Mubarak Alharbi-User Experience Dimensions, aspects and measures...
78
User Experience Dimensions, Aspects and Measures: Systematic Literature Review A Thesis Submitted in Partial Fulfillment of the Requirements for the Degree of Master of Sciences in Software Engineering At the College of Computer & Information Sciences At Prince Sultan University Mubarak Saad Alharbi March 2016 January 201
Transcript of Mubarak Alharbi-User Experience Dimensions, aspects and measures...

User Experience Dimensions, Aspects
and Measures: Systematic Literature
Review
A Thesis Submitted in Partial Fulfillment of the Requirements for the Degree of Master of Sciences in Software Engineering
At the College of Computer & Information Sciences At Prince Sultan University
Mubarak Saad Alharbi
March 2016
January 201
I
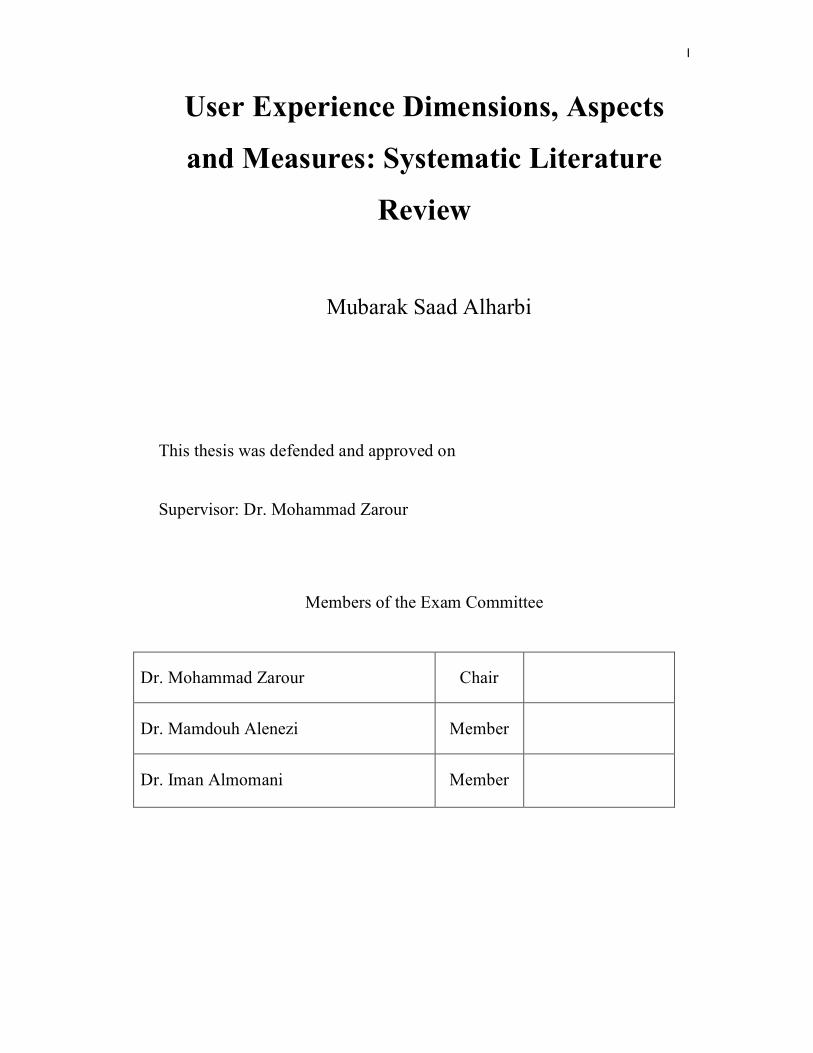
User Experience Dimensions, Aspects
and Measures: Systematic Literature
Review
Mubarak Saad Alharbi
This thesis was defended and approved on
Supervisor: Dr. Mohammad Zarour
Members of the Exam Committee
Dr. Mohammad Zarour Chair
Dr. Mamdouh Alenezi Member
Dr. Iman Almomani Member

II
Acknowledgments
In the name of Allah, the Most Gracious and the Most Merciful,
Alhamdulillah, all praises to Allah for the strengths and His blessing in completing this
thesis.
Firstly, I have to thank my parents for their love, pray and support through my life.
Thank you for everything that giving me the strength to reach this achievement. Special
thanks to my wife for her understanding and support during my study.
Secondly, I would like to express my sincere gratitude to my advisor Dr. Mohammad
Zarour for the continuous support of my Master study and related research, for his
patience, motivation, and immense knowledge. His guidance helped me in all the time
of research and writing of this thesis. I could not have imagined having a better advisor
and mentor for my Master study.
My sincere thanks also go to Mr. Tariq Alhuzaimi – eChannels Department Director in
STC, who gave me the time to complete this thesis.
I should not forget to acknowledge my brothers and sisters for their continuous prays,
support, understanding and good wishes.
Finally, I thank all those who have helped me directly or indirectly in the successful
completion of my thesis. Anyone missed in this acknowledgment are also thanked.
If I did not mention someone’s name here, it does not mean that I do not acknowledge
your support and help. Again, I would like to thank everyone who supported and helped
me during my Master study.
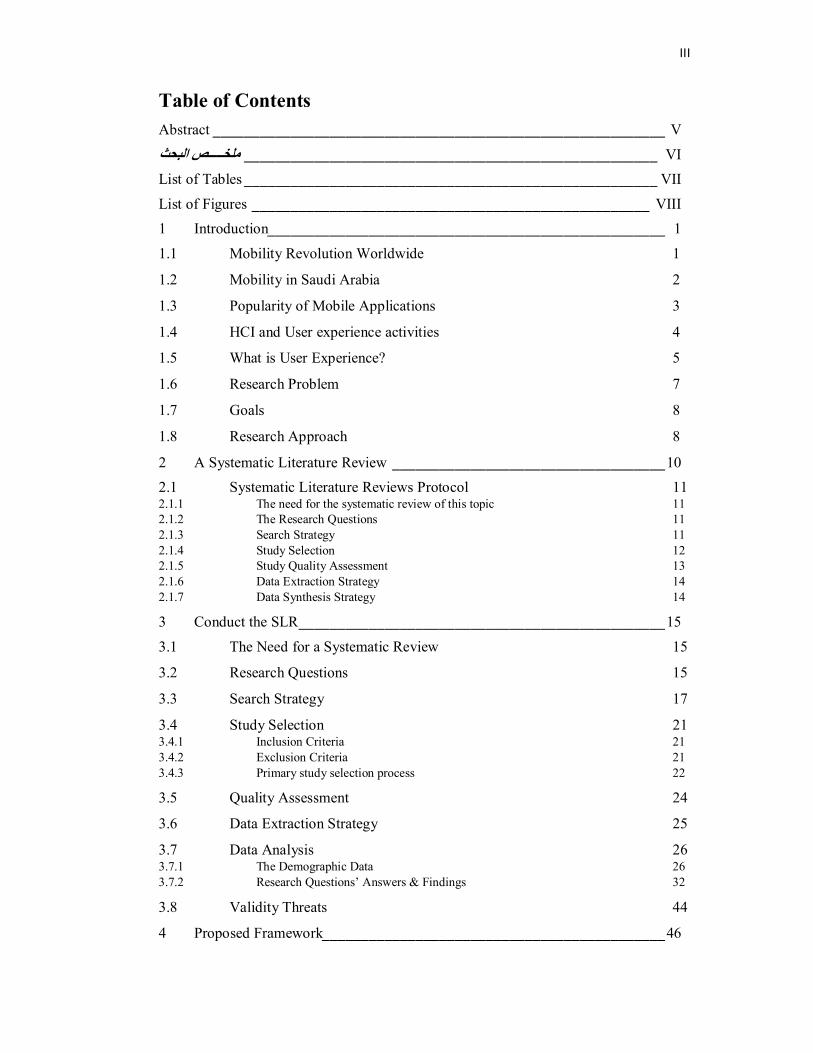
III
Table of Contents Abstract __________________________________________________________ V
البحث ملخـــــص _____________________________________________________ VI List of Tables _____________________________________________________ VII
List of Figures ___________________________________________________ VIII 1 Introduction ___________________________________________________ 1
1.1 Mobility Revolution Worldwide 1
1.2 Mobility in Saudi Arabia 2
1.3 Popularity of Mobile Applications 3
1.4 HCI and User experience activities 4
1.5 What is User Experience? 5
1.6 Research Problem 7
1.7 Goals 8
1.8 Research Approach 8
2 A Systematic Literature Review ___________________________________10
2.1 Systematic Literature Reviews Protocol 11 2.1.1 The need for the systematic review of this topic 11 2.1.2 The Research Questions 11 2.1.3 Search Strategy 11 2.1.4 Study Selection 12 2.1.5 Study Quality Assessment 13 2.1.6 Data Extraction Strategy 14 2.1.7 Data Synthesis Strategy 14
3 Conduct the SLR _______________________________________________15
3.1 The Need for a Systematic Review 15
3.2 Research Questions 15
3.3 Search Strategy 17
3.4 Study Selection 21 3.4.1 Inclusion Criteria 21 3.4.2 Exclusion Criteria 21 3.4.3 Primary study selection process 22
3.5 Quality Assessment 24
3.6 Data Extraction Strategy 25
3.7 Data Analysis 26 3.7.1 The Demographic Data 26 3.7.2 Research Questions’ Answers & Findings 32
3.8 Validity Threats 44
4 Proposed Framework ____________________________________________46

IV
4.1 UX Definitions 46
4.2 UX Dimensions 46
4.3 UX Aspects 48
4.4 UX Measurement Methods 52
4.5 Final Proposed Framework 53
5 Conclusion & Future Work _______________________________________55
5.1 Conclusion 55
5.2 Future Work 56
Appendix _________________________________________________________57
A. Selected Primary Studies _________________________________________57
B. UX Aspects’ Studies ____________________________________________58
C. UX Measurement Methods’ Studies ________________________________59
Bibliography ______________________________________________________60
V
Abstract
Technology is changing the way the people used to live. The new generation,
indisputably, is the generation of technology and more specifically the generation of
mobile. Kids started using the technology even before they entered the school.
Nowadays, the users of technology applications started developing their user experience
very early in their lives. Mobile applications have become one of the most used
products on mobile devices, 90% of the US mobile Internet usage time is spent using
applications while 10% of the time spent on browsing. The success or failure of a
software product is affected by the users of that product. Accordingly, studying,
measuring and improving user experience is crucial for the success of any software
product.
The purpose of this research is to scan various aspects that may affect the user
experience (UX) and how it can be measured in various applications and apply the
gained knowledge in mobile applications. To achieve this purpose, a systematic
literature review is conducted to collect necessary information. By analyzing the
extracted data, the possible UX dimensions that have an impact on the UX either during
the product development or the product usage are gathered, and four main dimensions
are identified. In addition to the UX dimensions, the relationship between those
dimensions and UX aspects that have a direct or indirect impact on the UX is scanned.
The UX aspects that have been identified are categorized into seven categories and
assigned to the corresponding UX dimension. Moreover, the possible methods that can
be used to measure UX aspects are scanned, and the generic names of these methods
have been identified and as a result of this step, fourteen generic methods are identified.
The generic methods are linked to the corresponding UX dimension based on the
applicability of measuring UX aspects in this UX dimension.
All these results have been analyzed and consolidated in one framework that explains
the relationship between UX dimensions, UX Aspects and UX measurement methods.
This framework can be used as starting step for understanding how the user experience
got affected in mobile applications and how to measure it.

VI
البحث صـــــملخ تغیر نمط حیاتنا الیومیة. فالجیل الجدید یعتبر، بال منازع، جیل التقنیة او باألحرى تعمل التقنیة على
جیل الجوال. فاالطفال یشرعون في استخدام الجوال وما یصاحبھ من تقنیات حتى قبل دخولھم
حل التقنیة بتطویر خبراتھم كمستخدمین للتطبیقات التقنیة في مرا االمدرسة. فالیوم، یبدأ مستخدمو
حیث تطبیقات الجوال من أكثر التطبیقات استخداماً خالل الفترة األخیرة تعتبر و .رة من حیاتھممبك
التصفح في حین إحتل، الكلیة٪ من فترة استخدام الجوال ٩٠التطبیقات مایقارب احتل استخدام ھذه
و نتیجةً رتبط بشكل رئیسي بمستخدمي ذلك التطبیق.نجاح أي تطبیق یتأثر وی . إن ٪١٠بقیة ال
، فإن دراسة وقیاس تجربة مستخدمي التطبیقات ھي جزء من األسباب المؤدیة لنجاح التطبیق.لذلك
تطبیقاتال في المستخدم تجربة في مایؤثرمانستطیع م جمع ھو البحث ھذا من لغرضاكان لذلك
.، ومن ثم تطبیقھا على تطبیقات الجوالقیاسھا یمكن كیف ومعرفة بشكل عام
تم ذلك من المستخرجة البیانات وتحلیل المجال ھذا في أبحاث من سبق لما علمیة مراجعة خالل من
بعد أو التطبیق تطویر فترة خالل سواءاً المستخدم تجربة في التأثیر ذات الرئیسیة اإلتجاھات حصر
حصر من ماسبق ىإل وباإلضافة ، وقد تم حصر أربعة اتجاھات رئیسیة.للمستخدمین ونشره اكتمالھ
تجاھاتاإل ھذه بین العالقة توضیح تم فقد المستخدم تجربة في المؤثرة الرئیسیة لإلتجاھات
بحیث حصلنا على سبع وقد قمنا بتصنیف ھذه العوامل .المستخدم تجربة في المؤثرة والعوامل
تجربة قیاس أدوات بحصر قمنا فقد ذلك على عالوةً اإلتجاھات المناسبة لھا. بربطھا تصنیفات وتم
ومن أداة عامة، أربع عشرةبحیث أصبح لدینا وإعادة تصنیفھا حسب نوع األداة الممكنة المستخدم
اعتماداً المستخدم تجربة في الموثرة العوامل وكذلك السابقة التأثیر باتجاھات ربطھا ثم تم ، وذلك
.محدد تأثیراتجاه على قابلیة استخدام ھذه األداة مع العوامل المؤثرة والمرتبطة ب
تجربة المستخدم قیاس وأدوات الموثرة والعوامل لإلتجاھات حصر من سبق مما اإلنتھاء بعد
الفھم زیادة لغرض وذلك ماسبق لكل شامل عمل إطار ببناء قمنا ، بینھا فیما العالقات وتوضیح
.قیاسھا وكیفیة الجوال تطبیقات في المستخدم تجارب طبیعة حول

VII
List of Tables
Table 1: Attributes required to document the research results ...................................... 12
Table 2: Research questions and the expected outcomes .............................................. 16
Table 3: Research questions and the extracted keywords ............................................. 17
Table 4: Research sources and the fields used to conduct the search ............................ 17
Table 5: Results of the first round of the research questions and the sources ................ 18
Table 6: Results of removing the duplicates from the sources ...................................... 18
Table 7: Results of applying the inclusion/exclusion criteria (title & abstract scanning)
.................................................................................................................................... 20
Table 8: New results using Mendeley DB to find related papers .................................. 20
Table 9: Included and excluded studies across the sources ........................................... 22
Table 10: Quality assessment checklist ........................................................................ 24
Table 11: Extracted attributes from the selected studies ............................................... 25
Table 12: Suggested categories/Dimensions for research disciplines ............................ 35
Table 13: UX Aspects' descriptions ............................................................................. 37
Table 14: Suggested categories for UX aspects and their relationship to UX dimensions
.................................................................................................................................... 39
Table 15: Categories of UX measurement methods from the SLR ............................... 40
Table 16: Extracted UX measurement methods from the selected studies .................... 41
Table 17: UX measurement Methods - General Names ................................................ 42
Table 18: Frameworks to measure the UX and the UX dimensions that are covered .... 43
Table 19: Suggested relationship between the UX measurement methods and the UX
dimensions .................................................................................................................. 52
Table 20: Framework measures UX in literature and the proposed one in addition to the
covered UX dimensions............................................................................................... 54
Table 23: Selected primary papers and their points ...................................................... 57
Table 24: UX aspects and the related studies ............................................................... 58
Table 25: UX measurement methods and the related studies ........................................ 59
VIII
List of Figures Figure 1: ICT growth during the last 15 years ...............................................................1
Figure 2 : Growth of ICT sector in Saudi Arabia ...........................................................2
Figure 3: Categories of usage on mobile devices ...........................................................3
Figure 4: Growth of Mobile Apps between Q2-2014 and Q2-2015 ...............................4
Figure 5: UX is elaboration of Usability ........................................................................6
Figure 6: Usability for Objective and UX for Subjective ................................................6
Figure 7: UX is an umbrella for everything ....................................................................6
Figure 8: Research approach flow and outcomes ...........................................................9
Figure 9: SLR Flow Chart ........................................................................................... 23
Figure 10: Sources of selected studies ......................................................................... 26
Figure 11: The growth of selected studies .................................................................... 27
Figure 12: Participation of countries in UX research .................................................... 28
Figure 13: Percentage of answered research questions in selected studies .................... 29
Figure 14: Percentage of research methods used in selected studies ............................. 30
Figure 15: Application domains that studied in this SLR papers .................................. 30
Figure 16: Output of selected studies ........................................................................... 31
Figure 17: Perspectives relationship ............................................................................ 33
Figure 18: Identified Dimensions from the SLR and its relationships ........................... 35
Figure 19: UX aspects and number of related papers ................................................... 36
Figure 20: The relation between value and UX dimensions.......................................... 47
Figure 21: UX Aspects Classifications......................................................................... 49
Figure 22: Relation between UX Aspects categories and UX dimensions .................... 50
Figure 23: Relation between UX aspects and all UX dimensions ................................. 51
Figure 24: Proposed Framework that covers gathered UX dimensions, aspects
categories, aspects, and measurement methods ............................................................ 53
1
1 Introduction
Technology is changing the way the people used to live. The new generation,
indisputably, is the generation of technology and more specifically the generation of
mobile. Kids started using the technology even before they entered the school.
Nowadays, the users of technology applications started developing their user experience
very early in their lives. One of the very popular types of applications used are those
running by mobile devices. Mobile applications have become some of the most-used
products on mobile devices [1].
1.1 Mobility Revolution Worldwide
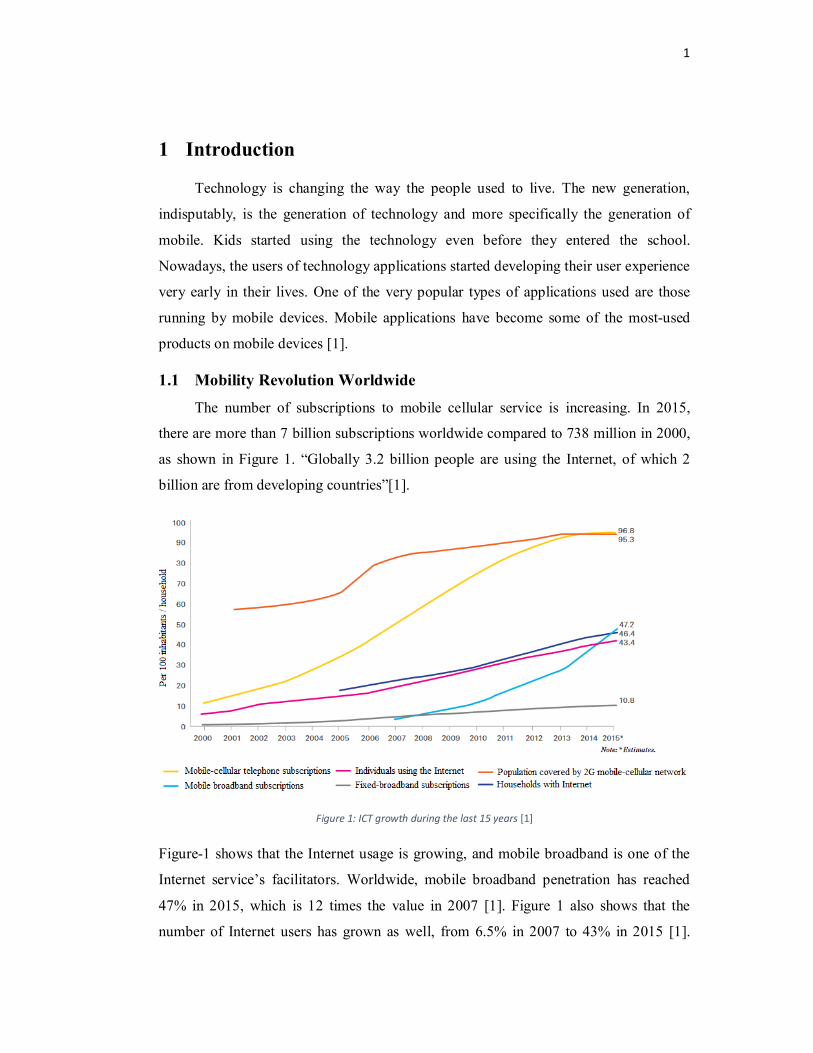
The number of subscriptions to mobile cellular service is increasing. In 2015,
there are more than 7 billion subscriptions worldwide compared to 738 million in 2000,
as shown in Figure 1. “Globally 3.2 billion people are using the Internet, of which 2
billion are from developing countries”[1].
Figure 1: ICT growth during the last 15 years [1]
Figure-1 shows that the Internet usage is growing, and mobile broadband is one of the
Internet service’s facilitators. Worldwide, mobile broadband penetration has reached
47% in 2015, which is 12 times the value in 2007 [1]. Figure 1 also shows that the
number of Internet users has grown as well, from 6.5% in 2007 to 43% in 2015 [1].
2
Hence, in the world that moves faster than ever towards the digitalization of societies,
the use of mobile and smart devices become prominent. Nowadays, mobiles are used
heavily by individuals as well as business. Mobile usage in business was divided into
three categories as below [2]:
• Business to Enterprise (B2E): Apps to Employees
• Business to Business (B2B): Apps to Brokers
• Business to Consumer (B2C): Apps to Consumers
Mobile in B2C world is important, and was divided into three domains Commerce,
Intermediary, and Information. Commerce usage of mobiles covers the commercial
transactions of digital such as eBooks and physical products such as buying tickets.
Intermediary usage of mobiles covers the content delivery to the consumers such as
providing content about weather, while Information usage of mobiles covers sending
personalized information to the consumer either for marketing use or personal
information [3].
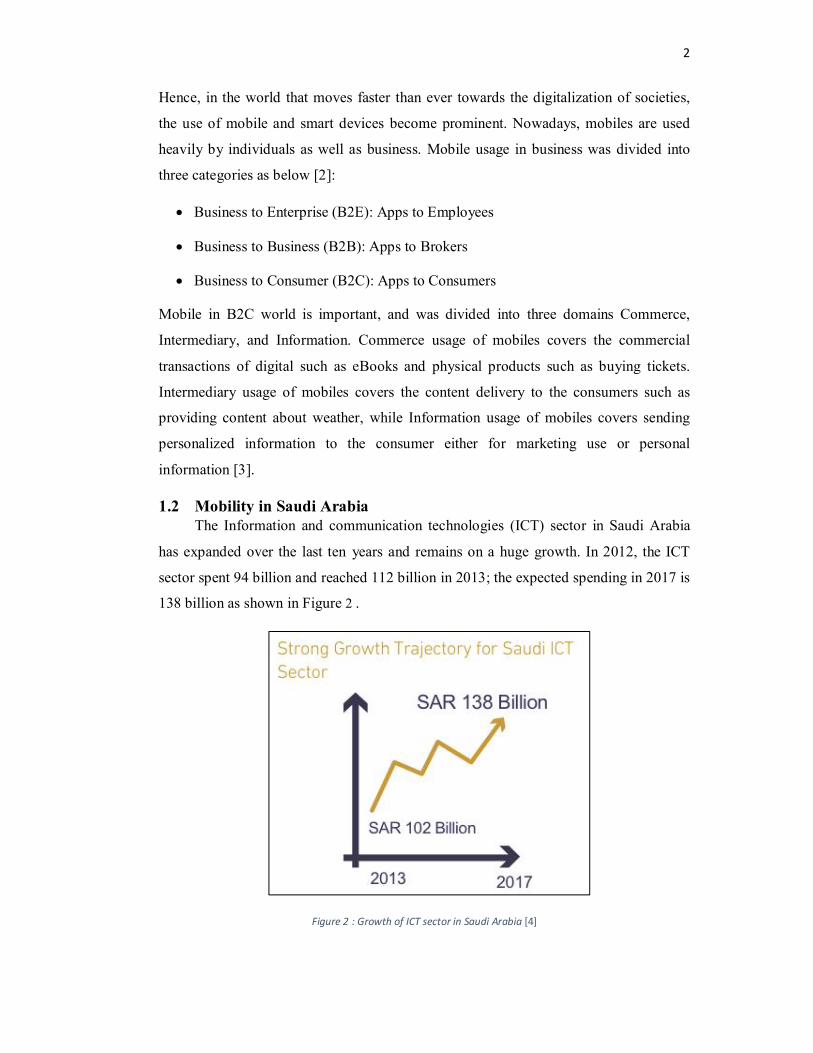
1.2 Mobility in Saudi Arabia The Information and communication technologies (ICT) sector in Saudi Arabia
has expanded over the last ten years and remains on a huge growth. In 2012, the ICT
sector spent 94 billion and reached 112 billion in 2013; the expected spending in 2017 is
138 billion as shown in Figure 2 .
Figure 2 : Growth of ICT sector in Saudi Arabia [4]
3
Mobility in Saudi Arabia is one of the most dynamic aspects of ICT, and it gained 64%
of the spending in 2013. Due to the high penetration of smartphones, mobile broadband
subscriptions have grown over the past five years. Saudi Arabia has one of the world’s
highest percentages of total Internet traffic consumed on mobile devices [4]. In Saudi
Arabia, mobile broadband penetration represented 47.6% by the end of 2013 while
fixed broadband penetration represented 45.5%. These facts refer to the importance of
the mobile role in keeping the consumers connected to others, as it is one of their
primary needs [4].
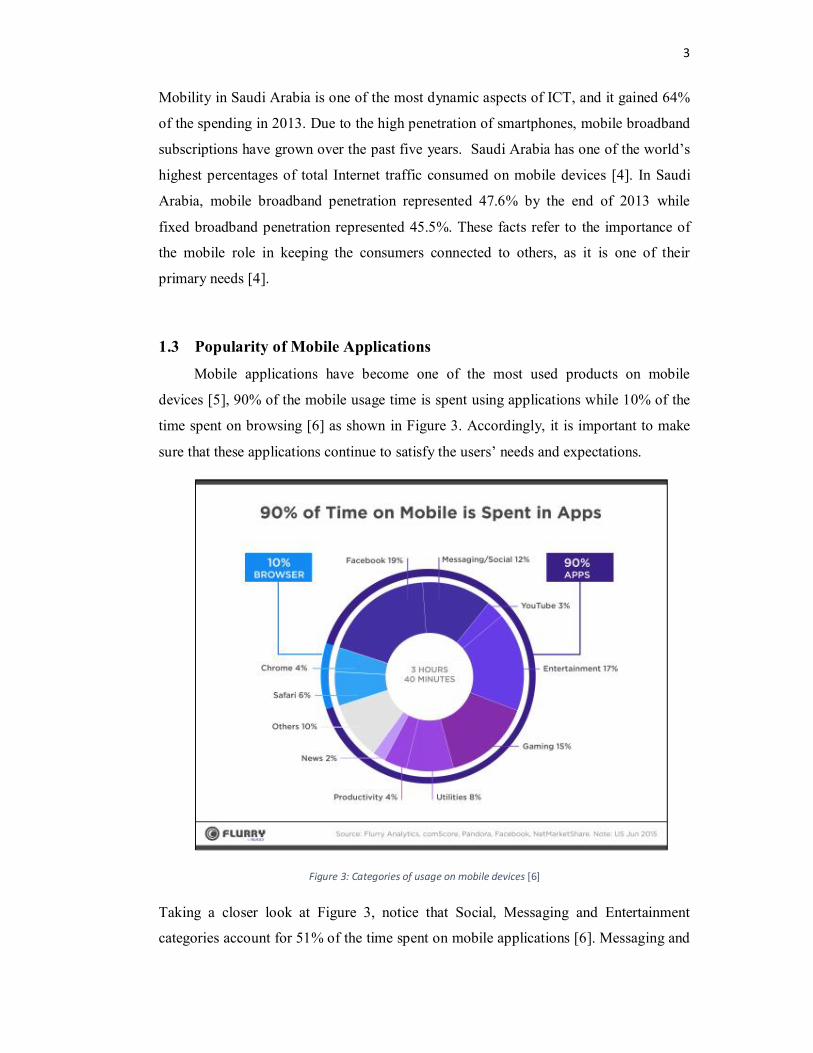
1.3 Popularity of Mobile Applications Mobile applications have become one of the most used products on mobile
devices [5], 90% of the mobile usage time is spent using applications while 10% of the
time spent on browsing [6] as shown in Figure 3. Accordingly, it is important to make
sure that these applications continue to satisfy the users’ needs and expectations.
Figure 3: Categories of usage on mobile devices [6]
Taking a closer look at Figure 3, notice that Social, Messaging and Entertainment
categories account for 51% of the time spent on mobile applications [6]. Messaging and
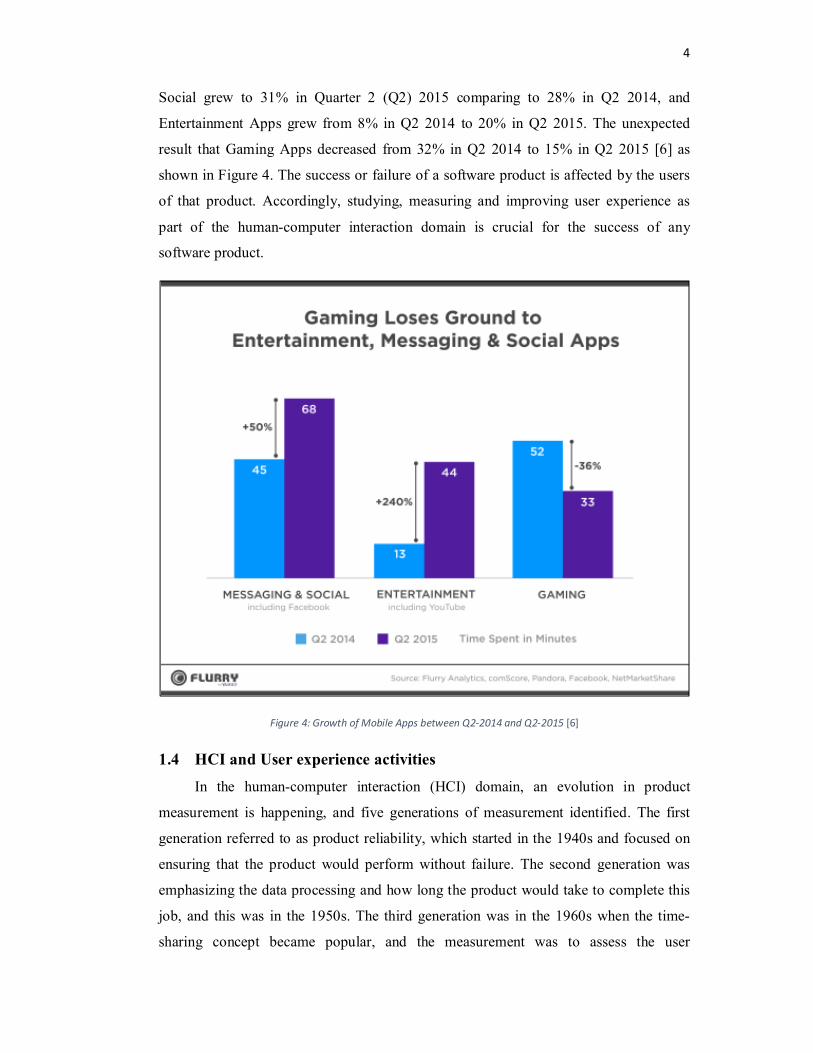
4
Social grew to 31% in Quarter 2 (Q2) 2015 comparing to 28% in Q2 2014, and
Entertainment Apps grew from 8% in Q2 2014 to 20% in Q2 2015. The unexpected
result that Gaming Apps decreased from 32% in Q2 2014 to 15% in Q2 2015 [6] as
shown in Figure 4. The success or failure of a software product is affected by the users
of that product. Accordingly, studying, measuring and improving user experience as
part of the human-computer interaction domain is crucial for the success of any
software product.
Figure 4: Growth of Mobile Apps between Q2-2014 and Q2-2015 [6]
1.4 HCI and User experience activities In the human-computer interaction (HCI) domain, an evolution in product
measurement is happening, and five generations of measurement identified. The first
generation referred to as product reliability, which started in the 1940s and focused on
ensuring that the product would perform without failure. The second generation was
emphasizing the data processing and how long the product would take to complete this
job, and this was in the 1950s. The third generation was in the 1960s when the time-
sharing concept became popular, and the measurement was to assess the user

5
performance and how long the task would take to be completed. The fourth generation
started in the 1980s when the number of products’ users increased, and the
measurement included more measures such as learnability and others, and this referred
to the usability. The fifth generation started late in the 1990s and shifted to measure the
user experience [7] [8]. Academic researchers of HCI are studying the usage and the
user experience of user interfaces through experimental testing of user interfaces in the
lab, or qualitative/ quantitative and observation of people using user interfaces in the
wild.
1.5 What is User Experience?
User experience (UX) studies in HCI fields have increased during last two
decades [8]. In these studies, a common agreement has been reached about the
dynamics of user experience and the subjectivity of its nature [9]. Several researchers
have stated that user experience is dynamic, context-dependent, and subjective. Due to
this fact, “the user experience is seen as something desirable without defining what
something means”, and this has led to difficulty in agreeing on a user experience
definition [10].
In literature, definitions for user experience were proposed, but those definitions were
affected by the researcher’s background and interest [10] and could not be used as a
common definition. ISO 9241-210 defined user experience as “A person's perceptions
and responses that result from the use or anticipated use of a product, system or
service”[11]. This definition is a promising one as stated by Law[10], The definition is
in line with the view by most researchers about the subjectivity of UX, but the used
terms require more explanation to list possible objects that affect user experience[10].
User experience a tightly coupled with usability [12], and it can be conceptualized in
different ways as it summarized in [13]:
• An elaboration of the usability from the satisfaction perspective as shown in
Figure 5. This is because the usability has different attributes such as efficiency,
effectiveness and satisfaction [14]. Satisfaction attribute refers to the likely,
pleasure trust and other similar attributes, and from this perspective the UX is
considered as elaboration of usability.

6
Figure 5: UX is elaboration of Usability
• Distinct from usability which emphasizes on objective measures, while user
experience emphasizes on subjective measures as shown in Figure 6. This
differentiation based on the usage of measurement methods. It is not necessary
that usability methods can measure UX as there is a clear difference between
usability characteristics and UX characteristics[15].
Figure 6: Usability for Objective and UX for Subjective
• An umbrella term for users’ perceptions, whether measured objectively or
subjectively as shown in Figure 7, it follows ISO 9241-210 definition which
covers perceptions from the user; either objectively or subjectively[10].
Figure 7: UX is an umbrella for everything

7
1.6 Research Problem Mobile applications have become one of the most popular products used by users
nowadays, and the need for measuring the acceptance of the mobile application is
growing as well [5]. Referring to the fact that current generation of measuring the
products measures the user experience with it, leads to the need for measuring user
experience with the mobile application. The concept of user experience has been
growing in the research community during the last two decades, and there is still no
agreement about its nature and how to measure it [16]. As stated by many studies in the
literature, the “UX is dynamic, context-dependent, and subjective” [10]. This fact led to
the need to scan this research area systematically to identify the possible dimensions
that related to the UX and that have an impact on it. Identifying these dimensions will
build boundaries around the UX and will give directions on how to recognize the impact
on the UX if it exists. Also, this may help to discover the methods that can be used to
measure such an impact or, at least, understand its nature. Once identified the possible
the dimensions that have an impact on the UX and the methods that have been used to
measure such dimensions, then a framework can be proposed to covers these
dimensions and apply the useful methods to measure it. As a summary, the UX is
difficult to be measured due to its nature, and a need for a framework that covers the
different UX dimensions and aspects will help to measure it using proper methods.
Accordingly the main research problem covered in this research work is to identify the
main user experience dimensions, aspects and measurement methods currently available
in the literature and relate them all together in one framework.
8
1.7 Goals In this research, a systematic approach will be applied to a reach the main
objective of understanding how to measure the user experience in mobile applications
and to build a framework for that. To reach this final goal, the below tasks need to be
completed:
1. Study the available UX literature to understand the current state, which will help us to know if a new framework need to be built or a common frameworks can be used.
2. Identify available frameworks and analyze the weaknesses.
3. Identify various dimensions that affect UX.
4. Build a comprehensive framework that covers the main UX dimensions and overcome the current weaknesses.
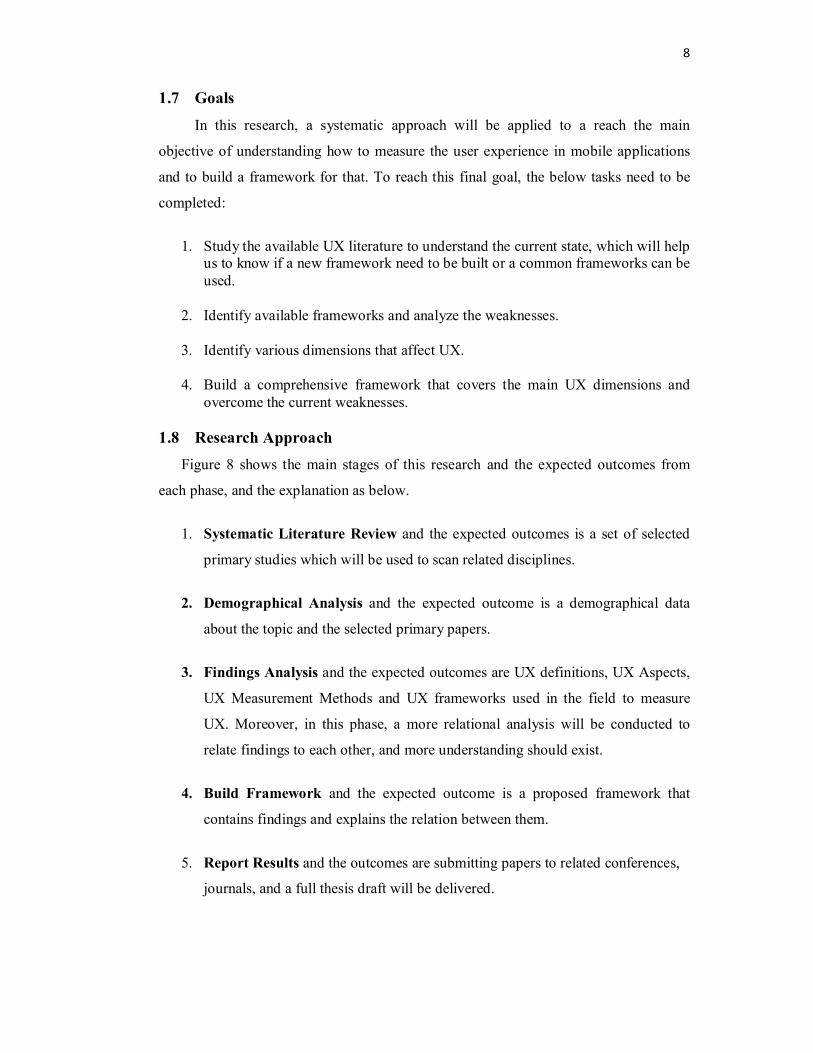
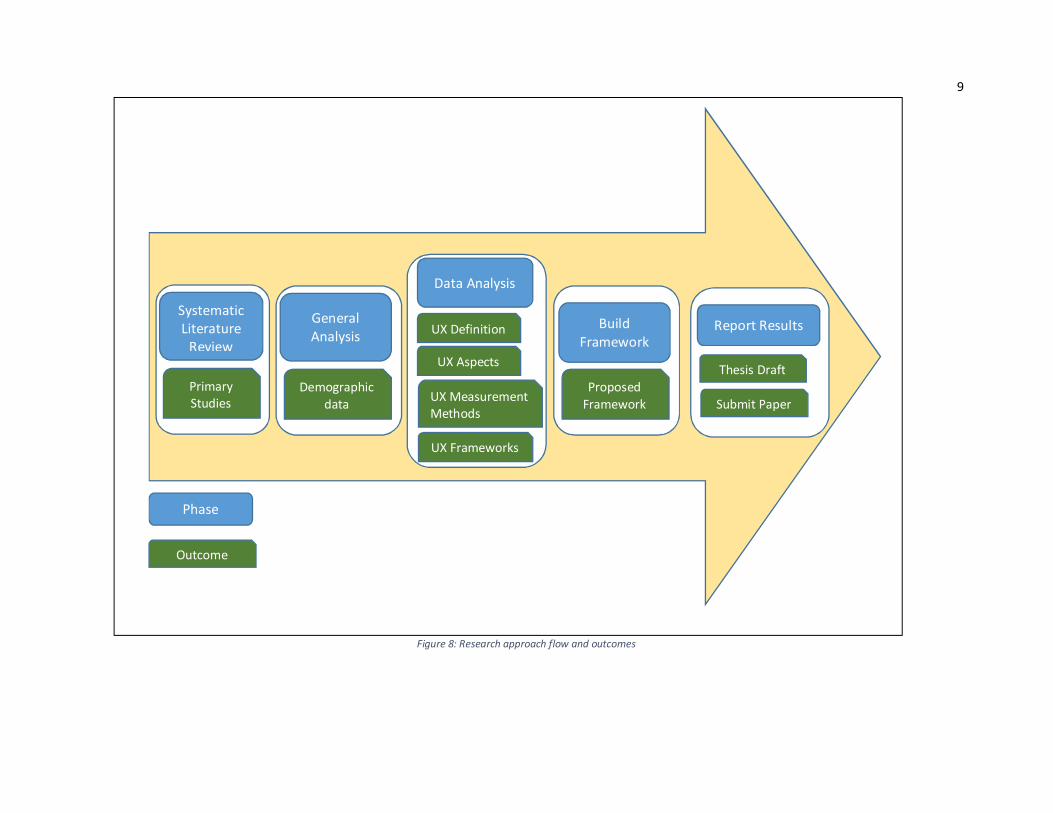
1.8 Research Approach Figure 8 shows the main stages of this research and the expected outcomes from
each phase, and the explanation as below.
1. Systematic Literature Review and the expected outcomes is a set of selected
primary studies which will be used to scan related disciplines.
2. Demographical Analysis and the expected outcome is a demographical data
about the topic and the selected primary papers.
3. Findings Analysis and the expected outcomes are UX definitions, UX Aspects,
UX Measurement Methods and UX frameworks used in the field to measure
UX. Moreover, in this phase, a more relational analysis will be conducted to
relate findings to each other, and more understanding should exist.
4. Build Framework and the expected outcome is a proposed framework that
contains findings and explains the relation between them.
5. Report Results and the outcomes are submitting papers to related conferences,
journals, and a full thesis draft will be delivered.
9
Figure 8: Research approach flow and outcomes
Systematic Literature
Review
Primary Studies
General Analysis
Demographic data
Data Analysis
UX Definition
UX Aspects
UX Measurement Methods
UX Frameworks
Build Framework
Proposed Framework
Report Results
Thesis Draft
Submit Paper
Outcome
Phase

10
2 A Systematic Literature Review
Evidence-based software engineering (EBSE) aims to improve decision-making
related to software development and maintenance by integrating current best evidence
from research with practical experience and human values [17]. An evidence-based
paradigm is used in medicine for decades[18]. The applicability of this paradigm to the
software engineering (SE) field studied in the literature [18], and it showed that EBSE
brings benefits to SE by improving the quality of software-intensive systems and
reassuring stakeholder groups that practitioners are using the best practice. To identify
the possible best practices, collecting evidence and synthesize practical experience, a
systematic literature review is needed.
A systematic literature review, is an identification and evaluation of available research
that is related to a research topic or research question. Any individual study that
contributes to a systematic review called a primary study while the systematic review is
known as a secondary study. The systematic review helps to summarize the available
evidence that is related to a topic or domain. Also, it helps identify any gaps in a
particular area of research to suggest areas of investigations. In addition to that, a
systematic review helps to provide background for new research work, in particular for
those who are new to the area [19].
It is recommended [18] that software engineers adopt more EBSE to treat systematic
reviews at their practitioner publications. Since then, software reviews have become
increasingly popular in software engineering [19], and the main purpose of those SRs is
to get the best quality of scientific studies [20]. Such systematic reviews should define
the search strategy that has been followed to conduct the review. This documented
strategy, which known as systematic review protocol, will help to assess the
completeness of the SR[19].
11
2.1 Systematic Literature Reviews Protocol
A review protocol specifies the methods and steps that will be followed to
implement the systematic review. Such a protocol will reduce the possibility of
researchers' bias [19]. The protocol contains components needed to complete the
review, which are as follows:
2.1.1 The need for the systematic review of this topic
Conducting systematic reviews will help in summarizing the findings documented
in the literature related to certain topic and it helps in exploring the weaknesses in that
topic that should gain more attention by the researchers in the domain. Hence, the
reviewer should document clearly the need to conduct the systematic review.
2.1.2 The Research Questions
In SLR, the research questions that are going to be answered need to be identified.
These research questions are used as bases to identify the suitable keywords to be used
as search strings to search the digital resources.
2.1.3 Search Strategy
It is necessary to follow a search strategy, and the strategy is an iterative process
that benefits from assessing existing systematic reviews and related studies. It also
benefits from regular searches using the terms derived from the research questions. In
addition to that, checking the results of the regular searches against a list of known
primary studies will add more value to the search terms that used. Finally, consulting
the experts in the search domain is a factor in building the search strategy [19].
Breaking the research question down to identify the search terms is a starting point, and
the result will be nouns. Using the combination of those terms and alternative
translations and abbreviations will lead to a list of possible search terms that can be used
to search for primary studies. Previous factors need to be considered in building the
search strategy and need to be documented and replicable. Suggested procedures to
document the search process are given in Table 1:

12
Table 1: Attributes required to document the research results
Data Source Documentation
Digital Library Name of database (e.g. IEEE, ACM, Citeseer)
Search strategy for the database
Date of search
Years covered by search
Other Sources Date searched/contacted
URL
Any specific conditions about the search
2.1.4 Study Selection
Once the primary studies obtained, then both inclusion and exclusion criteria
should be applied to identify the primary studies that provide evidence about the
research question [19]. The inclusion/exclusion criteria need to be applied based on
practical issues such as the following [19]:
• Journal
• Authors
• Subject
• Research methodology and design
• Date of publication
Another factor needing to be explained is how many assessors will be available to
evaluate the selected primary studies and how the conflicts will be resolved.

13
2.1.5 Study Quality Assessment
Adding a new layer for filtering the selected primary studies after applying the
inclusion and exclusion criteria is a necessary step to do the following [19]:
• Provide more detailed inclusion/exclusion criteria
• Investigate if the differences of quality provide an explanation for differences in
studies’ results
• Find the strength of studies' results and conclusions
• Give weights for the studies
Such a layer of filtering the studies needs to be applied against an appropriate checklist.
The choice of the checklist is affected by the type of primary studies and the stage of
implementing the study either design, conduct, analysis, or conclusions, and this will
lead to a complex process to apply the quality checklist [19].
One of the choices is the checklist that proposed by Kichenham [20] and below the
selected questions that will be answered during the SLR conducting:
• Is there a clear statement of the aims of the study? Yes/No. Score as 1, 0.5, 0.
• Is there an adequate description of the context in which the research or
observation was carried out? Yes/Partly/No. Score as 1, 0.5, 0.
• Was the research method appropriate to address the aims of the research?
Yes/Partly/No/Not applicable. Score as 1, 0.5, and 0 or mark NA.
• Was the recruitment strategy or experimental material or context appropriate to
the aims of the research? Yes/Partly/No/Not applicable. Score as 1, 0.5, and 0 or
mark NA.
• Has the relationship between researcher and participants been considered to an
adequate degree? Yes/Partly/No. Score as 1, 0.5, 0.
• Is there a clear statement of findings? Yes/Partly/No. Score as 1, 0.5, 0.
• Is the study of value for research or practice? Yes/Partly/No. Score as 1, 0.5, 0.

14
2.1.6 Data Extraction Strategy
After selecting the final primary studies and assessing the selection against a
proper quality instrument, specific data need to be extracted to obtain the information
from the primary studies. The process of extracting such data should be clear and can
extract required data that answer the research questions. The extracted data can be used
either for inclusion/exclusion criteria or data analysis. If the data required in
inclusion/exclusion criteria, then a separated form needs to be used; otherwise, one form
can be used to collect possible data.
Such data extraction needs to be reviewed to ensure the quality of extracted data. As
suggested by the SLR guidelines [19], the SLR conducted by postgraduate students in
their master or Ph.D. work is revised by the supervisor to ensure that the protocol
applied correctly. Hence, the selected studies will be reviewed by the supervisor for
further analysis and approval.
2.1.7 Data Synthesis Strategy
This stage of review protocol is the final phase. It involves collecting and
summarizing the results of primary studies. Synthesis can be quantitative and
qualitative. Using statistical techniques to obtain the quantitative results is called meta-
analysis. Synthesis activities need to be documented and explained in the protocol, and
some of the issues cannot be resolved until the data is analyzed since the protocol will
be updated by that.

15
3 Conduct the SLR
In this chapter, the systematic literature review guideline is applied and the details
of each step is explained.
3.1 The Need for a Systematic Review
A systematic literature review is needed to scan and assess the current status and
the work that has done in the user experience field. This literature review will have
good value if conducted following a systematic process, which can be repeated at any
time and assessed by the readers. This SLR is needed to scan relevant dimensions and
aspects that have an impact on user experience as the user experience is considered as a
part of satisfying the users’ needs [12]. Due to the numerous studies that conducted in
UX field, the need to synthesize these studies using SLR is prominent. Moreover, the
literature lacks the development of clear frameworks or measurement criteria to
measure the UX. The literature needs to be systematically reviewed to be able to
identify related factors, to develop such a framework.
3.2 Research Questions
To determine the aims of this study and get more understanding about it, seeking
answers to a set of research questions is mandatory. This study will focus on the main
milestones of the UX area, namely, UX definitions, aspects that affect the user
experience, methods that are used to measure UX and if there is any framework has
been used to measure U. The research questions and an explanation of the need for each
question and how it can add value to the study domain is following.
RQ1: What are the different definitions of user experience in literature?
This question concerned with identifying the possible definitions of UX in literature,
either defined by authors or any specialized organizations such as ISO. Identifying those
definitions will guide us in extracting the general dimensions of the aspects that affect
the UX, and this will help us to discover the relationship between the aspects, see Table
2.

16
RQ2: What are the aspects that affect the user experience?
This question concerned with identifying the aspects that affect the UX, which have
been studied or discovered in literature. Identifying these aspects, in addition to relating
them to the study domain and the UX dimension, will help us to study the effects of
these aspects on the UX as shown in Table 2.
RQ3: What are the methods identified to measure each of the specified aspects in
the literature?
This question concerned with identifying the measurement methods that have been used
in literature to measure the UX aspects as shown Table 2.
RQ4: What kind of framework can be developed to understand and measure the
user experience with mobile applications?
This question concerned with identifying any UX measurement framework that has
been documented in the literature. Identifying these frameworks will help us to know
how to build the frameworks that contain the UX dimensions, aspects, and measurement
methods and how to extract more dimensions, aspects, and measurement methods and
understand the relation between them as shown in Table 2Error! Reference source not
found..
Table 2: Research questions and the expected outcomes
Research
Question Expected Outcomes
Value for the study
RQ1 UX definitions
Gather possible
dimensions.
RQ2 The aspects that affect the UX and the relation
to UX dimensions
Gather affections
aspects.
RQ3 Methods used to measure the UX aspects Gather useful methods.
RQ4 Frameworks used to measure the UX and its
structure
Understand available
frameworks’ structure to
build a framework that
cover available
Dimensions, Aspects and
17
Measurement methods.
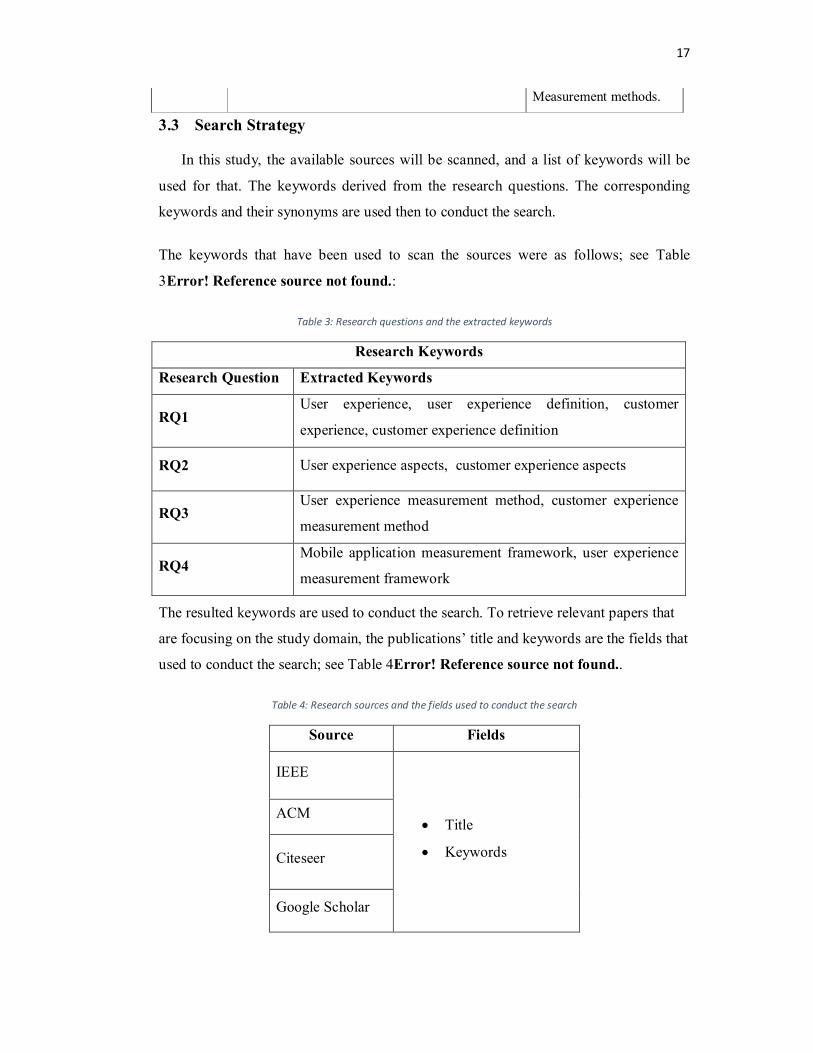
3.3 Search Strategy
In this study, the available sources will be scanned, and a list of keywords will be
used for that. The keywords derived from the research questions. The corresponding
keywords and their synonyms are used then to conduct the search.
The keywords that have been used to scan the sources were as follows; see Table
3Error! Reference source not found.:
Table 3: Research questions and the extracted keywords
Research Keywords
Research Question Extracted Keywords
RQ1 User experience, user experience definition, customer
experience, customer experience definition
RQ2 User experience aspects, customer experience aspects
RQ3 User experience measurement method, customer experience
measurement method
RQ4 Mobile application measurement framework, user experience
measurement framework
The resulted keywords are used to conduct the search. To retrieve relevant papers that
are focusing on the study domain, the publications’ title and keywords are the fields that
used to conduct the search; see Table 4Error! Reference source not found..
Table 4: Research sources and the fields used to conduct the search
Source Fields
IEEE
• Title
• Keywords
ACM
Citeseer
Google Scholar
18
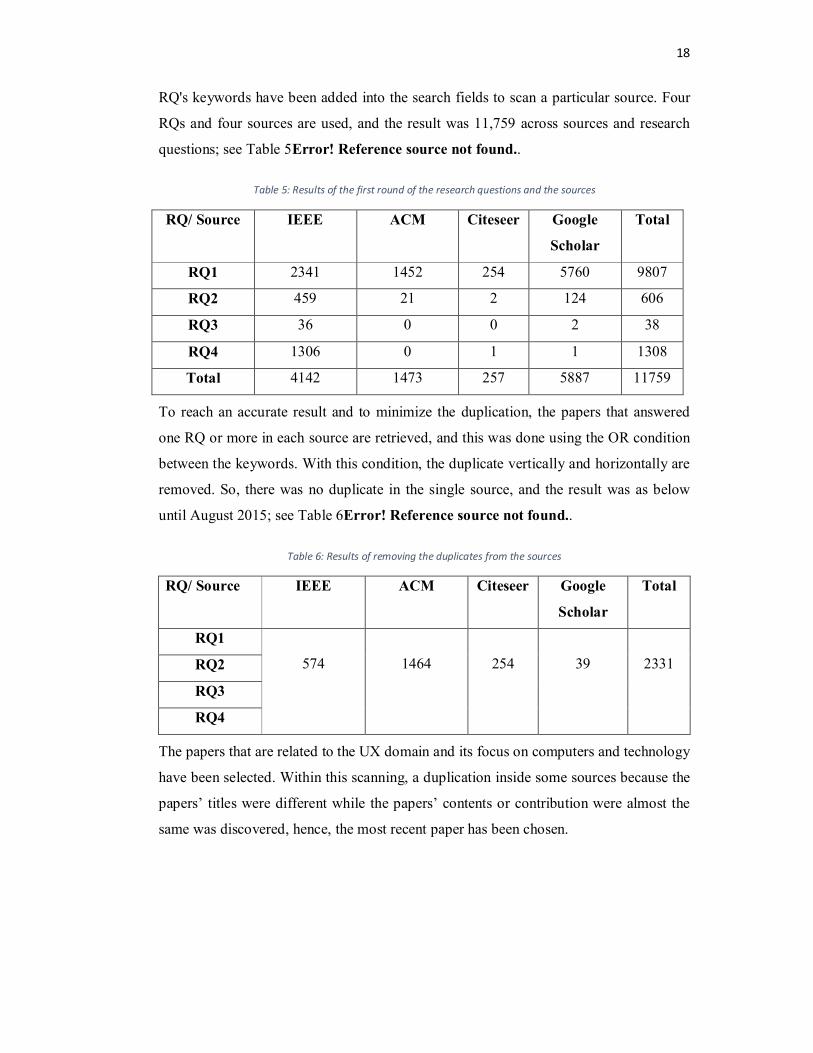
RQ's keywords have been added into the search fields to scan a particular source. Four
RQs and four sources are used, and the result was 11,759 across sources and research
questions; see Table 5Error! Reference source not found..
Table 5: Results of the first round of the research questions and the sources
RQ/ Source IEEE ACM Citeseer Google
Scholar
Total
RQ1 2341 1452 254 5760 9807
RQ2 459 21 2 124 606
RQ3 36 0 0 2 38
RQ4 1306 0 1 1 1308
Total 4142 1473 257 5887 11759
To reach an accurate result and to minimize the duplication, the papers that answered
one RQ or more in each source are retrieved, and this was done using the OR condition
between the keywords. With this condition, the duplicate vertically and horizontally are
removed. So, there was no duplicate in the single source, and the result was as below
until August 2015; see Table 6Error! Reference source not found..
Table 6: Results of removing the duplicates from the sources
RQ/ Source IEEE ACM Citeseer Google
Scholar
Total
RQ1
574
1464
254
39
2331 RQ2
RQ3
RQ4
The papers that are related to the UX domain and its focus on computers and technology
have been selected. Within this scanning, a duplication inside some sources because the
papers’ titles were different while the papers’ contents or contribution were almost the
same was discovered, hence, the most recent paper has been chosen.

19
Table 7Error! Reference source not found. summarizes the resulted set of papers per
digital library that included in this study.
20
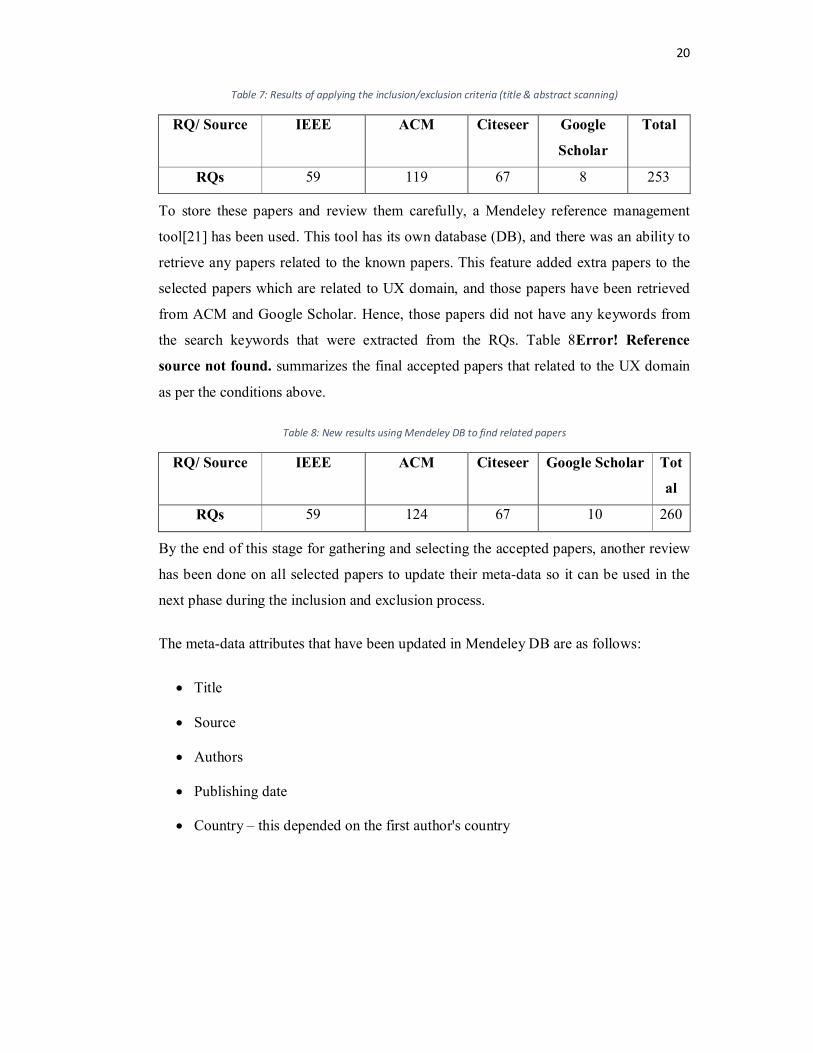
Table 7: Results of applying the inclusion/exclusion criteria (title & abstract scanning)
RQ/ Source IEEE ACM Citeseer Google
Scholar
Total
RQs 59 119 67 8 253
To store these papers and review them carefully, a Mendeley reference management
tool[21] has been used. This tool has its own database (DB), and there was an ability to
retrieve any papers related to the known papers. This feature added extra papers to the
selected papers which are related to UX domain, and those papers have been retrieved
from ACM and Google Scholar. Hence, those papers did not have any keywords from
the search keywords that were extracted from the RQs. Table 8Error! Reference
source not found. summarizes the final accepted papers that related to the UX domain
as per the conditions above.
Table 8: New results using Mendeley DB to find related papers
RQ/ Source IEEE ACM Citeseer Google Scholar Tot
al
RQs 59 124 67 10 260
By the end of this stage for gathering and selecting the accepted papers, another review
has been done on all selected papers to update their meta-data so it can be used in the
next phase during the inclusion and exclusion process.
The meta-data attributes that have been updated in Mendeley DB are as follows:
• Title
• Source
• Authors
• Publishing date
• Country – this depended on the first author's country

21
3.4 Study Selection
To select the primary studies, a new layer for filtering the selected papers that
gathered in the previous stage needs to be applied. This layer will have two categories
which are inclusion criteria and exclusion criteria.
3.4.1 Inclusion Criteria
The inclusion criteria will focus on the factors and conditions that need to be exist to
select the paper and include it in the primary studies. The inclusion criteria applied in
this study are below.
• The paper answers one of the RQs partially.
• The paper's publication date is 2005 and above.
• If a snowballing search happened, then the paper should exist on one of the
primary sources which are IEEE, ACM, Citeseer, or Google Scholar.
3.4.2 Exclusion Criteria The exclusion criteria will focus on the factors and conditions that cause the paper
to excluded from the primary studies list. The exclusion criteria applied in this study
are:
• The paper's publication date is 2004 or before.
• Full paper is not accessible
• The paper limited to the non-IT domain.
• The paper's author is not mentioned in the paper itself.
• The paper is calling for a workshop.
• It is a book or magazine.
• The paper is not answering any RQs, either with fully or partially.
• The paper is a duplicate of another paper with a different title, and the most recent
one has been chosen.

22
3.4.3 Primary study selection process
To apply the above inclusion and exclusion criteria, a Mendeley tool was used to
update the below meta-data, which will be used to filter the papers that gathered in the
previous stage.
The meta-data attributes that are added at this stage in addition to the previous attributes
are as follows:
• Answered RQs:
o This attribute is used to identify the RQs that answered in this paper.
o Example: RQ1RQ2; RQ1RQ4; RQ3.
• Application domain:
o This attribute is used to identify the application domain that related to the
paper.
o Example: General; Mobile App; Mobile Device; software, etc.
Table 9Error! Reference source not found. shows the final number of papers from the
previous stage after applying inclusion and exclusion criteria.
Table 9: Included and excluded studies across the sources
Criteria IEEE ACM Citeseer Google
Scholar
Total
Included Papers 26 68 15 5 114
Excluded Papers 33 56 52 5 146
Total 59 124 67 10 260
So, the total number of primary studies becomes 114 after applying the inclusion and
exclusion criteria. All studies' meta-data, either included or excluded, have been
updated to extract the data about it during the data synthesis stage, and Figure 9
summarize all previous stages.

23
Figure 9: SLR Flow Chart

24
3.5 Quality Assessment
In addition to using the general inclusion and exclusion criteria, it is required to
assess the quality of the primary studies. An initial difficulty is that there is no
agreement on the definition of quality of papers, but most quality checklists include a
question that aimed at assessing the bias and validity of papers [19].
Below a list of questions that are proposed to evaluate the quality of the selected
primary papers[20] as shown in Table 10Error! Reference source not found..
Table 10: Quality assessment checklist
No. Question No. of papers
answered the
Question by
Yes (Out of
114)
%
1 Is there a clear statement of the aims of the study? 60 52%
2 Is there an adequate description of the context in which the research or observation was carried out?
83 72%
3 Was the research method appropriate to address the aims of the research?
87 76%
4 Was the recruitment strategy or experimental material or context appropriate to the aims of the research?
62 54%
5 Has the relationship between researcher and participants been considered to an adequate degree?
66 57%
6 Is there a clear statement of findings? 103 90%
7 Is the study of value for research or practice? 86 75%
25
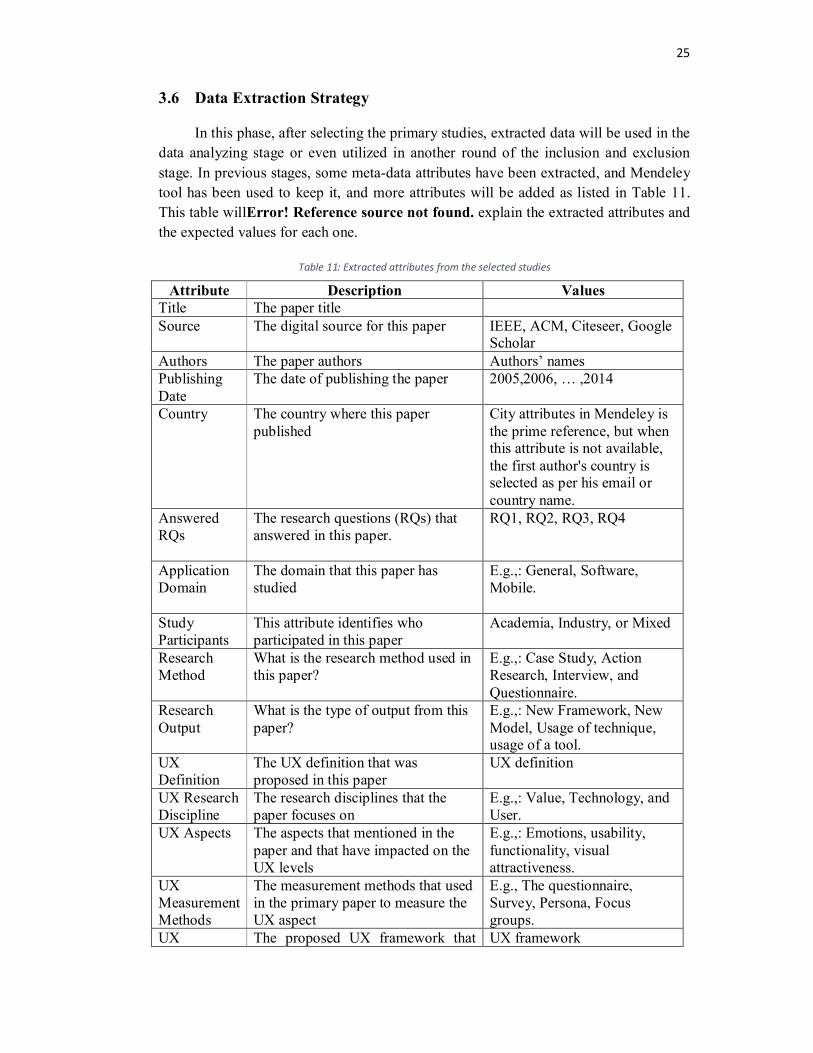
3.6 Data Extraction Strategy
In this phase, after selecting the primary studies, extracted data will be used in the data analyzing stage or even utilized in another round of the inclusion and exclusion stage. In previous stages, some meta-data attributes have been extracted, and Mendeley tool has been used to keep it, and more attributes will be added as listed in Table 11. This table willError! Reference source not found. explain the extracted attributes and the expected values for each one.
Table 11: Extracted attributes from the selected studies
Attribute Description Values Title The paper title Source The digital source for this paper IEEE, ACM, Citeseer, Google
Scholar Authors The paper authors Authors’ names Publishing Date
The date of publishing the paper 2005,2006, … ,2014
Country The country where this paper published
City attributes in Mendeley is the prime reference, but when this attribute is not available, the first author's country is selected as per his email or country name.
Answered RQs
The research questions (RQs) that answered in this paper.
RQ1, RQ2, RQ3, RQ4
Application Domain
The domain that this paper has studied
E.g.,: General, Software, Mobile.
Study Participants
This attribute identifies who participated in this paper
Academia, Industry, or Mixed
Research Method
What is the research method used in this paper?
E.g.,: Case Study, Action Research, Interview, and Questionnaire.
Research Output
What is the type of output from this paper?
E.g.,: New Framework, New Model, Usage of technique, usage of a tool.
UX Definition
The UX definition that was proposed in this paper
UX definition
UX Research Discipline
The research disciplines that the paper focuses on
E.g.,: Value, Technology, and User.
UX Aspects The aspects that mentioned in the paper and that have impacted on the UX levels
E.g.,: Emotions, usability, functionality, visual attractiveness.
UX Measurement Methods
The measurement methods that used in the primary paper to measure the UX aspect
E.g., The questionnaire, Survey, Persona, Focus groups.
UX The proposed UX framework that UX framework

26
Measurement Frameworks
has been studied or suggested in the primary paper
3.7 Data Analysis
As a result of conducting the SLR stages, extracted data from the primary studies
have been analyzed, and charts that explain the trends have been generated.
3.7.1 The Demographic Data
In next sections, findings related to demographical data are shown which may
help to get more understanding about the UX domain and the participants.
3.7.1.1 Source
Four primary sources in this SLR have been used, which are IEEE, ACM,
Citeseer, and Google Scholar. The majority of the selected papers were from the ACM
digital library, then IEEE, then Citeseer, and finally Google Scholar as shown in Figure
10. If any paper founded by snowballing, and it was not exist in one of these primary
source then it is excluded.
Figure 10: Sources of selected studies
IEEE25%
ACM59%
CiteSeer12%
Google4%
27
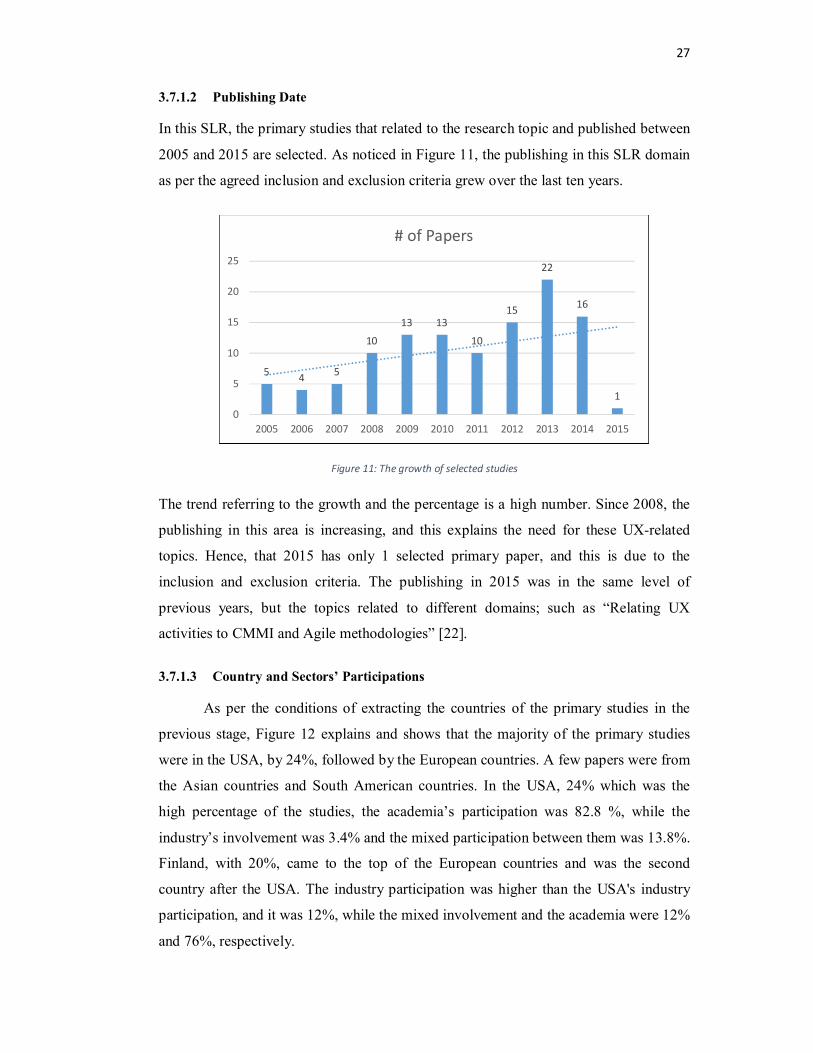
3.7.1.2 Publishing Date
In this SLR, the primary studies that related to the research topic and published between
2005 and 2015 are selected. As noticed in Figure 11, the publishing in this SLR domain
as per the agreed inclusion and exclusion criteria grew over the last ten years.
Figure 11: The growth of selected studies
The trend referring to the growth and the percentage is a high number. Since 2008, the
publishing in this area is increasing, and this explains the need for these UX-related
topics. Hence, that 2015 has only 1 selected primary paper, and this is due to the
inclusion and exclusion criteria. The publishing in 2015 was in the same level of
previous years, but the topics related to different domains; such as “Relating UX
activities to CMMI and Agile methodologies” [22].
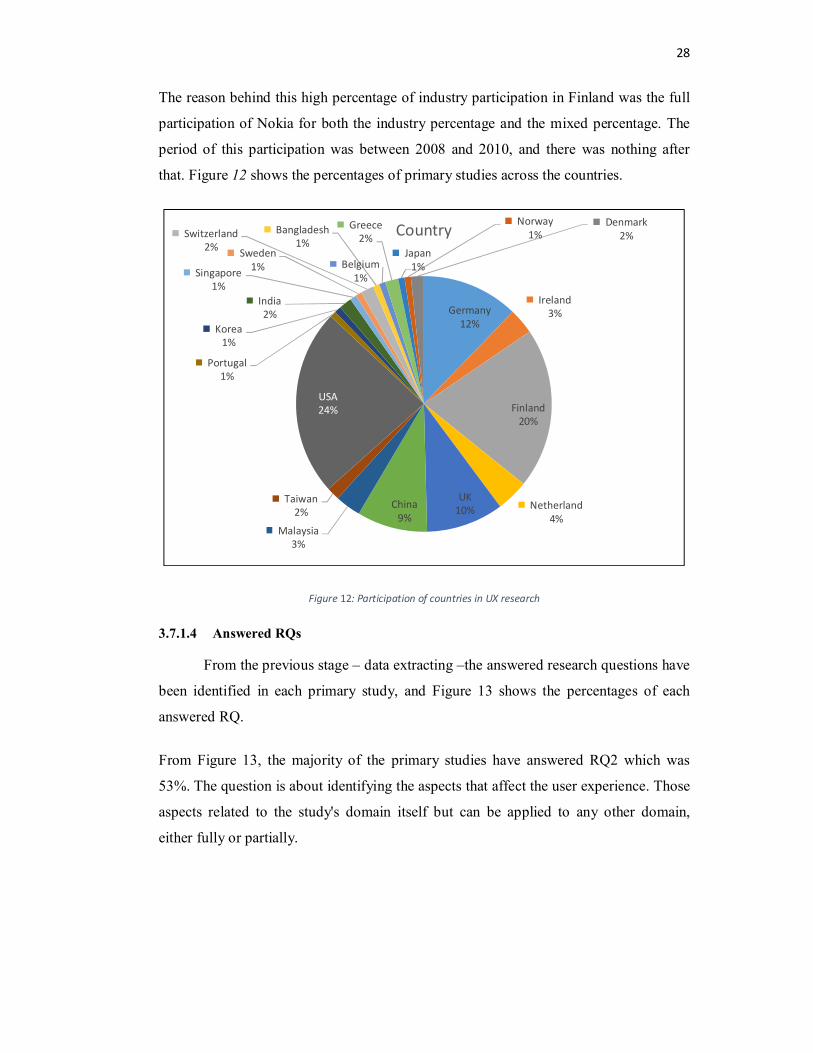
3.7.1.3 Country and Sectors’ Participations
As per the conditions of extracting the countries of the primary studies in the
previous stage, Figure 12 explains and shows that the majority of the primary studies
were in the USA, by 24%, followed by the European countries. A few papers were from
the Asian countries and South American countries. In the USA, 24% which was the
high percentage of the studies, the academia’s participation was 82.8 %, while the
industry’s involvement was 3.4% and the mixed participation between them was 13.8%.
Finland, with 20%, came to the top of the European countries and was the second
country after the USA. The industry participation was higher than the USA's industry
participation, and it was 12%, while the mixed involvement and the academia were 12%
and 76%, respectively.
5 4 5
10
13 13
10
15
22
16
1
0
5
10
15
20
25
2005 2006 2007 2008 2009 2010 2011 2012 2013 2014 2015
# of Papers
28
The reason behind this high percentage of industry participation in Finland was the full
participation of Nokia for both the industry percentage and the mixed percentage. The
period of this participation was between 2008 and 2010, and there was nothing after
that. Figure 12 shows the percentages of primary studies across the countries.
Figure 12: Participation of countries in UX research
3.7.1.4 Answered RQs
From the previous stage – data extracting –the answered research questions have
been identified in each primary study, and Figure 13 shows the percentages of each
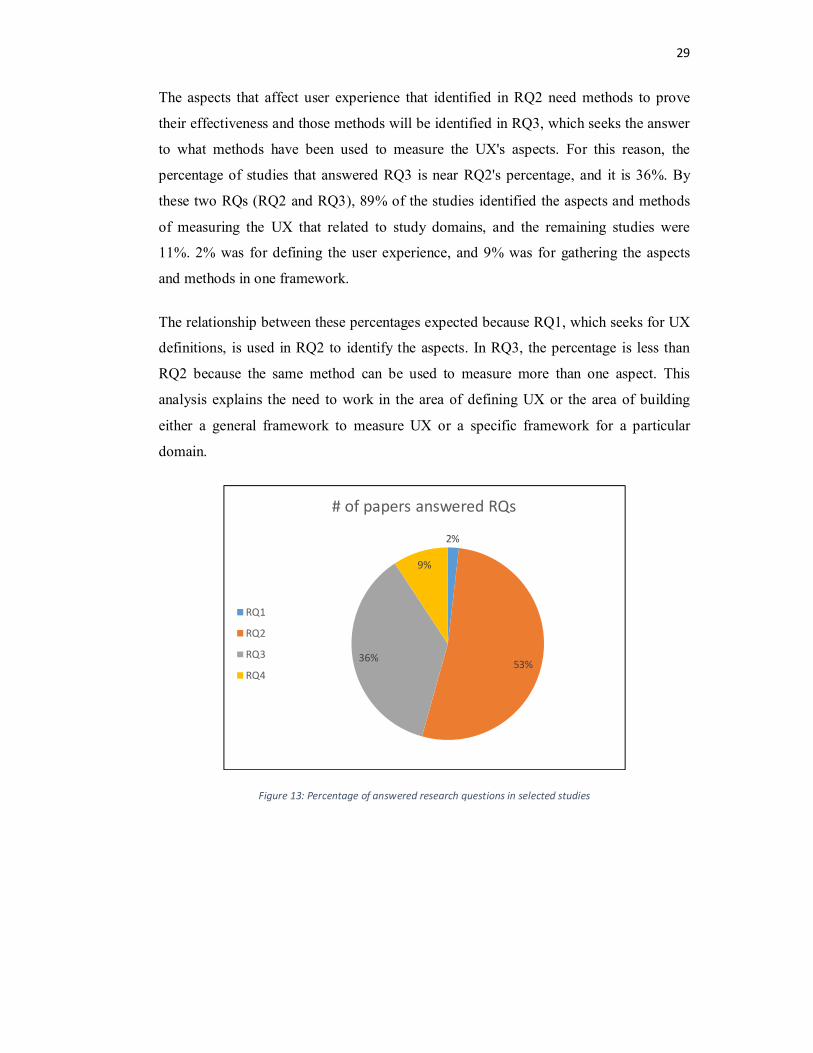
answered RQ.
From Figure 13, the majority of the primary studies have answered RQ2 which was
53%. The question is about identifying the aspects that affect the user experience. Those
aspects related to the study's domain itself but can be applied to any other domain,
either fully or partially.
Germany12%
Ireland3%
Finland20%
Netherland4%
UK10%China
9%Malaysia
3%
Taiwan2%
USA24%
Portugal1%
Korea1%
India2%
Singapore1%
Sweden1%
Switzerland2%
Bangladesh1%
Belgium1%
Greece2%
Japan1%
Norway1%
Denmark2%Country
29
The aspects that affect user experience that identified in RQ2 need methods to prove
their effectiveness and those methods will be identified in RQ3, which seeks the answer
to what methods have been used to measure the UX's aspects. For this reason, the
percentage of studies that answered RQ3 is near RQ2's percentage, and it is 36%. By
these two RQs (RQ2 and RQ3), 89% of the studies identified the aspects and methods
of measuring the UX that related to study domains, and the remaining studies were
11%. 2% was for defining the user experience, and 9% was for gathering the aspects
and methods in one framework.
The relationship between these percentages expected because RQ1, which seeks for UX
definitions, is used in RQ2 to identify the aspects. In RQ3, the percentage is less than
RQ2 because the same method can be used to measure more than one aspect. This
analysis explains the need to work in the area of defining UX or the area of building
either a general framework to measure UX or a specific framework for a particular
domain.
Figure 13: Percentage of answered research questions in selected studies
2%
53%36%
9%
# of papers answered RQs
RQ1
RQ2
RQ3
RQ4

30
3.7.1.5 Research Method
Figure 14 shows the percentages of the various research methods adopted by different
publications. The high percentage was 18%, and it was for Case Study. The method has
been classified to be other if the author does not explicitly mention the method.
Figure 14: Percentage of research methods used in selected studies
3.7.1.6 Application Domain
Application domains that have been scanned in this SLR are shown in Figure 15,
which explains that the majority of primary studies done without the limitation to a
particular domain, which was 51%, and it was identified as a General Domain. In
addition to the general domain, a scanning was happened for the studies that related to
domains similar to the mobile application from a development perspective; such as web
portals and from the point of view of affecting the mobile application such as Mobile
Communication.
Figure 15: Application domains that studied in this SLR papers
Other41%
Case Study18%Experiment
6%
Interview3%
Questionnaire
3%
Survey8%
Discussion11%
Empirical Study
2%
Comparison2%
Experience Report
4%
Ethnographic Study
1%
Thinking Aloud
1%Research Method
General51% Mobile
Communication2%
Mobile Apps12%
Software9%
e-Commerce
System3%
Mobile Devices
6%
Mobile Software
11%
Web Portals
6%Application Domain

31
3.7.1.7 Research Output
The research output from the primary studies in this SLR shown in Figure 16. It
noticed that the majority was about guidelines and emphasizing the aspects that need to
be considered when measuring the UX in addition to the methods that can be used to
measure those aspects. The percentage for the guidelines was 44%, while the new
suggested frameworks, models/methods, tools, and techniques - which are the ways of
using the aspect or the method- were 18%, 17%, 3%, and 1%, respectively.
Those new frameworks and models were for particular domains, but none of them was a
comprehensive one which can be used as a generic one. However, those frameworks
and models will be used to build the appropriate structures of a framework to measure
the UX on mobile applications. The usage experiences of techniques, tools, and models,
were 3%, 3%, and 2%, respectively. The remaining percentage was 1%, and it was for a
modification of current techniques to use a method to measure an aspect of user
experience.
Figure 16: Output of selected studies
New Framework18%
Guidelines44%
New Tool3%
Usage Experience of Technique
11%
Usage Experience
of Tool3%
Usage Experience of
Model2%
New Technique
1%
Modification of Technique
1%
New Model17%
32
3.7.2 Research Questions’ Answers & Findings
In next sections, the findings related to research questions are explained, and the
relation between the answers will be used to build the framework.
3.7.2.1 UX Definitions
ISO 9241-210 [11] has defined UX as “A person's perceptions and responses
that result from the use or anticipated use of a product, system or service”. A survey
that gathered a view of UX from 275 researchers has been conducted in [10]. It is
concluded that: “ the draft UX definition by ISO is a promising one, but the used terms
and the list of the possible objects of UX will require further explanations, e.g.,
‘anticipated use’” [10]. In 2010, the ISO 9241-210 definition was confirmed and
published. Hassenzahl defined the UX [23] as “A momentary, primarily evaluative
feeling while interacting with a product or service”. Hassenzahl‘s definition focused on
evaluating feelings while interacting with the product. Schulze defined the UX in [24]
as: “The degree of positive or negative emotions that can be experienced by a particular
user in a specific context during and after product use and that motivates for further
usage.” Schulze’s definition focused on the emotions felt while interacting with the
product.
For each UX’s definition, there are one or more elements that build the UX definition,
and the main element that identified from the UX survey [10] is the Perspective.
Perspective will help identify what and who has been affected by the changes of the UX
and below are the UX Perspectives that taken from the UX definitions [10]:
• Organization: concerned about designing a good UX of its products
• User: concerned about emotions and usability.
• Value: concerned about gained values
• Design: concerned about product look and its experience’s quality.
• Evaluation: concerned about the context of use and how to evaluate it.

33
To identify the relationships between the above perspectives and the UX impact, a
consideration was taken to what stated in many studies that the main components of
interaction between technology and user are system, product, user, and the context of
use [25] [26] [5], and Figure 17 explains this relationship.
Figure 17: Perspectives relationship
From Figure 17, the UX-related elements are:
1. UXà Organization: This will look to provide valuable products for the users.
2. UX à User: This is the person who is looking for a valuable and efficient
usage of the product.
3. UX à Context of use: which is the intermediate bridge between organization
and user, and it has an impact on both of them.
4. UX à Product: This is concerned the product design.
So, as a summary, the UX is a value centric and all UX elements related to the value.

34
3.7.2.2 UX research disciplines
In this SLR, the researchers focused on different disciplines depending on their
background or their purpose for the study and below are the main disciplines that are
studied in this SLR:
• UX and values: This is related to the impact of the UX’s level on one of the below
parts [25][27][28][29]:
o User’s value from using the product.
o Organization’s value from providing the product to the users.
o Conditional values that are related to the context of use and linked to the user
or company or both of them.
• UX and brand: This is related to the image of the organization or the marketing of
the products and how the UX got affected by them [25][28][5].
• UX and user’s needs: This is related to the two types of needs of the user which
are Pragmatic & Hedonic, and how satisfying the users will lead to a change in
UX’s level [16][25][30] [26][24][31] [32].
• UX and development process: This is related to the impact of the development
process on UX [32] [33].
• UX and technologies: This is related to the technologies that have been used to
deliver the product, the level of operation after releasing the product to the users,
and how the provided operation may affect the UX’s level [28] [5] [24][31] [34].
35
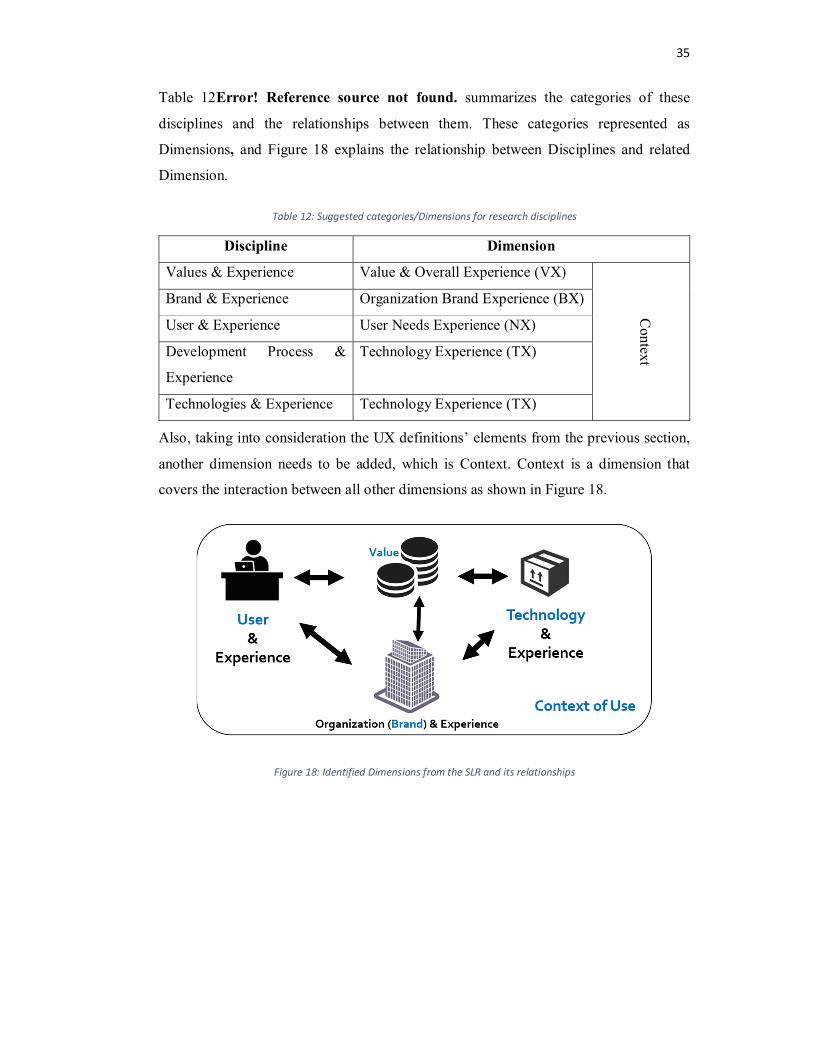
Table 12Error! Reference source not found. summarizes the categories of these
disciplines and the relationships between them. These categories represented as
Dimensions, and Figure 18 explains the relationship between Disciplines and related
Dimension.
Table 12: Suggested categories/Dimensions for research disciplines
Discipline Dimension
Values & Experience Value & Overall Experience (VX)
Context
Brand & Experience Organization Brand Experience (BX)
User & Experience User Needs Experience (NX)
Development Process &
Experience
Technology Experience (TX)
Technologies & Experience Technology Experience (TX)
Also, taking into consideration the UX definitions’ elements from the previous section,
another dimension needs to be added, which is Context. Context is a dimension that
covers the interaction between all other dimensions as shown in Figure 18.
Figure 18: Identified Dimensions from the SLR and its relationships

36
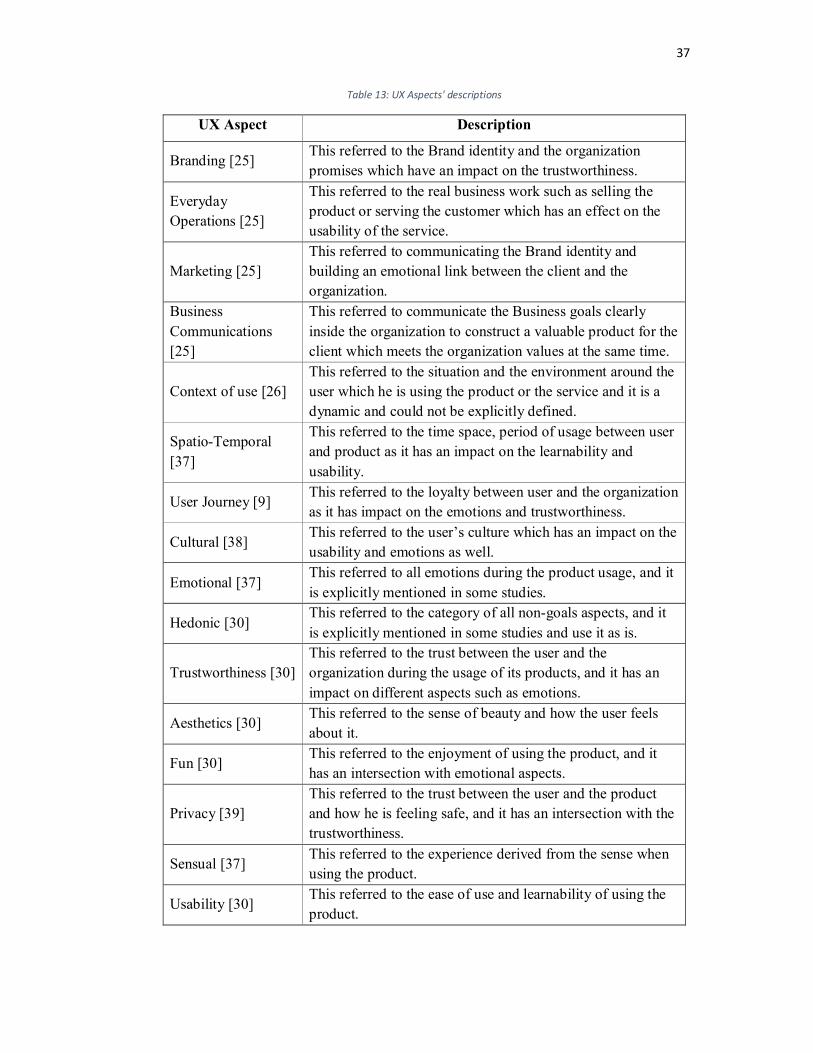
3.7.2.3 UX Aspects
From this SLR, the main UX aspects have been identified which mentioned in
the primary studies, and have a direct or indirect impact on the UX [24]. These aspects
are related to either the user himself, the system that is providing the service or the
context of use between them. Those three components building the relation between the
user and the system [5][25] [26]. The same terms that have been used in these primary
studies were used as much as possible to keep the same terminologies and Table
13Error! Reference source not found. explains the meaning of these aspects.
Moreover, the terms Pragmatic quality which is related to doing the task itself [35] such
as usability ;and Hedonic which is related to the expression of self and user’s personal
values [36] such as emotions were identified. The user’s related aspects can be either
related to achieving explicit goals which are pragmatic aspects, or achieving implicit
goals which are hedonic aspects. Figure 19 explains all aspects and the number of
papers that mentioned it.
Figure 19: UX aspects and number of related papers
3 2
1 1
10
15
10
4
20
854432
23
9
8
1 3 59 2
# of Papers / UX AspectsBrandingEveryday OperationsMarketingBusiness CommunicationsContext of useSpatio-TemporalUser JourneyCulturalEmotionalHedonicTrustworthinessAestheticsFunPrivacySensualUsabilityFunctionalityUsefulnessPlatform TechnologyInfrastructureService Response timeVisual AttractivenessDevelopment Process
37
Table 13: UX Aspects' descriptions
UX Aspect Description
Branding [25] This referred to the Brand identity and the organization promises which have an impact on the trustworthiness.
Everyday Operations [25]
This referred to the real business work such as selling the product or serving the customer which has an effect on the usability of the service.
Marketing [25] This referred to communicating the Brand identity and building an emotional link between the client and the organization.
Business Communications [25]
This referred to communicate the Business goals clearly inside the organization to construct a valuable product for the client which meets the organization values at the same time.
Context of use [26] This referred to the situation and the environment around the user which he is using the product or the service and it is a dynamic and could not be explicitly defined.
Spatio-Temporal [37]
This referred to the time space, period of usage between user and product as it has an impact on the learnability and usability.
User Journey [9] This referred to the loyalty between user and the organization as it has impact on the emotions and trustworthiness.
Cultural [38] This referred to the user’s culture which has an impact on the usability and emotions as well.
Emotional [37] This referred to all emotions during the product usage, and it is explicitly mentioned in some studies.
Hedonic [30] This referred to the category of all non-goals aspects, and it is explicitly mentioned in some studies and use it as is.
Trustworthiness [30] This referred to the trust between the user and the organization during the usage of its products, and it has an impact on different aspects such as emotions.
Aesthetics [30] This referred to the sense of beauty and how the user feels about it.
Fun [30] This referred to the enjoyment of using the product, and it has an intersection with emotional aspects.
Privacy [39] This referred to the trust between the user and the product and how he is feeling safe, and it has an intersection with the trustworthiness.
Sensual [37] This referred to the experience derived from the sense when using the product.
Usability [30] This referred to the ease of use and learnability of using the product.

38
Table 14: UX Aspects' descriptions (continued)
Functionality [40] This referred to the state of being functional and can meet the goals of using the product.
Usefulness [30] This referred to the state of being useful.
Platform Technology [41]
This referred to the software technology that has been used to build the product which has an impact on the usability and the emotions as well.
Infrastructure [42]
This referred to the hardware technology that has been used to build the product from both sides (client and Server) as it has an impact on the usability and it has interaction with Service Response Time aspect.
Service Response time [43]
This referred to the time that the organization takes to response to the user by a valuable result, and it is mainly here related to the technology.
Visual Attractiveness [30]
This referred to User Interface, and it has an impact on the usability and emotions as well.
Development Process [44]
This referred to the development process and how it is covering the user’s needs and expectations.
Taking into consideration the UX disciplines’ dimensions, the aspects that affect the UX
can be categorized into one of the below types:
• User’s needs aspects: which is related to the User dimension and can be divided
into two categories[36] [35]:
o Pragmatic aspects: This is related to the usability and do-goal qualities.
o Hedonic aspects: This is related to the feelings and be-goal qualities.
• Brand aspects: This is related to the marketing and the business communications
between the user and the organization and can be linked to the Organization
Brand dimension.
• Technology aspects: This is related to the development and production
technologies that have an impact on the overall experience and can be linked to
the Technology dimension. It can be divided into four types:
o UX designs (UXD) aspects: This is related to the UI designs.
o Development technology aspects: This is related to development technologies
that are used in delivering the product.

39
o Hardware aspects: This is related to the infrastructure of either the client side
or the server side.
o Operation aspects: This is related to the technologies that are used to monitor
the production and response to the users.
• The context of use aspects: This is related to any aspect that is not related to one
of the previous aspects but has an impact on them and can be linked to the
Context dimension.
From the previous classifications and the identified UX aspects from the primary
studies, the below table is filled to show the relationship between the UX aspects, its
categories and UX dimensions as shown in Table 15.
Table 15: Suggested categories for UX aspects and their relationship to UX dimensions
UX Aspect Category Dimension
Branding Brand BX
Everyday Operations Brand BX
Marketing Brand BX
Business Communications Brand BX
Context of use Context BX
Spatio-Temporal Context BX
User Journey Context BX
Cultural Context NX
Emotional Hedonic NX
Hedonic Hedonic NX
Trustworthiness Hedonic NX
Aesthetics Hedonic NX
Fun Hedonic NX
Privacy Hedonic NX
Sensual Hedonic NX
Usability Pragmatic NX
Functionality Pragmatic NX
Usefulness Pragmatic NX
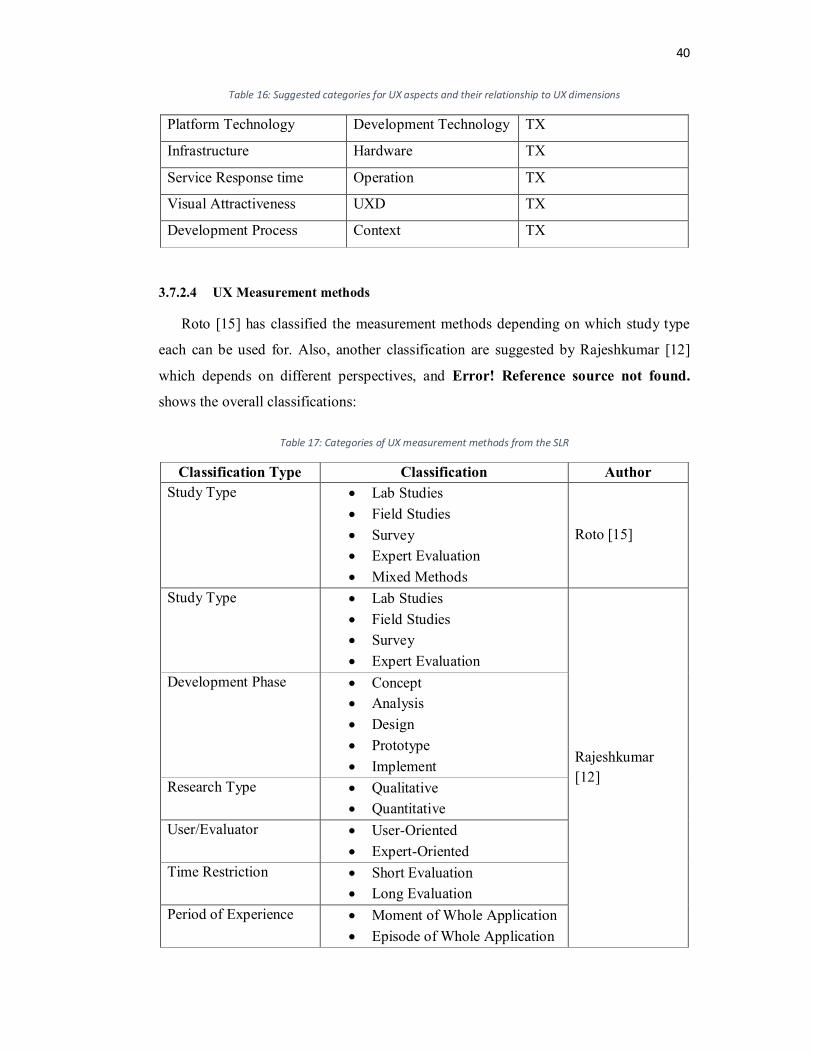
40
Table 16: Suggested categories for UX aspects and their relationship to UX dimensions
Platform Technology Development Technology TX
Infrastructure Hardware TX
Service Response time Operation TX
Visual Attractiveness UXD TX
Development Process Context TX
3.7.2.4 UX Measurement methods
Roto [15] has classified the measurement methods depending on which study type
each can be used for. Also, another classification are suggested by Rajeshkumar [12]
which depends on different perspectives, and Error! Reference source not found.
shows the overall classifications:
Table 17: Categories of UX measurement methods from the SLR
Classification Type Classification Author Study Type • Lab Studies
• Field Studies • Survey • Expert Evaluation • Mixed Methods
Roto [15]
Study Type • Lab Studies • Field Studies • Survey • Expert Evaluation
Rajeshkumar [12]
Development Phase • Concept • Analysis • Design • Prototype • Implement
Research Type • Qualitative • Quantitative
User/Evaluator • User-Oriented • Expert-Oriented
Time Restriction • Short Evaluation • Long Evaluation
Period of Experience • Moment of Whole Application • Episode of Whole Application

41
• Overall of Whole Application
An identification for the measurement methods that have been used to measure the UX
aspects in the primary studies has been done. Those methods are used to measure the
UX aspects, either alone as one method or mixed with other methods. Also, the same
method is used to measure more than one aspect in some cases.
In these primary studies, some of the methods are mentioned by the general name, such
as questionnaire, interview, etc., while the remaining methods are mentioned as part of
the commercial name, such as Attrakdiff, which is a Questionnaire. Table 18 shows the
measurement methods and number of related papers.
Table 18: Extracted UX measurement methods from the selected studies
Measurement Method # of papers Measurement Method # of
papers Questionnaire 6
Experience Report (Open-ended Questions) 1
Interview 5 User’s Feedback 1 Experience Report 5 Diary 1 Expert Review 4 Valence Method 1
Attrakdiff 4 Expressing Experiences and Emotions (3E) 1
Electromyography Responses (EMG) 3 Probe 1
Self-Assessment Manikin (SAM) 3 Fuzzy Cognitive Map ( FCM) 1
Persona 3 UNeeQ 1 User Profile 3 Survey 1
UX Curve 2 System Usability Scale questionnaire (SUS) 1
Observation 2 Sentence Compaction Survey 1
PLEX 2 Emocards 1
Day Reconstruction Method 2 Emotion Words Priming List (EWPL) 1
Lean UX 1 PrEmo 1
Prototype 1 Group Experience Evaluation Method 1
BadIdeas 1
Subjective Usability Measurement Inventory (SUMI) 1
Electro Dermal Activity (EDA) 1 SUXES 1 Specification Document 1 Attrak-Work 1 Think-Aloud 1 Focus Group 1
AHP 1 Experience Sampling Method (ESM) 1

42
Table 19: Extracted UX measurement methods from the selected studies
Tracking Realtime User Experience (TRUE) Method 1
Goal Question Metric (GQM)
1
DrawUX 1 Experience Evaluation Model (EEM)
1
UX Cards 1 User Experience Metric(UXM)
1
UX Concept Testing 1 SPUX 1
iScale 1 Self-Expression Template Method
1
An important point that needs to be mentioned is that those measurement methods are
not necessarily used to measure all UX aspects in the study mentioning the method, and
the goal was to understand the methods’ popularity along with the aspect.
The focus will be on the generic methods, so it can be a starting point to link the
methods with the aspects and Error! Reference source not found. shows the UX
measurement methods that are mentioned using the general names:
Table 20: UX measurement Methods - General Names
General Measurement Methods
Questionnaire
Interview
Expert Review
Persona
Survey
User Profile
Observation
Prototype
Specification Document
Focus Group
Think-Aloud
Experience Report
Users’ Feedback
Diary

43
3.7.2.5 UX Frameworks and related participants
In this SLR, there are participations from the authors about UX, but none of
them shows a structured concept about UX that can be used as a framework. The
available participations have been reviewed to understand how it is related to UX, and if
there is any discipline that can help to understand the UX relations. Gathered disciplines
in 3.7.2.2 which converted to be UX dimensions are used to validate the available
participations, and to check the UX dimensions coverage. This was applied to validate
the need for a new framework that gather available participations in one place. Error!
Reference source not found. Shows participations, and covered UX dimensions.
Table 21: Related UX participations and UX dimensions coverage
Participations From Year UX dimensions
Mahlke [30] 2005 User Needs Experience
Vyas [45] 2006 User Needs Experience
Jetter [25] 2007 User Needs Experience, Brand Experience
Thayer [46] 2009 User Needs Experience, Brand Experience
Moller [26] 2009 User Needs Experience, Technology Experience
Schulze [24] 2010 User Needs Experience
Gegner [27] 2011 Brand Experience
Zhi Chen [31] 2011 User Needs Experience, Technology Experience
Gross [16] 2012 User Needs Experience, Value Experience
Anitha [33] 2012 Technology Experience
Jian [28] 2012 Technology Experience, Brand Experience
Fuchsberger [29] 2012 Value Experience, User Needs Experience
Gao [34] 2013 User Needs Experience, Technology Experience
Kujala [47] 2013 Brand Experience
Fronemann [32] 2014 User Needs Experience, Technology Experience
Zhenzhen [5] 2014 Brand Experience

44
3.8 Validity Threats
As stated by Pereira in [48] that a key issue when performing the SLR is validating
the results. In this section, the possible threats and how to minimize its impact will be
discussed, and it will be categorized as follow[49].
• Investigator Bias
This research has been done by an individual researcher, and it could have more
threats than other SLRs which done by more than one researcher, and this may
have an impact on selected primary papers, extracted data, and its results.
However, this SLR was reviewed and validated by the supervisor who did too
many SLRs on various topics. In addition to that, all primary papers have been
reviewed more than one time during the various phases. For instance, abstract
and titles have been scanned at least three times as explained in section 3.3.
However, a claim that these have solved this type of bias could not be exist, but
it reduced its impact.
• Publication Bias
In this SLR, the primary papers have been selected from four digital libraries
using specific keywords derived from the research questions as explained in
section 3.3. All papers that were not accessible or not related to the domain were
excluded, and all excluded papers are tracked and can be reviewed by any other
researchers if needed. However, the primary studies were limited to papers, and
magazines and books were excluded to increase the reliability if possible.
Hence, that ACM has 59% from selected papers while IEEE has 25% which
refer to the majority of papers are related to a computer technology, not an
engineering. The research was limited to these digital libraries due to the
availability, and because of the popularity of these libraries. No claim that
coverage for all studies in this domain is happened because there are too
different digital libraries and source may contain relevant studies.
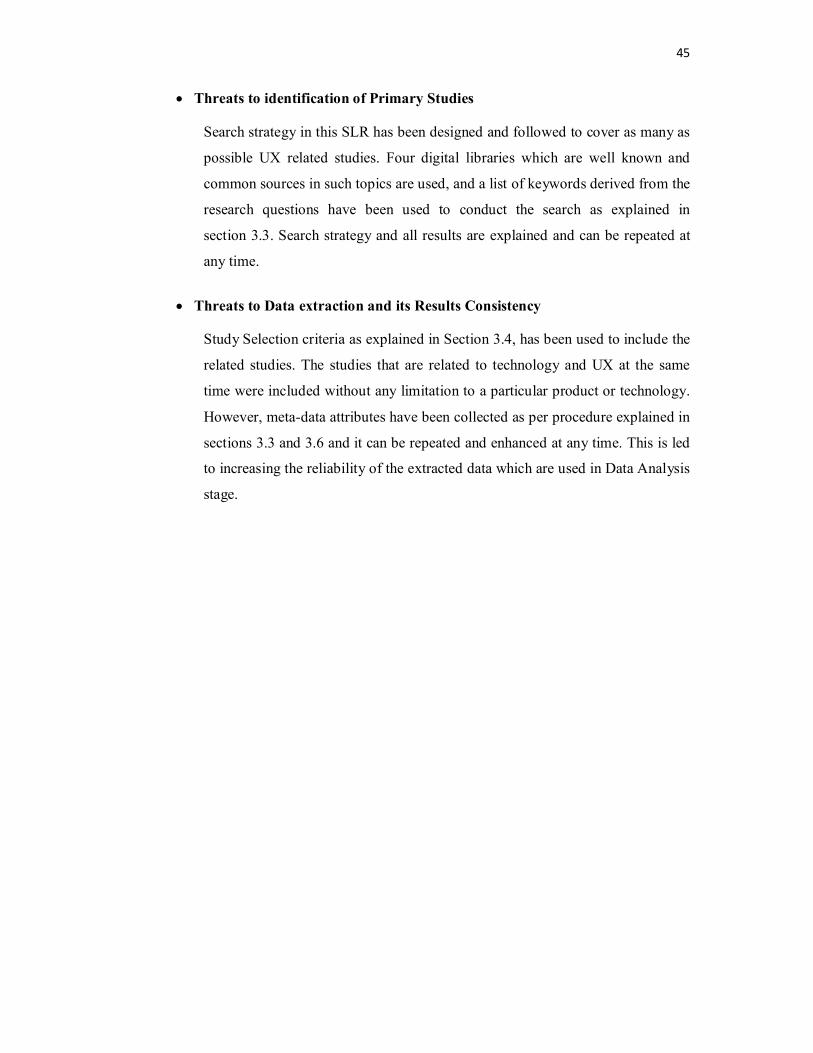
45
• Threats to identification of Primary Studies
Search strategy in this SLR has been designed and followed to cover as many as
possible UX related studies. Four digital libraries which are well known and
common sources in such topics are used, and a list of keywords derived from the
research questions have been used to conduct the search as explained in
section 3.3. Search strategy and all results are explained and can be repeated at
any time.
• Threats to Data extraction and its Results Consistency
Study Selection criteria as explained in Section 3.4, has been used to include the
related studies. The studies that are related to technology and UX at the same
time were included without any limitation to a particular product or technology.
However, meta-data attributes have been collected as per procedure explained in
sections 3.3 and 3.6 and it can be repeated and enhanced at any time. This is led
to increasing the reliability of the extracted data which are used in Data Analysis
stage.
46
4 Proposed Framework
In this chapter, the results of the extracted data from the SLR are considered in
detail aiming to define a framework that combine collected data.
4.1 UX Definitions Perspective [10] is the main element that used to build UX definition, and it will help
to identify who has been affected by the changes of the UX. From Figure 17, the UX-
related perspectives are explained as follow:
• Organization: This will look to provide valuable products for the users.
• User: The user is looking for a valuable and appropriate usage of the product.
• The context of use: This has an impact on both elements which are organization
and user, and is the intermediate bridge between them.
• Product: This is concerned the product design.
Also, the UX is a value centric, and all UX perspectives are related to the value.
4.2 UX Dimensions Dimension is the category of the research disciplines that has been followed in
the primary studies to study the UX. The UX dimensions that are related to the research
studies in the primary studies are listed below and was shown before in Error!
Reference source not found..
• Value: This is related to the studies that have been focused on the gained value.
• User Needs Experience (NX): This is related to the studies that have been
focused on user needs and gained qualities.
• Brand Experience (BX): This is related to the studies that have focused on the
organization’s brand image.
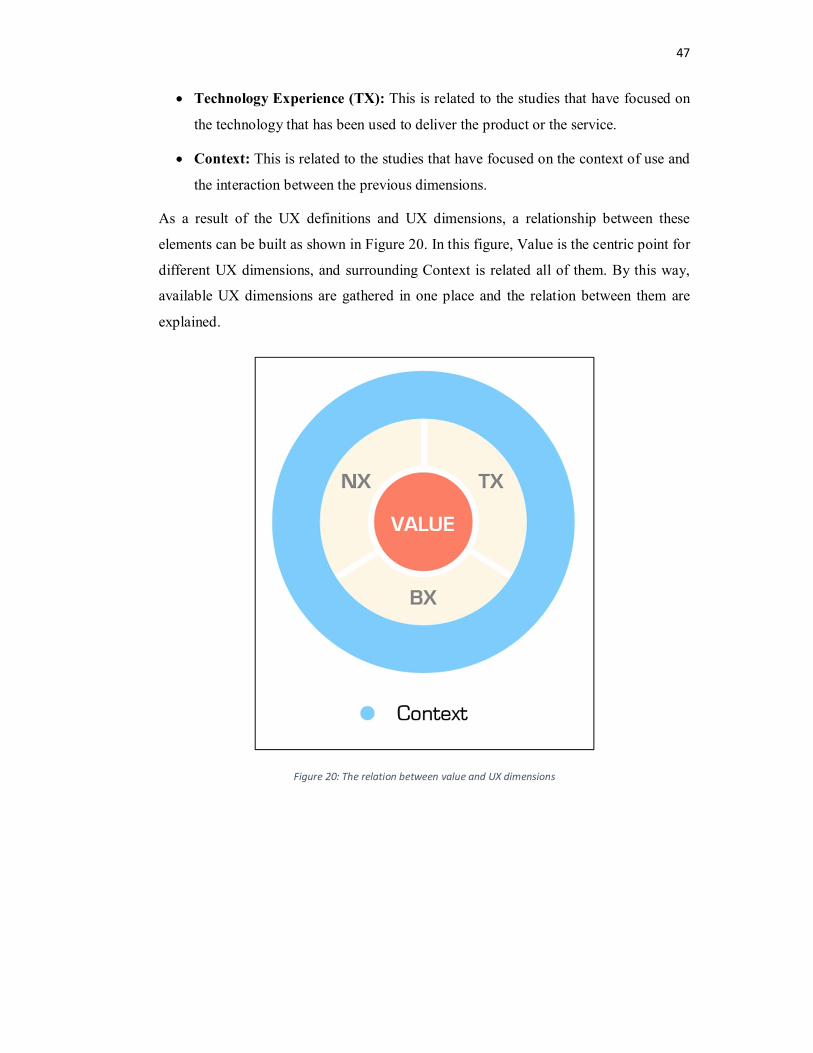
47
• Technology Experience (TX): This is related to the studies that have focused on
the technology that has been used to deliver the product or the service.
• Context: This is related to the studies that have focused on the context of use and
the interaction between the previous dimensions.
As a result of the UX definitions and UX dimensions, a relationship between these
elements can be built as shown in Figure 20. In this figure, Value is the centric point for
different UX dimensions, and surrounding Context is related all of them. By this way,
available UX dimensions are gathered in one place and the relation between them are
explained.
Figure 20: The relation between value and UX dimensions
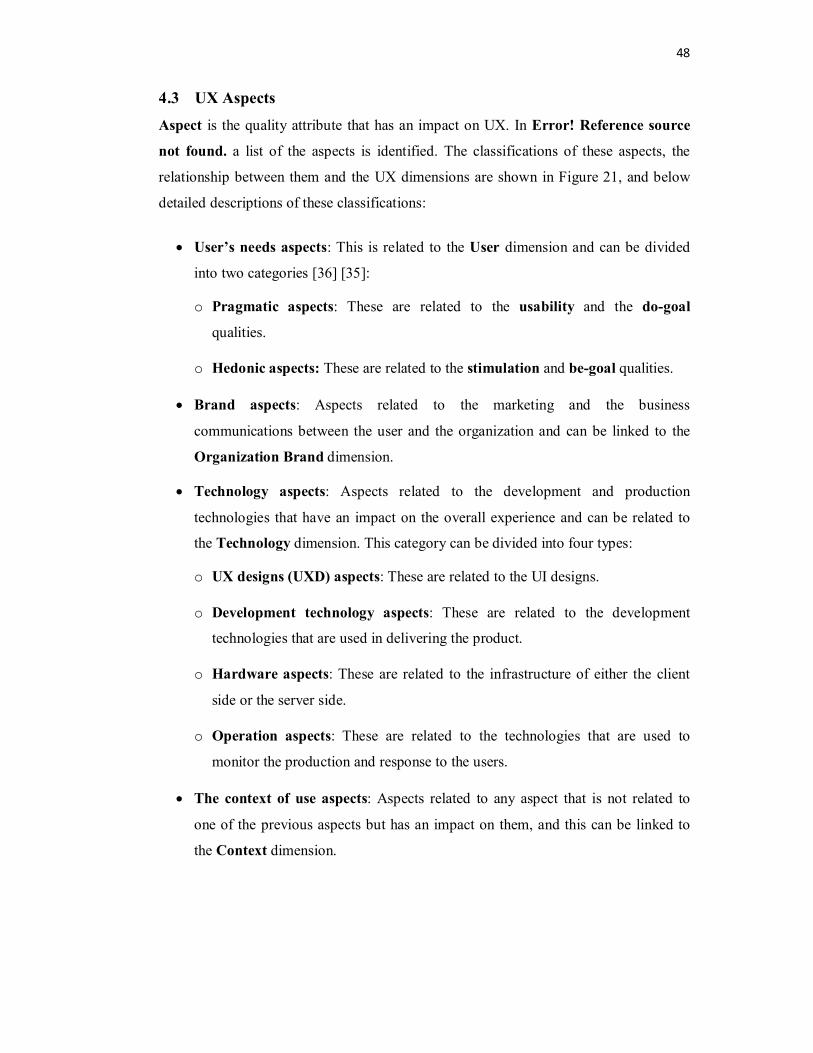
48
4.3 UX Aspects Aspect is the quality attribute that has an impact on UX. In Error! Reference source
not found. a list of the aspects is identified. The classifications of these aspects, the
relationship between them and the UX dimensions are shown in Figure 21, and below
detailed descriptions of these classifications:
• User’s needs aspects: This is related to the User dimension and can be divided
into two categories [36] [35]:
o Pragmatic aspects: These are related to the usability and the do-goal
qualities.
o Hedonic aspects: These are related to the stimulation and be-goal qualities.
• Brand aspects: Aspects related to the marketing and the business
communications between the user and the organization and can be linked to the
Organization Brand dimension.
• Technology aspects: Aspects related to the development and production
technologies that have an impact on the overall experience and can be related to
the Technology dimension. This category can be divided into four types:
o UX designs (UXD) aspects: These are related to the UI designs.
o Development technology aspects: These are related to the development
technologies that are used in delivering the product.
o Hardware aspects: These are related to the infrastructure of either the client
side or the server side.
o Operation aspects: These are related to the technologies that are used to
monitor the production and response to the users.
• The context of use aspects: Aspects related to any aspect that is not related to
one of the previous aspects but has an impact on them, and this can be linked to
the Context dimension.

49
Figure 21: UX Aspects Classifications
A list of the aspects and all related categories explained in Error! Reference source
not found.. The Context dimension refers to the interaction between other dimensions,
and it has the following aspects:
o Spatio-Temporal
o User Journey
o Cultural
o Context of Use
o Development Process
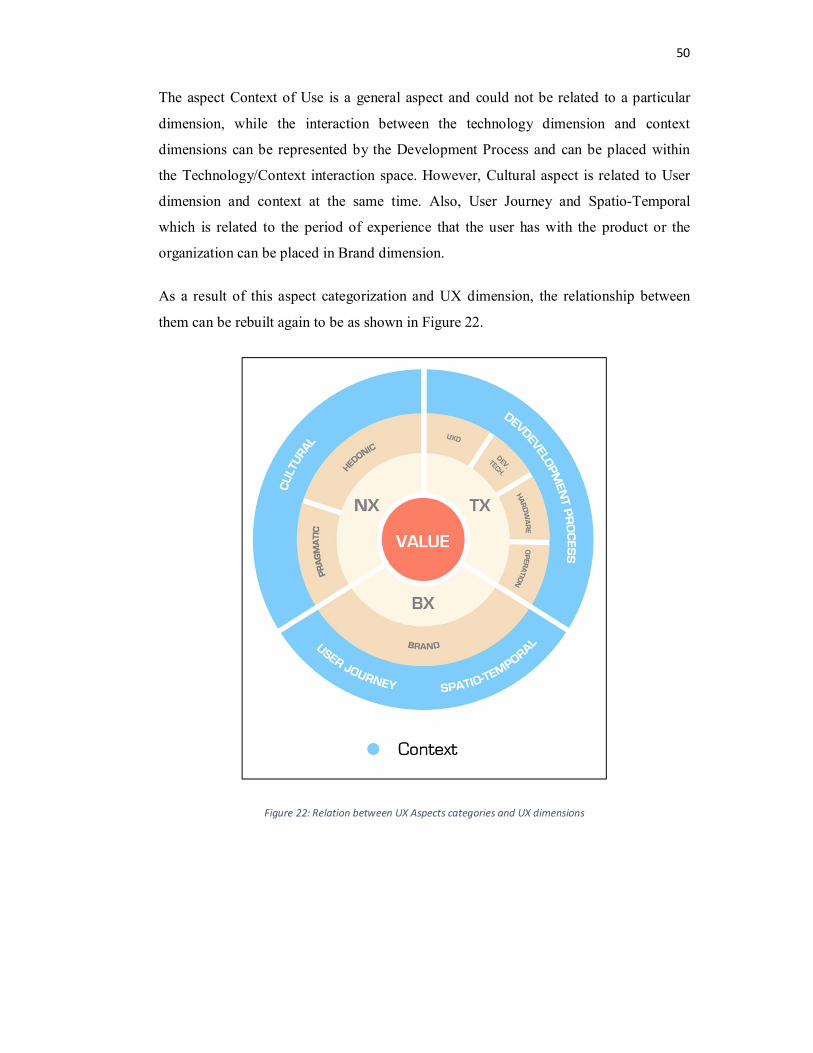
50
The aspect Context of Use is a general aspect and could not be related to a particular
dimension, while the interaction between the technology dimension and context
dimensions can be represented by the Development Process and can be placed within
the Technology/Context interaction space. However, Cultural aspect is related to User
dimension and context at the same time. Also, User Journey and Spatio-Temporal
which is related to the period of experience that the user has with the product or the
organization can be placed in Brand dimension.
As a result of this aspect categorization and UX dimension, the relationship between
them can be rebuilt again to be as shown in Figure 22.
Figure 22: Relation between UX Aspects categories and UX dimensions
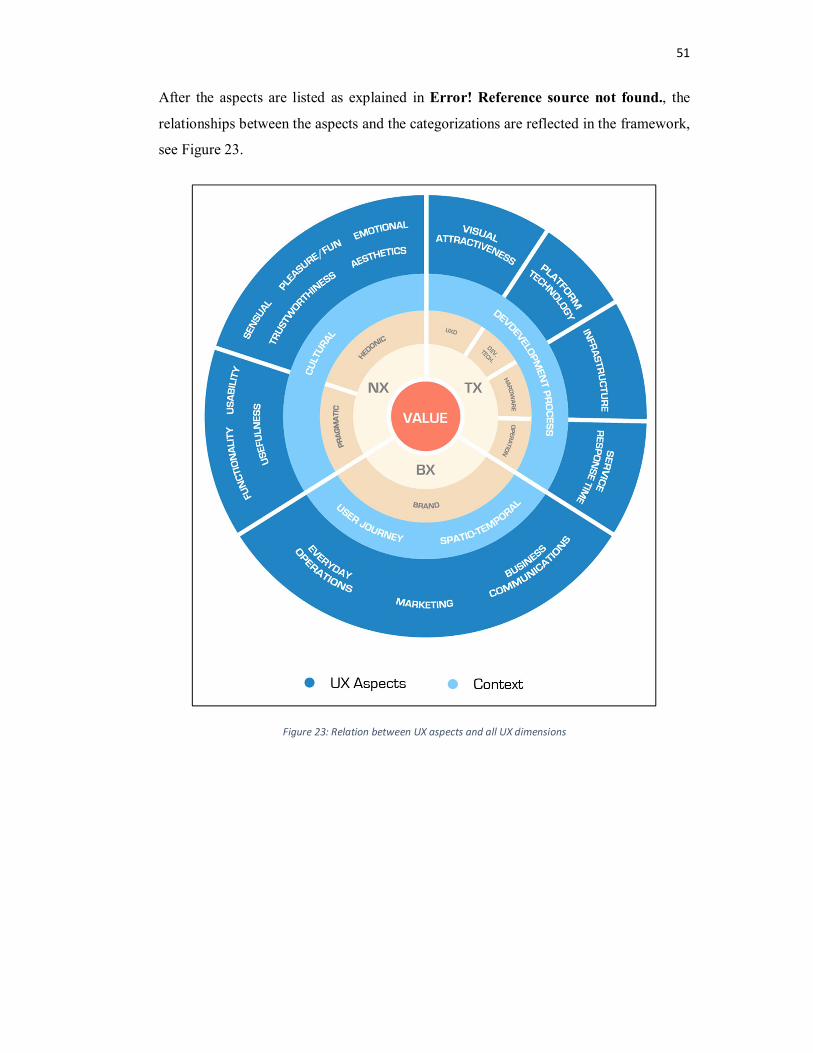
51
After the aspects are listed as explained in Error! Reference source not found., the
relationships between the aspects and the categorizations are reflected in the framework,
see Figure 23.
Figure 23: Relation between UX aspects and all UX dimensions

52
4.4 UX Measurement Methods Measurement Method is a method to measure the UX aspect and to get
information about the fulfillment level of this aspect. Too many methods have been
identified from the primary studies. Most of them belong to the categories (generic
methods) that were shown in Error! Reference source not found. but are identified by
another name – either a commercial name such as Attrakdiff [15] or a proposed name
because it was mixed methods such as UNeeQ [32]. After reviewing those generic
methods and their use in the primary studies, a categorization has been identified
according to the applicability of the method to the UX dimension in general. Error!
Reference source not found. shows the main measurement methods (general methods)
that have been proposed to be used with corresponding UX dimensions to measure its
Aspects.
Table 22: Suggested relationship between the UX measurement methods and the UX dimensions
Method UX Dimensions
NX BX TX
Questionnaire √ √
Interview √ √
Expert Review √ √
Persona √ √
User Profile √ √
Observation √
Prototype √ √
Specification Document √
Think-Aloud √
Experience Report √ √
Users’ Feedback √ √
Diary √
Survey √ √
Focus Group √
For the Context dimension, no measurement methods are assigned, because the UX
aspects in this dimension are not applicable to be measured.
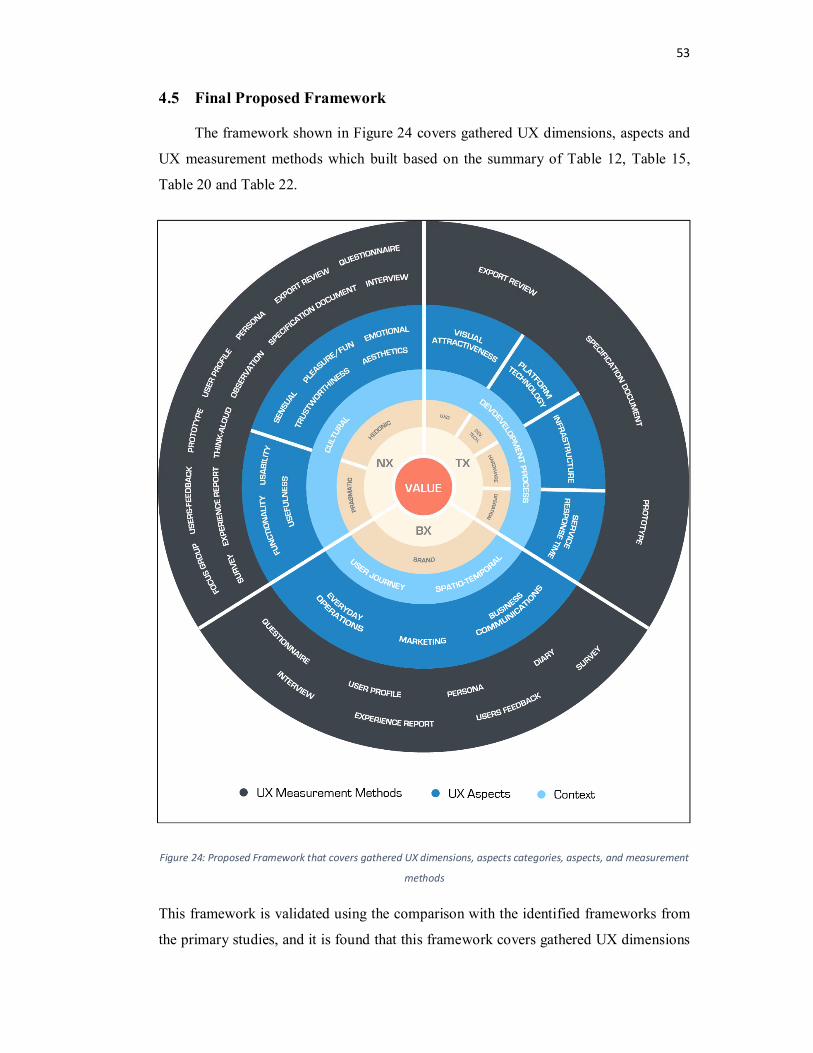
53
4.5 Final Proposed Framework
The framework shown in Figure 24 covers gathered UX dimensions, aspects and
UX measurement methods which built based on the summary of Table 12, Table 15,
Table 20 and Table 22.
Figure 24: Proposed Framework that covers gathered UX dimensions, aspects categories, aspects, and measurement
methods
This framework is validated using the comparison with the identified frameworks from
the primary studies, and it is found that this framework covers gathered UX dimensions

54
compared to the remaining framework as shown in Error! Reference source not
found.. This framework can be used to understand the UX aspects and factors that
affect the UX in general. Also, it can be used as strategic guidelines for including the
UX activities in an organization.
Table 23: Related UX participations and UX dimensions coverage, and proposed framework
Participation From Year UX dimensions
Mahlke [30] 2005 User Needs Experience
Vyas [45] 2006 User Needs Experience
Jetter [25] 2007 User Needs Experience, Brand Experience
Thayer [46] 2009 User Needs Experience, Brand Experience
Moller [26] 2009 User Needs Experience, Technology Experience
Schulze [24] 2010 User Needs Experience
Gegner [27] 2011 Brand Experience
Zhi Chen [31] 2011 User Needs Experience, Technology Experience
Gross [16] 2012 User Needs Experience, Value
Anitha [33] 2012 Technology Experience
Jian [28] 2012 Technology Experience, Brand Experience
Fuchsberger [29] 2012 Value, User Needs Experience
Gao [34] 2013 User Needs Experience, Technology Experience
Kujala [47] 2013 Brand Experience
Fronemann [32] 2014 User Experience, Technology Experience
Zhenzhen [5] 2014 Brand Experience
Proposed Framework 2015 Value, Brand Experience, User Needs Experience,
Technology Experience

55
5 Conclusion & Future Work
As a result of the all previous stages, the conclusion of findings, and future work
that required to move forward will be explained.
5.1 Conclusion
In this research, UX related results that can help in measuring user experience with
mobile applications have been presented. The purpose of this research is exploring how
the user experience on a mobile application is affected and how to measure it. To gain
this purpose, the below questions that derived the understanding are identified:
1. What are the different definitions of user experience in literature?
2. What are the aspects that affect the user experience?
3. What are the methods identified to measure each of the specified aspects in the literature?
4. What kind of framework can be developed to understand and measure the user experience with mobile applications?
From the systematic literature review and the analysis of extracted data, the possible
UX dimensions that have an impact on the UX either during the development or after
the product use are gathered. In addition to the UX dimensions, the relationship between
those dimensions and UX aspects that have a direct or indirect impact on the UX is
scanned. However, the possible methods that can be used to measure those aspects are
scanned. All these results have been analyzed and consolidated in one framework that
explains the relationship between UX dimensions, UX aspects and UX measurement
methods as shown in Figure 24. This framework is a promising one and can be used as
starting step for understanding how the user experience got affected in mobile
applications and how to measure it.
The proposed framework can be used as strategic guidelines for anyone who wants to
include the UX activities in his or her organization, as it shows the main dimensions
that affect the UX and it can help strategically to know the roles and responsibilities of
these concerned dimensions.
56
5.2 Future Work Concerning the future work, more work is required on the below points:
• Use a cumulative method to measure the UX from a long-term usage perspective,
as the current methods in the proposed framework are mainly for short-term
usage. The UX Curve method is mentioned in literature and can be used in such
cases and needs to be included in this framework [50][51].
• Build a relationship and integrate the proposed framework with a common
maturity model such as CMMI. This will help to improve strategically the UX
work level and a study in literature referring to that [22].
• Identify the proper development process that brings more consistency between the
proposed framework and the Development Process aspect that exists in the
Context dimension. Currently, no specific process is suggested, while the Lean
UX is proposed as a UX-centric development process [52] in literature.
• For each UX measurement method, a template and general guidelines are required
to assure that the questions and statements used in this method are covering all
related aspects. This can be reached by identifying the goals that satisfy the
aspect, and the Analytic Hierarchy Process (AHP) [31] method can help in this
case.
• An Experimental work on the commercial UX methods to assure its applicability
to measuring the different UX aspects. This will help to simplify the proposed
framework and give directions about which method can be used.
• More analysis in the Context dimension is needed to identify more aspects, so it
can be related to other dimensions.
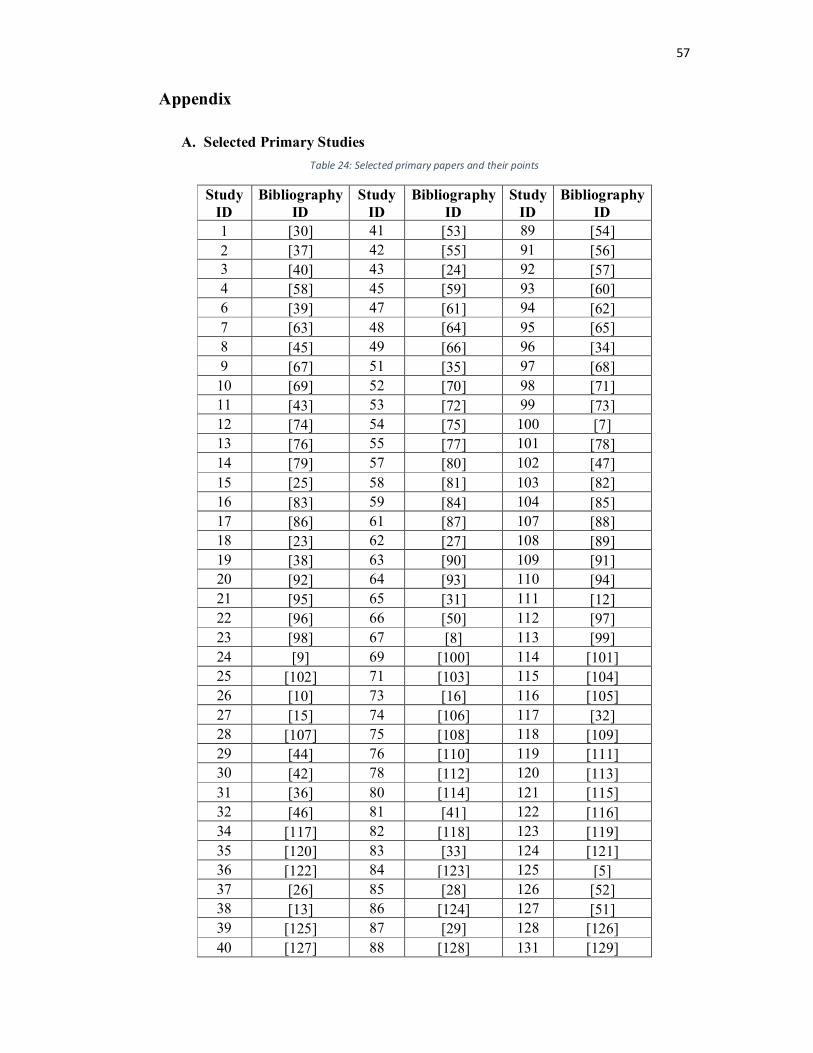
57
Appendix
A. Selected Primary Studies Table 24: Selected primary papers and their points
Study ID
Bibliography ID
Study ID
Bibliography ID
Study ID
Bibliography ID
1 [30] 41 [53] 89 [54] 2 [37] 42 [55] 91 [56] 3 [40] 43 [24] 92 [57] 4 [58] 45 [59] 93 [60] 6 [39] 47 [61] 94 [62] 7 [63] 48 [64] 95 [65] 8 [45] 49 [66] 96 [34] 9 [67] 51 [35] 97 [68]
10 [69] 52 [70] 98 [71] 11 [43] 53 [72] 99 [73] 12 [74] 54 [75] 100 [7] 13 [76] 55 [77] 101 [78] 14 [79] 57 [80] 102 [47] 15 [25] 58 [81] 103 [82] 16 [83] 59 [84] 104 [85] 17 [86] 61 [87] 107 [88] 18 [23] 62 [27] 108 [89] 19 [38] 63 [90] 109 [91] 20 [92] 64 [93] 110 [94] 21 [95] 65 [31] 111 [12] 22 [96] 66 [50] 112 [97] 23 [98] 67 [8] 113 [99] 24 [9] 69 [100] 114 [101] 25 [102] 71 [103] 115 [104] 26 [10] 73 [16] 116 [105] 27 [15] 74 [106] 117 [32] 28 [107] 75 [108] 118 [109] 29 [44] 76 [110] 119 [111] 30 [42] 78 [112] 120 [113] 31 [36] 80 [114] 121 [115] 32 [46] 81 [41] 122 [116] 34 [117] 82 [118] 123 [119] 35 [120] 83 [33] 124 [121] 36 [122] 84 [123] 125 [5] 37 [26] 85 [28] 126 [52] 38 [13] 86 [124] 127 [51] 39 [125] 87 [29] 128 [126] 40 [127] 88 [128] 131 [129]

58
B. UX Aspects’ Studies Table 25: UX aspects and the related studies
Aspect Related Studies (Study ID)
Usability 1,3,7,19,12,14,16,20,31,34,37,39,43,48,54,59,69,76,81,93,97,98,123
Emotional 2,4,6,8,9,14,17,28,36,37,54,57,74,92,99,100,103,113,115,131 Spatio-Temporal 2,20,21,26,30,35,66,84,92,94,102,118,119,127,128 Context of Use 37,49,55,57,64,75,91,97,110,123 User Journey 24,29,42,47,48,51,83,107,125 Functionality 3,8,20,22,30,36,37,97,104 Hedonic 1,15,31,34,37,43,51,93 Visual Attractiveness 1,7,8,37,43,89,97,112,121 Usefulness 1,7,12,16,37,43,119,123 Trustworthiness 1,9,16,34,88 Service Response time 11,16,20,26,37 Branding 15,20,26,129 Cultural 19,23,40,45 Aesthetics 1,14,37,82 Fun 1,9,12,13 Privacy 6,37,97 Infrastructure 30,34,37 Everyday Operations 15,20 Sensual 2,8 Marketing 15 Business Communications 15 Platform Technology 81 Development Process 29,51

59
C. UX Measurement Methods’ Studies Table 26: UX measurement methods and the related studies
Method Study ID Method Study ID
Questionnaire 30,32,37,43,92,96 Experience Report ( Open-Ended Questions ) 41
Interview 9,12,32,59,103 Users’ Feedback 124 Experience Report 32,55,59,63,95 Diary 127 Expert Review 30,34,37,122 Valence Method 52
Attrakdiff 27,29,59,119,128 Expressing Experiences and Emotions (3E) 100
Electromyography Responses (EMG) 14,115,131 Probe 23
Self-Assessment Manikin (SAM) 14,59,100 Fuzzy Cognitive Map ( FCM) 71
Persona 6,63,110 UNeeQ 117 User Profile 7,12,110 Survey 16,119
UX Curve 66,127 System Usability Scale Questionnaire (SUS) 96
Observation 27,28 Sentence Compaction Survey 40 PLEX 55,121 Emocards 27 Day Reconstruction Method 35,92 Emotion Words Priming List
(EWPL) 28
Lean UX 125 PrEmo 74
Prototype 63 Group Experience Evaluation Method 25
BadIdeas 42 Subjective Usability Measurement Inventory (SUMI) 14
Electro Dermal Activity (EDA) 14 SUXES 109
Specification Document 37 Attrak-Work 31
Think-Aloud 43 Focus Group 27
AHP 65 Experience Sampling Method(ESM) 100
Tracking Realtime User Experience (TRUE) Method
27 Goal Question Metric (GQM) 101
DrawUX 80 Experience Evaluation Model (EEM)
11
UX Cards 122 User Experience Metric (UXM) 22 UX Concept Testing 51 SPUX 48 iScale 119,128 Self-Expression Method 112
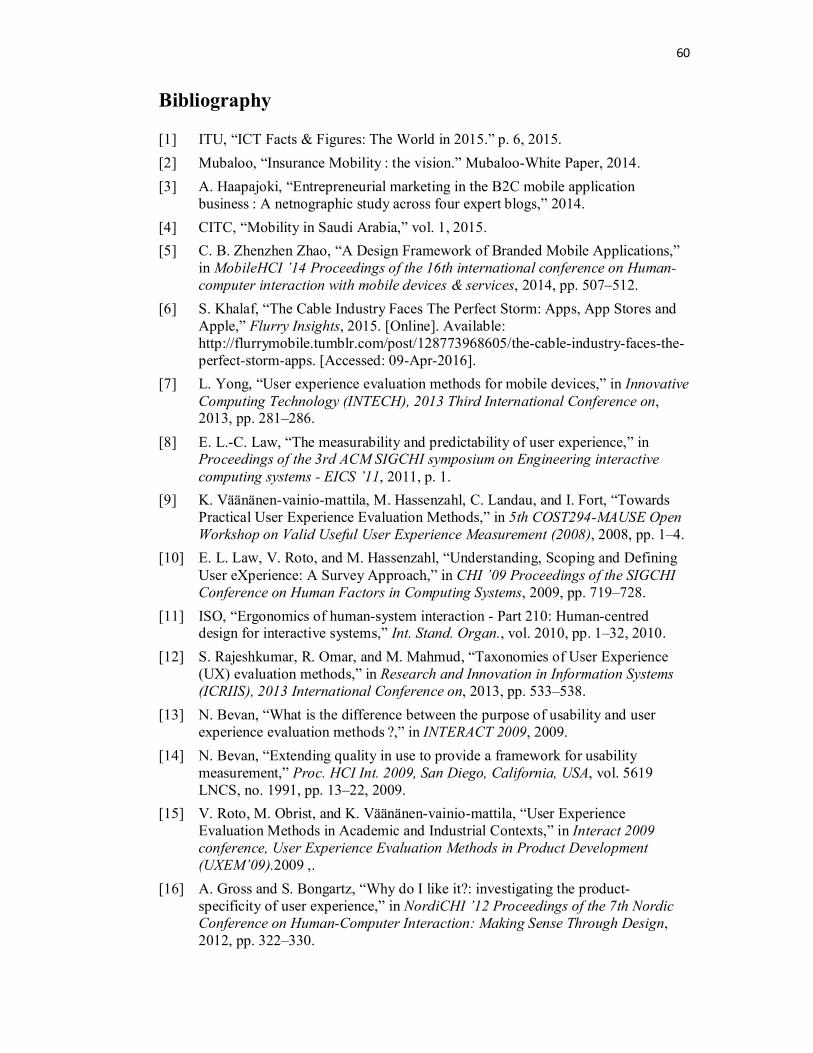
60
Bibliography
[1] ITU, “ICT Facts & Figures: The World in 2015.” p. 6, 2015. [2] Mubaloo, “Insurance Mobility : the vision.” Mubaloo-White Paper, 2014. [3] A. Haapajoki, “Entrepreneurial marketing in the B2C mobile application
business : A netnographic study across four expert blogs,” 2014. [4] CITC, “Mobility in Saudi Arabia,” vol. 1, 2015. [5] C. B. Zhenzhen Zhao, “A Design Framework of Branded Mobile Applications,”
in MobileHCI ’14 Proceedings of the 16th international conference on Human-computer interaction with mobile devices & services, 2014, pp. 507–512.
[6] S. Khalaf, “The Cable Industry Faces The Perfect Storm: Apps, App Stores and Apple,” Flurry Insights, 2015. [Online]. Available: http://flurrymobile.tumblr.com/post/128773968605/the-cable-industry-faces-the-perfect-storm-apps. [Accessed: 09-Apr-2016].
[7] L. Yong, “User experience evaluation methods for mobile devices,” in Innovative Computing Technology (INTECH), 2013 Third International Conference on, 2013, pp. 281–286.
[8] E. L.-C. Law, “The measurability and predictability of user experience,” in Proceedings of the 3rd ACM SIGCHI symposium on Engineering interactive computing systems - EICS ’11, 2011, p. 1.
[9] K. Väänänen-vainio-mattila, M. Hassenzahl, C. Landau, and I. Fort, “Towards Practical User Experience Evaluation Methods,” in 5th COST294-MAUSE Open Workshop on Valid Useful User Experience Measurement (2008), 2008, pp. 1–4.
[10] E. L. Law, V. Roto, and M. Hassenzahl, “Understanding, Scoping and Defining User eXperience: A Survey Approach,” in CHI ’09 Proceedings of the SIGCHI Conference on Human Factors in Computing Systems, 2009, pp. 719–728.
[11] ISO, “Ergonomics of human-system interaction - Part 210: Human-centred design for interactive systems,” Int. Stand. Organ., vol. 2010, pp. 1–32, 2010.
[12] S. Rajeshkumar, R. Omar, and M. Mahmud, “Taxonomies of User Experience (UX) evaluation methods,” in Research and Innovation in Information Systems (ICRIIS), 2013 International Conference on, 2013, pp. 533–538.
[13] N. Bevan, “What is the difference between the purpose of usability and user experience evaluation methods ?,” in INTERACT 2009, 2009.
[14] N. Bevan, “Extending quality in use to provide a framework for usability measurement,” Proc. HCI Int. 2009, San Diego, California, USA, vol. 5619 LNCS, no. 1991, pp. 13–22, 2009.
[15] V. Roto, M. Obrist, and K. Väänänen-vainio-mattila, “User Experience Evaluation Methods in Academic and Industrial Contexts,” in Interact 2009 conference, User Experience Evaluation Methods in Product Development (UXEM’09). ,2009 .
[16] A. Gross and S. Bongartz, “Why do I like it?: investigating the product-specificity of user experience,” in NordiCHI ’12 Proceedings of the 7th Nordic Conference on Human-Computer Interaction: Making Sense Through Design, 2012, pp. 322–330.

61
[17] S. Engineering, “Evidence-Based Software Engineering for Practitioners,” Software, IEEE 22.1, pp. 58–65, 2005.
[18] B. A. Kitchenham and T. Dybå, “Evidence-based Software Engineering,” in Proceedings of the 26th international conference on software engineering, 2004, pp. 273–281.
[19] S. Keele, “Guidelines for performing systematic literature reviews in software engineering,” EBSE Tech. Rep., vol. 2.3, 2007.
[20] B. Kitchenham and P. Brereton, “A systematic review of systematic review process research in software engineering,” Inf. Softw. Technol., vol. 55, no. 12, pp. 2049–2075, Dec. 2013.
[21] Mendeley.com, “Getting started with Mendeley Desktop.” 2016. [22] A. L. Peres and S. L. Meira, “Towards a framework that promotes integration
between the UX design and SCRUM, Aligned to CMMI,” in 2015 10th Iberian Conference on Information Systems and Technologies (CISTI), 2015, pp. 1–4.
[23] M. Hassenzahl, “User experience (UX): towards an experiential perspective on product quality,” in Proceedings of the 20th International Conference of the Association Francophone d’Interaction Homme-Machine on - IHM '08, 2008, pp. 11–15.
[24] K. Schulze and H. Krömker, “A framework to measure user experience of interactive online products,” in Proceedings of the 7th International Conference on Methods and Techniques in Behavioral Research - MB ’10, 2010, pp. 1–5.
[25] H. Jetter and J. Gerken, “A Simplified Model of User Experience for Practical Application,” in 2nd International Open Workshop on COST294-MAUSE (2006), 2007, pp. 2–3.
[26] S. Moller, K.-P. Engelbrecht, C. Kuhnel, I. Wechsung, and B. Weiss, “A taxonomy of quality of service and Quality of Experience of multimodal human-machine interaction,” in 2009 International Workshop on Quality of Multimedia Experience, 2009, pp. 7–12.
[27] L. Gegner, M. Runonen, and T. Keinonen, “Oscillating between extremes: a framework for mapping differing views on User eXperience,” in DPPI ’11 Proceedings of the 2011 Conference on Designing Pleasurable Products and Interfaces, 2011, p. Article No. 57.
[28] C. Jian, L. Wen-wang, Z. Wen-an, G. Hai-sheng, C. Zhang, and M. Shao-fu, “Customer experience oriented service quality management,” in Robotics and Applications (ISRA), 2012 IEEE Symposium on, 2012, pp. 298–301.
[29] V. Fuchsberger, C. Moser, and M. Tscheligi, “Values in action (ViA): combining usability, user experience and user acceptance,” in CHI EA ’12 CHI '12 Extended Abstracts on Human Factors in Computing Systems, 2012, pp. 1793–1798.
[30] S. Mahlke, “Understanding users’ experience of interaction,” in EACE ’05 Proceedings of the 2005 annual conference on European association of cognitive ergonomics, 2005, pp. 251–254.
[31] Zhi Chen and Shangshang Zhu, “The research of mobile application user experience and assessment model,” in Computer Science and Network Technology (ICCSNT), 2011 International Conference on, 2011, pp. 2832–2835.

62
[32] N. Fronemann and M. Peissner, “User experience concept exploration: user needs as a source for innovation,” in NordiCHI ’14 Proceedings of the 8th Nordic Conference on Human-Computer Interaction: Fun, Fast, Foundational, 2014, pp. 727–736.
[33] P. Anitha and B. Prabhu, “Integrating requirements engineering and user experience design in Product life cycle Management,” in 2012 First International Workshop on Usability and Accessibility Focused Requirements Engineering (UsARE), 2012, pp. 12–17.
[34] Gao Changyuan, Wang Shiying, and Zhong Chongran, “Research on user experience evaluation system of information platform based on web environment,” in Measurement, Information and Control (ICMIC), 2013 International Conference on, 2013, pp. 558–562.
[35] S. Sproll, M. Peissner, and C. Sturm, “From product concept to user experience: exploring UX potentials at early product stages,” in NordiCHI ’10 Proceedings of the 6th Nordic Conference on Human-Computer Interaction: Extending Boundaries, 2010, pp. 473–482.
[36] H. Väätäjä, T. Koponen, and V. Roto, “Developing Practical Tools for User Experience Evaluation: A Case from Mobile News Journalism,” in ECCE ’09 European Conference on Cognitive Ergonomics: Designing beyond the Product --- Understanding Activity and User Experience in Ubiquitous Environments, 2009, p. Article No. 23.
[37] R. I. A. Mercuri, “Technology as Experience,” interactions - Funology, pp. 42–43, 2005.
[38] I. Lee, J. Kim, and Y. An, “Cultural Dimensions for User Experience : Cross-Country and Cross-Product Analysis of Users’ Cultural Characteristics,” in British Computer Society Conference on Human-Computer Interaction (2008), 2008, pp. 3–12.
[39] D. Swallow, M. Blythe, and P. Wright, “Grounding Experience: Relating Theory and Method to Evaluate the User Experience of Smartphones,” in EACE ’05 Proceedings of the 2005 annual conference on European association of cognitive ergonomics, 2005, pp. 91–98.
[40] N. Mcnamara, “Functionality, Usability, and User Experience: Three Areas of Concern,” in International Journal (2005), 2005, pp. 26–28.
[41] N. P. Huy and D. VanThanh, “Evaluation of mobile app paradigms,” in Proceedings of the 10th International Conference on Advances in Mobile Computing & Multimedia - MoMM ’12, 2012, p. 25.
[42] H. Wigelius and H. Väätäjä, “Dimensions of Context Affecting User Experience in Mobile Work,” in INTERACT ’09 Proceedings of the 12th IFIP TC 13 International Conference on Human-Computer Interaction: Part II, 2009, pp. 604–617.
[43] W.-F. Tung and S.-T. Yuan, “Optimization of Collaborative Service Systems Using Experience Evaluation Model,” in Services Computing, 2007. SCC 2007. IEEE International Conference on, 2007, pp. 244–247.
[44] V. Roto, H. Rantavuo, and V. Kaisa, “EVALUATING USER EXPERIENCE OF EARLY PRODUCT CONCEPTS,” in Proc. DPPI. ,2009 , p. 9.
[45] D. Vyas and G. C. Van Der Veer, “Experience as Meaning: Some Underlying

63
Concepts and Implications for Design,” in Proceedings of the 13th Eurpoean conference on Cognitive ergonomics: trust and control in complex socio-technical systems. ACM. ,2006 .
[46] A. Thayer and T. E. T. E. Dugan, “Achieving design enlightenment: Defining a new user experience measurement framework,” in Professional Communication Conference, 2009. IPCC 2009. IEEE International, 2009, pp. 1–10.
[47] S. Kujala, M. Obrist, M. Vogel, and A. Pohlmeyer, “Lost in Time: The Meaning of Temporal Aspects in User Experience,” in CHI ’13 Extended Abstracts on Human Factors in Computing Systems on - CHI EA '13 (2013), 2013, pp. 559–564.
[48] J. Pereira, K. Constantino, and E. Figueiredo, “A Systematic Literature Review of Software Product Line Management Tools,” Softw. Reuse Dyn. Syst. Cloud Beyond SE - 6, vol. 8919, pp. 73–89, 2014.
[49] a. Krapp, S. Hidi, and K. a. Renninger, “Human Factors in Software Development : A Systematic Literature Review,” Role Interes. Learn. Dev., p. 368, 2010.
[50] S. Kujala and V. Roto, “Identifying hedonic factors in long-term user experience,” in DPPI ’11 Proceedings of the 2011 Conference on Designing Pleasurable Products and Interfaces, 2011, p. 17.
[51] F. Sahar, J. Varsaluoma, and S. Kujala, “Comparing the Effectiveness of Electronic Diary and UX Curve Methods in Multi-Component Product Study,” in AcademicMindTrek ’14: Proceedings of the 18th International Academic MindTrek Conference: Media Business, Management, Content & Services, 2014, pp. 93–100.
[52] L. Liikkanen, H. Kilpiö, L. Svan, and M. Hiltunen, “Lean UX - The Next Generation of User-Centered Agile Development?,” in NordiCHI ’14 Proceedings of the 8th Nordic Conference on Human-Computer Interaction: Fun, Fast, Foundational, 2014, pp. 1095–1100.
[53] K. Väänänen-Vainio-Mattila, H. Korhonen, and J. Arrasvuori, “Let Users Tell the Story: Evaluating User Experience with Experience Reports,” in CHI EA ’10 CHI '10 Extended Abstracts on Human Factors in Computing Systems, 2010, pp. 4051–4056.
[54] M. Nivethika, I. Vithiya, S. Anntharshika, and S. Deegalla, “Personalized and adaptive user interface framework for mobile application,” in Advances in Computing, Communications and Informatics (ICACCI), 2013 International Conference on, 2013, pp. 1913–1918.
[55] P. Silva and J. Read, “A methodology to evaluate creative design methods: a study with the BadIdeas method,” in OZCHI ’10 Proceedings of the 22nd Conference of the Computer-Human Interaction Special Interest Group of Australia on Computer-Human Interaction, 2010, pp. 264–271.
[56] X. Sun and A. May, “A Comparison of Field-Based and Lab-Based Experiments to Evaluate User Experience of Personalised Mobile Devices,” in Advances in Human-Computer Interaction, 2013, pp. 1–9.
[57] S. Kujala and T. Miron-Shatz, “Emotions, experiences and usability in real-life mobile phone use,” in CHI ’13 Proceedings of the SIGCHI Conference on Human Factors in Computing Systems, 2013, pp. 1061–1070.

64
[58] K. Battarbee and I. Koskinen, “Co-Experience – User Experience as Interaction,” CoDesign, no. 1.1, pp. 5–18, 2005.
[59] Q. Yan, “Cultural versioning of mobile user experience,” in Proceedings of the 28th of the international conference extended abstracts on Human factors in computing systems - CHI EA ’10, 2010, p. 2943.
[60] M. Salehi, M. Salimi, and A. Haque, “The Impact of Online Customer Experience (OCE) on Service Quality in Malaysia,” World Appl. Sci. J. , pp. 1621–1631, 2013.
[61] A. P. O. S. Vermeeren, E. L. Law, and V. Roto, “User Experience Evaluation Methods : Current State and Development Needs,” in Proceedings of the 6th Nordic Conference on Human-Computer Interaction Extending Boundaries - NordiCHI ’10 (2010), 2010, pp. 521–530.
[62] M. Vogel, “Temporal evaluation of aesthetics of user interfaces as one component of user experience,” in AUIC ’13 Proceedings of the Fourteenth Australasian User Interface Conference, 2013, pp. 131–132.
[63] Z. Pei and Z. Zhenxiang, “A Framework for Personalized Service Website based on TAM,” in Service Systems and Service Management, 2006 International Conference on, 2006, pp. 1598–1603.
[64] Y.-L. Huang, T. Marsh, and A. D. Cheok, “Investigation of software patterns of user experience,” in Proceedings of the 7th International Conference on Advances in Computer Entertainment Technology - ACE ’10, 2010, p. 116.
[65] S. Hedegaard and J. G. Simonsen, “Extracting usability and user experience information from online user reviews,” in Proceedings of the SIGCHI Conference on Human Factors in Computing Systems - CHI ’13, 2013, p. 2089.
[66] J. Arrasvuori, H. Korhonen, and K. Väänänen-Vainio-Mattila, “Exploring playfulness in user experience of personal mobile products,” in Proceedings of the 22nd Conference of the Computer-Human Interaction Special Interest Group of Australia on Computer-Human Interaction - OZCHI ’10, 2010, p. 88.
[67] J. Schrammel, A. Geven, and M. Tscheligi, “Using Narration to Recall and Analyse User Experiences and Emotions Evoked by Today’s Technology,” in International Conference on Design and Emotion (In Press). ,2006 .
[68] L. Arhippainen, “A Tutorial of Ten User Experience Heuristics.,” in MindTrek, 2013, pp. 336–337.
[69] S. N. Junaini, “Towards a Framework for the Assessment of Online Store Product Catalogs,” in Information and Communication Technologies, 2006. ICTTA ’06. 2nd, 2006, pp. 245–250.
[70] M. Burmester, M. Mast, K. Jäger, and H. Homans, “Valence method for formative evaluation of user experience,” in Proceedings of the 8th ACM Conference on Designing Interactive Systems - DIS ’10, 2010, p. 364.
[71] D. Raptis, N. Tselios, J. Kjeldskov, and M. Skov, “Does size matter ? Investigating the impact of mobile phone screen size on users ’ perceived usability , effectiveness and efficiency .,” in Proceedings of the international conference on Human-computer interaction with mobile devices and services (MobileHCI ’13) (2013), 2013, pp. 127–136.
[72] K. Rodden, H. Hutchinson, and X. Fu, “Measuring the User Experience on a
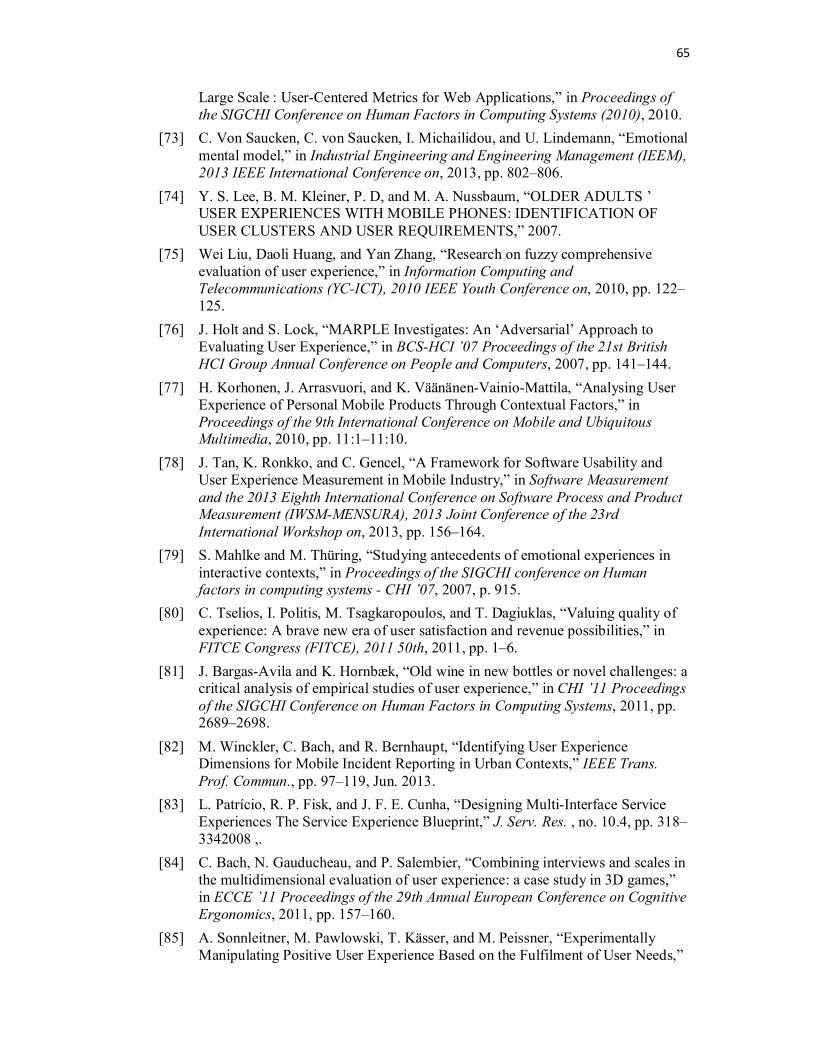
65
Large Scale : User-Centered Metrics for Web Applications,” in Proceedings of the SIGCHI Conference on Human Factors in Computing Systems (2010), 2010.
[73] C. Von Saucken, C. von Saucken, I. Michailidou, and U. Lindemann, “Emotional mental model,” in Industrial Engineering and Engineering Management (IEEM), 2013 IEEE International Conference on, 2013, pp. 802–806.
[74] Y. S. Lee, B. M. Kleiner, P. D, and M. A. Nussbaum, “OLDER ADULTS ’ USER EXPERIENCES WITH MOBILE PHONES: IDENTIFICATION OF USER CLUSTERS AND USER REQUIREMENTS,” 2007.
[75] Wei Liu, Daoli Huang, and Yan Zhang, “Research on fuzzy comprehensive evaluation of user experience,” in Information Computing and Telecommunications (YC-ICT), 2010 IEEE Youth Conference on, 2010, pp. 122–125.
[76] J. Holt and S. Lock, “MARPLE Investigates: An ‘Adversarial’ Approach to Evaluating User Experience,” in BCS-HCI ’07 Proceedings of the 21st British HCI Group Annual Conference on People and Computers, 2007, pp. 141–144.
[77] H. Korhonen, J. Arrasvuori, and K. Väänänen-Vainio-Mattila, “Analysing User Experience of Personal Mobile Products Through Contextual Factors,” in Proceedings of the 9th International Conference on Mobile and Ubiquitous Multimedia, 2010, pp. 11:1–11:10.
[78] J. Tan, K. Ronkko, and C. Gencel, “A Framework for Software Usability and User Experience Measurement in Mobile Industry,” in Software Measurement and the 2013 Eighth International Conference on Software Process and Product Measurement (IWSM-MENSURA), 2013 Joint Conference of the 23rd International Workshop on, 2013, pp. 156–164.
[79] S. Mahlke and M. Thüring, “Studying antecedents of emotional experiences in interactive contexts,” in Proceedings of the SIGCHI conference on Human factors in computing systems - CHI ’07, 2007, p. 915.
[80] C. Tselios, I. Politis, M. Tsagkaropoulos, and T. Dagiuklas, “Valuing quality of experience: A brave new era of user satisfaction and revenue possibilities,” in FITCE Congress (FITCE), 2011 50th, 2011, pp. 1–6.
[81] J. Bargas-Avila and K. Hornbæk, “Old wine in new bottles or novel challenges: a critical analysis of empirical studies of user experience,” in CHI ’11 Proceedings of the SIGCHI Conference on Human Factors in Computing Systems, 2011, pp. 2689–2698.
[82] M. Winckler, C. Bach, and R. Bernhaupt, “Identifying User Experience Dimensions for Mobile Incident Reporting in Urban Contexts,” IEEE Trans. Prof. Commun., pp. 97–119, Jun. 2013.
[83] L. Patrício, R. P. Fisk, and J. F. E. Cunha, “Designing Multi-Interface Service Experiences The Service Experience Blueprint,” J. Serv. Res. , no. 10.4, pp. 318–334 ,2008 .
[84] C. Bach, N. Gauducheau, and P. Salembier, “Combining interviews and scales in the multidimensional evaluation of user experience: a case study in 3D games,” in ECCE ’11 Proceedings of the 29th Annual European Conference on Cognitive Ergonomics, 2011, pp. 157–160.
[85] A. Sonnleitner, M. Pawlowski, T. Kässer, and M. Peissner, “Experimentally Manipulating Positive User Experience Based on the Fulfilment of User Needs,”

66
in Human-Computer Interaction–INTERACT 2013. ,2013 , pp. 555–562. [86] Y. Lim, J. Donaldson, H. Jung, B. Kunz, D. Royer, S. Ramalingam, S.
Thirumaran, and E. Stolterman, “Emotional Experience and Interaction Design,” in Affect and Emotion in Human-Computer Interface Design (2008), 2008, pp. 116 – 129.
[87] C. Mulwa, S. Lawless, M. Sharp, and V. Wade, “The evaluation of adaptive and personalised information retrieval systems : a review,” in International Journal of Knowledge and Web Intelligence (2011), 2011, vol. 2, pp. 138–156.
[88] J. Mashapa, E. Chelule, D. Van Greunen, and A. Veldsman, “Managing User Experience – Managing Change,” in Human-Computer Interaction–INTERACT 2013. ,2013 , pp. 660–677.
[89] S. Wirtz and E. Jakobs, “Improving User Experience for Passenger Information Systems. Prototypes and Reference Objects,” IEEE Trans. Prof. Commun., pp. 120–137, 2013.
[90] M. Obrist, E. Beck, D. Wurhofer, and M. Tscheligi, “Experience characters: a design tool for communicating mobile phone experiences to designers,” in MobileHCI ’11 Proceedings of the 13th International Conference on Human Computer Interaction with Mobile Devices and Services, 2011, pp. 385–394.
[91] T. Keskinen, J. Hakulinen, T. Heimonen, M. Turunen, S. Sharma, T. Miettinen, and M. Luhtala, “Evaluating the experiential user experience of public display applications in the wild,” in Proceedings of the 12th International Conference on Mobile and Ubiquitous Multimedia - MUM ’13, 2013, pp. 1–10.
[92] P. Ketola and V. Roto, “Exploring User Experience Measurement Needs,” in Proc. of the 5th COST294-MAUSE Open Workshop on Valid Useful User Experience Measurement (VUUM). ,2008 , pp. 23–26.
[93] V. Roto, H. Väätäjä, S. Jumisko-Pyykkö, and K. Väänänen-Vainio-Mattila, “Best practices for capturing context in user experience studies in the wild,” in Proceedings of the 15th International Academic MindTrek Conference on Envisioning Future Media Environments - MindTrek ’11, 2011, p. 91.
[94] R. Jain, J. Bose, and T. Arif, “Contextual adaptive user interface for Android devices,” in India Conference (INDICON), 2013 Annual IEEE, 2013, pp. 1–5.
[95] E. Karapanos, M. Hassenzahl, and J.-B. Martens, “User experience over time,” in Proceeding of the twenty-sixth annual CHI conference extended abstracts on Human factors in computing systems - CHI ’08, 2008, p. 3561.
[96] A. Joshi and S. Tripathi, “User Experience Metric and Index of Integration: Measuring Impact of HCI Activities on User Experience,” in I-USED ,2008 .
[97] L. Arhippainen and M. Pakanen, “Utilizing Self-Expression Template Method in User Interface Design - Three Design Cases,” in Proceedings of International Conference on Making Sense of Converging Media - AcademicMindTrek ’13, 2013, pp. 80–86.
[98] A. Ahtinen, S. Ramiah, J. Blom, and M. Isomursu, “Design of mobile wellness applications: identifying cross-cultural factors,” in OZCHI ’08 Proceedings of the 20th Australasian Conference on Computer-Human Interaction: Designing for Habitus and Habitat, 2008, pp. 164–171.
[99] C. L. Paul and A. Komlodi, “Measuring user experience through future use and
67
emotion,” in Proceedings of the extended abstracts of the 32nd annual ACM conference on Human factors in computing systems - CHI EA ’14, 2014, pp. 2503–2508.
[100] R. De Oliveira and N. Oliver, “Influence of Usability on Customer Satisfaction : A Case Study on Mobile Phone Services,” in NordiCHI 2012, 2012, no. September.
[101] T. Yamakami, “Exploratory analysis of differences between social experience design and user experience design,” in Advanced Communication Technology (ICACT), 2014 16th International Conference on, 2014, pp. 769–773.
[102] Z. Wang, X. Zhou, H. Wang, H. Ni, and R. Wu, “A Quantitative Evaluation Model of Group User Experience,” in Computational Intelligence and Industrial Application, 2008. PACIIA ’08. Pacific-Asia Workshop on, 2008, pp. 918–923.
[103] V. C. Gerogiannis, S. Papadopoulou, and E. I. Papageorgiou, “A Fuzzy Cognitive Map for Identifying User Satisfaction from Smartphones,” in Informatics (PCI), 2012 16th Panhellenic Conference on, 2012, pp. 156–161.
[104] A. Aggarwal, G. Niezen, and H. Thimbleby, “User experience evaluation through the brain’s electrical activity,” in Proceedings of the 8th Nordic Conference on Human-Computer Interaction Fun, Fast, Foundational - NordiCHI ’14, 2014, pp. 491–500.
[105] E. L. Law and P. van Schaik, “To Measure or Not to Measure UX: An Interview Study,” in I-UxSED, 2014, pp. 58–63.
[106] V. Milanova, T. Mandl, and R. Kölle, “Design for emotion: a case study,” in MobileHCI ’12 Proceedings of the 14th international conference on Human-computer interaction with mobile devices and services companion, 2012, pp. 59–64.
[107] H. Petrie and C. Harrison, “Measuring users’ emotional reactions to websites,” in Proceedings of the 27th international conference extended abstracts on Human factors in computing systems - CHI EA ’09, 2009, p. 3847.
[108] T. Jokela, “The early phases of UX : Why they are important ( more than evaluation ), and what they are ?,” in NordiCHI 2012, 2012.
[109] C.-C. Huang and E. Stolterman, “Temporal anchors in user experience research,” in Proceedings of the 2014 conference on Designing interactive systems - DIS ’14, 2014, pp. 271–274.
[110] I. Moczarny, M. Villiers, and J. Biljon, “How can usability contribute to user experience? A study in the domain of e-commerce,” in SAICSIT ’12 Proceedings of the South African Institute for Computer Scientists and Information Technologists Conference, 2012, pp. 216–225.
[111] J. Varsaluoma and F. Sahar, “Usefulness of long-term user experience evaluation to product development: practitioners’ views from three case studies,” in NordiCHI ’14: Proceedings of the 8th Nordic Conference on Human-Computer Interaction: Fun, Fast, Foundational, 2014, pp. 79–88.
[112] K. Kunze and D. Strohmeier, “Examining subjective evaluation methods used in multimedia Quality of Experience research,” in Quality of Multimedia Experience (QoMEX), 2012 Fourth International Workshop on, 2012, pp. 51–56.
[113] R. Alves, P. Valente, and N. J. Nunes, “The state of user experience evaluation
68
practice,” in Proceedings of the 8th Nordic Conference on Human-Computer Interaction Fun, Fast, Foundational - NordiCHI ’14, 2014, pp. 93–102.
[114] J. Varsaluoma and V. Kentta, “Drawux: web-based research tool for long-term user experience evaluation,” in NordiCHI ’12 Proceedings of the 7th Nordic Conference on Human-Computer Interaction: Making Sense Through Design, 2012, pp. 769–770.
[115] Y. Li and X. Wang, “Mobile interface studies about style description and influential factors,” in Management Science & Engineering (ICMSE), 2014 International Conference on, 2014, pp. 578–583.
[116] C. Lallemand, V. Koenig, and G. Gronier, “How Relevant is an Expert Evaluation of User Experience based on a Psychological Needs-Driven Approach?,” in NordiCHI ’14 Proceedings of the 8th Nordic Conference on Human-Computer Interaction: Fun, Fast, Foundational, 2014, pp. 11–20.
[117] K. Väänänen-Vainio-Mattila and M. Wäljas, “Developing an Expert Evaluation Method for User eXperience of Cross-platform Web Services,” in Proceedings of the 13th International MindTrek Conference: Everyday Life in the Ubiquitous Era, 2009, pp. 162–169.
[118] M. Q. Abbasi, J. Weng, Y. Wang, I. Rafique, X. Wang, and P. Lew, “Modeling and Evaluating User Interface Aesthetics Employing ISO 25010 Quality Standard,” in Quality of Information and Communications Technology (QUATIC), 2012 Eighth International Conference on, 2012, pp. 303–306.
[119] C. M. Macdonald and M. E. Atwood, “What Does it Mean for a System to be Useful ? An Exploratory Study of Usefulness,” in Designing interactive systems (2014), 2014, pp. 885–894.
[120] E. Karapanos, J. Zimmerman, J. Forlizzi, and J.-B. Martens, “User Experience Over Time: An Initial Framework,” in CHI ’09 Proceedings of the SIGCHI Conference on Human Factors in Computing Systems, 2009, pp. 729–738.
[121] N. Seyff, G. Ollmann, and M. Bortenschlager, “AppEcho: a user-driven, in situ feedback approach for mobile platforms and applications,” in Proceedings of the 1st International Conference on Mobile Software Engineering and Systems - MOBILESoft 2014, 2014, pp. 99–108.
[122] S. Wang and Shence Wang, “Emotional design based on customer experience requirement,” in Computer-Aided Industrial Design & Conceptual Design, 2009. CAID & CD 2009. IEEE 10th International Conference on, 2009, pp. 158–161.
[123] S. Luojus, “Integrating Momentary and Long-term UX: A Theoretical Approach,” in OzCHI ’12 Proceedings of the 24th Australian Computer-Human Interaction Conference, 2012, pp. 353–356.
[124] D. Buskermolen, J. Tarken, and B. Eggen, “Informing User Experience Design About Users: Insights from Practice,” in CHI EA ’12 CHI '12 Extended Abstracts on Human Factors in Computing Systems, 2012, pp. 1757–1762.
[125] H. Petrie and N. Bevan, “The evaluation of accessibility , usability and user experience,” in The Universal Access Handbook (2009), 2009, pp. 10–20.
[126] T. Walsh, S. Kujala, H. Petrie, and C. Power, “Axe UX : Exploring Long-Term User Experience with iScale and AttrakDiff,” in AcademicMindTrek ’14: Proceedings of the 18th International Academic MindTrek Conference: Media Business, Management, Content & Services, 2014, pp. 32–39.
69
[127] T. Walsh, P. Nurkka, and R. Walsh, “Cultural differences in smartphone user experience evaluation,” in Proceedings of the 9th International Conference on Mobile and Ubiquitous Multimedia - MUM ’10, 2010, pp. 1–9.
[128] Z. Hasan, R. Gope, and M. Nasir Uddin, “Do Aesthetics Matter in Long-Established Trust?,” in International Journal of Computer Applications, 2013, p. 77.
[129] V. Carofiglio, G. Ricci, and F. Abbattista, “User brain-driven evaluation of an educational 3D virtual environment,” in Information Systems and Technologies (CISTI), 2015 10th Iberian Conference on, 2015, pp. 1–7.