MTSU 1 Quality Tools. MTSU 2 Plan Do Study Act The PDSA Cycle.
124
1 MTSU Quality Tools Quality Tools
-
Upload
jeremy-caldwell -
Category
Documents
-
view
219 -
download
1
Transcript of MTSU 1 Quality Tools. MTSU 2 Plan Do Study Act The PDSA Cycle.

1MTSU
Quality ToolsQuality Tools

2MTSU
Plan
Do
Study
Act
The PDSA CycleThe PDSA Cycle
3MTSU
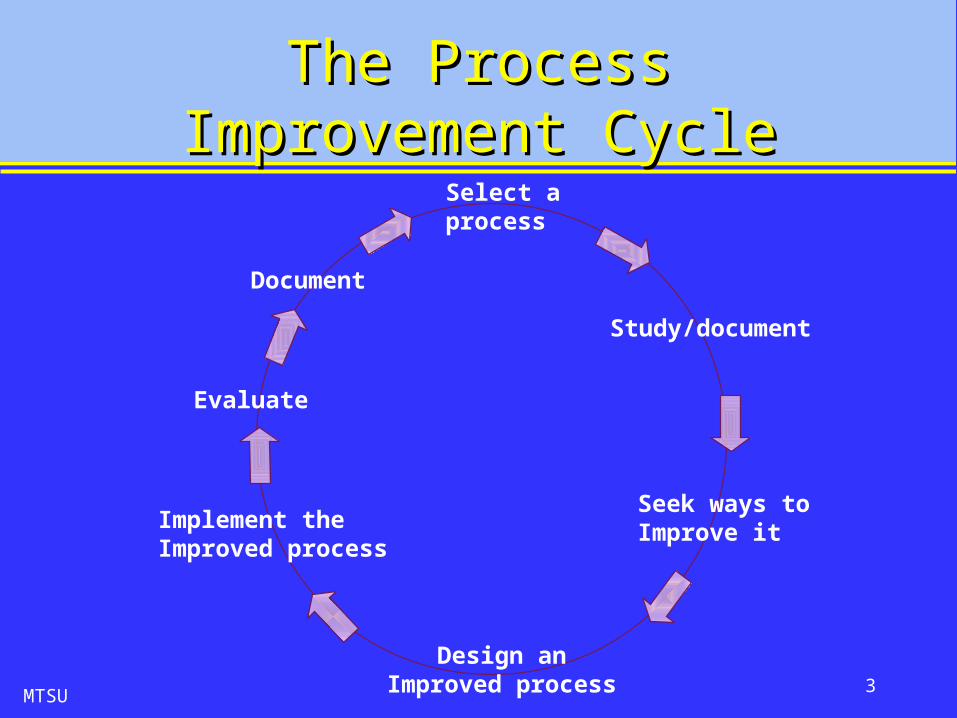
The Process Improvement The Process Improvement CycleCycle
Implement theImproved process
Select aprocess
Study/document
Seek ways toImprove it
Design anImproved process
Evaluate
Document

4MTSU
Process Improvement Process Improvement ToolsTools
• There are a number of tools that can be used for problem solving and process improvement
• Tools aid in data collection and interpretation, and provide the basis for decision making

5MTSU
Seven Basic Quality ToolsSeven Basic Quality Tools
1. Check sheets2. Flowcharts3. Scatter diagrams4. Histograms5. Pareto analysis6. Control charts7. Cause-and-effect diagrams
6MTSU
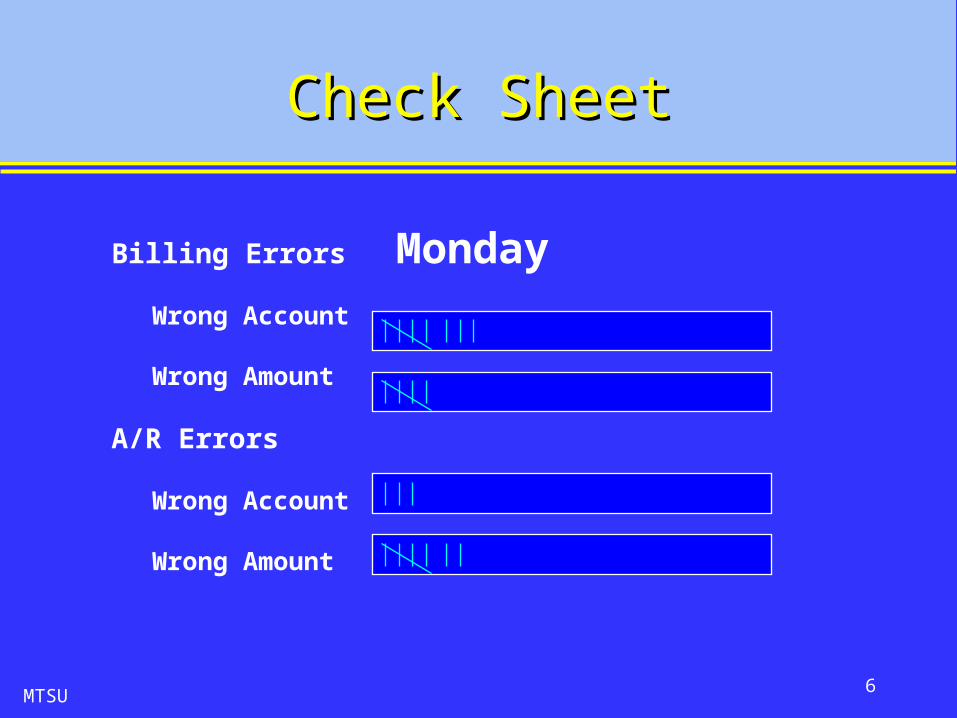
Billing Errors
Wrong Account
Wrong Amount
A/R Errors
Wrong Account
Wrong Amount
Monday
Check SheetCheck Sheet

7MTSU
FlowchartFlowchart
Process Good? Process Good? Process
Process
8MTSU
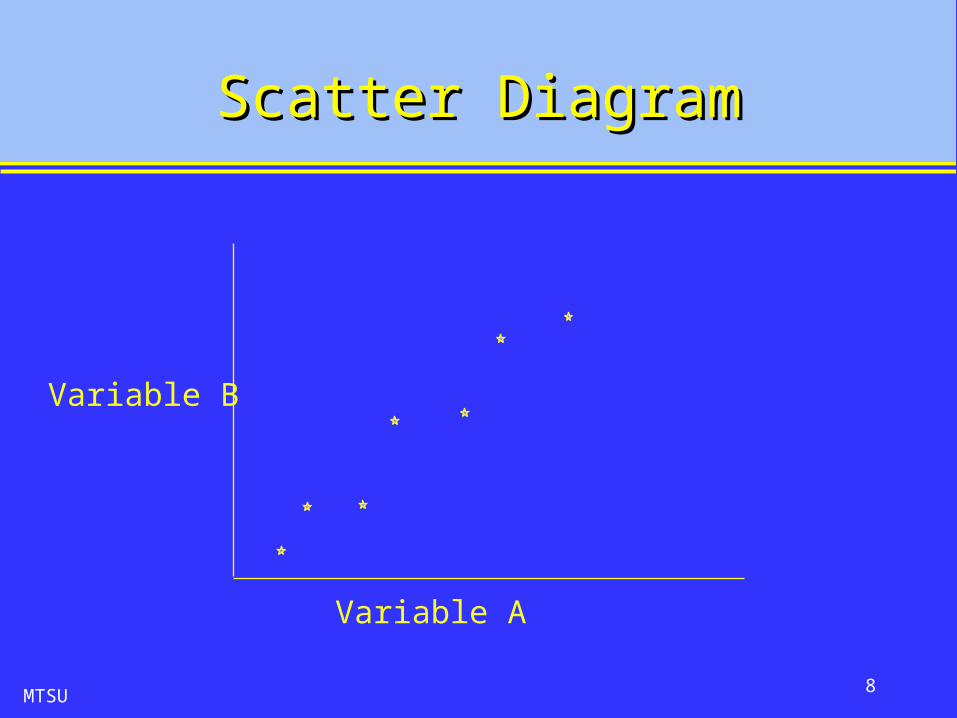
Scatter DiagramScatter Diagram
Variable A
Variable B
9MTSU
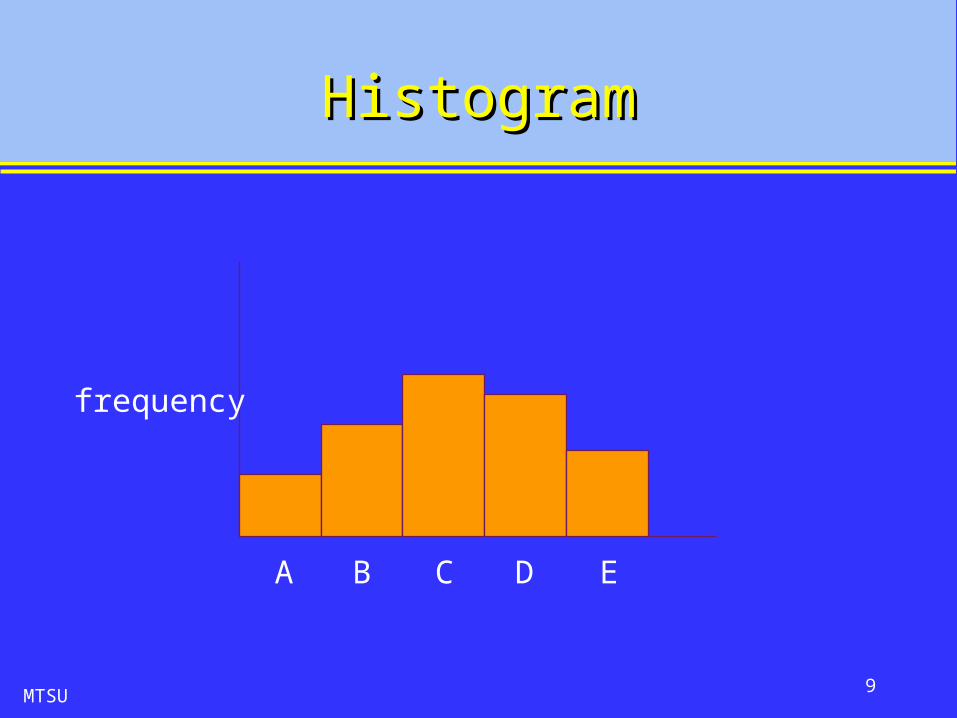
HistogramHistogram
frequency
A B C D E

10MTSU
80% of the problems may be attributed to 20% of thecauses.
80% of the problems may be attributed to 20% of thecauses.
Smearedprint
Nu
mb
er o
f d
efec
ts
Offcenter
Missinglabel
Loose Other
Pareto AnalysisPareto Analysis

11MTSU
970
980
990
1000
1010
1020
0 1 2 3 4 5 6 7 8 9 10 11 12 13 14 15
UCL
LCL
Control ChartControl Chart

12MTSU
Cause-and-Effect DiagramCause-and-Effect Diagram
Effect
MaterialsMethods
EquipmentPeople
Environment
Cause
Cause
Cause
Cause
Cause
CauseCause
Cause
CauseCause
Cause
Cause

13MTSU
Tracking ImprovementsTracking Improvements
UCL
LCL
LCLLCL
UCLUCL
Process not centeredand not stable
Process centeredand stable
Additional improvementsmade to the process

14MTSU
Seven Management ToolsSeven Management Tools
1. Affinity Diagram2. Interrelationship Diagraph3. Tree Diagrams4. Prioritization Matrices5. Matrix Diagram6. Process Decision Program Chart7. Activity Network Diagram
15MTSU
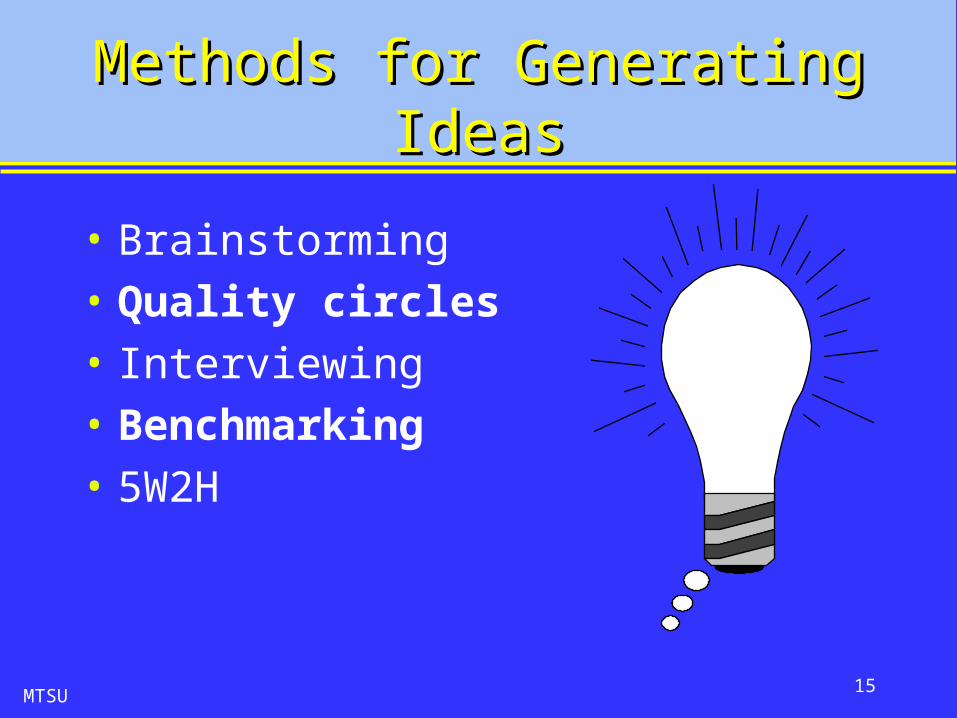
Methods for Generating Methods for Generating IdeasIdeas
• Brainstorming• Quality circles• Interviewing• Benchmarking• 5W2H

16MTSU
A Brief History of QualityA Brief History of Quality

17MTSU
America Re-discovers America Re-discovers DemingDeming

18MTSU
… … and Juranand Juran
19MTSU
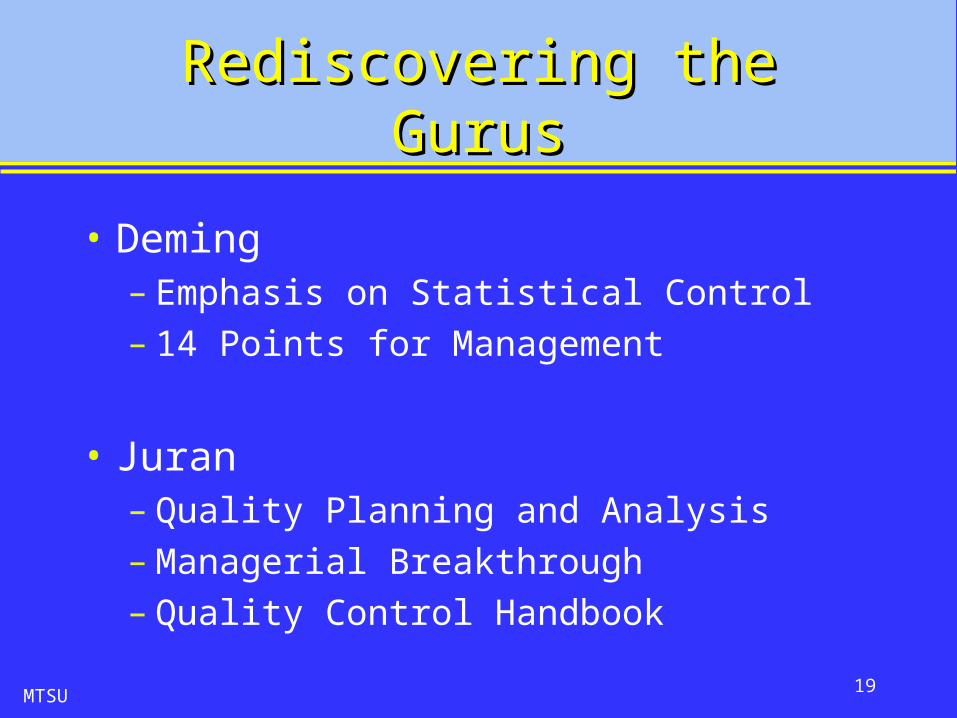
Rediscovering the GurusRediscovering the Gurus
• Deming– Emphasis on Statistical Control– 14 Points for Management
• Juran– Quality Planning and Analysis– Managerial Breakthrough– Quality Control Handbook
21MTSU

22MTSU

23MTSU

24MTSU

25MTSU

26MTSU

27MTSU

28MTSU

29MTSU

30MTSU
Statistics

31MTSU
32MTSU
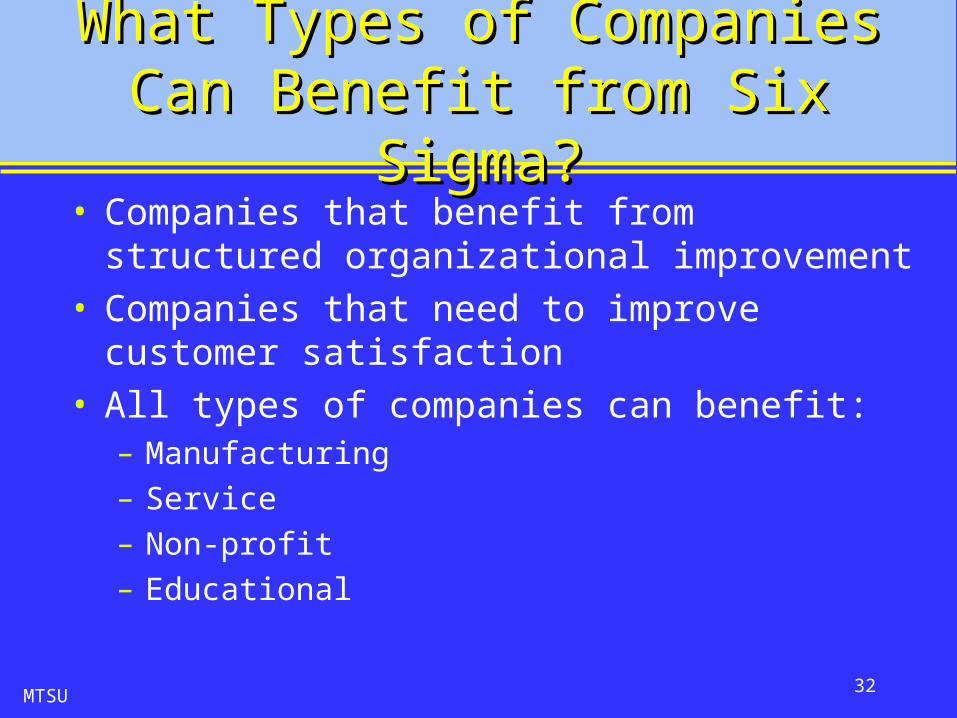
What Types of Companies What Types of Companies Can Benefit from Six Can Benefit from Six
Sigma?Sigma?• Companies that benefit from structured
organizational improvement• Companies that need to improve customer
satisfaction• All types of companies can benefit:
– Manufacturing– Service – Non-profit– Educational
33MTSU
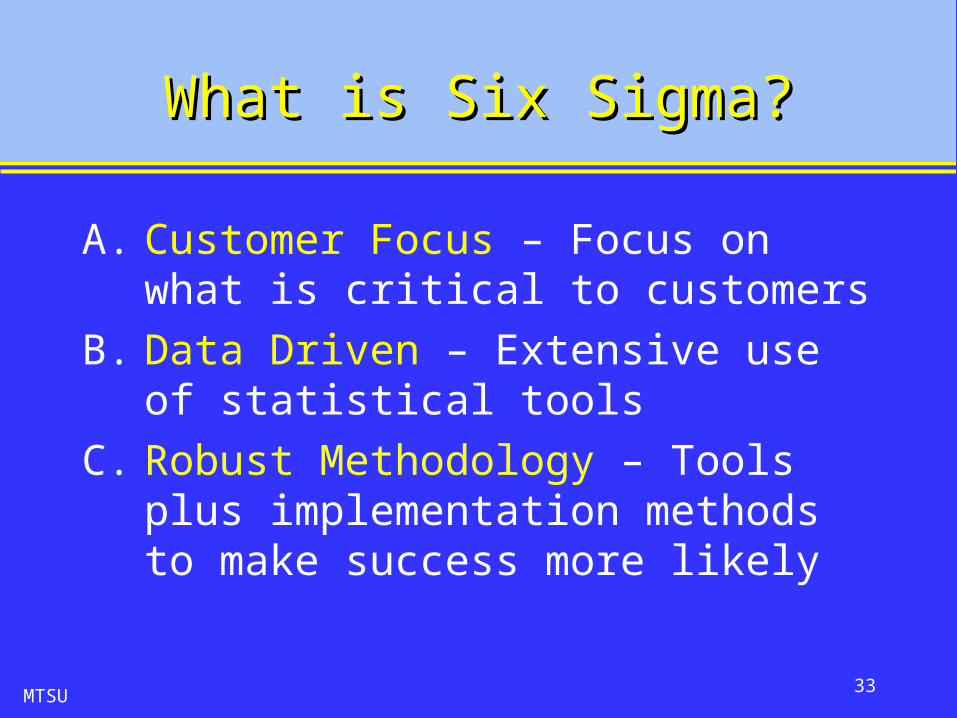
What is Six Sigma?What is Six Sigma?
A. Customer Focus – Focus on what is critical to customers
B. Data Driven – Extensive use of statistical tools
C. Robust Methodology – Tools plus implementation methods to make success more likely

34MTSU
What is Six Sigma?What is Six Sigma?Key ConceptsKey Concepts
1. Critical to Quality: What attributes are most important to the customer? (CTQ, CTC, CTD)
2. Defect: Failing to deliver what the customer wants / expects (DPMO)
3. Variation: The level of unpredictability the customer experiences

35MTSU
What is Six Sigma?What is Six Sigma? Key ConceptsKey Concepts
5. Process Capability: What your process can deliver – consistently
6. Stable Operations: Stable ops are predictable
7. Design for Six Sigma: Designing to meet customer needs and process capability

36MTSU
DMADV - DMAICDMADV - DMAIC
Define
Design
Verify
Measure
Analyze
Define
Improve
Control
Measure
Analyze
New Processes Existing Processes

37MTSU
Statistics LiteStatistics LiteCentered Centered ProcessProcess
LSL USL

38MTSU
Statistics LiteStatistics Lite Centered Centered ProcessProcess
LSL USL

39MTSU
Statistics LiteStatistics Lite Centered Centered ProcessProcess
LSL USL
Non-conformingProduct
1,300 DPMO

40MTSU
Statistics LiteStatistics Lite Centered Centered ProcessProcess
LSL USL
Non-conformingProduct
2,600 DPMO

41MTSU
Statistics LiteStatistics Lite Shifted Shifted ProcessProcess
LSL USL
1.5 mean shift

42MTSU
Statistics LiteStatistics Lite Shifted Shifted ProcessProcess
LSL USL
Non-conformingProduct
66,800 DPMO
1.5 mean shift
43MTSU
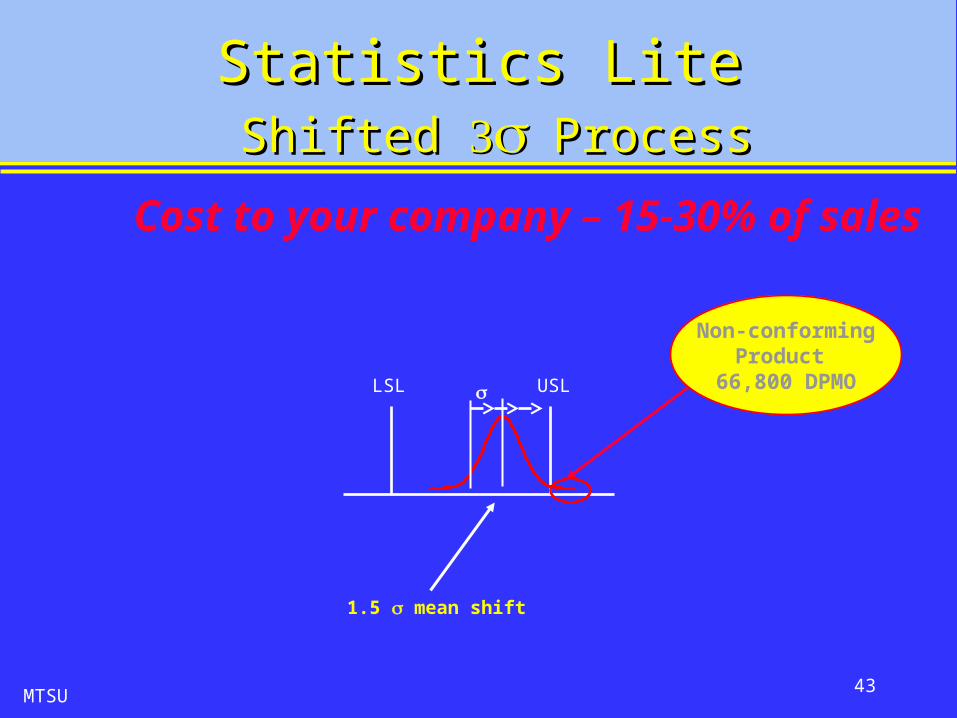
Statistics LiteStatistics Lite Shifted Shifted ProcessProcess
Cost to your company – 15-30% of sales
LSL USL
Non-conformingProduct
66,800 DPMO
1.5 mean shift

44MTSU
Cost of Poor QualityCost of Poor Quality
Lost Opportunity
DowntimeRework
InspectionOvertime
Rejects
Lost sales
Late delivery
Long cycle times
Expediting costs Inaccurate Reports
(less obvious)
Lost Customer Loyalty
Redundant Operations
Cost of Capital
Excessive Planning
5-8% ofSales
15-22%of Sales
45MTSU
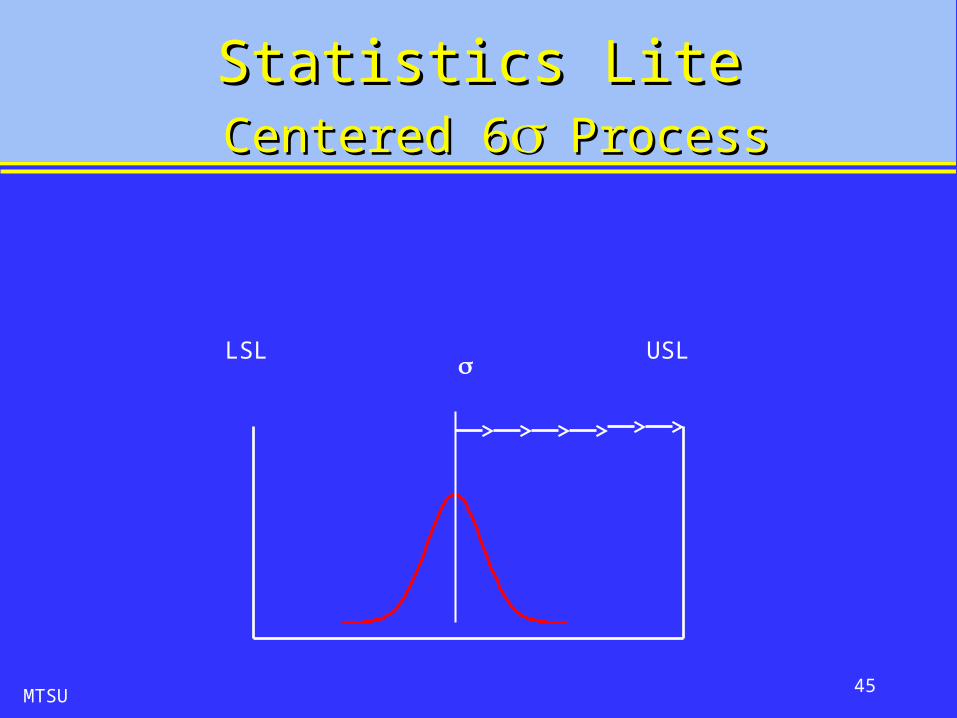
Statistics LiteStatistics Lite Centered 6Centered 6ProcessProcess
LSL USL

46MTSU
Statistics LiteStatistics Lite Shifted 6Shifted 6ProcessProcess
LSL USL
1.5 mean shift

47MTSU
Statistics LiteStatistics Lite Shifted 6Shifted 6ProcessProcess
LSL USL
1.5 mean shift
Non-conformingProduct
3.4 DPMO

48MTSU
99.99966% (6 Sigma)
• 20,000 lost articles of mail per 20,000 lost articles of mail per hourhour
• 5,000 incorrect surgical 5,000 incorrect surgical operations per weekoperations per week
• Two short or long landings at Two short or long landings at most major airports each daymost major airports each day
• 200,000 wrong drug prescriptions 200,000 wrong drug prescriptions each yeareach year
• No electricity for almost seven No electricity for almost seven hours each monthhours each month
• Seven articles lost per hourSeven articles lost per hour
• 2 incorrect operations per week 2 incorrect operations per week
• One short or long landing every One short or long landing every five yearsfive years
• 70 wrong prescriptions per year70 wrong prescriptions per year
• One hour without electricity every One hour without electricity every 34 years34 years
99% (3.8 Sigma)
Why Six Sigma?Why Six Sigma?
49MTSU
Six Sigma Six Sigma Breakthrough StrategyBreakthrough Strategy
• Define• Measure• Analyze• Improve• Control
50MTSU
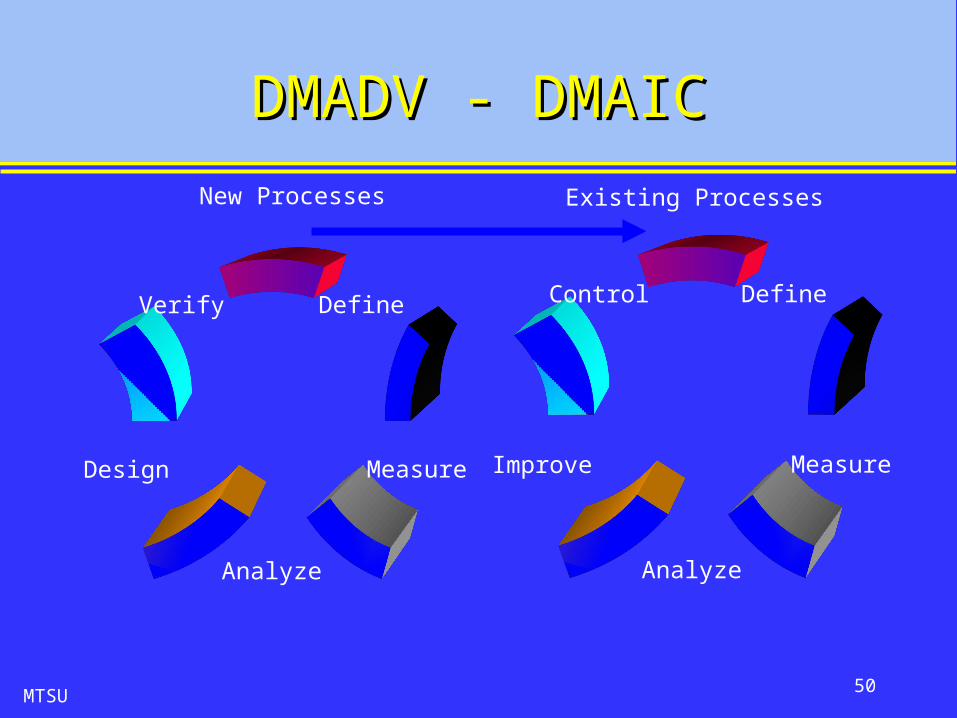
DMADV - DMAICDMADV - DMAIC
Define
Design
Verify
Measure
Analyze
Define
Improve
Control
Measure
Analyze
Existing ProcessesNew Processes

51MTSU
Define - Selecting ProjectsDefine - Selecting Projects
• The project must relate to customer satisfaction
• The project’s results must reduce defects by some threshold amount
• The project should achieve some threshold of cost savings.

52MTSU
Criteria for Project Criteria for Project SelectionSelection
• Does it involve recurring events?
• Is the scope narrow?• Do measures exist? • Do you have control of the
process?

53MTSU
Define Phase, ContinuedDefine Phase, Continued
• If these criteria are met then:1) Identify the customers involved, both internal and external to the function.2) Find out what the customer’s CT’s are (Critical to Quality, Critical to Delivery, Critical to Cost, etc). 3) Define the project scope and goals.4) Map the process to be improved.

54MTSU
Define Phase - ToolsDefine Phase - Tools
• Project Charter• Stakeholder
Analysis• Affinity Diagram• SIPOC• Voice of the
Customer• CT Tree
• Kano Model• SWOT Analysis• Cause-and-Effect
Diagrams• Supplier
Segmentation • Project
Management

55MTSU
CharterCharter
• Problem statement• Business case• Goals, milestones,
success criteria, & deliverables
• Project scope / boundaries
• Roles & responsibilities
• Stakeholder support / approval needed

56MTSU
Define PhaseDefine PhaseCharter DevelopmentCharter Development
Charter – An agreement between management and project team members about what the team will accomplish.

57MTSU
Charter: Providing Charter: Providing DirectionDirection
You have to be careful if you don’t know
where you’re going, ...
because you might not get
there.

58MTSU
Define Phase Define Phase Charter – What it doesCharter – What it does
• Clarifies expectations (what and why)
• Keeps team focused – Reduces tampering– Reduces wandering– Reduces goal creep
• Transfers ownership from management to team

59MTSU
Define Phase Define Phase Charter – What it doesCharter – What it does
• Provides overview of purpose• Describes why you are working on
this project (business case)• Defines scope of project• Determines deliverables• Defines measures of success• Determines resources available

60MTSU
Business CaseBusiness Case
Potential Improvement
Potential Impact
Improve quality Reduce cost, inventory
Improve OTD Shortages , inventory Select better suppliers Q, $, LT, reduce
inventory
Implement rating system
Improve supply efficiency, better suppliers
Reduce price Reduce cost

61MTSU
Define Phase - ToolsDefine Phase - Tools
• Project Charter• Stakeholder
Analysis• Affinity Diagram• SIPOC• Voice of the
Customer• CT Tree
• Kano Model• SWOT Analysis• Cause-and-Effect
Diagrams• Supplier
Segmentation • Project
Management

62MTSU
SIPOC ExampleSIPOC Example
Suppliers Inputs Processes Outputs Customers
Ops Mgt Supplier Perf.
SupplierEvaluation
Survey Ops Mgt
Buyers Complaints
Rating system
Buyers
Engrg. Tech Reqts
Improved Supplier Perform.
Engineering
Mfg. Rating system
Commit. to suppliers
Mfg.
Suppliers Supplier Complaints
Suppliers

63MTSU
SWOT AnalysisSWOT Analysis
Positive Negative
Internal Strengths Weaknesses
External Opportunities
Threats

64MTSU
Define OutputsDefine Outputs
• Once completed, the Define Phase should answer the following questions:1) Who is the customer?2) What matters?3) What is the scope?4) What defect am I trying to reduce?5) What are the improvement targets?

65MTSU
Define PhaseDefine Phase Toll Gate ReviewToll Gate Review
• Submit project storyboard to sponsor
• Toll Gate review presentation• Sponsor provides feedback• Project corrections are made prior
to proceeding to the next phase

66MTSU
The Measure PhaseThe Measure Phase
• Purpose– To collect current performance of the
process identified in the Define phase
– This data is used to determine sources of variation and serve as a benchmark to validate improvements

67MTSU
MeasurementsMeasurements
• Benefits of having good data need to outweigh the costs of getting it
• What does this measure do for the Project?

68MTSU
The Measure PhaseThe Measure Phase
• Upon completion of the measure phase, Project Teams will have:
»A plan for collecting data that specifies the type of data needed and techniques for collecting the data
»A validated measurement system that ensures the accuracy and consistency of the data collected
»A sufficient data set for problem analysis

69MTSU
Measure - Key ConceptsMeasure - Key Concepts
• Measurement• Variation
– Exists naturally in any process and is the reason Six Sigma projects are undertaken
• Data• Data Collection Plan• Measurement System Analysis
– Ensures measurement techniques are reproducible and repeatable

70MTSU
Recording MeasurementsRecording Measurements
• 3 stages– The output stage
»These tell how well customer needs are being met
– Parts of the process»These are taken at critical points in the
process
– The input stage»These evaluate contributions to the process
that are turned into value for the customer

71MTSU
Recording MeasurementsRecording Measurements
• Output Stage– Shortages– Line shutdowns– Quality – discrepant material– Material price variances– Internal customer survey

72MTSU
Recording MeasurementsRecording Measurements
• Parts of the process– Project milestones– Supplier ship on time performance– Supplier OTD– Supplier internal throughput yield– Supplier suggested cost reductions

73MTSU
Recording MeasurementsRecording Measurements
• The input stage– Supplier base size– % Buyers with degrees– % of spend covered by LTC’s– % of spend from reverse auction– Supplier FMEA’s

74MTSU
Operational DefinitionsOperational Definitions
Walter Shewhart, the inventor of statistical process control,
believed his work on operational definitions to be of
greater importance than his work on control charts.

75MTSU
Operational DefinitionsOperational Definitions
“An operational definition is a procedure agreed upon for
translation of a concept into measurement of some kind.”
Operational definitions should be valid and reliable.
Deming, 1986

76MTSU
Operational Definitions?Operational Definitions?
Slump, I ain’t in no slump. I just ain’t
hitting.

77MTSU
Operational DefinitionsOperational Definitions
• On-Time Delivery• On-Time Payment• Late• Defective• Clean• Good communication• Engineering support
Do you, your management, and your Do you, your management, and your suppliers agree on these definitions? suppliers agree on these definitions?
78MTSU
Determining Data TypeDetermining Data Type
• What do we want to know?
• Review materials developed during design phase
• What characteristics do we need to learn more about?

79MTSU
Data Collection PlanData Collection Plan
• What data will be collected?• Why is it needed?• Who is responsible?• How will it be collected?• When will it be collected?• Where will it be collected?

80MTSU
Measurement System Measurement System AnalysisAnalysis
• After Data Collection Plan is complete, it needs to be verified before actual data is collected
• MSA is performed on a regular basis
• MSA ends when a high level of confidence is reached that the data collected accurately depicts the variation in the process

81MTSU
Analyze PhaseAnalyze Phase
• The analyze phase allows the Project Team to target improvement opportunities by taking a closer look at the data.
82MTSU
Analyze PhaseAnalyze Phase
• Capability Analysis - establishing current performance level
• Graphical Analysis - a visual indication of performance using graphs
• Root Cause Analysis – developing a hypothesis about the causes of variation
• Root Cause Verification – verifying that the planned action will generate the desired improvement
83MTSU
Process CapabilityProcess Capability
When selecting a process to perform an operation, the inherent variability of process output should
be compared to the range or tolerances allowed by the designer’s specifications.

84MTSU
Process CapabilityProcess Capability
LowerSpecification
UpperSpecification
A significant portion of the process output falls outside of the specification width
In other words, is the process capable of producing the item
within specifications?
Much of the process output fits within specification width
Almost all of the process output fits within the specification width
process distribution

85MTSU
Analyze PhaseAnalyze Phase Cause HypothesesCause Hypotheses
• Identifying Obvious Process Problems– Disconnects– Bottlenecks– Redundancies– Unnecessary distance– Rework– Decision points
Process Map Review

86MTSU
Analyze PhaseAnalyze Phase Cause HypothesesCause Hypotheses
• Quantifying Value-Added Steps– Value-Adding– Value-Enabling– Non-Value-Adding
Process Map Review

87MTSU
Analyze PhaseAnalyze Phase Cause HypothesesCause Hypotheses
• Process Time Analysis– Work time (value, but often only 5%)– Wait (& queue) time (usually dominates)– Setup time (tremendous leverage)– Move time (process dependent)

88MTSU
Analyze PhaseAnalyze Phase ToolsTools
• Brainstorming . . . And beyond!• Process Maps• Cause-and-Effect Diagrams• Focused Problem Statement• Statistical Tools

89MTSU
Cause-and-Effect Diagrams Cause-and-Effect Diagrams Supplier Failure - CausesSupplier Failure - Causes
People
Materials
Equipment
Processes
Environment
Measurement
FireEarthquake
Mat'l price increase
Bankruptcy
Illness
Turnover
Process upset Commodity allocation
Bad specs
Inaccurate PO
New employees
New source
IncompetenceIncapable equip
Lack of PM
FraudLawsuit
Tornado
Flood
StrikeStrikeBusiness down
Business up
Different standards

90MTSU
Elements of Improve Elements of Improve PhasePhase
Generate Improvement Alternatives
Create a “Should Be” Process Map Conduct FMEA Perform Cost/Benefit Analysis Pilot Validate Improvement

91MTSU
Improve PhaseImprove PhaseElementsElements
Generate Improvement Alternatives
Create a “Should Be” Process Map Conduct FMEA Perform Cost/Benefit Analysis Pilot Validate Improvement

92MTSU
Failure Modes Effects Failure Modes Effects AnalysisAnalysis
• Identify failure modes – How can this product or process fail?
• Identify failure effects – What happens when this failure occurs?
• Identify potential causes of the effects & their probability of occurring.
• Rate the likelihood of detecting the occurrence.

93MTSU
FMEA - OutputFMEA - Output
• Ranked list of products that contribute to risk
• List of actions and persons responsible for addressing the risk
• Revised ranked priority list
94MTSU
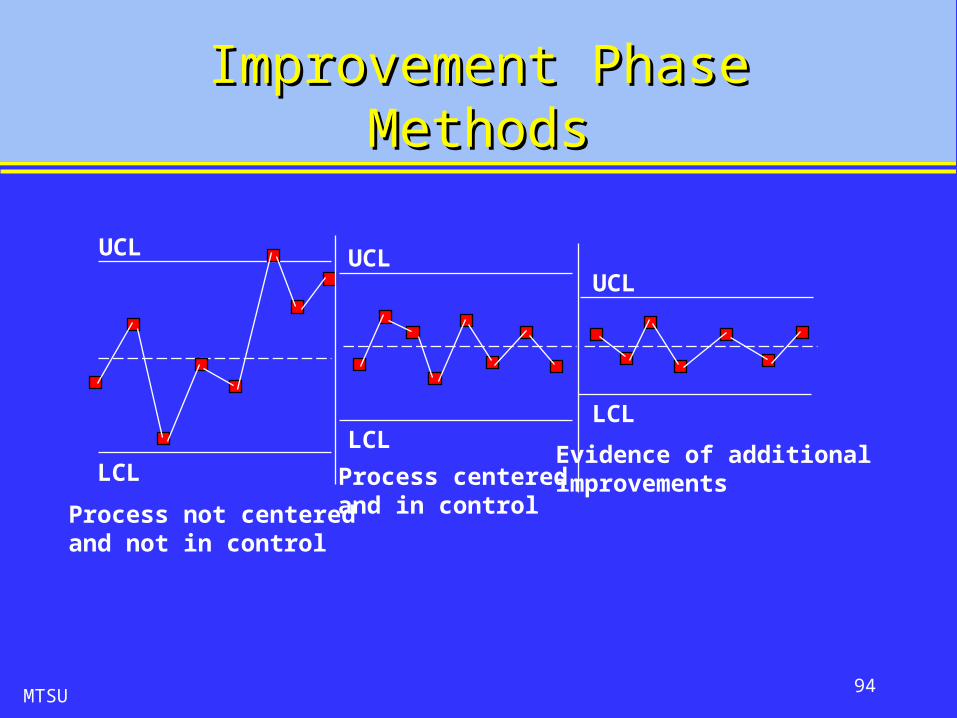
Improvement PhaseImprovement PhaseMethodsMethods
UCL
LCL
LCLLCL
UCLUCL
Process not centeredand not in control
Process centeredand in control
Evidence of additional improvements

95MTSU
Review of Improvement Review of Improvement PhasePhase
• Generate Improvement Alternatives
• Create a “Should Be” Process Map• Conduct FMEA• Perform Cost/Benefit Analysis• Pilot• Validate Improvement

96MTSU
Generating Improvement Generating Improvement AlternativesAlternatives
Define Improvement Criteria Generate Possible Improvements Evaluate Improvements and Make
Best Choice

97MTSU
PilotPilot
Benefits of Pilot• Determine best way to implement the
improvement• Lowers risk of failure• Increases opportunity for feedback• Obtain buy-in from affected personnel• Provides opportunity to revise the
improvement before full implementation

98MTSU
Stakeholder AnalysisStakeholder Analysis
People or Groups
Level of Commitment
Buy Mfg Eng
Enthusiastic Support
Help it work
Compliant
Hesitant X
Indifferent
Uncooperative X
Opposed
Hostile X

99MTSU
Review of Implementation Review of Implementation PhasePhase
• Generate Improvement Alternatives
• Create a “Should Be” Process Map• Conduct FMEA• Perform Cost/Benefit Analysis• Pilot• Validate Improvement

100MTSU
Control PhaseControl PhaseWhy is it important?Why is it important?
• The Control Phase begins as the project team tries to eliminate errors by “Mistake Proofing” their improvement alternative.
• Mistake Proofing attempts to eliminate the opportunities for error.
101MTSU
Control PhaseControl PhaseWhy is it important?Why is it important?
• Mistake Proofing tries to make it impossible for an operation to be performed incorrectly, and/or correct errors before they are passed to the next worker, where they might become a defect.

102MTSU
Control Phase #2Control Phase #2
• During the Control Phase the Project team will:1) Develop a plan to make sure the measurement system will remain relevant over the long term.2) Establish Control Charts the process owner will use to manage the process.3) Create a Reaction Plan to address situations that might cause the process to move out of control.

103MTSU
Control Phase #3Control Phase #3
• The Control Phase ends when:1) Standard Operating Procedures have been updated.2) Process Operators, the people who do the job, have been trained for the new process.
• Once completed, the Control Phase should sustain the gains the project made while implementing ongoing process controls.

104MTSU
Control Phase #4Control Phase #4
• When is a project complete?1) When other Black Belts can see the ongoing controls work2) When the customer sees the results3) When the business sees the money.

105MTSU
Six Sigma Six Sigma Six Sigma PeopleSix Sigma People
• Executives• Champions (deployment, project)• Master Black Belts• Black Belts• Green Belts

106MTSU
Control PhaseControl Phase MethodsMethods
• During the Control Phase the Project team will:1) Develop a plan to make sure the measurement system will remain relevant over the long term.2) Establish Control Charts the process owner will use to manage the process.3) Create a Control Plan to address situations that might cause the process to move out of control.

107MTSU
Statistical Process Control Statistical Process Control (SPC)(SPC)
• Chance variations are the many sources of variation within a process that is in statistical control. They behave like a constant system of random chance causes.
• If only natural causes of variation are present, the output of a process forms a distribution that is stable over time and is predictable.

108MTSU
Statistical Process Control Statistical Process Control (SPC)(SPC)
• Assignable variation in a process can be traced to a specific reason. Machine wear Misadjusted equipment Fatigued or untrained workers
• If assignable causes of variation are present, the process output is not stable over time and is not predictable.

109MTSU
SPC - Assignable CausesSPC - Assignable Causes
The operational definition of assignable variation is variation that causes out-of-control points on a control chart.

110MTSU
Natural Patterns or VariationsNatural Patterns or Variations
Natural patterns exhibit the following characteristics:
• Most of the points are near the centerline.• A few points spread out and approach the control
limits.• None (or only on rare occasions) of the points
exceeds the control limits.
Reference: Statistical Quality Control Handbook, Western Electric
111MTSU
Unnatural Patterns or Unnatural Patterns or VariationsVariations
Unnatural patterns exhibit the following characteristics:
• Absence of points near the centerline produces a pattern known as a “mixture.”
• Absence of points near the control limits produces an unnatural pattern known as “stratification.”
• Presence of points outside of the control limits produces an unnatural pattern known as “instability.”
Reference: Statistical Quality Control Handbook, Western Electric
112MTSU
Tests for Unnatural PatternsTests for Unnatural Patterns
• Instability– A single point falls outside of the 3 sigma control
limits.– Two out of three successive points fall in the outer one third
of the control limits.– Four out of five successive points fall in the outer two thirds
of the control limits.– Eight successive points fall on one side of the centerline.
• Systematic variable– A long series of points are high, low, high, low without
interruption.Reference: Statistical Quality Control Handbook, Western Electric

113MTSU
Statistical Process ControlStatistical Process ControlWhy use averages?Why use averages?
• To create a normal distribution
• Averages are more sensitive to change than individuals

114MTSU
Central Limit Theorem Central Limit Theorem SimulationSimulation
The distribution of a sample approaches normal even when the parent population is not normally distributed.

115MTSU
UCL
LCL
x-Chart
UCL
LCL
R-chart
Drift Detected
No drift detected
process mean drifting upward
ProcessDistribution
Control Phase Control Phase Mean and Range ChartsMean and Range Charts
116MTSU
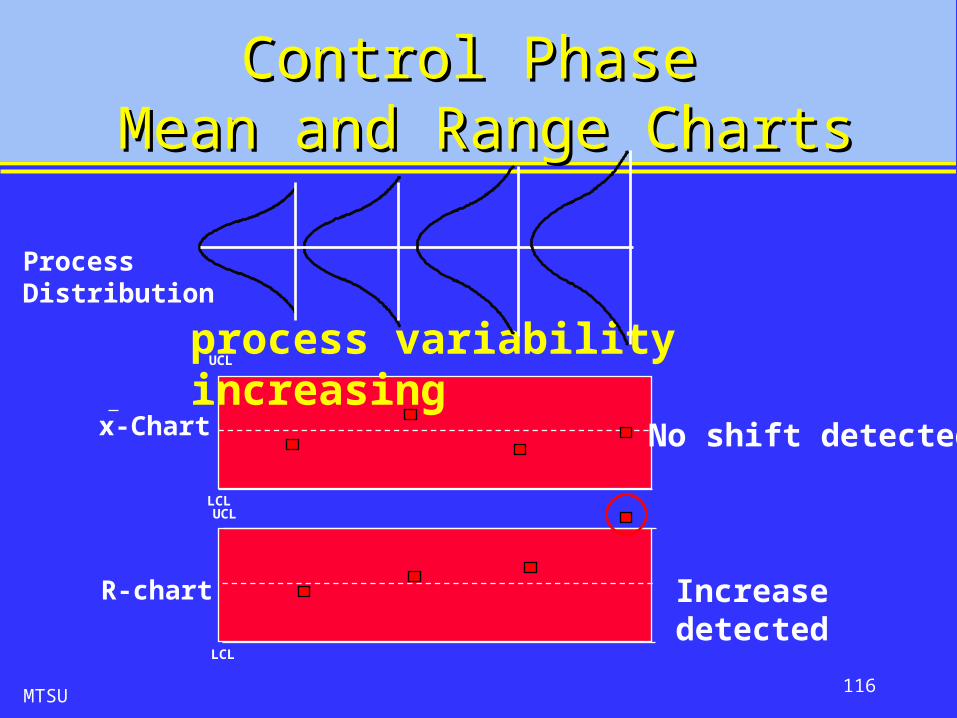
UCL
LCL
R-chart
UCL
LCL
x-Chart
process variability increasing
Control Phase Control Phase Mean and Range ChartsMean and Range Charts
ProcessDistribution
No shift detected
Increase detected
117MTSU
Statistical Process ControlStatistical Process Control
• Tolerance or specification limits– Defined by an engineer– Related to product design
requirements
• Control limits– Defined by the process– Related to the variation in the process– Unrelated to product needs

118MTSU
Control PhaseControl Phase Control PlansControl Plans
• Structured approach for designing value added control methods
• Control actions necessary to ensure output quality
• May include controls anywhere in the process

119MTSU
Control Phase Control Phase Radar ChartRadar Chart
0123456F1
F2
F3F4
F5
Baseline Current
05
101520Cust-1
Cust-2
Cust-3
Cust-4
Baseline Current
0123456Jane
Sally
TomSteven
Jose
Baseline Current
Product Features -
Data Entry Errors
Days Late
0100000200000300000400000500000
P1
P2
P3
P4
P5
P6
Threshold Actual
Savings by Project

120MTSU
Control Phase Control Phase Radar ChartRadar Chart
0123456S1
S2
S3
S4
S5
S6
Q1 Q2 Q3
Defect Levels by Supplier

121MTSU
Final Toll Gate ReviewFinal Toll Gate Review
• Submit project storyboard to sponsor• Toll Gate review presentation
– Did the team carry out the agreed upon tasks?
– Did the team achieve the desired results?
• Sponsor provides feedback• Project corrections are made prior to
termination or proceeding to next cycle

122MTSU
Why TQM FailsWhy TQM Fails
• Lack of Top Management Commitment
• Wasted Education & Training
• Lack of Short-Term Results
• Failure to Empower EmployeesBrown, Hitchcock, and Willard - 1994
CommitmentUp Front
AppropriateTraining
Biz CaseThreshold
Charter

123MTSU
Why Six Sigma FailsWhy Six Sigma Fails(and it does)(and it does)
• Lack of Top Management Commitment
• Interdepartmental / cross-functional issues
• Communication• People

124MTSU
Quality ToolsQuality Tools
Kimball Bullington, Ph.D.
125MTSU
References
Books:• Six Sigma Pocket Guide (Rath & Strong’s)• The Black Belt Memory Jogger (GOAL / QPC)• Six Sigma (Harry and Schroeder)• Implementing Six Sigma (Breyfogle)• The Six Sigma Way Team Fieldbook (Pande, et al)• The Vision of Six Sigma: A roadmap for breakthrough
(Harry)• Why TQM Fails and What To Do About It (Brown,
Hitchcock, & Willard)
Web sites:• www.isixsigma.com• www.ge.com/sixsigma• www.asq.org• www.aiag.org