mtc.ca.gov Technical Report Figure 5.1 Vulnerability and Risk Assessment Process Exposure to SLR is...
24
Vulnerability and Risk Assessment 5.0
Transcript of mtc.ca.gov Technical Report Figure 5.1 Vulnerability and Risk Assessment Process Exposure to SLR is...

Vulnerability and Risk Assessment 5.0

This page intentionally left blank.

Adapting to Rising Tides: Transportation Vulnerability and Risk Assessment Pilot Project 5-1
5 Vulnerability and Risk Assessment
5.1 IntroductionUnderstanding the level of vulnerability of an asset to climate impacts is a valuable part of decisionmaking and policy development for future adaptation, as it provides a basis for establishing priorities. Forthis project, the vulnerability assessment identifies the degree to which the assets would be affected bysea level rise (SLR). Section 5.2 describes the vulnerability assessment that was carried out for theselected assets.
Risk is the potential for an unwanted outcome resulting from an event, in this case from inundation fromSLR. It is determined by the product of (a) the likelihood of the impact and (b) the consequence of theimpact. The likelihood of an impact is, in part, a function of the likelihood of the impact (SLR) occurring.“Consequence” refers to the significance or impact to the wider region of the inundation of an asset due toSLR.
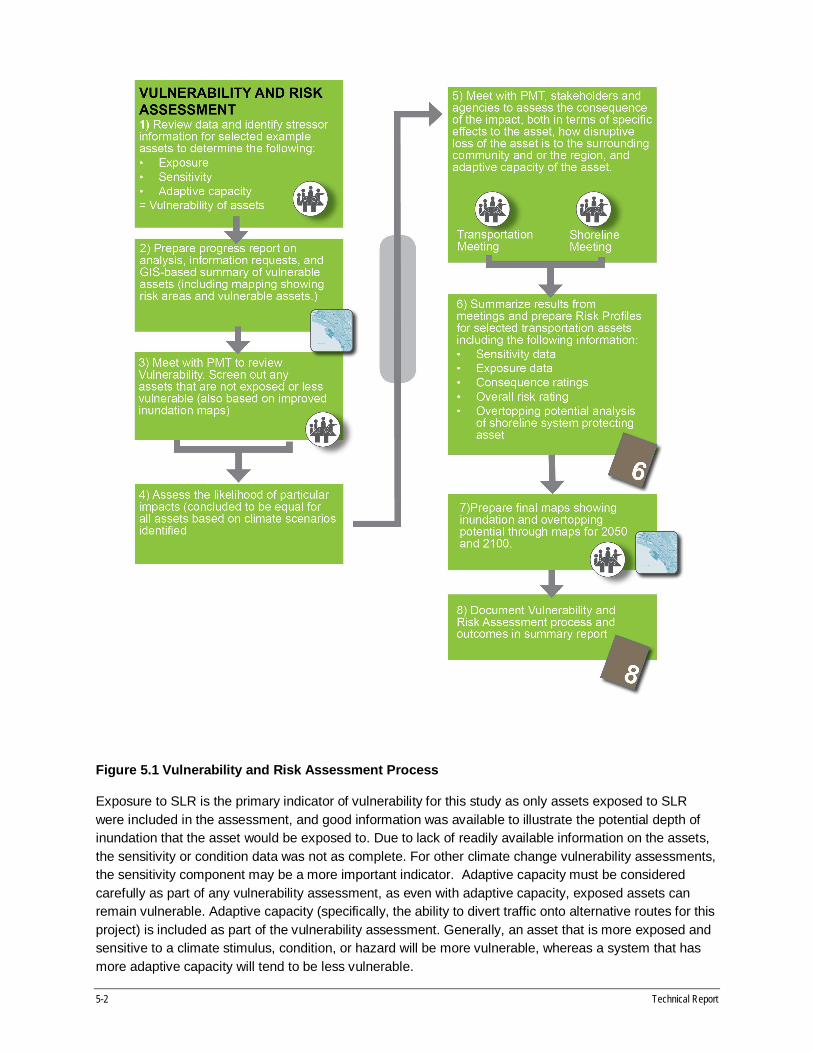
Section 5.3 describes the risk assessment that was carried out for the selected assets. During the riskassessment, (1) the vulnerability of the selected assets to SLR was reviewed in order to screen outassets that were less vulnerable to projected climate effects; (2) the likelihood of inundation occurringfrom SLR was assessed; (3) the consequence of the impact was reviewed, not just in terms of what theimpact would do to a particular asset, but in terms of how it would affect the surrounding community andbeyond; and (4) the risk rating of the consequence and likelihood occurring was determined. Section 5.4contains the risk profiles summarizing all of the information collected on the assets that were developedas a result of the risk assessment. The process is outlined in Figure 5.1.
5.2 Vulnerability Assessment5.2.1 INTRODUCTIONThe vulnerability of an asset is related to its potential for, or its susceptibility to, damage. Vulnerability toclimate change is often assessed in terms of exposure, sensitivity, and adaptive capacity. This analysisused definitions from the Intergovernmental Panel on Climate Change (IPCC 2007) for the followingterms:
Vulnerability “is the degree to which a system is susceptible to, or unable to cope with, adverseeffects of climate change, including climate variability and extremes.”
Exposure “is the nature and degree to which a system is exposed to significant climatic variations.”(For this project, this is SLR and is measured by depth of inundation at midcentury and at the end ofthe century.)
Sensitivity “is the degree to which a system is affected, either adversely or beneficially, by climate-related stimuli.” (For this project, this is the physical condition of the asset. The worse the condition ofthe asset, the larger the magnitude of an adverse reaction to SLR is assumed.)
Adaptive capacity “is the ability of a system to adjust to climate change to moderate potentialdamages, to take advantage of opportunities or cope with the consequences” (IPCC 2001, alsoreferenced in the 2009 California Climate Adaptation Strategy [California Natural Resources Agency2009). (For this project, one critical aspect of adaptive capacity is the ability to divert traffic ontoalternative routes.)
5-2 Technical Report
Figure 5.1 Vulnerability and Risk Assessment Process
Exposure to SLR is the primary indicator of vulnerability for this study as only assets exposed to SLRwere included in the assessment, and good information was available to illustrate the potential depth ofinundation that the asset would be exposed to. Due to lack of readily available information on the assets,the sensitivity or condition data was not as complete. For other climate change vulnerability assessments,the sensitivity component may be a more important indicator. Adaptive capacity must be consideredcarefully as part of any vulnerability assessment, as even with adaptive capacity, exposed assets canremain vulnerable. Adaptive capacity (specifically, the ability to divert traffic onto alternative routes for thisproject) is included as part of the vulnerability assessment. Generally, an asset that is more exposed andsensitive to a climate stimulus, condition, or hazard will be more vulnerable, whereas a system that hasmore adaptive capacity will tend to be less vulnerable.
Adapting to Rising Tides: Transportation Vulnerability and Risk Assessment Pilot Project 5-3
In addition to setting priorities, a vulnerability analysis also provides valuable information that will aid indetermining which adaptation strategies may work best, as well as determining the potential points ofintervention for implementing those strategies (such as during replacement, or seismic retrofit). It alsohelps to identify which agencies will need to be involved in the development and implementation of thosestrategies as well as a variety of other issues.
Vulnerability = Exposure + Sensitivity + Adaptive Capacity
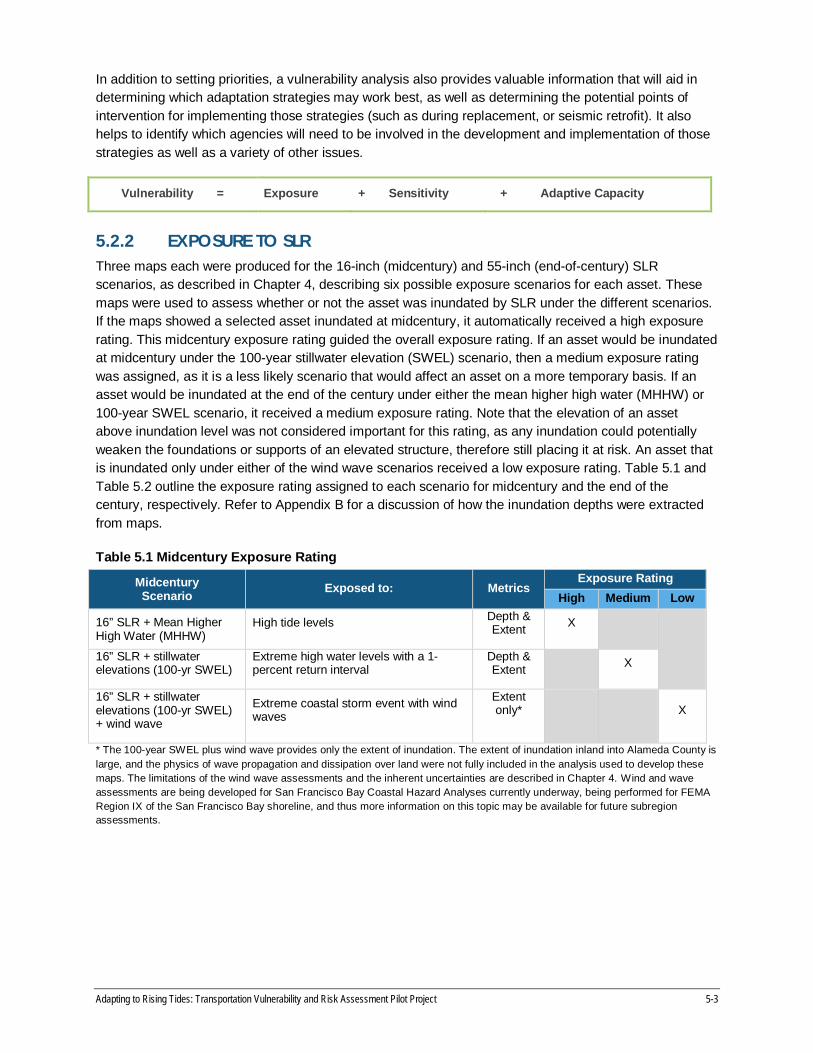
5.2.2 EXPOSURE TO SLRThree maps each were produced for the 16-inch (midcentury) and 55-inch (end-of-century) SLRscenarios, as described in Chapter 4, describing six possible exposure scenarios for each asset. Thesemaps were used to assess whether or not the asset was inundated by SLR under the different scenarios.If the maps showed a selected asset inundated at midcentury, it automatically received a high exposurerating. This midcentury exposure rating guided the overall exposure rating. If an asset would be inundatedat midcentury under the 100-year stillwater elevation (SWEL) scenario, then a medium exposure ratingwas assigned, as it is a less likely scenario that would affect an asset on a more temporary basis. If anasset would be inundated at the end of the century under either the mean higher high water (MHHW) or100-year SWEL scenario, it received a medium exposure rating. Note that the elevation of an assetabove inundation level was not considered important for this rating, as any inundation could potentiallyweaken the foundations or supports of an elevated structure, therefore still placing it at risk. An asset thatis inundated only under either of the wind wave scenarios received a low exposure rating. Table 5.1 andTable 5.2 outline the exposure rating assigned to each scenario for midcentury and the end of thecentury, respectively. Refer to Appendix B for a discussion of how the inundation depths were extractedfrom maps.
Table 5.1 Midcentury Exposure Rating
MidcenturyScenario Exposed to: Metrics
Exposure RatingHigh Medium Low
16” SLR + Mean HigherHigh Water (MHHW)
High tide levels Depth &Extent X
16” SLR + stillwaterelevations (100-yr SWEL)
Extreme high water levels with a 1-percent return interval
Depth &Extent X
16” SLR + stillwaterelevations (100-yr SWEL)+ wind wave
Extreme coastal storm event with windwaves
Extentonly* X
* The 100-year SWEL plus wind wave provides only the extent of inundation. The extent of inundation inland into Alameda County islarge, and the physics of wave propagation and dissipation over land were not fully included in the analysis used to develop thesemaps. The limitations of the wind wave assessments and the inherent uncertainties are described in Chapter 4. Wind and waveassessments are being developed for San Francisco Bay Coastal Hazard Analyses currently underway, being performed for FEMARegion IX of the San Francisco Bay shoreline, and thus more information on this topic may be available for future subregionassessments.

5-4 Technical Report
Table 5.2 End-of-Century Exposure RatingEnd of Century Exposure Rating
Scenario Exposed to: Metrics High Medium Low
55” SLR + Mean HigherHigh Water (MHHW)
High tide levels Depth &Extent X
55” SLR + stillwaterelevations (100-yrSWEL)
Extreme high water levels with a 1-percent return interval
Depth &Extent X
55” SLR + stillwaterelevations (100-yrSWEL) + wind wave
Extreme coastal storm event with windwaves
Extentonly* X
* The 100-year SWEL plus wind wave provides only the extent of inundation. The extent of inundation inland into Alameda County islarge, and the physics of wave propagation and dissipation over land were not fully included in the analysis used to develop thesemaps. The limitations of the wind wave assessments and the inherent uncertainties are described in Chapter 4. Wind and waveassessments are being developed for San Francisco Bay Coastal Hazard Analyses currently underway, being performed for FEMARegion IX of the San Francisco Bay shoreline, and thus more information on this topic may be available for future subregionassessments.
5.2.3 SENSITIVITYSensitivity of an asset to inundation by SLR relates to both the condition and the function of an asset.This study used physical condition to evaluate sensitivity, while data related to function (goodsmovement, socioeconomic impact, etc.) were used to evaluate consequence. The following physicalcharacteristics were determined to best describe the sensitivity of an asset to SLR:
Level of use (e.g., average daily traffic [ADT] volume [cars/trucks])Age of facilitySeismic retrofit statusMaintenance (ongoing operations and maintenance [O&M]) costLiquefaction susceptibility
Information was also collected on the following other physical characteristics but ultimately not used toevaluate the sensitivity of assets:
Condition/remaining service life - It was determined that data on remaining service life does notprovide a conclusive indication of sensitivity. For instance, an asset with a short remaining service lifecould be characterized as sensitive, because it soon must be replaced – however, once thisreplacement occurs, it would then count among the assets with the greatest remaining service life,and therefore least sensitive. Since the timing of the impacts of sea level rise and of futurereplacement or improvements is not known, it was decided not to include “remaining service life” orage as inputs to the sensitivity rating; however, where provided this information is presented in therisk profiles.
Foundation condition - Data was requested for foundation condition, but very little information wasactually collected.
The sensitivity criteria were not appropriate for all asset types and therefore, the information for thoseasset types was neither available nor relevant.
This condition data also provided key input for consideration of adaptation measures, particularly for themidcentury scenario. However, based on the final quality and quantity of data received on the assets, notall of the sensitivity data were used in the development of sensitivity ratings. Therefore, sensitivity ratings

Adapting to Rising Tides: Transportation Vulnerability and Risk Assessment Pilot Project 5-5
were developed based on the data collected and were compared within asset types. For example, thesensitivity of a roadway asset was compared with other roadway assets, not with other asset types, suchas rail facilities. Overall sensitivities were therefore compared only within particular asset types and notbetween asset types. The approach for each asset type is described below.
ROADWAYSFor roadways (interstates/freeways and state routes and arterial, collector, and local streets), comparabledata were generally available for the above-mentioned sensitivity metrics, except for foundation condition.Seismic retrofitting does not apply to all roadway segments and was not considered for rating purposes.In addition, the related metrics of age and remaining service life were not considered in the final ratings;older assets—though more sensitive at present—may be improved or rebuilt before SLR affects them,whereas newer assets—less sensitive today—may exhibit the greater sensitivity of older assets at thetime when they are affected by SLR. Absent further information and analysis about the likely future livesof the assets, these data alone were not considered sufficient to provide a conclusive indication ofsensitivity. The data points for the remaining metrics (level of use [expressed as ADT], O&M costs, andliquefaction susceptibility) were compared and separated into low, medium, and high values with respectto sensitivity. “Higher” values corresponded to higher levels of traffic, O&M costs, and liquefactionsusceptibility.
If an asset had a value for one of the metrics at the low end, it received one point. If the value wasmidrange, the asset received two points. If the value was at the high end, it received three points. Thetotal number of points for each asset was compared with the totals for the other assets within the assettype. Assets with a total at the low end of the totals received low ratings, assets with medium range totalreceive medium ratings, and assets at the high end of the totals received high ratings. Table 5.3 shows acouple of examples for interstates/freeways and state routes, and Table 5.4 shows a couple of examplesfor arterials, collectors, and local streets. The full list of sensitivity ratings assigned for the assets reviewedcan be found in Table C5.3 and Table C5.4 in Appendix C.
Table 5.3 Sensitivity Rating – Interstates/Freeways and State RoutesAsset (Segment) Level of Use -
Average DailyTraffic Volume
Operations &Maintenance Cost
LiquefactionSusceptibility
OverallSensitivity
(H/M/L)
3 points > 150,000 > $600,000 Very High8 or 9
H
2 points 50,000–150,000
$300,000–600,000
Very High,Medium
6 or 7M
1 point < 50,000 < $300,000 Medium4 or 5
L
I-80(Powell St. to Toll Plaza)
251,0003 pts.
$673,0003 pts.
Very High3 pts.
Point total: 9H
SR 92(Clawiter Rd. to Toll Plaza)
86,0002 pts.
$436,0002 pts.
Medium1 pt.
Point total:5L

5-6 Technical Report
Table 5.4 Sensitivity Rating – Arterials, Collectors, and Local StreetsAsset (Segment) Level of Use -
Average DailyTraffic Volume
Operations &Maintenance Cost
LiquefactionSusceptibility
OverallSensitivity
(H/M/L)
3 points > 20,000 > $5.0 M Very High 8 or 9H
2 points 5,000–20,000
$1.0 M–5.0 M
Very High,Medium
6 or 7M
1 point < 5,000 $1.0 M Medium 4 or 5L
West Grand Avenue(I-80 to Adeline St.)
22,9123 pts.
$2.0 M(30 yrs.)
2 pts.
Very High3 pts.
Point total: 8H
Mandela Parkway(West Grand Ave. to I-580)
8,0302 pts.
$1.0 M(30 yrs.)
1 pt.
Very High,Medium2 pts.
Point total: 5L
TUNNELS AND TUBES, TOLL, INTERSTATE AND STATE BRIDGES, AND FERRYTERMINALSFor tunnels and tubes, toll, interstate and state bridges, and ferry terminals, there are only two or threeassets for each type. In these cases, professional judgment was used to assign a single sensitivity rating toeach asset if they were comparable with respect to the condition metrics or to rank one higher than anotherif the data demonstrated a clear difference and that indicated one was more sensitive than the other.
CITY OF ALAMEDA BRIDGES, BART AND RAILROAD STATIONS, BART AND RAILLINES, SUPPORT FACILITIES AND BICYCLE/PEDESTRIAN ASSETSData availability for the assessment was limited for the City of Alameda bridges, Bay Area Rapid Transit(BART) and railroad stations, BART and rail lines, and support facilities and bicycle/pedestrian assets.Only a single sensitivity metric, liquefaction susceptibility, was consistently available to assign a rating.Due to this lack of data, the project team decided to remove sensitivity from the vulnerability equation forthese assets and use only exposure and adaptive capacity to assign ratings. In some instances, this ledto a mixed rating (e.g., HM) (see Section 5.2.5).
5.2.4 ADAPTIVE CAPACITYThe adaptive capacity of transportation assets includes the following:
Potential for maintaining partial use while inundated (note that this ultimately was not included in thevulnerability assessment) and
Adequate alternative route availability to maintain function while inundated.
It was considered that assets permanently exposed to inundation would be closed to further use but thatpartial use may be possible in cases where the inundation is temporary or associated with extraordinaryevents, such as a 100-year flood event. A roadway subject to 6 inches or less of inundation, for example,could still remain in operation, although its capacity may be reduced due to slower speeds. However, theinundation mapping exercise allowed the determination of inundation depths with certainty only to thenearest foot. Thus, the data could not assess the potential for maintaining partial use, as the level ofinundation separating a facility that could remain in use and a facility that would have to be closed woulddiffer by only a fraction of a foot.

Adapting to Rising Tides: Transportation Vulnerability and Risk Assessment Pilot Project 5-7
The project team discovered a lack of guidance with respect to the effect of inundation exposure on thepartial use or closure of transportation facilities. In Sausalito, the on-ramps to US 101 are currentlysubject to recurring flooding events, under which the ramps may be inundated under several inches ofwater. Despite this, the ramps remain open and traffic proceeds, albeit at slower speeds, as dictated bythe situation. Caltrans was contacted regarding this situation, and it was related that there are no specificguidelines in place that would determine under how much inundation the ramps (or any other Caltransfacility) would be closed. This lack of guidance made it difficult to provide a complete assessment ofadaptive capacity
The adaptive capacity of an asset was therefore determined solely by the availability of (a) comparableasset(s) that could provide an alternative route or provide a similar level of functionality should the assetbe closed. This included considering transit as an alternative route should a roadway or bridge be closed.(It should be noted when developing potential adaptation strategies the adaptive capacity of assets canbe more broadly defined as the ability to improve resilience to sea level rise through measures such asimproved drainage or coastal protection etc.)
It should be highlighted that when evaluating adaptive capacity, the project team measured the inability toadapt for consistency of assigning a high, medium, or low rating relating to a high, medium or lowvulnerability, so that a high rating always meant more vulnerable. Table 5.5 illustrates the ratingapproach, based on the identification of nearby or parallel assets that provide alternative routes orreplacement functionality for each asset at midcentury. Alternative routes at end of century wereassessed but not included in the Vulnerability rating, as the condition of the transportation network so farinto the future was considered too speculative to include in the rating. (It is more standard practice todefine adaptive capacity as the ability to adapt, which would lead to an asset that has a high adaptivecapacity, having a high rating.)
Table 5.5 Adaptive Capacity
Climate ScenarioInadequate Alternative Route (to Show Inability to Adapt)
High Medium Low
16” or 55” SLR + 100-yearSWEL
No alternative route/ nocomparable asset toreplace functionality
An alternative route/replacement asset isavailable but not fully
comparable
Multiple alternativeroutes/comparable facilities
available
In the case of linear assets (roadway segments, rail segments, and Bay Trail segments), both sides of theasset were considered to identify parallel routes that generally provide the same level of connectivity. Ifboth “sides” provide an alternative, a low rating was given; if only one “side” offers an alternative route, amedium rating was assigned. In the case of “point” assets (bridges, rail stations, ferry terminals andfacilities), the area around the asset was considered for nearby facilities that provide comparablefunctionality. A low rating was assigned if multiple alternatives were identified; if only one suitablealternative was located nearby, a medium rating was assigned. Thus, for example, while the BART linesegments all received high ratings because there are not parallel alternative routes for BART trains, theLake Merritt BART Station received a medium rating because if it were closed, BART passengers couldstill access the BART system at the nearby 12th Street Oakland City Center Station.
The ratings for the end-of-century scenario took an “if-then” approach, described as follows:
5-8 Technical Report
If an asset received a high rating for the midcentury scenario, it automatically received a high ratingfor the end-of-century scenario (as greater inundation would not change the lack of an alternativeroute/replacement asset).
If an asset received a medium rating for the midcentury scenario, and the alternativeroute/replacement asset would remain untouched by inundation during the 55-inch SLR plus 100-yearflood event, then it also received a medium rating for the end-of-century scenario. If the alternativeroute/replacement asset identified would be touched by inundation during the 55-inch SLR plus 100-year flood event, then both the original asset and its replacement were considered to be similarlyaffected, and a high rating was given for the end-of-century scenario.
If an asset received a low rating for the midcentury scenario, and a greater level of inundation underthe 55-inch SLR plus 100-year flood event would not affect the identified alternativeroutes/replacement assets, then it also received a low rating for the end-of-century scenario. If thegreater level of inundation at the end of the century would reduce the number of alternativeroutes/replacement assets to a single alternative, then a medium rating was assigned. If the level ofinundation resulting from 55-inch SLR plus the 100-year flood would touch all of the identifiedalternative routes or replacement assets, then all were considered affected, similar to the originalasset, and a high rating was given for the end-of-century scenario.
The vulnerability assessment incorporated only the ratings assigned for midcentury, although the ratingsassigned for the end of the century were noted. The project team assumed that the transportationnetwork may change considerably by the end of the century (due to adaptation strategies), so the ratingswere not used to alter the vulnerability rating. Despite this uncertainty, the vulnerability ratings were notchanged as a result of the rating assigned for the end of the century scenario.
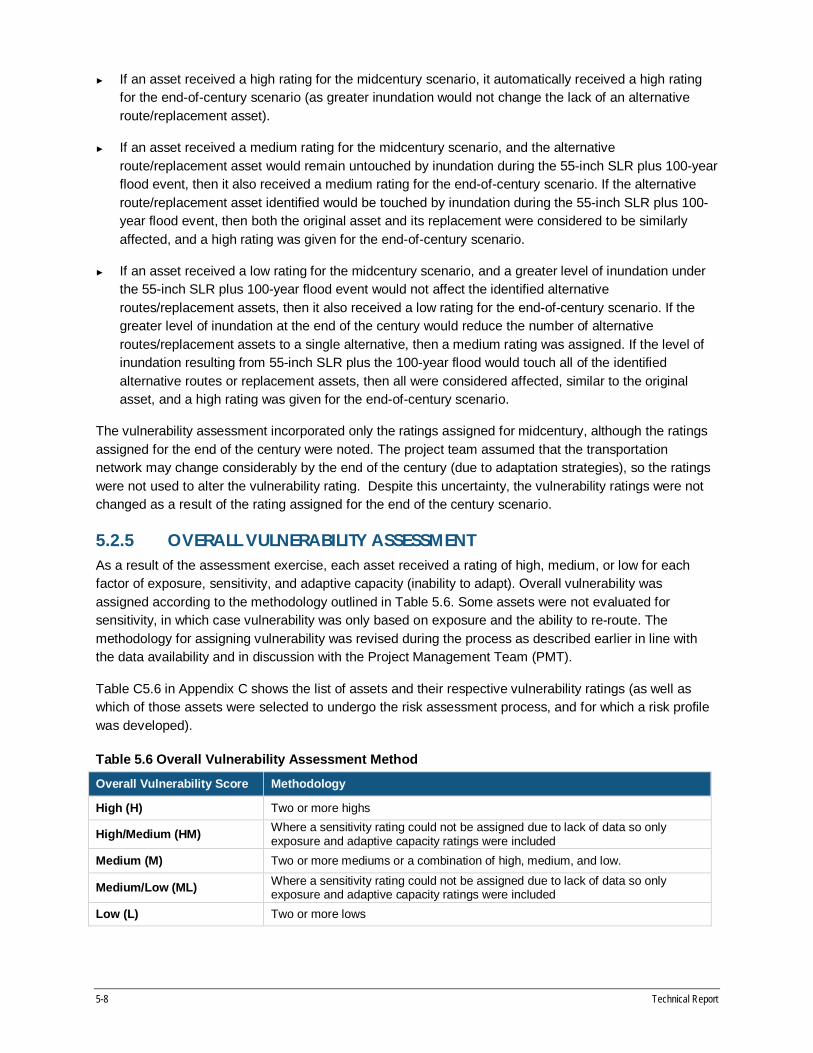
5.2.5 OVERALL VULNERABILITY ASSESSMENTAs a result of the assessment exercise, each asset received a rating of high, medium, or low for eachfactor of exposure, sensitivity, and adaptive capacity (inability to adapt). Overall vulnerability wasassigned according to the methodology outlined in Table 5.6. Some assets were not evaluated forsensitivity, in which case vulnerability was only based on exposure and the ability to re-route. Themethodology for assigning vulnerability was revised during the process as described earlier in line withthe data availability and in discussion with the Project Management Team (PMT).
Table C5.6 in Appendix C shows the list of assets and their respective vulnerability ratings (as well aswhich of those assets were selected to undergo the risk assessment process, and for which a risk profilewas developed).
Table 5.6 Overall Vulnerability Assessment Method
Overall Vulnerability Score Methodology
High (H) Two or more highs
High/Medium (HM) Where a sensitivity rating could not be assigned due to lack of data so onlyexposure and adaptive capacity ratings were included
Medium (M) Two or more mediums or a combination of high, medium, and low.
Medium/Low (ML) Where a sensitivity rating could not be assigned due to lack of data so onlyexposure and adaptive capacity ratings were included
Low (L) Two or more lows
Adapting to Rising Tides: Transportation Vulnerability and Risk Assessment Pilot Project 5-9
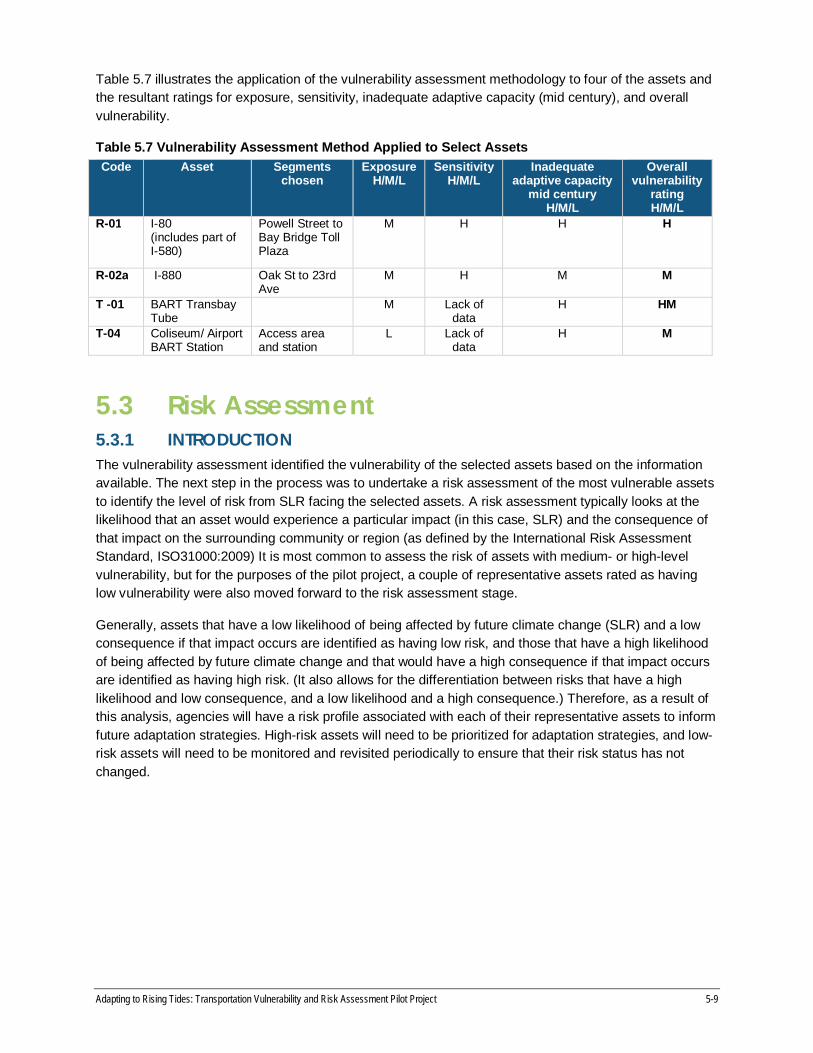
Table 5.7 illustrates the application of the vulnerability assessment methodology to four of the assets andthe resultant ratings for exposure, sensitivity, inadequate adaptive capacity (mid century), and overallvulnerability.
Table 5.7 Vulnerability Assessment Method Applied to Select AssetsCode Asset Segments
chosenExposure
H/M/LSensitivity
H/M/LInadequate
adaptive capacitymid century
H/M/L
Overallvulnerability
ratingH/M/L
R-01 I-80(includes part ofI-580)
Powell Street toBay Bridge TollPlaza
M H H H
R-02a I-880 Oak St to 23rdAve
M H M M
T -01 BART TransbayTube
M Lack ofdata
H HM
T-04 Coliseum/ AirportBART Station
Access areaand station
L Lack ofdata
H M
5.3 Risk Assessment5.3.1 INTRODUCTIONThe vulnerability assessment identified the vulnerability of the selected assets based on the informationavailable. The next step in the process was to undertake a risk assessment of the most vulnerable assetsto identify the level of risk from SLR facing the selected assets. A risk assessment typically looks at thelikelihood that an asset would experience a particular impact (in this case, SLR) and the consequence ofthat impact on the surrounding community or region (as defined by the International Risk AssessmentStandard, ISO31000:2009) It is most common to assess the risk of assets with medium- or high-levelvulnerability, but for the purposes of the pilot project, a couple of representative assets rated as havinglow vulnerability were also moved forward to the risk assessment stage.
Generally, assets that have a low likelihood of being affected by future climate change (SLR) and a lowconsequence if that impact occurs are identified as having low risk, and those that have a high likelihoodof being affected by future climate change and that would have a high consequence if that impact occursare identified as having high risk. (It also allows for the differentiation between risks that have a highlikelihood and low consequence, and a low likelihood and a high consequence.) Therefore, as a result ofthis analysis, agencies will have a risk profile associated with each of their representative assets to informfuture adaptation strategies. High-risk assets will need to be prioritized for adaptation strategies, and low-risk assets will need to be monitored and revisited periodically to ensure that their risk status has notchanged.

5-10 Technical Report
Risk Perception
Research indicates that one difficulty of conducting a risk assessment is the perception of risk: It isimportant to understand what it takes for people to be concerned enough to take mitigating action. Astudy by NOAA (2009), entitled Risk Behavior and Risk Communication Synthesis, focused onengaging the public in responding to immediate threats to coastal areas, such as evacuating before ahurricane. The study highlights risk (defined as Hazard x Exposure x Probability) as a social construct,noting that citizens’ perceptions of risk are affected by the norms of the groups that they identify with.Risk perception is based on a wider framing on topics, considerations, and agendas. It reflects personalexperiences and circumstances and is highly influenced by context, such as social networks. Thefollowing points summarize some key findings, which were appropriate for consideration in the riskassessment conducted by the project team:
There is evidence that people who are asked to compare the level of risk between variousalternatives perceive risk differently from that which actually exists. Risk has two dimensions: (1)what is known about the hazard itself and (2) what is felt about it, such as the level of dread or fear.The latter can have a large influence on the perception and assessment of risk.
From a social and cultural perspective, emerging social norms can help engage others in perceivingand responding to risk, especially if the change agents are trusted community members. Also, top-down campaigns that use a heavy-handed approach to try to convince people that they or theirproperty are at risk are not likely to succeed and may be resented. If engaged in the riskassessment process, citizens are more likely to accept the results and to perceive their riskadequately.
There are barriers to communicating about risk, especially for long-term, less immediate risks, suchas SLR. These barriers include other, and “bigger,” more pressing problems and concerns for thestakeholders involved. Other risks, such as current financial issues, may be perceived as moreimportant and requiring more immediate action.
For the vulnerability and risk assessment exercise of this pilot project those participating in the exerciseincluded the organizations that made up the Transportation and Shoreline Sub Committees asdescribed either in the report and the PMT. For these individuals, the hazard of SLR is a longer termthreat to the communities and assets under their jurisdiction, but it is not a threat to their immediatelivelihoods. Thus, it is expected that there are fewer emotional barriers to assessing risk/consequenceof SLR. In addition, the development of guidance on how to address SLR (and legal requirements)provides the local agencies with tools to address the threat of SLR to their communities and assets,leaving the assessment of risk and development of a response less to the perception and will ofindividuals.
Adapting to Rising Tides: Transportation Vulnerability and Risk Assessment Pilot Project 5-11
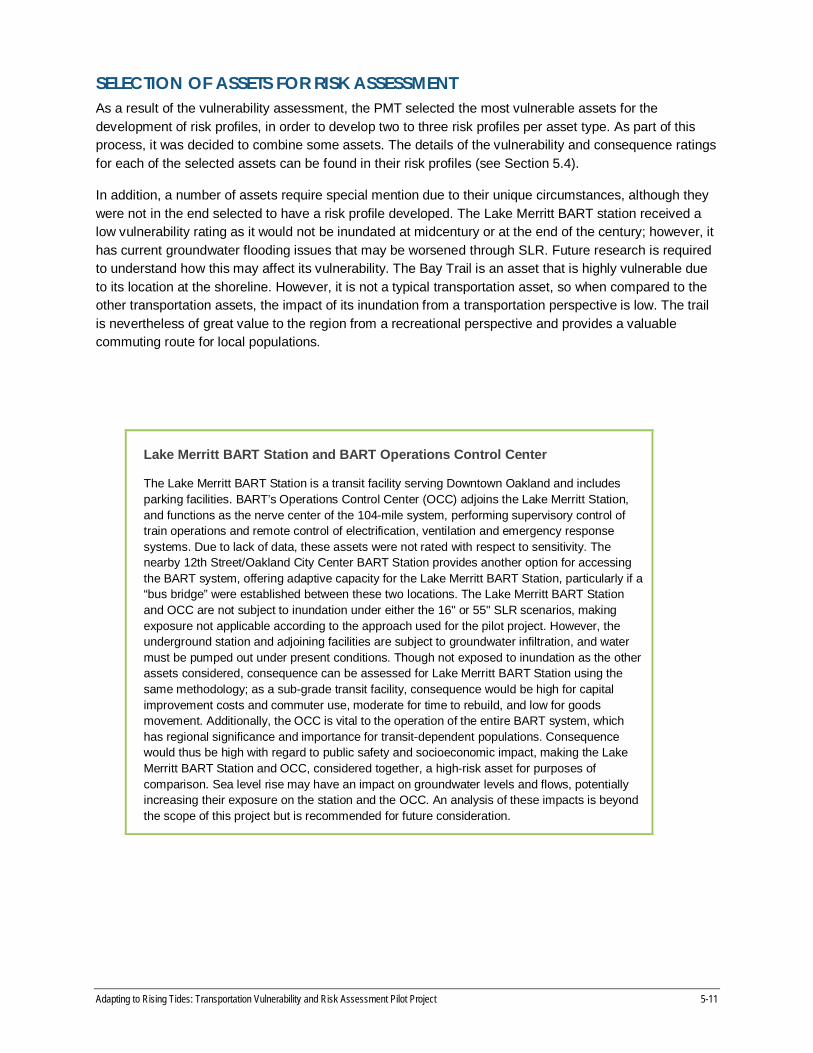
SELECTION OF ASSETS FOR RISK ASSESSMENTAs a result of the vulnerability assessment, the PMT selected the most vulnerable assets for thedevelopment of risk profiles, in order to develop two to three risk profiles per asset type. As part of thisprocess, it was decided to combine some assets. The details of the vulnerability and consequence ratingsfor each of the selected assets can be found in their risk profiles (see Section 5.4).
In addition, a number of assets require special mention due to their unique circumstances, although theywere not in the end selected to have a risk profile developed. The Lake Merritt BART station received alow vulnerability rating as it would not be inundated at midcentury or at the end of the century; however, ithas current groundwater flooding issues that may be worsened through SLR. Future research is requiredto understand how this may affect its vulnerability. The Bay Trail is an asset that is highly vulnerable dueto its location at the shoreline. However, it is not a typical transportation asset, so when compared to theother transportation assets, the impact of its inundation from a transportation perspective is low. The trailis nevertheless of great value to the region from a recreational perspective and provides a valuablecommuting route for local populations.
Lake Merritt BART Station and BART Operations Control Center
The Lake Merritt BART Station is a transit facility serving Downtown Oakland and includesparking facilities. BART’s Operations Control Center (OCC) adjoins the Lake Merritt Station,and functions as the nerve center of the 104-mile system, performing supervisory control oftrain operations and remote control of electrification, ventilation and emergency responsesystems. Due to lack of data, these assets were not rated with respect to sensitivity. Thenearby 12th Street/Oakland City Center BART Station provides another option for accessingthe BART system, offering adaptive capacity for the Lake Merritt BART Station, particularly if a“bus bridge” were established between these two locations. The Lake Merritt BART Stationand OCC are not subject to inundation under either the 16" or 55" SLR scenarios, makingexposure not applicable according to the approach used for the pilot project. However, theunderground station and adjoining facilities are subject to groundwater infiltration, and watermust be pumped out under present conditions. Though not exposed to inundation as the otherassets considered, consequence can be assessed for Lake Merritt BART Station using thesame methodology; as a sub-grade transit facility, consequence would be high for capitalimprovement costs and commuter use, moderate for time to rebuild, and low for goodsmovement. Additionally, the OCC is vital to the operation of the entire BART system, whichhas regional significance and importance for transit-dependent populations. Consequencewould thus be high with regard to public safety and socioeconomic impact, making the LakeMerritt BART Station and OCC, considered together, a high-risk asset for purposes ofcomparison. Sea level rise may have an impact on groundwater levels and flows, potentiallyincreasing their exposure on the station and the OCC. An analysis of these impacts is beyondthe scope of this project but is recommended for future consideration.

5-12 Technical Report
Bay Trail and Connecting Trails
The Bay Trail provides easily accessible recreationalopportunities for outdoor enthusiasts, including hikers,joggers, bicyclists and skaters. It also offers a setting forwildlife viewing and environmental education, and itincreases public respect and appreciation for the Bay. Italso has important transportation benefits, providing acommute alternative for cyclists, and connects tonumerous public transportation facilities (including ferryterminals, light-rail lines, bus stops and Caltrain, Amtrak,and BART stations); also, the Bay Trail will eventuallycross all the major toll bridges in the Bay Area. Within thesubregion, the Bay Trail consists of off-street paved orgravel paths; on-street bike lanes and sidewalks; off-streetunimproved paths (of varying width and surfaces). Otherpaved or gravel paths connect to the Bay Trail.
This project evaluated two off-street trail segments alongthe Alameda County shoreline: the trail around LakeMerritt connecting to the Bay Trail (the “Lake MerrittConnector Trail”) and the segment of the Bay Trail alongthe Hayward Regional Shoreline (the “Hayward RegionalShoreline Trail”). Due to lack of data, these assets werenot rated with respect to sensitivity. Exposure for both trailsegments is high (due to significant inundation under boththe 16" and 55" SLR scenarios). While the Lake MerrittConnector Trail has a parallel trail, it is likely to be similarlyaffected by inundation; no parallel trail is available for theHayward Regional Shoreline Trail, making thevulnerability of both trail segments high. For both trailsegments, all consequence criteria have a low rating,making them low-risk assets.
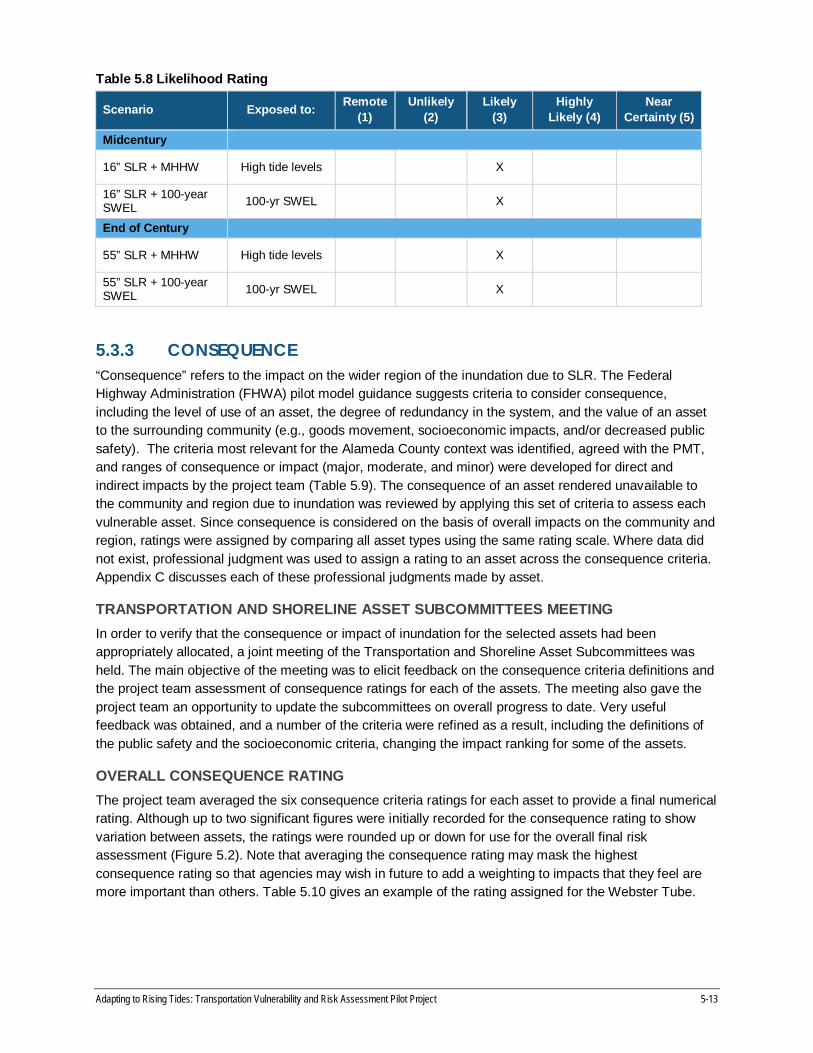
5.3.2 LIKELIHOODLikelihood is determined by estimating the probability that a certain climate change impact will occur. Forthis project, the climate change impact is limited to a certain set of SLR scenarios. Since this studyconsidered only two climate change scenarios and the project area is relatively small, the likelihood ratingis the same for each transportation asset for each scenario (Table 5.8). If a range of SLR scenarios hadbeen considered (for example, different depths of inundation expected by midcentury), then a range oflikelihoods could have been identified.
Bay Trail
Bay Trail
Lake Merritt Connector Trail
Adapting to Rising Tides: Transportation Vulnerability and Risk Assessment Pilot Project 5-13
Table 5.8 Likelihood Rating
Scenario Exposed to: Remote(1)
Unlikely(2)
Likely(3)
HighlyLikely (4)
NearCertainty (5)
Midcentury
16” SLR + MHHW High tide levels X
16” SLR + 100-yearSWEL 100-yr SWEL X
End of Century
55” SLR + MHHW High tide levels X
55” SLR + 100-yearSWEL 100-yr SWEL X
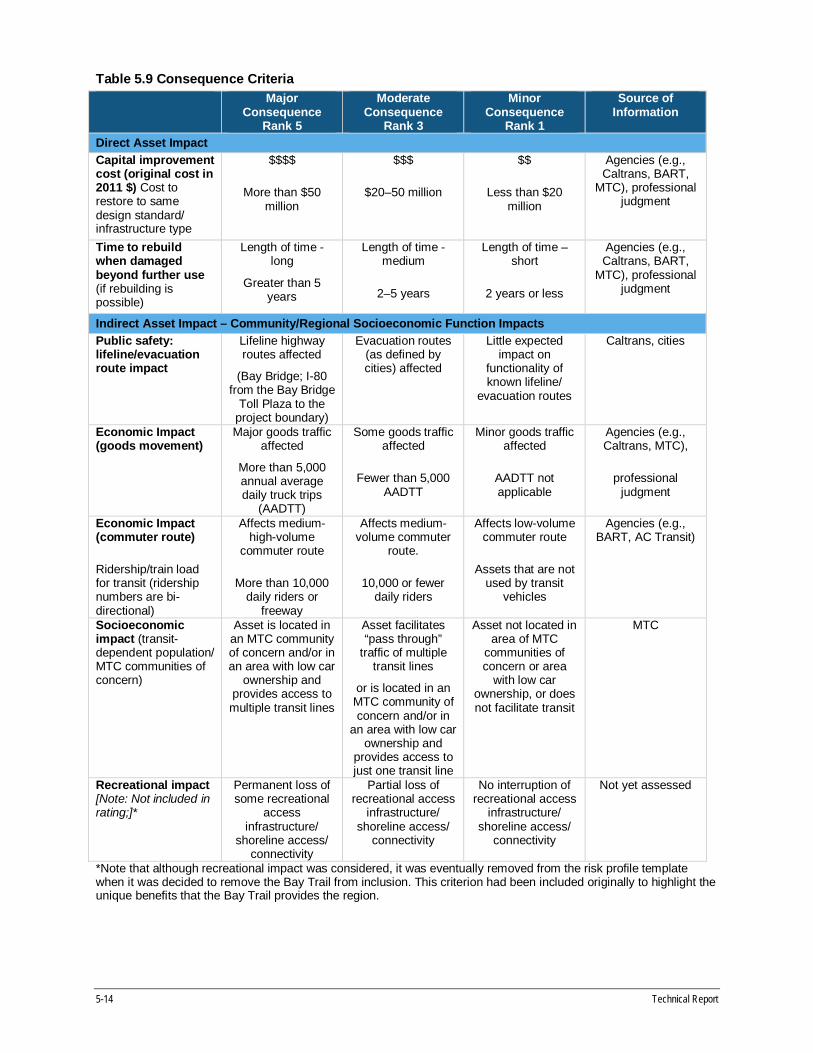
5.3.3 CONSEQUENCE“Consequence” refers to the impact on the wider region of the inundation due to SLR. The FederalHighway Administration (FHWA) pilot model guidance suggests criteria to consider consequence,including the level of use of an asset, the degree of redundancy in the system, and the value of an assetto the surrounding community (e.g., goods movement, socioeconomic impacts, and/or decreased publicsafety). The criteria most relevant for the Alameda County context was identified, agreed with the PMT,and ranges of consequence or impact (major, moderate, and minor) were developed for direct andindirect impacts by the project team (Table 5.9). The consequence of an asset rendered unavailable tothe community and region due to inundation was reviewed by applying this set of criteria to assess eachvulnerable asset. Since consequence is considered on the basis of overall impacts on the community andregion, ratings were assigned by comparing all asset types using the same rating scale. Where data didnot exist, professional judgment was used to assign a rating to an asset across the consequence criteria.Appendix C discusses each of these professional judgments made by asset.
TRANSPORTATION AND SHORELINE ASSET SUBCOMMITTEES MEETINGIn order to verify that the consequence or impact of inundation for the selected assets had beenappropriately allocated, a joint meeting of the Transportation and Shoreline Asset Subcommittees washeld. The main objective of the meeting was to elicit feedback on the consequence criteria definitions andthe project team assessment of consequence ratings for each of the assets. The meeting also gave theproject team an opportunity to update the subcommittees on overall progress to date. Very usefulfeedback was obtained, and a number of the criteria were refined as a result, including the definitions ofthe public safety and the socioeconomic criteria, changing the impact ranking for some of the assets.
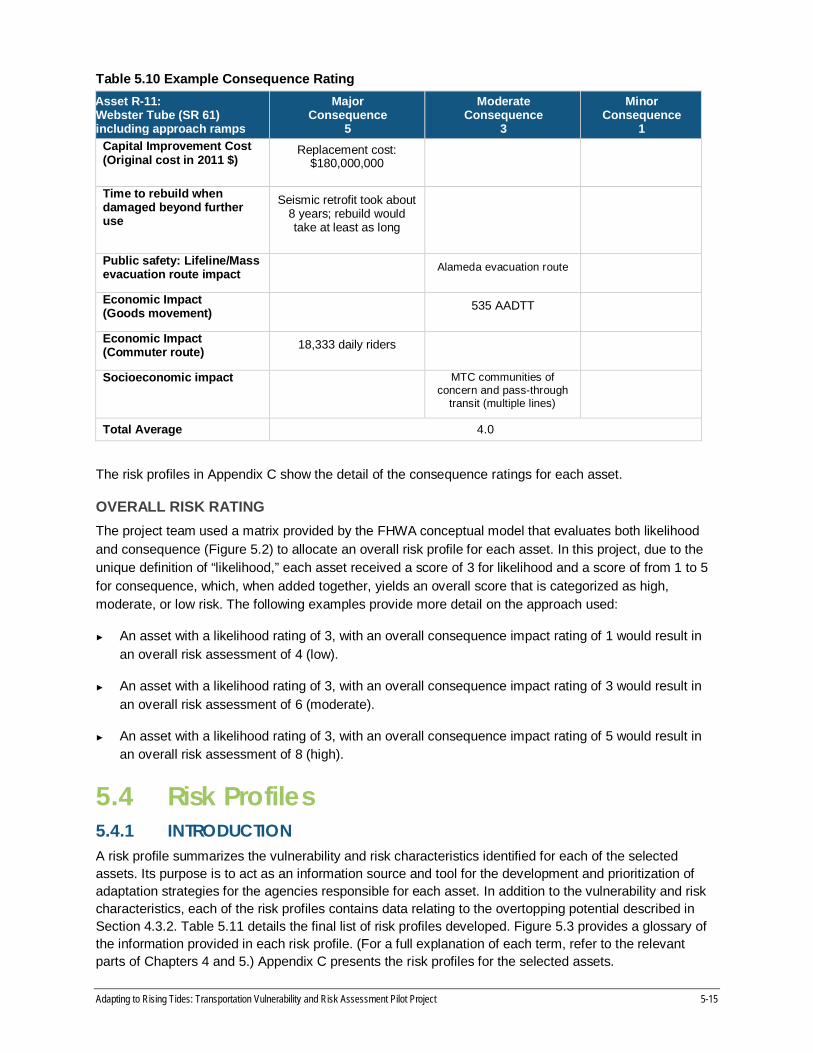
OVERALL CONSEQUENCE RATINGThe project team averaged the six consequence criteria ratings for each asset to provide a final numericalrating. Although up to two significant figures were initially recorded for the consequence rating to showvariation between assets, the ratings were rounded up or down for use for the overall final riskassessment (Figure 5.2). Note that averaging the consequence rating may mask the highestconsequence rating so that agencies may wish in future to add a weighting to impacts that they feel aremore important than others. Table 5.10 gives an example of the rating assigned for the Webster Tube.
5-14 Technical Report
Table 5.9 Consequence CriteriaMajor
ConsequenceRank 5
ModerateConsequence
Rank 3
MinorConsequence
Rank 1
Source ofInformation
Direct Asset ImpactCapital improvementcost (original cost in2011 $) Cost torestore to samedesign standard/infrastructure type
$$$$
More than $50million
$$$
$20–50 million
$$
Less than $20million
Agencies (e.g.,Caltrans, BART,
MTC), professionaljudgment
Time to rebuildwhen damagedbeyond further use(if rebuilding ispossible)
Length of time -long
Greater than 5years
Length of time -medium
2–5 years
Length of time –short
2 years or less
Agencies (e.g.,Caltrans, BART,
MTC), professionaljudgment
Indirect Asset Impact – Community/Regional Socioeconomic Function ImpactsPublic safety:lifeline/evacuationroute impact
Lifeline highwayroutes affected
(Bay Bridge; I-80from the Bay Bridge
Toll Plaza to theproject boundary)
Evacuation routes(as defined bycities) affected
Little expectedimpact on
functionality ofknown lifeline/
evacuation routes
Caltrans, cities
Economic Impact(goods movement)
Major goods trafficaffected
More than 5,000annual averagedaily truck trips
(AADTT)
Some goods trafficaffected
Fewer than 5,000AADTT
Minor goods trafficaffected
AADTT notapplicable
Agencies (e.g.,Caltrans, MTC),
professionaljudgment
Economic Impact(commuter route)
Ridership/train loadfor transit (ridershipnumbers are bi-directional)
Affects medium-high-volume
commuter route
More than 10,000daily riders or
freeway
Affects medium-volume commuter
route.
10,000 or fewerdaily riders
Affects low-volumecommuter route
Assets that are notused by transit
vehicles
Agencies (e.g.,BART, AC Transit)
Socioeconomicimpact (transit-dependent population/MTC communities ofconcern)
Asset is located inan MTC communityof concern and/or inan area with low car
ownership andprovides access tomultiple transit lines
Asset facilitates“pass through”
traffic of multipletransit lines
or is located in anMTC community ofconcern and/or in
an area with low carownership and
provides access tojust one transit line
Asset not located inarea of MTC
communities ofconcern or area
with low carownership, or doesnot facilitate transit
MTC
Recreational impact[Note: Not included inrating;]*
Permanent loss ofsome recreational
accessinfrastructure/
shoreline access/connectivity
Partial loss ofrecreational access
infrastructure/shoreline access/
connectivity
No interruption ofrecreational access
infrastructure/shoreline access/
connectivity
Not yet assessed
*Note that although recreational impact was considered, it was eventually removed from the risk profile templatewhen it was decided to remove the Bay Trail from inclusion. This criterion had been included originally to highlight theunique benefits that the Bay Trail provides the region.
Adapting to Rising Tides: Transportation Vulnerability and Risk Assessment Pilot Project 5-15
Table 5.10 Example Consequence RatingAsset R-11:Webster Tube (SR 61)including approach ramps
MajorConsequence
5
ModerateConsequence
3
MinorConsequence
1Capital Improvement Cost(Original cost in 2011 $)
Replacement cost:$180,000,000
Time to rebuild whendamaged beyond furtheruse
Seismic retrofit took about8 years; rebuild wouldtake at least as long
Public safety: Lifeline/Massevacuation route impact Alameda evacuation route
Economic Impact(Goods movement) 535 AADTT
Economic Impact(Commuter route) 18,333 daily riders
Socioeconomic impact MTC communities ofconcern and pass-through
transit (multiple lines)
Total Average 4.0
The risk profiles in Appendix C show the detail of the consequence ratings for each asset.
OVERALL RISK RATINGThe project team used a matrix provided by the FHWA conceptual model that evaluates both likelihoodand consequence (Figure 5.2) to allocate an overall risk profile for each asset. In this project, due to theunique definition of “likelihood,” each asset received a score of 3 for likelihood and a score of from 1 to 5for consequence, which, when added together, yields an overall score that is categorized as high,moderate, or low risk. The following examples provide more detail on the approach used:
An asset with a likelihood rating of 3, with an overall consequence impact rating of 1 would result inan overall risk assessment of 4 (low).
An asset with a likelihood rating of 3, with an overall consequence impact rating of 3 would result inan overall risk assessment of 6 (moderate).
An asset with a likelihood rating of 3, with an overall consequence impact rating of 5 would result inan overall risk assessment of 8 (high).
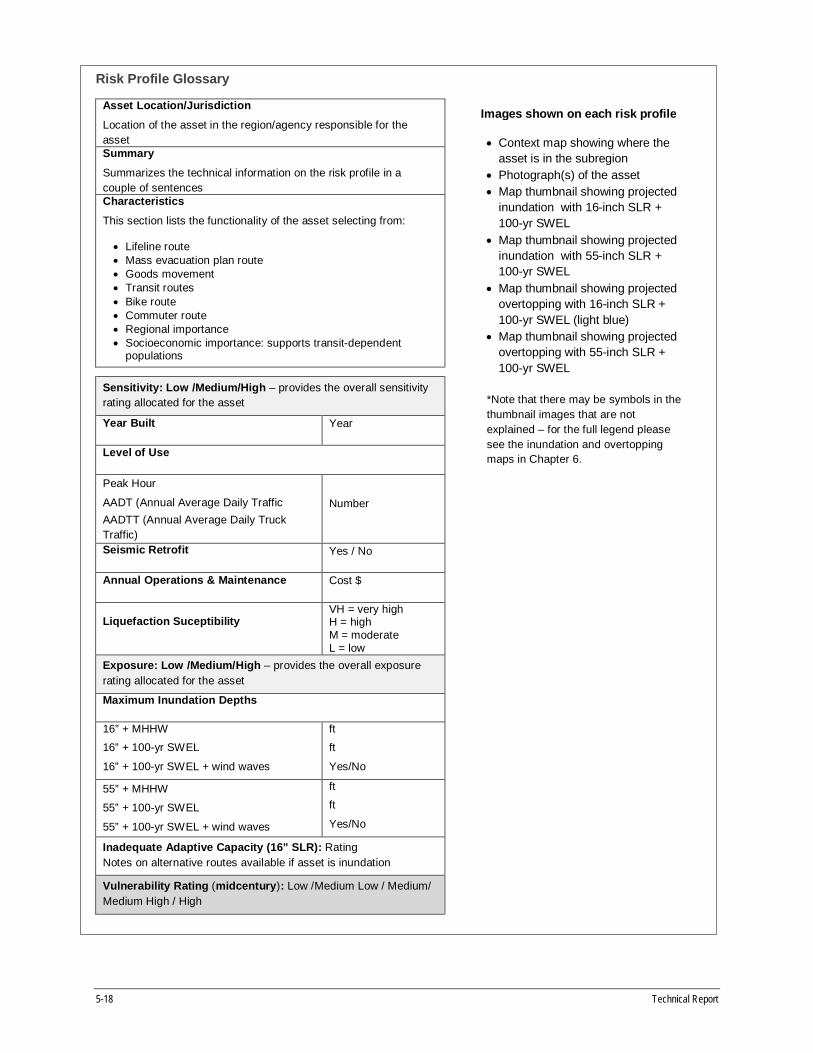
5.4 Risk Profiles5.4.1 INTRODUCTIONA risk profile summarizes the vulnerability and risk characteristics identified for each of the selectedassets. Its purpose is to act as an information source and tool for the development and prioritization ofadaptation strategies for the agencies responsible for each asset. In addition to the vulnerability and riskcharacteristics, each of the risk profiles contains data relating to the overtopping potential described inSection 4.3.2. Table 5.11 details the final list of risk profiles developed. Figure 5.3 provides a glossary ofthe information provided in each risk profile. (For a full explanation of each term, refer to the relevantparts of Chapters 4 and 5.) Appendix C presents the risk profiles for the selected assets.

5-16 Technical Report
Consequence
Like
lihoo
d
1 2 3 4 5
1 2 3 4 5 62 3 4 5 6 73 4 5 6 7 84 5 6 7 8 95 6 7 8 9 10
Risk Low Moderate High
High Risk (Red)
Unacceptable, major disruption likely; priority management attention required.
Moderate Risk (Orange)
Some disruption; additional management attention may be needed.
Low Risk (Green)
Minimum impact; minimum oversight needed to ensure risk remains low.
Figure 5.2 Risk Rating Matrix
Table 5.11 Final List of Risk Profiles, by Asset Category and Asset Type, Showing Final RiskRating
Code Asset Category and Asset Types Segments Chosen Final Risk Rating
Road Network (R)
R-01 I-80 (includes part of I-580) Powell Street to Bay Bridge Toll Plaza High
R-02a I-880 Oak St to 23rd Ave High
R-02b I-880 High St to 98th Ave High
R-03 SR 92 Clawiter Rd to San Mateo Bridge Toll Plaza Medium
R-04 West Grand Ave I-80 to Adeline St Medium
R-05Hegenberger RdAirport DrFuture BART Line - OaklandInternational Airport Connector
San Leandro Street to Doolittle DrEntire facilityRoute serving/crossing SLR exposure area
MediumMediumMedium
R-06 Powell St (City of Emeryville) West of I-80 Low
R-07 Mandela Pkwy West Grand Ave to I-580 Low
R-08 Ron Cowan Pkwy Entire facility Medium
R-09 Burma Rd Entire facility Low
R-10 Cabot Blvd Entire facility Medium

Adapting to Rising Tides: Transportation Vulnerability and Risk Assessment Pilot Project 5-17
Code Asset Category and Asset Types Segments Chosen Final Risk Rating
R-11 Posey Tube (SR 260) Webster StTube (SR 61) All, including approach ramps High
High
R-12 Bay Bridge (I-80) From Toll Plaza until Alameda Countyboundary High
R-13 San Mateo Bridge (SR 92) From Toll Plaza until Alameda Countyboundary Medium
R-14 Bay Farm Island Bridge Entire facility, including adjacent bicyclebridge Medium
Transit (T)
T -01 BART Transbay Tube Entire facility High
T -02 Elevated BART Line betweenTransbay Tube and Oakland Wye
Elevated structure between I-880overcrossing and I-880 undercrossing Medium
T-03 West Oakland BART Station Entire facility Medium
T-04 Coliseum/Airport BART Station Entire facility Medium
T-05 Oakland Jack London SquareAmtrak Station Entire facility Low
T-06 UP Martinez Subdivision Emeryville Segment (I-580 to 14) Medium
T-07 UP Niles Subdivision Oakland Segment (17-23) Medium
T-08 Jack London Square Ferry Terminal Entire facility Low
T-09Alameda Gateway Ferry Terminal(including Park &Ride, bike, ADAaccess)
Entire facility Low
Facilities (F)
F-01 AC Transit Maintenance (1100Seminary) Not Applicable Medium
F-02 Burlington Northern Santa Fe IntlGateway Intermodal Yard Not Applicable Medium
F-03 Capitol Corridor Norcal O&M Yard Not Applicable Medium
F-04 7th Street Highway and RailroadPumps Not Applicable Medium
5-18 Technical Report
Risk Profile Glossary
Asset Location/Jurisdiction
Location of the asset in the region/agency responsible for theassetSummary
Summarizes the technical information on the risk profile in acouple of sentencesCharacteristics
This section lists the functionality of the asset selecting from:
Lifeline route Mass evacuation plan route Goods movement Transit routes Bike route Commuter route Regional importance Socioeconomic importance: supports transit-dependent
populations
Sensitivity: Low /Medium/High – provides the overall sensitivityrating allocated for the asset
Year Built Year
Level of Use
Peak Hour
AADT (Annual Average Daily Traffic NumberAADTT (Annual Average Daily TruckTraffic)Seismic Retrofit Yes / No
Annual Operations & Maintenance Cost $
Liquefaction SuceptibilityVH = very highH = highM = moderateL = low
Exposure: Low /Medium/High – provides the overall exposurerating allocated for the asset
Maximum Inundation Depths
16” + MHHW ft16” + 100-yr SWEL ft
16” + 100-yr SWEL + wind waves Yes/No
55” + MHHW ft
55” + 100-yr SWEL ft
55” + 100-yr SWEL + wind waves Yes/No
Inadequate Adaptive Capacity (16” SLR): RatingNotes on alternative routes available if asset is inundation
Vulnerability Rating (midcentury): Low /Medium Low / Medium/Medium High / High
Images shown on each risk profile
Context map showing where theasset is in the subregion
Photograph(s) of the asset Map thumbnail showing projectedinundation with 16-inch SLR +100-yr SWEL
Map thumbnail showing projectedinundation with 55-inch SLR +100-yr SWEL
Map thumbnail showing projectedovertopping with 16-inch SLR +100-yr SWEL (light blue)
Map thumbnail showing projectedovertopping with 55-inch SLR +100-yr SWEL
*Note that there may be symbols in thethumbnail images that are notexplained – for the full legend pleasesee the inundation and overtoppingmaps in Chapter 6.

Adapting to Rising Tides: Transportation Vulnerability and Risk Assessment Pilot Project 5-19
Risk Profile Glossary
Consequence Rating (out of 5): Number between 0 and 5Ranges of consequence or impact - major (5), moderate (3) and minor (1) were developed for each of the impactsbelow.Capital improvement cost
Cost to restore to same design standard/ infrastructure type.Time to rebuild
To original condition, based on 84-, 60-, and 24-month estimatesPublic safety
Lifeline or evacuation routeEconomic impact -goods movement Based on average annual daily truck traffic (AADTT) data
Economic impact -commuter route Daily ridership figures (also all freeways, bridges, tubes assigned major impact)
Socioeconomic impact Based on MTC communities of concern, MTC data on household car ownership andwhether providing a transit route
Risk Rating: High / Medium / Low (from combination of “likelihood” and “consequence”) rating
Shoreline Asset “Overtopping” Analysis (see Section 4.3.2 for more detail)
Proximity oftransportation asset toovertopped shorelineasset (distance)
16” + 100-yr SWEL
ftTransportation assets that are closer to the shoreline could have a higher likelihood offuture inundation
55” + 100-yr SWEL
ft
Length overtopped(% of system)
16” + 100-yr SWEL
ft (%)The greater the percentage, potentially the more at risk the asset is
55” + 100-yr SWEL
ft (%)
Average depth ofovertopping
The average depth of inundation along the overtopped portion of the shoreline assetswithin a particular system. Portions of the shoreline system that are not overtopped(overtopping depth = 0) are not included in the average overtopping depth calculation.As sea level rises from the 16” to 55” SLR scenarios, additional lengths of shorelineare inundated within each system; therefore, the average overtopping depth increasebetween the two scenarios is less than the 39” increase in sea level.
16” + 100-yr SWEL
ftThe deeper the overtopping, potentially the more at risk the asset is
55” + 100-yr SWEL
ft
System responsible forinundating transportationasset
(See overview map)
Number of System: The study area is divided into 28 shoreline “systems” – contiguousreaches of shoreline that act together to prevent inundation of inland areas, ranging inlength from approximately 1 to 18 miles.
Section 6.5
Future ProjectsDescription of any future projects anticipated for the asset.
Figure 5.3 Risk Profile Glossary: Asset Name (Asset Code)
5-20 Technical Report
5.5 Recommended Refinements to the FHWAConceptual Model
5.5.1 LESSONS LEARNEDDATA COLLECTIONAs mentioned in Chapter 2, due to the large number of important transportation assets in the project area,extensive data collection requests related to specific transportation assets were delayed until the assetlist had been shortened so that agencies were not overwhelmed by the data requests. This included theinformation required to assess the condition of the asset to inform the sensitivity component of thevulnerability analysis (such as its age, whether or not it had been seismically retrofitted, its annual O&Mbudget) and the potential impact of inundation to inform the consequence component of the analysis(such as cost and time to rebuild). Data were sometimes also received after deadlines set by the projectteam, which led to the need for repeated updates to the inventory and to both the vulnerability and riskassessment exercises. The amount of effort and time required to collect data should not beunderestimated.
DEFINITIONSThe methodology used for the vulnerability assessment was a truly iterative process, due to the numberof approaches to vulnerability assessment and the number of interpretations of some of the key terms(even between different papers produced by the Intergovernmental Panel on Climate Change). Forexample, some approaches consider adaptive capacity as part of the vulnerability equation, and some donot, assuming that this could mask the true vulnerability of an asset. The project team had extensivediscussions to work out what the most appropriate approach was for the project area and assets, bearingin mind the information available. For example, the team originally considered both the potential formaintaining partial use of an asset while it was inundated and the availability of an adequate alternativeroute to maintain function while the asset is inundated as important components of adaptive capacity of atransportation asset. But this was revised to just refer to the availability of an adequate alternative route.Initially, the project team considered that adaptive capacity should be considered as part of theconsequence of inundation (if the asset has adaptive capacity, it is of lower consequence to the region)but finally concluded that as long as low-cost adaptive capacity measures only were considered, it shouldbe part of the vulnerability equation.
INTEGRATION OF SHORELINE ASSETS INTO THE ASSESSMENTIf and how the performance of the shoreline assets should feed into a vulnerability assessment was alsoa topic of much discussion. Using the inundation mapping information generated for the project, it ispossible to look in detail at which shoreline assets were overtopped where and to what depth, providinguseful information for future adaptation strategies. It was decided, however, that there was not sufficientinformation available regarding the likely future maintenance, and upgrade schedule for the shorelineassets to understand with confidence how the overtopping potential may affect the vulnerability of theassets. It was decided in the end that this information would be best utilized as a tool to help figure outthe most appropriate adaptation strategies to protect the transportation asset. Knowing how much and towhat depth the closest shoreline protection system was overtopped would allow both the prioritization andthe development of the most appropriate adaptation strategies. This is an indication of the adaptivecapacity of the shoreline assets.

Adapting to Rising Tides: Transportation Vulnerability and Risk Assessment Pilot Project 5-21
TREATMENT OF DIFFERENT ASSET TYPESAt different points in the process, assets were compared within or across asset types. When sensitivitydata were reviewed, in order to develop sensible ranges of low, medium, and high, assets werecompared within ranges (e.g., in terms of cost, replacement time). When reviewing consequence impactdata, assets were compared across asset types to ensure comparison of truly comparable assets and toassist in appropriate prioritization.
There was much discussion regarding how to assess the Bay Trail and other pedestrian or bicycleinfrastructure in terms of impact or consequence of inundation from SLR. Although the Bay Trail is ofgreat importance as a recreational and social asset for the local community and is a valuable commutingroute for some, when compared to other transportation infrastructure, such as freeways or the Bay Tube,it cannot compete in terms of regional transportation significance. For the risk assessment exercise forthis project as described above, all assets were compared using a common scale in order to use theassessment as a prioritization tool. The Bay Trail was carried through the vulnerability assessment stageas an important representative asset for the region and was determined to be highly vulnerable. However,when assessed with the consequence criteria, it was determined to have low impact or consequence(because it would be comparatively inexpensive to rebuild and does not carry significant commuter orgoods traffic) relative to other assets. Given the trail’s importance to the region (even though not from aregional transportation perspective), the project team decided that it was not appropriate to label it of lowconsequence if it were inundated. (It should be noted that for other projects, if prioritization orcomparison is not made across asset types, then metrics can be developed to enable assets to becompared within their asset types.)
5.5.2 RECOMMENDATIONS FOR FUTURE APPLICATIONSRecommendations for the vulnerability and risk component of the process include the following:
Provide fuller definitions or guidance on what exposure, sensitivity, and adaptive capacity mean andhow to use them for different project types.
Obtain early input from stakeholders on definitions of the consequence impact criteria as this insightis valuable to ensuring that criteria are tailored to the local context. For example, during the project,the definition used for “public safety” was expanded from a defined California Department ofTransportation lifeline route to include routes that were identified as emergency evacuation routes bylocal cities.
Provide guidance about whether or not agencies may wish to add a weighting to certain impacts inthe instance that multiple impacts are being rated and averaged to provide an overall consequencerating which may mask the highest (and most concerning) consequence rating
Organizational impacts to the agencies themselves are not included as consequence criteria andshould be considered in the future. Decisions made by agencies today that increase the vulnerabilityby not taking climate change into account may led to liability issues in the future.
Provide guidance and examples on how to rate the sensitivity of an asset when the availability of datais inconsistent between assets.
Provide guidance on how to include consideration of the impact of potentially accelerated assetdeterioration due to e.g. temporary inundation during storm events

5-22 Technical Report
Provide guidance and examples on the methodology developing the ranges (major – moderate –minor) for rating assets against different consequence criteria, particularly when qualitative data maybe hard to obtain, yet participants are not comfortable using professional judgment to rate an impact.
Ensure that asset types only of comparable scale/class are included in the same assessment.
Provide guidance on when it is appropriate to assess assets across asset types and when it isappropriate to assess assets within asset types.
Provide guidance on the range of asset types that should be included in a project scope so that like-with-like comparisons can be made.
Agencies should put in place data inventory development processes to consolidate data abouttransportation assets to facilitate future risk assessment exercises.
Include guidance or suggestions on what type of more detailed inundation mapping can be helpful forprioritizing vulnerable assets and understanding how the protection that a shoreline asset is offeringchanges with SLR.
If more detailed inundation mapping is done for projects looking at SLR in particular, ensure that timeis factored into the schedule to account for this.
5.6 ReferencesCalifornia Natural Resources Agency 2009. 2009 California Climate Adaptation Strategy.
IPCC Fourth Assessment Report: Climate Change 2007 (AR4) IPCC 2007
IPCC Third Assessment Report: Climate Change 2001 (TAR) IPCC 2001
Risk Behavior and Risk Communication: Synthesis and Expert Interviews Final Report for The NOAACoastal Services Center Betty H. Morrow, Ph.D. SocResearch Miami July 2009
Knowles, Noah. 2009. Potential Inundation Due to Rising Sea Levels in the San Francisco Bay Region. APaper From: California Climate Change Center (CEC-500-2009-023-F), March 2009.