Métabolomique par RMN - ESIesilrch1.esi.umontreal.ca/~syguschj/cours/BCM6225/Lecture Notes...1...
40
1 Métabolomique par RMN Principes et applications -6 -4 -2 0 2 4 6 -9 -8 -7 -6 -5 -4 -3 -2 -1 0 1 2 3 4 5 6 7 8 9 t[2] t[1] Cerv Cm C-Fr C-Rh Hipp M. Malet-Martino Groupe de RMN Biomédicale [email protected]
Transcript of Métabolomique par RMN - ESIesilrch1.esi.umontreal.ca/~syguschj/cours/BCM6225/Lecture Notes...1...

1
Métabolomique par RMN Principes et applications
-6
-4
-2
0
2
4
6
-9 -8 -7 -6 -5 -4 -3 -2 -1 0 1 2 3 4 5 6 7 8 9
t[2]
t[1]
Matricepartie_de_cerveau_simca.M8 (PLS-DA)
t[Comp. 1]/t[Comp. 2]
Colored according to classes in M8
R2X[1] = 0,143472 R2X[2] = 0,0779111 Ellipse: Hotelling T2 (0,95)
Cerv
Cf
Cm
Cr
Hipp
SIMCA-P+ 12.0.1 - 2010-04-27 19:08:42 (UTC+1)
Cerv
Cm C-Fr
C-Rh
Hipp
M. Malet-Martino
Groupe de RMN Biomédicale [email protected]

2
Partie 2
Applications
3
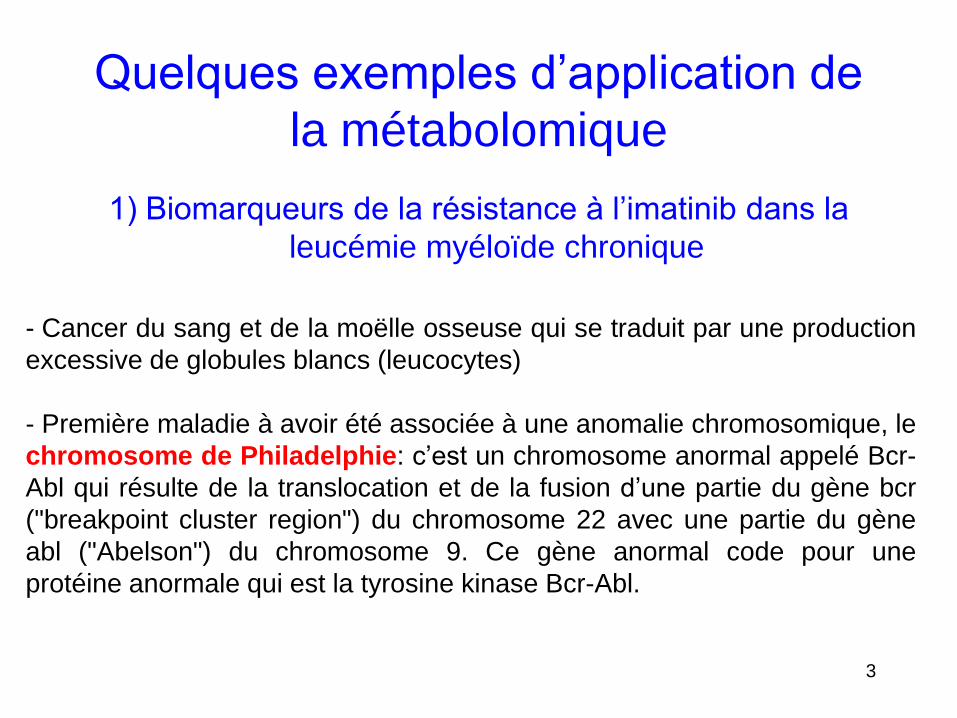
Quelques exemples d’application de
la métabolomique
1) Biomarqueurs de la résistance à l’imatinib dans la
leucémie myéloïde chronique
- Cancer du sang et de la moëlle osseuse qui se traduit par une production
excessive de globules blancs (leucocytes)
- Première maladie à avoir été associée à une anomalie chromosomique, le
chromosome de Philadelphie: c’est un chromosome anormal appelé Bcr-
Abl qui résulte de la translocation et de la fusion d’une partie du gène bcr
("breakpoint cluster region") du chromosome 22 avec une partie du gène
abl ("Abelson") du chromosome 9. Ce gène anormal code pour une
protéine anormale qui est la tyrosine kinase Bcr-Abl.

4
- Traitement par l’imatinib (Glivec®) qui est un inhibiteur compétitif sélectif
de la tyrosine kinase Bcr-Abl. Il se fixe à proximité du site de fixation de
l’ATP sur la protéine Bcr-Abl.
MAIS
apparition de résistance chez 28% des patients

5
Comparaison du métabolome de cellules sensibles (M0) ou
résistantes à l’imatinib (M2)
-10
-5
0
5
10
-10 -5 0 5 10
t[2]
t[1]
M0
M2
-0,20
-0,15
-0,10
-0,05
-0,00
0,05
-0,22 -0,20 -0,18 -0,16 -0,14 -0,12 -0,10 -0,08 -0,06 -0,04 -0,02 -0,00 0,02 0,04 0,06 0,08 0,10 0,12 0,14 0,16 0,18 0,20
w*c
[2]
w*c[1]
ATP
Phe
Tyr
Tyr
Fumarate
PC
PC+Lac
Lac
GSHox
GSHox
GSHred GSH+Asp
Asp
Asp
GSH
Ala+PC
Glu
GSHred
GSHred
GSH
GSH
GSHred
Gly
GSHox
Val+GSHox
Val
GSHox
Bet
GPC
PC
Cho
Tau
GSHox GSHox
GSHox
GSHred
GSHred
GSHred
Asp Asp+?? Asp
Malate Malate+Cit
Cit
Malate Malate+Cit
Cit
Cit Cit Asp Asp+Cit
Asp
GSH
GSH
GSH
GSH
Succinate
Glu
Val
Glu
Acetate
Glu
Ala
Lac
Val
Val
Ile Ile Leu
Leu+Val
Ile
Leu
Val Ile
Val
PLS-DA
Score plot (individus) Loading plot (variables)
Q2 = 0,969
CV-ANOVA = 4,0.10-8
6
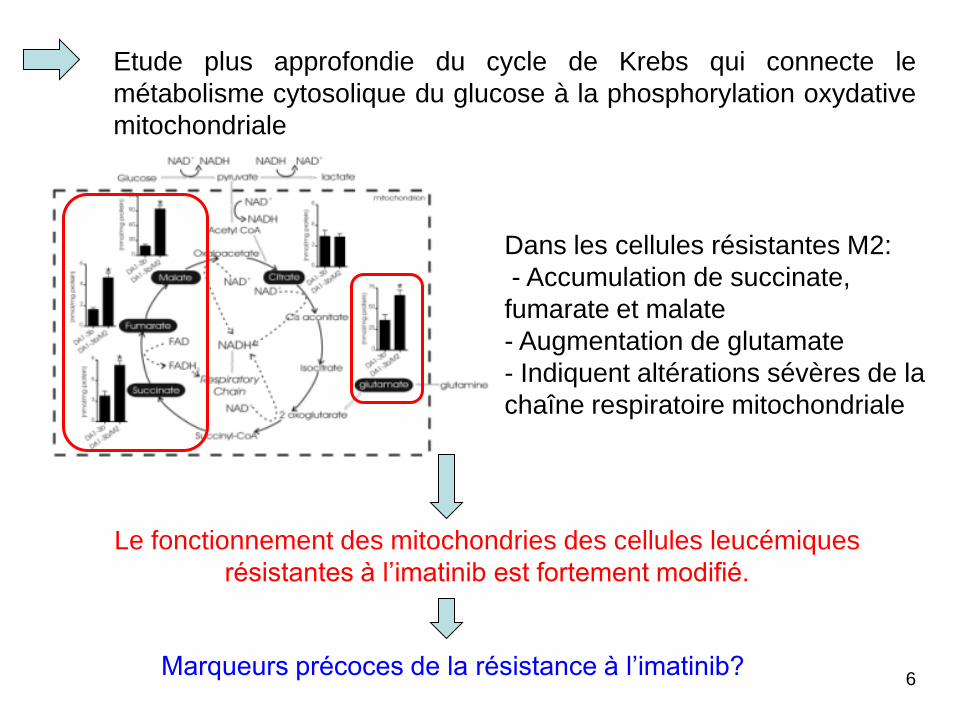
Etude plus approfondie du cycle de Krebs qui connecte le
métabolisme cytosolique du glucose à la phosphorylation oxydative
mitochondriale
Dans les cellules résistantes M2:
- Accumulation de succinate,
fumarate et malate
- Augmentation de glutamate
- Indiquent altérations sévères de la
chaîne respiratoire mitochondriale
Le fonctionnement des mitochondries des cellules leucémiques
résistantes à l’imatinib est fortement modifié.
Marqueurs précoces de la résistance à l’imatinib?
7
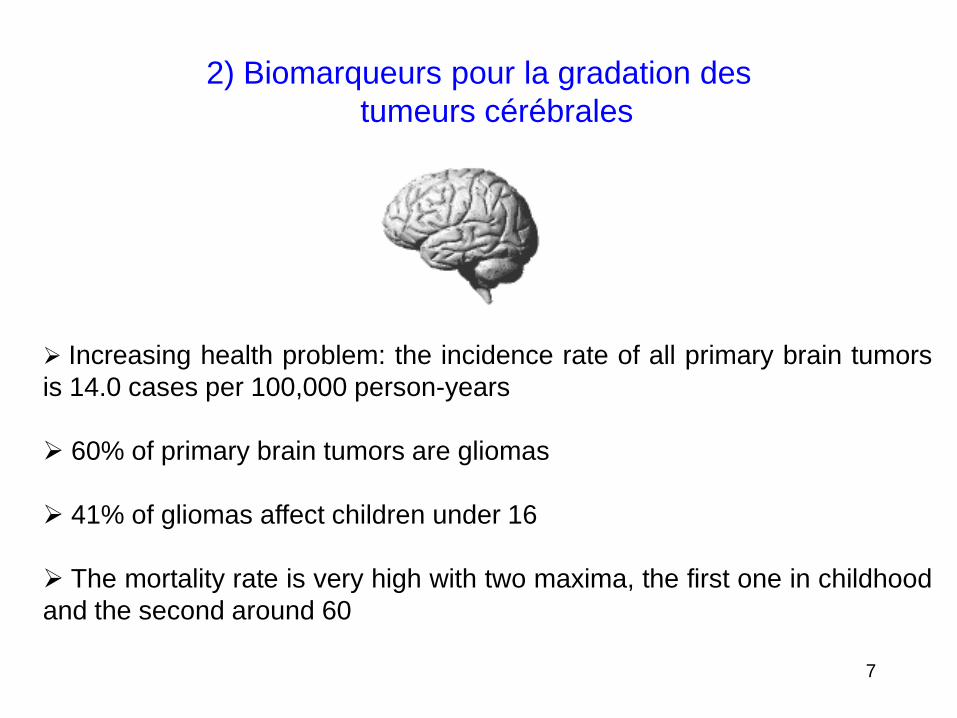
2) Biomarqueurs pour la gradation des
tumeurs cérébrales
Increasing health problem: the incidence rate of all primary brain tumors
is 14.0 cases per 100,000 person-years
60% of primary brain tumors are gliomas
41% of gliomas affect children under 16
The mortality rate is very high with two maxima, the first one in childhood
and the second around 60

Recent significant advances in the treatment of these tumors:
- new antitumor drugs (temozolomide)
- radiotherapy with a better codification of protocols
- surgery with the use of computerized guiding systems
Efficacy of these treatments related to an accurate diagnosis
The diagnosis of brain tumors is only based on the histological
evaluation of cell morphological changes
Despite international efforts to standardize tumor evaluation criteria, the
morphologic classification of human brain tumors can lead to variable
interpretations
8
In addition to morphological changes, tumor tissues have an altered
metabolism
Metabolic changes occur before cell modifications observed
histologically
Tumor metabolism changes could help to establish biochemical
criteria allowing a more accurate tumor classification
9
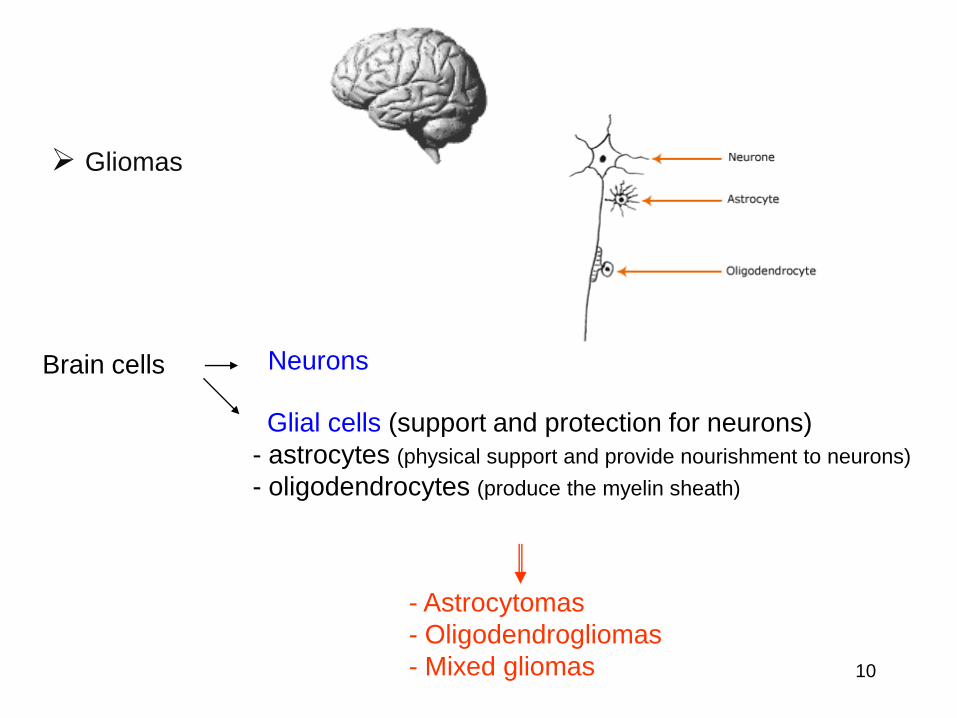
Gliomas
Brain cells Neurons
Glial cells (support and protection for neurons)
- astrocytes (physical support and provide nourishment to neurons)
- oligodendrocytes (produce the myelin sheath)
- Astrocytomas
- Oligodendrogliomas
- Mixed gliomas
10

WHO classification of gliomas grade of malignancy
II
III
Oligoastrocytoma (OAs)
Anaplastic oligoastrocytoma (AOAs)
Mixed tumors
II
III
Oligodendroglioma (OL)
Anaplastic oligodendroglioma (AO)
Oligodendroglial tumors
II
III
IV
Astrocytoma (AII)
Anaplastic astrocytoma (AA)
Glioblastoma (GBM)
WHO grade Astrocyte tumors
Slow evolution tumors called low grade (LG): grades I and II grade
II
Fast evolution tumors called high grade (HG): grades III and IV
11
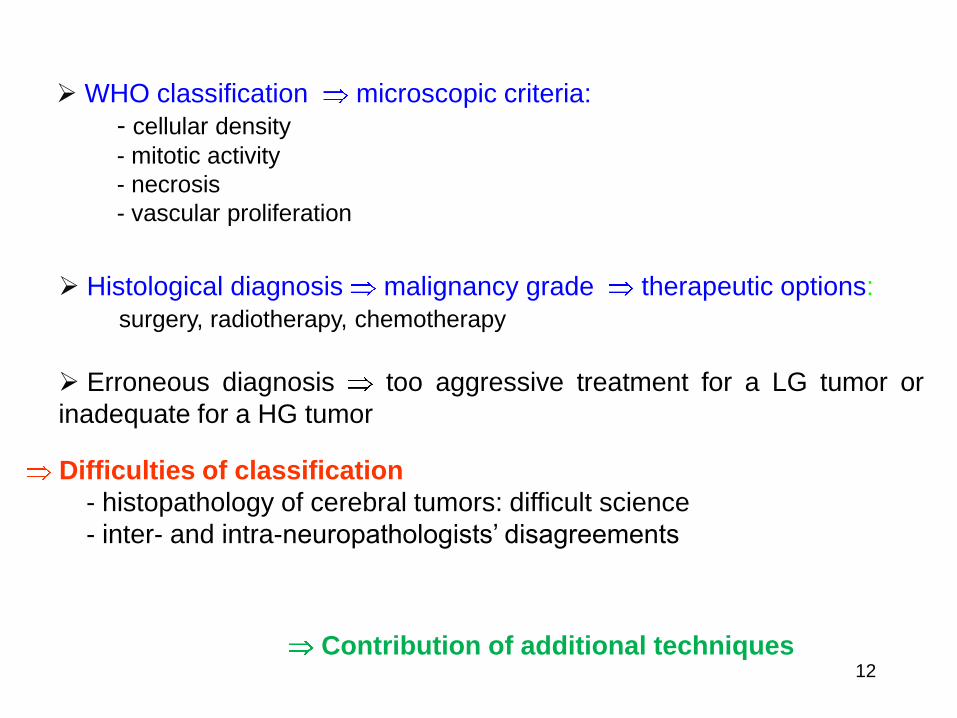
WHO classification microscopic criteria:
- cellular density
- mitotic activity
- necrosis
- vascular proliferation
Histological diagnosis malignancy grade therapeutic options:
surgery, radiotherapy, chemotherapy
Erroneous diagnosis too aggressive treatment for a LG tumor or
inadequate for a HG tumor
Difficulties of classification
- histopathology of cerebral tumors: difficult science
- inter- and intra-neuropathologists’ disagreements
Contribution of additional techniques 12
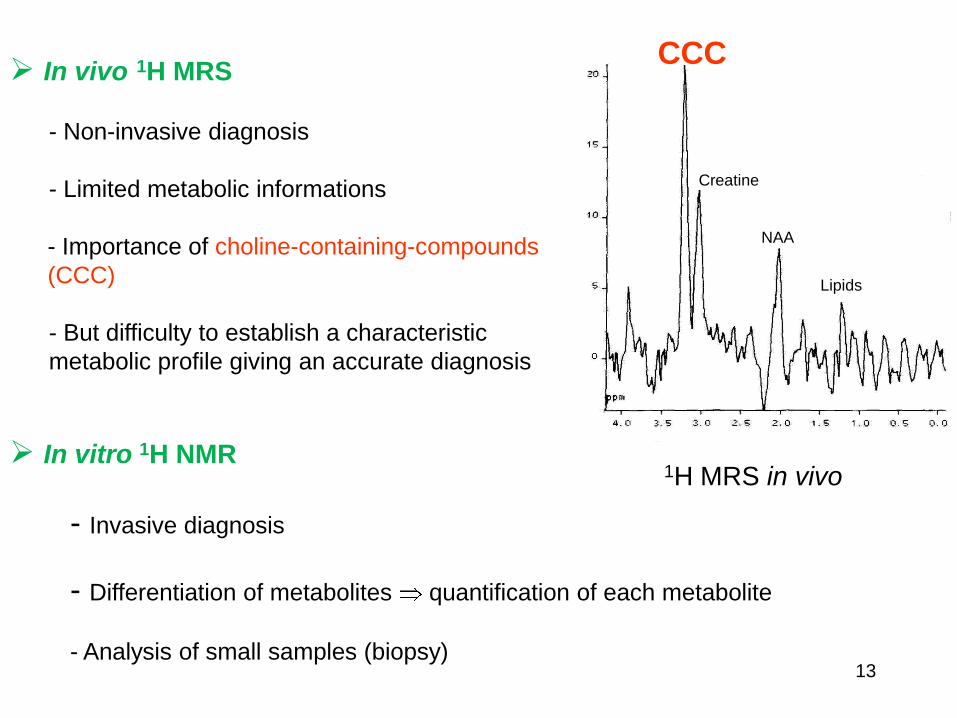
CCC In vivo 1H MRS
- Non-invasive diagnosis
- Limited metabolic informations
- Importance of choline-containing-compounds
(CCC)
- But difficulty to establish a characteristic
metabolic profile giving an accurate diagnosis
In vitro 1H NMR
- Invasive diagnosis
- Differentiation of metabolites quantification of each metabolite
- Analysis of small samples (biopsy)
Creatine
NAA
Lipids
1H MRS in vivo
13

THE BIOPSY
Biopsy in stereotactic condition
CHU Toulouse-Purpan
Sample for the diagnosis
Dr Jean SABATIER
14

1H NMR
Lactate
Acetate
NAA
Glutamate
Glutamine
Succinate
NAA
NAA
Lactate
m-inositol
Creatine
m-inositol
s -inositol Taurine
Creatine
GPC
PC Cho
m-inositol
Beta
NAAG
15

PATIENTS
107
SAMPLES
110
76 HG - 46 GBM (IV)
- 13 AA (III)
- 11 AO (III)
- 6 HG
34 LG - 21 OL (II)
- 9 AII
- 3 OAs (II)
- 1 BG
24 serial - 15 GBM (IV)
- 5 AA (III)
- 3 AO (III)
- 1 HG
9 serial
- 5 OL (II)
- 2 AII (II)
- 2 OAs (II)
Questions: with 1H NMR
- Is it possible to determine the grade of gliomas ?
- Is it possible to establish a characteristic profile for a type of tumor ?
- Are there metabolic variations within a tumor ?
16

Question 1 Is it possible to determine the grade of gliomas ?
GPC
PC
Cho
HG
LG
GPC
PC
Cho
BG
0
10
20
30
40
50
60
70
80
% GPC % PC % Cho
%
HG
0
10
20
30
40
50
60
70
% GPC % PC % Cho
%
32 8%
mol /g 0,3 0,2
54 9% 0,5 0,3
14 7% 0,1 0,1
62 9%
mol /g 0,5 0,3
27 6% 0,2 0,2
11 6% 0,1 0,1
BG
0
10
20
30
40
50
60
70
80
% GPC % PC % Cho
%
HG
0
10
20
30
40
50
60
70
% GPC % PC % Cho
%
LG
0
10
20
30
40
50
60
70
80
% GPC % PC % Cho
%
HG
0
10
20
30
40
50
60
70
% GPC % PC % Cho
%
32 8%
mol /g 0.3 0.2
54 9% 0.5 0.3
14 7% 0.1 0.1
62 9%
mol /g 0.5 0.3
27 6% 0.2 0,2
11 6% 0,1 0,1
BG
0
10
20
30
40
50
60
70
80
% GPC % PC % Cho
%
HG
0
10
20
30
40
50
60
70
% GPC % PC % Cho
%
BG
0
10
20
30
40
50
60
70
80
% GPC % PC % Cho
%
BG
0
10
20
30
40
50
60
70
80
% GPC % PC % Cho
%
HG
0
10
20
30
40
50
60
70
% GPC % PC % Cho
%
HG
0
10
20
30
40
50
60
70
% GPC % PC % Cho
%
32 8%
mol /g 0,3 0,2
54 9% 0,5 0,3
14 7% 0,1 0,1
62 9%
mol /g 0,5 0,3
27 6% 0,2 0,2
11 6% 0,1 0,1
BG
0
10
20
30
40
50
60
70
80
% GPC % PC % Cho
%
BG
0
10
20
30
40
50
60
70
80
% GPC % PC % Cho
%
HG
0
10
20
30
40
50
60
70
% GPC % PC % Cho
%
HG
0
10
20
30
40
50
60
70
% GPC % PC % Cho
%
LG
0
10
20
30
40
50
60
70
80
% GPC % PC % Cho
%
LG
0
10
20
30
40
50
60
70
80
% GPC % PC % Cho
%
HG
0
10
20
30
40
50
60
70
% GPC % PC % Cho
%
HG
0
10
20
30
40
50
60
70
% GPC % PC % Cho
%
32 8%
mol /g 0.3 0.2
54 9% 0.5 0.3
14 7% 0.1 0.1
62 9%
mol /g 0.5 0.3
27 6% 0.2 0,2
11 6% 0,1 0,1
17
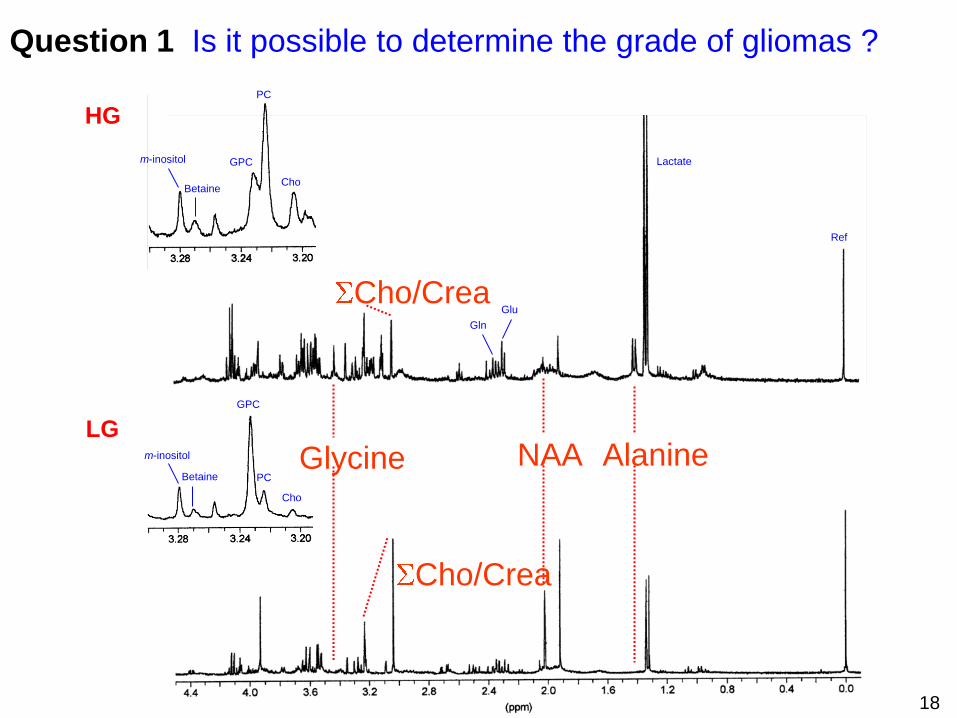
Question 1 Is it possible to determine the grade of gliomas ?
Glu
Gln
Ref
Lactate
HG
GPC
PC
Cho
LG m-inositol
GPC
Cho
PC
Betaine
m-inositol
Betaine
Alanine NAA Glycine
Cho/Crea
Cho/Crea
18
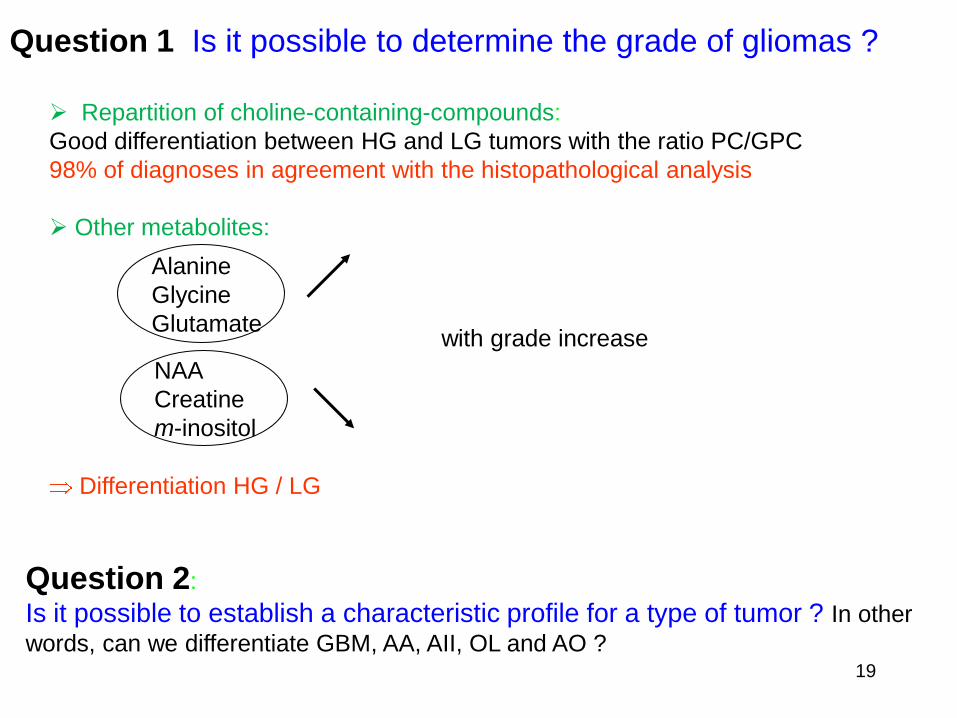
Question 1 Is it possible to determine the grade of gliomas ?
Repartition of choline-containing-compounds:
Good differentiation between HG and LG tumors with the ratio PC/GPC
98% of diagnoses in agreement with the histopathological analysis
Other metabolites:
Differentiation HG / LG
Alanine
Glycine
Glutamate
NAA
Creatine
m-inositol
with grade increase
Question 2:
Is it possible to establish a characteristic profile for a type of tumor ? In other
words, can we differentiate GBM, AA, AII, OL and AO ?
19

Question 2 DIFFERENTIATION OF ASTROCYTOMAS
Glu
Gln
Ref
Lactate
GPC
PC
Cho
Acetate
GPC
PC
Cho
PC Cho
GPC
GBM
(IV)
AA
(III)
AII
(II)
Differentiation
between GBM and
AA:
- Alanine
- Glycine
- NAA
Cho/Crea
Differentiation
between HG (GBM,
AA) and LG (AII):
- Choline profile
NAA Alanine Glycine
20

Question 2 DIFFERENTIATION OF OLIGODENDROGLIOMAS
GPC
PC
Cho
AO
(III)
Ref
Lactate
Gln Glu
GPC
PC
Cho
m-inositol
OL
(II) m-inositol
Acetate
Differentiation
between AO and OL:
- Alanine
- NAA
- Cho/Crea
- Glycine
- Choline profile
Alanine NAA Glycine
Cho/Crea
21
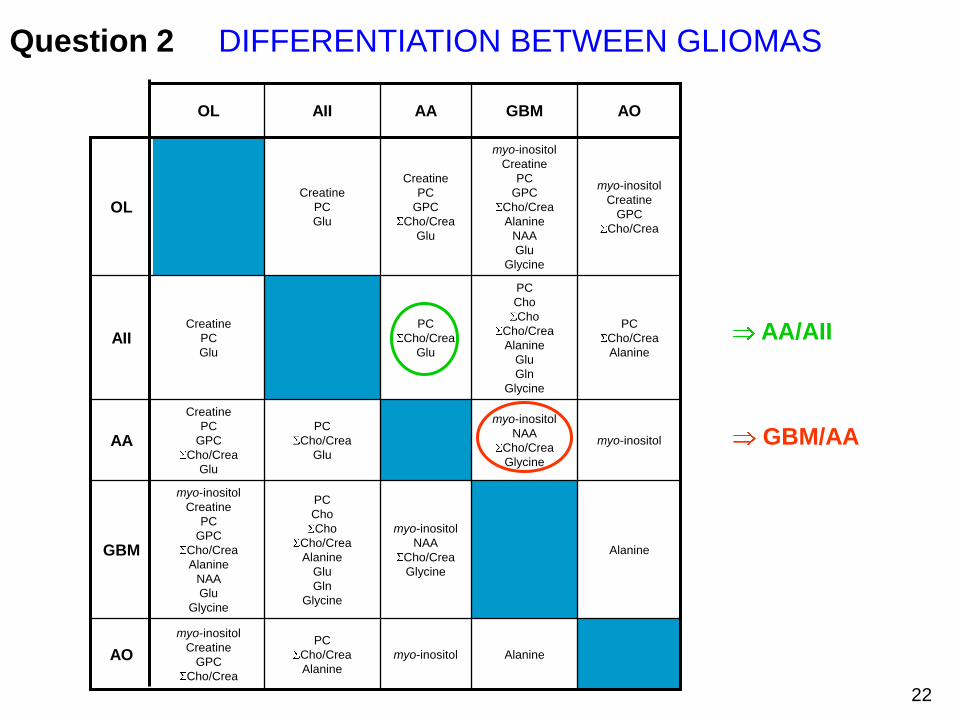
Question 2 DIFFERENTIATION BETWEEN GLIOMAS
Alanine myo-inositol
PC
Cho/Crea
Alanine
myo-inositol
Creatine
GPC
Cho/Crea
AO
Alanine
myo-inositol
NAA
Cho/Crea
Glycine
PC
Cho
Cho
Cho/Crea
Alanine
Glu
Gln
Glycine
myo-inositol
Creatine
PC
GPC
Cho/Crea
Alanine
NAA
Glu
Glycine
GBM
myo-inositol
myo-inositol
NAA
Cho/Crea
Glycine
PC
Cho/Crea
Glu
Creatine
PC
GPC
Cho/Crea
Glu
AA
PC
Cho/Crea
Alanine
PC
Cho
Cho
Cho/Crea
Alanine
Glu
Gln
Glycine
PC
Cho/Crea
Glu
Creatine
PC
Glu AII
myo-inositol
Creatine
GPC
Cho/Crea
myo-inositol
Creatine
PC
GPC
Cho/Crea
Alanine
NAA
Glu
Glycine
Creatine
PC
GPC
Cho/Crea
Glu
Creatine
PC
Glu OL
AO GBM AA AII OL
AA/AII
GBM/AA
22
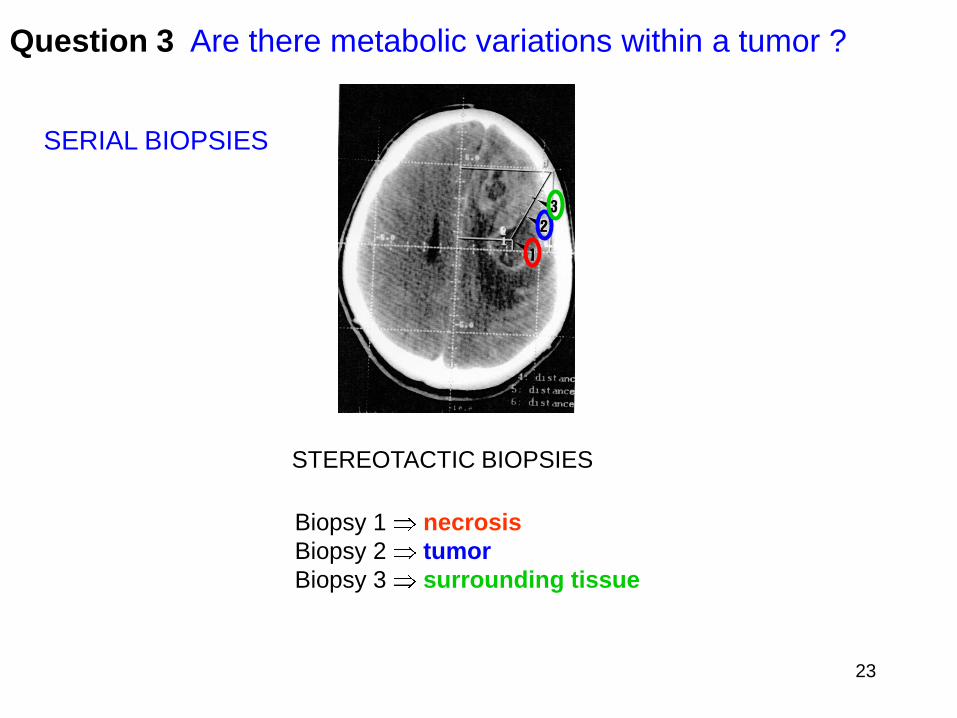
Question 3 Are there metabolic variations within a tumor ?
STEREOTACTIC BIOPSIES
Biopsy 1 necrosis
Biopsy 2 tumor
Biopsy 3 surrounding tissue
SERIAL BIOPSIES
23

Question 3 Are there metabolic variations within a tumor ?
Biopsy n 1:
necrosis
Biopsy n 2:
tumor
Biopsy n 3:
surrounding tissue Alanine
NAA
GPC
PC
Cho
GPC
PC
Cho
Cho/Crea
HG
Biopsy n 1:
tumor
Biopsy n 2:
surrounding tissue
GPC
GPC
PC
PC
Cho
Cho
NAA
LG
Cho/Crea
24

Question 3 Are there metabolic variations within a tumor ?
Confirms previous observations on single biopsies:
- Ratio PC/GPC tumor or non-tumor tissue
- Alanine and Glycine with the tumoral nature of the tissue
- NAA with the tumoral nature of the tissue
- Cho/Crea with the tumoral nature of the tissue
Conclusion
In vitro 1H NMR
Metabolic abnormalities help in the diagnosis of
gliomas
25
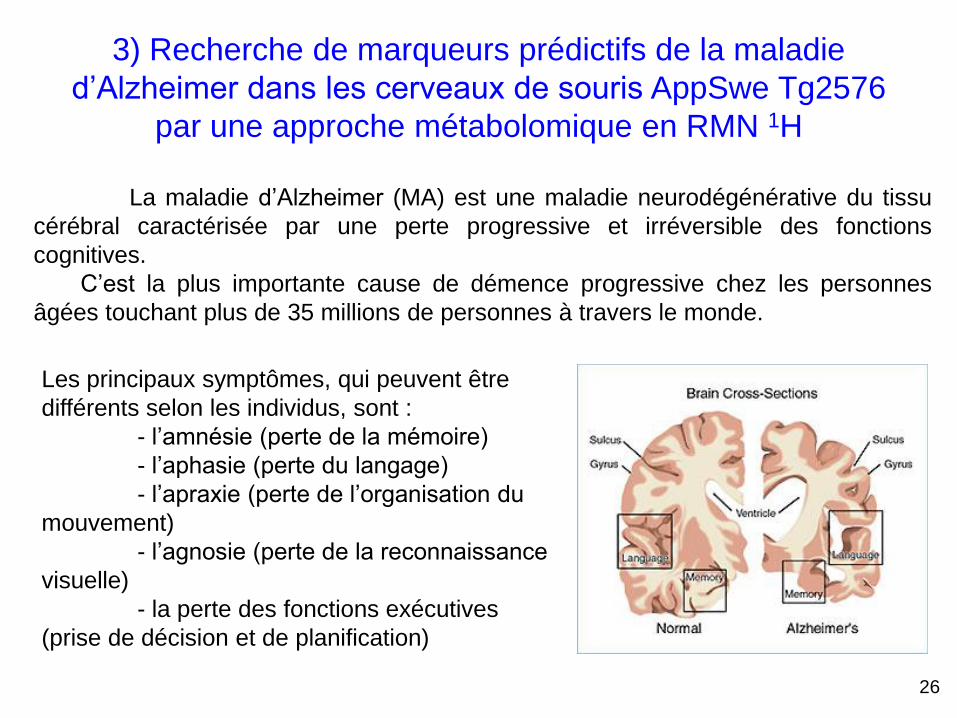
3) Recherche de marqueurs prédictifs de la maladie
d’Alzheimer dans les cerveaux de souris AppSwe Tg2576
par une approche métabolomique en RMN 1H
La maladie d’Alzheimer (MA) est une maladie neurodégénérative du tissu
cérébral caractérisée par une perte progressive et irréversible des fonctions
cognitives.
C’est la plus importante cause de démence progressive chez les personnes
âgées touchant plus de 35 millions de personnes à travers le monde.
Les principaux symptômes, qui peuvent être
différents selon les individus, sont :
- l’amnésie (perte de la mémoire)
- l’aphasie (perte du langage)
- l’apraxie (perte de l’organisation du
mouvement)
- l’agnosie (perte de la reconnaissance
visuelle)
- la perte des fonctions exécutives
(prise de décision et de planification)
26
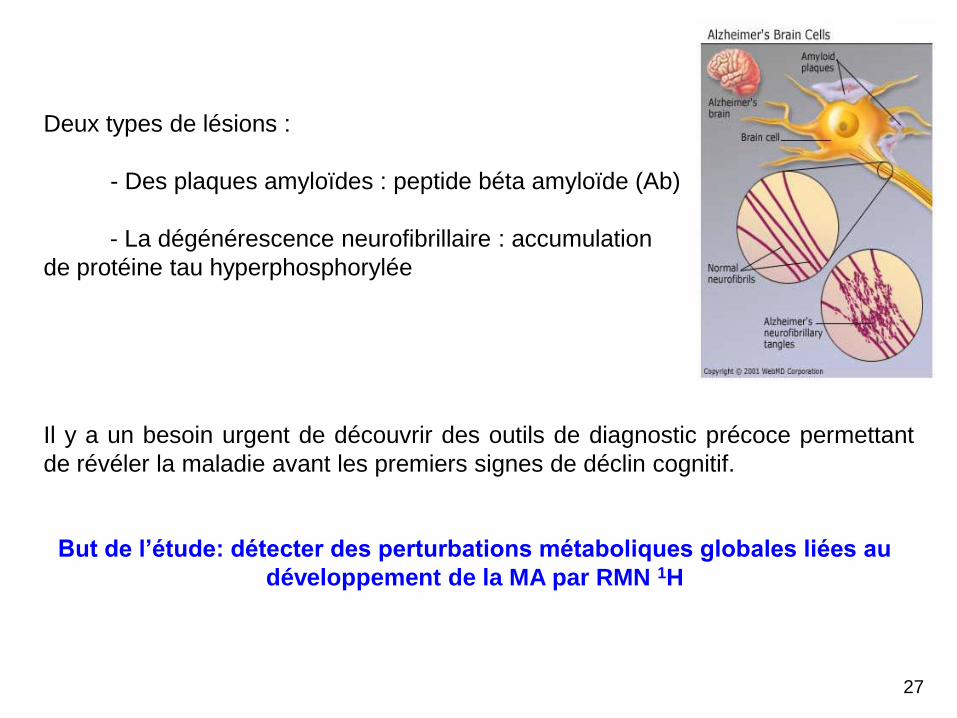
Deux types de lésions :
- Des plaques amyloïdes : peptide béta amyloïde (Ab)
- La dégénérescence neurofibrillaire : accumulation
de protéine tau hyperphosphorylée
Il y a un besoin urgent de découvrir des outils de diagnostic précoce permettant
de révéler la maladie avant les premiers signes de déclin cognitif.
But de l’étude: détecter des perturbations métaboliques globales liées au
développement de la MA par RMN 1H
27

La souris transgénique Tg2576 est l’un des modèles de souris le mieux caractérisé de la MA. Il
surexprime le gène humain de la protéine précurseur amyloïde.
Maladie d’Alzheimer: souris Tg2576
Hippocampe Cortex rhinal
Souris contrôle Souris contrôle Souris transgénique
âgée de 11 mois
Souris transgénique
âgée de 11 mois
Comportement et dépôts amyloïdes
1 et 3 mois
11 mois
6 mois
Pas d’effet de comportement
Pas de dépôts amyloïdes
Effet de comportement
Pas de dépôts amyloïdes
Effet de comportement
Dépôts amyloïdes
28

Echantillons
Les animaux sont sacrifiés par dislocation
cervicale. Le cortex fontal, le cortex rhinal,
l’hippocampe, le cerveau médian et le cervelet
sont prélevés et directemement placés dans
l’azote liquide et stockés à -80 C jusqu’à
l’extraction.
Nombre de souris mâles 1 mois 3 mois 6 mois 11 mois
Contrôle (Tg2576-) 12 11 12 9
Transgénique (Tg2576+) 12 9 9 9
83 souris = 410 échantillons
29
Extraction

Spectre RMN 1H (région 0-5 ppm) d’un extrait aqueux de cortex frontal
(14.1 mg) d’une souris contrôle AppSwe Tg2576-
Attributions RMN
Conception de la matrice de données
Bucketing, intégration, normalisation, centrage sur la moyenne
Analyses univariées et multivariées
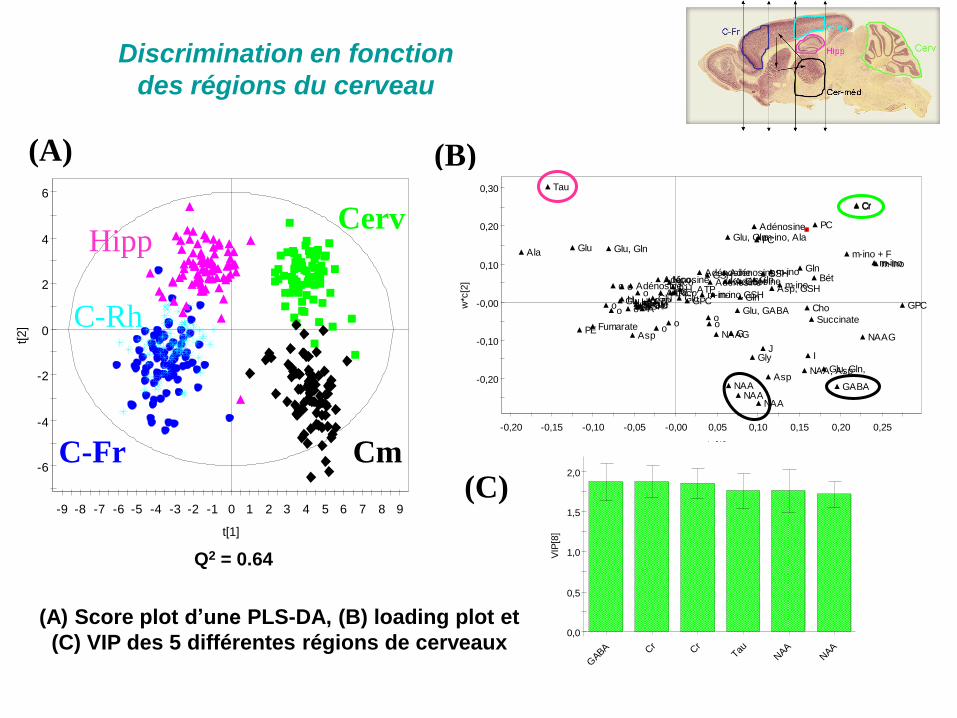
Discrimination en fonction
des régions du cerveau
(A) Score plot d’une PLS-DA, (B) loading plot et
(C) VIP des 5 différentes régions de cerveaux
(B) (A)
-0,20
-0,10
-0,00
0,10
0,20
0,30
-0,20 -0,15 -0,10 -0,05 -0,00 0,05 0,10 0,15 0,20 0,25
w*c
[2]
w *c[1]
Matricepartie_de_cerveau_simca.M8 (PLS-DA)
w*c[Comp. 1]/w*c[Comp. 2]
Colored according to model terms
R2X[1] = 0,143472 R2X[2] = 0,0779111
X
Y
NicoNico
HATPL
AdénosineH, ATP
AdénosineK
JI
oo
oo
Nico
o
oFumarate
H, ATP
Adénosine
G
oo
oo
oo
ooo o
NAA
m-ino
PC
m-inom-ino + F
Cr
Adénosine,
AdénosineAdénosine,
Adénosine Asp, GSH
Asp
GPC
m-ino, Ala
m-ino
Glu
GSH Gln
Gly
GlnGSH
m-ino,GSHm-ino
Bét
m-inoGPC
PC
Cho
PE
Tau
Cr
GABA
C
Asp
NAA
CitrateB
NAA, Asp
GSH
Succinate
GSH
Gln
Glu, GABA
NAAG
AGlu
Glu
NAAG
Glu Glu
NAA
Glu, Gln
Glu, Gln
Glu, Gln,
Ala
SIMCA-P+ 12.0.1 - 2010-04-27 19:04:19 (UTC+1)
0,0
0,5
1,0
1,5
2,0
GABA C
rCr
TauNAA
NAA
VIP
[8]
Var ID (Name)SIMCA-P+ 12.0.1 - 2010-04-27 19:05:47 (UTC+1)
(C) -6
-4
-2
0
2
4
6
-9 -8 -7 -6 -5 -4 -3 -2 -1 0 1 2 3 4 5 6 7 8 9
t[2]
t[1]
Matricepartie_de_cerveau_simca.M8 (PLS-DA)
t[Comp. 1]/t[Comp. 2]
Colored according to classes in M8
R2X[1] = 0,143472 R2X[2] = 0,0779111 Ellipse: Hotelling T2 (0,95)
Cerv
Cf
Cm
Cr
Hipp
SIMCA-P+ 12.0.1 - 2010-04-27 19:08:42 (UTC+1)
Cerv
Cm C-Fr
C-Rh
Hipp
Q2 = 0.64
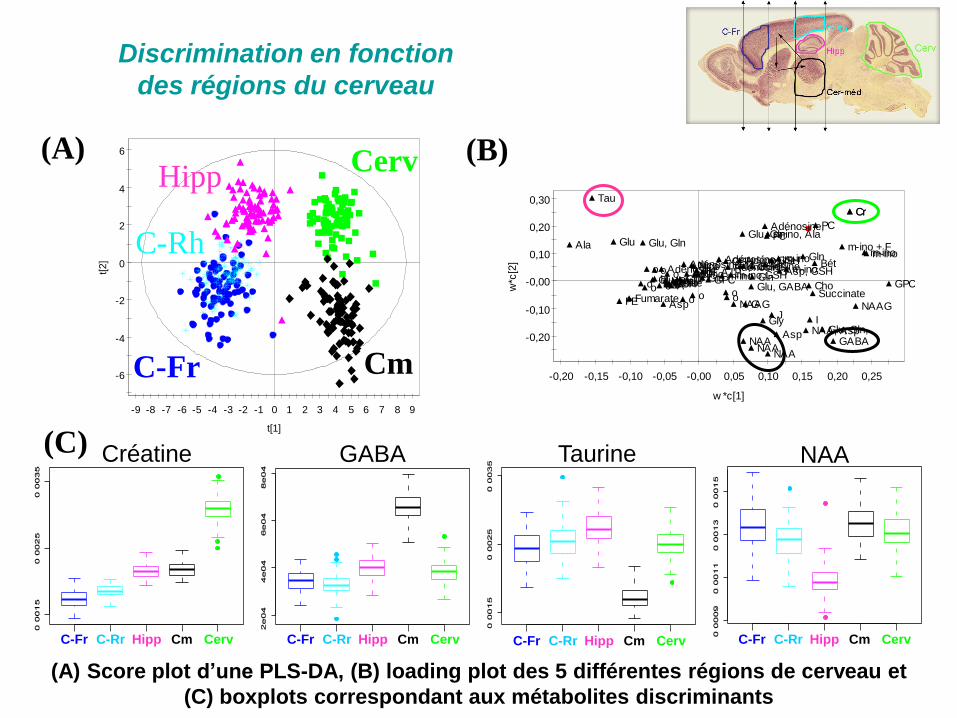
(A) Score plot d’une PLS-DA, (B) loading plot des 5 différentes régions de cerveau et
(C) boxplots correspondant aux métabolites discriminants
(B) (A)
(C)
-6
-4
-2
0
2
4
6
-9 -8 -7 -6 -5 -4 -3 -2 -1 0 1 2 3 4 5 6 7 8 9
t[2]
t[1]
Matricepartie_de_cerveau_simca.M8 (PLS-DA)
t[Comp. 1]/t[Comp. 2]
Colored according to classes in M8
R2X[1] = 0,143472 R2X[2] = 0,0779111 Ellipse: Hotelling T2 (0,95)
Cerv
Cf
Cm
Cr
Hipp
SIMCA-P+ 12.0.1 - 2010-04-27 19:08:42 (UTC+1)
Cerv
Cm C-Fr
C-Rh
Hipp
-0,20
-0,10
-0,00
0,10
0,20
0,30
-0,20 -0,15 -0,10 -0,05 -0,00 0,05 0,10 0,15 0,20 0,25
w*c
[2]
w *c[1]
Matricepartie_de_cerveau_simca.M8 (PLS-DA)
w*c[Comp. 1]/w*c[Comp. 2]
Colored according to model terms
R2X[1] = 0,143472 R2X[2] = 0,0779111
X
Y
NicoNico
H ATPLAdénosineH, ATP
AdénosineK
J I
o oo o
Nicoo
oFumarate
H, ATP
Adénosine
G
oo
ooo o
ooo o
NAA
m-ino
PC
m-inom-ino + F
Cr
Adénosine,
AdénosineAdénosine,Adénosine Asp, GSH
Asp
GPC
m-ino, Ala
m-ino
Glu
GSH Gln
Gly
GlnGSH
m-ino,GSHm-ino
Bét
m-inoGPC
PC
Cho
PE
Tau
Cr
GABA
C
Asp
NAA
CitrateB
NAA, Asp
GSH
Succinate
GSHGln
Glu, GABA
NAAG
AGluGlu
NAAG
Glu Glu
NAA
Glu, GlnGlu, Gln
Glu, Gln,
Ala
SIMCA-P+ 12.0.1 - 2010-04-27 19:08:12 (UTC+1)
Créatine GABA Taurine NAA
C-Fr C-Rr Hipp Cm Cerv C-Fr C-Rr Hipp Cm Cerv C-Fr C-Rr Hipp Cm Cerv C-Fr C-Rr Hipp Cm Cerv
Discrimination en fonction
des régions du cerveau

Souris contrôles Souris transgéniques
Score plots de PLS-DA de l’hippocampe (A) dans les souris contrôles et
(B) dans les souris transgéniques et leurs boxplots correspondants
(B) (A)
Discrimination en fonction de l’âge
(1,3,6 ou 11 mois) dans l’hippocampe
-8
-6
-4
-2
0
2
4
6
8
-12 -10 -8 -6 -4 -2 0 2 4 6 8 10 12
t[2]
t[1]
1-3-6-11m_S_Hipp_simca.M7 (PLS-DA)
t[Comp. 1]/t[Comp. 2]
Colored according to classes in M7
R2X[1] = 0,244287 R2X[2] = 0,133653 Ellipse: Hotelling T2 (0,95)
11m
1m
3m
6m
SIMCA-P+ 12.0.1 - 2010-04-27 19:19:41 (UTC+1)
3m
1m
6m
11m
-8
-6
-4
-2
0
2
4
6
8
-12 -10 -8 -6 -4 -2 0 2 4 6 8 10 12
t[2]
t[1]
1-3-6-11m_T_Hipp_simca.M7 (PLS-DA)
t[Comp. 1]/t[Comp. 2]
Colored according to classes in M7
R2X[1] = 0,211517 R2X[2] = 0,116452 Ellipse: Hotelling T2 (0,95)
11m
1m
3m
6m
SIMCA-P+ 12.0.1 - 2010-04-27 19:27:49 (UTC+1)
3m
1m
6m
11m
1m 3m 6m 11m 1m 3m 6m 11m 1m 3m 6m 11m 1m 3m 6m 11m
1m 3m 6m 11m 1m 3m 6m 11m 1m 3m 6m 11m 1m 3m 6m 11m
Glutamate Taurine
Créatine NAA
Glutamate Taurine
Créatine NAA

Discrimination en fonction des souris
contrôles et transgéniques
-0,30
-0,20
-0,10
-0,00
0,10
-0,25 -0,20 -0,15 -0,10 -0,05 -0,00 0,05 0,10 0,15 0,20
w*c
[2]
w *c[1]
S-T_6m_Hipp_simca.M5 (PLS-DA)
w*c[Comp. 1]/w*c[Comp. 2]
Colored according to model terms
R2X[1] = 0,228069 R2X[2] = 0,181743
X
Y
oo
H
ATPL
Adénosine
H, ATP Adénosine
K
J
Io
oo
o
o o
oFumarate
H, ATP Adénosine
G ooo
ooo
o
o
o o
NAA
m-inoPC
m-ino
Cr
Adénosine,
Adénosine
Adénosine,
AdénosineAsp, GSHAsp
GPC
m-ino, Alam-ino
Glu
GSHGln
Gly
Gln
GSHm-ino,GSHm-inoBétm-ino
GPC
PC
Cho
PE
TauCr
GABA
C
Asp
NAA
Citrate
B
NAA, Asp
GSH
Succinate
GSH
Gln
Glu, GABA
oA
Glu
GluGlu
Glu GluNAA Glu, Gln
Glu, Gln
Glu, Gln,
Ala
SIMCA-P+ 12.0.1 - 2010-04-28 17:37:23 (UTC+1)
-0,5
0,0
0,5
1,0
1,5
2,0
2,5
Cr
Cr
TauNAA
Glu
NAA
VIP
[4]
Var ID (Name)SIMCA-P+ 12.0.1 - 2010-04-28 17:38:26 (UTC+1)
Hippocampe
6 mois
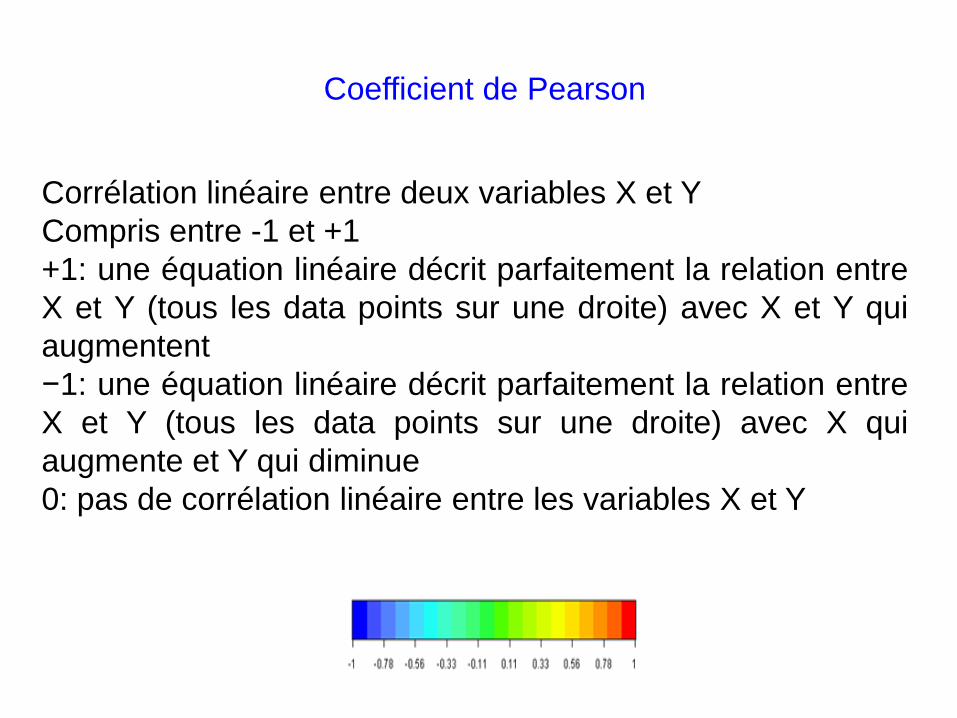
Coefficient de Pearson
Corrélation linéaire entre deux variables X et Y
Compris entre -1 et +1
+1: une équation linéaire décrit parfaitement la relation entre
X et Y (tous les data points sur une droite) avec X et Y qui
augmentent
−1: une équation linéaire décrit parfaitement la relation entre
X et Y (tous les data points sur une droite) avec X qui
augmente et Y qui diminue
0: pas de corrélation linéaire entre les variables X et Y

Tau Cr GABA Glu Gln NAA Asp PC GPC m-ino Ala Gly
Tau
Cr
GABA
Glu
Gln
NAA
Asp
Cho
PC
GPC
m-ino
Ala
Gly
PE
Bét
GSH
Succinate
Tau Cr GABA Glu Gln NAA Asp PC GPC m-ino Ala Gly
Tau
Cr
GABA
Glu
Gln
NAA
Asp
Cho
PC
GPC
m-ino
Ala
Gly
PE
Bét
GSH
Succinate
Tau Cr GABA Glu Gln NAA Asp PC GPC m-ino Ala Gly
Tau
Cr
GABA
Glu
Gln
NAA
Asp
Cho
PC
GPC
m-ino
Ala
Gly
PE
Bét
GSH
Succinate
Tau Cr GABA Glu Gln NAA Asp PC GPC m-ino Ala Gly
Tau
Cr
GABA
Glu
Gln
NAA
Asp
Cho
PC
GPC
m-ino
Ala
Gly
PE
Bét
GSH
Succinate
Tau Cr GABA Glu Gln NAA Asp PC GPC m-ino Ala Gly
Tau
Cr
GABA
Glu
Gln
NAA
Asp
Cho
PC
GPC
m-ino
Ala
Gly
PE
Bét
GSH
Succinate
Tau Cr GABA Glu Gln NAA Asp PC GPC m-ino Ala Gly
Tau
Cr
GABA
Glu
Gln
NAA
Asp
Cho
PC
GPC
m-ino
Ala
Gly
PE
Bét
GSH
Succinate
Tau Cr GABA Glu Gln NAA Asp PC GPC m-ino Ala Gly
Tau
Cr
GABA
Glu
Gln
NAA
Asp
Cho
PC
GPC
m-ino
Ala
Gly
PE
Bét
GSH
Succinate
Tau Cr GABA Glu Gln NAA Asp PC GPC m-ino Ala Gly
Tau
Cr
GABA
Glu
Gln
NAA
Asp
Cho
PC
GPC
m-ino
Ala
Gly
PE
Bét
GSH
Succinate
Tau Cr GABA Glu Gln NAA Asp PC GPC m-ino Ala Gly
Tau
Cr
GABA
Glu
Gln
NAA
Asp
Cho
PC
GPC
m-ino
Ala
Gly
PE
Bét
GSH
Succinate
Tau Cr GABA Glu Gln NAA Asp PC GPC m-ino Ala Gly
Tau
Cr
GABA
Glu
Gln
NAA
Asp
Cho
PC
GPC
m-ino
Ala
Gly
PE
Bét
GSH
Succinate
Tau Cr GABA Glu Gln NAA Asp PC GPC m-ino Ala Gly
Tau
Cr
GABA
Glu
Gln
NAA
Asp
Cho
PC
GPC
m-ino
Ala
Gly
PE
Bét
GSH
Succinate
Tau Cr GABA Glu Gln NAA Asp PC GPC m-ino Ala Gly
Tau
Cr
GABA
Glu
Gln
NAA
Asp
Cho
PC
GPC
m-ino
Ala
Gly
PE
Bét
GSH
Succinate
Tau Cr GABA Glu Gln NAA Asp PC GPC m-ino Ala Gly
Tau
Cr
GABA
Glu
Gln
NAA
Asp
Cho
PC
GPC
m-ino
Ala
Gly
PE
Bét
GSH
Succinate
Tau Cr GABA Glu Gln NAA Asp PC GPC m-ino Ala Gly
Tau
Cr
GABA
Glu
Gln
NAA
Asp
Cho
PC
GPC
m-ino
Ala
Gly
PE
Bét
GSH
Succinate
Tau Cr GABA Glu Gln NAA Asp PC GPC m-ino Ala Gly
Tau
Cr
GABA
Glu
Gln
NAA
Asp
Cho
PC
GPC
m-ino
Ala
Gly
PE
Bét
GSH
Succinate
Tau Cr GABA Glu Gln NAA Asp PC GPC m-ino Ala Gly
Tau
Cr
GABA
Glu
Gln
NAA
Asp
Cho
PC
GPC
m-ino
Ala
Gly
PE
Bét
GSH
Succinate
Cortex frontal
Cortex rhinal
Hippocampe
Cerveau médian
Cervelet
1 mois 3 mois 6 mois 11 mois

Hippocampe 6 mois

1 mois 3 mois 6 mois 11 mois
Hippocampe

6M
Glu, neurotransmetteur excitateur dans le
SNC, joue un rôle important dans le
développement du cerveau et dans les
processus tels que l’apprentissage, la
mémoire, l’activité sensorielle, le contrôle
du mouvement et la modulation de la
transmission synaptique
Hippocampe 6 mois
Glu, en concentration
élevée, est excitotoxique
Glu corrèle avec 5 métabolites
dont 3 (Tau, GABA et GSH) vont
contrer cette excitotoxicité
Augmentation de Glu provoque une augmentation du métabolisme énergétique (Cr)
Tau et GSH: effet contre le stress oxydant et protecteurs contre la neurotoxicité du Glu
GABA: AA inhibiteur protecteur quand excès de Glu
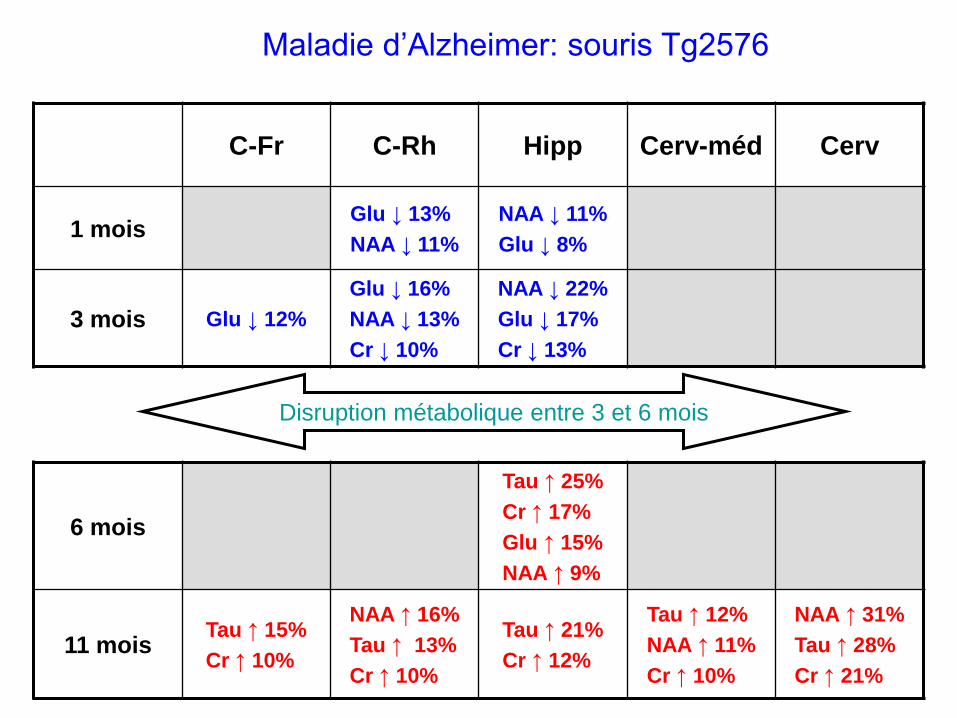
C-Fr C-Rh Hipp Cerv-méd Cerv
1 mois Glu ↓ 13%
NAA ↓ 11%
NAA ↓ 11%
Glu ↓ 8%
3 mois Glu ↓ 12%
Glu ↓ 16%
NAA ↓ 13%
Cr ↓ 10%
NAA ↓ 22%
Glu ↓ 17%
Cr ↓ 13%
6 mois
Tau ↑ 25%
Cr ↑ 17%
Glu ↑ 15%
NAA ↑ 9%
11 mois Tau ↑ 15%
Cr ↑ 10%
NAA ↑ 16%
Tau ↑ 13%
Cr ↑ 10%
Tau ↑ 21%
Cr ↑ 12%
Tau ↑ 12%
NAA ↑ 11%
Cr ↑ 10%
NAA ↑ 31%
Tau ↑ 28%
Cr ↑ 21%
Disruption métabolique entre 3 et 6 mois
Maladie d’Alzheimer: souris Tg2576