MTA 2015 Preliminary Budget
495
MTA 2015 Preliminary Budget July Financial Plan 2015-2018 Volume 2 July 2014
Transcript of MTA 2015 Preliminary Budget

MTA 2015Preliminary Budget
July Financial Plan 2015-2018
Volume 2July 2014

OVERVIEW
MTA 2015 PRELIMINARY BUDGET JULY FINANCIAL PLAN 2015-2018
VOLUME 2
The MTA’s July Plan is divided into two volumes: Volume 1 consists of financial schedule s supporting the complete MTA-Consolidated Financial Plan, including an Executive Summary, the baseline forecast (as detailed in Volume 2 and desc ribed below) and certain adjustments captured below the baseline. These “below-the-line” adjustments include: Fare/Toll Increases, MTA Initiatives, Polic y Actions, and MTA Re-estimates. Volume 1 also includes descriptions of the “below-the-line” actions as well as the required Certification by the Chai rman and Chief Executive Officer, and a description of the MTA Budget Process. Volume 2 includes MTA-Consolidated detailed financial and pos ition schedules as well as the narratives that s upport the baseline projections included in the 2014 Final Proposed Budget and the Financial Plan for 2015 through 2018. Also included are the Agency se ctions which incorporat e descriptions of Agency Programs with supporting baseline tables and required information related to the MTA Capital Program. The July 17th agreement between the LI RR and its major labor unions came too late to be included in Agency Baseline fo recasts (Volume 2). V olume I of this Plan captures an estimated financial impac t of this agreement that assumes the contract will be ratified and approved, and that a c omparable proposal will be accepted by the remaining unions at the LIRR and the unsigned unions at MNR.

TABLE OF CONTENTS VOLUME 2
l. MTA Consolidated 2015-2018 Financial Plan-Baseline 2015: Where the Dollars Come From and Where the Dollars Go……………….. l-1 2015-2018 Financial Plan: Statement of Operations by Category………………. l-2 2014-2017 Reconciliation to February Plan………………………………………… l-6 Farebox Recovery and Operating Ratios……………………………………………. l-7 ll. Major Assumptions Agency Baseline Assumptions………………………………………………………... ll-1 Subsidies………………………………………………………………………………… ll-35 Debt Service…………………………………………………………………………….. ll-71 Debt Service Affordability Statement…………………………………………………. ll-77 Positions (Headcount)………………………………………………………………….. ll-81 lll. Other MTA Consolidated Materials-Baseline 2015-2018 Consolidated Statements of Operations by Category: Accrued (Non-Reimbursable and Reimbursable), Cash, and Cash Conversion Detail……………………………………………………………. lll-1 Year-to-Year Changes by Category………………………………………………. lll-6 Non-Recurring Revenues and Savings, and MTA Reserves………………….. lll-7 lV. MTA Capital Program Information 2014 Commitment Goals by Agency………………………………………………… lV-1 2014-2017 Completions by Agency………………………………………………….. lV-17 Operating Impacts Exceeding $1 Million…………………………………………….. lV-31

V. Agency Financial Plans Bridges and Tunnels…………………………………………………………………… V-1 Capital Construction Company……………………………………………………..... V-33 Long Island Rail Road………………………………………………………………… V-51 Metro-North Railroad………………………………………………………………….. V-89 MTA Headquarters and Inspector General………………………………………….. V-147 First Mutual Transportation Assurance Co. (FMTAC)……………………………… V-199 New York City Transit…………………………………………………………………. V-211 MTA Bus Company…………………………………………………………………….. V-257 Staten Island Railway…………………………………………………………………. V-295

I. MTA Consolidated 2015-2018 Financial Plan- Baseline

Farebox Revenue $5,725Toll Revenue 1,655Other Revenue 644Dedicated Taxes 5,187State & Local Subsidies 1,078
Total $14,289
Payroll $4,614 NYCT/SIR $7,460Overtime 607 LIRR 1,413Health & Welfare 1,578 MNR 1,159Pension 1,330 MTABC 636Other Labor 282 HQ/FMTAC 446Non-Labor 3,334 B&T 490Debt Service 2,445 Debt Service 2,445
Total $14,189 MTA General Reserve 140Total $14,189
Note: The revenues and expenses reflected in these charts are on an accrued basis and exclude cash adjustments, carryover balances and those “below-the-line” adjustments that are captured in Volume I. Any comparison of revenues versus expenses will not directly correspond to the cash balances reflected in the Statement of Operations.
($ in millions) ($ in millions)
Expenses exclude Depreciation, OPEB obligation and Environmental Remediation.
1 MTA Capital Construction is not included in the above charts, as its budget contains reimbursable expenses only.
Where the Dollars Come From …
MTA 2015 Preliminary BudgetBaseline Before Below-the-Line Adjustments
Non-Reimbursable
By Revenue Source($ in millions)
Where the Dollars Go …
By Expense Category By MTA Agency 1
Farebox Revenue
40%
Toll Revenue
12%
Other Revenue4%
Dedicated Taxes36%
State & Local Subsidies
8%
Payroll33%
Overtime4%
Health & Welfare
11%Pension
9%
Other Labor2%
Non-Labor24%
Debt Service17%
By Expense Category
NYCT/SIR53%
LIRR10%
MNR8%
MTABC4%
HQ/FMTAC3%
B&T4%
Debt Service17%
MTA General Reserve
1%
By MTA Agency
I-1

LineNo.7 2014 20158 2013 Mid-Year Preliminary 9 Actual Forecast Budget 2016 2017 2018
10 Operating Revenue11 Farebox Revenue $5,507 $5,662 $5,725 $5,807 $5,858 $5,90412 Toll Revenue 1,645 1,651 1,655 1,665 1,670 1,678 13 Other Revenue 754 717 644 667 696 723 14 Capital and Other Reimbursements 0 0 0 0 0 015 Total Operating Revenue $7,906 $8,030 $8,024 $8,138 $8,225 $8,306
1617 Operating Expense
18 Labor Expenses:19 Payroll $4,254 $4,576 $4,614 $4,701 $4,813 $4,90420 Overtime 621 680 607 612 623 63521 Health & Welfare 896 995 1,070 1,136 1,220 1,31422 OPEB Current Payment 473 468 508 548 592 64423 Pensions 1,302 1,341 1,330 1,325 1,313 1,32724 Other-Fringe Benefits 689 617 616 637 662 68425 Reimbursable Overhead (321) (344) (335) (334) (328) (332)26 Sub-total Labor Expenses $7,912 $8,333 $8,410 $8,626 $8,896 $9,176
2728 Non-Labor Expenses:
29 Electric Power $493 $551 $514 $535 $608 $65630 Fuel 259 268 265 254 259 26831 Insurance 39 48 58 71 85 10132 Claims 300 204 215 217 225 22833 Paratransit Service Contracts 367 382 392 427 480 52334 Maintenance and Other Operating Contracts 497 591 630 659 637 63335 Professional Service Contracts 297 346 337 325 327 33736 Materials & Supplies 475 550 555 565 567 57037 Other Business Expenses 167 181 184 198 199 20938 Sub-total Non-Labor Expenses $2,894 $3,121 $3,149 $3,250 $3,387 $3,524
3940 Other Expense Adjustments:
41 Other $46 $45 $44 $48 $48 $4942 General Reserve 0 135 140 145 150 15543 Sub-total Other Expense Adjustments $46 $180 $184 $193 $198 $204
4445 Total Operating Expense before Non-Cash Liability Adj. $10,853 $11,634 $11,744 $12,068 $12,481 $12,904
4647 Depreciation $2,174 $2,291 $2,407 $2,473 $2,662 $2,71148 OPEB Obligation 1,920 1,950 2,036 2,120 2,207 2,29949 Environmental Remediation 14 8 6 6 6 65051 Total Operating Expense after Non-Cash Liability Adj. $14,961 $15,883 $16,193 $16,666 $17,356 $17,919
5253 Conversion to Cash Basis: Non-Cash Liability Adjs. $4,109 $4,249 $4,449 $4,599 $4,875 $5,0155455 Debt Service (excludes Service Contract Bonds) (2,299) (2,288) (2,445) (2,568) (2,753) (2,921)5657 Total Operating Expense with Debt Service $13,152 $13,922 $14,189 $14,636 $15,234 $15,825
5859 Dedicated Taxes and State/Local Subsidies $5,898 $6,179 $6,265 $6,499.0 $6,678 $6,8736061 Net Deficit After Subsidies and Debt Service $652 $286 $100 $2 ($331) ($646)
6263 Conversion to Cash Basis: GASB Account (86) (48) (0) 0 0 (10)64 Conversion to Cash Basis: All Other (481) (490) (518) (269) (389) (459)6566 CASH BALANCE BEFORE PRIOR-YEAR CARRYOVER $86 ($252) ($418) ($267) ($720) ($1,114)
($ in millions)MTA Consolidated Statement Of Operations By Category
July Financial Plan 2015-2018
METROPOLITAN TRANSPORTATION AUTHORITY
Non-Reimbursable
I-2

Line
No Non-Reimbursable 2014 2015
7 2013 Mid-Year Preliminary
8 Actual Forecast Budget 2016 2017 2018
9 Total Operating Revenue
10 New York City Transit $4,566 $4,616 $4,610 $4,692 $4,750 $4,80511 Bridges and Tunnels 1,667 1,673 1,672 1,682 1,687 1,695 12 Long Island Rail Road 693 702 707 711 715 71813 Metro-North Railroad 681 712 723 738 754 76614 MTA Bus Company 225 226 222 223 224 22515 MTA Headquarters 62 66 57 59 60 6216 Staten Island Railway 10 10 8 8 8 817 First Mutual Transportation Assurance Company 3 24 24 25 25 2618 Total $7,906 $8,030 $8,024 $8,138 $8,225 $8,306
19
20 Total Operating Expenses before Non-Cash Liability Adjs. 1
21 New York City Transit $6,984 $7,284 $7,410 $7,643 $7,926 $8,21122 Bridges and Tunnels 410 482 490 502 516 53423 Long Island Rail Road 1,307 1,467 1,413 1,437 1,510 1,58824 Metro-North Railroad 1,118 1,194 1,159 1,192 1,233 1,26825 MTA Bus Company 574 595 636 654 661 65526 MTA Headquarters 344 381 399 394 400 41327 Staten Island Railway 43 45 50 60 46 4828 First Mutual Transportation Assurance Company 28 7 2 (7) (10) (19)29 Other 46 180 184 193 198 20430 Total $10,853 $11,634 $11,744 $12,068 $12,481 $12,904
31
32 Depreciation
33 New York City Transit $1,421 $1,544 $1,638 $1,688 $1,863 $1,91334 Bridges and Tunnels 91 104 112 120 128 12835 Long Island Rail Road 333 333 343 347 350 35436 Metro-North Railroad 230 227 227 227 229 23137 MTA Bus Company 49 42 42 42 43 4438 MTA Headquarters 42 31 36 40 41 3339 Staten Island Railway 8 8 8 8 8 840 First Mutual Transportation Assurance Company 0 0 0 0 0 041 Total $2,174 $2,291 $2,407 $2,473 $2,662 $2,711
42
43 Other Post Employment Benefits
44 New York City Transit $1,554 $1,554 $1,616 $1,681 $1,748 $1,81845 Bridges and Tunnels 77 67 70 74 77 8146 Long Island Rail Road 45 71 74 76 76 7747 Metro-North Railroad 58 65 68 70 73 7748 MTA Bus Company 100 100 100 100 100 10049 MTA Headquarters 85 90 105 117 130 14350 Staten Island Railway 1 2 2 2 2 251 Total $1,920 $1,950 $2,036 $2,120 $2,207 $2,299
52
53 Environmental Remediation
54 New York City Transit $24 $0 $0 $0 $0 $055 Bridges and Tunnels (0) 0 0 0 0 056 Long Island Rail Road (14) 4 2 2 2 257 Metro-North Railroad 2 4 4 4 4 458 MTA Bus Company 2 0 0 0 0 059 Staten Island Railway 0 0 0 0 0 060 Total $14 $8 $6 $6 $6 $6
61
62 Net Operating Surplus/(Deficit) 1
63 New York City Transit ($5,418) ($5,766) ($6,054) ($6,320) ($6,787) ($7,137)64 Bridges and Tunnels 1,090 1,019 1,000 987 966 95265 Long Island Rail Road (978) (1,173) (1,125) (1,151) (1,223) (1,304)66 Metro-North Railroad (726) (778) (736) (755) (785) (814)67 MTA Bus Company (500) (511) (556) (573) (580) (574)68 MTA Headquarters (409) (435) (484) (493) (510) (526)69 Staten Island Railway (43) (45) (52) (63) (49) (50)70 First Mutual Transportation Assurance Company (25) 17 22 32 35 4471 Other (46) (180) (184) (193) (198) (204)
Total ($7,055) ($7,853) ($8,169) ($8,528) ($9,131) ($9,613)
Note: 1 Excludes Debt Service
July Financial Plan 2015-2018METROPOLITAN TRANSPORTATION AUTHORITY
($ in millions)MTA Consolidated Accrued Statement of Operations By Agency
I-3

LineNo7 Cash Receipts and Expenditures 2014 2015
8 2013 Mid-Year Preliminary
9 Actual Forecast Budget 2016 2017 2018
10 Receipts
11 Farebox Revenue $5,571 $5,679 $5,764 $5,847 $5,899 $5,94512 Other Operating Revenue 803 728 667 754 707 73213 Capital and Other Reimbursements 1,340 1,708 1,607 1,580 1,521 1,52414 Total Receipts $7,713 $8,116 $8,039 $8,181 $8,126 $8,201
1516 Expenditures
17 Labor:
18 Payroll $4,525 $5,263 $5,031 $5,065 $5,169 $5,26119 Overtime 736 811 695 697 707 71920 Health and Welfare 952 1,026 1,100 1,168 1,249 1,34421 OPEB Current Payment 431 452 491 530 574 62522 Pensions 1,191 1,343 1,368 1,363 1,347 1,35923 Other Fringe Benefits 653 752 727 741 761 78324 Contribution to GASB Fund 86 48 0 0 0 1025 Reimbursable Overhead 0 0 0 0 0 026 Total Labor Expenditures $8,574 $9,696 $9,413 $9,564 $9,807 $10,100
2728 Non-Labor:
29 Electric Power $498 $553 $510 $530 $602 $64930 Fuel 252 265 258 248 252 26231 Insurance 24 50 53 62 76 9232 Claims 213 188 193 194 200 20333 Paratransit Service Contracts 373 380 390 425 478 52134 Maintenance and Other Operating Contracts 471 572 559 579 555 55135 Professional Service Contracts 293 384 379 351 326 32636 Materials & Supplies 640 677 686 693 693 70037 Other Business Expenditures 165 240 207 200 201 21038 Total Non-Labor Expenditures $2,929 $3,309 $3,236 $3,281 $3,385 $3,513
3940 Other Expenditure Adjustments:
41 Other $36 $86 $118 $93 $86 $13642 General Reserve 0 135 140 145 150 15543 Total Other Expenditure Adjustments $36 $221 $258 $238 $236 $291
4445 Total Expenditures $11,539 $13,226 $12,907 $13,083 $13,428 $13,9044647 Net Cash Deficit Before Subsidies and Debt Service ($3,826) ($5,110) ($4,869) (4,903) (5,301) (5,703)
4849 Dedicated Taxes and State/Local Subsidies $5,576 $6,524 $6,240 $6,537 $6,642 $6,79550 Debt Service (excludes Service Contract Bonds) (1,664) (1,666) (1,790) (1,902) (2,061) (2,206)5152 CASH BALANCE BEFORE PRIOR-YEAR CARRY-OVER $86 ($252) ($418) ($267) ($720) ($1,114)
($ in millions)MTA Consolidated Cash Receipts and Expenditures
July Financial Plan 2015-2018
METROPOLITAN TRANSPORTATION AUTHORITY
I-4

LineNumber 2014 2015
7 2013 Mid-Year Preliminary
8 Actual Forecast Budget 2016 2017 2018
9 Total Receipts
10 New York City Transit $5,417 $5,580 $5,480 $5,536 $5,575 $5,63511 Long Island Rail Road 918 989 968 980 966 96712 Metro-North Railroad 866 950 1000 997 988 99913 MTA Bus Company 230 240 232 234 235 23614 MTA Headquarters 242 279 283 360 289 29215 Staten Island Railway 12 18 14 12 10 1016 Capital Construction Company 26 36 36 36 37 3717 First Mutual Transportation Assurance Company 3 24 24 25 25 2618 Total $7,713 $8,116 $8,039 $8,181 $8,126 $8,201
19
20 Total Expenditures
21 New York City Transit $7,668 $8,477 $8,307 $8,467 $8,740 $9,04722 Long Island Rail Road $1,537 1,778 1,688 1,721 1,778 1,85723 Metro-North Railroad $1,265 1,486 1,461 1,466 1,486 1,52524 MTA Bus Company $569 660 635 653 660 65425 MTA Headquarters $404 596 533 503 499 54926 Staten Island Railway $41 58 56 64 48 5027 Capital Construction Company $26 36 36 36 37 3728 First Mutual Transportation Assurance Company $3 24 24 25 25 2629 Other 26 112 167 148 154 15930 Total $11,539 $13,226 $12,907 $13,083 $13,428 $13,904
31
32 Net Operating Surplus/(Deficit)
33 New York City Transit (2,251) (2,897) (2,826) (2,931) (3,165) (3,413)34 Long Island Rail Road (619) (789) (720) (741) (811) (890)35 Metro-North Railroad (399) (536) (461) (469) (498) (526)36 MTA Bus Company (340) (419) (402) (419) (425) (418)37 MTA Headquarters (163) (317) (251) (143) (211) (257)38 Staten Island Railway (29) (39) (42) (52) (38) (40)39 Capital Construction Company 0 0 0 0 0 040 First Mutual Transportation Assurance Company 0 0 0 0 0 041 Other (26) (112) (167) (148) (154) (159)42 Total ($3,826) ($5,110) ($4,869) ($4,903) ($5,301) ($5,703)
MTA Consolidated Cash Statement of Operations By AgencyJuly Financial Plan 2015-2018
METROPOLITAN TRANSPORTATION AUTHORITY
($ in millions)
I-5

2014 2015 2016 2017
($202) ($409) ($484) ($1,039)
Savings Programs $37 $60 $61 $68
2014 BRP (New Savings Programs) 28 46 41 37
NYCT Paratransit - Additional Net Savings 10 14 20 31
New Needs/Investments ($31) ($54) ($55) ($53)
Maintenance/Operations (18) (22) (31) (30)Information Technology (5) (18) (11) (11)Service Adjustments (3) (7) (7) (7)All Other New Needs (6) (8) (7) (6)
Labor Adjustments (TWU pattern) ($297) ($136) ($90) ($80)
Labor Agreements (Settled and Assumptions) 1 (348) (245) (208) (207)
GASB Account - Suspend Contributions 51 109 118 127
Agency Baseline Adjustments ($0) $135 $299 $358East Side Access Delayed Opening 2 27 70 111Farebox/Toll Revenue 14 4 14 33Weather Impacts 2 (56) (0) (0) (0)
Overtime (includes Rebaselining) 3 (28) (20) (19) (20)Rates: Health & Welfare (including retirees) 3 60 54 75 86 Energy (16) 59 85 51 Pensions 3 5 21 48 62 Insurance 3 10 17 25 Worker's Compensation 7 8 8 8Other Baseline Re-estimates 4 7 (27) 2 3
Changes in Subsidies $191 ($60) ($68) ($75)MMTOA 6 7 11 5Real Estate Taxes 152 (23) (26) (32)Petroleum Business Tax 9 (9) (16) (18)Payroll Mobility Tax and MTA Aid (52) (68) (80) (86)CDOT Subsidy 21 (2) 3 2B&T Surplus Transfer 6 5 22 34Forward Energy Contracts Program - Gain/(Loss) 2 2 (0) 0Other Subsidies 47 29 17 20
Debt Service Adjustments from Refundings/Lower Interest Rates $50 $46 $70 $101
Prior Year Carryover $0 $0 $0 $0
($252) ($418) ($267) ($720)
*
1
2
3
4
METROPOLITAN TRANSPORTATION AUTHORITYJuly Financial Plan 2015-2018
($ in millions)Cash Reconciliation
MTA Consolidated July Financial Plan Compared with February Financial Plan
FEBRUARY FINANCIAL PLAN 2014-2017 CASH BALANCE BEFORE BTL ADJUSTMENTS
JULY FINANCIAL PLAN 2015-2018 CASH BALANCE BEFORE BTL ADJUSTMENTS *
B&T Operating Surplus Transfer is captured as a subsidy. While B&T's impacts are also captured in individual reconciliationcategories in the Agency Baseline Adjustments above, the duplication is eliminated within the line "Baseline Re-estimates."
Excludes impacts of labor agreements (settled and assumptions).
Includes loss of farebox revenue and increased use of overtime.
Encompasses all expenses associated with the TWU settlement and labor growth assumptions, including overtime, pension andhealth and welfare, which are excluded from Agency Baseline Adjustments.
Favorable/(Unfavorable)
Totals may not add due to rounding.
I-6

2013Actual
2014 Mid-Year Forecast
2015 Preliminary
Budget2016Plan
2017Plan
2018Plan
New York City Transit 38.0% 37.5% 36.7% 36.0% 34.4% 33.2%Staten Island Railway 11.7% 11.7% 11.0% 9.6% 11.7% 11.5%Long Island Rail Road 32.7% 30.3% 31.0% 30.6% 29.3% 27.9%Metro-North Railroad 43.3% 40.0% 41.7% 41.5% 40.7% 39.8%Bus Company 28.5% 28.3% 27.0% 26.6% 26.4% 26.7%
MTA Total Agency Average 37.3% 36.3% 35.8% 35.2% 33.9% 32.8%
2013Actual
2014 Mid-Year Forecast
2015 Preliminary
Budget2016Plan
2017Plan
2018Plan
New York City Transit 58.2% 58.2% 57.7% 56.8% 55.1% 53.6%Staten Island Railway 16.9% 16.8% 15.4% 12.9% 16.8% 16.4%Long Island Rail Road 47.9% 43.6% 46.2% 45.9% 44.0% 41.9%Metro-North Railroad 57.0% 55.5% 58.9% 58.9% 58.5% 57.9%Bus Company 36.7% 35.9% 33.9% 33.2% 32.9% 33.4%
MTA Total Agency Average 55.3% 54.4% 54.7% 53.9% 52.6% 51.2%
Farebox recovery ratio has a long-term focus. It includes costs that are not funded in the current year, except in an accounting-ledgersense, but are, in effect, passed on to future years. Those costs include depreciation and interest on long-term debt. Approximately 20%(and sometimes more) of MTA costs are not recovered in the current year from farebox revenues, other operating revenues or subsidies.That is why MTA operating statements generally show deficits. In addition, the recovery ratio allocates centralized MTA services to theAgencies, such as Security, the costs of the Inspector General, Civil Rights, Audit, Risk Management, Legal and Shared Services.
Farebox operating ratio focuses on Agency operating financial performance. It reflects the way MTA meets its statutory and bond-covenantbudget-balancing requirements, and it excludes certain costs that are not subject to Agency control, but are provided centrally by MTA.
In the agenda materials for the Meeting of the Metro-North and Long Island Committees, the calculations of the farebox operating andrecovery ratios for the LIRR and MNR use a revised methodology to put the railroads on a more comparable basis. Those statistics, whichare included in the respective financial and ridership reports of both Agencies, differ from the statistics presented in this table.
METROPOLITAN TRANSPORTATION AUTHORITYJuly Financial Plan 2015-2018
Baseline Farebox Recovery and Farebox Operating Ratios
FAREBOX RECOVERY RATIOS
FAREBOX OPERATING RATIOS
I-7

[THIS PAGE INTENTIONALLY LEFT BLANK]
I-8

II. Major Assumptions

Agency Baseline Assumptions
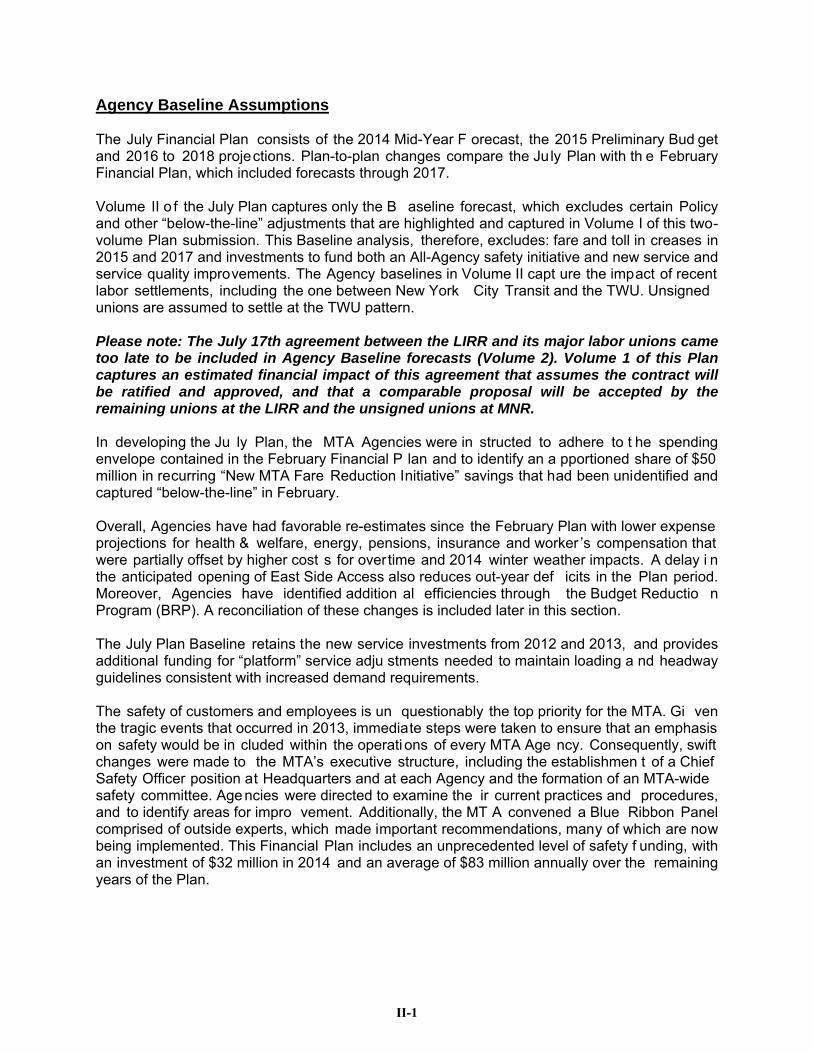
Agency Baseline Assumptions The July Financial Plan consists of the 2014 Mid-Year F orecast, the 2015 Preliminary Bud get and 2016 to 2018 projections. Plan-to-plan changes compare the Ju ly Plan with th e February Financial Plan, which included forecasts through 2017. Volume II o f the July Plan captures only the B aseline forecast, which excludes certain Policy and other “below-the-line” adjustments that are highlighted and captured in Volume I of this two-volume Plan submission. This Baseline analysis, therefore, excludes: fare and toll in creases in 2015 and 2017 and investments to fund both an All-Agency safety initiative and new service and service quality improvements. The Agency baselines in Volume II capt ure the impact of recent labor settlements, including the one between New York City Transit and the TWU. Unsigned unions are assumed to settle at the TWU pattern. Please note: The July 17th agreement between the LIRR and its major labor unions came too late to be included in Agency Baseline forecasts (Volume 2). Volume 1 of this Plan captures an estimated financial impact of this agreement that assumes the contract will be ratified and approved, and that a comparable proposal will be accepted by the remaining unions at the LIRR and the unsigned unions at MNR. In developing the Ju ly Plan, the MTA Agencies were in structed to adhere to t he spending envelope contained in the February Financial P lan and to identify an a pportioned share of $50 million in recurring “New MTA Fare Reduction Initiative” savings that had been unidentified and captured “below-the-line” in February. Overall, Agencies have had favorable re-estimates since the February Plan with lower expense projections for health & welfare, energy, pensions, insurance and worker ’s compensation that were partially offset by higher cost s for overtime and 2014 winter weather impacts. A delay i n the anticipated opening of East Side Access also reduces out-year def icits in the Plan period. Moreover, Agencies have identified addition al efficiencies through the Budget Reductio n Program (BRP). A reconciliation of these changes is included later in this section. The July Plan Baseline retains the new service investments from 2012 and 2013, and provides additional funding for “platform” service adju stments needed to maintain loading a nd headway guidelines consistent with increased demand requirements. The safety of customers and employees is un questionably the top priority for the MTA. Gi ven the tragic events that occurred in 2013, immediate steps were taken to ensure that an emphasis on safety would be in cluded within the operati ons of every MTA Age ncy. Consequently, swift changes were made to the MTA’s executive structure, including the establishmen t of a Chief Safety Officer position at Headquarters and at each Agency and the formation of an MTA-wide safety committee. Agencies were directed to examine the ir current practices and procedures, and to identify areas for impro vement. Additionally, the MT A convened a Blue Ribbon Panel comprised of outside experts, which made important recommendations, many of which are now being implemented. This Financial Plan includes an unprecedented level of safety f unding, with an investment of $32 million in 2014 and an average of $83 million annually over the remaining years of the Plan.
II-1

Baseline July Plan Changes from February Plan
The following summary table and narrative capture the ma jor baseline changes between the February and July Plans, by functional category.
2014 2015 2016 2017Savings Programs $37 $60 $61 $68
2014 BRP (New Savings Programs) 28 46 41 37NYCT Paratransit - Additional Net Savings 10 14 20 31
New Needs/Investments ($31) ($54) ($55) ($53)Maintenance/Operations (18) (22) (31) (30)Information Technology (5) (18) (11) (11)Service Adjustments/Service Support (3) (7) (7) (7)All Other New Needs (6) (8) (7) (6)
Labor Adjustments (TWU pattern) ($297) ($136) ($90) ($80)
Labor Agreements (Settled and Assumptions) 1 (348) (245) (208) (207)GASB Account - Suspend Contributions 51 109 118 127
Agency Baseline Adjustments ($0) $135 $299 $358East Side Access Delayed Opening 2 27 70 111Farebox/Toll Revenue 14 4 14 33Weather Impacts 2 (56) (0) (0) (0)Overtime (includes Rebaselining) 3 (28) (20) (19) (20)Rates: Health & Welfare (including retirees) 3 60 54 75 86 E nergy (16) 59 85 51 Pensions 3 5 21 48 62 Insurance 3 10 17 25 Worker's Compensation 7 8 8 8Other Baseline Re-estimates (includes timing) 4 7 (27) 2 3
Net Cash Baseline Changes ($291) $5 $215 $293
3 Excludes impacts of labor agreements (settled and assumptions).
4 B&T Operating Surplus Transfer is captured as a subsidy. While B&T's impacts are also captured in individual reconciliation categories in the Agency Baseline Adjustments above, the duplication is eliminated within the line "Other Baseline Re-estimates."
AGENCY BASELINEJULY CHANGES FROM FEBRUARY PLAN
Favorable/(Unfavorable)($ in millions)
1 Encompasses all expenses associated with the TWU settlement and labor growth assumptions, including overtime, pension and health & welfare which are excluded from Agency Baseline Adjustments.
2 Includes loss of farebox revenue and overtime.
II-2

Savings Programs/Cost Control: The MTA continues to focus on cost control. In addition to the net favorable changes described above, the MTA identified greater savings from new Budget Reduction Programs (BRPs). These savings, which are being used to help meet New Fare Reduction Init iative targets, are detailed later in this section. When combined with prior MTA Efficiency savings programs, detailed in Volume I, total annual savings are projected to be $1.1 billion in 2014, $1.3 billion i n 2015, and finally $1.5 billion by 2017. The growth in non-discretionary costs remains a challenge. Categories such as employee and retiree health care (OPEB), energy, insuranc e, paratransit and pensions are dependent on factors that are largely outside the control of the MTA. MTA is committed to reducing this growth with tactics that include the hedging of fuel purchases, payi ng down the pension l iability when funding is available, the proactive management of paratransit, and initiatives to reduce health & welfare costs. New Needs/Investments: The Plan continues to include t he projected operating budget impacts of “Me ga” Projects, including the Fulton Street Transit Center, 7 Line Extension, Second Avenue Subway, and East Side Access. In additio n, the MTA continues t o improve the reliability and perfor mance of it s fleet and infrastructure t hrough increased maintenance. The July Plan includes so me service adjustments/service support, and numerous information technology-related investments. For the most part, funding of these investments is provided by each Agency internally through reduced spending. Major Agency investments include: NYC Transit Investments: Include a program to provide additional main tenance to Transit’s 1,318 buses that have
been in service for more than 12 years. It is e stimated that buses ove r that threshold require 50 more hours of maintenance per bus than those in service for fewer years. The program requires 60 additional maintenance positions and six supervisors to support this work. Overtime has been budgeted until th ose positions are hir ed commencing September 2014. The program is expected to conclude in 2016 as t his “older” fleet is significantly reduced through retirement and replaced with new buses that are anticipated to be delivered beginning in late 2015;
Hire additional station cleaning staff to improve cleanline ss and reduce unsched uled overtime;
Improve the alignment of the track constr uction maintenance workforce by converting reimbursable track con struction personnel to non-reimbursable posit ions to sup port weekday maintenance-specific tasks that include critica l safety and s ensitive maintenance work such as rail inspection s, repair, and emergency response, maintaining the system's functiona l integrity a nd maximizing operational safety o f all track components;
Increase Rapid Transit Operations training periods for supervisor and hourly titled
employees to accommodate new course subje cts, ensuring that personnel receive the most appropriate instructions to meet their job responsibilities;
Fund normal “platform” service adju stments, reflecting seasonal schedule changes, and loading and headway guidelines; and
II-3

Revise the scheduled maintenance system f or work scope alignment and additional electronic components installations.
LIRR Investments: Provide additional Reliability Cycle Maintenance for it s M3 fleet to ensure cars remain
available for revenue se rvice through 2018—consequential steps necessary to address delays in the procurement and delivery of M9 cars;
Implement a strategy to address obsolete Multi-Function Unit, Central Diagnostic
System and Train Operator Display components on the M7 fleet. Bombardier will supply the materials and installation will be completed by LIRR employees; and
Establish funding for normal “platform” service adjustments, reflecting seasonal schedule changes, and loading and headway guidelines.
MNR Investments: Support the Enterprise Asset Management system, which will promote best stand ards
and procedures, proactive maintenance, cost efficiencies, and tools f or managing the life-cycle process of MNR’s assets. This MTA-wide program will help align corporate objectives with practices, enhan cing the quality of information recorded and disseminated throughout the Agencies;
Purchase two new Ca tenary Maintenance Vehicles (CMV) to replace the two CMV's approaching the end of their useful life;
Invest in cr itical inventory manage ment system compone nts including a wareho use stacking system for the Harmon Material Distribution C enter and t wo vertical lift machines for efficient and safe retrieval of warehouse inventories and supplies;
Replace power system electrical components, including AC Bus Ducts at 20 traction
power substations to properly maintain the relia bility of 3rd rail traction for the Harlem and Hudson lines; and
Revise the Infrastructure Improvement Program, a four-prong initiative covering right-of-
way maintenance improvements, safety, track maintenance management and oversight, and training.
B&T Investments: Hire a manager to oversee Minority and Wome n Owned Business Ent erprise (M/WBE)
compliance and outreach for variou s state programs to pro mote diversity among B&T contractors, subcontractors and consultants; and
Add four positions associated with All Electronic Tolling (AET) and Open Road To lling (ORT) dedicated to t he many t echnical and administrative activities require d to implement and enforce the changes in the meth od of toll collection, which is currently in place at the Henry Hudson Bridge.
II-4

MTA Bus Investments: Increase resources needed to me et the higher costs of Goodyear tires and tubes for
MTA Bus’s low-floor bus fleet, which has gro wn from 38 9 buses to 601 buses since 2012.
Hire six fa rebox maintainers to perform more freque nt preventive maintenance inspections (PMIs) and address farebox reliability which directly impacts customers and the ability to collect re venue. The additional maintainers will conduct PMIs at more optimal intervals and provide better absentee coverage resulting in re duced overtime expenses;
Provide additional maintenance for fleet buses that have b een in servi ce for over 12 years in order to keep these “older” buses in a state of good repair and provide safe and reliable service to customers. The program is expected t o conclude in 2015 as this “older” fleet is significantly reduced through retirement and replacement with new buses that are anticipated to be delivered beginning in late 2015; and
Revise Shop Program assumptions including the deferral of Motor Coach Industries’ bus engine work to out-years, and the acceler ation of CNG engine overhauls and transmission work.
Staten Island Railway Investments: Increase resources to upgrade damaged and eroded fuel tanks.
MTA Headquarters Investments: Support an Enterprise Asset Management system throughout the MTA with a se t of
defined policy objectiv es, such as implementation of whole-life programs, risk management, and performance measurement system strategies;
Upgrade current back-up structure to a ccommodate the additiona l workload of the upgraded accounting/human resources system at the Business Service Center;
Provide resources for t he newly e stablished MTA IT dep artment for a number o f key initiatives in support of MTA an d Agency operations, including Automatic Train Supervision-A Division for NYCT, F RA-mandated and oth er workforce applicat ions for LIRR and MNR, and data analysis and visualization tools for B&T. In addition, MTA-wide IT investments include cyber security, resiliency and disaster recovery, cloud email, the mta.info site, open data initiativ es, IT asset state-of- good-repair, and IT project management; and
Additional funding required by MTA Police for expenses associated with relocating to the
Graybar Building, 420 Lexington Avenue.
II-5

Labor Adjustments (Settled and Assumptions): Agency baselines include adjustments for retro-active pay and a new wage base resulting from the TWU settlement and the assu mption that the same pattern will be applied to MTA unions without contract agreements. For MTA HQ, the Pl an includes the impact of the settlement with the Police Benevolent Associat ion (PBA). For represented employees, these labor adjustments eliminate the three years of “net zero” wage gr owth assumption that was previously captured within the February Plan. The estimated impa ct of the lab or settlements and assumptions are $348 million in 2014; $245 million in 2015; $208 million in 2 016, $207 million in 20 17 and $192 million in 2 018. Measures taken to fund the ov erall impact of higher labor costs i nclude the suspension of contributions to the GASB Fund. Additional actions taken and other labor related matters are addressed in Volume I. Salaries for non-represented employees, who have not r eceived a general salary increase during the last five years, are assumed to follow CPI-based increa ses. The 20 14 Mid-Year Forecast baseline includes the compounding of raises for 2012 and 2013; however, as of th e July Plan, no raises have been granted. Please note: At the time that Volume II went to press, the LIRR and its labor unions were in contract negotiations. Volume I provides an updated status of those discussions and, if warranted, a re-estimated cost impact to the LIRR (and Metro-North), as well as MTA’s overall bottom line. Overtime (excludes impact of weather-related overtime) Following a major review in 2013 t hat identified overtime-related issues and resulted in the re-baselining of this expense (see the 2013 Nove mber Plan f or details), t he July Plan include s further revisions to improve forecasting. Exam ples of incre ases include greater maintenance work at NYCT (e.g., bus and track work), the Infrastructure Improvement Program at MNR, and a more accurate assessment of vacancy/absentee coverage requirements. Implementing sustainable programs that reduce ov ertime levels in routine maintenance, and controllable types of overtime, such as vacan cy/absentee coverage and unsched uled service remain at the forefront for MTA management. Areas that continue to b e scrutinized and require particular focus include: forecasting methodology; optimization of overtime vs. straight-time; impacts on pensions; overtime us e for non-e ssential work; and overtime intensity. Further analysis of overtime will be conducted and addressed in the coming months, and it is expected that efficiencies can be identified that will result in rea listic savings i n overtime. Additional information is contained within the consolidated narratives section and explained further within Agency sections of this volume. Weather Impacts: In the first two months of 2014, Central Park experienced 11 days of snowfall and 49 inches of snow accumulation, more than three times the 16 inch norm for this period. The resulting impact of these conditions totaled $56 million, consisting of $12 million in reduced farebox revenue at NYCT and increased expenses, particularly overtime, as follows: $36 million at NYCT, $6 million at the Long Island Rail Road, and $2 million at MTA Bus.
II-6

Agency Baseline Adjustments: Explanations of individual adjustments are captured within the detailed explanation of individual revenue and expense categories. Accrued Baseline Assumptions The following present s Agency baseline assumptions supporting the MTA Consolidate d Statement of Operations including analysis of individual revenue a nd expense categories. Additional detail is available in each Agency section. 2014 Mid-Year Forecast The 2014 Mid-Year Forecast projects a Net Operating Deficit before Subsidies and Debt Service of $7,853 milli on which is $391 milli on unfavorable from the Adopted Budget, as expenses, including Non-Cash Liability Adjustments, were partially offset by higher revenue. Excluding Non-Cash Liability Adjustments, the 2014 Mid-Year Forecast is $313 mi llion higher than the Adopted Budget. Revenue Total operating revenue was $75 million higher than the Adopted Budget of which $61 million, due to higher other operating revenue, reflectin g the recovery of opera ting losses from Federal sources for Super Storm Sandy an d higher investment income from F MTAC. Farebox and Toll revenues were also hig her than the Adopted Budget due to higher than forecast ridership a t NYCT and LIRR, and traffic levels at B&T, partially offset by lower farebox revenue at MNR and MTA Bus, primarily due to lower ridership. Expenses Excluding non-cash adjustments, operating expenses wer e $388 million higher than the Adopted Budget, the bulk of which were due to higher net labor costs as a result of the TWU settlement with NYCT, and the assumption of a pattern se ttlement for unions with out contract agreements. In addition , the Plan captures th e impact of the settle ment with the Police Benevolent Association at MTA HQ. The implications of the wage settlement and assumptions impacted all labor-relat ed generic categories, as well as other business expense. Partially offsetting these impacts are lower costs for health & welfare, paratransit service contracts, and insurance. 2015 Preliminary Budget The 2015 Preliminary Baseline Bud get projects a Net Operating Deficit before Subsidies an d Debt Service of $8,169 million. Total 2015 operating expenses, includin g Non-Cash Adjustments, of $16,193 million are $310 million higher than the 2014 Mid-Year Forecast due mostly to higher non-cash liabilitie s, health & welfare, maintenance and othe r operating contracts, and materials and supplies. When compared with the 2015 forecast in the February Plan, the 2015 Net Operating Defici t before Subsidies and Debt Service was $80 mil lion unfavorable due mostly to higher costs for payroll and overtime, n on-cash liabilities, other business expenses, and professio nal service contracts. These unfavorable results were partially offset b y lower costs for energy, health & welfare, paratransit service contracts, and insurance. Excluding Non-Cash Liability Adjustments, the 2015 Preliminary Budget is $3 million higher than the 2015 forecast in the February Plan.
II-7

Total operating revenue of $8,024 million is expected to be $37 million better than the February Plan forecast, largely reflecting the recovery of Super Storm Sand y-related losses and higher investment income from the MTA F irst Mutual Transportation Assuran ce Company (FMTAC). Farebox and Toll revenues also were higher than the February Plan due to a slight improvement in ridership at NYCT and LIRR, and traffic levels at B&T, partially offset by lo wer farebox revenue at MNR and MTA Bus, primarily due to lower ridership. Total expenses in 2015 are expected to incr ease by $117 million compared with the February Plan, the impacts of which are reflected in payroll, overtime, po st-employment benefits, depreciation, other business expense, and professional service contracts. 2016 – 2018 Forecast Year-to-year changes include higher revenue from modest growth in utilization and inflationary impacts on wages and other expenses. The Plan also captures the impacts of “m ega-projects” coming on-line or preparing to do so. The July Forecast includes decreases to the baseline deficit , compared with the February Plan, for 2016 and 2017 mainly as a result of delays in the open ing of East Side Access until 202 2, which shifts the ra mp-up on related operating expenses into later years, and higher other operating revenue due to projected higher investment income, and higher farebox revenue. Also contributing to the decreased de ficits are lower expenses for health & welfare, energy, paratransit service contracts, pensions, and insurance. The projected operating impacts from the “Mega” Projects are presented below:
Positions ($000) Positions ($000) Positions ($000) Positions ($000) Positions ($000)
East Side AccessRevenue Service Date: Year 2022
LIRR 0 ‐$ 0 ‐ 19 2.164 203 25.583 335 48.250
MTAHQ ‐ ‐ ‐ ‐ ‐ ‐ ‐ ‐ 30 3.179
0 ‐$ 0 ‐$ 19 2.164$ 203 25.583$ 365 51.429$
2nd Avenue SubwayRevenue Service Date: Year 2016
NYCT 0 ‐$ 0 ‐$ 0 ‐$ 301 31.642$ 301 32.885$
7‐Line ExtensionRevenue Service Date: Year 2014
NYCT 181 5.119$ 175 17.296$ 182 17.640$ 184 18.009$ 184 18.696$
Fulton St Transit CenterRevenue Service Date: Year 2014
NYCT 35 5.145$ 35 9.298$ 35 9.333$ 35 9.333$ 35 9.704$
216 10.264$ 210 26.594$ 236 29.137$ 723 84.567$ 885 112.714$
Subtotal
TOTAL
2014Mid YearForecast Budget 2016 2017 2018
Preliminary
METROPOLITAN TRANSPORTATION AUTHORITYJuly Financial Plan 2015‐2018
Operating Budget Impacts of Capital "Mega" Projects($ in millions)
2015
II-8

PASSENGER & TOLL REVENUE / UTILIZATION
On an average weekd ay, MTA c arries 8.5 million passengers on its subways, buses and commuter railroads, while there are 800 thousand cro ssings at MTA Bridges & Tunnels facilities. The use of MTA subways, buses, commuter railroads an d bridges a nd tunnels varies with a number of factors, and perhaps m ost important among these is the health of the regional economy. Since hitting recessionary lows in 2010, employment le vels and the regional economy have slowly but gradu ally improved and consequentially twel ve-month average ridership levels have returned to pre-recession levels. The Financial Plan assumes employment levels, compared with the assumptions in the February Pla n, will be modestly higher, from 12 thousand more jobs in New York City for 2014 than previously projected and by 4 4 thousand more jobs by 2017, bringing the tota l number of New York City jobs to 4.2 million in 2017; these modest improvements partly account for plan-to-plan variances in consolidated utilization. While economic conditions are an i mportant influence on system-wide utilization, other factors also explain changes in ridership, vehicle tra ffic and fare and toll revenues. One of the most significant determinants in 2014 was the severe winter weather in Jan uary and February that brought colder than n ormal temperatures an d several heavy snowstorms that dampened system-wide utilization, especially crossings at B&T facilities and bus ri dership on NYCT and MTA Bus. On the positive side, LIRR has strategically deployed shuttle-style collectors between stations known to face challenge s with fare evasion, in particular where a high volume of ridership occurs between stations that are ge ographically close, and the July Plan includes resources to sustain and build upon this initiative’s success. During the Plan period, is projecting ridership growth from service e xpansions and the ra ilroad’s effort to in crease parking availability. Utilization figures presented in this section do not reflect fare media liability or paratransit operations at NYCT; these items are included in the Agency and MTA consolidated tables in the Financial Plan. Additionally, utilization for MNR’s west-of-Hudson operations is also not included in this section; in the Agency and MTA consolidated financial tables, west-of-Hudson utilizati on is netted against expenses and is not included in revenue. The 2014 Mid-Year Forecast for MTA consolid ated ridership is projected to total 2 ,697 million passengers, while crossings at B&T facilitie s are expected to reach 282 million. The NYCT combined subway and bus ridership forecast f or the 2014 July Forecast is 2,402 million and accounts for 89% of MTA consolidat ed ridership. LIRR and MNR‘s East -of-Hudson operations each account for 3% of MTA consolidated rid ership, with 2013 ridership project ed to be 85 million for LIRR and 83 million for MNR’s East-of-Hudson operations. Ri dership for MTA Bus is projected to be 124 million, and accounts for 5% of MTA consolidate d ridership, while SIR ridership is projected to be 4 million (0.2% of MTA ridership). MTA consolidated farebox revenue for the 201 4 Mid-Year Forecast is expected to be $5,576 million, and toll revenu e is expect ed to be $1 ,651 million. NYCT combined subw ay and bus farebox revenue is forecast at $4,070 million, while LIRR i s projecting $651 million in farebox revenue and MNR $65 0 million in farebox revenue for its East-of-Hudson oper ations. SIR farebox revenue is expected to be $6 million, and MTA Bus farebox re venue is expected to b e $200 million.
II-9

The 2014 Mid-Year Forecast for MTA consolidated rider ship is expected to increase by 18 million trips (0.7%) compared with 2013, reflecting, in p art, continued improvement in the regional economy. Ridership at N YCT is ex pected to in crease by 17 million ( 0.7%); and ridership levels at MNR, LIRR, and SIR are also expected to rise in 2 014, combining for an increase of 2 million trips (1.3%). MTA Bus, however, forec asts a decline of 1 million riders in 2014 (1.2%); and traffic crossings at B&T facilities are expected to decr ease by 3 million trip s (0.9%) compared with 2013, primarily because of the po or winter weather in January and February. The 2014 Mid-Year Forecast project s a consolidated farebox revenue increase of $147 million (2.7%) in 2014, the result of higher collections at NYCT, MTA Bus, SIR and both of the commuter railroads; and in spite of fewer b ridge and tunnel crossings, B&T toll revenue is expected to exceed 2013 toll revenue by $6 million (0.4%). MTA consolidated ridership for the 2014 Mid-Ye ar Forecast is expected to fall short of the 2014 Adopted Budget forecast by 25 million trips (0 .9%). Although LIRR ha s improved its ridership forecast by 1 million (0.8%) and SIR forecasts a small improvement of 0.2% over t he Adopted Budget, NYCT, MNR and MTA Bus now forecast ridersh ip decreases. For NYCT, the ridership decrease of 23 million trips (0.9%) reflects 20 million fewer bus trips and 2 million fewer subway trips. The decline in bu s ridership was primarily due to th e unusually harsh winter weather i n January and February and, as an ancillary effect, forced a reduction in NYCT’s estimate of ridership recovery from the enforcement of fare evasion. MNR forecasts ridersh ip numbers to be unfavorable compared with the Adopted Budget by 2 million (1.9%), largely because of lower than expected commut ation and n on-commutation ridership as a consequence of the poo r winter weather, but also attributable independently to lower ridership trends since t he latter part of 2013. For MTA Bus, the decline in expre ss bus ridership, even as local ridership has improved relative to forecasts in February, contributed to 1 million fewer riders (1.0%) compared with the Adopted Budget. Althoug h the winte r storms in January and February dampene d vehicle traffic on B&T facilit ies, conditions were generally favorable from March through May, and the Mid-Year Forecast expects that B&T crossings will improve compared with the Adopted Budget by 0.3 million trips (0.1%). As noted earlier, this ut ilization analysis excludes NYCT Fare Media Liability (as wel l as NYCT Paratransit operations), yet it is included in the consolidated financial tables. The 2014 Mid-Year Forecast includes a significant re-estimate of Fare Media Lia bility, resulting in a favorable plan-to-plan variance of $28 million for Fare Media Liability. Wit h Fare Media Liability in cluded (as well as an u nfavorable $1 million variance for Paratransit revenue), MTA consolidated farebox revenue is favorable by $12 million compared with the Adopted Budget. The change in the Fare Media Liability forecast reflects a hig her than expected volume of MetroCard ticket expirations; a refinement of the forecasting procedure also resulted in more modest favorable va riances of $5 million per year for 2 015 through 2017 compared with the February Plan. When Fare Media Liability and Paratransit revenue are excluded from the an alysis, MTA consolidate d farebox revenue in the 2014 Mid-Year Forecast is expected to b e lower than the Adopted Budget forecast by $12 million (0.2%), as MNR falls short by $10 million, NY CT by $6 million (NYCT would be favorable by $21 million i f Fare Media Liabil ity and Paratransit were in cluded), and MTA Bus by $2 million. LIRR forecasts of farebox revenues have improved by $7 million, while SIR expects revenues to be favorable by less than a tenth of a percent. B&T toll revenue is also projected to be $2 million (0.1%) better than the Adopted Budget forecast. The Preliminary Budget continues to anticipate year-to-year improvements in ridership and fare revenues, due mostly to a steadily improving economy and the associated increase in jobs in New York City; B&T t raffic and t oll receipts are also expected to improve o ver 2014, notwithstanding the unseasonably favorable winter weather in 2013 th at boosted traffic levels.
II-10

Year-to-year, MTA consolidated rid ership is ex pected to increase by 52 million trips (1.9%) compared to 2014, an d B&T vehicular cro ssings are expected to increase by 1 million trip s (0.5%). Farebox reven ue is pro jected to increase $86 million (1.5%) over 2014, while t oll revenue is forecast to improve by $4 million (0.2%). MTA consolidated ridership for the 2015 Preliminary Bud get is expected to be lower than the February Plan projection by 5 million trips (0.2%), mostly the result of worse than expected bus utilization at NYCT that will resul t in a fall in total ridership of 4.8 m illion (0.2%), but also because of 1 million fewer trips (1.3%) at MNR. At B&T facilities, the Preliminary Budget shows a small increase of 0.4 million more vehicular crossings in 2015 than forecast in the February Plan. In spite of the ove rall decline in ridership, MTA consolidated farebox revenue for 2015 in the Preliminary Budget is expected to exceed the projection s in the February Plan by $2 million (less than 0.1%), with only MNR an d MTA Bus showing unfavorable variances (by $6 and $2 million, respectively). B&T toll reve nue for 2015 is projected to be $2 million (0.1%) above the February Plan forecast.
Annual Utilization Growth Rates -- Traffic & Ridership2014 2015 2016 2017 2018
Traffic: Bridges & Tunnels (0.9%) 0.5% 0.7% 0.5% 0.6%
Long Island Rail Road 1.4% 1.0% 0.8% 0.4% 0.5%Metro-North Railroad 1.1% 2.2% 1.7% 1.8% 1.2%MTA Bus Company (1.2%) 1.6% 0.7% 0.1% 0.4%New York City Transit 0.7% 2.0% 1.4% 0.7% 0.7%Staten Island Railway 2.5% 1.8% 1.2% 0.7% 0.7%Ridership 0.7% 1.9% 1.3% 0.7% 0.7%
Annual Utilization Growth Rates -- Toll & Farebox Revenue2014 2015 2016 2017 2018
Toll Revenue: Bridges & Tunnels 0.4% 0.2% 0.6% 0.3% 0.5%
Long Island Rail Road 3.0% 1.0% 0.7% 0.6% 0.3%Metro-North Railroad 4.8% 2.9% 2.1% 2.1% 1.5%MTA Bus Company 0.3% 0.8% 0.8% 0.1% 0.4%New York City Transit 2.5% 1.4% 1.5% 0.7% 0.7%Staten Island Railway 4.5% 2.2% 1.5% 0.8% 0.9%Farebox Revenue 2.7% 1.5% 1.4% 0.9% 0.8%
II-11

MTA consolidated ridership and farebox revenue are both expected to in crease each year from 2016 to 2018, and by 2018 con solidated ridership is projected to reach 2, 825 million passengers, and farebox revenue is expected to reach $5,837 million. B&T crossin gs are also projected to increase each year, reaching 288 million crossings in 2018; toll revenue is forecast to reach $1,678 million in 2018, increasing in each year. Compared with the February Plan , MTA consolidated rid ership for 2016 is expected to be marginally unfavorable (by less tha n 0.1%), bu t favorable for 2017 by 0.2%. The f orecasts of traffic at B&T facilities a re marginally higher tha n in the February Plan for both years (by 0.2% for 2016 and 0.3% for 2017). MTA consolidated farebox revenue is expected to be 0.2% higher in 2016 an d 0.5% hig her in 2017 than was expected in the Februa ry Plan, while B&T toll revenue is projected to be 0.2% higher in 2016 and 0.3% higher in 2017.
II-12

2014 2015Mid-YearForecast
PreliminaryBudget 2016 2017 2018
Traffic
Bridges & Tunnels 281.9 283.2 285.3 286.6 288.4
Ridership
Long Island Rail Road 84.6 85.4 86.1 86.4 86.9Metro-North Railroad 1 82.7 84.5 86.0 87.5 88.6MTA Bus Company 123.5 125.4 126.3 126.4 126.9New York City Transit 2, 3 2,402.1 2,449.6 2,483.4 2,500.5 2,518.2Staten Island Railway 4.3 4.4 4.5 4.5 4.5
Total Ridership 2,697.1 2,749.4 2,786.2 2,805.4 2,825.1
2014AdoptedBudget 2015 2016 2017
Traffic
Bridges & Tunnels 281.6 282.9 284.8 285.8
Ridership
Long Island Rail Road 83.9 85.0 85.2 85.5Metro-North Railroad 1 84.2 85.6 86.8 87.8MTA Bus Company 124.7 125.3 126.1 126.2New York City Transit 2, 3 2,424.6 2,454.5 2,485.0 2,494.7Staten Island Railway 4.3 4.4 4.4 4.4
Total Ridership 2,721.7 2,754.8 2,787.5 2,798.6
2014 2015 2016 2017Traffic
Bridges & Tunnels 0.3 0.4 0.5 0.8
Ridership
Long Island Rail Road 0.7 0.4 0.9 0.9Metro-North Railroad 1 (1.6) (1.1) (0.8) (0.3)MTA Bus Company (1.2) 0.1 0.2 0.2New York City Transit 2, 3 (22.5) (4.8) (1.6) 5.9Staten Island Railway 0.0 0.0 0.0 0.1
Total Ridership (24.6) (5.4) (1.3) 6.7
1 Metro-North Railroad utilization f igures are for East-of-Hudson service (Hudson, Harlem and New Haven Lines) only.2 Excludes Paratransit Operations.3 Excludes Fare Media Liability.
July Financial Plan
MTA Consolidated UtilizationPlan-to-Plan Comparison
Baseline Before Gap-Closing Actions (in millions)
February Financial Plan
Plan-to-Plan Changes: Favorable / (Unfavorable)
II-13

2014 2015Mid-YearForecast
PreliminaryBudget 2016 2017 2018
Toll Revenue
Bridges & Tunnels $1,651.2 $1,655.1 $1,664.7 $1,670.4 $1,678.4
Fare Revenue
Long Island Rail Road 650.9 657.3 662.2 666.1 668.4Metro-North Railroad 1 649.8 668.5 682.2 696.7 707.3MTA Bus Company 199.8 201.4 202.9 203.2 204.0New York City Transit 2, 3 4,069.7 4,128.6 4,189.2 4,220.1 4,251.3Staten Island Railway 5.8 5.9 6.0 6.0 6.1
Total Farebox Revenue $5,575.9 $5,661.7 $5,742.5 $5,792.0 $5,837.0
2014AdoptedBudget 2015 2016 2017
Toll Revenue
Bridges & Tunnels $1,649.5 $1,652.9 $1,661.9 $1,665.9
Fare Revenue
Long Island Rail Road 644.3 649.0 652.9 655.8Metro-North Railroad 1 660.1 674.0 685.5 696.3MTA Bus Company 201.5 202.9 204.6 204.8New York City Transit 2, 3 4,075.9 4,128.6 4,182.5 4,200.6Staten Island Railway 5.7 5.8 5.9 5.9
Total Farebox Revenue $5,587.6 $5,660.2 $5,731.3 $5,763.4
2014 2015 2016 2017Toll Revenue
Bridges & Tunnels $1.7 $2.2 $2.8 $4.5
Fare Revenue
Long Island Rail Road 6.5 8.3 9.3 10.3Metro-North Railroad 1 (10.3) (5.5) (3.2) 0.4MTA Bus Company (1.7) (1.5) (1.6) (1.7)New York City Transit 2, 3 (6.2) 0.0 6.7 19.5Staten Island Railway 0.0 0.1 0.1 0.1
Total Farebox Revenue ($11.7) $1.5 $11.2 $28.6
1 Excludes Paratransit Operations.2 Metro-North Railroad utilization f igures are for East-of-Hudson service (Hudson, Harlem and New Haven Lines) only.3 Excludes Fare Media Liability.
July Financial Plan
MTA Consolidated UtilizationPlan-to-Plan Comparison
Baseline Before Gap-Closing Actions (in millions)
February Financial Plan
Plan-to-Plan Changes: Favorable / (Unfavorable)
II-14

OTHER OPERATING REVENUE The Other Operating Revenue category captures all operating revenues generated fro m sources other than fare s and tolls, and includ es advertising, paratran sit reimbursement, fare reimbursement, rents, concessio ns, parking and inve stment income. It al so includes reimbursement from i nsurance and the federal government for operating losses and infrastructure damages sustained by MTA Agencies. Approximately 30% of Other Operating Rev enue per ann um is gene rated by th e MTA Real Estate Department, wh ich provides comprehensiv e corporate real estate services to MT A Agencies, by acquiring property (purchase d or lease d) when required to support MTA operations and projects. This centralized function also helps to generate recurring revenues through leasing and licensing of space for r etail, advertising, par king, telecom and other purposes and, where feasible, gen erating funds to support the MTA’s capital budgets through the disposition of surplus property. MTA Real Estate Department functions t hat support Other Operating Revenue fall into two general categories: Recurring Revenue from Leases and Licenses: Retail leasing serves a dual purpose, enhancing the commuting experience of MTA customers while generating operating revenue. Advertising revenue, which averages 51% of total real estat e revenue, is generated from, but is not limited to, billboards, walls, car cards, brand trains and interior wraps, and digital advertising placed on NYCT, the Commuter Railroads, SIR and MTA Bus property. Sources producing rental income include leased retail space, “pole, pipe, and wire agreements”, and freight, which are generated on NYCT, the Commuter Railroads, SIR and MTA HQ prop erties. Parking revenue is generated by commuter parking lots along the right-of-way of the LIRR and MNR, together with operations at the B&T Battery Parking Garage. Disposition of Surplus Property: MTA Real Estate has systematically surve yed the nearly 13,000 parcels that make up the right-of-ways and other properties co ntrolled by MTA and its constituent agencies, and has identified a variety of oppo rtunities to generate revenues from overbuilds and/or outright dispositio ns of such properties. Most notably, MTA Real Estate is in the process of implementing an office space right-sizing plan that will reduce the square footage of administrative office space by nearly 20%, allowing for the disposition of NYC Transit’s former headquarters at 370 Ja y Street in Brooklyn and culminatin g in the vacating and disposition of the 341, 345 and 347 Madison Avenue properties in Manhattan. The following table captures July Plan projections of Other Operating Revenue:
2014 2015Mid-Year PreliminaryForecast Budget 2016 2017 2018
Rental Income $106 $98 $101 $103 $107Advertising 135 139 144 148 152Paratransit Reimbursement 176 182 199 221 240Fare Reimbursement (students/seniors) 99 100 100 100 100Concessions 8 8 8 8 8Parking 18 18 19 19 19All Other (Investment Income, MetroCard "Green" Fee, Recoveries, etc) 174 99 96 96 97Total Other Operating Revenue $717 $644 $667 $696 $723
July Financial Plan 2015-2018
($ in millions)
Other Operating Revenue
II-15

Over the course of the Plan, year-to-year changes reflect a decrease of $73 million in 2015 and increases of $23 million in 2016, $30 million in 2017, and $27 million in 2018. The year-to-year decrease in 2015 mainly reflects changes to the timing of Sandy-related storm recoveries, which impacted most Agencies, as well as reductions at MTA HQ due to lower rental revenue generated from the Madison Avenue buildings and re-estimated charge-backs to Agencies for reduced work performed by MTA HQ. By Agency, the decrease in 2015 revenue is as follows: $41 million at NYCT, $10 million at MTA HQ, $8 million at MNR, $6 million at MTA Bus, $5 million at B&T, $2 million at SIR, and $2 million at the LIRR. Year-to-year revenue growth from 2016 to 2018 is mainly attributable to higher NYC reimbursements for paratransit services at NYCT of $20 million in 2016, $26 million in 2017 and $22 million in 2018; reimbursement of consolidation/relocation expenses from the disposition of the Madison Avenue properties; a nd inflationary increases at MTA HQ of $2 million in each year. Compared with the February Plan, Other Operating Revenue increases by $61 million in 2014, $33 million in 2015, $28 million in 2016, and $23 million in 2017. The increase in 2014 primarily reflects expected receipt of Sandy storm-related recoveries from insurance and the federal government, and higher investment income at FMTAC. The revenue increases from 2015 through 2017 reflect higher investment income at FMTAC; New York State sup port for the Verrazano Narrows Bridge toll rebate program; higher Two Broadway rentals at MTA HQ; and the timing of a real estate sale in 2015 at the LI RR. Partially offsetting these revenue increases are decreases at NYCT from 2015 through 2017 caused by reductions in NYC reimbursements for paratransit services, resulting fr om lower than previously forecast ed paratransit ridership growth. Excluding the projected increase in investment income, other operating revenues increase by $36 million in 2014, $9 million in 2015, $3 million in 201 6 and decrease by $ 2 million in 2017. PAYROLL At the time that Volume II went to press, the LIRR and its labor unions were in contract negotiations. Volume I presents an updated status of those discussions and a re-estimated cost impact to the LIRR (and Metro-North), as well as MTA’s overall bottom line. MTA Consolidated Payroll expense s from 2014 through 2018 are influ enced by a number of factors including position levels, inflation assumptions, labor agreements, pro grams and initiatives, and capital project activity. The July Plan baseline reflects the recent labor settlement at NYCT with the Transport Workers Union (TWU), MTA’s largest collective bargaining unit, and assumes the s ame pattern settlement for employe es represented by unions without contract agreements. Accordingly, effective upon the expiration of contracts for those unsettled unions, the following pattern has been applied: 0.87% in Year 1; 0.95% in Year 2; 2.23% in Year 3; 2.22% in Year 4; 1.88% i n Year 5; and 2.00% annually going forward. For MTA HQ, the Plan includes the impact of th e settlement with the Police Bene volent Association (P BA). Salaries for non -represented employees, who have not received a general salary increase during t he last f ive years, are assumed to follow CPI-based in creases. The 2014 Mid-Year Forecast baseline includes the compounding of raises for 2012 and 2013; however, as of t he July Plan, no raises have been granted.
II-16

In 2014, these wage settlements and assumptions result in payroll adjustments estimated at $256 million, including $122 million in retroactive payments and $134 million in new wage base adjustments. Starting in 2015, new wage base adjustments average $157 million per yea r through 2018. These labor costs are in excess of the February Plan provision and results in a significant unfavorable impact to th e operating budget. A portion of th is additional cost will be funded by the suspension of contr ibutions to t he GASB fund. Additional information on labor matters are addressed in Volume I. July Plan payroll expe nses are pr ojected at $4,576 million in 2014, $4,614 million in 2015 , $4,701 million in 2016, $4,813 million in 2017, and $4,904 million in 2018. On a year-to-year basis, expenses increase by $37 million in 2015, $88 million in 2016, $111 million in 2017 and $92 million in 2018. The year-to-year growth in 2015 i s mostly attr ibutable to higher expenses of $ 66 million at NYCT, $5 million at MTA Bus, $3 million at B&T, and $2 million at MTA HQ, partially offset b y expense reductions of $26 million at the LIRR and $13 mi llion at MNR. The o verall increase mostly reflects the impact of the TWU settlement and pattern wage assumpt ions. 2015 expenses exclude non-recurring retroactive wage payments from 2014 (except at N YCT where such payments for a few of the smaller unions are assumed to occur in 2015). Aside from ne w wage impacts, expense growth is f urther influenced by ne w and existing maintenance and operational programmatic investments, IT-related initiatives, contractu al escalations, reduced vacancy assumptions, and the full-year impact of newly authorized positions. (See agency sections for specific program details and headcount implications). Year-to-year average annual expense growth from 2016 to 2018 largely reflects the continuing impact of the labor adjustments, as well as headcount growth related to East Side Access (ESA) readiness efforts at the LIRR, and the Shop Overhaul and t he Salvage and Shop programs at MTA Bus. Compared with the February Plan, Payroll exp enses increase by $20 9 million in 2014, $137 million in 2015, $116 million in 2016, and $101 million in 20 17. Plan-to-plan increases in 201 4 mainly reflect the impact of one-time retroactive wage payments an d wage gro wth pattern assumptions described earlier. By Agency, overall changes are as follows: $90 million at NYCT; $52 million at the LIRR; $35 million at MNR; $13 million at MTA Bus; $11 million at MTA HQ; $6 million at B&T; and $1 million at SIR. In 2015, hig her expense projection s totaling $ 137 million mainly reflect a continu ation of the wage growth pattern. Total change by Agency is as follows: $99 million at NYCT; $12 million at MNR; $12 million at MTA HQ; $5 million at B&T; $4 million at MTA Bus; $4 million at the LIRR; and $1 million at SIR. Also within the 2015 projections is the inclusio n of retroactive pay at NYCT for several small unions. For 2016 and 2017, expense increases mainly reflect a continuation of the wage growth pattern and includes additional resources necessary to support new and existing efforts, which include: support for bus, statio n, and track maintenance-related initiatives at NYCT; t he Farebox Maintenance initiative, aging fle et requirements, and revised Shop Overh aul Program assumptions at MTA Bus; the Enterprise Asset Management initiative at MNR; and the MTA Information Technology Transformation Initiative at MTA HQ. These increases are partially offset by revised ESA ramp-up assumptions at the LIRR.
II-17

OVERTIME MTA Consolidated Overtime expenses are influenced by a number of fa ctors including vacancies, employee availability, wage growth assumptions, project activity, weather, and wor k rules. The MTA has b een proactive in its efforts to corr ect these d eficiencies and has made Agency-specific recommendations such as: determining underlying causes for higher absenteeism and addressing abu ses; performing cost/ben efit sensitivity analysis on overtime vs. straight time economies; re-focusing effort s to achieve overtime control; and addressing fundamental issues responsible for overtime levels. The MTA is commit ted to more effectively manage these costs. July Plan expenses are projected at $680 million in 2014, $607 million in 2015, $612 million in 2016, $623 million in 20 17, and $635 million in 2018, reflecting a year-to-year decrease of $73 million in 2015, and increases of $5 million in 2016, $11 million in 2017, and $12 million in 2018. Included within this cate gory are expenses attributable to the recent labor settlement with the TWU and the assumption that the same pattern will be app lied to other unions without contract agreements. For MTA HQ, the Plan includes t he impact of the PBA settlement. Accordingly , those impacts, including retroactive pay, are as follows: $33 million in 2014; $18 million in 2015; and $19 million in each of the out-years. The year-to-year decrease in 2015 is mostly attributable to NYCT ($45 million) due to increased coverage necessitated by adverse weather experienced in early 2014 and a leveling-off of some 2014 planning-related assumptions, such as those for vacancy and absente e coverage. Expenses decrease at the LIRR ($15 million) mostly due to the one-time retroactive payment in 2014 based on the la bor assumption described above, anticipated lower weather-related overtime and lower req uirements for project a ctivity. Expenses decre ase at MNR ($6 million ) mostly due to a one-time retroactive payment in 2014 based on the labor assumption described above. MTA Bus expenses decrease in 2015 ($5 million) due to lower weather-related overtime and lower coverage required for fle et maintenance. Out-year changes largely reflect the impact of general wage increase assumptions. When compared with the February Plan, overtime expense s increase by $122 million in 2014, $58 million in 2015, $5 9 million in 2016, and $61 million in 2017. Th e bulk of th e increase reflects retro-active wage payments and new wage patterns resulting from the wage settlement assumptions. Accordingly, 2014 results to date reflect an overall higher level of overti me expenses. In addition to the wage impacts, expense increases are driven by NYCT ($70 million in 2014, followed by average annual increases of $36 million thereafter) due to adverse weather in early 2014 and refining overtime projections to more accurately reflect usage lev els needed for additional bus traffic, FasTrack, signals and facility maintenance, and increased supervision requirements. MNR’s e xpense increases ( $23 million in 2014 followed by a verage annual increases of $19 million thereafter) are mostly attributable to coverage associated with programmatic and routine maintenance, sch eduled service, weather emerge ncies, and unscheduled maintenance. LIRR’s plan-to-plan increases ($23 million in 2014 followed by average annual increases of $5 mill ion thereafter) are due to revised weather-related coverage requirements and short-term progra mmatic initiatives. At MTA Bus, expenses incr ease by $6 million in 2014 and remain basica lly unchanged for each of the out-yea rs, due to coverage for inclement weather and vacancies, as well as for fleet maintenance. It should be noted that actual Non-Reimbursable and Reimbursable overtime spending year-to-date through May, 201 4 exceeded the Adopted B udget by $91 million. Approximately $2 6 million or 28% of this variance is attributable to weather emergencies, specifically, $17 million at
II-18

NYCT, $4 million at the LIRR, $3 million at MNR, and $2 million at MTA Bus. The July Plan has been adjusted to refle ct improved forecasting and steps necessary to address overtime spending affected by vacancy/absentee coverage issues, u nscheduled service, and programmatic/routine maintenance. HEALTH & WELFARE Empire Plan premium rates provided in April 201 4 by the Ne w York State Departme nt of Civil Service are used as t he primary assumption for per-employee Health & Welfar e premium expenses in 2014 and 2015. Premi um forecasts for 2016 through 2018 are based on the 10-year average change in premiums, excluding the largest and smallest annual percent changes. For employee health plans other th an the Empire Plan, existing contra ctual rates—and when available projected rate changes—are used in place of the Empire Plan assumptio ns. Year-to-year changes in expenses are also impacted by position levels. MTA Consolidated Health & Welfare expenses are $995 million for the 2014 Mid-Year Forecast. July Plan Health & Welfare expenses for the 2015 Preliminary Budget are projected to b e $1,070 million, $76 mil lion greater than 2014 expenses, primarily due to hig her costs for premiums and anticipated increases in positions. MTA Consolidated Health & Welfare expenses are forecast to increase annually by 6.2%, 7.4% and 7.7%, respectively, for 2016 through 2018, when expenses are projected to reach $1,314 million. July Plan forecasts are lower than expense forecasts in th e February Plan, favorable by $32 million in 2014, $30 million in 2015, $46 million in 2016 and $53 million in 2017. These favorable changes are attributable to lower projected co sts for premiums primarily due to a decrease in the projected 2013 claims base, a reduction in the 2013 trend estimate as well as the impact of anticipated increases in Health & Welfare contributions resulting from labor settlements. OTHER POST-EMPLOYMENT BENEFITS (OPEB) and GASB FUND OPEB In 2007, the MTA implemented the Governmental Accounting Standard Board Statement No. 45 (“GASB-45”), “Accounting and Financial Reporting fo r Employers for Post-Employment Benefits Other Than Pensions,” requiring that state and local go vernmental entities’ financial reports reflect systematic, accrual-based measurements and the recognition of Other Post-Employment Benefit (OPEB) costs over a period that appr oximates the employee’s years of service and provides information about actuarial accrued liabilities and to what extent progress is made in the funding of any liabilities. Prior to that, the MTA and other governmental employers’ OPEB costs had been funded on a “pay-as-you-go” basis and were reported in the financial statements when the “promised” benefits were paid. The annual review by the MTA’s actuary resulted in an incr eased annual required contribution (ARC) to $2,843 million, as of December 31, 2013, an in crease of 7.4% over the pri or ARC of $2,648 million. The val ue of the unfunded accrued liabil ity in the 20 12 valuation is currently estimated to be $19.9 billion, an increase of 12.3% over the estimate in the 2010 valuation. The July Plan accrued baseline reflects the pay-as-you-go component for the OPEB expense category called “OPEB Current Payment.” Growth in this category is consistent with the assumptions described under Health & Welfare.
II-19

In comparison with the February Plan, OPEB cu rrent payment expenses are favorable by $28 million 2014, $29 million in 2015, $37 million i n 2016 and $41 million in 2017. T he favorable variances are primarily due lower employer premium assumptions. GASB FUND While the GASB 45 standard only requires the disclosure of this f uture liability, the MTA has taken measures to fund this growing liability . Agency contributions to this GASB fund are captured in the Cash Receipts an d Expenditures Statement. In Jun e 2008, the MTA Board approved the establish ment of the “MTA Retiree Welfare Benefits Trust” (“OPEB Trust”) to govern the administration and investment of th e OPEB Trust assets. Annual contributions are deposited with the MTA Treasurer in the GASB Fund Rese rve, with the intent of periodically moving such funds into the OPEB Trust. Since 2012, $300 million has been move d from the GASB Fund Reserve to the OPEB Trust. As a result of the TWU labor settlement, the MTA intends to fund a po rtion of the settlement impact with the suspension of cont ributions to the GASB f und beginning in mid-2014 lasting through 2017, with re duced contributions to continue t hereafter. The MTA remains fully committed to the import ance of funding this growing obligation, and this topic will be revisited should MTA’s financia l situation improves. Annual projected contributions are $48 million in 2014, $0 in 2015 through 2017 and $10 million in 2018. In comparison with the February Plan, the imp act of the changes to t he cash Contribution to GASB Fund expenditures result in favorable b udgetary variances of $50 million in 2014, $10 6 million in 2015, $114 million in 2016 and $1 23 million in 2017 due to the suspension of contributions beginning in mid-2014 and lasting through 2017. PENSIONS MTA employees are covered by a number of separate and distinct pension p lans. All B&T employees and two-thirds of empl oyees at NYCT are participants in the New York Cit y Employee Retirement System (NYCERS). The remaining one-third of NYCT e mployees are participants in the Manhattan and Bronx Surface Transit Operating Authority (MaBSTOA) Plan, one of three MTA-sponsored Plans. The othe r two MTA-sponsored plans—the MTA Defined Benefit Plan and the Lo ng Island Rail Road Ad ditional Plan—cover employees at the LIRR, MNR, SIR, MTA Bus a nd MTA Po lice (which is part of MTAHQ). Non-police e mployees at MTAHQ are participants in the New York State and Local Retirement System (NYSLRS). Year-to-year pension cost changes are influenced by the most recent actuarial valuations for the pension plans that MT A employees participate in, as well as chang es in assu med position levels, wage growth a nd labor settlements. Pension expenses refle ct changes to actuarial assumptions, the most significant of which is a lowered assumed rate of return on investment s from 8.0% down to 7.0%1 for NYCERS and from 7.5% down to 7.0% for MTA-sponsored Plans beginning in FY20132. Additionally, year-to-year pension cost changes reflect the impact of a new pension tier—Tier 6—which applies to new participants of NYCERS, NYSLRS, MaBSTOA and MTA Police members of the MTA Defined Benefit Plan hired after April 1, 2012.
1 The 8.0% rate of return assumption was based on a return gross of expenses while the current 7.0% rate of return assumption is based on a return net of expenses; the change from 8.0% to 7.0% is, in effect, a net decrease of 80 basis points (0.8%). 2 NYCERS FY2013 began on July 1, 2012; MTA-sponsored Plans’ FY2013 began on January 1, 2013.
II-20

Pension expenses total $1,341 million in 2014 and decrease by $11 million in 2015, $5 million in 2016 and $11 million in 2017 and increase by $13 million in 2018, when total pension expenses are projected to be $1,327 million. Pension expenses are based on actuarial projecti ons; where projections are unavailable, the for ward three-year average CPI plus one percent—which is a proxy intended to capt ure anticipated impacts from demographic changes of employees and retirees—is applied to projections. Compared with the February Fina ncial Plan, expenses are unfavorable by $21 million in 2014 and favorable by $2 million in 2015, $28 million in 2016 and $43 million in 2017. Plan-to-plan variances reflect the impact of lower pension costs in the outer years resulting from a forecast revision of Tier 6 me mbership. Partially offsetting these savings is the impact for anticipated labor settlements. OTHER FRINGE BENEFITS The Other Fringe Benefits catego ry captures costs for Worker’s Compensation and Fede ral Insurance Contributions Act (FICA) expenses at all Agencie s except the Commute r Railroads. For the LIRR and MNR, Federa l Employees Liability Act (FELA) expenses and Railroad Retirement taxes (RRT), which are similar in nature to Worker’s Compensation and FICA, are also included, as are miscellaneous employee expenses. July Plan Expenses are projected at $617 million in 2014, $616 million in 2015, $637 million in 2016, $662 million in 2017, and $684 million in 2018. Over the course of the Plan, on a year-to-year basis, this results in a reduction of expe nses totaling $0.4 million in 2015, followed b y average annual increases of $23 million from 2016 through 2018. Included in the July Plan are expenses attributable to the recent labor settlement wit h the TWU (PBA at MT A HQ) and the assumption that the same pattern will be a pplied to ot her unions without contract agreements. The anticipated i mpact is $26 million in 2014; and $14 million in each of the out-years. Aside from the wage impacts noted above, the year-to-year decrease in 2015 is mainly at the LIRR ($5 million) and MNR ($2 million) and reflects the latest Railroad Retirement Tax and Railroad Unemployment assumptions as well as employee claims adjustments. This is partially offset by higher expenses at NYCT ($7 million), reflecting the overal l impact of staffing levels, programmatic changes, and inflationary payroll rate assumptions. For the years 2016 through 2018, year-to-year average annual expense growth is $11 million at NYCT, $6 million at the LIRR, $3 million at MNR, and $2 million at MTA Bus, an d is consistent with changes in staff ing levels, employee i njury claims, payroll rate assumptions, and a continuation of the RRT and Railroad Unemployment assumptions at th e Commuter Railroads as noted above. Compared with the February Plan, 2014 expenses increase by $31 million pri marily due to adjustments for the TW U-based wage pattern. By Agency, plan-to-plan increases in 2014 are $14 million at NYCT, $11 million at the LIRR, $3 million at MNR, $1 million at SIR, and a total of $1 million combined at MTA HQ, B&T, and MTA Bus. The increases in subse quent years through 2017 reflect new wage pattern adjustments and a continuation of the RRT and Railroad Unemployment assumptions at the Commuter Railroads.
II-21

ELECTRIC POWER Electric Power is supp lied to the MTA by th e New York Power Authority (NYPA), the Long Island Power Authority (LIPA) and Connecticut Light & Po wer (CL&P). MTA has a Long-Term Agreement (LTA) through 2017 wit h NYPA to meet MTA’s electricity requirements within the City of New York and Westchester County. T he LTA requires that certain NYPA assets, such as a share of low-cost upstate hydroelectric p ower and dedicated lo w-cost transmission lin e capacity from upstate New York, be allocated to serve the MTA and NYPA’s other governmental customers located in New York Cit y. Additionally, along with NYPA and the other governmental customers involved in the LTA, MTA has a long-term share in the Astoria II power plant. Expenses associated with the NYPA LTA are based on NYPA’s current 2014 cost of service estimate, which reflects actuals through February and a May revision for the re mainder of the year. Projections after 2014 for NYPA cost of service are based on changes in t he national consumer price index as well as projected co mmodity price changes for natural gas and diesel fuel. Delivery of NYPA-supplied e lectricity is ha ndled by Consolidated Edison (Con Ed), and delivery cost projections through 2015 are based on rates without increases as approved by the State Public Service Commission (PSC); alternating 10% and 15% increases are expected for subsequent years. The 2014 Con Ed delivery rate also reflects the final phase-in of the delivery rate redesign, which began in 2011; as of April 2014, the Con Edison delivery rat e charged to MTA reflects full delivery cost. The forecast for NYPA-supplied electricity for the 2014 Mid-Year F orecast is projected to increase 17.39% for traction power and 4.9% for non-traction power, compared with 2013 costs; this reflects steeper prices for nat ural gas, th e primary variable cost in the gen eration of electricity. The 2014 Adopted Budget assumed a decline of about 3 percent due to lower diese l fuel and natural gas prices, and also assumed an offset for a contractual accounting adjustment for prior year expenses would take place in 2013; NYPA is working to finalize this adjustment and it is now expected to take place in 2014, and is reflect ed in the 2014 Mid-Year Forecast. Con Ed deli very rates are projected to be 5.2% greater than charges incurred in 2013, lower than the projected 12.7% increase in the Adopted Budget assumption. The rate for NYPA-supplied electricity for the 2015 Preliminary Budget, compared with the 2014 Mid-Year Forecast, is projected to decrease 14.8% for both traction and all other purposes, reflecting a projected significant reduction in natural gas prices along with a modest decline in diesel fuel costs. This change a lso reflects the one-time account ing adjustment payment expected in 2014; without that adjustment, the year-to-ye ar decrease would be 13.3%. In th e February Plan, 2015 NYPA expenses were projected to increase 5.5%. Con Ed delivery rates are projected to be un changed from 2014, reflecting the PSC approved rates; in t he February Plan, Con Ed delivery rates were projected to increase 10.4% from 2014 to 2015. NYPA rates, both for traction and for all other uses, are expected to increase 1.3 % in 2016, 16.4% in 2017 and 7.6% in 2018. The February Plan as sumed NYPA rates wo uld increase 5.3% in 2016 and 4.4% in 2017. For 2016 through 2018, Con Ed delivery rates are projected to be 10% in 2 016, 15% in 2017 and 1 0% in 2018; in the February Plan Con Ed increases were projected to be 10% for both 2016 and 2017. Price projections for electricity supplied by LIPA and CL&P are based o n Producer Price Index for Electric Power forec asts, and are projected to increase 4.2% in 2014, compare d with the 3.8% increase assumed in the Ado pted Budget. The LIPA and CL&P rates for electricity are estimated to increase 1.6% in 20 15, slightly higher than the 1.3% projection in the February
II-22

Plan. For 2016, LIPA a nd CL&P ra tes are exp ected to increase 0.9% (compared with 2.3% projected in the February Plan), increase 3.2% in 2017 (co mpared with 2.4% in the February Plan), and increase 3.4% in 2018. MTA Consolidated Electric Power expenses of $551 million for the 2014 Mid-Year Forecast are $58 million (11.7%) higher than 2013 expenses. This estimate is $16 million (3.0%) unfavorable compared with the Adopted Budget projection, and primarily reflects the impact of higher natural gas prices on rates, as well as the delay into 2014 of the NYPA n on-recurring accounting adjustment. Expenses for the 2015 Preliminary Budget are expected to be $514 million, a decr ease of $37 million (6.7%) from the 2014 Mid-Year Forecast, pr imarily reflecting the impact of lower natural gas prices on annual r ate changes and the additional expense in 2014 of the NYPA non-recurring accounting adjustment. Compared with the February Plan, 201 5 is $56 million (9.8%) favorable, due to lower than previously projected electric rates and t he unchanged Con Ed delivery rate in 2015. MTA Consolidated Electric Power expenses are forecast to increase by 4.0% in 2016, 13.8% in 2017 and 7.8% in 2018, reaching $656 million in 2018. Compared with the February Plan, fore casts are $71 million (11.7%) favorable in 2016 and $35 million (5.4%) favorable in 2017. FUEL Diesel and natural gas prices for the 2014 July Financial Plan include actual prices through April 28, 2014 a nd reflect commodit y futures price s as of May 6, 2014. W here commodity futures prices are unavailable, price changes are projected using Global Insight forecasts (May 2014) for New York Harbor No. 2 Distillate for heating oil and diesel and PPI ( Producer Price Index) Utility for Natural Gas. Oil prices a re forecast t o change modestly from the projections used in the July Plan. On a year-to-year basis, Ultra Low Sulfur Diesel (ULSD) prices are projected to decrease by 3.6% and 3.8% in 2015 and 2016, respectively, and then increase by 1.8% and 3.0% in 2017 and 2018, respectively. For Compressed Natural Gas (CNG), prices are forecast to d ecrease by 28.3% and 2.8% in 2015 and 2016, respectively, but increase by 16.4 % and 5.2% in 2017 and 2018, respectively. Since 2008, the MTA h as used fin ancial instruments to hedge a portion of its pr ojected fuel expense to reduce bu dgetary risk from price volatility.3 The MTA intends to co ntinue this strategy, with new hedge contracts extending as far as 24 months from execution date, which provides a measure of financial stability from price fluctuations. At any poi nt in time, approximately 50% of the projected fuel usage for the forward 12-month period will be hedged. Fuel expenses of $268 million for the 2014 Mid-Year Forecast are virtually unchanged from the 2014 Adopted Budget. The 2014 Mid-Year Forecast price for ULSD and Hea ting Oil are estimated to be $0.02 and $0.11 per gallon lower, respectively, while CNG prices a re estimated to be $1.88 per MMBTU (million metric British thermal unit) higher than price assumptions in the 2014 Adopted Budget. Fuel expenses for the 2015 Preliminary Budget are estimated to be $265 million, $ 3 million less than projected in the February Plan. The price for ULSD is estimated to be $0.0 1 per gallon 3 Financial impacts from fuel hedge settlements are reflected in cash subsidies, not in the fuel expense category.
II-23

lower than assumed in the February Plan, CNG prices ar e projected to be $0.11 per MMBTU lower, while Unleaded Gasoline is estimated to be $0.01 per gallon higher, than the February Plan. July Plan F uel expenses in 2016 are estima ted to be $ 254 million, $14 millio n less than projected in the February Plan. The price for ULSD is est imated to be $0.15 per gallon lower and CNG prices are estimated to be $0.39 per MMBTU lower, than the February Plan. July Plan F uel expenses in 2017 are estima ted to be $ 259 million, $17 millio n less than projected in the February Plan. The price for ULSD is estimated to be $0.19 per gallon lower, but CNG prices are estimated to be $0.25 per MMBTU higher, than the February Plan. July Plan Fuel expenses in 2018 are estimated to be $268 million. INSURANCE The MTA’s insurance p rograms are obtained th rough the commercial insurance marketplace and by the MTA’s First Mutual Transportation Assurance C ompany (FMTAC), which is a pure captive insurance company. The programs insured by FMTAC include: 4 The following table measures MTA Consolidated Insurance expenses:
4 A portion is insured through FMTAC and the remainder is insured in the global market. 5 These policies are insured through FMTAC and then reinsured in the global market. 6 Only the deductible portion of these policies is captured within FMTAC.
Insurance Expenses2013
Actual
2014 Mid-Year Forecast
2015 Preliminary
Budget 2016 2017 2018
NYCT $62 $68 $77 $89 $102 $117
LIRR 20 24 26 29 33 36
MNR 14 18 20 22 24 27
SIR 1 1 2 2 2 2
MTA Bus 3 3 4 5 6 6
B&T 10 16 17 19 20 22
MTAHQ 3 2 2 2 2 3
Total Gross Insurance Expenses $113 $132 $148 $167 $189 $214
Insurance Credits
FMTAC ($75) ($84) ($90) ($97) ($104) ($113)
Net Insurance Expenses $39 $48 $58 $71 $85 $101
MTA CONSOLIDATED INSURANCE EXPENSES
Non-Reimbursable
($ in millions)
All-Agency Excess Liability (Primary) All-Agency Excess Liability (Excess)1 All-Agency Protective Liability (Primary) All-Agency Protective Liability (Excess) All-Agency Protective Liability (LORAM) All-Agency Property Policy2
All-Agency Sabotage & Terrorism2 Comprehensive Automobile Liability3 Paratransit (Access-A-Ride)3 Station Liability – LIRR & MNR Force Account – LIRR & MNR Premises Liability
II-24

The table captures gross insurance expenses by Agency, includin g some co sts that are contracted between MTA Risk Ma nagement on behalf of MTA Agencies and the commercial marketplace. It also captures FMTAC expen se credits necessary for correct accounting treatment. Since FMTAC is an MTA Agency, its finances are incorporated within MT A consolidated financial reports and budgets. Therefore, premiums paid by an Agency to FMTAC result in off setting revenue that has to be cre dited. What remains, and is captu red as net insurance expenses, are only those costs that exclude a FMTAC co mponent. This include s costs for policies that are contracte d directly between MT A Risk Management on behalf of a n Agency and the commercial marketplace, as well as for FMTAC policies that are then re-insured in the commercial marketplace. Insurance expenses includes su pplemental coverage in MTA’s p roperty program, which provides for a further la yer of $200 million of fully collateralized coverage for losses from storm surges that surpass spe cified trigger levels in New York Harbor or Long Island Sound and are associated with named storms that occur at a ny point in t he three year period fr om July 31, 2013 to July 30, 2016. The expanded protection is reinsured by MetroCat Re Ltd., a Bermuda special purpose insurer formed to provide FMTAC with capital markets-based property reinsurance. The MetroCat Re reinsurance policy is fully collateralized by a Regulation 114 trust invested in U.S. Treasury Money Market Funds. The additional coverage provided is available for storm surge losses o nly after amounts available under the $500 million in general property reinsurance are exhausted. Year-to-year increases in Insurance expense ar e primarily driven by a ssessments of market conditions made by MTA’s Risk Management Department in conjunction with its master broker. Policy premiums are primarily drive n by c hanges in underlying losses and market conditions, and are further influenced by factors such as claims losses, reserve adjustments and exposure (e.g., projected ridership, vehicle count, and volume of capital work). In comparison with the February Financial Pla n, MTA Co nsolidated Insurance expenses are favorable by $3 million in 2014, $10 million in 2015, $17 million in 2016 and $25 million in 2017. The favorable variances are primarily due to the renewal of several large policies at prior year rates, partially offset by higher premiums in the Excess Loss Programs. CLAIMS Claims expenses are ba sed on actuarial valuations of projected claims, actual claims expense paid and any adjustments to reserves. Claims expenses in th e July Fina ncial Plan a re projected to be $20 4 million in 2014, $21 5 million in 2015, $217 million in 2016, $225 million in 2017 and $228 million in 2018. In comparison with the February Financial Plan, Claims expenses are unfavorable by $3 million in 2014, $4 million in 2015, $2 million in 2016 and $6 million in 2017, reflecting the latest actuarial valuation of projected claims. PARATRANSIT SERVICE CONTRACTS Paratransit Service Co ntracts are third-party contracts for federally mandated transportation services that benefit people covered under the Americans with Disabilities Act, as well as their personal care attendants. Funding is provided for direct tra nsportation costs (primary vendors, vouchers and taxis) a nd eligibility determinations, as well as for operational services fo r scheduling and dispatching trip s. Maintenance expenses for vehicle rehab ilitations, the
II-25

scheduling system, the Automated Vehicle Lo cator and the Interactive Voice Response system are also included. Faced with a projected rapid growth in the demand for paratransit service and an associated increase in expenses, in 2010, MT A embarked on an ambi tious plan to control expenses. This included reducing non-service related costs and average cost per trip, improved enfo rcement of eligibility requirements, and the conversion of c ontracted trips to fixed route feeder trips. Following up in September, 2013, the MTA introduced the Paratransit Fare Incentive (Zero Fare Proposal), an efficiency initiative that would ena ble paratransit customers to ride subways and buses for free using special zero-fare MetroCards. July Plan expenses are projected to be $382 million in 2014 , $392 million in 2015, $427 million in 2016, $480 million in 2017, and $523 million in 2018, reflecting year-to-year increases of $10 million in 2 015, $35 million in 2016, $53 milli on in 2017, and $42 million in 2 018. These increases mainly reflect projected annual trip growth of 7% and CPI inflationary adjustments o n paratransit carrier contracts. Compared with the F ebruary Financial Plan, Paratransit Service Contract expenses are projected to decrease by $12 million in 2014, $ 20 million in 2015, $29 million in 2016, and $45 million in 2017. The savings are primarily the result of a projected reduction in trip activity. For a complete income statement on Paratransit, please refer to Section II, Major Assumptions 2014-2017 Projections-Baseline, Subsidies. Further information on Paratransit saving initiatives is included in Section II, Major Assumptions 2014-2018 Projections-Baseline, Agency Baseline Assumptions, and Paratransit. MAINTENANCE AND OTHER OPERATING CONTRACTS Maintenance and Othe r Operating Contracts is a broad c ategory of expenses that includes facility expenses (e.g., leases, rentals, utilities, real estate taxes), operating cont racts (e.g., equipment/vehicle rental, E-ZPass tags, envi ronmental testing and services, rolling stock purchases), and maint enance services (e.g., construction services, snow removal). Expense forecasts for this category are based on contractual increases and regional CPI forecasts. July Plan expenses are projected at $591 million in 2014, $630 million in 2015, $659 million in 2016, $637 million in 2017 and $633 million in 2018, re flecting year-to-year increases of $40 million in 2015 and $28 million in 2016, followed by decrea ses of $22 million in 2017, and $3 million in 2018. The year-to-year increase in 2015 i s attributable to: MTA Bus ($29 millio n) mostly due to Shop Program changes in Hybrid Bus conversion and MCI engine and structural upgrades; SIR ($8 million), mainly due to the R44 car fleet main tenance program; B&T ($5 million), mostly for major maintenance and preventive maintenance for key bridge and tun nel components, the E-ZPass Tag Replacement program and an increase for E-ZPass Customer Service Cent er expenses associated with the All Electronic Tolling (AET) program; NYCT ($4 milli on), mostly attributable to purchases of paratransit vehicle s; and MNR ($3 million) mainly d ue to a ne w cycle of locomotive o verhauls. T hese unfavorable proje ctions are partially offset by lower expenses at the LIRR ($6 million) and are due to the completion of the elevator maintenance overhaul and concrete tie rep lacement programs, lower non-revenue vehicle repairs and replacement, and various secur ity initiatives; and MTA HQ ($3 mill ion) mostly due to th e presumed leasing of the Madison Avenue properties.
II-26
The year-to-year increase in 2016 is mainly dr iven by: NYCT ($11 million), largely due to th e timing of bus shop requirements; SIR ($8 million), due to the full year cost of the R44 car fleet maintenance program; B&T ($6 million), mostly for major maintenance and preventative maintenance for key br idge and tu nnel components, and E-ZPass Customer Service Center expenses associated with the All Electronic Tolling (AET) program; MNR ($4 millio n) mainly for a new cycl e of lo comotive overhauls; and the LIRR ($2 million) fo r contractual and norm al inflationary increases. These unfavorable projections are partially offset by lower expenses at MTA Bus ($4 million), primarily caused by changes in the Shop Overhaul Program. The year-to-year decrease in 2017 is mainly attributable to: SIR ($17 million), pri marily due to the shifting of expenses for the R44 car fleet maintenance program to 2016 from 2017 thereby accelerating the program; MTA Bus ($10 million) mostly due to chang es in the Sh op Overhaul Program; and NYCT ($9 million), mainly due to the timing of bus sh op requirements which pushed expenses into 2016. Partially offsetting these lower expenses are higher expenses a t the B&T ($6 million), due to major and preventive maintenance on key bridge and tunnel components and E-ZPass Customer Service Center expenses associated with the All Electronic Tolling (AET) program; the LIRR ( $5 million) mainly due to contractu al and normal inflationary increases; and MNR ($3 million) mostly driven by higher office space expenses and inflationary increases. The year-to-year decrease in 2018 is mainly driven by MTA Bus ($14 million), reflecting the impact of revisions to the Shop Ove rhaul Program. This fa vorable projection is par tially offset by unfavorable expenses at B&T ($ 7 million) mostly for major and preventive maintenance on key bridge and tunnel components, E-ZPass Custom er Service Center expenses associate d with the All Electronic Tolling (AET) program a nd the E-ZPass Tag Replacement Program, as well as the LIRR ($2 million), largely due to East Side Access start-up costs. Compared with the February Plan, Maintenance and Other Operating Contracts in crease by $8 million in 2014, $4 million in 2015, and $15 million in 2016 and decrease by $6 milli on in 2017. In 2014, plan-to-plan increases are driven by higher Two Broadway ground lease payments and IT new needs at MTA HQ, and higher SMS f leet maintenance expenses at NYCT. These projections are partially offset by lower expenses at MNR, reflecting savings resulting from lower lease expense for office space; delays in the locomotive o verhaul programs; and a review o f maintenance contracts that resulted in operating efficiencies. In 2015 and 2016, including th e aforementioned reasons at MTA HQ and NYCT, additi onal increases are driven by the shift ing of R44 car fleet main tenance program expenses from 2017 to 2016 at SI R; and the Infrastructure Improvement Program; New Haven Line car disposal co sts; customer enhancement projects at Grand Central Terminal; and power substation refurbishments at MNR. These unfavorable projections are partially offset by lower expenses at the LIRR mainly due to timin g and re-es timates of various contr acts; and at B&T due t o the shifting of some major projects into gen eral engineering services. In 2017, the plan-to-plan decre ase is driven primarily by the impact of the revised opening date of East Side Access a t the LIRR; and a shift in expenses for the R44 car fleet maintenance program from 2017 to 2016 at SIR. These favorable projections are partially offset by higher expenses for the afor ementioned reasons at MTA HQ, MNR and NYCT; as well as increases in the number of low-floor tires, CNG engines and transmission work, and Life Extension work scheduled to be performed on 22 MCI buses at MTA Bus.
II-27

PROFESSIONAL SERVICE CONTRACTS Professional Service Contracts broa dly consists of three ca tegories of expense: Information Technology (IT), Office and Employee expenses, and Othe r Professional Services. Information Technology expenses include soft ware, hardware, IT co nsulting, data center costs, and IT maintenance and repair. Office & Employee expenses include, but are not limited t o, expenses for temporary services, office equipment and related rentals, repair and mainte nance, and outside training. Other Professional Services includes, but is not limited to, fees for engineering, legal, auditing, and market research. July Plan annual expenses are projected at $346 million in 2014, $337 million in 2015, $325 million in 2 016, $327 million in 2 017, and $337 million in 2018, reflecting a decrease of approximately $9 million in 2015 , a decrease of $12 million in 2016 , followed by year-to-year increases of $2 million in 2017 and $10 million in 2018. Total year-to-year expense reductions in 2015 predominantly reflect decreases of $8 million at the LIRR, which capt ures revised timing a ssumptions of Information Techn ology system initiatives and various other professional servi ce contracts; decreases of $2 million at MNR, reflecting non-recurring 2014 budget system start-up costs; and decreases of $2 million at B&T, resulting from the completion of various st udies and surveys performed in 2014 und er General Engineering Services. These results are partially offset by expense increases totaling $1 million each at NYCT and MTA HQ, wh ich are mainly timing adjustments for several IT-related expenditures. Year-to-year average annual changes from 2016 through 2018 reflect the impact of i nflationary adjustments, reduced IT New Needs, re-estimates from 2015, and lower IT hosting expenses at MTA HQ where expenses are projected to decline by $9 million in 2016, remain flat in 2017, and increase by $2 million in 2018. Ot her changes year-over-year are further influen ced by the timing of information technology projects: NYCT expenses are projected to decline by $2 million in 2016, and increase by $2 million and $4 million in 2017 and 2018, respectively; at the LIRR, expenses are expected to fluctuate, declining by approximately $1 million in 2016, and rising to $2 million by 2018. Year-over-year changes at other agencies were modest and mostly reflect inflationary adjustments, the t iming of various IT-related projects, and several limited duration initiatives, as well as higher MTA PD costs related to the ESA project at MTA HQ. Compared with the February Plan, expenses increase by $8 million in 2014, $17 million in 2015, $8 million in 2016, and $5 million 2017. The major contributors are:
HQ: expense increases of $6 million in 2014, $11 million in 2015, $4 million in 2016, and $3 million 2017 reflect investments to the Enterprise Asset Management initiative and for the MTA Information Technology Transformation initiat ive which will provide key resources in support of MTA and Agency IT operations, including desktop support for all the agencies by in-house staff rather than outside vendors, and IT security.
B&T: expense increases of $7 million in 2014, $5 million in both 2015 and 2016, and $3 million in 2017 reflect the reclassi fication of several engineering projects from major maintenance, higher bond issuance fees resulting from projected incr eased financing activities, and higher re-estimates for procurement credit card purchases.
MNR: expense increases of $2 million in 2014 , and $1 mi llion annually in 2015–2017 mainly reflect Budget system implementation and maintenance costs.
II-28

NYCT: Annual expense decreases of $7 million in 2014 an d average annual reductions
of $2 million in 2015–2017, primarily result from Workers’ Compensation Board savings associated with New York State systemic reform.
MATERIALS AND SUPPLIES Materials & Supplies reflect funding for a variety of expenses including but not limited to rolling stock replacement parts, ele ctrical supplies, communication equipment, project materials, roadway equipment, and infrastruct ure maintenance supplies. Agency increases in Materials and Supplies for 2015 through 2018 are inflated primarily by regional CPI-U forecasts. July Plan expenses are projected at $550 million in 2014, $555 million in 2015, $565 million in 2016, $567 million in 2 017, and $ 570 million in 2018, refl ecting year-to-year increases of $5 million in 2015, $10 million in 2016, and $2 million in 2017 and 2018. The year-to-year increase in 2015 is mostly attributable to revise d timing a ssumptions, specifically at NYCT ($4 million) for the subway and bus fle et maintenance programs; and MTA Bus ($2 million) due to fluctuations in Shop Overhaul requirements. Year-to-year increases for 2016 through 2018 also reflect the chang e-out of M7 obsolet e materials and East Side Access readiness efforts ($7 million in 2016, $2 million in 2017, and $4 million in 2018) at the LIRR; the revised timing of su bway and bus fleet maintenance requirements at NYCT ($3 million in 2017 and $4 million in 2018), and fluctuation s in the timing of Shop Overhaul requi rements at MTA Bus ($4 million unf avorable in 2016, $2 million and $ 6 million favorable in 2017 and 2018, respectively). Compared with the February Plan, expenses increase by $22 million in 2014, $7 million in 2015, $9 million in 2016, and $3 million in 2017. The plan-to-plan incre ase in 2014 is mainly attributable to NYCT ($13 million) resulting from a rollover from 2013 of SMS fleet maintenance expenses; the LIRR ($4 million) d ue to a recl assification of security funding from Professional Services to Materials & Supplies; and MNR ($3 million) primarily due to derailment and infrastructure repairs and a write-off of obsolete inventory. For 2015-20 17, expense increases are primarily attributable to the retirement of the M3 fleet and maintenance on the M7 fleet at the LIRR; costs for the M7 Seat Chan ge-Out Plan, cost s associated with derailment repairs and security system installat ions at MNR; and changes in the Shop Overhaul Plan at MTA Bus. It should be noted that the LIRR will realize savings of $2 million in 2017 due to a r evised East Side Access ramp-up plan. OTHER BUSINESS EXPENSES Other Business Expenses reflect a variety of expenses in cluding credit and debit card fees for fare media purchases, bond service fees and internal subsidy support requirements. July Plan Expenses are projected at $181 million in 2014, $184 million in 2015, $198 million in 2016, $199 million in 2 017 and $2 09 million in 2018, reflecting year-to-year increases of $3 million in 2015, $14 million in 2016, $1 million in 2017 and $10 million in 2018. Included within this category are e xpenses attributable to the recent labor settlement with the T WU and th e assumption that the same pattern will be appli ed to other unions without contract agreements; accordingly those impacts are as fol lows: $6 million in 2014; and $11 million in each of the out-years.
II-29

The year-to-year increase in 2015 is mostly attributable to higher expenses at NYCT ($ 6 million), chiefly reflecting the impact of granting Metro-North Railroad and Long Island Rail Road commutation passes to TWU employees living outside of the five boroughs of New York City – a benefit resulting from the TWU contract settlement; and at MTA HQ ($4 million) fo r additional support to subsidiary representing t he MTA share of the Verrazano Narrows Bridge toll rebate program. These varian ces were partially offset by lower expenses at MNR ($8 million) mainly due to the shifting of a n anticipated reimbursement from Con Edison for revenue loss and expenses incurred as a result of a power out age on the New Ha ven Line that occurred in September 2013. The year-to-year increase in 2016 is mostly attributable to higher expenses at MNR ($11 million) mainly due to a proje cted non-recurring Con E dison reimbursement in 2015 and NYCT ($2 million) for providing railroad pa sses to TWU employees as a r esult of th e TWU labor settlement. The year-to-year increase in 2017 is mostly attr ibutable to MTA Bus ($ 2 million) due mostly to increased spending on Automatic Fare Collection (AFC) and Ticket printing fees/charges; MNR ($1 million) mostly due to the impact of additional service expansions and adjustments to West-of-Hudson subsidies; and B&T ($1 million) mostly due to inflat ionary adjustments. These variances were partially offset b y lower expenses at NYCT ($4 million) mainly due to reimbursable account adjustments impacting non-reimbursable expenses. The year-to-year increase in 2018 is mostly dr iven by the LI RR ($6 million) and cau sed by M3 fleet decommissioning expenses, and NYCT ($2 million) mostly due to providing railroad passes to TWU employees. Compared with the Fe bruary Plan, expenses i ncrease by $30 million in 2014, $1 7 million in 2015, $26 million in 2 016 and $2 3 million in 2017. The increases are mainly driven by th e Verrazano Narrows Bridge toll reb ate program at MTA HQ; providing railroad pa sses to TWU employees at NYCT; shifting a presumed reimbursement from Con Edison from 2 014 to 2015 for impacts resulting from a power outage on the New Haven Line; higher expense re-estimates at FMTAC; and the re classification of the Payroll Mobility Tax expenses from Other Fringe Benefits at MTA Bus. These unfavorable projections are pa rtially offset by lower e xpenses at MNR mainly caused by a presumed reimbursement from Con Edison in 2015, red uced subsidy payments to New Jersey Transit for West-of- Hudson operations, and lower processing fees for mobile ticketing; the reclassification of office supplies to Materials & Supplies at the LIRR; and favorable re-estimates of credit and debit card fees at B&T.
II-30

2014 Budget Reduction Program (BRP)
MTA Agencies were given a recurri ng deficit reduction target totaling $50 million in New Fare Reduction Initiatives for the July Plan. In order to achieve greater savings, Agencies were permitted to apply only 50% of real and discretionary prior-year (2013) favorable results toward meeting their deficit re duction target, with the remaining 50% available to help fund ne w programs. Additionally, for each Agency, the 50% share of 2013 favorable results (real and discretionary) can only be applied to reduce the amount of the 201 4 target an d cannot b e carried forward to meet the target in subsequent years. The BRP’s developed for this Plan result in pr ogrammatic savings that reduce the deficit b y $27.8 million in 2014, $45.9 million in 2015, $40.9 million in 2016, $36.8 million in 2017 and $36.5 million in 2018, as well as reflect a decrease of 99 positions by the end of the Plan period. All BRPs have been incorporated in to Agency baselines within the cate gory construct of MTA’s traditional financial statements.
Pos $ Pos $ Pos $ Pos $ Pos $
Agency:
New York City Transit/SIR 47 19.6 80 26.6 80 26.6 80 26.6 80 26.6Long Island Rail Road - 3.2 - 2.7 - 2.7 - 2.7 - 2.7Metro-North Railroad - 4.4 11 4.5 11 4.5 11 4.5 11 4.5Bridges & Tunnels - 0.0 - 0.0 - 0.0 - 0.0 - 0.0MTA Headquarters - 0.0 - 1.3 - 1.4 - 1.4 - 1.4
Total (Excluding MTA Bus) 47 $27.2 91 $35.2 91 $35.2 91 $35.2 91 $35.2
MTA Bus 6 0.6 63 10.8 35 5.7 11 1.6 8 1.3
Total 53 $27.8 154 $45.9 126 $40.9 102 $36.8 99 $36.5
Administration - 15.9 - 19.9 - 19.9 - 20.0 - 20.0Customer Convenience/Amenities - 0.0 - 0.0 - 0.0 - 0.0 - 0.0Maintenance/Inventory 28 3.4 51 8.2 51 7.9 51 7.9 51 7.9Revenue Enhancement 17 2.4 17 2.1 17 2.1 17 2.1 17 2.1Safety/Security - 0.0 - 0.0 - 0.0 - 0.0 - 0.0Service 2 2.2 23 2.2 23 2.5 23 2.5 23 2.5Service Support - 0.0 - 0.0 - 0.0 - 0.0 - 0.0Other - 3.2 - 2.7 - 2.7 - 2.7 - 2.7
Total (Excluding MTA Bus) 47 $27.2 91 $35.2 91 $35.2 91 $35.2 91 $35.2
MTA Bus - Other 6 0.6 63 10.8 35 5.7 11 1.6 8 1.3 Total 53 $27.8 154 $45.9 126 $40.9 102 $36.8 99 $36.5
Category:
METROPOLITAN TRANSPORTATION AUTHORITYJuly Financial Plan 2015 - 2018
($ in millions)
2014 Budget Reduction Program by Agency and Category
2014 2015 2016 2017 2018
Favorable/(Unfavorable)
II-31

Major budget reduction initiatives that comprise the total 2014 BRPs – Programmatic are listed below by a gency. Sp ecific details can be found in the BRP worksheets located in Agency sections. NYCT BRP Savings:
Employee Group Waiver Plan (EGWP) Program savings based on an Affordable Care Act prescription drug plan for Med icare-eligible members that is a more financially affordable alternative than existing plans;
Medical Eligibility Initia tive savings based on improving the efficiency of eli minating
coverage for ineligible persons and the automation of transferring Medicare beneficiaries to primary status;
Subways Availability-Reduction of “Injury-on-Duty” Lost Days results in projected Workers’ Compensation savings achievable through a more comp rehensive and aggressive monitoring and review of cla ims thereby reducing the n umber of days employees are out of work on a long-term basis;
Subways Availability-Video Right To Know (RTK) training at home will result in projected position reductions and increase station agent and station cleaner availability;
Subways Facility Clea ning Efficiencies will result in savings to b e achieved by implementing improved processes for car and facility cleaning;
Revenue Collection Efficiencies savings based on the opportunity to re duce labor costs resulting from the implementation of the $1 Green Fee charge wh ich significantly reduced the number of new MetroCards produced; and
Tower Operator Efficien cies savings based on a zero-based budget analysis of the Rapid Transit Subdivision B Tower Operator and Supervision functions.
LIRR BRP Savings:
Implementation of tight er management controls and ov ersight on operating and
administrative departments’ non-payroll budgets and spen ding with particular emphasis on contract services.
MNR BRP Savings:
Savings were achieved through both non-recurring reductio ns—including management position vacancies, the reschedulin g of a Genesis locomotive overhaul from 201 4 to 2015, and service pla n adjustments—and recurring re ductions, including reduced material usage for M8 cars, reduce d maintenance contracts costs for contracted shop equipment and commu nications equipment, scheduling ch anges for n ew Genesis and BL20 locomotive overh auls, reducing train cre w costs an d energy expenses, red uced materials needs for M7 car seat replacements, and increases to other operating revenue resulting from additional GCT retail revenues and expanded parking space at the North White Plains station parking facility.
II-32

MTAHQ BRP Savings: MTAPD has reduced expenses for facilities maintenance and repairs, and expenses for
contracts for outside vendors;
MTAHQ has reduced leases and rentals expenses, and expenses for advertising, outside consultants, and vendors; and
Additional other operating revenue from higher projected Tr ansit Museum facility rental revenue.
SIR BRP Savings: Vacancy savings based on assessment of position functions and risks.
MTA Bus BRP Savings: Efficiencies discovered with the scheduled operations pickup program which shifts focus
from unscheduled work to preventive maintenance; and
Work scope revisions in the S hop Overhaul Program that resulted in ex pense reductions.
II-33

[THIS PAGE INTENTIONALLY LEFT BLANK]
II-34

Subsidies

SUBSIDIES - OVERVIEW The following pages provide ac crual and cash summary tables for projections of subsidies and dedicated taxes r eceived by MTA, as well as tables compar ing these projections with those from the 2014 February Financial Plan. Detailed narratives describing each subsidy, the forecast me thodologies employed and explanations of changes from earlier Plans are also inc luded. The details of Bridges and Tunnels operations that produce the Operating Surplus Transfer are discussed in t he Bridges and Tunnels portion of the Agency Financial Plan s section of this report. C onsolidated income and expens e information on NYCT’s Pa ratransit operation is also included. (Note that additional details on NYCT’s Paratransit operation can be found in th is volume under Agency Financial Plans.) Overall accrued subsidies are proj ected to grow from year to year in line with regional economic growth projections. Real estate transaction tax revenues trend higher as they have done since the Fall of 2010, and projections indicate that recent improvements in the regional ec onomy will cont ribute to a continuation of th is trend. However, these improvements in annual real es tate tax revenues should be contra sted with the steep declines that occurred in 2 008 and 2009, when MTA saw receip ts fall by seventy-five percent; the 2014 real estate tax forecast re mains thirty-two percent lower than actua l receipts in 2007. On an accrual basis, the 2014 Mid-Year Forecast of Total Dedicated Taxes and State & Local Subsidies is $6,179 million, which is $281 million (5%) hig her than 2013. The growth is due primarily to a higher appropriation fo r MTA Metropolitan Mass Transportation Operating Assistance (MMTOA), a higher forecast of Payroll Mobility Tax (PMT) and Petroleum Business Tax (PBT) re venues and favorable regional economic activity affecting over all real estate ta x revenues. This forecast is $146 million (2%) above the Adopted Budget estimate. The favor able variance to the Adopted Budget is primarily the result of higher Urban Tax transaction receipts, a higher timing-related City Subsidy for MTA Bus and increased State Dedi cated Tax revenue due to re-estimates of MMTOA and PBT revenues, partially offset by unfavorable PMT receipts. Year-over-year, total Dedicated Taxes and State & Local Subsidies are projected to increase from the prior year by $86 million (1%) in 2015, $234 million (4%) in 2016, $179 million (3%) in 2017 and $196 million (3%) in 2018. Compared with the February Financial Plan, the July Financial Plan forecasts are lower by $108 million in 2015, $110 million in 2016 and $135 million in 2 017, due p rimarily to unfavorable PMT, MRT and timing-related City Subsidy to MTA Bus, offset by favorable Urban Tax transactions. On a cash basis, total 2014 M TA Dedicated Ta xes and State & Local Subsidies is $5,963 million. The cash forecast is $185 million above the Adopted Budget estimate, and this favorable variance is primarily attributable to favorable variances for Urban Tax ($177 million), timing-related City Subs idy to MTA Bus ($54 million), Connecticut Department of Transportation (CDOT) Subsidy ($21 million), PBT ($9 million) an d MMTOA ($6 million). This is offset primar ily by lower PMT ($58 million), unfavorable Mortgage Recording Tax (MRT) transactions ($25 million) and timing-related City
II-35

Subsidy to SIRTOA ($8 millio n). Details of these changes are described in the related sections of this report. Year-over-year, total Dedicated Taxes and State and Local Subsidies are projected to dec rease from the prior year by $232 million (4%) in 2015, and to increase by $316 million (6%) in 2016, $137 million (2 %) in 2017 and $187 million (3%) in 2018. Compared to the February Financial Plan, the July Financial Plan estimates are lower by $65 million in 2015, $90 million in 2016, $10 9 million in 2017, due primarily to unfavorable PMT, MRT, and PBT transactions, partially offset by favorable Urban Tax and City Subsidy of MTA Bus. The 2014 Urban Tax cash projection is about eighty percent over 2013 receipts and is estimated to excee d the Adop ted Budget by $122 millio n, attributable to several unusually large real estate transactions in New York City. This is offset by unfavorable PMT transactions of $58 million due to a recalibration to correct for an over stated base in the Adopted Budget that was formulat ed on early NYS Wage and Salary projections that did not materializ e. For the remainder of the Plan period, Urban Tax transactions are projected to increase from the Adopt ed Budget level in each year, but more modestly than in 2014; MRT transactions ar e below the Adopted Budget estimate in each year.
II-36

2014 2015 2013 Mid-Year Preliminary Actual Forecast Budget 2016 2017 2018
Subsidies
Dedicated Taxes
Metropolitan Mass Transportation Operating Assist (MMTOA) $1,518.2 $1,563.9 $1,632.0 $1,703.6 $1,771.1 $1,851.5Petroleum Business Tax (PBT) Receipts 589.1 617.8 604.8 601.4 601.0 602.1Mortgage Recording Tax (MRT) 365.5 376.3 388.8 403.8 414.1 428.8 MRT Transfer to Suburban Counties (3.4) (2.7) (3.1) (3.0) (3.0) (3.3) Reimburse Agency Security Costs (10.0) (10.0) (10.0) (10.0) (10.0) (10.0) Interest 4.5 4.7 4.9 5.1 5.3 5.3Urban Tax 632.0 655.6 614.5 670.3 710.3 743.3Investment Income 1.0 1.0 1.1 1.1 1.2 1.2
$3,097.0 $3,206.6 $3,233.1 $3,372.4 $3,489.9 $3,619.0
PMT and MTA AidPayroll Mobility Tax $1,215.3 $1,256.9 $1,316.0 $1,376.0 $1,436.7 $1,494.2Payroll Mobility Tax Replacement Funds 307.2 309.3 309.3 309.3 309.3 309.3MTA Aid 302.9 324.5 328.3 329.8 332.3 334.5
$1,825.3 $1,890.7 $1,953.5 $2,015.0 $2,078.2 $2,137.9
State and Local Subsidies
State Operating Assistance $187.9 $187.9 $187.9 $187.9 $187.9 $187.9Local Operating Assistance 187.9 187.9 187.9 187.9 187.9 187.9CDOT Subsidy 70.8 111.6 93.9 97.5 100.0 109.3Station Maintenance 162.0 164.4 167.2 169.8 172.4 175.5
$608.7 $651.9 $636.9 $643.2 $648.3 $660.6
$5,531.0 $5,749.1 $5,823.6 $6,030.5 $6,216.4 $6,417.5
City Subsidy for MTA Bus 342.6 395.0 404.3 420.7 427.0 419.7City Subsidy for SIRTOA 24.0 34.5 37.1 47.8 34.4 36.3
$366.7 $429.5 $441.3 $468.5 $461.4 $456.0
$5,897.6 $6,178.6 $6,264.9 $6,499.0 $6,677.8 $6,873.5
Inter-agency Subsidy TransactionsB&T Operating Surplus Transfer $614.2 $547.2 $503.9 $488.1 $453.5 $420.5MTA Subsidy to Subsidiaries 0.0 0.0 0.0 0.0 0.0 0.0
$614.2 $547.2 $503.9 $488.1 $453.5 $420.5
GROSS SUBSIDIES $6,511.8 $6,725.8 $6,768.8 $6,987.1 $7,131.2 $7,294.0
Consolidated Subsidies
July Financial Plan 2015-2018METROPOLITAN TRANSPORTATION AUTHORITY
Total Dedicated Taxes & State and Local Subsidies
Subtotal Dedicated Taxes & State and Local Subsidies
($ in millions)Accrual Basis
II-37

2013 2014 2015 2016 2017 Subsidies
Dedicated Taxes
Metropolitan Mass Transportation Operating Assist (MMTOA) $0.0 $5.5 $6.6 $11.0 $5.1Petroleum Business Tax (PBT) Receipts (5.3) 7.9 (9.6) (16.2) (18.1)Mortgage Recording Tax (MRT) (4.1) (27.4) (50.7) (55.2) (56.4) MRT Transfer to Suburban Counties 0.2 2.1 2.4 2.4 2.2 Reimburse Agency Security Costs 0.0 0.0 0.0 0.0 0.0 Interest 0.0 0.0 0.0 0.0 0.0Urban Tax 103.8 122.1 25.4 26.4 23.8Investment Income 0.0 0.0 0.0 0.0 0.0
$94.6 $110.2 ($26.0) ($31.6) ($43.4)
PMT and MTA AidPayroll Mobility Tax $1.0 ($58.2) ($68.6) ($76.5) ($85.4)Payroll Mobility Tax Replacement Funds 0.0 2.1 2.1 2.1 2.1MTA Aid (5.4) 4.1 (1.9) (5.2) (2.7)
($4.3) ($52.1) ($68.5) ($79.6) ($86.0)
State and Local Subsidies
State Operating Assistance $0.0 $0.0 $0.0 $0.0 $0.0Local Operating Assistance 0.0 0.0 0.0 0.0 0.0CDOT Subsidy (25.8) 20.9 (2.0) 3.1 1.8Station Maintenance 1.7 1.7 1.7 1.8 1.8
($24.2) $22.6 ($0.3) $4.9 $3.6
$66.2 $80.8 ($94.8) ($106.3) ($125.9)
City Subsidy for MTA Bus ($50.8) $58.6 ($13.5) ($12.1) ($1.8)City Subsidy for SIRTOA Recovery (8.3) 6.6 0.4 8.8 (7.2)
($59.1) $65.2 ($13.1) ($3.3) ($9.0)
$7.0 $146.0 ($107.9) ($109.7) ($134.9)
Inter-agency Subsidy Transactions
B&T Operating Surplus Transfer $40.5 ($4.9) $6.2 $24.1 $35.5MTA Subsidy to Subsidiaries 0.0 0.0 0.0 0.0 0.0
$40.5 ($4.9) $6.2 $24.1 $35.5
GROSS SUBSIDIES $47.5 $141.1 ($101.7) ($85.6) ($99.4)
Summary of Changes Between the July and February Financial PlansMETROPOLITAN TRANSPORTATION AUTHORITY
Total Dedicated Taxes & State and Local Subsidies
Subtotal Dedicated Taxes & State and Local Subsidies
($ in millions)Accrual Basis
Consolidated Subsidies
II-38

2014 2015 2013 Mid-Year Preliminary Actual Forecast Budget 2016 2017 2018
Subsidies
Dedicated Taxes
Metropolitan Mass Transportation Operating Assist (MMTOA) $1,518.2 $1,563.9 $1,632.0 $1,703.6 $1,771.1 $1,851.5Petroleum Business Tax (PBT) Receipts 586.4 619.0 605.1 601.5 600.9 602.0Mortgage Recording Tax (MRT) 362.4 375.5 387.6 403.0 412.8 428.2 MRT Transfer to Suburban Counties (2.4) (3.4) (2.7) (3.1) (3.0) (3.0) Reimburse Agency Security Costs (10.0) (10.0) (10.0) (10.0) (10.0) (10.0) MTA Bus Debt Service (24.9) (24.9) (24.9) (24.9) (24.9) (23.8) Interest 4.5 4.7 4.9 5.1 5.3 5.3Urban Tax 594.7 705.6 609.8 666.9 707.4 742.2Investment Income 1.0 1.0 1.1 1.1 1.2 1.2
$3,029.9 $3,231.4 $3,202.8 $3,343.3 $3,460.8 $3,593.5
PMT and MTA Aid
Payroll Mobility Tax $1,215.3 $1,256.9 $1,316.0 $1,376.0 $1,436.7 $1,494.2Payroll Mobility Tax Replacement Funds 307.2 309.3 309.3 309.3 309.3 309.3MTA Aid 302.9 324.5 328.3 329.8 332.3 334.5
$1,825.3 $1,890.7 $1,953.5 $2,015.0 $2,078.2 $2,137.9
State and Local Subsidies
State Operating Assistance $187.9 $187.9 $187.9 $187.9 $187.9 $187.9Local Operating Assistance 188.5 187.9 187.9 187.9 187.9 187.9CDOT Subsidy 70.8 111.6 93.9 97.5 100.0 109.3Station Maintenance 160.2 162.6 165.1 167.9 170.5 173.1AMTAP 0.0 0.0 0.0 0.0 0.0 0.0
$607.4 $650.0 $634.8 $641.3 $646.4 $658.2
Other Subsidy AdjustmentsResource to Reduce Pension Liability ($210.0) ($20.9) ($8.8) ($17.4) ($15.3) ($13.2)Interagency Loan (120.2) 0.0 0.0 0.0 0.0 0.0NYCT Charge Back of MTA Bus Debt Service (11.5) (11.5) (11.5) (11.5) (11.5) (11.5)Forward Energy Contracts Program - Gain/(Loss) 0.6 3.3 1.6 (0.2) 0.0 0.0MNR Repayment for 525 North Broadway (2.4) (2.4) (2.4) (2.4) (2.4) (2.4)NYS Reimbursement Transferred to B&T (3.9) 0.0 0.0 0.0 0.0 0.0Repayment of Loan to Capital Financing Fund (200.0) (100.0) (100.0) 0.0 0.0 0.0Committed to Capital (283.8) (144.8) (408.1) (370.0) (443.0) (448.9)
($831.2) ($276.4) ($529.3) ($401.6) ($472.2) ($476.1)
$4,631.4 $5,495.6 $5,261.8 $5,597.9 $5,713.1 $5,913.5
City Subsidy for MTA Bus $307.5 $443.6 $435.4 $412.5 $423.8 $423.3City Subsidy for SIRTOA 30.7 24.0 34.5 37.1 47.8 34.4
$338.2 $467.6 $469.9 $449.5 $471.6 $457.7
$4,969.6 $5,963.3 $5,731.7 $6,047.5 $6,184.7 $6,371.2
Inter-agency Subsidy Transactions
B&T Operating Surplus Transfer $606.0 $560.4 $508.2 $489.6 $456.9 $423.8MTA Subsidy to Subsidiaries 0.0 0.0 0.0 0.0 0.0 0.0
$606.0 $560.4 $508.2 $489.6 $456.9 $423.8
GROSS SUBSIDIES $5,575.6 $6,523.7 $6,239.9 $6,537.1 $6,641.6 $6,795.0
Consolidated SubsidiesJuly Financial Plan 2015-2018
METROPOLITAN TRANSPORTATION AUTHORITY
Total Dedicated Taxes & State and Local Subsidies
Subtotal Dedicated Taxes & State and Local Subsidies
($ in millions)Cash Basis
II-39

2013 2014 2015 2016 2017 Subsidies
Dedicated Taxes
Metropolitan Mass Transportation Operating Assist (MMTOA) $0.0 $5.5 $6.6 $11.0 $5.1Petroleum Business Tax (PBT) Receipts (6.7) 9.5 (9.1) (16.0) (18.1)Mortgage Recording Tax (MRT) (2.2) (25.1) (50.3) (55.0) (57.2) MRT Transfer to Suburban Counties 0.0 0.2 2.1 2.4 2.4 Reimburse Agency Security Costs 0.0 0.0 0.0 0.0 0.0 MTA Bus Debt Service 0.0 0.0 0.0 0.0 0.0 Interest 0.0 0.0 0.0 0.0 0.0Urban Tax 47.2 176.8 25.3 26.7 22.8Investment Income 0.0 0.0 0.0 0.0 0.0
$38.3 $166.9 ($25.5) ($30.8) ($45.1)
PMT and MTA AidPayroll Mobility Tax $1.0 ($58.2) ($68.6) ($76.5) ($85.4)Payroll Mobility Tax Replacement Funds 0.0 2.1 2.1 2.1 2.1MTA Aid (5.4) 4.1 (1.9) (5.2) (2.7)
($4.3) ($52.1) ($68.5) ($79.6) ($86.0)
State and Local Subsidies
State Operating Assistance $0.0 $0.0 $0.0 $0.0 $0.0Local Operating Assistance (18-b) 0.6 0.0 0.0 0.0 0.0CDOT Subsidy (25.8) 20.9 (2.0) 3.1 1.8Station Maintenance 1.7 1.7 1.7 1.8 1.8
($23.6) $22.6 ($0.3) $4.8 $3.5
Other Subsidy AdjustmentsResource to Reduce Pension Liability $0.0 $0.0 $0.0 $0.0 $0.0Inter-Agency Loan 0.0 0.0 0.0 0.0 0.0NYCT Charge Back of MTA Bus Debt Service 0.0 0.0 0.0 0.0 0.0Forward Energy Contracts Program - Gain/(Loss) 0.5 1.5 1.7 (0.2) 0.0MNR Repayment for 525 North Broadway 0.0 0.0 0.0 0.0 0.0NYS Reimbursement Transferred to B&T 0.0 0.0 0.0 0.0 0.0Repayment of Loan to Capital Financing Fund 0.0 0.0 0.0 0.0 0.0Committed to Capital 0.0 0.0 0.0 0.0 0.0
$0.5 $1.5 $1.7 ($0.2) $0.0
$10.9 $139.0 ($92.6) ($105.8) ($127.5)
City Subsidy for MTA Bus ($63.9) $54.0 $20.7 $15.3 $9.3City Subsidy for SIRTOA 0.0 (8.3) 6.6 0.4 8.8
($63.9) $45.6 $27.3 $15.7 $18.1
($53.0) $184.7 ($65.3) ($90.1) ($109.4)
Inter-agency Subsidy TransactionsB&T Operating Surplus Transfer $29.9 $6.1 $5.0 $22.3 $34.4MTA Subsidy to Subsidiaries 0.0 0.0 0.0 0.0 0.0
$29.9 $6.1 $5.0 $22.3 $34.4
GROSS SUBSIDIES ($23.1) $190.8 ($60.2) ($67.8) ($75.1)
Summary of Changes Between the July and February Financial PlansMETROPOLITAN TRANSPORTATION AUTHORITY
Total Dedicated Taxes & State and Local Subsidies
Subtotal Dedicated Taxes & State and Local Subsidies
($ in millions)Cash Basis
Consolidated Subsidies
II-40

METROPOLITAN MASS TRANSPORTATION OPERATING ASSISTANCE (MMTOA) Revenues derived f rom the following taxes flow into the statewide Mass Transportation Operating Assistance (MTOA) Fund:
Petroleum Business Tax (PBT), which is a small portion of the basic PBT imposed on petroleum businesses operating within New York State;
Sales Tax, which is imposed on sa les and uses of certain tangible personal property and services;
Corporate Franchise Taxes impos ed on certain transportation and transmission companies;
Temporary Corporate Surcharges imposed on the por tion of the franchise and other taxes of certain businesse s attributable to the c onduct of business within the transportation district.
The statewide MTOA consists of the Pu blic Transportation Systems Operating Assistance Account, the Urban Mass Transit Operating Assistance Account, and the Metropolitan Mass Transportation Assistance Account. The Metropolitan Mass Transportation Operating Assistance (MMTOA ) Account consists of one hundred percent of the receipts from the 17% corporate surcharge imposed within the MTA Commuter Transportation District (MCTD), one hundred percent of the sales and use tax impos ed in the MCTD, fifty-five percent of the MTOA PBT, and eighty percent of the ta x on transportation and transmission companies. The amount of funds avai lable from the MMTOA account are appropriated by the State and supplement the general operating subsidies of downstate transportation systems in t he MCTD. Current law governing the corporate franchise t ax is in effect through the end of 2014, at which time recently enacted tax reforms will be imp lemented; the impact of the tax chan ges is expected to be revenue neutral to the MTA.
2014 Mid-Year Forecast
The estimate of total taxes in the statewide MTOA Fund for 2014 is $2,108 million, of which $2,059 million is allotted for Downstate transit properties. Of this Downstate allotment, $1,564 m illion in non-18b funds is appropriated for the benefit of MTA, and this amount is t he MTA’s 2014 Mid-Year Forecast. Of the total estimated MMTOA receipts for 2014, $1,036 million is appropriated for NYCT/SIR and $528 million for the Co mmuter Railroads. The combined MTA Share is $46 million (3%) higher than the 2013 level, and $6 million (0.4%) higher than the F ebruary forecast. In addition, $1 90 million is earmarked to fund the State’s 18-b obligation, which includes $175 million for the MTA. The 2014 Mid-Year Forecast assumes t hat the State’s funding of its 18-b obligations to the MT A remains at the 2013 level of $175, wh ich includes $154
II-41

million for NYCT/SIR and $2 1 million for the Co mmuter Railroads and is consistent with the February Plan. The 2014 percentage allocations of the Downstate share of MMTOA are 58% for NYCT/SIR and 27% for the Commuter Ra ilroads. These percentages are based on the actual amounts appropriated in NYS’ 2014-15 E nacted Budget, and also reflect the State 18-b amounts. MMTOA and State 18-b funds were als o allotted to MTA Bus and other downstate transportation properties. 2015 Preliminary Budget For 2015, total estimated MTA MMTOA re venue is $1,632 million, which is $68 million (4%) more than the 2014 Mid-Year Forecast, and reflects an increas e of $7 million (0.4%) from the February Plan estimate. This reflects assumptions that revenues from the Sales Tax and Cor porate Surcharge components of MMTOA will grow annually from the 2014 level by 4%and 8%, respectively. Revenue from Petroleum Business Tax is expected to decline by 3%. There is no change expected in the level of Corporate Franchi se Tax, which remains flat through the Plan period. (See the table at the end of th is section). Of the total, $1,080 million is earmarked for NYCT and SIR and $5 48 million is earmarked for the commuter railroads. The 2015 Preliminary Budget assumes that the State’s funding of its 18-b obligation for NYCT and Commuter Ra ilroads will remain at the 2014 level of $175 million, whic h is consistent with the Febr uary Plan. The percentage allocations of MMTOA’s downstate shares that come to the MTA r epresent 58% for NYCT/SIR and 27% for the Commuter Railroads. 2016 – 2018 MTA MMTOA forecasts are $1,704 million in 2016, $1,771 mil lion in 2017, and $1,852 million in 2018, and are based on projections included in the NYS 2014-15 Enacted Budget for sales taxes, pet roleum business taxes, corporate franchise taxes and corporate tax su rcharges. Year-over-year, MTA MMTOA revenues are expected to increase $72 million (4%) in 2016, $67 million (4%) in 2017 and $80 million (5%) in 2018. Com pared with the February Plan, the MTA MMTOA revenues are expected to increase by $11 million in 2016 and $5 million in 2017. F or 2015 through 2018, the Plan assumes the following growth rates from the prior year levels for the component taxes of MMTOA:
Growth Rate for the Individual Components of MMTOA (from prior year level)
2015 2016 2017 2018
Sales Tax 4% 4% 3% 3%Petroleum Business Tax -3% 0% 0% 1%Corporate Franchise Tax 0% 0% 0% 0%Corporate Tax Surcharge 8% 5% 4% 5%
II-42

ACTUAL
2013 2014 2015 2016 2017 2018
Forecast of MMTOA Gross Receipts (SFY):
Sales Tax $854.9 $894.5 $934.5 $967.5 $996.5 $1,030.5PBT 142.0 135.1 130.4 130.1 130.1 130.8Corporate Franchise 58.0 60.0 60.0 60.0 60.0 60.0Corporate Surcharge 1,000.0 1,018.0 1,096.0 1,148.0 1,199.0 1,260.0Investment Income 0.0 0.0 0.0 0.0 0.0 0.0
Total Gross Receipts Available for Allocation $2,054.9 $2,107.6 $2,220.9 $2,305.6 $2,385.6 $2,481.3
Allocation of Total Gross Receipts to Downstate:
Total Gross Receipts $2,054.9 $2,107.6 $2,220.9 $2,305.6 $2,385.6 $2,481.3
Less: Upstate Share of PBT (63.9) (60.8) (58.7) (58.5) (58.5) (58.9)Less: Upstate Share of Transmission (19.1) (19.8) (19.8) (19.8) (19.8) (19.8)Less: New Fund Balance 0.0 0.0 0.0 0.0 0.0 0.0Upstate Percent Share of Investment Income 3.11% 2.88% 2.64% 2.54% 2.45% 2.37%Less: Upstate Share of Investment Income 0.0 0.0 0.0 0.0 0.0 0.0
Total Net Downstate Share Available for Allocation $1,971.9 $2,059.3 $2,142.4 $2,227.3 $2,307.3 $2,402.6
Less: 18-B Adjustment (189.5) (189.5) (189.5) (189.5) (189.5) (189.5)Adjusted Total Net Downstate Share for Allocation $1,782.4 $1,869.8 $1,952.9 $2,037.7 $2,117.7 $2,213.1
Add: NYS Reimbursement 3.9 0.0 0.0 0.0 0.0 0.0Adjusted Total Net Downstate Share + Other $1,786.3 $1,869.8 $1,952.9 $2,037.7 $2,117.7 $2,213.1
Allocation of Total Net Downstate Share to NYCT/SIR:
NYCT/SIR Share 58.66% 57.77% 57.79% 57.79% 57.79% 57.79%
From Total Net Downstate Share $1,156.8 $1,189.6 $1,238.0 $1,287.0 $1,333.3 $1,388.4Less: 18-B Adjustment (153.9) (153.9) (153.9) (153.9) (153.9) (153.9)Adjusted Total Net Downstate Share $1,002.9 $1,035.8 $1,084.2 $1,133.2 $1,179.4 $1,234.5From Carryover 0.0 0.0 0.0 0.0 0.0 0.0
Total NYCT/SIR Share of Net Downstate Share $1,002.9 $1,035.8 $1,084.2 $1,133.2 $1,179.4 $1,234.5
SIR Share (Accrued) 3.510 3.625 3.795 3.966 4.128 4.321Total SIR Share (Cash) 3.5 3.6 3.8 4.0 4.1 4.3Total NYCT Share of Net Downstate Share $999.4 $1,032.1 $1,080.4 $1,129.2 $1,175.3 $1,230.2
Allocation of Total Net Downstate Share to MTA:
MTA Share 27.01% 26.68% 26.56% 26.56% 26.56% 26.56%
From Total Net Downstate Share $532.6 $549.3 $569.1 $591.6 $612.8 $638.2Less: 18-B Adjustment (21.2) (21.2) (21.2) (21.2) (21.2) (21.2)Adjusted Total Net Downstate Share $511.4 $528.1 $547.9 $570.4 $591.6 $617.0From Carryover 0.0 0.0 0.0 0.0 0.0 0.0
Total MTA Share of Net Downstate Share $511.4 $528.1 $547.9 $570.4 $591.6 $617.0
NYS Reimbursement
NYS Reimbursement $3.9 $0.0 $0.0 $0.0 $0.0 $0.0
Total NYS Reimbursement $3.9 $0.0 $0.0 $0.0 $0.0 $0.0
FORECAST
MMTOA STATE DEDICATED TAXES
($ in millions)July Financial Plan 2015-2018
II-43

PETROLEUM BUSINESS TAXES (PBT) The Statewide Dedic ated Funds Pool is the repository for revenues from the following dedicated taxes and fees:
Petroleum business taxes - a business privilege tax imposed on petroleum businesses operating in New York State;
Motor fuel taxes - an excise tax levied with r espect to gasoline and diesel motor fuels;
Motor vehicle fees - derived m ainly from vehicle registration and driver license fees.
Subject to statutory al location under current State Law, thirty-four percent (34%) of the Dedicated Funds Pool is current ly deposited in the Mass Transportation Trust Fund (MTTF) for MTA’s benefit, wh ile sixty-three percent (63%) is earmarked for State uses, including upst ate highways and other transportation needs, and the remaining thre e percent (3%) is allotted to other mass transit operating agencies. Amounts transferred fr om the MTTF Account to the MTA’s Dedicated Tax Fund constitute MTTF Re ceipts, which is also referred to interchangeably by t he MTA for purpose of budget presentatio n as Petroleum Business Tax (PBT) Receipts. Eighty-five percent (85%) of the MTTF Receipt s are payable to New York City Transit fo r the benefit of NYCT and SIR, and the remaining 15% to MTA for the benefit of LIRR and Metro-North. MTA utilizes the PBT Receipts to pay debt service on MTA’s Dedicated Tax Fund Bonds (DTF Bonds). Debt service on DTF Bonds is payable first from PBT Receipts and then, to the extent of any deficiency, from MMTOA Taxes. On an annual basis to date, PBT Receipts have always been sufficient to meet debt service commitments and no MMTOA Taxes have been used for this purpose. After debt obligations are satisfied, t he remaining PBT funds are allocat ed to New York City Trans it (85%) and the Co mmuter Railroads (15%) in accordance with the formula provided by statute. The PBT estimates are provided on a cash basis. Accrual estimates are based on a one-month lag in the booking and collection of PBT proceeds. 2014 Mid-Year Forecast The 2014 MTA Mid-Year Forecast for PBT , on a cash basis , is $619 million, which is $33 million above the 2013 leve l. This is $9 million ab ove the Adopted Budget, an upward revision that reflects actual receipts through June. Of the total PBT allocation, 85% or $526 million is earmarked for New York City Transit and 15% or $93 million for the commuter railroads.
II-44

2015 Preliminary Budget The 2015 Preliminary Budget for MTA PBT, on a ca sh basis, is $605 million, which is $ 14 million (2%) lower than the 2014 Mid-Year Forecast. This is $9 million below the Fe bruary Plan estimate, reflecting the State’s updated PBT revenue estimate. 2016 - 2018 PBT cash estimates are $601 million in 2016, $601 million in 2 017 and $602 million in 2018, reflecting year-to-year declines of $4 million (0.6 % ) in 2016 and $1 million (0.1%) in 2017 and y ear-to-year increases of $1 millio n (1%) in 2017 and $1 million (0.2%) in 2018, reflecting t he State’s estimates of PBT revenues updated with its 2014-15 Enacted Budget. Compared to the February Plan, these estimates are lower by $16 million in 2016 and $18 million in 2017.
II-45

ACTUAL
2013 2014 2015 2016 2017 2018
Total Net PBT Collections Available for Distribution $1,724.7 $1,820.6 $1,779.7 $1,769.0 $1,767.2 $1,770.5
Distribution Shares:
MTA Total 34.0% 34.0% 34.0% 34.0% 34.0% 34.0%Other Transit 3.0% 3.0% 3.0% 3.0% 3.0% 3.0%Highway Trust Fund 63.0% 63.0% 63.0% 63.0% 63.0% 63.0%General Fund 0.0% 0.0% 0.0% 0.0% 0.0% 0.0%
Share Total 100.0% 100.0% 100.0% 100.0% 100.0% 100.0%
Amount of Total Net Collections Available for the MTA:
MTA Total $586.4 $619.0 $605.1 $601.5 $600.9 $602.0
Accrued
NYCT/SIR Share of MTA Total $500.8 $525.2 $514.1 $511.2 $510.8 $511.8Commuter Railroad Share of MTA Total 88.4 92.7 90.7 90.2 90.1 90.3
MTA Total of Net Collections $589.1 $617.8 $604.8 $601.4 $601.0 $602.1
Cash
NYCT/SIR Share of MTA Total $498.4 $526.2 $514.3 $511.2 $510.7 $511.7Commuter Railroad Share of MTA Total 88.0 92.9 90.8 90.2 90.1 90.3
MTA Total of Net Collections $586.4 $619.0 $605.1 $601.5 $600.9 $602.0
FORECAST
PETROLEUM BUSINESS TAX PROJECTIONS
($ in millions)July Financial Plan 2015-2018
II-46

MORTGAGE RECORDING TAXES (MRT) The Mortgage Recor ding Taxes consist of two separate taxes: Mortgage Recording Tax-1 (MRT-1) and Mortgage Recording Tax-2 (MRT-2). These taxes are c ollected by New York City and the seven other counties with the MTA’s service area. MRT-1 is imposed on the borrower for recor ded mortgages of real property, subject to certain exclusions, at the rate of three-tent hs of one percent (0.3%) of the debt secured by certain real estate mortgages. By Statute, receipts from MRT-1 must be applied, first, to meet MTA Headquarters operating expenses and, second, to make deposits into th e New York City Trans it Account (55% of the remaining amount) and the Commuter Railroad Account (45% of t he remaining amount). Funds in the NYCT Ac count are required to be used to pay operating and capita l costs of NYCT, its subsidiaries, and Staten Island Railway. Funds in the Commuter Railroad Account are required to be first used to pay up to $20 million to the State Suburban Transportation Fund each year. In the event the transfer to the Suburban F und would result in a Commuter Railroad operating deficit, the amount of the defic it is appropriat ed to the MTA for Commuter Railroad operating purposes, and not transferred to the S uburban Fund. After first making the required transfers to the S uburban Fund, any balance in the Commuter Railroad Account is required to be used to pay commuter railroad operating and capital costs. MRT-2 is a tax imposed on th e institutional lender at a rate of one-quarter of one percent (0.25%) of certain recorded mortgages secured by real estate structures containing one to six dw elling units. MRT-2 receipts ar e to be applied, first, to make deposits into the Payment Sub-account s for Dutchess, Orange and Rockland Fund (DORF) payments and, second, to make depos its into the Corporate Purposes Sub-account for the purpose of paying operating and capital costs, incl uding debt service and debt service reserve requirements, if an y, incurred for the benefit of MTA, NYCT and their respective subsidiaries. MTA is required to make annual DORF paym ents, in equal quarterl y installments, of $1.5 million each for Dutchess and Orange Co unties, and $2.0 million f or Rockland County. Additionally, MTA must transfer to DORF for each of these three counties an amount equal to the product of (i) the percentage by whic h the county’s mortgage recording tax payment (MRT-1 excluding post- 1989 tax rate increases plus MRT-2) to MTA in the preceding calendar year incr eased over such payment in calendar year 1989 and (ii) $1.5 million each for Dutche ss and Orange Countie s and $2.0 million for Rockland County. Forecast Methodology Forecasts of MRT revenues consist of ac tual receipts through June 2014. With the exception of MRT colle ctions from New York City, fore casts for the remainder of the Plan period are bas ed on projections of s uburban real estate activity provided by IHS Global Insight and an analysis of recent conditions. For New York City, MRT receipts for
II-47

the remainder of the Plan per iod are based on the City of New York’s May 2014 budget assumptions. 2014 Mid-Year Forecast MRT receipts are forecast to be $376 milli on in 2014, $13 million (4%) more than 2013 MRT receipts. This projected increase woul d be the fourth annual increas e after four years of declines from 2007 to 2010. Coupled with increases over the past three years, the 2014 MRT projection will st ill be 51 percent lower than when MRT receipts peaked in 2006. MRT-1, whic h is collected on mortgages for both commercial and residential properties, is projected to increase $13 million (5%) while MRT- 2, which is paid only on residential properties with fewer than seven units in the structure, is forecast to increase $0.6 million (0.5%) compared with 2013 receipts. The 2014 Mid-Year Forecast for MRT is $25 million (6%) less than the Adopted Budget, reflecting a weaker recovery in resi dential mortgage borrowing than previous ly anticipated. MRT-1 is estimated to be $10 million (3%) less than the Adopted Budg et, while MRT-2 is projected to be $16 million (12%) less than the Adopted Budget. 2015 Preliminary Budget Projections indicate that im provements in the region al economy will continue to spur growth in mortgage recordings, but at a slow er rate than was expected in t he February Plan. MRT receipts are forecast to be $38 8 million in 2014, $12 million (3%) greater than estimated for the 2014 Mid-Year Foreca st; MRT-1 receipts are projected to increase $6 million (2%), while MRT-2 receipts are forecast to increase $6 million (6%). The 2015 Preliminary Budget for MRT is $5 0 million (11%) less than the Feb ruary Plan forecast, reflecting a lower 2014 base and a weaker y ear-over-year increase (3% vs. 9% in February). MR T-1 is estimated to be $30 million (10%) le ss, while MRT-2 is projected to be $20 million (15%) less than the February Plan forecast. 2016 - 2018 MRT receipts are expected to improve an nually, increasing $15 million in 2016, $1 0 million in 2017, and $15 million in 2018. The projected growth in MRT receipts reflects continued improvement in t he regional economy over the course of the plan period, which is expected to have favorable impac ts on housing demand – a nd, by extension, mortgage recording activity – in the MTA region. Despite these increases, 2018 MRT receipts, which are projected to reach $428 million, will still be 44 percent below receipts from twelve years earlier, when MRT receipts peaked in 2006. For 2016, projected MRT receipts in the Ju ly Plan are $55 million (12%) less than the February Plan forecast, and 2017 MRT receipts expected to be $57 million (12%) lower. As with the plan-to-plan changes for 2015 these forecasts reflect a lower 2014 base and
II-48

slower growth from 2014 to 2015 than pr ojected in the Febr uary Plan; 2016 and 2017 year over year growth is marginally slower than was anticipated in the February Plan. The following table summarizes MRT year-to-year changes in the July Plan:
2014 2015 2016 2017 2018
MRT-1 5% 2% 5% 3% 4% MRT-2 1% 6% 1% 1% 3% TOTAL 4% 3% 4% 2% 4%
Other MRT-2 Adjustments MRT-2 receipts are used to reimburse MTA Agencies for certain s hort term security projects from a fund managed by MTA Police. An a nnual amount of $10 millio n has been earmarked in the July Plan to cover these security expenses from 2014 through 2018. In addition, the July Plan assumes that funds from subsidies will be used to cover debt service cash flow requirements and loan repa yment of the MTABC. In negotiations with the City during the MTA takeover of the private buses, a package that consisted of bond proceeds ($209 millio n) and inter-agency loans ($114 million) was used to finance MTABC’s capital inv estment. Pursuant to the agreement with t he City, the MTA pay s the capital costs of the MTABC 2005-2009 Capi tal Program, to the ex tent that it is otherwise not paid from Federal grants, matching Cit y funds, or other funding sources specifically dedicated to MTABC capital projects. As part of the terms of this agreement, the MTA is required to pay the debt se rvice on bonds and commercial paper expended after November 2006 on MTABC 2005-2009 Capi tal Program projects, until such amounts are paid in full, wh ich would require payments through the Plan period and beyond. The July Plan estimates the required amounts to be $25 million annually during the Plan period, reflecting no change in assumptions from the February Plan.
II-49

($ in millions)July Financial Plan 2015-2018
MORTGAGE RECORDING TAX PROJECTIONS
Cash BasisACTUAL
r 2013 2014 2015 2016 2017 2018 MORTGAGE RECORDING TAX #261-1
Receipts Available for Transfer to NYCT and CRs:
Total Gross Receipts $253.6 $266.2 $271.9 $285.7 $294.2 $305.7Carryover 0.0 0.0 0.0 0.0 0.0 0.0OPEB Offset 0.0 0.0 0.0 0.0 0.0 0.0Less: MTAHQ Operating Expenses Net of Reimbursement (335.6) (356.0) (390.2) (387.1) (391.6) (394.6)
Receipts Available for Transfer ($82.0) ($89.8) ($118.4) ($101.4) ($97.4) ($88.8)Adjustments 0.0 0.0 0.0 0.0 0.0 0.0MRT-2 Required to Balance 82.0 89.8 118.4 101.4 97.4 88.8Adjusted Receipts Available for Transfer $0.0 $0.0 $0.0 $0.0 $0.0 $0.0
Allocation of Net Receipts to NYCT/SIR Account:
Opening Balance $0.0 $0.0 $0.0 $0.0 $0.0 $0.0NYCT/SIR Share 55% 55% 55% 55% 55% 55%From Current Year Net Receipts 0.0 0.0 0.0 0.0 0.0 0.0Interest 0.0 0.0 0.0 0.0 0.0 0.0Carryover from Prior-Year 0.0 0.0 0.0 0.0 0.0 0.0Transfers from MRT-2 0.0 0.0 0.0 0.0 0.0 0.0
Total NYCT/SIR Net Cash Share $0.0 $0.0 $0.0 $0.0 $0.0 $0.0Total SIR Net Cash Share 0.0 0.0 0.0 0.0 0.0 0.0Total NYCT Net Cash Share $0.0 $0.0 $0.0 $0.0 $0.0 $0.0
Allocation of Net Receipts to Commuter Railroad Account:
Opening Balance - CR/SHF $0.0 $0.0 $0.0 $0.0 $0.0 $0.0Commuter Railroad Share 45% 45% 45% 45% 45% 45%From Current Year Net Receipts 0.0 0.0 0.0 0.0 0.0 0.0Interest 0.0 0.0 0.0 0.0 0.0 0.0Carryover from Prior-Year 0.0 0.0 0.0 0.0 0.0 0.0Less: Suburban Highway Fund 0.0 0.0 0.0 0.0 0.0 0.0Transfers from MRT-2 0.0 0.0 0.0 0.0 0.0 0.0
Total Commuter Railroad Net Cash Share $0.0 $0.0 $0.0 $0.0 $0.0 $0.0
MORTGAGE RECORDING TAX #261-2
Receipts Available
Total Receipts to Corporate Account $108.8 $109.3 $115.7 $117.3 $118.6 $122.4All Agency Security Pool (10.0) (10.0) (10.0) (10.0) (10.0) (10.0)MTA Bus Debt Service (24.9) (24.9) (24.9) (24.9) (24.9) (23.8)General Reserve 0.0 (135.0) (140.0) (145.0) (150.0) (155.0)Investment Income 4.5 4.7 4.9 5.1 5.3 5.3
Total Receipts Available for Transfer $78.4 ($55.9) ($54.3) ($57.5) ($60.9) ($61.1)
Use of Total Receipts:
DORF Opening Balance $4.5 $4.5 $4.5 $4.5 $4.5 $4.5Less: Transfer to MTA DORF Account (6.9) (7.8) (7.2) (7.5) (7.5) (7.5)Less: Transfer to MTAHQ Funds (82.0) (89.8) (118.4) (101.4) (97.4) (88.8)
Net Receipts Available ($6.1) ($149.1) ($175.5) ($161.9) ($161.4) ($152.9)
FORECAST
II-50

URBAN TAXES
The Urban Taxes c onsist of two distinct taxes applied to certain c ommercial real property transactions and mortgage recordings within New York City: a Mortgage Recording Tax (MRT) imposes a five-ei ghths of one-percent (0.625%) levy on mortgages exceeding $500,000 on New York City com mercial properties; and, a Real Property Transfer Tax (RPTT) im poses a one percent levy on the tr ansfer of New York City commercial real properties with a val ue exceeding $500,000. Tax receipts are available only for transit purposes in New York City, with 90% of the receipts earmarked for New York City T ransit (NYCT) gener al operations and 6% used for the partial reimbursement of NYCT Paratransit costs. The remaining 4% is earmarked as subsidy for the Ne w York Cit y private f ranchise buses, and the City ut ilizes these funds to reimburse MTA Bus expenses. Figures below reflect the 90% of Urban Tax receipts earmarked to NYCT general operations. Forecast Methodology Forecasts of Urban T ax receipts for 2014 c onsist of actual receipts through June, with the second half of 2014 reflec ting average monthly receipts for the prior twelve months, excluding the receipts from unusually large real estate transactions. Additionally, anticipated tax receipts from two large transactions that were recorded in late June have been incorporated in the 201 4 projection. For subsequent years, forecasts are consistent with projections in the City of New York’s May 2014 Executive Budg et; receipts from the unus ually large transactions are excluded from the base that is used to project Urban Tax receipts for 2015 and subsequent years during the Plan period. 2014 Mid-Year Forecast Urban Tax receipts are forecast to be $706 million in 2014, $111 million (19%) more than 2013 receipts. Approximately $87 million (79%) of the increase in receipts over the 2013 level is attributable to the six significantly large transactions that have taken place during 2014, including the rece nt transaction in late June. About three-quarters Urban Tax growth over the 2013 level is derived fr om RPTT receipts, which are projected to increase $84 million ( 21%), while MRT receipts are fo recast to increase $27 million (14%). The unusually large transactions acc ount for about 90 percent of RPTT growth and just under half of the MRT growth. While the 2014 projected increase follows $445 million in incr eases over the prior four years (totaling 144% since 2 009), it also follows an 83% decline from 2007 to 2009, when annual receipts fell by $734 million in two years. The growth in rec eipts since 2009 represents about 76% of the 2007 to 2009 decline. The 2014 Mid-Year Forecast for the Urban Taxes is $177 million more than the Adopted Budget, a 33% improvement. RPTT receipts comp rise 84% of t he growth, favorable by $149 million (45%), while MRT receipts are $28 million (14%) favorable. Without the tax receipts from the unusually large 2014 transactions, the improvement from the Adopted
II-51

Budget would be cut in half to 17%, and th e plan-to-plan growth would have been 22% for RPTT and 7% for MRT. 2015 Preliminary Budget Urban Tax receipts are forecast to be $610 m illion in 2015. While this is a $96 million (14%) decline from the 2014 Mid-Year Forecas t, the decline reflects the tax receipts from the unusually large transactions in 2014 that were removed from the base used to develop the 2015 projection. If those large 2014 transactions were removed from the variance calculation, the year-to-year change would be a modest $4 million (0.7%) favorable. RPTT receipts are expected to decline by 18% while MRT receipts ar e expected to decrease by 4%. When adjust ed to exc lude the lar ge 2014 transactions, estimates of RPTT receipts are down 0.2% and MRT receipts are up 2% over the 201 4 Mid-Year Forecast. The 2015 Preliminary Budget for the Urban Taxes is $37 million more than the February Plan forecast (4%). RPTT is estimated to be $27 million (7%) greater than the February Plan forecast, while MRT is projected to be $2 million (2%) less than the February Plan forecast. 2016 - 2018 Urban Tax receipts are expected to improve annually, increasing by $57 million in 2016, $40 million in 2017 and $35 million in 2018 , reflecting annual improvements in the regional economy during the Plan period which, in turn, is expec ted to favorably impact commercial real estate activity in New York City. Even with these increas es coupled with the increases starting in 2010, projected 2018 Urban Tax receipts will still be 16 percent below receipts from eleven years earlier, when Urban Tax receipts peaked in 2007. Urban Tax receipt projections exceed the pr ojections in the F ebruary Plan by $27 million (4%) for 2016 and by $23 million (3%) for 2017. The following table summarizes Urban Tax year-to-year changes in the July Plan:
2014 2015 2016 2017 2018
Real Property Transfer Tax 21% (18)% 8% 6% 5% Mortgage Recording Tax 14% (4)% 12% 6% 5% TOTAL 19% (14)% 9% 6% 5%
II-52

PAYROLL MOBILITY TAX (PMT) The Payroll Mobility Tax (PMT), also refe rred to interchangeab ly as the Metropolitan Commuter Transportation Mobilit y Tax (MCTMT), was enacted in 2009 1 by New Y ork State (Chapter 25, Laws of 2009 ) to provide a stable source of revenues fo r the MTA that would also address the MTA’s re venue shortfall and operating budget gap. Legislation enacted in Decemb er 2011 signifi cantly changed th e Payroll Mobility Ta x, effective April 1, 2012. The new legis lation, referred to as the “December Act” , eliminates the payroll mob ility tax impos ed within th e MTA Commuter Transportatio n District (“MCTD”) for the following taxpayers:
Employers with payroll expense less t han or equal to $312,500 in any calendar quarter;
Any public school district, board of c ooperative educational s ervices, public elementary or secondary school, school se rving students wit h disabilities of school age and any nonpublic elementary or secondary school that provides instruction in grade one or above; and
Individuals with net earnings from self-employment attributable to the MCTD that do not exceed $50,000 for the tax year.
The December Act reduced the payroll mobility tax liability for the following taxpayers:
Employers with payr oll expense no greater than $375,000 in any calendar quarter are subject to reduced tax rate of 0.11 percent; and
Employers with payroll expens e greater than $375, 000 but not greater than $437,500 in any calendar quarter are subject to reduced tax rate of 0.23 percent.
Employers with payroll expense in excess of $437,500 in any calendar quarter continue to pay a tax rate of 0.34 percent . Further, the December Act expressly provides that any reductions in tran sit aid attributable to these reductions in th e payroll mobility ta x “shall be o ffset through alternative sources that will b e included in the state budget”; these offsets to the MTA from alternativ e sources are known as the “PMT Reven ue Offset” or “PMT Replacement Funds”.
1 When the tax was first enacted in 2009, it applied to all employers in the MCTD and was imposed on the earnings of all self-employed individuals within the MCTD at a flat rate of 0.34 percent. School districts were also required to pay the tax, but the legislation mandated that the tax payments from school districts be reimbursed by the State. The legislation permits the MTA to utilize the payroll mobility tax revenues:
As pledged revenue to secure and be applied to the payment of bonds to be issued in the future to fund capital projects of the MTA and NYCTA and NYCTA subsidiaries;
To pay capital costs, including debt service of MTA and its subsidiaries, and NYCTA and its subsidiaries; To pay for costs, including operating costs of MTA and its subsidiaries, and NYCTA and its subsidiaries.
II-53

2014 Mid-Year Forecast The 2014 Mid-Year forecast of PMT revenues of $1,257 mil lion is $58 million below th e Adopted Budget estimate. This reflects year-to-date actual collections through June and year-over-year trends for the remainder of 2014. Total PMT revenues for 2014 inc luding the replacement funds are $1,556 million, which is $56 million below the Adopted Budget estimate. The Adopted Budget was bas ed on ear ly projections of NYS Wage and Salary Disbursements that proved to be overstated. As a result, the July Plan forecast reflects a lower recalibrated estimate that is used as the base for the out-year projections. 2015 Preliminary Budget The 2015 Preliminary Budget fore cast for PMT is $1,316 millio n, which is $59 million higher than the 2014 Mid-year Forecast. This is $69 million below the February Plan. When combined with the PMT repl acement funds of $307 million, Total PMT revenues in 2015 are $1,625 million. The July Plan projections for the current and future years are based on Global Insight forecasts for regional Wage and Salary Disbursements. 2016 - 2018 The July Plan forecas t of PMT revenues is $1,376 million for 20 16, $1,437 million for 2017 and $1,494 for 2018. When combined with the replacement funds Total MTA PMT revenues are $1,685 millio n in 2016, $1,745 million in 2 017 and $1,803 million in 2018. These estimates are $74 million below the February Plan in 2016 and $83 million lower in 2017.
II-54

MTA AID TRUST REVENUES Legislative actions by New York State in May 2009 directed revenues from the following new taxes and fees to the MTA Aid Trust Account:
License Fee - a supplemental fee of one dollar for each six month period of validity of a learner’s permit or driver’s license issued to individuals residing in the Metropolitan Commuter Transportation District (MCTD);
Auto Registration Fee - a $25 increase in automobile registration fees in the MTA region, on an annual basis, to be paid by auto mobile registrants in increments of $50, since car registrations cover a two-year period;
Taxicab Tax – a tax of $0.50 per ri de imposed on taxicab owners for each taxicab ride that originates in New York City and te rminates within the 12-county MTA region;
Auto Rental Tax – a supplemental tax of five-percent (5%) of the cost of automobile rentals within the MCTD.
The legislation establishing these new tax streams:
Allows for the revenues to be pledged by MTA or by TBTA to secure debt;
Allows the MTA to pay operating and capital costs of the MTA an d its subsidiaries and NYCTA and its subsidiari es as determined by the MTA, subject to the provisions of the above referenced pledges, or in the event there is n o such pledge.
In February 2012, New York State Legislature passed a la w that granted the City the authority to establish a Hail Accessible Interborough License (HAIL) program to provide street hail service in cert ain underserved areas of Manha ttan in in the boroughs of Brooklyn, Bronx, Staten Island and Queens, and also to expand the existing yellow-taxi program by selling 2, 000 new licenses. A fter several leg al challenges, the law was implemented during the second half of 2013, and is expected to result in increased Taxicab Tax revenues for the MTA over the ne xt two years as t he additional vehicles continue to be phased into the City’s taxi fleet. 2014 Mid-Year Forecast The 2014 Mid-Year Forecast of total MTA Aid taxes is $325 million, which is $22 million higher than 2013; this is $4.1 million more than the Adopted Budget estimate. The Mid-Year Forecast includes $5 million in additiona l revenues res ulting from the HAIL program phase-in, which is consistent with the assumption in the Adopted Budget.
II-55

2015 Preliminary Budget The MTA Aid forecast for the 2015 Prelimi nary Budget is $328 m illion, which is $4 million higher than the 2014 Mid-Year Foreca st. This is $2 million lo wer than the February Plan, due to revised revenues projecti ons by the State. The estimate includes $5 million in additional revenues from the HAIL program. 2016 - 2018 For 2016 through 20 18, the July Plan estima tes of MTA Aid a re $330 million in 20 16, $332 million in 2 017 and $33 5 million in 2 018. Thes e estimates are high er than the prior year’s estimate by $2 million in 2016, $3 million in 2017 and $2 m illion in 2018. Compared to the February Plan, these estimates are lower by $5 million in 2 016 and $3 million in 2017. Included in the forecast is an additional $10 million annually from the full implementation of the HAIL program.
II-56

STATE AND LOCAL SUBSIDIES State and Local Subsidies consist of the following:
New York State Operating Assistance - a statewide mass transportation program (State 18-b Operating Assistance) that provides direct State aid to the MTA, which is appropriated by the St ate Legislature on an annual basis. Beginning in 1994, the St ate has used a portion of the MMTOA funds for the State’s 18-b payments.
Local Operating Assistance – payments made by the City and each of the seven counties in the MTA Transportati on District, w hich are required by the transportation law to match the amounts of State 18-b Operating Assistance. The matching payments are to be made quarterly to the MTA. Additiona l assistance from NYC and other localities not elsewhere captured are included in Local Operating Assistance.
Station Maintenance – a subsidy paid by the City and each of the seven counties in the MTA T ransportation District for the operation, maintenance and use of commuter railroad pass enger stations within the City and each of the counties. Station Maintenance base amounts were established in 1999 and are subject to an annual adjustment tied to the consumer price index.
Connecticut Department of Transportation (CDOT) Subsidy to Metro-North Railroad - subsidy payments made to Metr o-North Railroad as reimbursement for expenses assoc iated with Metro-No rth operations in th e State of Connecticut.
New York City Subsidy for MTA Bus - New York City reimbursement to the MTA of the cost of MTA Bus operati ons, which are 100% reimbursable by the City of New York. Under an agreement with the MTA, the City of New York committed to pay MTA Bus the difference between the actual operating costs of the City bus routes and all revenues rece ived for operations from said routes. MMTOA, State 18-b, Local Operating A ssistance, and Urban Taxes that are designated for the former private buses , which are s ubsidized by the City as required by Statute, continue to be paid directly to the City and are used by the City towards the funding of MTA Bus.
New York City Subsidy for SI Railway – subsidy payments made by New York City to cover expenses associated with SI Railway operations.
2014 Mid-Year Forecast
The 2014 Mid-Year Forecast of State and Local subs idy, on a cash basis, (excluding New York City Subsidy for MTA Bus and SIR) is $650 million, or $43 million higher than 2013. This estimate is $23 million higher than the Ad opted Budget estimate, and the change is primarily due to higher CDOT subsidies. The 2014 Mid-Year cash forecast of City Subsidy to MTA Bus of $444 million is $136 million higher than the previous year and is $54 million higher than the Adopted Budget
II-57
estimate; this was primarily due to favor able cash timing adjustm ents. The 2014 c ash forecast for City Subsidy to Staten Island Ra ilroad is $24 million. This is $7 million lower than the 2013 forecast. Compared with the Adopted Budget, the estimat e decreased by $8 million due to re-estimates of revenues and expenses. 2015 Preliminary Budget The 2015 Preliminary Budget fo r State and Local Subs idy, on a cash basis, (exclu ding City Subsidy for MTA Bus and SIR), on a ca sh basis, is $15 million be low the 2014 estimate. It is $0.3 million below the Adopted Budget estimate. The 2015 Preliminary Budget cash forecast of City Subsidy to MTA Bus of $435 millio n is $8 million lower than the previous year. The estimate is $21 million higher than the Adopted Budget estimate primarily due to favorable cash timing adjustments. The 2015 cash forecast for City Subs idy to Staten Isl and Railroad is $35 m illion, which is $1 0 million higher than the 2014 forecast. Compared with the Adopted Budget, the estimate increased by $7 million due to re-estimates of revenues and expenses. 2016 - 2018 The Forecast for total State and Local Subs idy is above the prior year’s estimate by $6 million in 2016, by $5 million in 2 017 and $12 million in 2018. Compared with Adopte d Budget estimates, these forecasts are high er by $5 million in 2 016 and $ 4 million in 2017. This was due pr imarily to re-estimates of CDOT subsidies to MNR, reflecting lower revenues and higher expenses. The July Plan forecasts of City Subsidy to MTA Bus are $412 million for 2016, $424 for 2017 and $423 for 2018, reflecting year-over-y ear declines of $23 million in 2016, and $0.5 million in 2018 and an increase of $11 million in 2017. Compared to the February Plan, these estimates are higher by $15 mi llion in 2016 and $9 million in 2017 due t o favorable cash timing adjustments. The cash forecasts for City Subsidy to Staten Island Railroad are $37 million in 2016, $48 million in 2017 and $34 millio n in 2018, reflecting year-over-year increases of $3 mi llion in 2016 and $11 million in 2 017 and a decline of $13 million in 2018. Compared wit h the Adopted Budget, the estimates increased by $0.4 million in 20 16 and $9 million in 2017, due to re-estimates of revenues and expenses.
II-58

SUBSIDY AND OTHER TECHNICAL ADJUSTMENTS In addition to the adjustments to MRT- 2, which are discussed in the MRT Section, the July Plan includes other subsidy adjustments for 2014 through 2018. MTA Bus Debt Service - Consistent with the Febr uary Financial Plan, the July Financial Plan reflects the MTA’s agreement with the City of New York to fund a portion of MTA Bus’ debt servic e from Ne w York City Transit subsidies eac h year, which is $12 million annually for t he duration of the Plan. These amounts reflect reimbursement to MTA Bus under a swap agreement with New York City Transit in which F ederal capital grant moneys earmarked for MTA Bus are paid directly to New York City Transit; NYCT applies thes e funds to cover its own capital projects and in turn reimburses MTA Bus. This is in addition to the M TA’s funding of all capital costs associated with MTABC’s 2005-2009 Capital Program, currently estimated at $25 mi llion. [For details s ee Other MRT-2 Adjustments in the Mortgage Recording Taxes (MRT) Section]. Forward Energy Contract - Since 2008, MTA has hedged a portion of its projected fuel expense to reduce budgetary risk from price vo latility. The MTA intends to continue this strategy, with new hedge cont racts extending as far as 24 months from execution dat e, which provides a measure of fi nancial stability from price fluctuations. At any point in time, approximately 50% of the projected fuel usage for the forward 12-month period will be hedged. MNR Repayment for 525 North Broadway - In 2007, an arrangement was made whereby MTA Capital would advance the funds for MNR’s cap ital project at 525 North Broadway in North White Plai ns, for which MTA Capital would be reimbursed overtime from MNR’s operating budget. The July Financial Plan, like the February Plan, incorporates the repayment of this loan in the amount of $2.4 million annually from 2014 through 2018. Repayment of Loan to Capital Financing Fund - The J uly Financial Plan, similar to the February Financial Plan, continues to pay down the remaining $200 million balance of a Board-author ized $500 million in teragency loan t o the o perating budget from the “Capital Financing Fund” (non-bond related funds dedica ted to capital programs), with annual installments of $100 million in 2014 and 2015. Committed to Capital – Like the February Plan, the July Financial Plan assumes that a portion of the new tax revenues authorized by New York State in May 2009 will be used for the MTA Capital Pr ogram. For 2014 and the s ubsequent Plan years, there are no changes from the Adopted Budget forecasts. The July Financial Plan continues to assume the tr ansfer of fund to the Capital Pro gram which began in 2012 with an initial pay ment of $150 million an d increases by increments of $50 million annually thr ough 2016. The amounts re flected in this category are net of debt service payments associated with the MTA’s 2010-2014 Capital Program, which are captured within consolidated debt service.
II-59

Additional Support for Capital Program – The 2014 F ebruary Plan assumed a total “down payment” in support of the 2015-2019 Capita l Program of $370 million in each year of the financial plan. It is expecte d that a reduction in this level of funding will be required to hel p fund higher c osts for represented labor. Updated assumptions and discussion are captured in Volume 1.
II-60

2014 2015 2013 Mid-Year Preliminary Actual Forecast Budget 2016 2017 2018
Subsidies
Dedicated TaxesMetropolitan Mass Transportation Operating Assist (MMTOA) $999.4 $1,032.1 $1,080.4 $1,129.2 $1,175.3 $1,230.2Petroleum Business Tax (PBT) Receipts 498.4 526.2 514.3 511.2 510.7 511.7Mortgage Recording Tax (MRT) 0.0 0.0 0.0 0.0 0.0 0.0Urban Tax 594.7 705.6 609.8 666.9 707.4 742.2
$2,092.5 $2,263.9 $2,204.5 $2,307.4 $2,393.4 $2,484.1
New State Taxes and FeesPayroll Mobility Tax $905.4 $877.3 $992.3 $1,033.4 $1,044.5 $1,059.4Payroll Mobility Tax Replacement Funds 228.9 215.9 233.2 232.2 224.8 219.3MTA Aid 225.6 226.5 247.5 247.6 241.5 237.2
$1,359.9 $1,319.7 $1,473.0 $1,513.2 $1,510.8 $1,515.8
State and Local Subsidies
State Operating Assistance $158.1 $158.1 $158.1 $158.1 $158.1 $158.1Local Operating Assistance 158.1 158.1 158.1 158.1 158.1 158.1
$316.2 $316.2 $316.2 $316.2 $316.2 $316.2
Other Subsidy AdjustmentsTransfer to/from Stabilization Fund $0.0 $0.0 $0.0 $0.0 $0.0 $0.0Inter-agency Loan ($89.5) $0.0 $0.0 $0.0 $0.0 $0.0NYCT Charge Back of MTA Bus Debt Service (11.5) (11.5) (11.5) (11.5) (11.5) (11.5)Forward Energy Contracts Program - Gain/(Loss) 0.4 2.3 1.1 (0.2) 0.0 0.0Repayment of Loan to Capital Financing Fund 0.0 (78.0) (100.0) 0.0 0.0 0.0Committed to Capital (270.8) (176.2) (396.0) (379.0) (439.5) (447.1)
($371.4) ($263.4) ($506.4) ($390.7) ($451.0) ($458.6)
$3,397.2 $3,636.4 $3,487.2 $3,746.2 $3,769.5 $3,857.5
Inter-agency Subsidy Transactions
Bridges and Tunnels Operating Surplus Transfer $246.0 $219.8 $198.3 $188.8 $172.0 $155.7$246.0 $219.8 $198.3 $188.8 $172.0 $155.7
GROSS SUBSIDIES $3,643.2 $3,856.2 $3,685.6 $3,935.0 $3,941.5 $4,013.2
Total Dedicated Taxes & State and Local Subsidies
($ in millions)Cash Basis
July Financial Plan 2015-2018MTA NEW YORK CITY TRANSIT SUBSIDY ALLOCATION
II-61

2014 2015 2013 Mid-Year Preliminary Actual Forecast Budget 2016 2017 2018
Subsidies
Dedicated TaxesMetropolitan Mass Transportation Operating Assist (MMTOA) $511.4 $528.1 $547.9 $570.4 $591.6 $617.0Petroleum Business Tax (PBT) Receipts 88.0 92.9 90.8 90.2 90.1 90.3Mortgage Recording Tax (MRT) 0.0 0.0 0.0 0.0 0.0 0.0Investment Income 1.0 1.0 1.1 1.1 1.2 1.2
$600.3 $622.0 $639.7 $661.7 $683.0 $708.5
New State Taxes and FeesPayroll Mobility Tax $309.9 $379.6 $323.7 $342.6 $392.2 $434.8Payroll Mobility Tax Replacement Funds 78.3 93.4 76.1 77.0 84.4 90.0MTA Aid 77.2 98.0 80.7 82.1 90.7 97.3
$465.5 $571.0 $480.6 $501.7 $567.3 $622.1
State and Local SubsidiesState Operating Assistance $29.3 $29.3 $29.3 $29.3 $29.3 $29.3Local Operating Assistance 29.8 29.3 29.3 29.3 29.3 29.3CDOT Subsidy 70.8 111.6 93.9 97.5 100.0 109.3Station Maintenance 160.2 162.6 165.1 167.9 170.5 173.1
$290.1 $332.7 $317.5 $323.9 $329.0 $340.9
Other Subsidy AdjustmentsPension Liability Reduction ($210.0) ($20.9) ($8.8) ($17.4) ($15.3) ($13.2)Inter-agency Loan (30.7) 0.0 0.0 0.0 0.0 0.0Forward Energy Contracts Program - Gain/(Loss) 0.2 1.0 0.5 (0.1) 0.0 0.0MNR Repayment for 525 North Broadway (2.4) (2.4) (2.4) (2.4) (2.4) (2.4)Repayment of Loan to Capital Financing Fund (200.0) (22.0) 0.0 0.0 0.0 0.0Committed to Capital (13.0) 31.4 (12.1) 9.0 (3.5) (1.8)
($455.9) ($13.0) ($22.9) ($10.9) ($21.2) ($17.4)
$900.0 $1,512.7 $1,414.9 $1,476.5 $1,558.1 $1,654.0
Inter-agency Subsidy Transactions
Bridges and Tunnels Operating Surplus Transfer $360.0 $340.6 $309.9 $300.8 $285.0 $268.1$360.0 $340.6 $309.9 $300.8 $285.0 $268.1
GROSS SUBSIDIES $1,259.9 $1,853.3 $1,724.7 $1,777.3 $1,843.0 $1,922.1
Total Dedicated Taxes & State and Local Subsidies
($ in millions)Cash Basis
July Financial Plan 2015-2018MTA COMMUTER RAILROAD SUBSIDY ALLOCATION
II-62

2014 2015 2013 Mid-Year Preliminary
Actual Forecast Budget 2016 2017 2018
Subsidies
Dedicated TaxesMetropolitan Mass Transportation Operating Assist (MMTOA) $3.5 $3.6 $3.8 $4.0 $4.1 $4.3
Mortgage Recording Tax (MRT) 0.0 0.0 0.0 0.0 0.0 0.0$3.5 $3.6 $3.8 $4.0 $4.1 $4.3
State and Local Subsidies
State Operating Assistance $0.6 $0.6 $0.6 $0.6 $0.6 $0.6Local Operating Assistance 0.6 0.6 0.6 0.6 0.6 0.6SIRTOA Recovery 30.7 24.0 34.5 37.1 47.8 34.4
$31.8 $25.1 $35.6 $38.2 $48.9 $35.5
$35.3 $28.8 $39.4 $42.1 $53.0 $39.8
Inter-agency Subsidy Transactions
MTA Subsidy to Subsidiaries $0.0 $0.0 $0.0 $0.0 $0.0 $0.0
GROSS SUBSIDIES $35.3 $28.8 $39.4 $42.1 $53.0 $39.8
MTA STATEN ISLAND RAILWAY SUBSIDY ALLOCATION
Total Dedicated Taxes & State and Local Subsidies
($ in millions)Cash Basis
July Financial Plan 2015-2018
II-63

2014 2015 2013 Mid-Year Preliminary Actual Forecast Budget 2016 2017 2018
Subsidies
Dedicated Taxes
Mortgage Recording Tax-1Net Receipts After Agency Transfers $253.6 $266.2 $271.9 $285.7 $294.2 $305.7
Adjustments to MRT-1Diversion of MRT to Suburban Highway 0.0 0.0 0.0 0.0 0.0 0.0MRT-2 Required to Balance 82.0 89.8 118.4 101.4 97.4 88.8
$82.0 $89.8 $118.4 $101.4 $97.4 $88.8
Net Available MRT-1 Funds for MTA HQ $335.6 $356.0 $390.2 $387.1 $391.6 $394.6
Net Funding of MTA Headquarters $335.6 $356.0 $390.2 $387.1 $391.6 $394.6
Unallocated MRT-1 Receipts $0.0 $0.0 $0.0 $0.0 $0.0 $0.0
Mortgage Recording Tax - 2Net Receipts $108.8 $109.3 $115.7 $117.3 $118.6 $122.4
Adjustments to MRT-2Funding of General Reserve $0.0 ($135.0) ($140.0) ($145.0) ($150.0) ($155.0)Diversion of MRT to Suburban Counties (2.4) (3.4) (2.7) (3.1) (3.0) (3.0)Investment Income 4.5 4.7 4.9 5.1 5.3 5.3Agency Security Costs from MRT (10.0) (10.0) (10.0) (10.0) (10.0) (10.0)MTA Bus Debt Service (24.9) (24.9) (24.9) (24.9) (24.9) (23.8)Transfer to MRT-1 (82.0) (89.8) (118.4) (101.4) (97.4) (88.8)
($114.9) ($258.5) ($291.2) ($279.3) ($280.0) ($275.4)
Unallocated MRT-2 Receipts ($6.1) ($149.1) ($175.5) ($161.9) ($161.4) ($152.9)
($ in millions)Cash Basis
July Financial Plan 2015-2018MTA HEADQUARTERS SUBSIDY ALLOCATION
II-64

2014 2015 2013 Mid-Year Preliminary Actual Forecast Budget 2016 2017 2018
Subsidies
City Subsidy to MTA Bus Company $307.5 $443.6 $435.4 $412.5 $423.8 $423.3
($ in millions)Cash Basis
July Financial Plan 2015-2018MTA BUS COMPANY SUBSIDY ALLOCATION
II-65

($ in millions)Surplus Transfer
July Financial Plan 2015-2018MTA BRIDGES & TUNNELS
ACTUAL
2013 2014 2015 2016 2017 2018
Net Surplus/(Deficit) $1,257.970 $1,190.597 $1,182.526 $1,182.118 $1,173.889 $1,163.951
Deductions from Net Operating Income:
Total Debt Service 597.454 597.868 633.695 644.353 669.149 691.000Capitalized Assets 14.525 17.843 17.849 20.635 21.056 21.475Reserves 28.573 25.895 26.382 26.881 27.338 27.824GASB Reserves 3.077 1.610 0.000 0.000 0.000 0.182
Total Deductions from Net Operating Income $643.629 $643.216 $677.926 $691.869 $717.542 $740.481
Net Income Available for Transfer to MTA and NYCT $614.341 $547.381 $504.600 $490.249 $456.347 $423.469
Distribution of Funds to MTA:
Investment Income in Current Year $0.131 $0.162 $0.737 $2.180 $2.866 $2.961Accrued Current Year Allocation 367.308 327.101 307.935 300.053 283.293 266.413
Total Accrued Amount Distributed to MTA $367.439 $327.263 $308.672 $302.233 $286.159 $269.374
Distribution of Funds to NYCT:
First $24 million of Surplus reserved for NYCT $24.000 $24.000 $24.000 $24.000 $24.000 $24.000Additional Accrued Current Year Allocation 222.902 196.118 171.928 164.016 146.189 130.095
Total Accrued Amount Distributed to NYCT $246.902 $220.118 $195.928 $188.016 $170.189 $154.095
Actual Cash Transfer to MTA and NYCT:
From Current Year Surplus $359.991 $340.639 $309.852 $300.842 $284.969 $268.101Investment Income in Prior Year 0.136 0.131 0.162 0.737 2.180 2.866
Total Cash Amount Distributed to MTA $360.127 $340.770 $310.013 $301.578 $287.149 $270.967
Total Cash Amount Distributed to NYCT $245.971 $219.793 $198.347 $188.807 $171.971 $155.705
FORECAST
II-66

($ in millions)Surplus Transfer
July Financial Plan 2015-2018MTA BRIDGES & TUNNELS
ACTUAL
2013 2014 2015 2016 2017 2018
Debt Service Detail by Agency:
B&T Own Purpose Debt Service $207.227 $241.834 $264.830 $275.455 $297.449 $321.429NYCT Transportation Debt Service 267.316 243.509 252.436 252.468 254.402 252.945MTA Transportation Debt Service 122.910 112.526 116.429 116.430 117.298 116.627
Total Debt Service by Agency $597.454 $597.868 $633.695 $644.353 $669.149 $691.000
Total Accrued Amount for Transfer to MTA and NYCT:
Total Adjusted Net Income Available for Transfer $1,211.664 $1,145.087 $1,137.558 $1,132.422 $1,122.630 $1,111.508Less: B&T Total Debt Service (207.227) (241.834) (264.830) (275.455) (297.449) (321.429)Less: first $24 million reserved for NYCT (24.000) (24.000) (24.000) (24.000) (24.000) (24.000)
Remainder of Total Accrued Amount for Transfer $980.437 $879.254 $848.728 $832.967 $801.181 $766.080
Calculation of Actual Cash Transfer to MTA:
Distribution of Remainder to MTA
Fifty Percent of Total Accrued Amount for Transfer $490.218 $439.627 $424.364 $416.483 $400.590 $383.040Less: MTA Total Debt Service (122.910) (112.526) (116.429) (116.430) (117.298) (116.627)
MTA's Accrued Current Year Allocation $367.308 $327.101 $307.935 $300.053 $283.293 $266.413
Cash Conversion of MTA's Accrued Amount
Current Year Amount $321.060 $294.391 $277.142 $270.048 $254.963 $239.772Balance of Prior Year 38.931 46.248 32.710 30.794 30.005 28.329
Cash Transfer to MTA $359.991 $340.639 $309.852 $300.842 $284.969 $268.101
Calculation of Actual Cash Transfer to NYCT:
Distribution of Remainder to NYCT
Fifty Percent of Total Accrued Amount for Transfer $490.218 $439.627 $424.364 $416.483 $400.590 $383.040Less: NYCT Total Debt Service (267.316) (243.509) (252.436) (252.468) (254.402) (252.945)Plus: first $24 million reserved for NYCT 24.000 24.000 24.000 24.000 24.000 24.000
NYCT's Accrued Current Year Allocation $246.902 $220.118 $195.928 $188.016 $170.189 $154.095
Cash Conversion of NYCT's Accrued Amount
Current Year Amount $225.215 $198.107 $176.335 $169.214 $153.170 $138.686Balance of Prior Year 20.756 21.687 22.012 19.593 18.802 17.019
Cash Transfer to NYCT $245.971 $219.793 $198.347 $188.807 $171.971 $155.705
FORECAST
II-67

Line
Number ACTUAL
9 2013 2014 2015 2016 2017 2018
10 Revenue Summary:
11
12 Farebox Revenue $5.5 $5.8 $5.9 $6.0 $6.0 $6.113 Other Revenue 4.3 4.3 2.4 2.4 2.4 2.414 State/City Subsidies 4.6 4.7 4.9 5.1 5.2 5.415
16 Total Revenues $14.4 $14.8 $13.1 $13.4 $13.7 $13.9
1718 Non-Reimbursable Expense Summary:
19
20 Labor Expenses $33.5 $32.0 $30.0 $31.8 $33.6 $34.421 Non-Labor Expenses 9.4 12.9 19.8 28.6 12.9 13.622 Depreciation 8.1 8.3 8.3 8.3 8.3 8.323 OPEB Obligation 1.4 2.3 2.3 2.3 2.3 2.324 Environmental Remediation 0.0 0.0 0.0 0.0 0.0 0.025
26 Total Non-Reimbursable Expenses $52.4 $55.5 $60.4 $71.0 $57.1 $58.6
2728
29 Total Net Revenue/(Deficit) ($38.0) ($40.7) ($47.3) ($57.6) ($43.4) ($44.7)30
31 Other Expenses
32 Debt Service 0.0 0.1 0.4 0.8 1.5 2.233
34 Total Net Revenue/(Deficit) after Debt Service ($38.0) ($40.8) ($47.7) ($58.4) ($45.0) ($46.9)
35
36 Cash Adjustment Summary:
37 Operating Cash Adjustments $14.0 $6.9 $10.6 $10.6 $10.6 $10.638 GASB Cash Adjustments 0.0 (0.6) 0.0 0.0 0.0 (0.0)40
41 Total Cash Adjustments $14.0 $6.3 $10.6 $10.6 $10.6 $10.6
42
43 Gross Cash Balance ($24.0) ($34.5) ($37.1) ($47.8) ($34.4) ($36.3)
4445 City Subsidy Cash Adjustments:
46 Cash Balance Due from the City of New York 24.0 34.5 37.1 47.8 34.4 36.347 Cash Subsidy Received from City of New York for SIRTOA 30.7 24.0 34.5 37.1 47.8 34.448 Subsidy Cash Timing $6.7 ($10.5) ($2.5) ($10.7) $13.4 ($1.9)49
50 Net Cash Balance from Previous Year (30.7) (24.0) (34.5) (37.1) (47.8) (34.4)51
52 Baseline Net Cash Surplus/(Deficit) ($24.0) ($34.5) ($37.1) ($47.8) ($34.4) ($36.3)
53
54 MTA Internal Subsidy:
55 MTA Carryover from Previous Year 0.0 0.0 0.0 0.0 0.0 0.056 MTA Internal Subsidy (Cash) 0.0 0.0 0.0 0.0 0.0 0.057
58 Baseline Net Cash Surplus/(Deficit) ($24.0) ($34.5) ($37.1) ($47.8) ($34.4) ($36.3)
59
SUMMARY
2014 JULY FINANCIAL PLAN2015-2018
($ in millions)
MTA STATEN ISLAND RAILWAY
FORECAST
II-68

Line
Number ACTUAL
9 2013 2014 2015 2016 2017 2018
10 Revenue Summary:
11
12 Farebox Revenue $199.2 $199.8 $201.4 $202.9 $203.2 $204.013 Other Revenue 26.2 26.5 20.4 20.6 20.9 21.314
15 Total Revenues $225.4 $226.3 $221.8 $223.5 $224.1 $225.4
16
17 Non-Reimbursable Expense Summary:
18
19 Labor Expenses $437.0 $451.6 $456.3 $473.8 $488.5 $499.120 Non-Labor Expenses 137.2 143.6 179.4 180.2 172.6 156.121 Depreciation 48.9 42.2 42.2 42.2 42.9 43.722 OPEB Obligation 100.2 100.2 100.2 100.2 100.2 100.223 Environmental Remediation 1.7 0.0 0.0 0.0 0.0 0.024
25 Total Non-Reimbursable Expenses $725.0 $737.6 $778.0 $796.4 $804.1 $799.0
2627
28 Total Net Revenue/(Deficit) ($499.5) ($511.3) ($556.2) ($572.9) ($580.0) ($573.6)
2930 Other Expenses
31 Debt Service $32.0 $24.3 $21.2 $21.1 $21.6 $21.932 Non-Billable Debt Service (2005-2011 Capital Program) (28.9) (22.2) (19.2) (19.1) (19.6) (19.8) 33
34 Total Net Revenue/(Deficit) after Debt Service ($502.6) ($513.4) ($558.3) ($575.0) ($582.1) ($575.8)
3536 Cash Adjustment Summary:
37 Operating Cash Adjustments $164.9 $94.5 $154.0 $154.3 $155.1 $156.138 Non-Billable GASB Cash Adjustments (4.9) (2.6) (0.0) 0.0 0.0 0.039
40 Total Cash Adjustments $160.0 $91.9 $154.0 $154.3 $155.1 $156.1
41
42 Gross Cash Balance ($342.6) ($421.5) ($404.3) ($420.7) ($427.0) ($419.7)
43
44 City Subsidy Cash Adjustments:
45 Cash Balance Due from NYC (adjusted for Non-Billable GASB) $342.6 $395.0 $404.3 $420.7 $427.0 $419.746 Cash Subsidy Received from City of New York for MTA Bus 307.5 443.6 435.4 412.5 423.8 423.347 Subsidy Cash Timing ($35.1) $48.6 $31.1 ($8.2) ($3.1) $3.748
49 Net Cash Balance from Previous Year ($99.5) ($134.6) ($85.9) ($54.8) ($63.1) ($66.2)5051
52 Baseline Net Cash Surplus/(Deficit) ($134.6) ($85.9) ($54.8) ($63.1) ($66.2) ($62.5)
53
SUMMARY
2014 JULY FINANCIAL PLAN2015-2018
($ in millions)
MTA BUS COMPANY
FORECAST
II-69

MTA New York City Transit July Financial Plan 2015 - 2018
Paratransit Operations($ in thousands)
ADA Trips:
Pct Change from Previous Year
Revenue: Fares Urban TaxSub-total City Reimbursements Total Revenue
Expenses:Operating Expenses: Salaries& Benefits Rental & Miscellaneous Total Expenses
Net Paratransit Surplus/(Deficit)
Total Paratransit Reimbursement: Urban Tax City Reimbursements
Rental & Miscellaneous Expense:Paratransit Service Contracts
Carrier Services
Command Center
Eligibility Certification
Other
Subtotal
Other Than Personnel Service: Insurance Fuel
Other Subtotal
Non-City Reimbursable OTPS:
Total Rental & Miscellaneous Expense
Annual Growth in Total Expenses
2014 2015 2016 2017 2018
6,769,639 7,379,980 7,896,579 8,449,340 9,040,793
1.1% 9.0% 7.0% 7.0% 7.0%
16,993$ 18,525$ 19,821$ 21,209$ 22,693$ 35,565 39,277 42,927 45,770 47,301
$ 52,557 $ 57,802 $ 62,748 $ 66,979 $ 69,994 135,132 141,003 154,091 173,598 190,620
$ 187,689 $ 198,805 $ 216,839 $ 240,577 $ 260,615
21,854$ 22,052$ 22,052$ 22,052$ 22,052$ 449,863 472,611 516,737 579,488 632,039 471,717$ 494,663$ 538,789$ 601,540$ 654,091$
$ (284,027) $ (295,858) $ (321,950) $ (360,964) $ (393,477)
170,697$ 180,281$ 197,018$ 219,368$ 237,922$ 35,565$ 39,277$ 42,927$ 45,770$ 47,301$
135,132 141,003 154,091 173,598 190,620
347,083$ 355,274$ 387,665$ 437,607$ 476,917$
24,199 26,843 29,371 32,096 35,075
3,701 4,100 4,550 5,050 5,050
5,539 5,537 5,538 5,538 5,537
380,523$ 391,754$ 427,124$ 480,292$ 522,580$
34,844 40,399 47,626 56,069 65,965 22,193 22,653 23,407 25,459 27,989
11,069 16,574 17,349 16,438 14,274 68,106$ 79,626$ 88,382$ 97,965$ 108,229$
1,211$ 1,211$ 1,210$ 1,210$ 1,230$
449,840$ 472,591$ 516,716$ 579,467$ 632,039$
4.8% 4.9% 8.9% 11.6% 8.7%
Paratransit Details
II-70

Debt Service

Debt Service in the Financial Plan The following table includes debt service projections for 2014 thr ough 2018 associated with approved Capital Programs. The overall decrease in baseline debt service from the February Plan is due primarily to the projected capi tal projects cash flow timing, lower than budgeted short-term rates through May of 2014 and lower fixed-rate interest rates.
Debt Service Forecast (in millions)*
Difference February Plan July Plan Favorable
Year Debt Service Debt Service (Unfavorable)2014 $2,333 $2,288 $45 2015 2,491 2,445 46 2016 2,651 2,568 83 2017 2,873 2,753 120 2018 N/A 2,921 N/ATotal $10,348 $12,975 $294
*Totals may not add due to rounding.
The following is a summary of the key ass umptions used to determine the debt service projections included in the financial plan.
Debt Issuance Assumptions:
Forecasted Borrowing Schedule* 2014 2015 2016 2017 2018
($ in millions) TR and DTF New Money Bonds $1,058 $2,099 $2,068 $2,074 $1,882 TBTA New Money Bonds 350 78 262 349 478 Total New Money Bonds $1,408 $2,177 $2,329 $2,423 $2,360
Assumed Fixed-Rates Transportation Revenue Bonds 4.92% 5.12% 5.31% 5.46% 5.54% Dedicated Tax Fund Bonds 4.78% 4.96% 5.13% 5.26% 5.33% Triborough Bridge & Tunnel Authority 4.78% 4.96% 5.13% 5.26% 5.33% Assumed Variable Rates 4.00% 4.00% 4.00% 4.00% 4.00%
Weighted Average Interest Rates 1 Transportation Revenue Bonds 5.33% 5.49% 5.63% 5.73% 5.77% Dedicated Tax Fund Bonds 5.04% 5.20% 5.33% 5.42% 5.46% Triborough Bridge & Tunnel Authority 5.04% 5.20% 5.33% 5.42% 5.46%
* TR stands for Transportation Revenue; DTF stands for Dedicated Tax Fund. 2014 New Money Bonds include $0.8 billion of Transportation Revenue New Money Bonds, $250 million of TBTA New Money Bonds and $100 million of TBTA Bond Anticipation Notes issued through May 31, 2014. 1 Weighted Average of fixed and variable forecasted rates calculated.
II-71

All debt is assumed to be issued as 30- year level debt, principal amortized over
the life of the bonds. Current fixed-rate estimates derived from prevailing Fair Market Yield Curves for
A- and AA- Transportation is suers using Bloomberg Information Serv ice. Financial Plan years 2014–20 18 derived by apply ing changes in U.S. Munic ipal Forward Curves to prevailing transportation curves (as of June 3, 2014).
Split of fixed-rate debt versus variable rate debt each year is 90% fixed and 10% variable.
New bond issues calculat ed interest rate at time of issuance use weighted average of fixed and variable assumptions.
Cost of issuance is 2% of gross bonding amount. New money bonds for currently approved transit and c ommuter projects assume
a target split of 25% under the DTF cred it and 75% under the Transportation credit, subject to satisfying the additional bonds test under the DTF Resolution.
Assumes Transportation Revenue Bonds are issued to fund a portion of the East Side Access project costs ultimately expected to be funded by the Railr oad Rehabilitation and Improvement Financing (RRIF) loan.
All bonds issued to finance T BTA capital projects issued under the TBT A General Revenue Resolution.
Assumes $331 million of pay-go funding during the 2014-2018 forecast period. Build America Bonds subsidy has been reduced by 7.2% annually through and
including Federal Fiscal Year 2021 reflecting the sequester reduction for payments to issuers of direct pay bonds.
No reserve funds.
II-72

Line
AC
TU
AL
Num
ber
20
13
20
14
20
15
20
16
20
17
20
18
9N
ew Y
ork
Cit
y T
ran
sit:
10Bu
dget
ed G
ross
Deb
t Ser
vice
for E
xist
ing
Tran
spor
tatio
n R
even
ue B
onds
$826
.805
$817
.300
$833
.288
$820
.252
$833
.538
$841
.951
11D
ebt S
ervi
ce o
n Ad
ditio
nal T
rans
porta
tion
Rev
enue
Bon
ds S
uppo
rting
App
rove
d C
apita
l Pro
gram
s0.
000
1.44
029
.734
82.0
8213
7.85
620
7.16
612
2 Br
oadw
ay C
ertif
icat
es o
f Par
ticip
atio
n - N
YCT
Leas
e Po
rtion
12.4
7717
.722
17.3
7116
.340
18.6
0519
.395
132
Broa
dway
Cer
tific
ates
of P
artic
ipat
ion
- Add
ition
al N
YCT
Shar
e of
MTA
Lea
se P
ortio
n0.
000
0.00
02.
405
2.26
22.
575
2.68
513
Tran
spor
tatio
n R
esol
utio
n C
omm
erci
al P
aper
0.66
612
.079
20.4
9120
.491
20.4
9120
.491
14Bu
dget
ed G
ross
Deb
t Ser
vice
for E
xist
ing
Ded
icat
ed T
ax F
und
Bond
s31
8.06
031
7.22
631
5.91
731
8.29
331
9.32
431
8.04
215
Deb
t Ser
vice
on
Addi
tiona
l Ded
icat
ed T
ax F
und
Bond
s Su
ppor
ting
Appr
oved
Cap
ital P
rogr
ams
0.00
00.
000
8.90
426
.258
42.2
3749
.765
16S
ub-T
otal
MT
A P
aid
Deb
t S
ervi
ce$1
,158
.008
$1,1
65.7
66$1
,228
.108
$1,2
85.9
78$1
,374
.626
$1,4
59.4
9517 18
Budg
eted
Gro
ss D
ebt S
ervi
ce fo
r Exi
stin
g TB
TA (B
&T) G
ener
al R
even
ue B
onds
$193
.033
$180
.506
$180
.042
$180
.048
$181
.023
$180
.052
19Bu
dget
ed G
ross
Deb
t Ser
vice
for E
xist
ing
TBTA
(B&T
) Sub
ordi
nate
Rev
enue
Bon
ds78
.119
63.0
0272
.622
73.2
4074
.725
74.2
7220
Sub
-Tot
al B
&T
Pai
d D
ebt
Ser
vice
$271
.152
$243
.509
$252
.664
$253
.288
$255
.749
$254
.324
21 22T
ota
l N
YC
T D
ebt
Ser
vice
$1,4
29.1
60$1
,409
.275
$1,4
80.7
73$1
,539
.266
$1,6
30.3
75$1
,713
.819
23 24C
om
mu
ter
Rai
lro
ads:
25Bu
dget
ed G
ross
Deb
t Ser
vice
for E
xist
ing
Tran
spor
tatio
n R
even
ue B
onds
$514
.580
$497
.139
$517
.319
$509
.226
$517
.474
$522
.697
26D
ebt S
ervi
ce o
n Ad
ditio
nal T
rans
porta
tion
Rev
enue
Bon
ds S
uppo
rting
App
rove
d C
apita
l Pro
gram
s0.
000
5.61
339
.896
95.1
9714
5.80
419
1.59
127
Tran
spor
tatio
n R
esol
utio
n C
omm
erci
al P
aper
0.36
37.
811
13.2
5213
.252
13.2
5213
.252
28Bu
dget
ed G
ross
Deb
t Ser
vice
for E
xist
ing
Ded
icat
ed T
ax F
und
Bond
s68
.550
67.1
9966
.007
66.5
0366
.719
66.4
5129
Deb
t Ser
vice
on
Addi
tiona
l Ded
icat
ed T
ax F
und
Bond
s Su
ppor
ting
Appr
oved
Cap
ital P
rogr
ams
0.00
00.
000
0.00
00.
000
0.00
00.
000
30S
ub-T
otal
MT
A P
aid
Deb
t S
ervi
ce$5
83.4
93$5
77.7
61$6
36.4
73$6
84.1
78$7
43.2
49$7
93.9
9131 32
Budg
eted
Gro
ss D
ebt S
ervi
ce fo
r Exi
stin
g TB
TA (B
&T) G
ener
al R
even
ue B
onds
$87.
461
$84.
845
$84.
627
$84.
630
$85.
088
$84.
632
33Bu
dget
ed G
ross
Deb
t Ser
vice
for E
xist
ing
TBTA
(B&T
) Sub
ordi
nate
Rev
enue
Bon
ds34
.322
27.6
8131
.907
32.1
7832
.831
32.6
3234
Sub
-Tot
al B
&T
Pai
d D
ebt
Ser
vice
$121
.783
$112
.526
$116
.534
$116
.808
$117
.919
$117
.264
35 36T
ota
l C
RR
Deb
t S
ervi
ce$7
05.2
76$6
90.2
87$7
53.0
08$8
00.9
86$8
61.1
68$9
11.2
5437 38
Bri
dg
es a
nd
Tu
nn
els:
39Bu
dget
ed G
ross
Deb
t Ser
vice
for E
xist
ing
TBTA
(B&T
) Gen
eral
Rev
enue
Bon
ds$1
85.8
76$2
17.8
62$2
34.4
71$2
34.4
78$2
35.7
48$2
34.4
8340
Budg
eted
Gro
ss D
ebt S
ervi
ce fo
r Exi
stin
g TB
TA (B
&T) S
ubor
dina
te R
even
ue B
onds
30.8
5824
.887
28.6
8728
.931
29.5
1829
.339
41D
ebt S
ervi
ce o
n Ad
ditio
nal T
BTA
(B&T
) Gen
eral
Rev
enue
Bon
ds S
uppo
rting
App
rove
d C
apita
l Pro
gram
s0.
000
0.00
02.
526
13.6
9134
.027
55.8
3842
2 Br
oadw
ay C
ertif
icat
es o
f Par
ticip
atio
n - T
BTA
Leas
e Po
rtion
1.76
42.
506
2.60
42.
450
2.78
92.
908
432
Broa
dway
Cer
tific
ates
of P
artic
ipat
ion
- Add
ition
al T
BTA
Shar
e of
MTA
Lea
se P
ortio
n0.
000
0.00
00.
192
0.18
10.
206
0.21
543 44
To
tal
B&
T D
ebt
Ser
vice
$218
.499
$245
.255
$268
.481
$279
.731
$302
.288
$322
.782
45 46M
TA
Bu
s:
47Bu
dget
ed G
ross
Deb
t Ser
vice
for E
xist
ing
Tran
spor
tatio
n R
even
ue B
onds
$32.
790
$24.
193
$20.
992
$20.
663
$20.
998
$21.
210
48D
ebt S
ervi
ce o
n Ad
ditio
nal T
rans
porta
tion
Rev
enue
Bon
ds S
uppo
rting
App
rove
d C
apita
l Pro
gram
s0.
000
0.00
00.
046
0.19
30.
295
0.29
549
Tran
spor
tatio
n R
esol
utio
n C
omm
erci
al P
aper
0.15
00.
152
0.25
70.
257
0.25
70.
257
50 51T
ota
l M
TA
Bu
s D
ebt
Ser
vice
$32.
940
$24.
345
$21.
294
$21.
113
$21.
550
$21.
762
52 53S
tate
n I
slan
d R
ailw
ay (
SIR
TO
A):
54Bu
dget
ed G
ross
Deb
t Ser
vice
for E
xist
ing
Tran
spor
tatio
n R
even
ue B
onds
$0.0
00$0
.110
$0.1
81$0
.178
$0.1
81$0
.183
55D
ebt S
ervi
ce o
n Ad
ditio
nal T
rans
porta
tion
Rev
enue
Bon
ds S
uppo
rting
App
rove
d C
apita
l Pro
gram
s0.
000
0.00
00.
017
0.10
80.
312
0.58
456
Tran
spor
tatio
n R
esol
utio
n C
omm
erci
al P
aper
0.00
00.
000
0.00
00.
000
0.00
00.
000
57 58T
ota
l S
IRT
OA
Deb
t S
ervi
ce$0
.000
$0.1
10$0
.198
$0.2
87$0
.493
$0.7
68
59 60T
ota
l M
TA
HQ
Deb
t S
ervi
ce f
or
2 B
road
way
Cer
tifi
cate
s o
f P
arti
cip
atio
n$1
.712
$2.4
31$2
.713
$2.5
52$2
.906
$3.0
29
FO
RE
CA
ST
ME
TR
OP
OL
ITA
N T
RA
NS
PO
RT
AT
ION
AU
TH
OR
ITY
Ju
ly F
ina
nc
ial P
lan
20
15
-20
18
Su
mm
ary
of
To
tal
Bu
dg
ete
d D
eb
t S
erv
ice
($ in
milli
ons)
II-73

Line
AC
TU
AL
Num
ber
20
13
20
14
20
15
20
16
20
17
20
18
FO
RE
CA
ST
ME
TR
OP
OL
ITA
N T
RA
NS
PO
RT
AT
ION
AU
TH
OR
ITY
Ju
ly F
ina
nc
ial P
lan
20
15
-20
18
Su
mm
ary
of
To
tal
Bu
dg
ete
d D
eb
t S
erv
ice
($ in
milli
ons)
61M
TA
To
tal:
62 63Bu
dget
ed G
ross
Deb
t Ser
vice
for E
xist
ing
Tran
spor
tatio
n R
even
ue B
onds
$1,3
74.1
75$1
,338
.743
$1,3
71.7
79$1
,350
.319
$1,3
72.1
91$1
,386
.041
64Bu
dget
ed G
ross
Deb
t Ser
vice
for E
xist
ing
Ded
icat
ed T
ax F
und
Bond
s38
6.61
038
4.42
538
1.92
338
4.79
638
6.04
238
4.49
365
Budg
eted
Gro
ss D
ebt S
ervi
ce fo
r Exi
stin
g TB
TA (B
&T) G
ener
al R
even
ue B
onds
466.
371
483.
213
499.
141
499.
156
501.
860
499.
166
66Bu
dget
ed G
ross
Deb
t Ser
vice
for E
xist
ing
TBTA
(B&T
) Sub
ordi
nate
Rev
enue
Bon
ds14
3.29
911
5.57
013
3.21
613
4.34
913
7.07
413
6.24
367
2 Br
oadw
ay C
ertif
icat
es o
f Par
ticip
atio
n15
.953
22.6
5925
.285
23.7
8527
.081
28.2
3268
Tran
spor
tatio
n R
esol
utio
n C
omm
erci
al P
aper
1.17
920
.042
34.0
0034
.000
34.0
0034
.000
69D
ebt S
ervi
ce o
n Ad
ditio
nal T
rans
porta
tion
Rev
enue
Bon
ds S
uppo
rting
App
rove
d C
apita
l Pro
gram
s0.
000
7.05
269
.693
177.
580
284.
267
399.
636
70D
ebt S
ervi
ce o
n Ad
ditio
nal D
edic
ated
Tax
Fun
d Bo
nds
Supp
ortin
g Ap
prov
ed C
apita
l Pro
gram
s0.
000
0.00
08.
904
26.2
5842
.237
49.7
6571
Deb
t Ser
vice
on
Addi
tiona
l TBT
A (B
&T) G
ener
al R
even
ue B
onds
Sup
porti
ng A
ppro
ved
Cap
ital P
rogr
ams
0.00
00.
000
2.52
613
.691
34.0
2755
.838
72 73T
ota
l D
ebt
Ser
vice
$2,3
87.5
88$2
,371
.704
$2,5
26.4
67$2
,643
.936
$2,8
18.7
80$2
,973
.414
74 75M
TA
In
vest
men
t In
com
e b
y R
eso
luti
on
76 77In
vest
men
t Inc
ome
from
Tra
nspo
rtatio
n D
ebt S
ervi
ce F
und
$0.0
00$0
.000
($1.
297)
($4.
851)
($8.
324)
($8.
973)
78In
vest
men
t Inc
ome
from
Ded
icat
ed T
ax F
und
Deb
t Ser
vice
Fun
d0.
000
0.00
0(0
.352
)(1
.305
)(2
.152
)(2
.182
)79
Inve
stm
ent I
ncom
e fro
m T
BTA
(B&T
) Gen
eral
Rev
enue
Deb
t Ser
vice
Fun
d0.
000
0.00
0(0
.452
)(1
.628
)(2
.693
)(2
.789
)80
Inve
stm
ent I
ncom
e fro
m T
BTA
(B&T
) Sub
ordi
nate
Rev
enue
Deb
t Ser
vice
Fun
d0.
000
0.00
0(0
.120
)(0
.427
)(0
.689
)(0
.685
)81
Inve
stm
ent I
ncom
e fro
m 2
Bro
adw
ay C
ertif
icat
es o
f Par
ticip
atio
n D
ebt S
ervi
ce F
und
0.00
00.
000
(0.0
23)
(0.0
76)
(0.1
36)
(0.1
42)
82 83T
ota
l M
TA
In
vest
men
t In
com
e$0
.000
$0.0
00($
2.24
3)($
8.28
7)($
13.9
94)
($14
.771
)84 85
MT
A N
et T
ota
l86 87
Net
Tra
nspo
rtatio
n R
even
ue B
onds
Deb
t Ser
vice
$1,3
74.1
75$1
,345
.795
$1,4
40.1
75$1
,523
.048
$1,6
48.1
34$1
,776
.704
88Tr
ansp
orta
tion
Res
olut
ion
Com
mer
cial
Pap
er1.
179
20.0
4234
.000
34.0
0034
.000
34.0
0089
Net
Ded
icat
ed T
ax F
und
Bond
s D
ebt S
ervi
ce38
6.61
038
4.42
539
0.47
540
9.74
942
6.12
843
2.07
690
Net
TBT
A (B
&T) G
ener
al R
even
ue B
onds
Deb
t Ser
vice
466.
371
483.
213
501.
216
511.
219
533.
194
552.
215
91N
et T
BTA
(B&T
) Sub
ordi
nate
Rev
enue
Bon
ds D
ebt S
ervi
ce14
3.29
911
5.57
013
3.09
613
3.92
213
6.38
513
5.55
892
Net
2 B
road
way
Cer
tific
ates
of P
artic
ipat
ion
Deb
t Ser
vice
15.9
5322
.659
25.2
6223
.710
26.9
4528
.090
93BA
B Su
bsid
y Tr
ansp
orta
tion
Rev
enue
Bon
ds(5
4.03
6)(5
4.47
7)(5
4.47
7)(5
4.47
7)(5
4.33
0)(5
4.16
7)94
BAB
Subs
idy
Ded
icat
ed T
ax F
und
Bond
s(2
5.97
2)(2
6.32
6)(2
6.32
6)(2
6.32
6)(2
6.32
6)(2
6.32
6)95
BAB
Subs
idy
TBTA
Gen
eral
Rev
enue
Bon
ds(8
.318
)(8
.422
)(8
.411
)(8
.411
)(8
.411
)(8
.411
)96 97
To
tal
MT
A N
et D
ebt
Ser
vice
$2
,299
.262
$2,2
82.4
79$2
,435
.010
$2,5
46.4
35$2
,715
.720
$2,8
69.7
3998 99
Sand
y Pr
ogra
m -
Tran
sit
0.00
00.
446
4.20
814
.358
28.0
5037
.466
100
Sand
y Pr
ogra
m -
Com
mut
er0.
000
0.04
70.
438
1.49
32.
916
3.89
510
1Sa
ndy
Prog
ram
- M
TA B
us0.
000
0.00
50.
043
0.14
60.
286
0.38
210
2Sa
ndy
Prog
ram
- SI
RTO
A0.
000
0.01
70.
158
0.54
01.
054
1.40
810
3Sa
ndy
Prog
ram
- TB
TA B
onds
0.00
00.
000
0.00
00.
000
0.00
06.
030
104
Sand
y Pr
ogra
m -
TBTA
BAN
s0.
000
5.00
05.
000
5.00
05.
000
2.50
010
510
6M
TA
Wid
e D
ebt
Ser
vice
Ass
oci
ated
wit
h S
and
y R
epai
r an
d M
itig
atio
n C
apit
al P
rog
ram
s$0
.000
$5.5
14$9
.848
$21.
537
$37.
307
$51.
681
107
108
To
tal
MT
A W
ide
Deb
t S
ervi
ce i
ncl
ud
ing
San
dy
Pro
gra
ms
$2,2
99.2
62$2
,287
.993
$2,4
44.8
58$2
,567
.973
$2,7
53.0
26$2
,921
.420
II-74

[THIS PAGE INTENTIONALLY LEFT BLANK]
II-75

[THIS PAGE INTENTIONALLY LEFT BLANK]
II-76

Debt Service Affordability Statement

[THIS PAGE INTENTIONALLY LEFT BLANK]
II-77

ME
TR
OP
OL
ITA
N T
RA
NS
PO
RT
AT
ION
AU
TH
OR
ITY
Deb
t A
ffo
rdab
ility
Sta
tem
ent
(1)
$ in
mill
ions
Fo
rec
as
ted
De
bt
Se
rvic
e a
nd
Bo
rro
win
g S
ch
ed
ule
No
tes
20
13
AC
TL
20
14
2
01
5
20
16
2
01
7
20
18
Com
bine
d M
TA/T
BTA
For
ecas
ted
Deb
t Ser
vice
Sch
edul
e1,
2, 3
$2,2
83.3
$2,2
60.3
$2,4
14.6
$2,5
39.3
$2,7
21.1
$2,8
84.8
Fore
cast
ed N
ew M
oney
Bon
ds Is
sued
42,
500.
0
1,
408.
6
2,
177.
2
2,
329.
5
2,
422.
9
2,
360.
4
Fo
rec
as
ted
De
bt
Se
rvic
e b
y C
red
it 9
No
tes
20
13
AC
TL
20
14
2
01
5
20
16
2
01
7
20
18
Tran
spor
tatio
n R
even
ue B
onds
P
ledg
ed R
even
ues
5$1
1,74
8.2
$12,
278.
4$1
2,27
5.0
$12,
506.
1$1
2,71
9.9
$12,
931.
9
Deb
t Ser
vice
1,32
1.3
1,31
1.9
1,42
4.4
1,51
8.6
1,65
9.1
1,79
8.3
D
ebt S
ervi
ce a
s a
% o
f Ple
dged
Rev
enue
s11
%11
%12
%12
%13
%14
%
Ded
icat
ed T
ax F
und
Bon
ds
Ple
dged
Rev
enue
s6
$586
.4$6
19.0
$605
.1$6
01.5
$600
.9$6
02.0
D
ebt S
ervi
ce36
0.6
35
8.1
36
4.1
38
3.4
39
9.8
40
5.7
Deb
t Ser
vice
as
a %
of P
ledg
ed R
even
ues
61%
58%
60%
64%
67%
67%
Trib
orou
gh B
ridge
and
Tun
nel A
utho
rity
Gen
eral
Rev
enue
Bon
ds
Ple
dged
Rev
enue
s 7
$1,2
11.7
$1,1
45.1
$1,1
37.6
$1,1
32.4
$1,1
22.6
$1,1
11.5
D
ebt S
ervi
ce45
8.1
47
4.8
49
3.0
50
3.3
52
5.8
54
5.2
Deb
t Ser
vice
as
a %
of T
otal
Ple
dged
Rev
enue
s38
%41
%43
%44
%47
%49
%
Trib
orou
gh B
ridge
and
Tun
nel A
utho
rity
Sub
ordi
nate
Rev
enue
Bon
ds
Ple
dged
Rev
enue
s8
$753
.6$6
70.3
$644
.6$6
29.1
$596
.8$5
66.3
D
ebt S
ervi
ce14
3.3
11
5.6
13
3.1
13
3.9
13
6.4
13
5.6
Deb
t Ser
vice
as
a %
of T
otal
Ple
dged
Rev
enue
s19
%17
%21
%21
%23
%24
%
Cu
mu
lati
ve D
eb
t S
erv
ice
(E
xc
lud
ing
Sta
te S
erv
ice
Co
ntr
ac
t B
on
ds
)N
ote
s2
01
3 A
CT
L
2
01
4
20
15
2
01
6
20
17
2
01
8
Tota
l Deb
t Ser
vice
1, 2
, 3$2
,283
.3$2
,260
.3$2
,414
.6$2
,539
.3$2
,721
.1$2
,884
.8
Fare
and
Tol
l Rev
enue
s$7
,152
.6$7
,313
.6$7
,380
.1$7
,471
.7$7
,528
.5$7
,582
.9To
tal D
ebt S
ervi
ce a
s a
% o
f Far
e an
d To
ll R
even
ue32
%31
%33
%34
%36
%38
%
Ope
ratin
g R
even
ues
(incl
udin
g Fa
re a
nd T
oll R
even
ues)
and
Sub
sidi
es$1
3,80
3.9
$14,
208.
8$1
4,28
8.6
$14,
637.
3$1
4,90
2.5
$15,
179.
5To
tal D
ebt S
ervi
ce a
s a
% o
f Ope
ratin
g R
even
ues
and
Sub
sidi
es17
%16
%17
%17
%18
%19
%
Non
-Rei
mbu
rsab
le E
xpen
ses
with
Non
-Cas
h Li
abilit
ies
$14,
961.
5$1
5,88
3.0
$16,
192.
8$1
6,66
6.3
$17,
356.
1$1
7,91
9.2
Tota
l Deb
t Ser
vice
as
% o
f Non
-reim
burs
able
Exp
ense
s15
%14
%15
%15
%16
%16
%
Not
es o
n th
e fo
llow
ing
page
are
inte
gral
to th
is ta
ble.
Ju
ly F
ina
nc
ial
Pla
n 2
01
5-2
01
8
II-78

No
tes
1 2S
ynth
etic
fix
ed-r
ate
debt
ass
umed
at
swap
rat
e.
3 4 5 6 7 8 9D
ebt
serv
ice
sche
dule
s fo
r ea
ch c
redi
t ar
e at
tach
ed a
s ad
dend
um h
eret
o.
Sp
ecia
l No
tes
(1)
Rev
enue
and
exp
ense
num
bers
do
not
incl
ude
the
impa
ct o
f th
ose
item
s lis
ted
as p
art
of t
he b
elow
-the
-lin
e ad
just
men
ts o
n th
e fin
anci
al s
ched
ules
.
Tot
al d
ebt
serv
ice
excl
udes
CO
PS
leas
e pa
ymen
ts.
All
debt
ser
vice
num
bers
red
uced
by
expe
cted
inve
stm
ent
inco
me
and
Bui
ld A
mer
ica
Bon
ds (
BA
B)
subs
idy.
New
mon
ey b
onds
am
ortiz
ed a
s 30
-yea
r le
vel d
ebt.
N
ew d
ebt
issu
ed a
ssum
ed 9
0% f
ixed
-rat
e an
d 10
% v
aria
ble
rate
. A
ctua
l 201
4 is
suan
ce t
hrou
gh M
ay 3
1, 2
014
is in
clud
ed w
ith t
he f
orec
ast
and
is
refle
ctiv
e of
new
mon
ey b
onds
and
not
es.
Tra
nspo
rtat
ion
Rev
enue
Bon
ds p
ledg
ed r
even
ues
cons
ist
gene
rally
of
the
follo
win
g: f
ares
and
oth
er m
isce
llane
ous
reve
nues
fro
m t
he t
rans
it an
d co
mm
uter
sys
tem
s, in
clud
ing
adve
rtis
ing,
ren
tal i
ncom
e an
d ce
rtai
n co
nces
sion
rev
enue
s (n
ot in
clud
ing
Gra
nd C
entr
al a
nd P
enn
Sta
tion)
; re
venu
es f
rom
the
dis
trib
utio
n to
the
tra
nsit
and
com
mut
er s
yste
m o
f T
BT
A s
urpl
us;
Sta
te a
nd lo
cal g
ener
al o
pera
ting
subs
idie
s,
incl
udin
g th
e ne
w S
tate
tax
es a
nd f
ees;
spe
cial
tax
-sup
port
ed o
pera
ting
subs
idie
s af
ter
the
paym
ent
of d
ebt
serv
ice
on t
he M
TA
Ded
icat
ed T
ax F
und
Bon
ds;
New
Yor
k C
ity u
rban
tax
for
tra
nsit;
sta
tion
mai
nten
ance
and
ser
vice
rei
mbu
rsem
ents
; an
d re
venu
es f
rom
the
inve
stm
ent
of c
apita
l pro
gram
fun
ds.
Ple
dged
rev
enue
s se
cure
Tra
nspo
rtat
ion
Rev
enue
Bon
ds b
efor
e th
e pa
ymen
t of
ope
ratin
g an
d m
aint
enan
ce e
xpen
ses.
Sta
rtin
g in
200
6, r
even
ues,
exp
ense
s an
d de
bt s
ervi
ce f
or M
TA
Bus
hav
e al
so b
een
incl
uded
.
Ded
icat
ed T
ax F
und
pled
ged
reve
nues
as
show
n ab
ove
cons
ist
gene
rally
of
the
follo
win
g: p
etro
leum
bus
ines
s ta
x, m
otor
fue
l tax
and
mot
or v
ehic
le f
ees
depo
site
d in
to t
he D
edic
ated
Mas
s T
rans
port
atio
n T
rust
Fun
d fo
r th
e be
nefit
of
the
MT
A;
in a
dditi
on,
whi
le n
ot r
efle
cted
in t
he D
TF
ple
dged
rev
enue
fig
ures
abo
ve,
the
petr
oleu
m b
usin
ess
tax,
dis
tric
t sa
les
tax,
fra
nchi
se t
axes
and
tem
pora
ry f
ranc
hise
su
rcha
rges
dep
osite
d in
to t
he M
etro
polit
an T
rans
port
atio
n O
pera
ting
Ass
ista
nce
Acc
ount
for
the
ben
efit
of t
he M
TA
are
als
o pl
edge
d. A
fter
the
pay
men
t of
deb
t se
rvic
e on
the
MT
A D
edic
ated
Tax
Fun
d B
onds
, th
ese
subs
idie
s ar
e av
aila
ble
to p
ay d
ebt
serv
ice
on t
he M
TA
Tra
nspo
rtat
ion
Rev
enue
Bon
ds,
and
then
any
rem
aini
ng a
mou
nts
are
avai
labl
e to
be
used
to
mee
t op
erat
ing
cost
s of
the
tra
nsit
syst
em,
the
com
mut
er s
yste
m,
and
SIR
TO
A.
Trib
orou
gh B
ridge
and
Tun
nel A
utho
rity
Gen
eral
Rev
enue
Bon
d pl
edge
d re
venu
es c
onsi
st p
rimar
ily o
f th
e to
lls c
harg
ed b
y T
BT
A o
n its
sev
en b
ridge
s an
d tw
o tu
nnel
s.
Ple
dged
rev
enue
s se
cure
TB
TA
G
ener
al R
even
ue B
onds
aft
er t
he p
aym
ent
of T
BT
A o
pera
ting
and
mai
nten
ance
exp
ense
s, in
clud
ing
cert
ain
rese
rves
.
Trib
orou
gh B
ridge
and
Tun
nel A
utho
rity
Sub
ordi
nate
Rev
enue
Bon
ds p
ledg
ed r
even
ues
cons
ist
prim
arily
of
the
tolls
cha
rged
by
TB
TA
on
its s
even
brid
ges
and
two
tunn
els,
aft
er t
he p
aym
ent
of d
ebt
serv
ice
on t
he T
BT
A G
ener
al R
even
ue B
onds
.
Unh
edge
d ta
x-ex
empt
var
iabl
e ra
te d
ebt
refle
cts
actu
al r
ates
thr
ough
May
201
4, a
nd 4
.00%
for
the
rem
aini
ng li
fe o
f bo
nds.
II-79

ME
TR
OP
OL
ITA
N T
RA
NS
PO
RT
AT
ION
AU
TH
OR
ITY
(in
clu
din
g T
rib
oro
ug
h B
rid
ge
and
Tu
nn
el A
uth
ori
ty)
To
tal B
ud
ge
ted
An
nu
al D
eb
t S
erv
ice
All
Issu
ance
to
May
31,
201
4 ($
in m
illi
on
s)
Fis
cal
Yea
rE
xist
ing
DS
Ad
dit
ion
al D
SC
om
bin
edE
xist
ing
DS
Ad
dit
ion
al D
SC
om
bin
edE
xist
ing
DS
Ad
dit
ion
al D
SC
om
bin
edE
xist
ing
DS
Ad
dit
ion
al D
SC
om
bin
edE
xist
ing
DS
Ad
dit
ion
al D
SC
om
bin
ed
2013
1,32
4.3
2.3
1,32
6.6
362.
6
-
36
2.6
45
6.4
0.1
456.
5
142.
9
-
14
2.9
2,
286.
2
2.
4
2,
288.
6
20
141,
304.
3
7.
6
1,
311.
9
35
8.1
-
358.
1
474.
8
-
47
4.8
12
0.6
-
120.
6
2,25
7.8
7.6
2,26
5.3
2015
1,35
1.3
74.5
1,
425.
8
35
5.6
8.9
364.
5
490.
7
2.
5
49
3.3
13
8.2
-
138.
2
2,33
5.8
86.0
2,
421.
8
20
161,
329.
8
19
4.1
1,
524.
0
35
8.5
26.3
38
4.7
49
0.7
13.7
50
4.4
13
9.3
-
139.
3
2,31
8.4
234.
1
2,55
2.5
2017
1,35
1.9
316.
6
1,66
8.4
359.
7
42
.2
402.
0
493.
4
34
.0
527.
5
142.
1
-
14
2.1
2,
347.
1
39
2.8
2,
739.
9
20
181,
365.
9
44
2.8
1,
808.
7
35
8.2
49.8
40
7.9
49
0.8
61.9
55
2.6
13
8.7
-
138.
7
2,35
3.5
554.
4
2,90
8.0
2019
1,36
3.6
524.
6
1,88
8.2
352.
5
49
.8
402.
3
487.
3
85
.9
573.
2
136.
3
-
13
6.3
2,
339.
6
66
0.3
2,
999.
9
20
201,
362.
0
54
3.3
1,
905.
3
35
4.2
49.8
40
3.9
48
7.8
98.7
58
6.5
13
5.9
-
135.
9
2,33
9.8
691.
8
3,03
1.7
2021
1,35
7.6
544.
7
1,90
2.3
351.
5
49
.8
401.
3
484.
9
10
6.3
591.
2
136.
6
-
13
6.6
2,
330.
6
70
0.8
3,
031.
4
20
221,
343.
0
54
5.6
1,
888.
6
34
7.2
49.8
39
6.9
48
8.4
109.
8
59
8.2
13
6.0
-
136.
0
2,31
4.6
705.
2
3,01
9.8
2023
1,36
6.2
545.
9
1,91
2.1
350.
0
49
.8
399.
8
481.
9
11
1.0
592.
9
136.
6
-
13
6.6
2,
334.
7
70
6.7
3,
041.
4
20
241,
355.
7
54
5.9
1,
901.
6
34
9.4
49.8
39
9.2
47
6.9
111.
3
58
8.2
13
6.7
-
136.
7
2,31
8.7
707.
0
3,02
5.7
2025
1,36
0.8
545.
9
1,90
6.7
349.
4
49
.8
399.
2
476.
7
11
1.3
588.
0
136.
6
-
13
6.6
2,
323.
6
70
7.0
3,
030.
6
20
261,
400.
7
54
5.9
1,
946.
6
34
6.7
49.8
39
6.4
47
6.2
111.
3
58
7.6
13
6.9
-
136.
9
2,36
0.4
707.
0
3,06
7.4
2027
1,40
0.5
545.
9
1,94
6.4
339.
6
49
.8
389.
3
479.
6
11
1.3
590.
9
136.
8
-
13
6.8
2,
356.
4
70
7.0
3,
063.
5
20
281,
399.
5
54
5.9
1,
945.
5
34
8.2
49.8
39
7.9
49
1.3
111.
3
60
2.7
13
7.0
-
137.
0
2,37
6.1
707.
0
3,08
3.1
2029
1,39
9.1
545.
9
1,94
5.0
346.
6
49
.8
396.
3
490.
3
11
1.3
601.
7
136.
8
-
13
6.8
2,
372.
8
70
7.0
3,
079.
9
20
301,
398.
9
54
5.9
1,
944.
8
34
5.5
49.8
39
5.3
49
2.5
111.
3
60
3.9
13
6.9
-
136.
9
2,37
3.9
707.
0
3,08
0.9
2031
1,40
8.8
545.
9
1,95
4.7
342.
9
49
.8
392.
6
510.
0
11
1.3
621.
3
130.
0
-
13
0.0
2,
391.
7
70
7.0
3,
098.
7
20
321,
328.
8
54
5.9
1,
874.
7
34
7.1
49.8
39
6.9
43
4.9
111.
3
54
6.3
76
.9
-
76.9
2,
187.
7
70
7.0
2,
894.
7
20
331,
054.
4
54
5.9
1,
600.
4
33
3.8
49.8
38
3.6
23
5.5
111.
3
34
6.8
-
-
-
1,62
3.7
707.
0
2,33
0.7
2034
1,05
5.3
545.
9
1,60
1.2
182.
8
49
.8
232.
6
246.
3
11
1.3
357.
6
-
-
-
1,
484.
3
70
7.0
2,
191.
4
20
351,
028.
8
54
5.9
1,
574.
7
13
1.3
49.8
18
1.0
27
6.2
111.
3
38
7.5
-
-
-
1,43
6.3
707.
0
2,14
3.3
2036
845.
9
545.
9
1,39
1.8
146.
0
49
.8
195.
8
270.
0
11
1.3
381.
3
-
-
-
1,
261.
9
70
7.0
1,
968.
9
20
3781
5.1
54
5.9
1,
361.
0
33
4.1
49.8
38
3.8
27
0.9
111.
3
38
2.3
-
-
-
1,42
0.1
707.
0
2,12
7.1
2038
757.
2
545.
9
1,30
3.1
322.
8
49
.8
372.
5
249.
6
11
1.3
360.
9
-
-
-
1,
329.
6
70
7.0
2,
036.
6
20
3968
9.4
54
5.9
1,
235.
4
27
1.3
49.8
32
1.1
95
.2
111.
3
20
6.6
-
-
-
1,05
6.0
707.
0
1,76
3.0
2040
585.
8
545.
9
1,13
1.7
29.9
49
.8
79.7
52
.4
111.
3
16
3.7
-
-
-
668.
1
707.
0
1,37
5.1
2041
437.
4
545.
9
983.
3
-
49.8
49
.8
32.5
11
1.3
143.
8
-
-
-
46
9.9
70
7.0
1,
176.
9
20
4237
4.6
54
5.9
92
0.5
-
49
.8
49.8
30
.8
111.
3
14
2.1
-
-
-
405.
3
707.
0
1,11
2.4
2043
231.
9
545.
9
777.
8
-
49.8
49
.8
18.3
11
1.3
129.
7
-
-
-
25
0.2
70
7.0
95
7.2
20
4496
.0
538.
4
634.
4
-
49.8
49
.8
13.5
11
1.3
124.
8
-
-
-
10
9.5
69
9.5
80
9.0
20
4554
.8
471.
4
526.
2
-
40.9
40
.9
-
108.
8
10
8.8
-
-
-
54.8
62
1.0
67
5.9
20
4653
.4
351.
8
405.
1
-
23.5
23
.5
-
97.6
97
.6
-
-
-
53
.4
472.
9
526.
3
2047
7.9
229.
3
237.
2
-
7.5
7.5
-
77.3
77
.3
-
-
-
7.
9
31
4.2
32
2.1
No
tes:
Doe
s no
t inc
lude
deb
t ser
vice
for S
tate
Ser
vice
Con
tract
Bon
ds a
nd C
onve
ntio
n C
ente
r Bon
ds, w
hich
is p
aid
by N
Y St
ate.
Als
o ex
clud
es C
OPS
leas
e pa
ymen
ts.
Incl
udes
inte
rest
bud
gete
d fo
r Tra
nspo
rtatio
n R
even
ue B
ond
Antic
ipat
ion
Not
es.
Fore
cast
ed In
vest
men
t Inc
ome
is n
ot in
clud
ed a
bove
.N
et o
f Bui
ld A
mer
ica
Bond
s su
bsid
y.
Ad
den
du
m t
o M
TA
Deb
t A
ffo
rdab
ilit
y S
tate
men
t
MT
A a
nd
TB
TA
Deb
t S
ervi
ceT
ran
spo
rtat
ion
Rev
enu
e R
eso
luti
on
Ded
icat
ed T
ax F
un
d R
eso
luti
on
TB
TA
Gen
eral
Rev
enu
e R
eso
luti
on
TB
TA
Su
bo
rdin
ate
Res
olu
tio
n
II-80

Positions (Headcount)

POSITIONS (Headcount) The information contained in this section presents MTA headcount by Agency, function, occupational group and various other reporting categories. Analy sis of these numbers is provided on both a plan-to -plan and a year-to-year basis. The changes in headcount described below are reflective of the MTA-wide commitment to improve service as well as maintain, expand and integrate the MTA Network. To that end, the July Plan reflects the strategic reallocation of resources with reductions in areas where operations can be made more efficient while also adding positions where more personnel are required. The MTA continues to benefit from headcount reductions taken in 2010 which resulted in a 15% administrative reduction at the Agencies (20% at Headquarters). Also, non-administrative positions that had been added in previous financial plans, primarily for long-term restoration and mitigation projects resulting from Superstorm Sandy, are now being partly offset by position reductions resulting from efficiencies and the delayed startup of East Side Access.
2014 2015 2016 2017
2014 February Plan ‐ Total Baseline Positions 68,538 68,564 68,514 68,869
Total Plan-to-Plan Changes (181) 21 452 575
2014 July Plan ‐ Total Baseline Positions 68,719 68,543 68,062 68,294
Total Year-to-Year Changes, July Plan 176 481 (232)
Total Plan‐to‐Plan Changes by Reporting Category:
Non‐Reimbursable (145) 112 516 577
Reimbursable (36) (91) (64) (2)
Total (181) 21 452 575
Full‐Time (181) 21 452 575
Full‐Time Equivalents 0 0 0 0
Total (181) 21 452 575
By Function Category
‐ Administration 59 (65) (49) (44)
‐ Operations (119) 53 193 210
‐ Maintenance (105) 52 297 354
‐ Engineering/Capital (15) (15) (15) (15)
‐ Public Safety (1) (4) 26 70
Total (181) 21 452 575
By Occupational Group
‐ Managers/Supervisors (177) (221) (146) (122)
‐ Professional, Technical, Clerical (61) (97) (90) (88)
‐ Operational Hourlies 57 338 687 784
Total (181) 21 452 575
Total Plan‐to‐Plan Changes by Major Category:
2013 BRPs 53 154 126 102
New Needs (207) (236) (177) (177)
Change in Reimbursable Positions (36) (91) (64) (2)
Re‐estimates & All Other1
9 194 567 652
Total (181) 21 452 575
METROPOLITAN TRANSPORTATION AUTHORITY
July Financial Plan 2015‐2018Favorable/(Unfavorable)
Total Position Changes at a Glance
II-81

Year-to-Year Position Changes 2015 vs. 2014 Consolidated 2015 baseline pos itions are 68,543, a dec rease of 176 positions from the 2014 level. This is primarily due to:
NYCT - Total positions decrease by 313 po sitions, reflecting a non-reimbursable decrease of 260 positions, and a reimbu rsable decrease of 53 reimbur sable positions. The decrease is due mostly to Subway ’s platform budget - normal budget adjustments, training float adjustments, Scheduled Maint enance Service (SMS), capital project completion, and the inc orporation of new s avings programs.
MTA HQ – Net incr eases of 65 pos itions are mainly due to non-reimbursable increases of 61 positions as part of the MTA IT Tr ansformation initiative to provide desktop support for PCs and laptops at all agencies by in-house staff rather than an off-site/off-shore vendor , five non-reimbursable Public Safety positions resulting from increases for the Moynihan project at Penn Station, partly offset by the elimination of the two-year Excelsior position in Capital Prog ram Management that had been mandated by New York State.
LIRR - Net increas es of 55 positions , reflecting an increas e of 145 non-reimbursable positions and a decrease of 90 reimbursable pos itions caused by the timing of capital program activity whic h results in the shift of 123 Engineering positions to Non-Reimbursable. Adjust ing for this timing shift, the actual reimbursable position increase is due prim arily to the start of Maintenance of Equipment Positive Train Control activities.
MTA Bus – Increases of ten non-reimbursable positions including two positions in support of the Shop Hybrid Program, six positions for Farebox Maintenance, two positions for Real Time bus in formation and MTA corporate-wide Asset Management initiative, six pos itions in support of t he Shop Overhaul Progr am, partly offset by a decrease of six positi ons for the completion of buses shifting from Far Rockaway to JFK Depot.
Positions by Function decreas e between 2014 and 2015 mainly for the following reasons:
Operations decreases by 202 positions, primarily due to timing of NYCT capital activity.
Maintenance decreases of 130 positions attributable to: NYCT capital activity, partly offset by increases at LIRR, also related to timing of capital activity.
Administration increases of 123 positions mainly due to MTAHQ increases of 60 positions attributable to the IT Transfo rmation initiative to p rovide desktop support for PCs and laptops, and NYCT incr eases of 55 due to project support activity.
Engineering increases of 25 positions due to NYCT capital project support requirements.
II-82

2016 - 2018 Total forecasted positions are 68,062 for 2016, a reduction of 481 pos itions from 2015. NYCT’s headcount reduction of 445 positions is mainly due to Subway ’s platform budget – normal budget increases, training f loat adjustments, SMS, and capital project completion. Decreases of 34 positions at SI R reflect reductions in Sandy reimbursable support positions. At the LIRR, staffing levels decrease by 33 positions attributable to changes in project activity. MTA Bus incr eases of 35 non-reim bursable positions are mainly for the Shop Overhaul Program, suppor t of Buses Real Time bus information, MTA Corporate Wide Asset Management Initiative. Total forecasted positions are 68,294 in 2017, an increase of 232 positions from 2016. This is primarily due to NY CT headcount increases of 121 positions attributable t o operating staff requi rements for the 2 nd Avenue Subway. LIRR increases of 102 positions are primarily due to non-reimbursable incr eases of 164 pos itions, mainly related to East Side Access readiness efforts, partially offset by reimbursable decreases of 62 due to changes in project activity. In 2018, total forecasted positions of 68,362 ar e an increase of 68 positions from 2017. Positions increase at LIRR by 128 primarily related to East Side Access readiness efforts. MTAHQ increases by 30 non-reim bursable positions due to revised MTAPD hiring plans for East Side Access in anticipation of its projected opening in 2021. Decreases of 48 non-reimbursable positions at MTA Bus are primarily due to changes in the Shop Overhaul Program, and NYCT decreases of 45 pos itions are mainly due t o changes in the Subways SMS program are partial offsets. July Plan vs. February Plan Position Changes 2014 Headcount of 68,719 positions r eflects an increase of 181 positions from the Februar y Plan, primarily due to:
NYCT - increases by 136 positions comprised of 164 non-reimbursable positions, partly offset by a reducti on of 28 reimbursable pos itions. New Needs increases of 176 positions include 56 positions fo r Bus Maintenance – Overage Fleet, 44 positions for Station Cleaning, 31 pos itions for RTO – Lengthened Training Periods, and 35 positions for Track Construction Maintenance. BRPs of 47 positions are an offset and include 28 pos itions resulting from Car Equipment Facility Cleaning efficiencies, and 17 Revenue Collection position efficiencies.
II-83

LIRR - increases by 17 positions, reflecting an incr ease of 85 reimbursable positions and a decrease of 68 non-reimbursable positions as a result of the timing of capital project activity.
MTA HQ - Headquarters increases by 15 position s, mainly for 13 administrative non-reimbursable positions and two reim bursable positions related to t he oversight of pension activities.
2015 Headcount of 68,543 positions reflects a decrease of 21 pos itions from the February Plan, mainly the result of:
LIRR - decreases by 131 positions, wh ich include 173 n on-reimbursable positions, primarily from the revis ed East Side Acc ess Startup Plan (2 29 positions), partially offset by additional pos itions for fa re protection initiativ es, additional train engineers to offset ov ertime, Customer Service Ambassador s, On-Board Ticket Issuing Machine rollout and additional positions needed due to the extended M3 retirement date. The net increase of 42 reimbursable positions is mainly driven by the Maintenance of Equipment Positive Train Control initiative.
MTA Bus - decreas es of 62 positions prim arily reflects changes in the Shop Overhaul Program of 76 positions partly offset by an increase of 11 pos itions for Overage Fleet Maintenance.
NYCT - increases of 96 positions are co mprised of 70 reimbursable positions and 26 non-reimbursable pos itions. New Needs increases of 132 positions include 48 positions for Bus Maint enance – Overage Fleet, 44 positions for Station Cleaning, 25 positions for Tr ack Construction Maintenance, and 15 positions for RTO - Lengthened Training Periods. Reimbursable and Re-estimate positions increase by 44 positions mainly due to Subway c apital program support. BRPs of 80 positions are an o ffset and include: Car Equipment Facility Cleaning eff iciencies (28 positions), Subways availability improvement for video trai ning at home (23 positions ), and Revenue Collection efficiencies (17 positions).
MTA HQ - increases of 76 positions ar e comprised of 74 non-reimbu rsable positions including 63 positions as part of the MTA IT Transformation initiative to provide desktop support for PCs and laptops at all the agencies by in-house staff rather than off-site/off-shore vendors, 11 administ rative positions, and two reimbursable positions related to the oversight of pension activities.
2016 and 2017 Headcount decreases to 68,062 positions in 2016, and 68,294 positions in 2017, reflecting decreases of 452 and 575 positions, respectively, from the February Plan. These unfavorable variances are mainly due to:
LIRR - decreases of 442 and 548 pos itions in 2016 and 2017, respectively, are mainly due to non-reimbursable reductions of 489 positions in 2016, and 54 2 in 2017, primarily due to the re vised East Side Access startup plan. Reimbursable
II-84

positions increase by 47 in 2016 and decrease by 5 in 2017 due to changes in project activity levels.
MTA Bus - decreases of 42 positions in 2 016 primarily reflects changes in the Shop Overhaul Program.
NYCT - decreases by 11 positions an d 20 positions in 2016 and 2017, respectively. These decreases are primarily due to BRPs of 80 positions in each year including efficiencies for Car Equi pment Facility Cleaning (28 positio ns), Revenue Collection (17 pos itions), and Subway ’s availability improvement for video training at home (23 positions). Reimbursable and re-estimated positions also decrease by 15 positions in 2016 and 24 positions in 2017. New Needs increases of 84 positions in each year including 44 positions for Station Cleaning, 25 positions for Track Construction Ma intenance, and 15 positions for RTO – Lengthened training Periods, were an offset.
MNR - decreases of 8 positions and 17 pos itions in 2016 and 2017, respectively, include 11 and 20 non-reimbur sable reductions in eac h year, partly offset by 3 reimbursable position increases.
MTA HQ - increases of 46 pos itions in 2016 and 2 positions in 2017 are due to increases of 77 administrative positions in each year including 63 positions as part of the MTA IT T ransformation initiative to provide desktop s upport for PCs and laptops at all the agencies by in-house staff rather than o ff-site/off-shore vendors, partly offset by the reduction of 31 and 75 Public Sa fety positions in 2016 and 2017, respectively, due to revised hiring plans for East Side Access in anticipation of its delayed projected opening.
New Needs Programmatic changes referred to earlier and explained further in Agenc y sections address MTA’s need to carry out critic al system maintenance work, and either commence or continu e programmatic effort s that will improve e quipment, safety and reliability of service. These New Needs result in increases of 207 positions in 2014, 236 positions in 2015, and 177 positions in 2016 and 2017. Major N ew Needs are listed in the following table:
II-85

2014 2015 2016 2017
NYCT
‐ Bus Maintenance ‐ Overage Fleet (56) (46) 0 0
‐ RTO ‐ Lengthened Training Periods (31) (15) (15) (15)
‐ Station Cleaning (44) (44) (44) (44)
‐ Track Construction Maintenance (35) (25) (25) (25)
‐ Other (10) (2) 0 0
Total NYCT (176) (132) (84) (84)
MNR
‐ Chief Engineer for MofW (1) (1) (1) (1)
‐ Other 0 (4) (4) (4)
Total MNR (1) (5) (5) (5)
B&T
‐ All‐Electronic Tolling (AET) program (3) (3) (3) (3)
‐ Procurement position for expanded M/WOBE program (1) (1) (1) (1)
‐ Legal position for toll matters, projects and initiatives (1) (1) (1) (1)
Total B&T (5) (5) (5) (5)
Headquarters
‐ Office Services for 2 B'way Mailroom (2) (2) (2) (2)
‐ General Counsel for Procurement (2) (2) (2) (2)
‐ EAM for Asset Oversight (2) (2) (2) (2)
‐ IT Transformation Initiative (2) (63) (63) (63)
‐ CPM for 5‐Year Capital marketing (2) (2) (2) (2)
‐ BSC for ELM support (1) (1) (1) (1)
‐ HR for Workforce Development (1) (1) (1) (1)
‐ Real Estate for West Side Yards project support (1) (1) (1) (1)
Total Headquarters (13) (74) (74) (74)
MTA Bus Co
‐ MWDBE Program (1) (1) (1) (1)
‐ Overage Fleet Maintenance (11) (11) 0 0
‐ Real Time Bus Inform. & Asset Management Inititatives 0 (2) (2) (2)
‐ Farebox Maintenance 0 6 6 0
Total MTA Bus Co (12) (20) (9) (9)
Total New Needs (207) (236) (177) (177)
METROPOLITAN TRANSPORTATION AUTHORITY
July Financial Plan 2014‐2017
Favorable/(Unfavorable)
Position Impacts of New Needs
II-86

Changes in Reimbursable Positions Reimbursable increases occur mainly as a resu lt of LIRR capital project activity an d Subways capital program suppo rt. Reimbursable changes result in increases of 36 positions in 2014, 91 positions in 2015, 64 positions in 2016 and two positions in 2017. Major Reimbursable positions are listed in the following table:
2014 2015 2016 2016
NYCT
‐ Subways Capital Program Support 0 (70) 0 0
‐ Other 28 0 (38) (28)
Total NYCT 28 (70) (38) (28)
LIRR
‐ Maint. of Equip. Positive Train Control 0 (42) (47) 0
‐ Capital Project Activity (85) 0 0 5
Total LIRR (85) (42) (47) 5
MNR
‐ Manager in MofW for CT construction (1) (1) (1) (1)
‐ Engineering and Design for GCT (2) (2) (2) (2)
Total MNR (3) (3) (3) (3)
HQ
‐ Pension position transferred from LIRR (1) (1) (1) (1)
‐ Chief Investment Officer for retirement assets (1) (1) (1) (1)
Total HQ (2) (2) (2) (2)
MTA Bus
‐ Transfer to Salvage and Scrap 26 26 26 26
Total Reimbursable (36) (91) (64) (2)
Position Impacts of Reimbursable
METROPOLITAN TRANSPORTATION AUTHORITY
July Financial Plan 2014‐2017
Favorable/(Unfavorable)
Re-Estimates & All Other Combined, agencies show a net decrease of 9 positions in 2014, 194 in 20 15, 567 in 2016, and 652 in 2017, resulti ng from their re-estimates and other changes. The revised East Side Access start up plan is the major driver of the change, as captured in the table below, with more information contained in Agency sections:
II-87

2014 2015 2016 2017
NYCT
‐ Other (35) 26 53 52
Total NYCT (35) 26 53 52
LIRR
‐ Capital Project Activity 68 0 0 0
‐ Revised East Side Access startup plan 0 229 545 598
‐ Other additions 0 (56) (56) (56)
Total LIRR 68 173 489 543
MNR
‐ Other 2 2 5 14
Total MNR 2 2 5 14
HQ
‐ Revised MTAPD hiring Plan for East Side Access ‐ ‐ 30 74
MTA Bus
‐ Transfer from Salvage & Scrap (26) (26) (26) (26)
‐ Other ‐ 19 16 (5)
Total MTA Bus (26) (7) (10) (31)
Total Re‐Estimates 9 194 567 652
METROPOLITAN TRANSPORTATION AUTHORITY
July Financial Plan 2014‐2017
Favorable/(Unfavorable)
Position Impacts of Re‐Estimates
II-88

Category
2013
Actual1
2014 Mid-Year Forecast
2015 Preliminary
Budget 2016 2017 2018
Baseline Total Positions 66,361 68,719 68,543 68,062 68,294 68,362 NYC Transit 46,412 47,447 47,134 46,689 46,810 46,765 Long Island Rail Road 6,727 7,001 7,056 7,023 7,125 7,253 Metro-North Railroad 6,099 6,585 6,592 6,588 6,586 6,589 Bridges & Tunnels 1,554 1,751 1,751 1,751 1,751 1,751 Headquarters 1,603 1,780 1,845 1,845 1,845 1,875 Staten Island Railway 267 305 305 271 271 271 Capital Construction Company 123 140 140 140 140 140 Bus Company 3,576 3,710 3,720 3,755 3,766 3,718
Non-Reimbursable 61,245 62,139 62,105 61,961 62,394 62,487 NYC Transit 42,459 42,730 42,470 42,303 42,563 42,535 Long Island Rail Road 6,136 6,122 6,267 6,269 6,433 6,568 Metro-North Railroad 5,842 5,967 5,974 5,960 5,958 5,961 Bridges & Tunnels 1,466 1,663 1,663 1,663 1,663 1,663 Headquarters 1,563 1,717 1,782 1,782 1,782 1,812 Staten Island Railway 259 268 268 268 268 268 Capital Construction Company - - - - - - Bus Company 3,520 3,672 3,682 3,717 3,728 3,680
Reimbursable 5,116 6,580 6,438 6,101 5,900 5,875 NYC Transit 3,953 4,717 4,664 4,386 4,247 4,230 Long Island Rail Road 591 879 789 754 693 685 Metro-North Railroad 257 618 618 628 628 628 Bridges & Tunnels 88 88 88 88 88 88 Headquarters 40 63 63 63 63 63 Staten Island Railway 8 37 37 3 3 3 Capital Construction Company 123 140 140 140 140 140 Bus Company 56 38 38 38 38 38
Total Full-Time 66,096 68,545 68,384 67,903 68,135 68,203 NYC Transit 46,165 47,289 46,991 46,546 46,667 46,622 Long Island Rail Road 6,727 7,001 7,056 7,023 7,125 7,253 Metro-North Railroad 6,098 6,584 6,591 6,587 6,585 6,588 Bridges & Tunnels 1,554 1,751 1,751 1,751 1,751 1,751 Headquarters 1,603 1,780 1,845 1,845 1,845 1,875 Staten Island Railway 267 305 305 271 271 271 Capital Construction Company 123 140 140 140 140 140 Bus Company 3,559 3,695 3,705 3,740 3,751 3,703
Total Full-Time-Equivalents 265 174 159 159 159 159 NYC Transit 247 158 143 143 143 143 Long Island Rail Road - - - - - - Metro-North Railroad 1 1 1 1 1 1 Bridges & Tunnels - - - - - - Headquarters - - - - - - Staten Island Railway - - - - - - Capital Construction Company - - - - - - Bus Company 17 15 15 15 15 15
12013 Actuals represent paid positions and are net of vacancies. For 2014 and beyond, the table captures authorized positions.1 2009 Actuals for NYCT are as per the MTA 2009 Year-end report and have not been re-cast to reflect the subsequent Subways
reorganization.
METROPOLITAN TRANSPORTATION AUTHORITYJuly Financial Plan 2015-2018
Baseline Total Non-Reimbursable - Reimbursable PositionsFull-Time Positions and Full Time Equivalents by Agency
II-89

Function
2013
Actual1
2014 Mid-Year Forecast
2015 Preliminary
Budget 2016 2017 2018Administration 3,969 4,327 4,450 4,433 4,442 4,446 NYC Transit 1,799 1,804 1,859 1,846 1,846 1,846 Long Island Rail Road 608 658 660 660 665 675 Metro-North Railroad 500 611 612 612 612 612 Bridges & Tunnels 55 92 92 92 92 92 Headquarters 849 981 1,041 1,041 1,041 1,041 Staten Island Railway 27 25 25 25 25 25 Capital Construction Company 16 18 18 18 18 18 Bus Company 115 138 143 139 143 137
Operations 29,697 30,009 29,807 29,732 29,907 29,998 NYC Transit 22,219 22,552 22,339 22,280 22,301 22,300 Long Island Rail Road 2,268 2,341 2,340 2,321 2,472 2,561 Metro-North Railroad 2,100 1,828 1,834 1,837 1,840 1,843 Bridges & Tunnels 648 767 767 767 767 767 Headquarters - - - - - - Staten Island Railway 92 91 91 91 91 91 Capital Construction Company - - - - - - Bus Company 2,370 2,430 2,436 2,436 2,436 2,436
Maintenance 29,298 30,716 30,587 30,287 30,335 30,278 NYC Transit 20,570 21,187 21,004 20,686 20,786 20,742 Long Island Rail Road 3,741 3,849 3,904 3,890 3,836 3,865 Metro-North Railroad 3,406 4,033 4,033 4,026 4,021 4,021 Bridges & Tunnels 389 405 405 405 405 405 Headquarters - - - - - - Staten Island Railway 148 155 155 155 155 155 Capital Construction Company - - - - - - Bus Company 1,044 1,087 1,086 1,125 1,132 1,090
Engineering/Capital 1,773 1,951 1,976 1,887 1,887 1,887 NYC Transit 1,237 1,274 1,299 1,244 1,244 1,244 Long Island Rail Road 110 153 153 153 153 153 Metro-North Railroad 94 113 113 113 113 113 Bridges & Tunnels 194 218 218 218 218 218 Headquarters - - - - - - Staten Island Railway - 34 34 - - - Capital Construction Company 107 122 122 122 122 122 Bus Company 31 37 37 37 37 37
.
Public Safety 1,625 1,716 1,724 1,724 1,724 1,754 NYC Transit 587 630 633 633 633 633 Long Island Rail Road - - - - - - Metro-North Railroad - - - - - - Bridges & Tunnels 268 269 269 269 269 269 Headquarters 754 799 804 804 804 834 Staten Island Railway - - - - - - Capital Construction Company - - - - - - Bus Company 16 18 18 18 18 18
12013 Actuals represent paid positions and are net of vacancies. For 2014 and beyond, the table captures authorized positions.1 2009 Actuals for NYCT are as per the MTA 2009 Year-end report and have not been re-cast to reflect the subsequent Subways
reorganization.
Baseline Total Non-Reimbursable - Reimbursable PositionsFull-Time Positions and Full Time Equivalents by Function and Agency
METROPOLITAN TRANSPORTATION AUTHORITYJuly Financial Plan 2015-2018
II-90

FUNCTION/OCCUPATIONAL GROUP
2013
Actual1
2014 Mid-Year Forecast
2015 Preliminary
Budget 2016 2017 2018
Administration Managers/Supervisors 1,502 1,699 1,797 1,782 1,788 1,798 Professional, Technical, Clerical 2,445 2,566 2,616 2,622 2,621 2,621 Operational Hourlies 22 62 37 29 33 27
Total Administration 3,969 4,327 4,450 4,433 4,442 4,446
Operations Managers/Supervisors 3,345 3,499 3,444 3,422 3,420 3,416 Professional, Technical, Clerical 976 981 980 975 975 975 Operational Hourlies 25,376 25,530 25,384 25,336 25,513 25,608
Total Operations 29,697 30,009 29,807 29,732 29,907 29,998
Maintenance Managers/Supervisors 5,080 5,385 5,344 5,293 5,291 5,295 Professional, Technical, Clerical 1,783 1,897 1,845 1,793 1,790 1,787 Operational Hourlies 22,435 23,435 23,398 23,201 23,254 23,196
Total Maintenance 29,298 30,716 30,587 30,287 30,335 30,278
Engineering/Capital Managers/Supervisors 480 567 570 515 515 515 Professional, Technical, Clerical 1,291 1,353 1,375 1,369 1,369 1,369 Operational Hourlies 2 30 30 2 2 2
Total Engineering/Capital 1,773 1,951 1,976 1,887 1,887 1,887
Public Safety Managers/Supervisors 249 436 436 436 436 436 Professional, Technical, Clerical 128 145 145 145 145 145 Operational Hourlies 1,248 1,135 1,143 1,143 1,143 1,173
Total Public Safety 1,625 1,716 1,724 1,724 1,724 1,754
Baseline Total Positions Managers/Supervisors 10,655 11,585 11,590 11,447 11,449 11,459 Professional, Technical, Clerical 6,624 6,942 6,961 6,904 6,900 6,897 Operational Hourlies 49,083 50,191 49,992 49,711 49,945 50,006
Baseline Total Positions 66,361 68,719 68,543 68,062 68,294 68,362
12013 Actuals represent paid positions and are net of vacancies. For 2014 and beyond, the table captures authorized positions.
1 2009 Actuals for NYCT are as per the MTA 2009 Year-end report and have not been re-cast to reflect the subsequent Subwaysreorganization.
Metropolitan Transportation AuthorityJuly Financial Plan 2015-2018
Baseline Total Full-time Positions and Full-time Equivalents by Function and Occupational GroupNon-Reimbursable and Reimbursable
II-91

Function Change
2014-2015Change
2015-2016Change
2016-2017Change
2017-2018
Baseline Total Positions 176 481 (232) (68) NYC Transit 313 445 (121) 45 Long Island Rail Road (55) 33 (102) (128) Metro-North Railroad (7) 4 2 (3) Bridges & Tunnels - - - - Headquarters (65) - - (30) Staten Island Railway - 34 - - Capital Construction Company - - - - Bus Company (10) (35) (11) 48
Non-Reimbursable 33 144 (433) (93) NYC Transit 260 167 (260) 28 Long Island Rail Road (145) (2) (164) (136) Metro-North Railroad (7) 14 2 (3) Bridges & Tunnels - - - - Headquarters (65) - - (30) Staten Island Railway - - - - Capital Construction Company - - - - Bus Company (10) (35) (11) 48
Reimbursable 143 337 201 25 NYC Transit 53 278 139 17 Long Island Rail Road 90 35 62 8 Metro-North Railroad - (10) - - Bridges & Tunnels - - - - Headquarters - - - - Staten Island Railway - 34 - - Capital Construction Company - - - - Bus Company - - - -
Total Full-Time 161 481 (232) (68) NYC Transit 298 445 (121) 45 Long Island Rail Road (55) 33 (102) (128) Metro-North Railroad (7) 4 2 (3) Bridges & Tunnels - - - - Headquarters (65) - - (30) Staten Island Railway - 34 - - Capital Construction Company - - - - Bus Company (10) (35) (11) 48
Total Full-Time-Equivalents 15 - - - NYC Transit 15 - - - Long Island Rail Road - - - - Metro-North Railroad - - - - Bridges & Tunnels - - - - Headquarters - - - - Staten Island Railway - - - - Capital Construction Company - - - - Bus Company - - - -
Favorable/(Unfavorable)
METROPOLITAN TRANSPORTATION AUTHORITYJuly Financial Plan 2015-2018
Year to Year Changes for Positions by AgencyBaseline Total Non-Reimbursable - Reimbursable Positions
Full-Time Positions and Full Time Equivalents
II-92

FUNCTION/DEPARTMENT Change
2014-2015Change
2015-2016Change
2016-2017Change
2017-2018Administration (123) 17 (9) (4) NYC Transit (55) 13 - - Long Island Rail Road (2) - (5) (10) Metro-North Railroad (1) - - - Bridges & Tunnels - - - - Headquarters (60) - - - Staten Island Railway - - - - Capital Construction Company - - - - Bus Company (5) 4 (4) 6
Operations 202 75 (175) (91) NYC Transit 213 59 (21) 1 Long Island Rail Road 1 19 (151) (89) Metro-North Railroad (6) (3) (3) (3) Bridges & Tunnels - - - - Headquarters - - - - Staten Island Railway - - - - Capital Construction Company - - - - Bus Company (6) - - -
Maintenance 130 300 (48) 57 NYC Transit 183 318 (100) 44 Long Island Rail Road (54) 14 54 (29) Metro-North Railroad - 7 5 - Bridges & Tunnels - - - - Headquarters - - - - Long Island Bus - - - - Staten Island Railway - - - - Capital Construction Company - - - - Bus Company 1 (39) (7) 42
Engineering/Capital (25) 89 - - NYC Transit (25) 55 - - Long Island Rail Road - - - - Metro-North Railroad - - - - Bridges & Tunnels - - - - Headquarters - - - - Staten Island Railway - 34 - - Capital Construction Company - - - - Bus Company - - - -
Public Safety (8) - - (30) NYC Transit (3) - - - Long Island Rail Road - - - - Metro-North Railroad - - - - Bridges & Tunnels - - - - Headquarters (5) - - (30) Staten Island Railway - - - - Capital Construction Company - - - - Bus Company - - - -
July Financial Plan 2015-2018Year to Year Changes for Positions by Function and AgencyBaseline Total Non-Reimbursable - Reimbursable Positions
Full-Time Positions and Full Time EquivalentsFavorable/(Unfavorable)
METROPOLITAN TRANSPORTATION AUTHORITY
II-93

FUNCTION/OCCUPATIONAL GROUPChange
2014-2015Change
2015-2016Change
2016-2017Change
2017-2018
Administration Managers/Supervisors (98) 15 (6) (10) Professional, Technical, Clerical (50) (6) 1 - Operational Hourlies 25 8 (4) 6
Total Administration (123) 17 (9) (4)
Operations Managers/Supervisors 55 22 2 4 Professional, Technical, Clerical 1 5 - - Operational Hourlies 146 48 (177) (95)
Total Operations 202 75 (175) (91)
Maintenance Managers/Supervisors 41 51 2 (4) Professional, Technical, Clerical 52 52 3 3 Operational Hourlies 37 197 (53) 58
Total Maintenance 130 300 (48) 57
Engineering/Capital Managers/Supervisors (3) 55 - - Professional, Technical, Clerical (22) 6 - - Operational Hourlies - 28 - -
Total Engineering/Capital (25) 89 - -
Public Safety Managers/Supervisors - - - - Professional, Technical, Clerical - - - - Operational Hourlies (8) - - (30)
Total Public Safety (8) - - (30)
Baseline Total Positions Managers/Supervisors (5) 143 (2) (10) Professional, Technical, Clerical (19) 57 4 3 Operational Hourlies 200 281 (234) (61)
Baseline Total Positions 176 481 (232) (68)
Non-Reimbursable and Reimbursable
Metropolitan Transportation AuthorityJuly Financial Plan 2015-2018
Year to Year Changes for Positions by Function and Occupational Group Baseline Total Full-time Positions and Full-time Equivalents
Favorable/(Unfavorable)
II-94

Category 2014 2015 2016 2017
Baseline Total Positions (181) 21 452 575 NYC Transit (136) (96) 11 20 Long Island Rail Road (17) 131 442 548 Metro-North Railroad (2) 5 8 17 Bridges & Tunnels (5) (5) (5) (5) Headquarters (15) (76) (46) (2) Staten Island Railway - - - - Capital Construction Company - - - - Bus Company (6) 62 42 (3)
Non-Reimbursable (145) 112 516 577 NYC Transit (164) (26) 49 48 Long Island Rail Road 68 173 489 542 Metro-North Railroad 1 8 11 20 Bridges & Tunnels (5) (5) (5) (5) Headquarters (13) (74) (44) - Staten Island Railway - - - - Capital Construction Company - - - - Bus Company (32) 36 16 (29)
Reimbursable (36) (91) (64) (2) NYC Transit 28 (70) (38) (28) Long Island Rail Road (84) (42) (47) 5 Metro-North Railroad (3) (3) (3) (3) Bridges & Tunnels - - - - Headquarters (2) (2) (2) (2) Long Island Bus - - - - Staten Island Railway - - - - Capital Construction Company - - - - Bus Company 26 26 26 26
Total Full-Time (181) 21 452 575 NYC Transit (136) (96) 11 20 Long Island Rail Road (17) 131 442 548 Metro-North Railroad (2) 5 8 17 Bridges & Tunnels (5) (5) (5) (5) Headquarters (15) (76) (46) (2) Staten Island Railway - - - - Capital Construction Company - - - - Bus Company (6) 62 42 (3)
Total Full-Time-Equivalents - - - - NYC Transit - - - - Long Island Rail Road - - - - Metro-North Railroad - - - - Bridges & Tunnels - - - - Headquarters - - - - Staten Island Railway - - - - Capital Construction Company - - - - Bus Company - - - -
METROPOLITAN TRANSPORTATION AUTHORITYJuly Financial Plan 2015-2018
Baseline Change Between 2014 July Financial Plan vs. 2014 February Financial PlanTotal Non-Reimbursable - Reimbursable Positions
Full-Time Positions and Full Time Equivalents by AgencyFavorable/(Unfavorable)
II-95

Function 2014 2015 2016 2017Administration 59 (65) (49) (44) NYC Transit 84 21 30 29 Long Island Rail Road (1) 2 9 15 Metro-North Railroad (4) (5) (5) (5) Bridges & Tunnels (8) (8) (8) (8) Headquarters (16) (77) (77) (77) Staten Island Railway - - - - Capital Construction Company (2) (2) (2) (2) Bus Company 6 4 4 4
Operations (119) 53 193 210 NYC Transit (104) (69) (40) (33) Long Island Rail Road (17) 118 226 227 Metro-North Railroad 1 9 12 21 Bridges & Tunnels 2 2 2 2 Headquarters - - - - Staten Island Railway - - - - Capital Construction Company - - - - Bus Company (1) (7) (7) (7)
Maintenance (105) 52 297 354 NYC Transit (114) (43) 26 29 Long Island Rail Road 18 28 224 323 Metro-North Railroad 4 4 4 4 Bridges & Tunnels (2) (2) (2) (2) Headquarters - - - - Staten Island Railway - - - - Capital Construction Company - - - - Bus Company (11) 65 45 -
Engineering/Capital (15) (15) (15) (15) NYC Transit - - - - Long Island Rail Road (17) (17) (17) (17) Metro-North Railroad (3) (3) (3) (3) Bridges & Tunnels 3 3 3 3 Headquarters - - - - Staten Island Railway - - - - Capital Construction Company 2 2 2 2 Bus Company - - - -
Public Safety (1) (4) 26 70 NYC Transit (2) (5) (5) (5) Long Island Rail Road - - - - Metro-North Railroad - - - - Bridges & Tunnels - - - - Headquarters 1 1 31 75 Staten Island Railway - - - - Capital Construction Company - - - - Bus Company - - - -
Baseline Total Positions (181) 21 452 575
Full-Time Positions and Full Time Equivalents by Function and Agency
METROPOLITAN TRANSPORTATION AUTHORITYJuly Financial Plan 2015-2018
Baseline Change Between 2014 July Financial Plan vs. 2014 February Financial PlanTotal Non-Reimbursable - Reimbursable Positions
Favorable/(Unfavorable)
II-96

2014 2015 2016 2017
Administration Managers/Supervisors 29 (75) (58) (54)
, Professional, Technical, Clerical (40) (88) (89) (88) Operational Hourlies 70 98 98 98
Total Administration 59 (65) (49) (44)
Operations Managers/Supervisors (78) (33) (25) (4) Professional, Technical, Clerical 2 - (1) (1) Operational Hourlies (43) 86 219 215
Total Operations (119) 53 193 210
Maintenance Managers/Supervisors 14 27 77 75 Professional, Technical, Clerical (27) (11) (2) (1) Operational Hourlies (92) 35 221 279
Total Maintenance (105) 52 297 354
Engineering/Capital Managers/Supervisors (16) (14) (14) (14) Professional, Technical, Clerical 1 (1) (1) (1) Operational Hourlies - - - -
Total Engineering/Capital (15) (15) (15) (15)
Public Safety Managers/Supervisors (126) (126) (126) (125) Professional, Technical, Clerical 3 3 3 3 Operational Hourlies 122 119 149 192
Total Public Safety (1) (4) 26 70
Baseline Total Positions Managers/Supervisors (177) (221) (146) (122) Professional, Technical, Clerical (61) (97) (90) (88) Operational Hourlies 57 338 687 784
Baseline Total Positions (181) 21 452 575
FUNCTION/OCCUPATIONAL GROUP
Change
Metropolitan Transportation AuthorityJuly Financial Plan 2015-2018
Baseline Change Between 2014 July Financial Plan vs. 2014 February Financial PlanNon-Reimbursable and Reimbursable
Full-time Positions and Full-time Equivalents by Occupational Group and AgencyFavorable/(Unfavorable)
II-97

[THIS PAGE INTENTIONALLY LEFT BLANK]
II-98

III. Other MTA Consolidated Materials-Baseline

LineNo.7 2014 20158 2013 Mid-Year Preliminary 9 Actual Forecast Budget 2016 2017 2018
10 Operating Revenue11 Farebox Revenue $5,507 $5,662 $5,725 $5,807 $5,858 $5,90412 Toll Revenue 1,645 1,651 1,655 1,665 1,670 1,678 13 Other Revenue 754 717 644 667 696 723 14 Capital and Other Reimbursements 0 0 0 0 0 015 Total Operating Revenue $7,906 $8,030 $8,024 $8,138 $8,225 $8,306
1617 Operating Expense
18 Labor Expenses:19 Payroll $4,254 $4,576 $4,614 $4,701 $4,813 $4,90420 Overtime 621 680 607 612 623 63521 Health & Welfare 896 995 1,070 1,136 1,220 1,31422 OPEB Current Payment 473 468 508 548 592 64423 Pensions 1,302 1,341 1,330 1,325 1,313 1,32724 Other-Fringe Benefits 689 617 616 637 662 68425 Reimbursable Overhead (321) (344) (335) (334) (328) (332)26 Sub-total Labor Expenses $7,912 $8,333 $8,410 $8,626 $8,896 $9,176
2728 Non-Labor Expenses:
29 Electric Power $493 $551 $514 $535 $608 $65630 Fuel 259 268 265 254 259 26831 Insurance 39 48 58 71 85 10132 Claims 300 204 215 217 225 22833 Paratransit Service Contracts 367 382 392 427 480 52334 Maintenance and Other Operating Contracts 497 591 630 659 637 63335 Professional Service Contracts 297 346 337 325 327 33736 Materials & Supplies 475 550 555 565 567 57037 Other Business Expenses 167 181 184 198 199 20938 Sub-total Non-Labor Expenses $2,894 $3,121 $3,149 $3,250 $3,387 $3,524
3940 Other Expense Adjustments:
41 Other $46 $45 $44 $48 $48 $4942 General Reserve 0 135 140 145 150 15543 Sub-total Other Expense Adjustments $46 $180 $184 $193 $198 $204
4445 Total Operating Expense before Non-Cash Liability Adj. $10,853 $11,634 $11,744 $12,068 $12,481 $12,904
4647 Depreciation $2,174 $2,291 $2,407 $2,473 $2,662 $2,71148 OPEB Obligation 1,920 1,950 2,036 2,120 2,207 2,29949 Environmental Remediation 14 8 6 6 6 65051 Total Operating Expense after Non-Cash Liability Adj. $14,961 $15,883 $16,193 $16,666 $17,356 $17,919
5253 Conversion to Cash Basis: Non-Cash Liability Adjs. $4,109 $4,249 $4,449 $4,599 $4,875 $5,0155455 Debt Service (excludes Service Contract Bonds) (2,299) (2,288) (2,445) (2,568) (2,753) (2,921)5657 Total Operating Expense with Debt Service $13,152 $13,922 $14,189 $14,636 $15,234 $15,825
5859 Dedicated Taxes and State/Local Subsidies $5,898 $6,179 $6,265 $6,499.0 $6,678 $6,8736061 Net Deficit After Subsidies and Debt Service $652 $286 $100 $2 ($331) ($646)
6263 Conversion to Cash Basis: GASB Account (86) (48) (0) 0 0 (10)64 Conversion to Cash Basis: All Other (481) (490) (518) (269) (389) (459)6566 CASH BALANCE BEFORE PRIOR-YEAR CARRYOVER $86 ($252) ($418) ($267) ($720) ($1,114)
($ in millions)MTA Consolidated Statement Of Operations By Category
July Financial Plan 2015-2018
METROPOLITAN TRANSPORTATION AUTHORITY
Non-Reimbursable
III-1

LineNo7 2014 20158 2013 Mid-Year Preliminary
9 Actual Forecast Budget 2016 2017 2018 10 Operating Revenue11 Farebox Revenue $0 $0 $0 $0 $0 $012 Toll Revenue 0 0 0 0 0 013 Other Revenue 0 0 0 0 0 014 Capital and Other Reimbursements 1,464 1,612 1,632 1,607 1,550 1,56615 Total Operating Revenue $1,464 $1,612 $1,632 $1,607 $1,550 $1,566
1617 Operating Expense
18 Labor Expenses:
19 Payroll $473 $549 $572 $566 $552 $55920 Overtime 159 121 111 113 111 11321 Health & Welfare 54 63 66 69 69 7122 OPEB Current Payment 0 0 0 0 0 023 Pensions 64 69 69 69 67 6724 Other-Fringe Benefits 149 168 172 170 165 16725 Reimbursable Overhead 319 342 331 330 324 32826 Subtotal Labor Expenses $1,219 $1,313 $1,322 $1,317 $1,289 $1,3062728 Non-Labor Expenses:
29 Electric Power $1 $1 $1 $1 $0 $030 Fuel 0 0 0 0 0 031 Insurance 7 9 10 10 10 1032 Claims 0 0 0 0 0 033 Paratransit Service Contracts 1 0 0 0 0 034 Maintenance and Other Operating Contracts 69 60 54 54 54 5535 Professional Service Contracts 47 63 99 82 57 5236 Materials & Supplies 115 159 140 135 131 13537 Other Business Expenses 5 7 7 8 8 838 Subtotal Non-Labor Expenses $245 $299 $311 $290 $260 $2603940 Other Expense Adjustments:
41 Other $0 $0 $0 $0 $0 $042 Subtotal Other Expense Adjustments $0 $0 $0 $0 $0 $04344 Depreciation $0 $0 $0 $0 $0 $045 OPEB Obligation 0 0 0 0 0 046 Environmental Remediation 0 0 0 0 0 047
48 Total Operating Expense $1,464 $1,612 $1,632 $1,607 $1,550 $1,566
49
50 Baseline Surplus/(Deficit) $0 $0 $0 $0 $0 $0
Reimbursable
($ in millions)MTA Consolidated Statement Of Operations By Category
July Financial Plan 2015-2018
METROPOLITAN TRANSPORTATION AUTHORITY
III-2

LineNumber
7 2014 20158 2013 Mid-Year Preliminary 9 Actual Forecast Budget 2016 2017 2018 10 Operating Revenue11 Farebox Revenue $5,507 $5,662 $5,725 $5,807 $5,858 $5,90412 Toll Revenue 1,645 1,651 1,655 1,665 1,670 1,678 13 Other Revenue 754 717 644 667 696 723 14 Capital and Other Reimbursements 1,464 1,612 1,632 1,607 1,550 1,56615 Total Operating Revenue $9,370 $9,642 $9,656 $9,745 $9,775 $9,872
1617 Operating Expense
18 Labor Expenses:
19 Payroll $4,728 $5,125 $5,186 $5,267 $5,365 $5,46320 Overtime 780 801 718 725 735 74721 Health & Welfare 950 1,058 1,137 1,205 1,290 1,38522 OPEB Current Payment 473 468 508 548 592 64423 Pensions 1,366 1,410 1,399 1,394 1,380 1,39424 Other-Fringe Benefits 838 785 788 807 827 85225 Reimbursable Overhead (2) (2) (3) (4) (4) (4)26 Sub-total Labor Expenses $9,131 $9,646 $9,732 $9,943 $10,185 $10,4822728 Non-Labor Expenses:
29 Electric Power $494 $552 $515 $535 $609 $65630 Fuel 259 268 265 254 259 26831 Insurance 45 57 68 81 95 11132 Claims 300 204 215 217 225 22833 Paratransit Service Contracts 368 382 392 427 480 52334 Maintenance and Other Operating Contracts 566 650 684 713 691 68835 Professional Service Contracts 345 409 436 406 384 38936 Materials & Supplies 590 709 695 700 698 70537 Other Business Expenses 172 189 191 205 206 21638 Sub-total Non-Labor Expenses $3,139 $3,420 $3,460 $3,539 $3,647 $3,7843940 Other Expense Adjustments:
41 Other $46 $45 $44 $48 $48 $4942 General Reserve 0 135 140 145 150 15543 Sub-total Other Expense Adjustments $46 $180 $184 $193 $198 $2044445 Total Operating Expense before Non-Cash Liability Adjs. $12,316 $13,246 $13,376 $13,675 $14,030 $14,470
4647 Depreciation $2,174 $2,291 $2,407 $2,473 $2,662 $2,71148 OPEB Obligation 1,920 1,950 2,036 2,120 2,207 2,29949 Environmental Remediation 14 8 6 6 6 65051 Total Operating Expense $16,425 $17,495 $17,825 $18,273 $18,906 $19,485
5253 Net Operating Deficit Before Subsidies and Debt Service ($7,055) ($7,853) ($8,169) ($8,528) ($9,131) ($9,613)
5455 Conversion to Cash Basis: Non-Cash Liability Adjs. $4,109 $4,249 $4,449 $4,599 $4,875 $5,0155657 Debt Service (excludes Service Contract Bonds) (2,299) (2,288) (2,445) (2,568) (2,753) (2,921)5859 Total Operating Expense with Debt Service $14,616 $15,534 $15,821 $16,243 $16,783 $17,391
6061 Dedicated Taxes and State/Local Subsidies $5,898 $6,179 $6,265 $6,499 $6,678 $6,8736263 Net Deficit After Subsidies and Debt Service $652 $286 $100 $2 ($331) ($646)
6465 Conversion to Cash Basis: GASB Account (86) (48) (0) 0 0 (10)66 Conversion to Cash Basis: All Other (481) (490) (518) (269) (389) (459)6768 CASH BALANCE BEFORE PRIOR-YEAR CARRY-OVER $86 ($252) ($418) ($267) ($720) ($1,114)
Non-Reimbursable / Reimbursable
($ in millions)MTA Consolidated Statement Of Operations By Category
METROPOLITAN TRANSPORTATION AUTHORITYJuly Financial Plan 2015-2018
III-3

LineNo7 Cash Receipts and Expenditures 2014 2015
8 2013 Mid-Year Preliminary
9 Actual Forecast Budget 2016 2017 2018
10 Receipts
11 Farebox Revenue $5,571 $5,679 $5,764 $5,847 $5,899 $5,94512 Other Operating Revenue 803 728 667 754 707 73213 Capital and Other Reimbursements 1,340 1,708 1,607 1,580 1,521 1,52414 Total Receipts $7,713 $8,116 $8,039 $8,181 $8,126 $8,201
1516 Expenditures
17 Labor:
18 Payroll $4,525 $5,263 $5,031 $5,065 $5,169 $5,26119 Overtime 736 811 695 697 707 71920 Health and Welfare 952 1,026 1,100 1,168 1,249 1,34421 OPEB Current Payment 431 452 491 530 574 62522 Pensions 1,191 1,343 1,368 1,363 1,347 1,35923 Other Fringe Benefits 653 752 727 741 761 78324 Contribution to GASB Fund 86 48 0 0 0 1025 Reimbursable Overhead 0 0 0 0 0 026 Total Labor Expenditures $8,574 $9,696 $9,413 $9,564 $9,807 $10,100
2728 Non-Labor:
29 Electric Power $498 $553 $510 $530 $602 $64930 Fuel 252 265 258 248 252 26231 Insurance 24 50 53 62 76 9232 Claims 213 188 193 194 200 20333 Paratransit Service Contracts 373 380 390 425 478 52134 Maintenance and Other Operating Contracts 471 572 559 579 555 55135 Professional Service Contracts 293 384 379 351 326 32636 Materials & Supplies 640 677 686 693 693 70037 Other Business Expenditures 165 240 207 200 201 21038 Total Non-Labor Expenditures $2,929 $3,309 $3,236 $3,281 $3,385 $3,513
3940 Other Expenditure Adjustments:
41 Other $36 $86 $118 $93 $86 $13642 General Reserve 0 135 140 145 150 15543 Total Other Expenditure Adjustments $36 $221 $258 $238 $236 $291
4445 Total Expenditures $11,539 $13,226 $12,907 $13,083 $13,428 $13,9044647 Net Cash Deficit Before Subsidies and Debt Service ($3,826) ($5,110) ($4,869) (4,903) (5,301) (5,703)
4849 Dedicated Taxes and State/Local Subsidies $5,576 $6,524 $6,240 $6,537 $6,642 $6,79550 Debt Service (excludes Service Contract Bonds) (1,664) (1,666) (1,790) (1,902) (2,061) (2,206)5152 CASH BALANCE BEFORE PRIOR-YEAR CARRY-OVER $86 ($252) ($418) ($267) ($720) ($1,114)
($ in millions)MTA Consolidated Cash Receipts and Expenditures
July Financial Plan 2015-2018
METROPOLITAN TRANSPORTATION AUTHORITY
III-4

2014 2015
2013 Mid-Year Preliminary
Actual Forecast Budget 2016 2017 2018 Depreciation
New York City Transit $1,421 $1,544 $1,638 $1,688 $1,863 $1,913Long Island Rail Road 333 333 343 347 350 354Metro-North Railroad 230 227 227 227 229 231MTA Bus Company 49 42 42 42 43 44MTA Headquarters 42 31 36 40 41 33Staten Island Railway 8 8 8 8 8 8Bridges & Tunnels 91 104 112 120 128 128
Sub-Total 2,174 2,291 2,407 2,473 2,662 2,711
Other Post Employment Benefits
New York City Transit $1,554 $1,554 $1,616 $1,681 $1,748 $1,818Long Island Rail Road 45 71 74 76 76 77
Metro-North Railroad 58 65 68 70 73 77
MTA Bus Company 100 100 100 100 100 100
MTA Headquarters 85 90 105 117 130 143
Staten Island Railway 1 2 2 2 2 2
Bridges & Tunnels 77 67 70 74 77 81
Sub-Total 1,920 1,950 2,036 2,120 2,207 2,299
Environmental Remediation
New York City Transit 24 0 0 0 0 0
Long Island Rail Road (14) 4 2 2 2 2
Metro-North Railroad 2 4 4 4 4 4
MTA Bus Company 2 0 0 0 0 0
Staten Island Railway 0 0 0 0 0 0
Bridges & Tunnels (0) 0 0 0 0 0
Sub-Total 14 8 6 6 6 6
Net Operating Surplus/(Deficit)
New York City Transit 168 (230) (27) 20 11 (7)Long Island Rail Road (5) (25) (14) (15) (17) (19)Metro-North Railroad 37 (54) (24) (15) (19) (24)MTA Bus Company 9 (51) 12 12 12 12MTA Headquarters 119 (3) 92 192 129 93Staten Island Railway 4 (4) (0) 0 0 (0)First Mutual Transportation Assurance Company 25 (17) (22) (32) (35) (44)Other 32 24 21 21 22 22
Sub-Total 391 (359) 38 183 102 33
Subsidies
New York City Transit (409) (213) (509) (393) (452) (458)Commuter Railroads (462) (1) (23) (12) (22) (18)MTA Bus Company (35) 49 31 (8) (3) 4MTA Headquarters (27) (26) (26) (26) (26) (24)Staten Island Railway (24) (35) (37) (48) (34) (36)Other (4) 0 0 0 0 0
Sub-Total (961) (226) (563) (487) (537) (533)
Total Cash Conversion $3,538 $3,663 $3,923 $4,295 $4,440 $4,515
($ in millions)Cash Conversion Detail
July Financial Plan 2015-2018
METROPOLITAN TRANSPORTATION AUTHORITY
III-5

LineNumber
9 Non-Reimbursable 2014 2015
10 2013 Mid-Year Change Preliminary Change Change Change Change
11 Actual Forecast 2014 - 2013 Budget 2015 - 2014 2016 2016 - 2015 2017 2017 - 2016 2018 2018 - 2017
12 Operating Revenue
13 Farebox Revenue $5,507 $5,662 $155 $5,725 $63 $5,807 $82 $5,858 $51 $5,904 $46
14 Toll Revenue 1,645 1,651 6 1,655 4 1,665 10 1,670 6 1,678 8
15 Other Revenue 754 717 (37) 644 (73) 667 23 696 30 723 27
16 Capital and Other Reimbursements 0 0 0 0 0 0 0 0 0 0 0
17 Total Operating Revenue $7,906 $8,030 $124 $8,024 ($7) $8,138 $115 $8,225 $86 $8,306 $8118
19 Operating Expense
20 Labor Expenses:21 Payroll $4,254 $4,576 ($322) $4,614 ($37) $4,701 ($88) $4,813 ($111) $4,904 ($92)22 Overtime 621 680 (59) 607 73 612 (5) 623 (11) 635 (12)23 Health & Welfare 896 995 (99) 1,070 (76) 1,136 (66) 1,220 (84) 1,314 (94)24 OPEB Current Payment 473 468 5 508 (40) 548 (40) 592 (44) 644 (51)25 Pensions 1,302 1,341 (39) 1,330 11 1,325 5 1,313 11 1,327 (13)26 Other-Fringe Benefits 689 617 72 616 0 637 (21) 662 (25) 684 (22)27 Reimbursable Overhead (321) (344) 23 (335) (9) (334) (1) (328) (6) (332) 428 Sub-total Labor Expenses $7,912 $8,333 ($421) $8,410 ($77) $8,626 ($215) $8,896 ($270) $9,176 ($280)29
30 Non-Labor Expenses:31 Traction and Propulsion Power $493 $551 ($58) $514 $37 $535 ($20) $608 ($74) $656 ($47)32 Fuel for Buses and Trains 259 268 (9) 265 3 254 10 259 (4) 268 (9)33 Insurance 39 48 (10) 58 (10) 71 (13) 85 (14) 101 (16)34 Claims 300 204 96 215 (11) 217 (2) 225 (8) 228 (3)35 Paratransit Service Contracts 367 382 (15) 392 (10) 427 (35) 480 (53) 523 (42)36 Maintenance and Other Operating Contracts 497 591 (94) 630 (40) 659 (28) 637 22 633 337 Professional Service Contracts 297 346 (49) 337 9 325 12 327 (2) 337 (10)38 Materials & Supplies 475 550 (75) 555 (5) 565 (10) 567 (2) 570 (2)39 Other Business Expenses 167 181 (14) 184 (3) 198 (14) 199 (1) 209 (10)40 Sub-total Non-Labor Expenses $2,894 $3,121 ($227) $3,149 ($28) $3,250 ($100) $3,387 ($137) $3,524 ($137)41
42 Other Expense Adjustments:43 Other $46 $45 1 $44 1 $48 (3) $48 (1) $49 (1)44 General Reserve 0 135 (135) 140 (5) 145 (5) 150 (5) 155 (5)45 Sub-total Other Expense Adjustments $46 $180 ($134) $184 ($4) $193 ($8) $198 ($6) $204 ($6)
46
47 Depreciation 2,174 2,291 (117) 2,407 (116) 2,473 (66) 2,662 (190) 2,711 (48)48 OPEB Obligation 1,920 1,950 (30) 2,036 (86) 2,120 (84) 2,207 (87) 2,299 (91)49 Environmental Remediation 14 8 7 6 2 6 0 6 0 6 050
51 Total Operating Expense after Non-Cash Liability Adj. $14,961 $15,883 ($921) $16,193 ($310) $16,666 ($474) $17,356 ($690) $17,919 ($563)
52
53 Conversion to Cash Basis: Non-Cash Liability Adjs. $4,109 $4,249 ($140) $4,449 ($200) $4,599 ($123) $4,875 ($185) $5,015 ($168)54
55 Debt Service (excludes Service Contract Bonds) (2,299) (2,288) 11 (2,445) (157) (2,568) (123) (2,753) (185) (2,921) (168)56
57 Total Operating Expense with Debt Service $13,152 $13,922 ($770) $14,189 ($266) $14,636 $447 $15,234 $598 $15,825 $59258
59 Dedicated Taxes and State/Local Subsidies $5,898 $6,179 $281 $6,265 $86 $6,499 $234 $6,678 $179 $6,873 $19660
61 Net Deficit After Subsidies and Debt Service $652 $286 ($366) $100 ($187) $2 ($98) ($331) ($333) ($646) ($315)62
63 Conversion to Cash Basis: GASB Account (86) (48) (37) (0) (48) 0 (0) 0 0 (10) 10
64 Conversion to Cash Basis: All Other (481) (490) 9 (518) 28 (269) (249) (389) 121 (459) 69
65 Net Cash Balance from Previous Year 314 162 (152) 10 (153) 10 0 146 136 113 (33)
66 CASH BALANCE BEFORE PRIOR YEAR CARRYOVER $86 ($252) ($338) ($418) ($166) ($267) 151 ($720) (453) ($1,114) (394)
($ in millions)Favorable/(Unfavorable)
Changes Year-to-Year By CategoryJuly Financial Plan 2015-2018
METROPOLITAN TRANSPORTATION AUTHORITY
III-6

Explanation Explanation Explanation Explanation Explanation
Multi-AgencySuper Storm Sandy
Reimbursement (October 2012)
$ 59.5
FEMA/FTA reimbursement for expenses incurred as a result of Superstorm Sandy
-$ -$ -$ -$
Multi-AgencyHurricane Irene Reimbursement (August 2011)
23.5$ FEMA/Insurance reimbursement due to Hurricane Irene
-$ -$ -$ -$
LIRRWinter Storm NEMO
Reimbursement (February 2013)
1.0$ FEMA reimbursement due to Winter Storm NEMO
-$ -$ -$ -$
LIRRBayridge Real
Estate Sale (shifted to 2015)
$ - 2.6$
Currently the Transit Oriented Development (TOD Group) is doing an engineering study & an appraisal for the air rights. They are projecting phase I to go out towards the end of 2013 and phase II in 2014.
-$ -$ -$
MTAHQRecovery of
Relocation Costs $ - 13.9$ Reimbursement of HQ
move to 2 Broadway 78.3$ Reimbursement of HQ move to 2 Broadway -$ -$
Total Non-Recurring Resources (> or = $1 million)
84.0$ 16.5$ 78.3$ -$ -$
2018 Plan
METROPOLITAN TRANSPORTATION AUTHORITYJuly Financial Plan 2015-2018
Non-Recurring Revenue and Savings($ in millions)
2017 Plan2014 Mid-Year Forecast 2015 Plan 2016 Plan
III-7

2014 2015Mid-Year Preliminary
Forecast Budget 2016 2017 2018
MTA General Reserve (annual) $135.0 $140.0 $145.0 $150.0 $155.0
GASB Fund Reserve1,2,3 $143.4 $143.4 $143.4 $143.4 $153.2
MTA Retiree Welfare Benefits Trust1 $300.0 $300.0 $300.0 $300.0 $300.0
1 Cumulative balances2 MTA intends to move funds from the GASB Fund Reserve into the MTA Retiree Welfare Benefits Trust Fund.3 These figures reflect the proposed below-the-line adjustments to the GASB Fund Reserve as noted in Volume 1, which include a withdrawal of $254 million in 2014 and a total of $533 million reflecting suspended contributions from 2014 to 2017 and the resumption of contributions in 2018 and beyond at a lower level.
($ in millions)
Operating Budget Reserves - BaselineJuly Financial Plan 2015-2018
METROPOLITAN TRANSPORTATION AUTHORITY
dkeller
Typewritten Text
dkeller
Text Box
Subsequent to the initial printing of Volume 2, footnote # 3 has been added to this page.

IV. MTA Capital Program Information

NYCT2014 Commitments GoalAll $ in millions
ACEP Project Description 2014
Commitments
2000-2004
N40905/34 Wireless Help Points: Bw7 WPR 0.95$ Element Total 0.95$
2005-2009
T50803/19 CBTC Canarsie: Equip R156 Locomotives 1.22$ T50806/15 PA/CIS: 44 Stns: Furnish-install Cabinets 22.14$ T50806/16 HVAC At 8 Locations, Wrap Up At 10 Locations 12.37$
Element Total 35.73$
T51204/08 Brt: Traffic Signal Priority Hardware (SBS) 3.63$ T51204/16 Ulmer Park Depot: Roof Replacement 2.44$ T51204/28 Ulmer Park Depot: Mezzanine Extension - [SBMP] 2.56$
Element Total 8.63$
2010-2014
T60302/15 Purchase 256 Articulated Buses 245.50$ T60302/17 Purchase 177 Paratransit Vehicles 20.59$ T60302/28 Purchase 276 Standard Buses (New Flyer) 152.49$ T60302/29 On-Board Audio Visual (OBAV) PILOT: Software Platform Devel 2.88$
Element Total 421.46$
T60404/01 Heet Nr Electronics Replacement Ph I 42.71$
T60404/05 New Fare Payment System 10.44$ T60404/07 PSLAN: 10 Stations - Partial Systems 2.00$
T60404/08 PSLAN: 20 Stations 19.97$ T60404/09 PSLAN: 2 Stations Montague Tube 2.39$
Element Total 77.51$
T60407/05 Elevator Replacement: 7 Hydraulic Elevators / Lexington 21.21$
Element Total 21.21$
T60412/13 Station Rehabilitation: 20 Avenue/ Sea Beach 41.40$ T60412/14 Station Rehabilitation: 8 Avenue / Sea Beach 36.00$ T60412/15 Station Rehabilitation: Fort Hamilton Parkway / Sea Beach 36.00$ T60412/16 Station Rehabilitation: 18 Avenue / Sea Beach 40.00$
T60412/17 Station Rehabilitation: Kings Highway / Sea Beach 40.00$ T60412/18 Station Rehabilitation: New Utrecht Av / Sea Beach 36.60$ T60412/19 Station Rehabilitation: Bay Parkway / Sea Beach 39.30$ T60412/20 Station Rehabilitation: Avenue U / Sea Beach 40.00$ T60412/21 Station Rehabilitation: 86 Street / Sea Beach 40.00$ T60412/32 Station Renewal: Ozone Park-Lefferts Blvd / Liberty 6.64$
T60412/38 Station Renewal: Avenue X / Culver 14.03$ T60412/39 Station Renewal: Avenue U / Culver 15.79$ T60412/40 Station Renewal: Avenue P / Culver 12.02$
IV-1

NYCT2014 Commitments GoalAll $ in millions
ACEP Project Description 2014
Commitments
T60412/41 Station Renewal: Bay Parkway / Culver 12.18$ T60412/42 Station Renewal: 18 Avenue / Culver 18.51$ T60412/43 Station Renewal: Ditmas Avenue / Culver 18.40$ T60412/44 Station Renewal: Avenue I / Culver 15.13$ T60412/45 Station Renewal: Pennsylvania Avenue / New Lots 10.58$ T60412/46 Station Renewal: Rockaway Avenue / New Lots 9.87$ T60412/47 Station Renewal: Saratoga Avenue / New Lots 10.96$ T60412/48 Station Renewal: Junius Street / New Lots 11.82$ T60412/49 Station Renewal: Sutter Avenue-Rutland Road / New Lots 11.36$ T60412/50 Station Renewal: Van Siclen Avenue / New Lots 10.74$ T60412/60 Station Component: Station Components: 6 Stations / Jamaica 37.80$ T60412/69 Station Component: Queensboro Plaza / Flushing 0.93$
T60412/80 Station Component: 103 Street / Lexington 9.95$ T60412/81 Station Component: 2 Locations / Culver 12.14$
T60412/82 Station Component: 49 Street / Broadway 6.86$ T60412/83 Station Component: 2 Locations / 4 Av 8.21$
T60412/84 Station Component: Delancey St-essex St / Nassau 0.90$ T60412/87 Station Ventilators: Elmhurst Av(N. Of Bwy) QBL [SBMP] 1.34$
T60412/91 Station Component: 3 Locations / Lexington 5.57$ T60412/92 Station Component: New Lots Av Station / New Lots Line 2.14$
T60412/93 Station Component: 2 Locations / QBL 10.13$ T60412/95 Station Ventilators: Ph 6 - 5 Loc / Upper Manhattan & Bronx 6.45$ T60412/96 Station Component: 2 Locations / Nostrand 6.53$ T60412/98 Station Component: Street Stairs: Ditmars Blvd / Astoria (s2/s3) [SBMP] 1.29$
T60412/A2 Station Component: Street Stairs: Grand St / Canarsie [SBMP] 2.18$ T60412/A3 Station Component: Mezzanine Ceiling/Walls: Morgan Avenue / Canarsie [ 1.27$
T60412/B1 Station Component: 3 Locations / Crosstown 9.62$ T60412/C3 Station Component: 5 Locations / Canarsie 10.88$ T60412/C4 Station Component: 7 Locations / 8th Avenue 25.19$ T60412/C5 Station Component: 2 Street Stairs: Broadway / Astoria (s1/s3) [SBMP] 1.31$ T60412/C6 Station Component: 1 St Stair: Broadway / Astoria (s2) [SBMP] 0.65$
T60412/C7 Station Component: 3 Street Stairs: Rector Street / Broadway (nb) [SBMP] 2.74$ T60412/C8 Station Component: 5 Street Stairs: Rector Street / Broadway (sb) [SBMP] 3.62$ T60412/C9 Station Component: 2 Street Stairs: Jay Street-metro Tech / Broadway [SB 1.30$
T60412/D1 Station Ventilators: Elmhurst Av (S of Bwy) / QBL [SBMP] 1.44$ T60412/D2 Station Ventilators: Grand Street / Canarsie [SBMP] 1.31$ T60412/D3 Station Ventilators:Clin-Wash Avs (W of Wvrly) / BCT [SBMP] 0.97$ T60412/D4 Station Component: 1 Interior Stair: 49 Street / Broadway (p2) [SBMP] 0.81$ T60412/D6 Station Component: 3 St Strs: Clinton-washington Avs/fulton (s2/s4/s6) [SB 1.01$
IV-2

NYCT2014 Commitments GoalAll $ in millions
ACEP Project Description 2014
Commitments
T60412/D7 Station Component: 3 St Strs: Clinton-washington Avs/fulton (s1/s3/s5) [SB 1.01$ T60412/D8 Station Component: 3 Street Strs: Rockaway Avenue / Fulton (s2/s4/s8) [S 0.94$
T60412/D9 Station Component: 3 Street Stairs: Rockaway Avenue / Fulton (s1/s3/s7) 0.94$ T60412/E1 Station Component: 3 Locations / Fulton 5.81$
Element Total 710.56$
T60413/07 ADA: 68 St-hunter College / Lexington 0.96$
T60413/10 ADA: 23 Street / Lexington 16.84$ T60413/11 ADA: Phase 2: 57 Street - 7 Avenue / Broadway 36.16$ T60413/12 ADA: Ozone Park-lefferts Blvd / Liberty 21.37$ T60414/05 Access Improvements: Grand Central / Lex 18.19$
Element Total 93.52$
T60502/13 Mainline Track Replacement - 2014 Design And EFA 4.90$ T60502/14 Track Force Account - 2014 35.00$ T60502/15 Mainline Track Replacement - 2015 2.00$ T60502/16 Continuous Welded Rail - 2014 18.44$ T60502/70 Mainline Track Replacement 2013 At Concourse 6.57$ T60502/75 Mainline Track Replacement 2013 At 7th Avenue 2.97$ T60502/83 Mainline Track Replacement 2014 / 4th Avenue 5.07$ T60502/84 Mainline Track Replacement 2014 / 8th Avenue 12.76$ T60502/85 Mainline Track Replacement 2014 / Concourse 3.38$ T60502/86 Mainline Track Replacement 2014 / Queens Blvd 14.70$ T60502/87 Mainline Track Replacement 2014 / White Plains Road 19.96$ T60502/88 Mainline Track Replacement 2014 / Eastern Parkway 4.78$ T60502/89 Mainline Track Replacement 2014 / Jerome 8.77$ T60502/90 Mainline Track Replacement 2014 / Lexington Ave & 42 Shuttle 13.56$ T60502/91 Mainline Track Replacement 2014 / Pelham 20.81$ T60502/92 Mainline Track Replacement 2014 / 7th Avenue 4.68$ T60502/93 Mainline Track Replacement 2014 / Brighton 28.41$ T60502/94 Mainline Track Replacement 2014 / Flushing 5.98$
Element Total 212.74$
T60503/05 Mainline Switches - 2014 Design And EFA 5.56$ T60503/06 Mainline Switch Replacement 2015 2.90$ T60503/21 Mainline Track Switches 2014 / Eastern Parkway 6.19$ T60503/22 Mainline Track Switches 2014 / White Plains Road 17.10$
T60503/23 Mainline Track Switches 2014 / Queens Blvd 6.12$ Element Total 37.87$
T60603/02 Vent Study: South Of Grand Central / Lexington 2.10$ T60603/05 Replace Vent Controls: 26 Locations 13.61$
Element Total 15.71$
IV-3

NYCT2014 Commitments GoalAll $ in millions
ACEP Project Description 2014
Commitments
T60604/03 Pumps: 4 Locations / Pelham - Jerome - Lenox 14.70$ T60604/04 Pumps: 2 Locs - Manhattan Midtown 0.74$
Element Total 15.44$
T60703/12 Rehab Retaining Walls: South (thru 18 Avenue) / Sea Beach 41.00$ T60703/13 Structure Repairs / Dyre Avenue Line 8.54$ T60703/16 Subway Tunnel Rehabilitation: Priority Repairs: 4th Avenue 0.50$ T60703/19 Overcoating: Broadway Junction - New Lots Avenue / Cnr 24.37$ T60703/24 Structural Steel Repair, Lower Level, 9th Ave, West End Ln 13.99$ T60703/27 Overcoating: Portal - King's Hwy 27.40$
T60703/28 Overcoating: King's Hwy - West 8th St 21.89$ Element Total 137.69$
T60803/15 Interlocking Modernization: 34 St / 6th Avenue 218.26$
T60803/16 West 4 St Interlocking / 6th Avenue 221.18$ T60803/18 Signal Key-by Circuit Mods: Phase 3 14.67$ T60803/25 Replacement Of ATS-A & CBTC Status Boards At RCC 6.59$
T60803/26 ATS-A: Normal Replacemnet Of Hardware & Operating System 5.70$ Element Total 466.39$
T60806/01 Fiber Optic Cable Replacement: Phase 1 1.10$ T60806/04 PA/CIS: 43 Stns: Furnish-install Cabinets 22.64$ T60806/10 Pbx Upgrade, Phase I 22.45$
T60806/13 Antenna Cable Upgrade/replacement Ph 1 1.73$ T60806/15 Copper Cable Upgrade/replacement Phase 3 8.92$ T60806/20 Hydrogen Gas Ventilation:19 Communications Rooms 4.79$
T60806/21 PSLAN: 30 Stations 28.09$ T60806/28 Integrated Service Information & Mngmnt B-Div: Module 1 Grp1 12.32$
Element Total 102.03$
T60902/08 Roof And Enclosure: Jerome/kinsbridge [SBMP] 2.97$
Element Total 2.97$
T60904/03 Replace/upgrade Emergency Alarms And Emerg Telephones Pilot 5.70$ T60904/09 CBH 275: Pearl Street / Clark 7.36$
Element Total 13.06$
T61004/01 HVAC Repair And Maintenance Project For Dce Facilities, Ph2 53.59$ T61004/07 Shop Repairs/ Upgrades: Pitkin And Concourse 16.20$ T61004/08 Heavy Shop Equipment Replacement 11.98$ T61004/15 Yard Track - 2014 1.40$ T61004/16 Yard Track - 2015 0.06$ T61004/21 Yard Switches - 2014 1.78$
T61004/22 Yard Switches - 2015 0.65$ T61004/25 207 St Overhaul: Equipment For Car HVAC Repair & Maintenance 2.24$
IV-4

NYCT2014 Commitments GoalAll $ in millions
ACEP Project Description 2014
Commitments
T61004/26 East 180 St Maintenance Shop: Facility Waterproofing 3.96$ T61004/27 Car Washer Repairs: 3 Yards 12.48$ T61004/28 Car Washer Repairs At Coney Island Yard 5.24$
Element Total 109.57$
T61203 Sliding Gate Replacement At Jackie Gleason Bus Depot 3.78$
T61203/03 Jamaica Depot Replacement 17.13$ T61203/04 126th Street Bus Depot Decommissioning 5.00$
Element Total 25.91$
T61204/14 Automated Fuel Management System Upgrade 2.50$ T61204/20 Jamaica Bus Terminal Reconfiguration 3.40$ T61204/21 New DOB Facility At St George Terminal 4.18$ T61204/29 Construct Bus Command Center- DOB 50.91$
T61204/30 3 Bus Washers At M J Quill: 1 New And 2 Rehab 5.76$ Element Total 66.75$
T61302/02 Purchase 54 Flat Cars 18.38$
T61302/06 Purchase 65 Non-rev Vehicles 11.50$ T61302/07 Work Train & Special Equipment: Vacuum Train 19.02$
Element Total 48.90$
T61602/05 Capital Revolving Fund - 2014 5.00$ T61602/22 Help Point: 2 Stations / White Plains Road & Flushing [SBMP] 1.55$ T61602/23 Help Point: 2 Stations / Flushing [SBMP] 1.61$
T61602/24 Help Point: 2 Stations / Jerome [SBMP] 1.51$ Element Total 9.67$
T61604/02 Enterprise-Wide San/Disaster Recovery Phase 2 11.68$ T61604/04 Enterprise Lan/Wan Replacement 9.61$
Element Total 21.29$
T61605/07 Engineering Services: 2013 3.60$ T61605/09 Scope Development: Scope Development - 2014 9.53$ T61605/13 Boring Services: Manhattan & Bronx 1.97$ T61605/14 Boring Services: Bklyn, Qns & SI 1.64$ T61605/15 Test Pits Contract (2014) 5.50$
Element Total 22.24$
T61606/04 Asbestos Disposal 2.52$
T61606/05 Sprinkler & Fire Alarm System, Ph 2: 6 Av Passageway 7.07$ T61606/06 Fire Alarm: 207 Street Overhaul Shop 0.40$ T61606/09 Asbestos Abatement - 2013 9.66$
T61606/10 Asbestos/Lead: Air Monitor 9.12$ Element Total 28.76$
T61607/03 RTO Master Tower Hardening 2.02$
IV-5

NYCT2014 Commitments GoalAll $ in millions
ACEP Project Description 2014
Commitments
T61607/05 Employee Facilities: Chambers St / Nassau Loop 6.53$
T61607/07 Security: Perimeter Hardening: RCC & 130 Livingston 10.88$ T61607/11 Facilities: AFC Equip Qtr: 8 Av Stn/ Sea Beach Ln 2.02$ T61607/17 Facilities: Livingston Plaza: Elevators, Roof, Facade 19.80$
T61607/20 RTO Facilities Hardening Ph 2 9.09$ Element Total 50.34$
S60701/03 Sir: Track: St. George Interlocking 12.93$ S60701/05 Sir: Power: New Power Substation: Prince's Bay 23.62$
Element Total 36.55$
E61404/02 Electronic Security: 10tsg Boro Hall-Court St 19.94$ E61404/03 Electronic Security: 10tsg Atlantic/Pacific 16.51$
Element Total 36.45$
ES0702/09 Sandy Repairs: Tower B Rehabilitation (Long Term) 6.43$ ES0702/11 Sandy Repairs: Clifton Shop Repairs (Long Term) Design 23.21$ ES0702/14 Sandy Repairs: St. George Interlocking 105.80$
Element Total 135.44$
ET0402 Sandy Repairs: Purchase And Install AFC Equipment 15.83$ ET0402/12 Sandy Repairs: South Ferry Advance Removal 10.61$ ET0402/13 Sandy Repairs: South Ferry Station Complex 141.77$
Element Total 168.21$
ET0403/07 Sandy Mitigation: Lower Mhttn Flood Doors / Hatches [SBFP] 1.78$ ET0403/08 Sandy Mitigation: Lower Mhttn Hatch Installation(SBFP) 1.33$
Element Total 3.10$
ET0502 Sandy Repairs: Mainline Switches South Ferry 2.20$ ET0502/10 Sandy Repairs: Track - Rutgers Tube 5.04$ ET0502/11 Sandy Repairs: Mainline Track - Clark St Tube 3.78$ ET0502/12 Sandy Repairs: Track - 53 St Tube QBL 6.64$ ET0502/13 Sandy Repairs: South Ferry Track 3.15$
Element Total 20.81$
ET0602 Sandy Repairs: Fan Plant (#6375) / Rutgers Tube 38.80$ ET0602/14 Sandy Repairs: Tunnel Lighting - Rutgers Tube 4.92$ ET0602/17 Sandy Repairs: 1 Pump Rooms (South Ferry) 6.50$ ET0602/18 Sandy Repairs: 2 Pump Rooms (Southern Manhattan) 6.50$ ET0602/20 Sandy Repairs: 2 Pump Rooms (207 St / CLK Tube) 7.30$ ET0602/23 Sandy Repairs: Fan Plant South Ferry 3.90$ ET0602/24 Sandy Repairs: 3 Fan Plants (Southern Manhattan) 30.70$ ET0602/26 Sandy Repairs: 1 Fan Plant (Old Slip) Clark 4.36$ ET0602/27 Sandy Repairs: South Ferry Tunnel Lighting 5.93$
Element Total 108.91$
IV-6

NYCT2014 Commitments GoalAll $ in millions
ACEP Project Description 2014
Commitments
ET0802/01 Sandy Repairs: South Ferry Interlocking 56.20$ ET0802/12 Sandy Repairs: Signals In The Clark St Tube 2.93$ ET0802/13 Sandy Repairs: Signals In The Rutgers Tube 1.96$ ET0802/14 Sandy Repairs: Signals In The Cranberry Tube 2.44$ ET0802/15 Sandy Repairs: Signals - 53 St Tube QBL 1.96$ ET0802/19 Sandy: Revenue Facility Microwave Communications System 3.49$ ET0802/21 Sandy Repairs: CCTV, Rutgers Tube 3.84$ ET0802/22 Sandy Repairs: CCTV, Cranberry Tube 3.84$
Element Total 76.66$
ET0902 Sandy Repairs: CBH #502/ Cranberry Tube 38.61$ ET0902/19 Sandy Repairs: Power & Comm Cable - Rutgers 23.10$ ET0902/20 Sandy Repairs: Comm/Power Cable - Cranberry Tube 15.83$ ET0902/22 Sandy Repair: 4 CBH's (#229, 278, 301, 284) - Clk (var Locs) 29.42$ ET0902/23 Sandy Repairs: Substation Equip (Irt) - Clark St Tube 16.13$ ET0902/24 Sandy Repairs: Comm & Power Cables - Clark St Tube 25.17$ ET0902/25 Sandy Repairs: Comm/Power Cable Replacemnt - 53 St Tube QBL 22.29$ ET0902/26 Sandy Repairs: Circuit Breaker House (#565) 53 St Tube QBL 22.55$ ET0902/27 Sandy Repairs: 4 Circuit Breaker Houses(#'s 55, 56, 58 & 88) 79.26$
Element Total 272.36$
ET1002/12 Sandy Repairs: Power Cable Replacement - Rockaway Park 6.87$ ET1002/13 Sandy Repairs: Rockaway Park Yard Assessment 0.40$ ET1002/14 Sandy Study: Yard Assessment - Coney Island 1.86$ ET1002/18 Sandy Repairs: 207 St Yard Signals 6.48$
Element Total 15.62$
ET1003/04 Sandy Mitigation: Rockaway Yard Rky 0.96$ ET1003/05 Sandy Mitigation:Near Term Perimeter Protection Coney Isl Yd 7.13$
Element Total 8.09$
ET1203/07 Sandy Mitigation: Various Depots 0.43$ Element Total 0.43$
ET1602 Sandy Repairs: Employee Facilty at Whitehall Station BWY 1.60$ Element Total 1.60$
T70803 TBD Interlocking Modernization: York Street / 6th Avenue 4.87$ Element Total 4.87$
Total 2014 Commitments 3,646.00$
IV-7

MTA Long Island Rail Road2014 Commitment SummaryAll $ in Millions
ACEP Project Description 2014
Commitments 2005-2009
L50204V4 3P CONSTRUCTION 1.26$ Element Total 1.26$
L50304TS 3RD PARTY DESIGN / FURNISH 4.28$ L50304TT F/A CONSTRUCTION 2.70$
Element Total 6.98$ L50601Y3 3P CONSTRUCTION SBMP 0.93$ L50601YD MTA REAL ESTATE 0.05$ L50601YF 3P PAVING-MENTORING 0.94$
Element Total 1.92$ L509048A 3P Remediation - Group "C" Sites 3.24$
Element Total 3.24$ 2010-2014
EL0402ZB 3P DESIGN & REVIEW 0.55$ Element Total 0.55$
EL0502ZC 3P CONSTR-FOUNDATION/EQUIP-PLATFORM 1.09$ Element Total 1.09$
EL0602ZD 3RD PARTY DESIGN 0.97$ EL0602ZL 3RD PARTY DESIGN & REVIEW 0.36$
Element Total 1.34$ EL0702ZM 3P CM 1.02$
Element Total 1.02$ EL0902ZF F/A MATERIAL 3.97$
Element Total 3.97$ L60204UC FA DESIGN 3.52$ L60204UD 3P CONSTRUCTION-(PN-V4) 11.17$ L60204UE 3P CONSTRUCTION - ELEVATOR 6.82$ L60204UF 3P DESIGN 1.20$ L60204UH FA CONSTRUCTION LABOR 3.95$
Element Total 26.66$ L60205U1 F/A TRANSPORTATION 1.55$
Element Total 1.55$ L60206VL PROJECT MANAGEMENT 11.00$
Element Total 11.00$ L60301TE PROJECT MANAGEMENT 50.93$ L60301TF 3p EQUIPMENT-TIE REMOVER 0.49$
Element Total 51.42$ L60304TU CPS 60.52$ L60304TV PROJECT MANAGEMENT 2.31$ L60304TW 3P CONSTRUCTION 16.36$ L60304TX 3P CM 6.45$
Element Total 85.64$ L60401BC 3P CONSTRUCTION 7.93$
Element Total 7.93$ L60502LA PTC RAILSIM ANALYSIS 0.15$
Element Total 0.15$ L60601YN FA INSPECTION 2.71$ L60604YT 3P CONSTRUCTION - UCC ROOF 3.50$
Element Total 6.21$ L60701AM FA CONSTRUCTION LABOR 6.88$ L60701AQ F/A ABATEMENT/DEMO 1.82$ L60701AR PROJECT MANAGEMENT 1.56$
Element Total 10.27$ L60904N3 3P DESIGN 0.72$ L60904N6 3P DESIGN 0.30$ L60904NA INDIRECT ADMINISTRATION 2014 19.88$ L60904NC LI PROTECTIVE LIABILITY 06/14-05/15 0.20$ L60904ND INDEPENDENT ENGINEER 2014 1.09$
Element Total 22.18$
Total 2014 Commitments 244.37$ IV-8

MTA Metro-North Railroad2014 Commitment SummaryAll $ in Millions
ACEP Project Description2014
Commitments2000-2004
G414-03-09 525 N. Broadway, White Plains 1.28$ Element Total 1.28$
M402-03-13 North White Plains Parking Garage 0.50$ Element Total 0.50$
2005-2009M501-01-10 M-9 Specification Development 0.43$ M501-01-12 Rolling Stock Signals (PTC) 0.71$
Element Total 1.14$ M502-02-02 Croton Harmon/Peekskill Station Improvements 3.01$ M502-02-06 Station Building Rehabilitation 0.25$
Element Total 3.26$ M508-01-09 Customer and Employee Communications Projects 1.40$
Element Total 1.40$ 2010-2014
M601-01-02 M-8 New Haven Line Purchase 10.00$ Element Total 10.00$
M602-01-01 GCT Trainshed/Tunnel Structure 18.12$ M602-01-05 GCT Leaks Remediation Phase II 2.99$ M602-01-06 GCT Elevator Rehab Phase 4 5.30$ M602-01-09 GCT Customer Communications 2.04$ M602-01-10 GCT Recycling Facility 1.11$
Element Total 29.56$ M602-02-02 Fordham Station Improvements 4.64$ M602-02-04 Station Building Rehabilitation/Net Lease 1.55$ M602-02-06 New Haven Line Station Phase II 0.30$ M602-02-08 Customer Communications/Connectivity Improve 5.37$
Element Total 11.86$ M603-01-02 Turnouts - Mainline/High Speed 3.40$ M603-01-03 GCT Turnouts/Switch Renewal 2.50$ M603-01-04 Turnouts - Yards/Sidings 1.62$ M603-01-05 M o f W Equipment/RS 3.91$ M603-01-08 Drainage Improvements -$ M603-01-14 2014 Cyclical Track Program 12.67$
Element Total 24.10$ M603-02-02 Rehab Culverts/Railtop Culvert 0.18$ M603-02-04 DC Substation/Signal House 0.66$ M603-02-05 Bridge Walkways Installation 0.38$ M603-02-06 Remove Obsolete Facilities 1.28$ M603-02-09 Employee Welfare and Storage Facilities 2.66$ M603-02-10 Replace/Repair Undergrade Bridges Program 3.45$ M603-02-11 Harlem River Lift Bridge Cable 0.13$ M603-02-12 Overhead Bridge Program - E of H 2.90$ M603-02-14 Park Avenue Viaduct Direct Fixation 1.74$ M603-03-05 W of H Replace/Renew Undergrade Bridges 5.70$
Element Total 19.08$ M604-01-01 Positive Train Control 19.21$ M604-01-02 West of Hudson Signal Improvements 12.74$ M604-01-04 Replace Field code System - Mott Haven 0.51$
IV-9

MTA Metro-North Railroad2014 Commitment SummaryAll $ in Millions
ACEP Project Description2014
CommitmentsM604-01-06 Centralized Train Control/SCADA Intrusion Testing 0.89$ M604-01-09 Replace High Cycle Relays 0.12$ M604-01-11 PBX Equipment Upgrade 0.10$
Element Total 33.57$ M605-01-01 Substation Bridge 23 - Construction -$ M605-01-03 Harlem & Hudson Lines Power Improvements 26.24$ M605-01-04 Replace Motors Alternators 1.48$ M605-01-05 Replace Substation Batteries -$ M605-01-07 Har. River Lift Bridge Breaker Houses/Controls 0.25$ M605-01-09 Replace 3rd Rail Brackets - Park Avenue Tunnel 6.56$
Element Total 34.52$ M606-01-01 Harmon Shop Improvements 36.84$
Element Total 36.84$ M608-01-01 Systemwide Lead/Asbestos Abatement 0.50$ M608-01-06 Program Administration 8.92$ M608-01-07 Program Scope Development 2.53$
Element Total 11.95$ EM03-02-02 Right of Way Restoration: Various Locations 2.20$
Element Total 2.20$ EM04-02-05 Comm & Signal Infrastructure Restoration Phase 1 3.08$ EM04-02-07 Comm & Signal Infrastr Restoration Eqpmt Replcmt 6.63$
Element Total 9.71$ EM05-02-06 Power Infrastructure Restoration-Phase 1 -$ EM05-02-08 Power Infrastructure Restoration-Substations 36.63$ EM05-02-09 Power Infrastructure Restoration-HRLB 4.44$ EM05-02-10 Power Infrastr Restoration-Remote Terminal Houses 1.28$
Element Total 42.35$
Total 2014 Commitments 273.33$
IV-10

2014 Commitments GoalAll $ in millions
ACEP Project Description2014
Commitments2005-2009
D505QM01 Service & FE Building Rehabilitation 3.09$ Element Total 3.09$
2010-2014D601BB28 Rehab. Walls, Roadway, Firelines, Ceiling Repair 69.67$
Element Total 69.67$ D601MP06 Substructure & Underwater Scour Protection 1.84$
Element Total 1.84$ D601QM18 Entrance and Exit Plazas Structural Rehabilitation 3.45$ D601QM40 Tunnel Wall and Ceiling Repairs and Leak Control 3.73$
Element Total 7.18$ D601RK23 Miscellaneous Rehab - Manhattan Approach Ramps 111.64$ D601RK76 Miscellaneous Structural Repair 15.75$
Element Total 127.39$ D601TN52 Miscellaneous Structural Rehabilitation 8.60$ D601VN34 Verrazano-Narrows Bridge Main Cable Testing 3.63$
Element Total 12.23$ D602BB54 Replacement Brooklyn Plaza Structural Slab 27.18$
Element Total 27.18$ D602HH88 Replace Upper & Lower Level Plza & Southbnd. Appr. 32.43$
Element Total 32.43$ D602MP21 Rehabilitate Rockaway Point Blvd Overpass 8.85$
Element Total 8.85$ D602RK65 Deck Replacement - Bronx/Manhattan Ramps/TollPlaza 218.83$ D602RK75 Interim Repairs - Toll Plaza Deck 16.18$
Element Total 235.00$ D602VN03 Toll Plaza - East & West Bound Ramps Improvements 0.63$
Element Total 0.63$ D604MP03 Programmable Logic Controller & Mechanical Rehab. 3.50$
Element Total 3.50$ D604QM81 Controls / Communication System 3.05$
Element Total 3.05$ D604VN87 Substation #1 Rehabilitation 12.06$
Element Total 12.06$ D605AW12 Hazardous Materials Abatement 0.42$
Element Total 0.42$ D605BB21 Service Building Rehabilitation 6.62$ D605BB43 MIsc. Repairs at BP Garage 5.32$
Element Total 11.94$ D606AW15 MTA Independent Engineer 0.56$ D606AW18 Protective Liability Insurance 2.62$ D606AW21 Program Administration 3.50$
Element Total 6.68$ D607RK65 Paint - Plaza and Approach Ramps 24.44$
Element Total 24.44$
MTA Bridges & Tunnels
IV-11

2014 Commitments GoalAll $ in millions
ACEP Project Description2014
Commitments
MTA Bridges & Tunnels
ED010209 Restore VNB TwrBase Elect/Lightg Sys+Ped Access Br 1.28$ ED010228 Restore Hugh L. Carey Tunnel - Structural 192.64$
Element Total 193.92$ ED010240 Restore Queens Midtown Tunnel - Structural 13.34$
Element Total 13.34$ ED010324 MPB/CBB Master Plan & Resiliency Needs 9.00$
Element Total 9.00$ ED020202 Restore Hugh L. Carey Tunnel Roadway 8.26$ ED020203 Restore Queens Midtown Tunnel Roadway 0.64$
Element Total 8.90$ ED040207 Replace MPB Electrical Equipmt at North Abutment 4.50$ ED040208 Replace MPB Lighting Systems 0.68$ ED040210 Repl CBB Mech&Elect Equip-S. Abutment & Svc Bldg 7.11$ ED040243 Restore Hugh L. Carey Tunnel Utilities 126.34$ ED040281 Restore QMT Cntrl/Comm Sys, CCTV,Traffic Signals 9.07$
Element Total 147.70$ ED050201 Restore CBB Service Bldg 1.74$ ED050202 Hugh L. Carey Tunnel Environmental Cleanup 7.20$ ED050203 Queens Midtown Tunnel Environmental Cleanup 0.42$ ED050204 Restore Queens Midtown Tunnel Vent Buildings 0.00$ ED050221 Restore Hugh L. Carey Tunnel Vent Bldgs 4.97$
Element Total 14.33$ ED05032A Flood Mitigation -Studies/Conceptual Design HCT 1.01$ ED05032B Flood Mitigation -Studies/Conceptual Design QMT 1.00$
Element Total 2.00$
Total 2014 Commitments 976.77$
IV-12

MTA Bus2014 Commitments GoalAll $ in millions
Project Description2014
Commiments
2005-2009
U5030204 $4.3MU5030211 $1.5MU5030225 $6.8MU5030204 $3.3MU5030216 $3.5M
Element Total $19.45
2010-2014
U6030201 $4.1MU6030205 $2.0MU6030208 $6.5MU6030225 $8.7MU6030217 $23.8MU6030219 $61.6MU6030226 $27.8M
Element Total $134.5M
EU030201 $25.0MElement Total $25.00
Total 2014 Commitments $178.92
Emergency Generators: 6 Depots - Purchase
Emergency Generators: 6 Depots - Installation
Project Administration & Engineering Chassis Wash: LaGuardia and Baisley Park
Security Upgrade: Far Rockaway and Baisley ParkFar Rockaway Roof Deck Replacement
Hurricane Sandy Depot Rehabilitation at Far Rockaway
Additional Fueling Capacity: JFK, Baisley Park and LaGuardia
75 Articulated BusesBus Radio System
New Apron: JFKBus Command Ctr45 Diesel Buses
ACEP
IV-13

2014 Commitment Goals
ACEP Project Description2014 Commiments
2005-2009N5100105 Harriman MTA PD Sign On - Design Phase $0.10
Element Total $0.102010-2014
EG160214 IESS East River Tunnel Impacts $21.36Element Total $21.36
E6100102 MTA PD Staten Island - Design $1.00E6100103 MTA PD District Office Nassau County $1.00
Element Total $2.00E6140202 Penn Station MTA PD Holding Cells - Design Phase $0.30E6140202 Penn Station - Consequence Management FLS $5.00E6140202 Penn Station MTA PD Holding Cells - Construction Phase $0.50
Element Total $5.80Program 6 -ACEP not assigned
Penn Station Perimeter Protection -7th Ave $0.95
Element Total $0.95G61401XX CM014B - GCT Concourse & Cavern Finishes $2.11G61401XX Harold Structures (Part 3) $31.46
Element Total $33.57G6090123 Harold Structures (Part 3) $75.05G6090114 CM014B - GCT Concourse & Cavern Finishes $193.38G609XXXX Traction Power System $114.75G6090142 Manhattan Southern Structures $316.27G6090137 System Package 3 (Signal Equipment Procurement) $21.84G6090135 Systems Package 1 - ESA $366.95
Element Total $1088.22
Total 2014 Commitments $1152.90
MTA Capital Construction
All $ in Millions
IV-14

ACEP Project Description2014
Commiments
2005-2009
N5100105 MTAPD District 7 - Harriman $0.40N5100109 MTAPD Radio Project $27.28
Element Total $27.682010-2014E6100102 MTAPD District 9 HQ $0.80E6100103 MTAPD District 2 HQ $1.50E6100104 MTAPD Radio Project - Additional Funding $60.00
Element Total $62.30
2014 Commitment Total $89.98
MTA Police Department2014 Commitment SummaryAll $ in Millions
IV-15

[THIS PAGE INTENTIONALLY LEFT BLANK]
IV-16

ACEP Project
Project Amount ($ in Mil)
Planned Completio
n Date
T60412/27 Station Renewal: Forest Avenue / Myrtle $7.38 Jan-14T60412/29 Station Renewal: Fresh Pond Road / Myrtle $9.50 Jan-14T60412/26 Station Renewal: Seneca Avenue / Myrtle $7.96 Jan-14T60412/25 Station Renewal: Central Avenue / Myrtle $11.30 Jan-14T60412/28 Station Renewal: Knickerbocker Avenue / Myrtle $11.00 Jan-14T60806/06 Communications - RTO: RTO: Portable Radio Unit Replacement $6.76 Jan-14T51302/03 Work Train & Special Equipment: 2 Ballast Regulators $7.74 Jan-14T61607/02 Information Technology: Jay St Systems Ph1: Radio Security System at 130 Livingston $1.99 Jan-14T50101/01 New Subway Cars: 23 A Division Cars - R188; Convert 10 R142A Cars $116.46 Jan-14T60502/69 Mainline Track Rehabilitation: Mainline Track Replacement 2013 at Canarsie $19.09 Feb-14T60413/08 Station Accessibility (ADA): ADA: Utica Av / Fulton Line $16.95 Feb-14T60412/85 Station Component Investments: Station Ventilators: Ph 4 - 4Loc / Eastern Queens $2.51 Feb-14T51604/02 Computer Hardware & Communications: HP Server Consolidation/Replacement $5.20 Feb-14T60407/01 Escalator Replacement: 3 Escalators - Southern Manhattan $14.56 Feb-14T60502/59 Mainline Track Rehabilitation: Mainline Track Replacement 2013 at Euclid Ave / 8 Avenue $11.31 Feb-14T60404/09 Communications Cable And Equipment: Passenger Station LAN: 2 Stations Montague Tube $2.39 Feb-14T60404/06 Communications Cable And Equipment: Passenger Station LAN: 4 Stations $5.25 Feb-14T61604/02 Computer Hardware & Communications: Enterprise-Wide SAN/Disaster Recovery Phase 1 $5.72 Mar-14T61607/06 Facilities: Distribution: Maspeth Warehouse Repairs $9.92 Mar-14T61604/05 Computer Hardware & Communications: HVAC Upgrade at 130 Livingston Plaza [SBMP] $0.65 Mar-14T60412/A6 Station Component Investments: Street Stairs: 23 Street / 6 Avenue (S1/S2) [SBMP] $0.97 Mar-14T60412/A7 Station Component Investments: Street Stairs: 23 Street / 6 Avenue (S3/S4) [SBMP] $1.03 Mar-14T51302/10 Rubber-Tired Vehicles: Diesel Particulate Filters: Non-Rev Fleet $4.97 Mar-14T60503/20 Mainline Track Switches: Mainline Track Switches 2013 at Brighton $4.78 Mar-14T60502/71 Mainline Track Rehabilitation: Mainline Track Replacement 2013 at Archer Avenue $2.42 Mar-14T60502/72 Mainline Track Rehabilitation: Mainline Track Replacement 2013 at Liberty Ave $8.67 Mar-14T60502/73 Mainline Track Rehabilitation: Mainline Track Replacement 2013 at Jerome Ave $6.38 Mar-14T60413/01 Station Accessibility (ADA): ADA: Forest Hills - 71 Av / Queens Blvd $24.73 Mar-14T60803/01 Maintenance Of Way: Signal Control Modifications Phase 4 $15.48 Mar-14T60502/55 Mainline Track Rehabilitation: Mainline Track Replacement 2013 at 6th Avenue $18.10 Mar-14T51204/11 Depot Rehabilitation: Bus Lifts At Various Locations $8.80 Mar-14T61204/02 Misc: Bus Projects: BRT - Bus Rapid Transit 2010-2014 (SBS) $25.00 Mar-14U50302/11 Depot Rehabilitation: Roof/Ventilation: Far Rockaway Depot $6.93 Mar-14U50302/09 Misc: Bus Projects: Upgrade Parking: Baisley Pk & JFK Depots $9.20 Mar-14T60703/26 Subway Tunnel Rehabilitation: Rehab of Subway Roof Delancey St (Norfolk-Essex) [SBMP] $1.28 Mar-14U50302/13 Depot Rehabilitation: Roof/Ventilation: Eastchester Maintenance Facility $3.64 Mar-14T60703/25 Subway Tunnel Rehabilitation: Rehab of Subway Roof Delancey St (Norfolk-Suffolk) [SBMP] $1.05 Mar-14ES0702/12 SIR: Shops & Facilities: Sandy Repairs: Tower B Rehabilitation (Short Term) $0.94 Apr-14ES0702/10 SIR: Shops & Facilities: Sandy Repairs: Clifton Shop Repairs (Short Term) $4.23 Apr-14T61204/09 Misc: Bus Projects: Tank Upgrades: Fresh Pond Depot [SBMP] $2.44 Apr-14T50902/12 Misc: Power: Substation Hatchways: 6 Locations $6.10 Apr-14T60902/03 Misc: Power: Substation Hatchways: 8 Locs $5.38 Apr-14U40302/14 Misc: Bus Projects: Bus Time Customer Information System: MTA Bus $10.45 Apr-14T51204/05 Misc: Bus Projects: Bus Time Customer Information System: NYCT $48.76 Apr-14T60502/37 Mainline Track Rehabilitation: Mainline Track Replacement 2012 at Concourse $14.13 Apr-14T41204/01 Radio & Data Communication: AVLM: Paratransit - 2,273 Vehicles $37.28 Apr-14T61606/02 Asbestos Abatement: Asbestos Abatement I/Q $8.30 May-14ET0603/04 Work Train & Special Equipment: Sandy Mitigation: Convrt 6 110A's & 2 Flats to 2 Pump Trains $13.89 May-14T61204/06 Bus Washers: 3 Bus Washers at Manhattanville Depot $4.15 May-14T61607/02 Information Technology: Jay St Systems Phase 1: New PBX Room $6.45 May-14T60803/07 Rapid Transit Operations: Station Time (ST) Improvements, Ph 2 / LEX $29.67 May-14T51606/10 Asbestos Abatement: Asbestos Waste Disposal I/Q $0.84 May-14T41302/P4 Work Train & Special Equipment: Purchase 9 Diesel-Electric Locomotives $31.04 May-14T51302/05 Work Train & Special Equipment: 19 Diesel Locomotives $79.27 May-14ET0403/03 Misc: Stations: Sandy Mitigation: South Ferry Near-Term Flood Protection $5.77 May-14T61606/05 Fire Protection: Sprinkler & Alarm Systems: Phase 1 - 5 Locations $13.32 May-14T61602/13 Misc: Stations: Help Point: 233 St & 238 St / White Plains Rd [SBMP] $1.47 May-14T60806/24 Station Communication Rooms: Communication Room Waterproofing: 5 Locations [SBMP] $1.30 May-14ET0403/05 Misc: Stations: Sandy Mitigation: Vent Cover Prototype (SBFP) $1.20 May-14T60803/01 Signal Systems: AC to DC Line Relay Conversion / Fulton PILOT $9.86 May-14ET0802/18 Signal Systems: Sandy Repairs: Install PLC Signal Equipment - Rockaway Line $6.03 May-14
NYCT 2014 - 2017 Completions
IV-17

ACEP Project
Project Amount ($ in Mil)
Planned Completio
n Date
NYCT 2014 - 2017 Completions
ET0403/04 Misc: Stations: Sandy Mitigation: Stair Covers Prototype (SBFP) $2.03 May-14T61602/14 Misc: Stations: Help Point: 219 St & 225 St / White Plains Rd [SBMP] $1.49 May-14T60413/09 Station Accessibility (ADA): ADA: Hunts Point Av / Pelham $17.97 May-14T60404/02 Fare Marketing/Distribution Equipment: Purchase Automated Farecard Access System (AFAS) Units $1.85 May-14T60502/12 Welded Rail: Continuous Welded Rail - 2013 $3.92 Jun-14T60412/A9 Station Component Investments: Street Stairs: 7 Avenue / 6 Avenue (S1-S4) [SBMP] $1.23 Jun-14S40701/15 SIR: Passenger Stations: Station Security Initiatives $22.24 Jun-14T61607/13 Consolidated Employee Facilities:Subways: 207 Street / 8th Avenue $8.84 Jun-14T60502/78 Mainline Track Rehabilitation: Mainline Track Replacement 2013 at s/o 190 St / 8th Avenue $6.89 Jun-14T60502/66 Mainline Track Rehabilitation: Mainline Track Replacement 2013 at Lenox-White Plains Rd $5.59 Jun-14T50599/01 Maintenance Of Way: Third Rail Heater Control System $5.95 Jun-14T61605/01 Capital Program Management: Boring Services: Bklyn, Qns, SI $1.54 Jun-14T61605/02 Capital Program Management: Boring Services: Manhattan & Bronx $1.85 Jun-14ET0802/08 Security Program: Sandy Repairs: Security Equipment Various Locations $7.32 Jun-14T51204/16 Depot Rehabilitation: Flatbush Depot: Asbestos Removal $2.45 Jun-14T60502/75 Mainline Track Rehabilitation: Mainline Track Replacement 2013 at 7th Avenue $2.97 Jun-14T60502/79 Mainline Track Rehabilitation: Mainline Track Replace 2013 at s/o 72 St & 81-86 St / 8AV $10.63 Jun-14T60703/14 Line Structure Overcoating: Bway Junction - Cypress Hills / Jamaica $19.93 Jun-14T50703/17 Line Structure Overcoating: Portal To EOL / Pelham $28.16 Jun-14E61404/01 Security Program: Electronic Security: 10TSG URT Phase 1 $20.59 Jun-14T60302/23 Bus Component Systems: Bus Cameras - 2010-14 Purchases $24.83 Jun-14T60502/61 Mainline Track Rehabilitation: Mainline Track Replacement 2013 at Sea Beach $12.00 Jun-14T60502/81 Mainline Track Rehabilitation: Mainline Track Replacement at Greenpoint Tube / Crosstown $3.73 Jun-14T41204/P2 Depot Rehabilitation: Paving: 3 Locations $3.13 Jun-14T60503/17 Mainline Track Switches: Mainline Track Switches 2013 at Queens Blvd $15.33 Jun-14T41302/O4 Work Train & Special Equipment: 36 CWR Flatcars & 18 Flatcars $15.11 Jun-14T61605/03 Capital Program Management: Test Pits Contract $2.60 Jun-14T60502/63 Mainline Track Rehabilitation: Mainline Track Replacement 2013 at 8th Avenue $14.04 Jun-14T60502/70 Mainline Track Rehabilitation: Mainline Track Replacement 2013 at Concourse $6.57 Jun-14T60412/A8 Station Component Investments: Street Stairs: 7 Avenue / 6 Avenue (S5-S8) [SBMP] $1.29 Jun-14T51204/16 Depot Rehabilitation: Flatbush Depot: Roof Repair $3.81 Jun-14T61004/25 Car Maintenance Shops: 207 St Overhaul: Equipment for Car HVAC Repair & Maintenance $2.24 Jun-14T60413/06 Station Accessibility (ADA): ADA: Kingsbridge Rd / Concourse $24.45 Jul-14T60412/89 Station Component Investments: Station Painting at Component Locations: 3 Loc / Brighton $3.09 Jul-14T60412/77 Station Component Investments: Station Components: 3 Stations / Brighton $6.92 Jul-14T61606/03 Asbestos Abatement: I/Q Asbestos/Lead Air Monitoring - 2010 $7.52 Jul-14S60701/02 SIR: Structures: Lemon Creek Culvert Bridge $3.45 Jul-14T60412/B9 Station Component Investments: Street Stairs:Franklin Av / Eastern Parkway (S2/S4) [SBMP] $1.19 Jul-14T60412/B8 Station Component Investments: Street Stairs:Franklin Av / Eastern Parkway (S1/S3) [SBMP] $1.19 Jul-14T60412/12 Station Rehabilitation: Smith-9 Streets / Prospect Park Line $32.31 Jul-14T50904/02 Power Distribution Facilities: Duct Reconstruction: Ryders Alley - Front St / 8AV (Phase 2) $21.36 Jul-14S60701/01 SIR: Passenger Stations: Station Structural Repairs, 8 Locations $15.51 Jul-14T60412/01 Station Component Investments: 4 Avenue / Culver $12.53 Jul-14T61607/25 Depot Rehabilitation: AFC Office Upgrades at 2 Depots - FP and QV [SBMP] $1.76 Jul-14T50803/07 Signal Systems: Signal Key-By Circuit Mod: Phase 2 $29.84 Jul-14T50414/03 Intermodal/Transfer Facilities: Myrtle-Wyckoff Intermdl Facl -Signal Wrk $0.68 Aug-14T60803/03 Signal Systems: Church Ave Interlocking & Automatics / Culver $210.61 Aug-14T51203/06 New Depots & Facilities: Clara Hale Depot: Reconstruction $252.87 Aug-14T61602/19 Misc: Stations: Help Point: Allerton Av & Burke Av /White Plains Rd [SBMP] $1.43 Aug-14T51602/04 Owner-Controlled Insurance Program: 2006-2009 Owner-Controlled Insurance $132.35 Aug-14T61607/02 Information Technology: Jay St Systems Phase 1: Signal Facility at 14 St / 8 Ave $5.83 Aug-14T51204/30 Depot Rehabilitation: Ulmer Park Depot: In-Ground Lift / Floor Replacement [SBMP] $1.15 Aug-14U50302/05 Depot Rehabilitation: Eastchester Depot: Relocate Fuel Tanks & Bus Washers $12.88 Aug-14T51203/07 Depot Rehabilitation: ENY Depot Rehab $17.19 Sep-14T60502/92 Mainline Track Rehabilitation: Mainline Track Replacement 2014 / 7th Avenue $4.68 Sep-14T60502/89 Mainline Track Rehabilitation: Mainline Track Replacement 2014 / Jerome $8.77 Sep-14T61204/05 Depot Equipment And Machinery: IVN For 5 Depots $2.60 Sep-14T60404/07 Communications Cable And Equipment: Passenger Station LAN: 10 Stations - Partial Systems $2.00 Sep-14T60412/88 Station Component Investments: Station Ventilators: Montrose Avenue / Canarsie [SBMP] $1.31 Sep-14T61607/02 Information Technology: Jay St Systems Ph1: Work Experience Program (WEP) Facility $4.22 Sep-14T60412/C1 Station Component Investments: Station Ventilators:Clin-Wash Avs (E of Wvrly) [SBMP] $1.15 Sep-14T60503/18 Mainline Track Switches: Mainline Track Switches 2013 at Jamaica $13.79 Sep-14
IV-18

ACEP Project
Project Amount ($ in Mil)
Planned Completio
n Date
NYCT 2014 - 2017 Completions
T60902/09 Substation Enclosures (IRT-BMT): Roof and Enclosure: E. 180th Street, Morris Park [SBMP] $2.52 Sep-14T40803/CI Mainline Track Rehabilitation: SSI Bergen: I/H Track Wrap-Up $1.80 Sep-14U50302/18 Misc: Bus Projects: Security Upgrade: Eastchester and LaGuardia $6.77 Sep-14T60502/36 Mainline Track Rehabilitation: Mainline Track Replacement 2012 at 6th Avenue $18.48 Sep-14E61402/01 Security Program: Perimeter Protection: Penn Station-Phase II $7.66 Oct-14T60703/07 Line Structure Overcoating: Rockaway Boulevard - Hammels Wye / Rockaway $4.48 Oct-14ET0802/09 Signal Systems: Sandy Repairs: Signals in the Greenpoint Tube $5.41 Oct-14T60703/04 Elevated Structure Rehabilitation: Viaduct Structure Rehab: Rockaway & Far Rockaway $42.09 Oct-14T61302/05 Rubber-Tired Vehicles: Purchase 80 Non-Rev Vehicles 2013 $13.94 Oct-14T60703/03 Elevated Structure Rehabilitation: Culver Viaduct Rehabilitation Phase 3 - Underside $50.64 Oct-14U60302/27 Depot Equipment And Machinery: Depot Equipment: Bus Washers at Baisley Park & JFK SBFP $3.28 Oct-14T60412/B3 Station Component Investments: Station Components: Greenpoint Avenue / Crosstown $2.79 Oct-14T60412/B4 Station Component Investments: Station Painting at Components Locations:2Locs - North/Xtown $1.38 Oct-14T60502/09 Welded Rail: Continuous Welded Rail - 2012 $9.05 Oct-14T60412/A1 Station Component Investments: Street Stairs: 39 Avenue / Astoria (S1/S2) [SBMP] $1.27 Oct-14T60412/99 Station Component Investments: Street Stairs: Ditmars Blvd / Astoria (S1/S4) [SBMP] $1.04 Oct-14T60412/B2 Station Component Investments: Station Components: 21 St / Crosstown $6.27 Oct-14T60902/10 Misc: Power: Substation Hatchways: 5 Locations [SBFP] $2.81 Oct-14T61203/07 Depot Rehabilitation: New Elevator at MAC #9 at Queens Village Bus Depot[SBMP] $0.68 Nov-14ET0802/16 Signal Systems: Sandy Repairs: Signal Equip Repl - Montague Tube $31.04 Nov-14T60803/04 Signal Systems: Repl Solid State Sig Equip - 2 Locs $0.48 Nov-14T41203/FH New Depots & Facilities: Charleston Depot: Decommission Retention Basin [SBMP] $0.93 Nov-14ET1602/08 Facilities: Sandy Repairs: Facilities Restoration (Vehicle Portion) $3.78 Nov-14T60412/A5 Station Component Investments: Station Ventilators: Ph 5 - 4 Loc / QBL, BCT, NOS, BW7 $5.50 Nov-14T61204/27 Bus Washers: 4 Bus Washers-2 Depots/Flatbush&Ulmer Pk [SBFP] $4.51 Nov-14T61004/08 Shop Equipment And Machinery: Heavy Shop Equipment Replacement $12.88 Nov-14T60414/02 Station Rehabilitation: Station Entrance Railings $4.02 Dec-14T61602/23 Misc: Stations: Help Point: 2 Stations / Flushing [SBMP] $1.61 Dec-14T61602/22 Misc: Stations: Help Point: 2 Stations / White Plains Road & Flushing [SBMP] $1.55 Dec-14T61203/06 Depot Rehabilitation: Pavement Repairs at Jackie Gleason Bus Depot [SBMP] $1.36 Dec-14T60502/80 Mainline Track Rehabilitation: Mainline Track Replacement 2013 at Flushing $19.08 Dec-14U50302/19 Autos, Trucks & Service Vehicles: Service Vehicles MTA Bus $4.00 Dec-14T60502/53 Mainline Track Rehabilitation: Mainline Track Repl 2012: Gaston Ave-Straiton Ave / Rockaway $10.61 Dec-14T61004/21 Yard Switches: Yard Switches - 2014 $2.11 Dec-14T61004/15 Yard Track Rehabilitation: Yard Track - 2014 $1.50 Dec-14T61607/02 Information Technology: Jay St Sys Ph1:PBX Switch Furnish & Install $7.97 Dec-14T60502/14 Mainline Track Rehabilitation: Track Force Account - 2014 $35.00 Dec-14S50701/12 SIR: Line Equipment: Signl Sys Mod: St.George-Tottnvil/Wrap-Up $1.19 Dec-14T60502/13 Mainline Track Rehabilitation: Mainline Track Replacement - 2014 Design and EFA $6.04 Dec-14T61602/21 Misc: Stations: Help Point: Ave I & Bay Pkwy / Culver [SBMP] $0.95 Dec-14T61602/20 Misc: Stations: Help Point: Ave N & Ave X / Culver [SBMP] $1.60 Dec-14T50404/01 Fare Control Modernization: Smart Card Implementation Study $5.40 Dec-14T60503/05 Mainline Track Switches: Mainline Switches - 2014 Design and EFA $7.47 Dec-14T60414/04 Misc: Stations: Scrubber Room Drainage - 2 Locations $3.23 Dec-14U50302/23 Misc: Bus Projects: Bus Time Customer Information System: MTA Bus -- Misc Items $1.74 Dec-14T60703/02 Line Structure Rehabilitation: Rehab Emergency Exits: 75 Locs $18.00 Dec-14ET0502/07 Mainline Track Rehabilitation: Sandy Repairs: Track Components in the Greenpoint Tube $12.94 Jan-15ET0602/10 Tunnel Lighting Rehabilitation: Sandy Repairs: Tunnel Lighting Greenpoint Tube $34.00 Jan-15ET0902/10 Power Distribution Facilities: Sandy Repairs: Power/Cable/Ducts: Greenpoint Tube $16.19 Jan-15T60407/03 Escalator Replacement: 2 Escalators Roosevelt Av / QBL $11.16 Jan-15T60902/03 Misc: Power: Substation Hatchways: 6 Locations $3.97 Jan-15T60703/15 Line Structure Overcoating: Dyckman Street - 215 Street / Broadway-7th Avenue $14.01 Jan-15T61606/05 Fire Protection: Sprinkler & Alarm Systems: Phase 2 / 3 Locations $6.92 Jan-15T61302/06 Rubber-Tired Vehicles: Purchase 65 Non-Rev Vehicles $11.50 Jan-15T60502/94 Mainline Track Rehabilitation: Mainline Track Replacement 2014 / Flushing $5.98 Jan-15U60302/08 Depot Rehabilitation: New Apron - JFK Depot $6.50 Jan-15U50302/98 Capital Program Management: Misc CONSTRUCTION Consultant Mgmt Svces $5.05 Jan-15T60904/06 Power Distribution Facilities: CBH 146 Prospect Park / Brighton $6.63 Jan-15T51605/01 Capital Program Management: MTA-Indep Engineering Consultant 2009-2010 $10.52 Jan-15T60502/85 Mainline Track Rehabilitation: Mainline Track Replacement 2014 / Concourse $3.38 Feb-15T40404/M6 Fare Control Modernization: AFC System Wrap-Up $8.10 Feb-15T50703/22 Elevated Structure Rehabilitation: Steel Repair and Abutments: La Salle - 133 St / Bway-7th Ave $9.67 Mar-15
IV-19

ACEP Project
Project Amount ($ in Mil)
Planned Completio
n Date
NYCT 2014 - 2017 Completions
T60703/22 Subway Tunnel Rehabilitation: 122 St &135 St Portal Repairs / Broadway-7th Avenue $16.84 Mar-15ET0902/08 Power Distribution Facilities: Sandy Repairs: Power Cable & Ducts Montague Tube $78.99 Mar-15ET0903/02 Power Distribution Facilities: Sandy Mitigation: Power Cable & Ducts Montague Tube $58.26 Mar-15ET0602/07 Tunnel Lighting Rehabilitation: Sandy Repairs: Tunnel Lighting Montague Tube $32.84 Mar-15ET0502/06 Mainline Track Rehabilitation: Sandy Repairs: Track (Montague Tube) $27.89 Mar-15ET0902/09 Substation Equipment (IRT-BMT): Sandy Repairs: Two Substations (Montague Tube) $1.36 Mar-15ET0902/07 Power Distribution Facilities: Sandy Repairs: 3 CBHs (Montague Tube) $10.86 Mar-15T51204/31 Depot Rehabilitation: Concrete Floor Replacement @ Manhattanville Depot [SBMP] $1.33 Mar-15ET0502/08 Mainline Track Switches: Sandy Repairs: Mainline Switches Montague Tube $3.30 Mar-15ET0602/09 Ventilation Facilities: Sandy Repairs: 1 Fan Plant (Montague Tube) $5.11 Mar-15ET0602/08 Pumping Facilities: Sandy Repairs: 2 Pump Room (Montague Tube) $9.41 Mar-15T61604/03 Computer Hardware & Communications: Enterprise Securty Network Infrastructure $10.39 Mar-15T60412/95 Station Component Investments: Station Ventilators: Ph 6 - 5 Loc / Upper Manhattan & Bronx $6.55 Mar-15T60503/22 Mainline Track Switches: Mainline Track Switches 2014 / White Plains Road $17.10 Mar-15U50302/04 Depot Rehabilitation: Purchase Emergency Generators: 2 Depots $4.30 Mar-15U50302/20 Depot Equipment And Machinery: Depot Equipment $1.16 Mar-15E61404/05 Security Program: 2011-TSG: Electronic Security - URT Phase 2 $32.00 Mar-15T60803/04 Signal Systems: Repl Solid State Sig Equip - 6 Locs $10.43 Mar-15T60302/ Radio & Data Communication: On-Board Audio Visual (OBAV) PILOT: 200 Buses $1.56 Apr-15ET0502/14 Mainline Track Rehabilitation: Sandy Repairs: Track (Steinway Tube) $6.11 Apr-15T61605/04 Capital Program Management: Independent Eng'g Consultant 2010-2014 $19.48 Apr-15T60806/19 Station Communication Rooms: Communication Room Waterproofing:14 Locations $14.19 Apr-15T60502/84 Mainline Track Rehabilitation: Mainline Track Replacement 2014 / 8th Avenue $12.76 Apr-15T60502/16 Welded Rail: Continuous Welded Rail - 2014 $18.44 Apr-15ET0602/21 Pumping Facilities: Sandy Repairs: Pump Room Steinway Tube FLS $12.17 Apr-15T60902/11 Substation Enclosures (IRT-BMT): Substn Roof and Enclosure: Secor / Dyre; Astor Pl / WPR $5.11 Apr-15ET0602/12 Ventilation Facilities: Sandy Repairs: 1 Fan Plant BCT (Greenpoint Tube) $9.70 Apr-15ET0602/11 Pumping Facilities: Sandy Repairs: Pump Room (54 Av-Vernon Blvd) Greenpoint Tube $5.25 Apr-15T60803/22 Maintenance Of Way: Duct Rehabilitation & Negative Cable: Steinway / Flushing $47.56 Apr-15T61004/26 Car Maintenance Shops: East 180 St Maintenance Shop: Facility Waterproofing $5.16 Apr-15T60703/21 Capital Program Management: Structural Repairs: Steinway Tube $15.00 Apr-15T50904/14 Misc: Power: Cathodic Protection Manhole Relocation at Queensbridge Park $3.50 Apr-15T60412/84 Station Component Investments: Delancey St-Essex St / Nassau $1.38 Apr-15T60502/83 Mainline Track Rehabilitation: Mainline Track Replacement 2014 / 4th Avenue $5.07 May-15T60302/27 Radio & Data Communication: On-Board Audio Visual System (OBAV) $26.44 May-15T60503/21 Mainline Track Switches: Mainline Track Switches 2014 / Eastern Parkway $6.19 May-15T60502/88 Mainline Track Rehabilitation: Mainline Track Replacement 2014 / Eastern Parkway $4.78 May-15ET2301/02 Direct Recovery Expense: Perimeter Protection: Livingston Plaza $0.50 May-15ET0403/08 Misc: Stations: Sandy Mitigation: Lower Mhttn Hatch Installation(SBFP) $1.33 May-15T61607/07 Security: Perimeter Hardening: RCC & 130 Livingston $12.00 May-15EM0502/10 MN: Sandy Repairs: Power Infrastr Restoration-Remote Terminal Houses-Sandy $1.28 May-15U50302/20 Depot Equipment And Machinery: Replace Chassis Wash and Oil Water Separator: JFK Depot SBFP $2.00 May-15E61404/ Security Program: Electronic Security: Wall St Station/Clark St Line (IESS) $0.80 May-15T60412/B7 Station Component Investments: Station Components: 2 Locs / BWY $6.92 May-15T60412/83 Station Component Investments: Station Components: 2 Locations / 4 Av $9.03 May-15T60502/91 Mainline Track Rehabilitation: Mainline Track Replacement 2014 / Pelham $20.81 Jun-15T60502/90 Mainline Track Rehabilitation: Mainline Track Replacement 2014 / Lexington Ave & 42 Shuttle $13.56 Jun-15T60503/23 Mainline Track Switches: Mainline Track Switches 2014 / Queens Blvd $6.12 Jun-15T60502/86 Mainline Track Rehabilitation: Mainline Track Replacement 2014 / Queens Blvd $14.70 Jun-15ET0402/11 Facilities: Police: Sandy Repairs: District Office 34: Stillwell Terminal $1.16 Jun-15U50302/05 Depot Rehabilitation: Eastchester Depot: Purchase AFC Equipment $0.40 Jun-15T60502/93 Mainline Track Rehabilitation: Mainline Track Replacement 2014 / Brighton $28.41 Jun-15E61404/02 Security Program: Electronic Security: 10TSG Boro Hall-Court St $22.08 Jun-15T60302/18 Fare Control Modernization: Replace Integrated Farebox Unit (IFU) Components, Phase 2 $21.94 Jun-15ET0402/10 Consolidated Employee Facilities:Subways: Sandy Repairs: Stillwell Terminal Employee Facilities $12.01 Jun-15T60502/87 Mainline Track Rehabilitation: Mainline Track Replacement 2014 / White Plains Road $19.96 Jun-15T60803/12 Maintenance Of Way: Signal Control Modifications Phase 5 $10.00 Jun-15T61004/04 Car Maintenance Shops: 207 St Maintenance Shop: DC Power Upgrade $14.73 Jul-15T60803/11 Communication-Based Train Control: CBTC Test Track, Phase 2 / Culver $84.90 Jul-15T50803/23 Communication-Based Train Control: CBTC Test Track Pilot/ Culver Line $16.01 Jul-15T60902/04 Substations (IND): Cabling: Central Substation / 6th Av - Phase 2 $15.00 Jul-15T60414/03 Misc: Stations: Water Condition Remedy - 2013 $2.86 Aug-15
IV-20

ACEP Project
Project Amount ($ in Mil)
Planned Completio
n Date
NYCT 2014 - 2017 Completions
T61602/01 Capital Revolving Fund: Capital Revolving Fund - 2010 $5.00 Aug-15T60412/06 Station Component Investments: Pelham Bay Park / Pelham $6.61 Aug-15T60412/07 Station Renewal: Buhre Avenue / Pelham $24.69 Aug-15T60412/08 Station Renewal: Middletown Road / Pelham $27.75 Aug-15T60412/09 Station Renewal: Zerega Avenue / Pelham $22.82 Aug-15T60412/10 Station Renewal: Castle Hill Avenue / Pelham $26.80 Aug-15T60412/22 Station Component Investments: Brick Arch Repair: 168 Street & 181 Street / Broadway-7th Av $65.33 Aug-15T60414/04 Misc: Stations: Scrubber Room Drainage: 191 & 181 Sts / Broadway-7th Avenue $0.48 Aug-15T60412/74 Station Component Investments: 157 Street / Broadway-7th Ave $3.39 Aug-15T60806/22 Misc: Stations: Help Point Infrastructure: 168 St / BW7 $0.86 Aug-15T60703/13 Line Structure Rehabilitation: Structure Repairs / Dyre Avenue Line $9.66 Aug-15T60302/26 Misc: Bus Projects: Integrated Asset Management Planning System (EAM) $7.00 Aug-15T61302/01 Rubber-Tired Vehicles: Purchase 87 Non-Revenue Vehicles - 2011 $13.42 Aug-15E61404/03 Security Program: Electronic Security: 10TSG Atlantic/Pacific $21.49 Aug-15T60412/69 Station Component Investments: Queensboro Plaza / Flushing $0.93 Aug-15T60412/96 Station Component Investments: 2 Locations / Nostrand $7.36 Aug-15T60412/B1 Station Component Investments: 3 Locations / Crosstown $0.76 Aug-15T61607/23 Facilities: Sidewalk Shed: Livingston Plaza [SBMP] $1.16 Sep-15T60703/24 Station Structural Remediation: Structural Steel Repair, Lower Level, 9th Ave, West End Ln $14.99 Sep-15T61606/01 Asbestos Abatement: Asbestos Abatement: Priority 7 $5.00 Sep-15T60412/80 Station Component Investments: 103 Street / Lexington $10.41 Sep-15T60412/92 Station Component Investments: New Lots Av Station / New Lots Line $2.68 Oct-15T61606/08 Groundwater And Soil Remediation: Consult: UST & Remed (2011) $6.00 Oct-15T61204/10 Depot Equipment And Machinery: HVAC Upgrades - Yukon Depot $16.95 Oct-15T60703/09 Line Structure Overcoating: Portal - East 180 Street / White Plains $32.01 Oct-15T61607/09 Roofing Repair & Replacement: DOS Roof Replacement Phase 3 $12.67 Oct-15T60603/03 Ventilation Facilities: Vent Plant: Mulry Square / 8AV & BW7 $71.81 Oct-15T60806/20 Station Communication Rooms: Hydrogen Gas Ventilation:19 Communications Rooms $6.33 Oct-15S60701/08 SIR: Passenger Stations: Station Construction: Arthur Kill $27.41 Oct-15U50302/04 Depot Rehabilitation: Install / Purchase Emergency Generators: 6 Depots $3.30 Oct-15ET0802/01 Signal Systems: Sandy Repairs: South Ferry Interlocking $1.70 Oct-15T61302/02 Work Train & Special Equipment: 54 Flat Cars $35.38 Oct-15T60412/90 Station Component Investments: Station Components: 5 Locations / Fulton $12.82 Nov-15U60302/17 New Buses: 45 Standard Buses $23.78 Nov-15T60806/28 Public Address/Customer Info Systems: Integrated Service Information & Mngmnt B-Div: Module 1 GRP1 $12.32 Nov-15ET0402/ Fare Marketing/Distribution Equipment: Sandy Repairs: Purchase and Install AFC Equipment $0.01 Dec-15EM0302/02 MN: Sandy Repairs: Right of Way Restoration: Various Locations - Sandy $8.00 Dec-15T60502/21 Mainline Track Rehabilitation: Mainline Track Replacement 2011 at Dyre Av $1.08 Dec-15T60413/10 Station Accessibility (ADA): ADA: 23 Street / Lexington $21.53 Dec-15T61004/09 Yard Lighting: Yard Lighting: (Jerome, Pelham) $14.61 Dec-15U60302/19 New Buses: 75 Articulated Buses $61.57 Dec-15T60806/21 Communications Cable And Equipment: Passenger Station LAN: 30 Stations $28.09 Dec-15T60703/06 Demolition Of Abandoned Structures: Demolition of Abandoned Structures - Various - Ph1 $15.15 Dec-15T60414/07 Station Signage: Station Signage $4.83 Dec-15T61606/05 Fire Protection: Spr & Alarm Sys, Ph 2: 14 St /8 Av Fire Sprinklr & #2 Egres $6.97 Dec-15T60806/04 Public Address/Customer Info Systems: PA/CIS: 43 Stations: Install Cable $47.32 Dec-15T61607/05 Consolidated Employee Facilities:Subways: RTO Fac: Chambers St / Nassau Loop $7.07 Dec-15T60502/15 Mainline Track Rehabilitation: Mainline Track Replacement - 2015 $2.00 Dec-15T60503/06 Mainline Track Switches: Mainline Switch Replacement 2015 $2.90 Dec-15T61004/16 Yard Track Rehabilitation: Yard Track - 2015 $0.06 Dec-15T61004/22 Yard Switches: Yard Switches - 2015 $0.65 Dec-15T60703/20 Elevated Structure Rehabilitation: Trackway Stabilization / Franklin Shuttle $3.21 Jan-16T60904/04 Power Distribution Facilities: CBH 74 Havermeyer & 74A Bridge / Jamaica $19.04 Jan-16T60904/05 Power Distribution Facilities: Rehab CBH 403 Vanderbilt / Flushing $15.60 Jan-16U50302/16 Misc: Bus Projects: Additional Fueling Capacity: Baisley Park, JFK, LaGuardia $3.53 Jan-16T61004/07 Car Maintenance Shops: Shop Repairs/ Upgrades: Pitkin and Concourse $18.00 Jan-16T60412/82 Station Component Investments: Station Components: 49 Street / Broadway $8.77 Jan-16T60412/60 Station Component Investments: Station Components: 6 Stations / Jamaica $39.82 Jan-16T60412/32 Station Renewal: Ozone Park-Lefferts Blvd / Liberty $7.99 Feb-16T60101/01 New Subway Cars: 103 A Division Cars - R188 Option $272.39 Feb-16T60404/08 Communications Cable And Equipment: Passenger Station LAN: 20 Stations $19.97 Feb-16T51204/13 Depot Equipment And Machinery: Depot Equipment 2009 $9.88 Feb-16
IV-21

ACEP Project
Project Amount ($ in Mil)
Planned Completio
n Date
NYCT 2014 - 2017 Completions
T60803/05 Communication-Based Train Control: CBTC Flushing: 370 R-142A Conversions $224.78 Feb-16T60413/12 Station Accessibility (ADA): ADA: Ozone Park-Lefferts Blvd / Liberty $24.65 Feb-16T61602/02 Capital Revolving Fund: Capital Revolving Fund - 2011 $5.00 Mar-16T60703/19 Line Structure Overcoating: Broadway Junction - New Lots Avenue / CNR $25.59 Mar-16T60412/50 Station Renewal: Van Siclen Avenue / New Lots $11.37 Mar-16T60412/45 Station Renewal: Pennsylvania Avenue / New Lots $11.20 Mar-16T60412/46 Station Renewal: Rockaway Avenue / New Lots $10.49 Mar-16T60412/47 Station Renewal: Saratoga Avenue / New Lots $11.58 Mar-16T60412/49 Station Renewal: Sutter Avenue-Rutland Road / New Lots $11.98 Mar-16T61004/28 Car Maintenance Shops: Car Washer Repairs at Coney Island Yard $6.43 Mar-16T60412/48 Station Renewal: Junius Street / New Lots $12.44 Mar-16EM0502/09 MN: Sandy Repairs: Power Infrastructure Restoration-HRLB Facility Houses-Sandy $5.12 Apr-16T61607/08 Maintenance Of Way: Emergency Generator at Livingston Plaza $10.39 Jun-16T60703/ Line Structure Overcoating: Line Structure Overcoating: Portal - King's Hwy $28.73 Jun-16T60703/ Line Structure Overcoating: Line Structure Overcoating: King's Hwy - West 8th St $21.89 Jun-16ET0802/07 Signal Systems: Sandy Repairs: Signals: 200 St - 207 St / 8th Ave $3.08 Jun-16T60302/25 New Buses: 300 Express Buses $188.88 Jun-16T60302/15 New Buses: 256 Articulated Buses $245.50 Jun-16T60407/04 Elevator Replacement: Replace 11 Hydraulic Elevators $27.84 Jul-16T60703/16 Subway Tunnel Rehabilitation: Priority Repairs: 4th Avenue $14.82 Jul-16T60806/13 Antenna Cable Replacement: Antenna Cable Upgrade/Replacement Ph 1 $12.89 Jul-16T60302/24 New Buses: 324 Standard Buses (Nova) $163.32 Jul-16T50302/18 New Buses: 90 Standard Buses (Nova) $52.42 Jul-16T60806/08 Communications Systems: VHF Radio System Upgrade $220.59 Jul-16T61004/01 Car Maintenance Shops: HVAC Repair and Maintenance Project for DCE Facilities, Ph2 $53.59 Jul-16T60302/28 New Buses: 276 Standard Buses (New Flyer) $152.49 Jul-16T51204/28 Depot Rehabilitation: Ulmer Park Depot: Mezzanine Extension - [SBMP] $0.33 Jul-16
EM0502/08 MN: Sandy Repairs: Power Infrastructure Restoration-Substations - Sandy $39.40 Aug-16T61606/06 Fire Protection: Fire Alarm: 207 Street Overhaul Shop $5.12 Aug-16T61204/29 Radio & Data Communication: Construct Bus Command Center- DOB $54.48 Aug-16T60803/18 Signal Systems: Signal Key-By Circuit Mods: Phase 3 $15.00 Aug-16ET1002/10 Power Distribution Facilities: Sandy Repairs: Power Cable Replacement - 207th St Yard $0.60 Aug-16U60302/25 Radio & Data Communication: Construct Bus Command Center - MTA Bus $8.73 Aug-16T60412/31 Station Renewal: 104 Street / Liberty $13.95 Sep-16T60412/34 Station Renewal: Rockaway Boulevard / Liberty $14.23 Sep-16T60412/33 Station Renewal: 111 Street / Liberty $13.42 Sep-16T60604/03 Pumping Facilities: Pumps: 4 Locations / Pelham - Jerome - Lenox $17.53 Sep-16T60412/36 Station Renewal: 80 Street / Liberty $14.15 Sep-16T60412/35 Station Renewal: 88 Street / Liberty $13.84 Sep-16ET1002/11 Power Distribution Facilities: Sandy Repairs: Power Cable Replace - Coney Island Yard $0.82 Sep-16EM0502/06 MN: Sandy Repairs: Power Infrastructure Restoration-PH1- Sandy $70.71 Oct-16EM0402/05 MN: Sandy Repairs: Comm & Signal Infrastructure Restoration Phase 1 - Sandy $65.40 Oct-16ES0702/14 SIR: Track: Sandy Repairs: St. George Interlocking $108.01 Oct-16T60603/04 Ventilation Facilities: Vent Plant: 46th Street-Northern Blvd / Queens Blvd Line $86.10 Oct-16S60701/03 SIR: Track: St. George Interlocking $14.21 Oct-16T50803/08 Communication-Based Train Control: CBTC Flushing Line $384.92 Nov-16T60803/06 Communication-Based Train Control: CBTC Flushing: Additional Support Costs $152.76 Nov-16T60803/06 Communication-Based Train Control: CBTC Flushing: Equipment Removals $12.00 Nov-16T60806/29 Public Address/Customer Info Systems: Integrated Service Information & Mngmnt B-Div: Module 1 GRP2 $19.14 Nov-16T60806/30 Public Address/Customer Info Systems: Integrated Service Information & Mngmnt B-Div: Module 1 GRP3 $11.72 Nov-16T60803/14 Signal Systems: Roosevelt Interlocking / Queens Blvd $103.57 Dec-16T61606/11 Fire Protection: Fire Alarm Systems: 16 DOS Locations $39.38 Dec-16T50803/19 Communication-Based Train Control: CBTC CNR: Equip R156 Locomotives $1.22 Dec-16T61607/15 Consolidated Employee Facilities:Subways: 9 Locations / Crosstown $7.51 Dec-16T60101/02 New Subway Cars: 300 B Division Cars - R179 $735.56 Jan-17T60404/01 Fare Control Modernization: AFC Replacement, Phase 2: Electronic Boards $30.00 Jan-17T61004/10 Yard Rehabilitation: Yard CCTV, Phase 2 $17.38 Feb-17T61607/17 Facilities: Livingston Plaza: Elevators, Roof, Facade $21.68 Feb-17S60701/05 SIR: Power: New Power Substation: Prince's Bay $26.19 Feb-17T60412/ Station Component Investments: 7 Locations / 8th Avenue $25.19 Mar-17T51605/21 Materiel: Concrete Batch Plant Inspection $1.15 Apr-17T51605/24 Capital Program Management: Concrete Cylinder Testing $0.72 Apr-17
IV-22

ACEP Project
Project Amount ($ in Mil)
Planned Completio
n Date
NYCT 2014 - 2017 Completions
T61602/03 Capital Revolving Fund: Capital Revolving Fund - 2012 $5.00 Apr-17T60803/10 Signal Systems: 2 Interlockings: Union Turnpike & 71 Av $310.74 Apr-17T60806/04 Public Address/Customer Info Systems: PA/CIS: 43 Stns: Furnish-Install Cabinets $18.64 Apr-17T50806/15 Public Address/Customer Info Systems: PA/CIS: 44 Stns: Furnish-Install Cabinets $9.76 Apr-17T60407/05 Elevator Replacement: 7 Hydraulic Elevators / Lexington $25.94 Apr-17T61004/27 Car Maintenance Shops: Car Washer Repairs: 3 Yards $14.20 May-17T60602/03 Tunnel Lighting Rehabilitation: 36 St To Jackson-Roosevelt / Queens Blvd $52.43 Jun-17T60803/24 Communication-Based Train Control: CBTC: Equipment Supplier Interoperability $1.23 Jun-17T61605/13 Capital Program Management: Boring Services: Manhattan & Bronx $2.03 Jul-17T61605/14 Capital Program Management: Boring Services: Bklyn, Qns & SI $1.69 Jul-17T61605/15 Capital Program Management: Test Pits Contract (2014) $5.56 Jul-17T60806/10 Information Technology: PBX Upgrade, Phase I $23.16 Jul-17T60803/13 Signal Systems: Dyre Avenue Line Signals $226.19 Jul-17T60413/11 Station Accessibility (ADA): ADA: Phase 2: 57 Street - 7 Avenue / Broadway $38.38 Aug-17T60414/05 Misc: Stations: Access Improvements: Grand Central / LEX $20.26 Aug-17T60703/11 Water Conditions Remedy: Alleviate Flooding At 6 Locs: Manhattan $48.69 Sep-17T60603/05 Ventilation Facilities: Replace Vent Controls: 26 Locations $15.36 Oct-17T60413/04 Station Accessibility (ADA): ADA: Platform Gap Retrofit Phase 2 - 14 Stations $5.70 Nov-17T61204/28 Bus Washers: 4 Bus Washers at 2 Depots (East NY & Yukon) [SBFP] $4.84 11/31/14
IV-23

Project # Project
Project Amount ($ in
Mil)Planned
Completion Date
PN8K MORRIS PARK ENVIRONMENTAL STUDY $8.58 Jan-14PNVC PENN STA - EMP FAC YARDS /BLDG/ESCALATOR $.52 Jan-14PNBH WOODHAVEN BLVD. BRIDGE $11.00 Feb-14PNYD WHEEL SPUR YARD $13.01 Feb-14PN28 FOREST HILL STATION-RAMP $2.00 Mar-14PNAE THIRD RAIL SYSTEM-2000 MCM CABLE $2.5M Mar-14PNVB PENN STA - THIRD RAIL & SIGNAL $7.3M Mar-14PN70 FLATBUSH SUBSTATION UPGRADE Aug-14PNZN LIC SUBSTATION RESTORATION $1.3M Apr-14PNAN THIRD RAIL FEEDER CABLE UPGRADE $2.5M May-14PNTT MLC-ELLISON AVENUE BRIDGE $1.5M May-14PNLF CENTRALIZED TRAFFIC CONTROL Oct-14PN27 NEW ATLANTIC TERMINAL ELEVATOR $3.4M Aug-14PNC1 F CIRCUIT BREAKER HOUSE $7.2M Aug-14PNFT LOCUST MANOR STATION IMPROVEMENTS $.6M Aug-14PNAC SIGNAL POWER MOTOR GENERATOR REPLACEMENT $2.0M Sep-14PNAH Composite Third Rail $10.9M Sep-14PNAK SIGNAL POWER LINE REPLACEMENT $3.0M Sep-14PNBG BRIDGE PAINTING PROGRAM $5.4M Oct-14PNYB HILLSIDE FACILITY BLDG REHAB (ROOF) $3.4M Oct-14PNAJ ATLANTIC AVE TUNNEL LIGHTING $7.0M Nov-14PNTF CONSTRUCTION EQUIPMENT $7.0M Nov-14PNAL POWER POLE REPLACEMENT $3.0M Dec-14PNL4 IMPROVED RADIO COVERAGE INITIATIVE $10.3M Dec-14PNTE 2014 ANNUAL TRACK PROGRAM $50.9M Dec-14PNTN ROW-TRACK STABILITY /RETAINING WALLS $1.10 Jan-15PNU1 WYANDANCH PARKING FACILITY $29.00 Jun-15PNYC HILLSIDE MAINTENANCE FACILITY $3.4M Jan-15PNYK MONTAUK YARD IMPROVEMENTS Apr-15PNAD SUBSTATION PILOT WIRE & RELAY REPLACEMEN $2.0M Feb-15PNAA REPLACE HILLSIDE & KEW GARDENS SUBS. $25.5M Jun-15PNN4 YAPHANK LANDFILL REMEDIATION $2.0M Mar-15PNAM NEW SUBSTATIONS Apr-15PNAP NEGATIVE REACTOR UPGRADE $4.0M May-15PNBK 150TH STREET BRIDGE REHAB $21.0M Sep-15PNBP ERT FIRE & LIFE SAFETY $16.6M May-15PNUB MASSAPEQUA STATION PLATFORM REPLACEMENT $20.5M Aug-15PNUF METS/WILLETS PT STATION RENOVATION $.4M May-15PNAG THIRD RAIL SYSTEM - PROTECTION BOARD $9.2M Jun-15PNBC COLONIAL RD IMPROVEMENT-BRIDGE REPLMNT $0.5M Sep-15PNBD BROADWAY BRIDGE REHABILITATION $4.8M Jun-15PNTL ROW-FENCING $8.0M Jun-15PNVA ERT FIRE & LIFE SAFETY $116.3M Jun-15PNTX 2ND MAIN LINE TRACK FARM TO KO $136.7M Aug-15PNBB BRIDGE PROGRAM $24.60 Nov-15PNL6 PENN STATION RADIO RETROFIT/ERT ANTENNA Sep-15PNV4 ESCALATOR REPLACEMENT PROGRAM $2.85 Nov-15PNYN NEW MID SUFFOLK ELECTRIC YARD $3.03 Sep-15PNLC SPEONK - MONTAUK SIGNALIZATION $73.00 Oct-15PN2E NEW ELEVATORS-FLUSHING MAIN STREET $16.4M Nov-15PNSM PTC DESIGN $9.5M Dec-15PNL1 FIBER OPTIC NETWORK $10.0M Jan-16
LIRR 2014 - 2017 Completions
IV-24

Project # Project
Project Amount ($ in
Mil)Planned
Completion Date
LIRR 2014 - 2017 Completions
PNL7 ATLANTIC AVE TUNNEL CABLE REPLACEMENT $4.8M Jan-16PNLB Signal Normal Replacement Program (2010) $15.0M Jan-16PNUH ELEVATOR REPLACEMENT PROGRAM $5.0M Jan-16PNTQ MLC-HICKSVILLE NORTH SIDING $2.3M May-16PNTV MASSAPEQUA POCKET TRACK $8.3M Mar-16PNTW COLONIAL RD IMPRO PROJ-POCKET TRK & DRAN $.6M Apr-16PNTG ATLANTIC BRANCH 1/2 TIES $2.8M Sep-16PNL2 PBX-WAYSIDE PHONE REPLACEMENT $9.1M Jul-16PNLA POSITIVE TRAIN CONTROL $327.2M Aug-16PNVL PENN STATION HVAC $11.0M Sep-16PNN6 SMITHTOWN VIADUCT REMEDIATION & DRAINAGE $.2M Dec-16PNLC SPEONK - MONTAUK SIGNALIZATION $38.1M Jan-17PNM4 PROTECT & WORK LOCO SPEC DEVELOPMENT $.1M Jan-17PNMA M9 PURCHASE FOR M3 REPLACEMENT $352.5M Jan-17PNTQ MLC-HICKSVILLE NORTH SIDING $2.3M Jan-17PNTS MLC - DIVIDE SUPERVISORY CONTROL & RTUS $2.3M Jan-17PNTT MLC-ELLISON AVENUE BRIDGE $1.5M Jan-17PNTU JAMAICA CAPACITY IMPROVEMENTS $301.7M Jan-17PNTX 2ND MAIN LINE TRACK FARM TO KO $47.7M Jan-17PNYL PORT WASHINGTON YARD RECONFIG $12.1M Jan-17PNZL LONG ISLAND CITY YARD RESTORATION $.2M Mar-17PNZC LONG BEACH BRANCH - SYS. RESTORE: SANDY $9.8M Apr-17PNAJ ATLANTIC AVE TUNNEL LIGHTING $7.0M Jun-17PNAQ REPLACEMENT OF PT. WASH SUBSTATION $4.5M Jun-17PNL2 PBX-WAYSIDE PHONE REPLACEMENT $9.1M Jul-17PNUC WANTAGH STATION PLATFORM REPLACEMENT $.2M Aug-17PNN4 YAPHANK LANDFILL REMEDIATION $2.0M Sep-17PNUE ESA/ GCT SUPPORT $7.1M Dec-17
IV-25

ACEP ProjectProject Amount
($ in Mil)
Planned Completion Date
M508-01-09 Customer & Employee Communications $ 7.96 Jan-2014M6010101/02 M8 Cars; 94 Cars Acceptance $ 82.72 Dec-2013M602-01-02 Park Avenue Tunnel Renewal 8.09$ Feb-2014M605-01-08 Replace 3rd Rail Sectionalizing Switches 1.26$ Mar-2014M603-03-01 West of hudson Track Program 21.18$ Jul-2014M603-02-03 Right Of Way Fencing 0.30$ Apr-2014M603-01-13 2013 Cyclical Track 12.67$ Jun-2014M603-03-03 Moodna/Woodbury Viaducts 9.24$ Jun-2014G514-03-03 2007 TSG Grand Central Terminal Emergency Generator 21.21$ Jun-2014M603-02-01 Replace Timbers Undergrade Bridges 3.68$ Jul-2014G514-03-05 Grand Central Terminal: Bollard Replacement Lex Av 1.99$ Aug-2014M602-02-06 New haven Line Station Improvements 36.75$ Aug-2014M604-01-04 Replace Field Code System-Mott Haven 1.76$ Aug-2014M404-01-07 Optimize Signal Relay Circuits 2.61$ Sep-2014M502-02-11 System Wide Vending Machines 0.57$ Sep-2014M604-01-11 PBX Equipment Upgrade 3.68$ Oct-2014M603-01-06 Cyclical Replacement of Insulated Joints 1.71$ Dec-2014M604-01-07 Refurbish/Replace Electrical Switch Mach 0.20$ Dec-2014M6060104 Port Jervis Yard Expansion 7.30$ Jan-2015M6030108 Drainage and Undercutting Improvements 14.00$ Jan-2015M6050102 Replace Switchgear M505-01-11 - M605-01-02 19.10$ Jan-2015M6030213 Catenary Painting/Rehabilitate 3.50$ Jan-2015M4020313 North White Plains Parking 41.80$ Apr-2015M6030203 Right-of-Way Fencing 0.30$ Mar-2014M6030114 2014 Cyclical Track Program 13.58$ Apr-2015M6030305 West of Hudson Replace / Renew 10.91$ May-2015M6080103 Railroad Protective Liability 4.15$ Jun-2015M6080104 Independent Engineer 6.73$ Jun-2015M6030211 Harlem River Lift Bridge-Cable & Breakers/Control System 32.89$ Jun-2015M6030205 Bridge Walkways Installation 0.92$ Jun-2015M6020202 Fordham Station Improvements 13.00$ Jul-2015M6040103 Replace Fiber / Communication 8.79$ Jul-2015M6050104 Replace Motor Alternators 8.00$ Jul-2015M6080101 Systemwide Lead / Asbestos Aba 0.50$ Aug-2015M6080102 Environmental Remediation 0.20$ Aug-2015M6030202 Renew / Replace Railtop Culver 2.40$ Aug-2015M6040106 Centralized Train Control /SCA 0.73$ Aug-2015M6020107 GCT Platform Improvements 3.10$ Sep-2015M6020108 GCT Utilities 27.39$ Sep-2015M5030206 Overhead Bridge Program-E of H 6.00$ Sep-2015M5020206 Station Building Rehabs. 11.31$ Dec-2015M6020204 Station Building Renewal / Net 4.95$ Dec-2015M6040109 Replace High Cycle Relays 0.63$ Dec-2015M6040102 West of Hudson Signal Improvem 67.60$ Dec-2015M6030204 DC Substation / Signal House 1.40$ Dec-2015M6030206 Remove Obsolete Facilities 3.00$ Dec-2015M6040107 Refurbish / Replace Electrical 0.20$ Dec-2015
PTCM6040101 Positive Train Control 206.28$ Dec-2015M6030212 Overhead Bridge Program - East 17.10$ Jan-2016M6050103 Harlem & Hudson Lines Power Im 35.74$ Feb-2016M6020302 Strategic Facilities 45.50$ Mar-2016M6030210 Replace / Repair Undergrade Br 29.20$ Mar-2016M6020105 GCT Leaks Remediation 13.00$ Apr-2016M6020106 GCT Elevator Renewal - Phase 4 7.50$ Jun-2016M6020101 GCT Trainshed / Park Avenue Tu 29.03$ Sep-2016M6030107 Rock Slope Remediation 7.00$ Sep-2016M6020110 GCT Recycling Facility 7.50$ Dec-2016M6030102 Turnouts: Mainline / High Spee 64.70$ Dec-2016M6060103 Other Shops / Yards Renewal 24.10$ Dec-2016
MNR 2014 - 2017 Completions
IV-26

ACEP Project
Project Amount ($ in
Mil)Planned
Completion Date
D503HH85 Upper Level Toll Plaza Deck $5.66 Feb-14D405BB43 Rehab Battery Parking Garage - Elevator $4.51 Apr-14D602TN82 Rehabilitate Orthotropic Deck - Phase B $25.37 Jun-14D607TN82 Paint - Bronx and Queens Approach Spans $42.24 Jun-14D601RK19 Seismic and Wind Study $5.40 Sep-14D604BB45 Replace Electrical Switchgear & Equipment $56.7M Sep-14D504BB45 Rehabilitation of Tunnel Vent. $5.0M Sep-14D601BW97 Concrete Anchorage Repairs $8.0M Oct-14D602RK73 Deck Replacement- RFK MQ Ramp $63.6M Nov-14ED010209 Restore VNB TwrBase Elect/Lightg Sys+Ped Access Br $1.8M Dec-14D502TN82 Rehab of Orthotropic Deck $2.7M Dec-14D602BW89 Deck Replacement - Elevated and On Grade Approach $148.5M Jan-15D503AW37 Operation Centers TS Systems $3.3M Jan-15D605AW12 Hazardous Materials Abatement $2.0M Jan-15D606AW15 MTA Independent Engineer $3.9M Jan-15D606AW21 Program Administration $16.3M Jan-15D606AW22 Miscellaneous $2.4M Feb-15D606AW85 Traffic Enforcement Support $5.8M Feb-15D604BW15 Necklace Lighting $12.5M May-15D601AW98 Feasibility Study:BBT/QMT Improve/Modernize $3.4M May-15D606AW18 Protective Liability Insurance $6.6M Jun-15D601MP06 Substructure & Underwater Scour Protection $25.3M Jul-15D602VN03 Toll Plaza - East & West Bound Ramps Improvements $66.2M Jul-15D604QM81 Controls / Communication System $4.3M Jul-15D603AW36 Installation of CCTV / Fiber Optic Cable $17.3M Jul-15D606AW28 Scope Development $7.8M Aug-15D601HH89 Skewbacks Retrofit $5.73 Oct-15D505QM01 Service & FE Building Rehab $13.32 Nov-15D605BB21 Service Building Rehabilitation $7.90 Nov-15D601TN52 Miscellaneous Structural Rehabilitation $22.04 Dec-15D501BW84 Cable and Anchorage Investigat $8.18 Dec-15D607AW95 Miscellaneous Agency Wide Painting $2.0M Jan-16D605BB43 MIsc. Repairs at BP Garage $6.3M Jan-16D601MP16 Miscellaneous Steel Repairs $2.5M Mar-16D604VN87 Substation #1 Rehabilitation $16.6M Jun-16D602TN49 Suspended Span Replacement - Phase A $23.9M Aug-16D602HH88 Replace Upper & Lower Level Plza & Southbnd. Appr. $49.4M Sep-16D602MP21 Rehabilitate Rockaway Point Blvd Overpass $11.1M Sep-16D607MP21 Paint - Rockaway Point Overpass $.0M Sep-16D601BW07 Tower and Pier Fender Protection $3.3M Dec-16D601RK76 Miscellaneous Structural Repair $20.0M Dec-16D603AW35 Weather Information Systems $1.2M Dec-16D603AW48 2nd Generation E-Zpass In-Lane $21.4M Dec-16D604AW80 Advanced Traveler Infomation Systems $11.6M Dec-16D604MP03 Programmable Logic Controller & Mechanical Rehab. $24.0M Apr-17ED040207 Replace MPB Electrical Equipmt at North Abutment $5.9M Apr-17ED040210 Repl CBB Mech&Elect Equip-S. Abutment & Svc Bldg $10.4M Apr-17D602VN84 Widening of Belt Parkway Ramps $7.7M Apr-17D604QM30 Tunnel Ventilation Building Electrical Upgrade $56.2M May-17D601QM18 Entrance and Exit Plazas Structural Rehabilitation $27.23 Jun-17D601TN60 Anchorage Dehumidification $3.30 Jun-17D601VN35 Steel Repair & Concrete Rehab. & Drainage Systems $13.56 Jun-17D607VN35 Paint - Brooklyn&Staten Island Lower Level Ramps $16.99 Jun-17D601RK23 Miscellaneous Rehab - Manhattan Approach Ramps $145.22 Jul-17
B&T 2014 - 2017 Completions
IV-27

Project Amount ($ in
Mil)Planned
Completion Date
U5030204 $1.6M Jan-13
U5030220 $1.4M Jan-13
U5030214 $9.5M Feb-13
U5030204 $1.7M Mar-13
U6030216 74 CNG Buses $46.3M Mar-13
U5030202 Storage Building at College Point $3.00 May-13
U5030217 $4.02 May-13
U5030213 $3.64 Jun-13
U5030217 $4.61 Jun-13
U6030224 Bus Cameras - 10-14 Purchases $2.20 Jun-13
U5030209 $9.76 Aug-13
U5030217 Fire Protection at JFK $4.0M Jan-14
U4030214 Bus Time Customer Information System: MTA Bus $10.4M Apr-14
U5030209 Upgrade Parking Lot: JFK & Baisley Park $9.2M Jul-14
U5030213 New Roof and Ventilation System at Eastchester $3.9M Jul-14
U5030205 Relocate Fuel Tanks/Rehabilitation at Eastchester $12.9M Sep-14
U5030218 Security Upgrade: Eastchester and LaGuardia $6.8M Sep-14
U6030227 Bus Wash: JFK and Baisley Park $3.3M Dec-14
U5030219 Service Vehicles $4.0M Dec-14
U5030223 Bus Time Customer Information System: MTA Bus-Misc. Items $1.7M Dec-14
U6030208 New Apron: JFK $6.5M Apr-15
U5030211 $1.5M May-15
U5030220 Oil-Water Separator/Chassis Wash: JFK $2.0M May-15
U5030225 Security Upgrade: Far Rockaway and Baisley Park $6.8M Dec-15
U5030298 $5.0M Dec-15
U5030299 Engineering Design Services $4.7M Dec-15
U6030217 $23.8M Dec-15
U5030204 $0.6M Jan-16
U5030204 $8.4M Jan-16
U5030216 Additional Fueling Capacity: JFK, Baisley Park and LaGuardia $3.5M Jan-16
U6030205 Chassis Wash: LaGuardia and Baisley Park $2.0M Jan-16
U6030219 75 Articulated Buses $61.6M Jan-16
EU030201 Hurricane Sandy Depot Rehabilitation at Far Rockaway $15.0M Jan-16
U6030226 Bus Radio System $36.5M Dec-16
Emergency Generators: 6 Depots - Purchase
Emergency Generators: 6 Depots - Installation
New Boiler and A/C at JFK
New Roof and Ventilation System at JFK
MTA Bus 2014 - 2017 Completions
ACEP Project
Power Upgrade at JFK
New Roof and Ventilation System at Eastchester
Fire Protection at JFK
Fire Protection: LaGuardia and Baisley Park
Power Upgrade at Baisley Park
Upgrade Parking Lot: JFK and Baisley Park
Construction Management Services
Far Rockaway Roof Deck Replacement
45 Diesel Buses
IV-28

ACEP Project
Project Amount ($ in
Mil)
Planned Completion
Date
G5100102 Cntract 4B 72 St Stn Structure 478.87$ Jan-14G4120106 FSTC A/C Mezzanine 173.13$ Jan-14G4090143 44th St and 245 Park Ave Entr 66.77$ Feb-14G5110108 Construction (Site J) 126.19$ Feb-14G5090115 50th St. Vent Plant Facility 100.47$ Mar-14PN CQ031 Queens Bored Tunnels 801.10$ Apr-14G4120107 FSTC 4F-Transit Center Enclosure 224.92$ Jun-14G4090126 Harold Structures (Part 2A) 27.07$ Jun-14G5090155 Harold Structures (Part 2A) 32.69$ Jun-14G5110106 Site A Fac; Finishes and Systems 580.11$ Oct-14G5090117 Harold Structures (Part 1) 209.47$ Aug-14G6090122 Harold Structures (Part 1) 66.45$ Aug-14G5100107 Cnt 5B 86St Stn Mining&Lining 75.24$ Feb-15G6100103 Cnt 5B 86St Stn Mining&Lining 264.39$ Feb-15G6090112 55th St. Ventilation Facility 58.85$ Apr-15G5100108 Contract 3: 63rd St Stn Rehab 202.28$ Jun-15G5090119 Harold & Point CIL 38.84$ Jul-15G6090120 Plaza Substation & Structures 211.92$ Aug-15G6100102 4C: Station Finishes/MEP 72 St 290.27$ Nov-15G5090118 Harold Interlocking Stage 1-4 116.56$ Nov-15G6140103 Harold Structures Part 3A: W-Bnd By-Pass 128.28$ Feb-16G6090141 Manhattan South Structures 220.66$ Feb-16G6100101 2B/C: Shell/Finishes/MEP 96 St 378.88$ Mar-16G5110112 Construction: Core&Shell (Site P) 96.36$ Apr-16G6100104 5C: Station Finishes/MEP 86 St 239.41$ May-16G6090123 Harold Structures - Part 3A 70.32$ May-16G5100104 Cntract 6: SAS Systems 323.25$ Aug-16G6090142 Manhattan North Structures 360.67$ Nov-16
MTACC 2014 - 2017 Completions
IV-29

MTA PD 2014-17 Completions
ACEP Project
Project Amount ($ in
Mil)
Planned Completion
Date
N5100104 K-9 Facility $ 13.47 9/2014N5100109 MTAPD Radio Project Design/Build 26.22$ 9/2014E6100104 MTAPD Radio Project Design/Build 60.00$ 9/2015E6100102 S. I. District Office 12.00$ 2/2015E6100103 Nassau County District Office 13.00$ 12/2014N5100105 Harriman District Office 0.40$ 6/2014
IV-30

OPERATING IMPACTS EXCEEDING $1 MILLION FOR CAPITAL PROJECTS REACHING BENEFICIAL USE 2014-2017
NEW YORK CITY TRANSIT CAPITAL PROJECTS
Project: Second Avenue Subway Phase I – MTA Capital Construction is managing construction of the Second Avenue Subway on Manhattan’s east side from 125th Street to the Financial District in Lower Manhattan. The first phase of this four-phase project will utilize an existing tunnel under Central Park from 57th Street/Seventh Avenue on the Broadway Line to 63rd Street/Lexington. From 63rd Street, a new tunnel will be built along Second Avenue between 63rd Street and 96th Street. The first phase will be served by an extension of the Q Line and have new stations at 63rd Street/Lexington (connection to F train), 72nd Street, 86th Street and finally 96th Street and is slated to open in December 2016. This will result in $31.7 million in additional annual expenses.
Project: Mother Clara Hale Depot Reconstruction. This is a reconstruction of a bus depot to create a modern facility and increase vehicle handling capacity. The new multi-story depot will replace a single-story structure dating from the 1890’s. The depot is planned to fully open in 2015 with about $2.2 million of annual expenses.
Project: Enterprise Security Network Infrastructure. This will install unified threat management network security hardware at all the nodes on the new IP-based enterprise data network. The security hardware will protect mission-critical applications like ATS (Automatic Train Supervision), CBTC (Computer based Train Control), PA/CIS (Public address and Customer Information System) which are planned to be migrated to new network. Installation is projected to be complete by 2016 with full operating budget impacts beginning in 2016 ($1.2 million annually.
Project: 7 West Extension. This project will extend the Flushing Line (7) southwest from 42 St & 8th Ave to a new station at 34th St & 11th Ave. The construction includes new running tunnels and associated right-of-way equipment; vent plants; and a new terminal station with elevators, escalators, HVAC, and other modern station finishes. Full impacts will start later in 2014 with $18.0 million in additional annual expenses.
Project: Fulton Street Transit Center Complex. This is a reconfiguration and reconstruction of an existing complex of subway stations. There is an additional underground connecting concourse extending west to the Cortland St Broadway line station. The complex is being renewed in phases. The renewed complex will be larger and have new escalators and elevators. The complex is scheduled to be open in the second half of 2014 with full impacts in 2015 and $9.3 million in additional annual expenses.
IV-31

Project: R188 Subway Car Purchase (126 cars). The purchase of 126 cars is to grow the A-Division fleet in anticipation of beginning CBTC on the Flushing Line and to support the extension of the Flushing Line. Additional new cars to the fleet have maintenance, energy, and personnel costs. Total impacts of 55 cars are included with the 7 West Extension above. NYCT expects to absorb the additional costs of the remaining 71 cars. The first R188 cars were placed in service in 2013 and all of the 126 cars are expected to be in service by 2016. Project: R179 Subway Car Purchase. This project is for the purchase of 300 'B' division cars that will replace 272 R32 and R42 cars due for retirement. The operating budget impact is neutral for 272 fleet replacement cars, but 28 cars are fleet expansion. Total impacts of the 28 fleet expansion cars are not included in the Financial Plan and NYCT is evaluating options regarding the operating impacts of these cars for a future financial plan cycle. The R179 cars are expected to start arriving in 2017. Project: Public Address/ Customer Information – 89 Stations B Division. This project will install public address speakers and visual information delivered by Customer Information Screens at 89 stations and 2 pilot stations. Impacts will begin in 2015, when the majority of the equipment would be installed or shortly thereafter. An annual total increase of $3.3 million is expected.
LONG ISLAND RAIL ROAD CAPITAL PROJECTS
Project: East Side Access. This project will expand LIRR service into Grand Central Terminal. The construction includes new tunnel and track along with related right-of-way equipment, vent plants, substations, and a new terminal station with elevators, escalators, and HVAC. The project also includes 236 new rail cars and will introduce an expanded train service plan to support Opening Day. Operating budget increases will begin before opening day.
Project: Positive Train Control (PTC). This project is for the installation of a PTC system for the LIRR. It is an integrated command, control, communication, and geographic information system designed to prevent train-to-train collisions, over-speed derailments, incursions into established work zone limits, and the movement of a train through a switch left in the wrong position. PTC is comprised of five core elements: On-Board Equipment, a Wireless Communication Network, Central Servers, a Dispatching System, and Wayside Equipment. The full operating budget impact has not been identified. However, because of the assets and equipment that will need to be operated and maintained, it is expected that PTC will have an operating budget impact of at least $1 million a year.
METRO-NORTH RAILROAD CAPITAL PROJECTS
Project: M-8 New Haven Line Purchase. This project is for the design, manufacture, test and delivery of the New Haven Line M8 EMU Cars. The first one hundred cars will be utilized to supplement the existing fleet to fill out trains and reduce standees. The base contract for 210
IV-32

cars and the first option for 90 additional cars were awarded on August 21, 2006. Two additional options 42 and 38 cars respectively. A change order was executed for 25 Single Cars for a total of 405 cars. Anticipated steady-state Operating Budget Impact of approximately $3 million (NYS portion) once all 405 cars are in service.
Project: Customer Communication/Connectivity Improvements. Under this project, an updated public address system and real-time information will be provided to Metro-North customers at East of Hudson stations. Departure time and destination, status, and track number will be displayed. Connectivity will be provided at each station to support the new real-time train information/public address system, upgrade ticket office workstations, and allow capability for remote CCTV and elevator monitoring/control. Project currently in scoping phase and any potential Operating Budget Impacts are currently unknown; however they could potentially exceed $1 million.
Project: Positive Train Control (PTC). Installation of a PTC system is mandated by the Federal Rail Safety Improvement Act of 2008. PTC is an integrated command, control, communication, and geographic information system designed to prevent train-to-train collisions, over-speed derailments, incursions into established work zone limits, and the movement of a train through a switch left in the wrong position. It is comprised of five core elements: On-Board Equipment, a Wireless Communication Network, Central Servers, a Dispatching System, and Wayside Equipment. The full operating budget impact has not been identified. However, because of the assets and equipment that will need to be operated and maintained, it is expected that PTC will have an Operating Budget Impact that will exceed $1 million a year.
Project: West of Hudson Signal Improvements. The purpose of this project is to install a new 100 Hz Cab Signal system replacing existing antiquated signal system for the West of Hudson Port Jervis Line between Suffern, NY (MP 31.3) and Sparrowbush, NY (MP 89.9). This system will be consistent with NORAC (Northeast Operating Rules Advisory Committee) and NJT (New Jersey Transit) operating rules. This project will extend existing cab signal system from NJT territory (south of Suffern) into MNR territory up to the division post at MP 89.9. This line consists of nine interlockings and four highway grade crossings. MNR rolling stock operated by NJT is already equipped with cab signal system due to its operation south of Suffern. PTC equipment for West of Hudson will be procured as options on New Jersey Transit PTC contract. Similarly to the Positive Train Control project (above), the West of Hudson Signal Improvements project could potentially have an annual Operating Budget Impact of greater than $1 million due to the assets and equipment that will need to be operated and maintained. OTHER AGENCIES Other MTA agencies have no capital projects entering beneficial use in 2014-2017 that have impacts on the operating budget over $1 million.
IV-33

[THIS PAGE INTENTIONALLY LEFT BLANK]
IV-34

V. Agency Financial Plans

Bridges and Tunnels

MTA BRIDGES AND TUNNELS 2015 Preliminary Budget
July Financial Plan 2015–2018
FINANCIAL OVERVIEW MTA Bridges and Tunnels (B&T) continues to be a strong source of fiscal stability to the MTA. In 2014 and 2015 com bined, B&T is pr ojected to contribute $1.777 billion in Support to Mass Transit. B&T is able to provide this subs tantial support to mass transit by efficiently carrying out its operations, while at the same time provid ing high levels of customer service and maintaining a strong safety focus for bot h employees and the travelers utiliz ing its facilities. There is no more important priority for B&T than s afety. Safe work practices are continually emphasized and safety training is regularly provided to employees. Ongoing efforts in shaping a safety culture at every level of the agency include: Utilizing a Special Operations Comman d unit to provide unified emergency
coordination, accident and facility/roadway hazard alerts, sa fety bulletins, and other vital communications to B&T customers and employees;
Employing a Safety Task Forc e to chec k facilities for hazards and e ither make immediate improvements or el evate issues to a Safety Action Team when more technical solutions are required;
Maintaining the effective ACROBAT (Ach ieve Collision Reduction on Bridges and Tunnels) program which is a joint effort with Engineering and Operations staff aimed at reducing vehicular accidents and customer injuries by pinpointing acc ident hot spots and implementing a var iety of countermeasures ranging from physical improvements to operational actions;
Continuing a vigorous bri dge and tunnel inspection progr am that exceeds Federal and New York State requirements to ensur e that any observe d deficiencies in structural or safety conditions are address ed as promptly as possible to maintain facility integrity and assure public safety;
Emphasizing inter-departmental initiative s between Engineering, Operations and Health and Safety staff in the areas of safety training, fiel d operations with the FDNY, and support in construction/maintenance activities.
B&T also carries out initiativ es that help assure the safe passa ge of its customers, including identifying collision hotspots, re-evaluating and m odifying traffic patterns in construction zones and improving roadway si gnage. As a result of these safety initiatives, through May 2014, the collision rate was 4.47 per million vehicles, which was nearly 11% lower than last year at this time.
V-1

To better enforce weight restrictions and ensure the safety and structural integrity of the facilities, a truck weight enforcement program is in place on B&T’s suspension bridges. The program uses a combinat ion of personnel to perform vehicle weight and safety inspections and provide a regular facility pr esence to conduct credential checks. From the start of the program in 2007 through April 2014, more than 67,000 trucks have been interdicted. In addition, B&T assists t he NYC Department of Transportation with inspections and violation assessments of commuter buses. B&T also monitors its facility operations b y tracking key customer service and safe ty oriented performance statistics at the bridges and tunnels. Through April, over 3,200 potholes were repaired and nearly 4,000 m iles of roadway were swept across all facilities. Traffic mobility at all facilities was consist ently smooth, with 90% of vehicle crossings at bridges during weekday peak periods traveling above 30 mph, and 65% of vehicle crossings at the tunnels (where lower speeds are posted during measured peak periods) traveling above 25 mph. These results are consistent with 2013 patterns. One of B&T’s key initiatives, to make E-ZP ass (which is the leas t expensive means of collecting tolls) more available to all B&T c ustomers, continues in the July Plan. From January through May of this year , E-ZPass usage averaged 84.5% of total traffic, which is 1.2% points greater than the same peri od last year. The following efforts have contributed toward this growth in usage. B&T began selling E-ZPass “On the Go” pre-pai d tags in the cash toll lanes at each
facility in 2012. As of the end of J une 2014, more than 343,000 tags had be en sold in the lanes.
Spanish language versions of the E-ZPass application, interactive website, and the customer service telephone voic e response system were introduced in J anuary of 2012.
B&T introduced the MTA Reload Card in February 2012, an in itiative which makes it easier for customers to replenish their E- ZPass account with cash. Customers can go to any Visa ReadyLink retail merchant and use the card to r eload their E-ZPass accounts, eliminating the need t o travel to one of three walk-in c enters in Yonkers, Queens, or Staten Island for that purpose. To date, over 91,000 cards have been issued to customers and appr oximately 16% of total cash replenishments are currently made using the reload cards.
In November 2012, B&T introduced E-ZP ass “Pay per Trip ”, which enables customers to set up an E-ZPass accoun t without a pre-paid balance. Thos e interested in this program will p ay for their tolls each day through an Aut omated Clearinghouse (ACH) deduction fr om their checking ac count. To date, over 24,000 account holders have signed up for this initiative.
The most potentially far reaching B&T initia tive is the project at the Hen ry Hudson Bridge (HHB) to test All Electronic Toll (AET ) collection operations. In November 2012, B&T implemented a cashless tolling pilot at t he HHB. All motorists are now able to use any lane to drive through the toll plaza wit hout stopping. Under the cashless tolling system, automatic billing remains the same for drivers with E-ZPass. For drivers without
V-2

an E-ZPass tag, an image is taken of their license plate and a bill for the toll is mailed to the vehicle’s registered owner . Currently, approximately 94. 6 percent of crossings at the HHB are processed through E-ZPass and 5.4 percent are “toll-by-mail” transactions. Based on t he results of the initiative, B&T requested and received Board approval in May 2014 to continue the all-electronic collect ion of tolls at the HHB following the completion of the pilot at the end of 2014. Initially, tolls will b e collected through the AET system being used for the AET pilot, wit h vehicles traveling in gateless, channelized lanes and tolling equipment mounted on the existing infrastructure. In the fall of 2016 or early 2017, a gantry-based Open Road Tolling (ORT) system will be put into revenue s ervice and the existing toll plazas including the booths will b e demolished. It is expected that the new OR T system will continue to utiliz e the current methods employed at the HHB to capture E-ZPass transponder-reads and license plate images, but will do so in an environment absent a tradition al toll p laza, enabling customers to traverse the bri dge's two tolling areas in free-flow fashion. This project is being executed in concert with a planned st ructural reconstruction of the HHB's upper and lower level roadways. Other significant customer service improvements are also being carried out through the capital program, with some of t he most si gnificant improvements taking place at the Verrazano-Narrows Bridge. By summer 2015, the remaining three unused eastbound toll booths will be removed
as part of improvements to the entrance and exit ramps and r ehabilitation of the eastbound toll plaza.
In September 2013, the newly constructed Lily Pond Avenue entrance ramp, Brooklyn-bound, opened with an improved wider and more efficient configuration over the old on-ramp.
In late 2012, a five-year, $235.7 million c onstruction contract was awa rded to replace the original 1960s upper level suspended span roadway of the Verrazano-Narrows Bridge which, once completed, will include the agency's first reversible high occupancy vehicle lane. In 2013, the construction of a new bus and HOV ramp was awarded for $65.7 million. Th e new re versible lane will co nnect with State Department of Transportation's HOV lanes on either s ide of the bridge, providing a continuous HOV lane from the Staten Island Expres sway straight through to the Hugh L. Carey Tunnel, saving time for thousands of daily bus and HOV car commuters.
In addition to the Verrazano improvement s, in mid-2012 a $5 0 million design/build contract was awarded to reconstruct t he Manhattan/Queens ramp at the Robert F. Kennedy Bridge. The 26-month project to reconstruct the 54,000-square-foot ramp is expected to be completed by fall 2014, an d will provide custom ers a muc h smoother ride through the bridge complex. At the Bronx Whitestone Bridge, a $212 m illion Capital project to reconstruct the Bronx approach roadway, providing drivers with wider 12-foot lanes and new safety shoulders,
V-3

was completed in August 2012, two months ahead of schedule . Currently underway is the $114 million rec onstruction of the Queens a pproach to the bridg e which was awarded in July 2011. A nd at the Throgs Neck Bridg e, approximately 67,000 square feet of the deteriorated s outhbound roadway was re-surfaced, which will result in a smoother ride for customers. Key total changes between the July and February plans are outlined below. 2014 Mid-Year Forecast In the 2014 Mid-Yea r Forecast, a total of $1,190.6 million is pr ojected in Baseline Operating Income compared to $1,195. 3 million in the 2014 Adopted Budget, a decrease of $4.7 million. Total revenues are $1,694.3 million, which is $7.3 millio n greater than the Adopte d Budget. T oll revenue accounts for 97% of al l revenues and is projected at $1,651. 2 million, which is $1.7 million greater than the Adopted Budget. Although harsh weather in January and February suppressed traffi c volumes considerably and resulted in a n unfavorable toll revenue varian ce of $8.1 m illion against the Adopted Budget, traffic trends were generally favorable from March through May, which partially offset the earlier losses. The net $3.4 million year-to- date May shortfall is exp ected to be more than offset by continued favo rable traffic trends from J une through the end of the year. Favorable results are also occ urring in Other Operating Rev enue, primarily from additional parking receipts at the Ba ttery Parking Garage, higher E-ZPass administrative fee inc ome, and anticipated FEMA and insuranc e reimbursements for expenses associated with Superstorm Sandy (Sandy) and Tropical Storm Irene. These and other small revenue sources are adding a co mbined $5.6 million to July Pla n operating income. The 2014 Mid-Year Forecast includes expenses totaling $503.7 million before depreciation and GASB adjustments. Labor costs are $270.0 million and non-labor costs are $233.7 million. Total expenses are $12.0 million above the Adopted Budget. Labor expenses are higher by $4.8 million primarily due to anticipated union contract settlements, including retroactive compens ation payments dating back to 2009. These projected contractual obligations require a total of $9. 0 million above Adopted Budget labor costs and are allocated across payroll, overtime and employer taxes captured in other fringe benefits. In addition, adjustments to the Health and Welfare forecast require a net increase of $0.3 million. Pa rtially offsetting these higher costs are favorable re-estimates for pens ion expenses ($3.4 million) an d lower payroll and corresponding fringe benefit costs associat ed with vacancies for Bridge & Tunnel Officers and managerial/professional staff ($1.4 million). Non-labor expenses are greater by $7.2 million primarily due to the timing of permanent restoration and mitigation work associated with Sandy. Approximat ely $4.9 million in Sandy-related expenses that were originally budgeted for 2013 have been deferred to
V-4

2014. In addition, pro jected bond issuance costs are $1.9 millio n greater than initially forecast due to increased financing activities. Total Support to Mass Transit is $903.4 mill ion compared to $907.6 million in the 2014 Adopted Budget, a decrease of $4.2 millio n resulting from $4.7 milli on less in Baseline Operating Income ($7.3 million in revenue gains offset by $12.0 million in high er expenses) and higher B&T de bt service ($1.1 million), partially offset by lower GASB Reserves ($1.6 million). In 2014, total planned year- end headcount is 1,751, including 88 capital reimbursable full-time equivalents. Headcount is 5 positions higher than the Adopted Budget level of 1,746. The additional headc ount includes 2 newly funded positions. A new procurement position is requir ed to cov er additional duties associated with the expanding MTA-wide Minorit y and Women-Owned Bus iness Enterprise (M/WOBE) program. A new legal position is necessary to handle wide-ranging toll matters, projects and initiatives, Authority-wide and with other tolling agencies such as the E-ZPass Inter-Agency Group, including All-Electronic To lling (AET), Open Road To lling (ORT), environmental and procurement issues, super vision of collection counsel, violation enforcement legislation, adjudication of toll violations, toll increases and national interoperability. In addition, the AET program began as a pilot in 2011 an d 3 AET-dedicated positions have been funded sinc e then, but given the pilot program context, these positions haven't been included in bu dgeted headcount. Since the pr ogram has become more formalized subsequent to Board appr oval last M ay, it's appropriate to include these positions in budgeted headcount at this time. 2015 Preliminary Budget - Baseline In the 201 5 Preliminary Budget, a total of $1,182.5 million is projected in Base line Operating Income compared to $1,181.0 milli on in the Februa ry Financial Pla n, an increase of $1.5 million. Total revenues are $1,694.3 million, which is $3.1 m illion greater than the February Financial Plan. Toll r evenues are increased by $2.2 million, refl ecting the higher plan-to-plan traffic trends from 2014. Other Operating Revenue has also been adjusted upward by $0.9 million to incorporate favorable re-estimates in several revenue sources including the Battery Parking Garage and E-ZPass administrative fees. Expenses before dep reciation and GASB adjustments tota l $511.8 millio n and are comprised of $275.7 million in labor costs and $236.1 million in non-labor exp enses. Overall expenses are $1.6 million higher than the February Financial Plan. Labor costs are projected to be greater by $3.6 m illion primarily due to the anticipate d union contract settlements in 2014. The to tal plan-to-plan cost of these settl ements—including payroll and overtime expenses, and employer taxes captured in other fringe benefits—is estimated at $6.5 million. In addition, adjustments to the forecast for Health and Welfare and OPEB Current Payment require a net increase of $2.3 million. Lastly , higher payroll and ass ociated fringe costs totaling $0.3 milli on have been included for
V-5

the new M/WOBE and AET pos itions previously discussed. Partially offsetti ng these higher costs are favorable re-estimates for pension expenses of $5.4 million. Non-labor expenses are lower by $2.0 million. Significant ly favorable re-estimates include insurance ($2.5 million), electric power ($1.2 million), and credit/debit card fees ($1.0 million). Partially offsetting these reductions are an add itional $2.6 million for bond issuance fees due to an expected increas e in f inancing activities compared to February Financial Plan assumptions. Total Support to Mass Transit is $873.5 m illion compared to $869.5 m illion in th e February Financial Plan, an in crease of $4.0 million result ing from higher Baseline Operating Income of $1.5 milli on ($3.1 million in reve nue gains partially offset by $1.6 million in higher e xpenses) and a favor able adjustment to GASB Rese rves ($3.4 million), partially offset by higher B&T debt service ($0.9 million). In 2015, total headc ount is budgeted at 1,751, including 88 reimbursable positions , which is 5 positions higher than the Fe bruary Financial Plan due to th e changes discussed under the 2014 Mid-Year Forecast. 2016-2018 Projections The 2016 projection for Baselin e Operating Income is $1,182.1 million co mpared to $1,175.6 million in t he February Financial Plan. Th is consists of $1,706.0 million in revenues, less $523.9 million in exp enses. The expenses are c omprised of $280.3 million in labor costs and $243.6 million in non-labor expenses. The 2017 projection for Baselin e Operating Income is $1,173.9 million co mpared to $1,163.2 million in t he February Financial Plan. Th is consists of $1,713.2 million in revenues, offset by $539.3 million in expenses. The expenses are comprised of $287.7 million in labor costs and $251.6 million in non-labor expenses. In 2018, the projection for Base line Operating Income is $1,164.0 million. This consists of $1,721.5 million in revenues, offset by $557.5 million in expenses. The expenses are comprised of $295.2 million in labor costs and $262.3 million in non-labor expenses. In 2016 to 2018, the total baseline planned headcount will be 1,751, which includes 88 capitally-reimbursable positions. Details for year-to-year changes and reconcili ations of the July Financial Plan to the February Financial Plan are dis cussed in the Plan-to-Plan Summary of Changes, a nd the assumptions guiding traffic and headc ount projections are discussed in the Other Assumptions section.
V-6

NON-REIMBURSABLE
2014 2015
2013 Mid-Year Preliminary
Actual Forecast Budget 2016 2017 2018
Operating Revenue
Vehicle Toll Revenue $1,645.193 $1,651.216 $1,655.058 $1,664.664 $1,670.445 $1,678.406Other Operating Revenue 22.142 21.701 16.869 17.044 17.044 17.044Capital and Other Reimbursements 0.000 0.000 0.000 0.000 0.000 0.000Investment Income 0.131 0.162 0.737 2.180 2.866 2.961Total Revenue $1,667.466 $1,673.079 $1,672.664 $1,683.888 $1,690.355 $1,698.411
Operating Expenses
Labor:
Payroll $118.568 $138.601 $141.336 $144.046 $148.246 $151.802Overtime 19.046 22.886 22.842 23.349 23.804 24.280Health and Welfare 23.651 27.677 30.524 31.219 32.741 34.148OPEB Current Payment 15.089 16.102 16.907 17.347 18.214 19.125Pensions 31.863 30.452 29.242 28.716 28.425 28.741Other Fringe Benefits 17.710 18.134 18.382 18.664 18.909 19.265Reimbursable Overhead (5.235) (5.095) (5.145) (5.196) (5.442) (5.227)Total Labor Expenses $220.692 $248.757 $254.087 $258.144 $264.897 $272.134
Non-Labor:
Electric Power $6.942 $7.350 $6.645 $6.956 $8.055 $8.747Fuel 2.841 2.959 2.860 2.757 2.657 2.717Insurance 10.482 16.294 17.386 18.874 20.438 22.178Claims 0.000 0.135 0.000 0.000 0.000 0.000Paratransit Service Contracts 0.000 0.000 0.000 0.000 0.000 0.000Maintenance and Other Operating Contracts 100.657 129.516 134.061 139.965 145.614 152.274Professional Service Contracts 36.206 43.788 42.134 41.379 40.260 41.062Materials & Supplies 2.965 4.603 4.338 4.420 4.548 4.646Other Business Expenses 28.720 29.080 28.627 29.275 29.996 30.704Total Non-Labor Expenses $188.813 $233.725 $236.050 $243.626 $251.568 $262.327
Other Expense Adjustments:
Other $0.000 $0.000 $0.000 $0.000 $0.000 $0.000Total Other Expense Adjustments $0.000 $0.000 $0.000 $0.000 $0.000 $0.000
Total Expenses Before Depreciation and GASB Adjs. $409.505 $482.482 $490.137 $501.770 $516.465 $534.460
Add: Depreciation $91.345 $104.389 $111.667 $119.521 $127.853 $127.853Add: OPEB Obligation 76.650 66.944 70.291 73.806 77.496 81.371Add: Environmental Remediation (0.009) 0.000 0.000 0.000 0.000 0.000
Total Expenses After Depreciation and GASB Adjs. $577.491 $653.815 $672.096 $695.097 $721.814 $743.684
Less: Depreciation $91.345 $104.389 $111.667 $119.521 $127.853 $127.853Less: OPEB Obligation 76.650 66.944 70.291 73.806 77.496 81.371
Total Expenses $409.496 $482.482 $490.137 $501.770 $516.465 $534.460
Baseline Income/(Deficit) $1,257.970 $1,190.597 $1,182.526 $1,182.118 $1,173.889 $1,163.951
July Financial Plan 2015-2018MTA BRIDGES AND TUNNELS
Accrual Statement of Operations by Category
($ in millions)
V-7
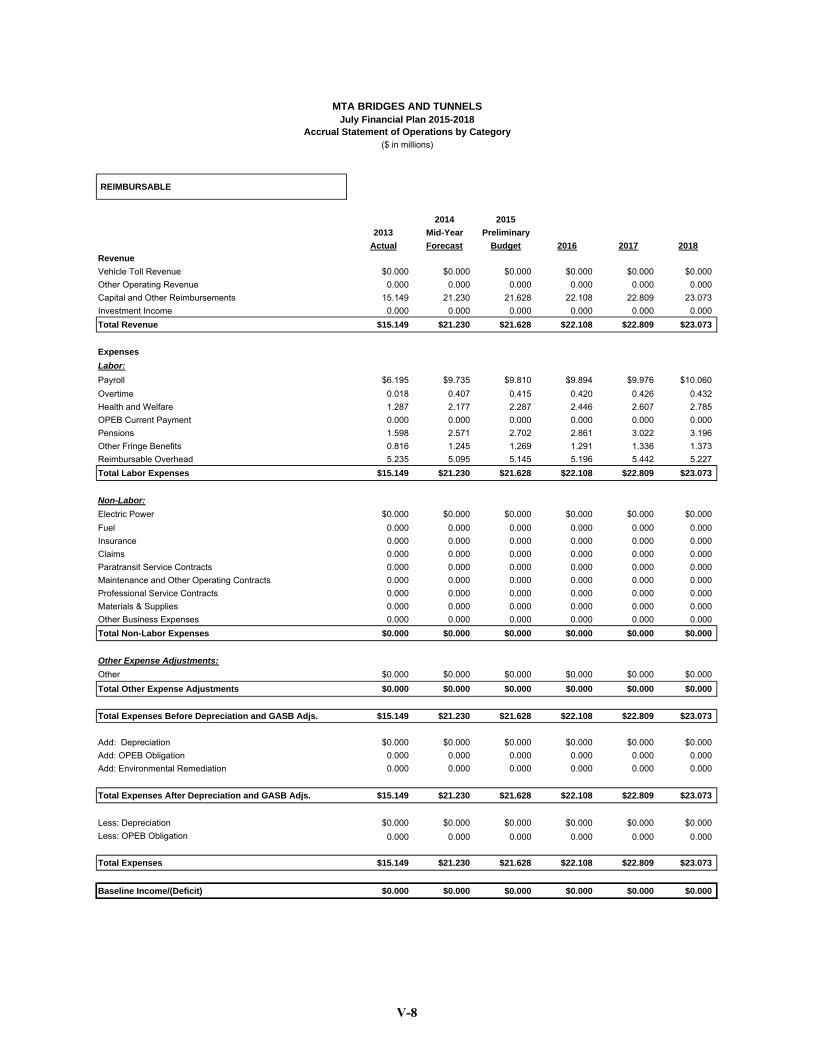
REIMBURSABLE
2014 2015
2013 Mid-Year Preliminary
Actual Forecast Budget 2016 2017 2018
Revenue
Vehicle Toll Revenue $0.000 $0.000 $0.000 $0.000 $0.000 $0.000Other Operating Revenue 0.000 0.000 0.000 0.000 0.000 0.000Capital and Other Reimbursements 15.149 21.230 21.628 22.108 22.809 23.073Investment Income 0.000 0.000 0.000 0.000 0.000 0.000Total Revenue $15.149 $21.230 $21.628 $22.108 $22.809 $23.073
Expenses
Labor:
Payroll $6.195 $9.735 $9.810 $9.894 $9.976 $10.060Overtime 0.018 0.407 0.415 0.420 0.426 0.432Health and Welfare 1.287 2.177 2.287 2.446 2.607 2.785OPEB Current Payment 0.000 0.000 0.000 0.000 0.000 0.000Pensions 1.598 2.571 2.702 2.861 3.022 3.196Other Fringe Benefits 0.816 1.245 1.269 1.291 1.336 1.373Reimbursable Overhead 5.235 5.095 5.145 5.196 5.442 5.227Total Labor Expenses $15.149 $21.230 $21.628 $22.108 $22.809 $23.073
Non-Labor:
Electric Power $0.000 $0.000 $0.000 $0.000 $0.000 $0.000Fuel 0.000 0.000 0.000 0.000 0.000 0.000Insurance 0.000 0.000 0.000 0.000 0.000 0.000Claims 0.000 0.000 0.000 0.000 0.000 0.000Paratransit Service Contracts 0.000 0.000 0.000 0.000 0.000 0.000Maintenance and Other Operating Contracts 0.000 0.000 0.000 0.000 0.000 0.000Professional Service Contracts 0.000 0.000 0.000 0.000 0.000 0.000Materials & Supplies 0.000 0.000 0.000 0.000 0.000 0.000Other Business Expenses 0.000 0.000 0.000 0.000 0.000 0.000Total Non-Labor Expenses $0.000 $0.000 $0.000 $0.000 $0.000 $0.000
Other Expense Adjustments:
Other $0.000 $0.000 $0.000 $0.000 $0.000 $0.000Total Other Expense Adjustments $0.000 $0.000 $0.000 $0.000 $0.000 $0.000
Total Expenses Before Depreciation and GASB Adjs. $15.149 $21.230 $21.628 $22.108 $22.809 $23.073
Add: Depreciation $0.000 $0.000 $0.000 $0.000 $0.000 $0.000Add: OPEB Obligation 0.000 0.000 0.000 0.000 0.000 0.000Add: Environmental Remediation 0.000 0.000 0.000 0.000 0.000 0.000
Total Expenses After Depreciation and GASB Adjs. $15.149 $21.230 $21.628 $22.108 $22.809 $23.073
Less: Depreciation $0.000 $0.000 $0.000 $0.000 $0.000 $0.000Less: OPEB Obligation 0.000 0.000 0.000 0.000 0.000 0.000
Total Expenses $15.149 $21.230 $21.628 $22.108 $22.809 $23.073
Baseline Income/(Deficit) $0.000 $0.000 $0.000 $0.000 $0.000 $0.000
($ in millions)
MTA BRIDGES AND TUNNELSJuly Financial Plan 2015-2018
Accrual Statement of Operations by Category
V-8

NON-REIMBURSABLE / REIMBURSABLE Page 1 of 2
2014 2015
2013 Mid-Year Preliminary
Actual Forecast Budget 2016 2017 2018
Revenue
Vehicle Toll Revenue $1,645.193 $1,651.216 $1,655.058 $1,664.664 $1,670.445 $1,678.406Other Operating Revenue 22.142 21.701 16.869 17.044 17.044 17.044Capital and Other Reimbursements 15.149 21.230 21.628 22.108 22.809 23.073Investment Income 0.131 0.162 0.737 2.180 2.866 2.961Total Revenue $1,682.615 $1,694.309 $1,694.291 $1,705.996 $1,713.164 $1,721.484
Expenses
Labor:
Payroll $124.763 $148.336 $151.146 $153.940 $158.222 $161.862Overtime 19.064 23.293 23.256 23.768 24.230 24.711Health and Welfare 24.938 29.854 32.811 33.665 35.348 36.933OPEB Current Payment 15.089 16.102 16.907 17.347 18.214 19.125Pensions 33.461 33.023 31.944 31.577 31.447 31.937Other Fringe Benefits 18.526 19.379 19.651 19.955 20.245 20.638Reimbursable Overhead 0.000 0.000 0.000 0.000 0.000 0.000Total Labor Expenses $235.841 $269.987 $275.715 $280.252 $287.706 $295.207
Non-Labor:
Electric Power $6.942 $7.350 $6.645 $6.956 $8.055 $8.747Fuel 2.841 2.959 2.860 2.757 2.657 2.717Insurance 10.482 16.294 17.386 18.874 20.438 22.178Claims 0.000 0.135 0.000 0.000 0.000 0.000Paratransit Service Contracts 0.000 0.000 0.000 0.000 0.000 0.000Maintenance and Other Operating Contracts 100.657 129.516 134.061 139.965 145.614 152.274Professional Service Contracts 36.206 43.788 42.134 41.379 40.260 41.062Materials & Supplies 2.965 4.603 4.338 4.420 4.548 4.646Other Business Expenses 28.720 29.080 28.627 29.275 29.996 30.704Total Non-Labor Expenses $188.813 $233.725 $236.050 $243.626 $251.568 $262.327
Other Expense Adjustments:
Other $0.000 $0.000 $0.000 $0.000 $0.000 $0.000Total Other Expense Adjustments $0.000 $0.000 $0.000 $0.000 $0.000 $0.000
Total Expenses Before Depreciation and GASB Adjs. $424.654 $503.711 $511.765 $523.878 $539.274 $557.533
Add: Depreciation $91.345 $104.389 $111.667 $119.521 $127.853 $127.853Add: OPEB Obligation 76.650 66.944 70.291 73.806 77.496 81.371Add: Environmental Remediation (0.009) 0.000 0.000 0.000 0.000 0.000
Total Expenses After Depreciation and GASB Adjs. $592.640 $675.044 $693.723 $717.205 $744.623 $766.757
Less: Depreciation $91.345 $104.389 $111.667 $119.521 $127.853 $127.853Less: OPEB Obligation 76.650 66.944 70.291 73.806 77.496 81.371
Total Expenses $424.645 $503.711 $511.765 $523.878 $539.274 $557.533
Baseline Income/(Deficit) $1,257.970 $1,190.597 $1,182.526 $1,182.118 $1,173.889 $1,163.951
($ in millions)
MTA BRIDGES AND TUNNELSJuly Financial Plan 2015-2018
Accrual Statement of Operations by Category
V-9

NON-REIMBURSABLE / REIMBURSABLE Page 2 of 2
2014 2015
2013 Mid-Year Preliminary
Actual Forecast Budget 2016 2017 2018
Baseline Income/(Deficit) $1,257.970 $1,190.597 $1,182.526 $1,182.118 $1,173.889 $1,163.951
Deductions from Income:
Less: Capitalized Assets $14.525 $17.843 $17.849 $20.635 $21.056 $21.475 Reserves 28.573 25.895 26.382 26.881 27.338 27.824 GASB Reserves 3.077 1.610 0.000 0.000 0.000 0.182
Adjusted Baseline Income/(Deficit) $1,211.795 $1,145.249 $1,138.295 $1,134.602 $1,125.496 $1,114.469
Less: Debt Service $597.454 $597.868 $633.695 $644.353 $669.149 $691.000
Income Available for Distribution $614.341 $547.381 $504.600 $490.249 $456.347 $423.469
Distributable To:
MTA - Investment Income $0.131 $0.162 $0.737 $2.180 $2.866 $2.961MTA - Distributable Income 367.308 327.101 307.935 300.053 283.293 266.413NYCT - Distributable Income 246.902 220.118 195.928 188.016 170.189 154.095
Total Distributable Income: $614.341 $547.381 $504.600 $490.249 $456.347 $423.469
Actual Cash Transfers:
MTA - Investment Income $0.136 $0.131 $0.162 $0.737 $2.180 $2.866MTA - Transfers 359.991 340.640 309.852 300.842 284.969 268.101NYCT - Transfers 245.971 219.794 198.347 188.807 171.971 155.705
Total Cash Transfers: $606.099 $560.565 $508.360 $490.385 $459.120 $426.672
SUPPORT TO MASS TRANSIT:
Total Revenues $1,682.615 $1,694.309 $1,694.291 $1,705.996 $1,713.164 $1,721.484Less: Net Operating Expenses 424.645 503.711 511.765 523.878 539.274 557.533
Net Operating Income: $1,257.970 $1,190.597 $1,182.526 $1,182.118 $1,173.889 $1,163.951
Deductions from Operating Income:
B&T Debt Service $207.227 $241.834 $264.830 $275.455 $297.449 $321.429Capitalized Assets 14.525 17.843 17.849 20.635 21.056 21.475Reserves 28.573 25.895 26.382 26.881 27.338 27.824GASB Reserves 3.077 1.610 0.000 0.000 0.000 0.182
Total Deductions from Operating Income: $253.402 $287.182 $309.061 $322.971 $345.843 $370.910
Total Support to Mass Transit: $1,004.568 $903.415 $873.465 $859.147 $828.047 $793.041
MTA BRIDGES AND TUNNELSJuly Financial Plan 2015-2018
Accrual Statement of Operations by Category($ in millions)
V-10

MTA BRIDGES and TUNNELS2014 Mid-Year Forecast
Non-Reimbursable/Reimbursable Overtime ($ in millions)
NON-REIMBURSABLE OVERTIME Hours $ %
OPERATIONS & MAINTENANCE
Scheduled Service 49,891 $2.856 12.5%
Unscheduled Service 12,091 0.679 3.0%
Programmatic/Routine Maintenance 446 0.039 0.2%
Unscheduled Maintenance 21,232 1.921 8.4%
Vacancy/Absentee Coverage 153,317 9.411 41.1%
Weather Emergencies 20,393 1.789 7.8%
Safety/Security/Law Enforcement 28,666 1.691 7.4%
Other 9,134 1.007 4.4%
All Other Departments and Accruals1 3.491 15.3%
Subtotal 295,170 $22.886 100%
REIMBURSABLE OVERTIME 5,677 $0.407
TOTAL OVERTIME 300,847 $23.293
Total
1 Includes overtime for all departments other than Operations and Maintenance, and adjustments to reflect the 28-day payroll lag. Does not include hours.
V-11

MTA BRIDGES AND TUNNELS 2015 Preliminary Budget
July Financial Plan 2015–2018 Year-to-Year Changes by Category - Baseline
Toll Revenue At current crossing charges, toll revenue is estimated at $1,651.2 million in 2014 and
$1,655.1 million in 2015, an increase of over $3.8 million primarily due to additional traffic volume resulting from forecast regi onal employment growth of 1.5%. Traffic estimates increase from 281.9 million vehicles in 2014 to 283.2 million in 2015.
Toll revenue increases to $1,664.7 in 2016, $1,670.4 in 2017 and $1,678.4 million in 2018, reflecting traffic volume increases fr om projected regional employment growth of approximately 1.0% per y ear, and the additional leap year day in 2016. Traffic levels are forecast at 285.3 million vehicles in 2016, 286.6 million in 2017, and 288.4 million in 2018.
Other Operating Revenue Other Operating Revenue is estimated at $21.7 millio n in 2014 and $16.9 million in
2015, a year-to-year drop of $4.8 million. Revenu e in 2014 includes $2.5 million in expected reimbursements from FEMA for Sandy-relat ed costs. Also in 2014, an insurance settlement of $2.2 million is anti cipated for costs associated with T ropical Storm Irene. Due to the uncertainty of future rei mbursements and costs, no reimbursement projections are included in B&T’s 2015 Preliminary Budget.
Other Operating Rev enue increases by $0.2 millio n in 2016 to reflect projected additional receipts from the Battery Parkin g Garage, after which revenues from this and other non-toll sources are not expected to grow significantly.
Capital and Other Reimbursements Capital and Other Reimbursements increas e by $0.4 million in 2015, $0.5 million in
2016, $0.7 million in 2017 and $0.3 mill ion in 2018. These adj ustments are tied t o expected work to be performed through the Capital Programs.
Investment Income The Investment Income plan for 2014 th rough 2018 reflects earnings on estimated
fund balances based on projected short-term investment yields, which continue to be forecast at very low interest ra tes. To tal investment income is estimated at $0.2 million in 2014 and $0.7 million in 2015.
Short-term interest rates are forecast to grow each year from 2016 on. Income projections are $2.2 million in 2016, $2.9 million in 2017 and $3.0 million in 2018.
V-12

Payroll In 2015, expenses increase by $2.8 millio n, primarily reflecting contractual step-up
increases, the filling of 2014 vacancies and inflationary adjustments. Thereafter, contractual step-up increases and inflationary adjustments result in
expense growth of $ 2.8 million in 2016, $4.3 millio n in 2017, and $3.6 million in 2018.
Salaries for most represented employ ees are expected t o include contract settlements for increases to compensation earned between 2009 and 2011, followed by a five year contract effective thr ough 2016, with CPI-based increases assumed thereafter. Wage inflation for represented employees is 2.22% in 2015, 1.88% in 2016 and 2.0% in both 2017 and 2018.
Salaries for non-represented employees, w ho have not received a general salar y increase during the last five years, are a ssumed to follow CPI-based increases. The 2014 Mid-Year Forecast baseline includes the compounding of r aises for 2012 and 2013; however, as of the July Plan, no raises have been granted
Wage inflation for non-represented employ ees is 1.85% in 2015, 1.89% i n 2016, 1.85% in 2017, and 1.80% in 2018.
Overtime As discussed under Payroll abov e, upon expected contract settlements in 2014, it's
anticipated that retroactive compensation increases dating back to 2009 will be fully paid by the end of the year. Despite pr ojected wage growth of 2.22% in 2015, Overtime is only $36,000 higher than in 2014 due to the retroactive payments.
Wage inflation rates for overtime are the same as for payroll and result in growth of $0.5 million each year from 2016 through 2018.
Health and Welfare/OPEB Current Payments In 2015, there is an increase of $3.8 mill ion from 2014 primar ily due to forecast
inflation for defined medical programs. The year-over-year increases from 2016 to 2018 are $ 1.3 million, $2.6 million, and
$2.5 million respectively, and are primarily the result of fo recast inflation for defined medical programs.
Inflation rates for defined medic al programs are 5.0% in 2015, 2.6% in 2016, and 5.0% each year thereafter.
Pension Pension expenses in this Ju ly Financial Plan reflect current projections for the NYC
Employee Retirement System (NYCERS) provided by the NYC Office of the Actuary. Costs decline by $1.1 million in 2015, $0.4 million in 2016, and $0.1 million in 2017,
with an increase of $0.5 million projected for 2018.
V-13

Other Fringe Benefits The year-over-year increase from 2014 to 2015 of $0.3 million is primarily due to
higher FICA and other expenses associat ed with the previously discussed payrol l and overtime changes.
Thereafter, expenses increase by $0.3 million in both 2015 and 2016, and by $0.4 million in 2018 primarily due to the inflationary adjustments for payroll and overtime.
Electric Power Expenses for Electric Power decline by $0.7 million in 2015, and increase each year
thereafter between $0.3 million and $1.1 m illion based on the most recent rate projections.
Fuel The expense plan for fuel is driven mainly by current projections for heating fuel.
Expenses are forecast to declin e $0.1 milli on each y ear from 2015 throug h 2017, with an increase of $0.1 million estimated for 2018.
Insurance Insurance costs increase between $1.1 million and $1.7 million annually from 2015
through 2018 based on current insurance policy growth assumptions. Maintenance and Other Operating Contracts Year-to-year expenses are projected to be $4.5 millio n higher in 2015. The main
driver for the increase is an additional $1 6.7 million in major maintenance t o ensure that key bridge and t unnel components are properly maintained to maximize the level of service they prov ide until large sc ale rehabilitation or replacemen t work under the capital program can be carried ou t. This is partially of fset by approximately $14.5 million in Sandy-relate d work that is not eligible for the capit al program and that is expected to be completed in 2014. The only other significant increase is for E-ZPass Cust omer Service Center expenses, which are estimated to rise by $2 .1 million primarily d ue to anticipated account growth and e xpenses associated with the All Electronic Tolli ng (AET) program. Other small increases across numerous miscellaneous maintenance contracts are largely inflation based.
Expenses grow by $ 5.9 million in 2016, $5.6 millio n in 2017, and $6.7 million in 2018. Much of the growth ($2.0 million in 2016, $3.3 million in 2017 and $1.4 million in 2018) is driven by anticipated increas es in major maintenance and preventive maintenance needs for the af orementioned reasons. The cyclical needs of the E-ZPass Tag Replacement program also represent a significant portion of the year-to-year changes, with $2.3 million more needed in 2015, followed by a decline of $0.4 million in 2017 and an increase of $2.9 million in 20 18. E-ZPass Customer Service Center costs are estimated to rise by a pproximately $1.1 million each year to fund
V-14

forecast account growth and AET-related services. Inflationary adjustments account for most of the expense growth in other cost centers within this category.
Inflationary adjustments are bas ed on a national CPI- U forecast of 1.74% in 2015, 1.77% in 2016, 1.85% in 201 7 and 2.03% in 2018. These factors also apply to the expense categories that follow (Professi onal Service Contracts, Materi als and Supplies and Other Business Expenses).
Professional Service Contracts In 2015, expenses decline by $1.7 million pr imarily due to the ex pected completion
of several projects budgeted in 2014 under General Engineering Services. Expenses decline by $0.8 million in 201 6 and $1.1 m illion in 2017, primarily
reflecting the projected cyclical workflow of several engineering studies and projects, and then increase by $0.8 mil lion in 2018 mainly as a result of inflationary adjustments.
Materials and Supplies Expenses are $0.3 milli on lower in 2015, reflecting a return to baseline projections
for de-icing materials after the severe winte r of 2014, followed by expense growth of $0.1 million each year thereafter based on inflationary adjustments.
Other Business Expenses Expenses decline by $0.5 million in 2015 due to an anticipated lower write-off of debt
associated with outstanding E-Z Pass account balances compared to 2014 . From 2016 through 2018, exp enses are between $0.6 million and $ 0.7 million greater each year primarily due to inflationary adjustments.
V-15

NON-REIMBURSABLE
2014 2015
Change 2015 -
2014 2016
Change 2016 -
2015 2017
Change 2017 -
2016 2018
Change 2018 -
2017 RevenueVehicle Toll Revenue 1,651.216$ 1,655.058$ 3.842$ 1,664.664$ 9.606$ 1,670.445$ 5.781$ 1,678.406$ 7.961$ Other Operating Revenue 21.701 16.869 (4.832) 17.044 0.175 17.044 - 17.044 - Capital and Other Reimbursements 0.000 0.000 - 0.000 - 0.000 - 0.000 - Investment Income 0.162 0.737 0.575 2.180 1.443 2.866 0.686 2.961 0.095 Total Revenue 1,673.079$ 1,672.664$ (0.415)$ 1,683.888$ 11.224$ 1,690.355$ 6.467$ 1,698.411$ 8.056$
ExpensesLabor:Payroll 138.601$ 141.336$ (2.735)$ 144.046$ (2.710)$ 148.246$ (4.201)$ 151.802$ (3.556)$ Overtime 22.886 22.842 0.044 23.349 (0.507) 23.804 (0.456) 24.280 (0.475) Health and Welfare 27.677 30.524 (2.847) 31.219 (0.695) 32.741 (1.522) 34.148 (1.407) OPEB Current Payment 16.102 16.907 (0.805) 17.347 (0.440) 18.214 (0.867) 19.125 (0.911) Pensions 30.452 29.242 1.210 28.716 0.526 28.425 0.291 28.741 (0.316) Other Fringe Benefits 18.134 18.382 (0.248) 18.664 (0.282) 18.909 (0.245) 19.265 (0.356) Reimbursable Overhead (5.095) (5.145) 0.050 (5.196) 0.051 (5.442) 0.246 (5.227) (0.215) Total Labor Expenses 248.757$ 254.087$ (5.330)$ 258.144$ (4.057)$ 264.897$ (6.753)$ 272.134$ (7.236)$
Non-Labor:Electric Power 7.350$ 6.645$ 0.706$ 6.956$ (0.311)$ 8.055$ (1.099)$ 8.747$ (0.691)$ Fuel 2.959 2.860 0.099 2.757 0.103 2.657 0.100 2.717 (0.060) Insurance 16.294 17.386 (1.092) 18.874 (1.488) 20.438 (1.564) 22.178 (1.739) Claims 0.135 - 0.135 - - - - - - Paratransit Service Contracts - - - - - - - - - Maintenance and Other Operating Contracts 129.516 134.061 (4.545) 139.965 (5.905) 145.614 (5.648) 152.274 (6.660) Professional Service Contracts 43.788 42.134 1.654 41.379 0.755 40.260 1.119 41.062 (0.802) Materials & Supplies 4.603 4.338 0.265 4.420 (0.083) 4.548 (0.127) 4.646 (0.098) Other Business Expenses 29.080 28.627 0.452 29.275 (0.647) 29.996 (0.722) 30.704 (0.707) Total Non-Labor Expenses 233.725$ 236.050$ (2.326)$ 243.626$ (7.576)$ 251.568$ (7.942)$ 262.327$ (10.759)$
Other Expenses Adjustments:Other - - - - - - - - - Total Other Expense Adjustments -$ -$ -$ -$ -$ -$ -$ -$ -$
Total Expenses before Depreciation and GASB Adjs. 482.482$ 490.137$ (7.656)$ 501.770$ (11.633)$ 516.465$ (14.695)$ 534.460$ (17.995)$
Add: Depreciation 104.389$ 111.667$ (7.278)$ 119.521$ (7.854)$ 127.853$ (8.332)$ 127.853$ -$ Add: OPEB Obligation 66.944 70.291 (3.347) 73.806 (3.515) 77.496 (3.690) 81.371 (3.875) Add: Environmental Remediation - - - - - - - - -
Total Expenses after Depreciation and GASB Adjs. 653.815$ 672.096$ (18.281)$ 695.097$ (23.001)$ 721.814$ (26.718)$ 743.684$ (21.870)$
Less: Depreciation 104.389 111.667 (7.278) 119.521 (7.854) 127.853 (8.332) 127.853 - Less: OPEB Obligation 66.944 70.291 (3.347) 73.806 (3.515) 77.496 (3.690) 81.371 (3.875)
Total Expenses 482.482$ 490.137$ (7.656)$ 501.770$ (11.633)$ 516.465$ (14.695)$ 534.460$ (17.995)$
Baseline Income/(Deficit) 1,190.597$ 1,182.526$ (8.071)$ 1,182.118$ (0.408)$ 1,173.889$ (8.228)$ 1,163.951$ (9.939)$
Favorable/(Unfavorable)
MTA BRIDGES AND TUNNELSJuly Financial Plan 2015-2018
Year-to-Year Changes by Category - Accrual Basis($ in millions)
V-16

REIMBURSABLE
2014 2015
Change 2015 -
2014 2016
Change 2016 -
2015 2017
Change 2017 -
2016 2018
Change 2018 -
2017 RevenueVehicle Toll Revenue -$ -$ -$ -$ -$ -$ -$ -$ -$ Other Operating Revenue - - - - - - - - - Capital and Other Reimbursements 21.230 21.628 0.398 22.108 0.480 22.809 0.701 23.073 0.264 Investment Income - - - - - - - - - Total Revenue 21.230$ 21.628$ 0.398$ 22.108$ 0.480$ 22.809$ 0.701$ 23.073$ 0.264$
ExpensesLabor:Payroll 9.735$ 9.810$ (0.075)$ 9.894$ (0.084)$ 9.976$ (0.082)$ 10.060$ (0.084)$ Overtime 0.407 0.415 (0.008) 0.420 (0.005) 0.426 (0.006) 0.432 (0.006) Health and Welfare 2.177 2.287 (0.110) 2.446 (0.159) 2.607 (0.161) 2.785 (0.178) OPEB Current Payment - - - - - - - - - Pensions 2.571 2.702 (0.131) 2.861 (0.159) 3.022 (0.161) 3.196 (0.174) Other Fringe Benefits 1.245 1.269 (0.024) 1.291 (0.022) 1.336 (0.045) 1.373 (0.037) Reimbursable Overhead 5.095 5.145 (0.050) 5.196 (0.051) 5.442 (0.246) 5.227 0.215 Total Labor Expenses 21.230$ 21.628$ (0.398)$ 22.108$ (0.480)$ 22.809$ (0.701)$ 23.073$ (0.264)$
Non-Labor:Electric Power -$ -$ -$ -$ -$ -$ -$ -$ -$ Fuel - - - - - - - - - Insurance - - - - - - - - - Claims - - - - - - - - - Paratransit Service Contracts - - - - - - - - - Maintenance and Other Operating Contracts - - - - - - - - - Professional Service Contracts - - - - - - - - - Materials & Supplies - - - - - - - - - Other Business Expenses - - - - - - - - - Total Non-Labor Expenses -$ -$ -$ -$ -$ -$ -$ -$ -$
Other Expenses Adjustments:Other - - - - - - - - - Total Other Expense Adjustments -$ -$ -$ -$ -$ -$ -$ -$ -$
Total Expenses before Depreciation and GASB Adjs. 21.230$ 21.628$ (0.398)$ 22.108$ (0.480)$ 22.809$ (0.701)$ 23.073$ (0.264)$
Add: Depreciation -$ -$ -$ -$ -$ -$ -$ -$ -$ Add: OPEB Obligation - - - - - - - - - Add: Environmental Remediation - - - - - - - - -
Total Expenses after Depreciation and GASB Adjs. 21.230$ 21.628$ (0.398)$ 22.108$ (0.480)$ 22.809$ (0.701)$ 23.073$ (0.264)$
Less: Depreciation - - - - - - - - - Less: OPEB Obligation - - - - - - - - -
Total Expenses 21.230$ 21.628$ (0.398)$ 22.108$ (0.480)$ 22.809$ (0.701)$ 23.073$ (0.264)$
Baseline Income/(Deficit) -$ -$ -$ -$ -$ -$ -$ -$ -$
($ in millions)
MTA BRIDGES AND TUNNELSJuly Financial Plan 2015-2018
Year-to-Year Changes by Category - Accrual Basis
Favorable/(Unfavorable)
V-17

NON-REIMBURSABLE and REIMBURSABLE(Page 1 of 2)
2014 2015
Change 2015 -
2014 2016
Change 2016 -
2015 2017
Change 2017 -
2016 2018
Change 2018 -
2017 RevenueVehicle Toll Revenue 1,651.216$ 1,655.058$ 3.842$ 1,664.664$ 9.606$ 1,670.445$ 5.781$ 1,678.406$ 7.961$ Other Operating Revenue 21.701 16.869 (4.832) 17.044 0.175 17.044 - 17.044 - Capital and Other Reimbursements 21.230 21.628 0.398 22.108 0.480 22.809 0.701 23.073 0.264 Investment Income 0.162 0.737 0.575 2.180 1.443 2.866 0.686 2.961 0.095 Total Revenue 1,694.309$ 1,694.291$ (0.017)$ 1,705.996$ 11.704$ 1,713.164$ 7.168$ 1,721.484$ 8.320$
ExpensesLabor:Payroll 148.336$ 151.146$ (2.810)$ 153.940$ (2.794)$ 158.222$ (4.283)$ 161.862$ (3.640)$ Overtime 23.293 23.256 0.036 23.768 (0.512) 24.230 (0.462) 24.711 (0.481) Health and Welfare 29.854 32.811 (2.957) 33.665 (0.854) 35.348 (1.683) 36.933 (1.585) OPEB Current Payment 16.102 16.907 (0.805) 17.347 (0.440) 18.214 (0.867) 19.125 (0.911) Pensions 33.023 31.944 1.079 31.577 0.367 31.447 0.130 31.937 (0.490) Other Fringe Benefits 19.379 19.651 (0.272) 19.955 (0.304) 20.245 (0.290) 20.638 (0.393) Reimbursable Overhead - - - - - - - - - Total Labor Expenses 269.987$ 275.715$ (5.728)$ 280.252$ (4.537)$ 287.706$ (7.454)$ 295.207$ (7.500)$
Non-Labor:Electric Power 7.350$ 6.645$ 0.706$ 6.956$ (0.311)$ 8.055$ (1.099)$ 8.747$ (0.691)$ Fuel 2.959 2.860 0.099 2.757 0.103 2.657 0.100 2.717 (0.060) Insurance 16.294 17.386 (1.092) 18.874 (1.488) 20.438 (1.564) 22.178 (1.739) Claims 0.135 - 0.135 - - - - - - Paratransit Service Contracts - - - - - - - - - Maintenance and Other Operating Contracts 129.516 134.061 (4.545) 139.965 (5.905) 145.614 (5.648) 152.274 (6.660) Professional Service Contracts 43.788 42.134 1.654 41.379 0.755 40.260 1.119 41.062 (0.802) Materials & Supplies 4.603 4.338 0.265 4.420 (0.083) 4.548 (0.127) 4.646 (0.098) Other Business Expenses 29.080 28.627 0.452 29.275 (0.647) 29.996 (0.722) 30.704 (0.707) Total Non-Labor Expenses 233.725$ 236.050$ (2.326)$ 243.626$ (7.576)$ 251.568$ (7.942)$ 262.327$ (10.759)$
Other Expenses Adjustments:Other - - - - - - - - - Total Other Expense Adjustments -$ -$ -$ -$ -$ -$ -$ -$ -$
Total Expenses before Depreciation and GASB Adjs. 503.711$ 511.765$ (8.054)$ 523.878$ (12.113)$ 539.274$ (15.396)$ 557.533$ (18.259)$
Add: Depreciation 104.389$ 111.667$ (7.278)$ 119.521$ (7.854)$ 127.853$ (8.332)$ 127.853$ -$ Add: OPEB Obligation 66.944 70.291 (3.347) 73.806 (3.515) 77.496 (3.690) 81.371 (3.875) Add: Environmental Remediation - - - - - - - - -
Total Expenses after Depreciation and GASB Adjs. 675.044$ 693.723$ (18.679)$ 717.205$ (23.481)$ 744.623$ (27.419)$ 766.757$ (22.134)$
Less: Depreciation 104.389 111.667 (7.278) 119.521 (7.854) 127.853 (8.332) 127.853 - Less: OPEB Obligation 66.944 70.291 (3.347) 73.806 (3.515) 77.496 (3.690) 81.371 (3.875)
Total Expenses 503.711$ 511.765$ (8.054)$ 523.878$ (12.113)$ 539.274$ (15.396)$ 557.533$ (18.259)$
Baseline Income/(Deficit) 1,190.597$ 1,182.526$ (8.071)$ 1,182.118$ (0.408)$ 1,173.889$ (8.228)$ 1,163.951$ (9.939)$
Favorable/(Unfavorable)
MTA BRIDGES AND TUNNELSJuly Financial Plan 2015-2018
Year-to-Year Changes by Category - Accrual Basis($ in millions)
V-18

NON-REIMBURSABLE and REIMBURSABLE(Page 2 of 2)
2014 2015
Change 2015 -
2014 2016
Change 2016 -
2015 2017
Change 2017 -
2016 2018
Change 2018 -
2017
Baseline Net Income/(Deficit) 1,190.597$ 1,182.526$ (8.071)$ 1,182.118$ (0.408)$ 1,173.889$ (8.228)$ 1,163.951$ (9.939)$
Deductions from Income:Less: Capitalized Assets 17.843$ 17.849$ (0.006)$ 20.635$ (2.786)$ 21.056$ (0.421)$ 21.475$ (0.419)$ Reserves 25.895 26.382 (0.487) 26.881 (0.499) 27.338 (0.457) 27.824 (0.487) GASB 45 Reserves 1.610 - 1.610 - - - - 0.182 (0.182)
Adjusted Baseline Net Income/(Deficit) 1,145.249$ 1,138.295$ (6.954)$ 1,134.602$ (3.693)$ 1,125.496$ (9.106)$ 1,114.469$ (11.027)$
Less: Debt Service 597.868 633.695 (35.827) 644.353 (10.658) 669.149 (24.796) 691.000 (21.851)
Income Available for Distribution 547.381$ 504.600$ (42.781)$ 490.249$ (14.351)$ 456.347$ (33.902)$ 423.469$ (32.878)$
Distributable To: MTA - Investment Income 0.162$ 0.737$ 0.575$ 2.180$ 1.443$ 2.866$ 0.686$ 2.961$ 0.095$ MTA - Distributable Income 327.101 307.935 (19.166) 300.053 (7.882) 283.293 (16.761) 266.413 (16.879) NYCT - Distributable Income 220.118 195.928 (24.190) 188.016 (7.912) 170.189 (17.827) 154.095 (16.093)
Total Distributable Income: 547.381$ 504.600$ (42.781)$ 490.249$ (14.351)$ 456.347$ (33.902)$ 423.469$ (32.878)$
Actual Cash Transfers: MTA - Investment Income 0.131$ 0.162$ 0.031$ 0.737$ 0.575$ 2.180$ 1.443$ 2.866$ 0.686$ MTA - Transfers 340.640 309.852 (30.788) 300.842 (9.010) 284.969 (15.873) 268.101 (16.868) NYCT - Transfers 219.794 198.347 (21.446) 188.807 (9.540) 171.971 (16.835) 155.705 (16.267)
Total Cash Transfers: 560.565$ 508.360$ (52.204)$ 490.385$ (17.975)$ 459.120$ (31.265)$ 426.672$ (32.448)$
SUPPORT TO MASS TRANSIT: Total Revenues $1,694.309 $1,694.291 ($0.017) $1,705.996 $11.704 $1,713.164 $7.168 $1,721.484 $8.320 Less: Net Operating Expenses 503.711 511.765 (8.054) 523.878 (12.113) 539.274 (15.396) 557.533 (18.259)
Net Operating Income: 1,190.597$ 1,182.526$ (8.071)$ 1,182.118$ (0.408)$ 1,173.889$ (8.228)$ 1,163.951$ (9.939)$
Deductions from Operating Income:B&T Debt Service $241.834 $264.830 ($22.996) $275.455 ($10.626) $297.449 ($21.994) $321.429 ($23.979)Capitalized Assets 17.843 17.849 (0.006) 20.635 (2.786) 21.056 (0.421) 21.475 (0.419) Reserves 25.895 26.382 (0.487) 26.881 (0.499) 27.338 (0.457) 27.824 (0.487) GASB 45 Reserves 1.610 - 1.610 - - - - 0.182 (0.182)
Total Deductions from Operating Inc: 287.182$ 309.061$ (21.879)$ 322.971$ (13.910)$ 345.843$ (22.872)$ 370.910$ (25.067)$
Total Support to Mass Transit: 903.415$ 873.465$ (29.950)$ 859.147$ (14.318)$ 828.047$ (31.100)$ 793.041$ (35.006)$
Favorable/(Unfavorable)
($ in millions)
MTA BRIDGES AND TUNNELSJuly Financial Plan 2015-2018
Year-to-Year Changes by Category - Accrual Basis
V-19

MTA BRIDGES AND TUNNELS 2015 Preliminary Budget
July Financial Plan 2015–2018 Summary of Major Plan-to-Plan Changes
Non-Reimbursable 2014: July Financial Plan vs. February Financial Plan Revenues Revenue adjustments from the February Plan gen erate an additional $7.3 million. Th e major changes include: Additional toll revenues ($1. 7 million) stemming from rec ent favorable traffic trend s
compared to the original forecast. Increased Other Operating Revenues ( $5.6 million) primarily due to revised
assumptions for San dy-related FEMA re imbursements ($2.5 million), in surance settlements related to Tropical Storm Irene ($2.2 million), and favorable re-estimates of several non-toll r evenue sources includi ng receipts from the Battery Parking Garage, E-ZPass administrative fees, and others ($0.9 million).
Expenses Non-reimbursable expenses are projected to be $12.0 million greater than the February Plan. Lab or costs are $4.8 million hi gher and non-la bor expenses are $7.2 millio n higher. The major variances include: Labor
o Higher Payroll ($5.7 million), Overtime ($1.7 million) and associated Other Fringe Benefits ($0.5 million) primarily due to the expe cted settlement of union contracts, including retroactive paym ents for compensation increases d ating back to 2009.
o A net increase in Health and Welfare/OPEB Current Payment ($0.3 million) due to GASB Reserve adjustments which have greater favorable impacts to adjusted baseline income (see Total Deductions from Income).
o Lower Pension expense ($3.4 million) to incorporate the most recent estimate provided by the NYC Office of the Actuary.
Non-Labor o Lower expenses in Maintenan ce and Other Operating Contra cts ($0.4 million)
resulting primarily from the reclassification of several engineering projects from Major Maintenance to areas falling under Pr ofessional Service Contracts ($4.4 million) and small favorable r e-estimates across numerous miscellan eous maintenance contracts ($0.9 million), parti ally offset by an additional $4.9 million in Sandy-related expenses that were deferred from 2013 into 2014.
o Higher expenses for Professional Service Contracts ($7.3 m illion) primarily due to the engineering project reclassifications cited above ($4.4 million), higher bond issuance fees resulting from increased fi nancing activities ($1.9 million), and higher re-estimates for procurement credit card purchases ($0.9 million).
V-20

o Increased Materials & Supplies ($0.3 million) for extr a de-icing materials needed for the harsh winter a nd higher Other Business Expenses ($0.3 million) resulting from additional projected E-ZPass debt.
Total Deductions from Income o The GASB Reserve for future retiree hea lth benefit costs has been reduced by
$1.6 million. o B&T Debt Service has been increased by $1.1 million.
2015-2017: July Financial Plan vs. February Financial Plan Revenues From 2015 through 2017, total revenues are being increased between $3.1 million and $5.3 million annually.
Increases in toll revenue range between $2 .2 million and $4.5 million each y ear, reflecting the higher baseline traffic from 2014 and current projections for regional employment and inflation.
Other Operating Rev enue is gr eater by $0.9 millio n on average each y ear primarily due to the expecte d continuation of improved re ceipts from the Battery Parking Garage, higher E-ZPass adminis trative fees, and ot her small non-toll revenue sources.
Expenses Non-reimbursable expenses increase by $1.6 million in 2015, followed by decreases of $2.8 million in 2016 and $5.4 million in 2017.
Labor Expenses increase by $3.6 million in 2015, $1.1 million in 2016 and $0.1 million in 2017 based on the following major changes: o Higher Payroll, Overtime and as sociated Other Fringe Benefits of $6.7 million in
2015, $7.1 million in 2016 and $7.3 million in 2018 primarily fo r the previously discussed expectation of union contract settlements in 2014.
o Net increases to Health and Welfare/O PEB Current Payment of $2.3 millio n in 2015, $0.8 million in 2016 a nd $0.5 million in 201 7 stemming from GASB Reserve adjustments which have greater favorable impacts on adjusted baseline income (see Total Deductions from Income).
o Lower Pension expenses of $5.4 million in 2015, $6.8 million in 2016, and $7.7 million in 2017 based on the mo st recent projections provided by the NYC Office of the Actuary.
Non-Labor Non-Labor expenses decline by $2.0 million in 2015, $3.9 million in 2016 and $5.4 million in 2017 based on the following major changes: o The expense plan for Insurance has been revised downward by $2.5 million in
2015, $4.3 million in 2016, and $6.5 million in 2017.
V-21

o Energy re-estimates bring down projected costs by $1.1 million in both 2015 an d 2016, and by $0.6 million in 2017.
o Net total increases ac ross all the other expense categories range between $1.5 million and $1.7 million each year and are primarily driven by the following factors: o Higher bond issuance costs averagi ng $3.0 millio n per yea r due to an
expected continuation of increased financing activities. o Lower credit/debit card fees of approx imately $1.0 million annually based on
current expense trends. o Lower E-ZPass tag expenses of approximately $0.6 million per year based on
the most recent projec ted inventory and replacem ent identification dat a available.
Total Deductions from Income Total deductions are lower by $2.4 millio n in 2015, $14.7 million in 2016 and $21.3 million in 2017, reflecting the following changes:
o Reduced contributions to the GASB Rese rve for future retiree health be nefit costs of $3.4 million in 2015, $3.6 million in 2016, and $3.8 million in 2017.
o B&T Debt Service is higher by over $0.9 million in 2 015, and is lower by n early $11.2 million in 2016 and $17.6 million in 2017.
Reimbursable There are no changes from the February Fi nancial Plan in reim bursable income and expenses for 2014 through 2017.
V-22

2014 2015 2016 2017
$1,148.291 $1,133.402 $1,124.500 $1,111.071
Baseline Changes
RevenueVehicle Toll Revenue $1.728 $2.159 $2.805 $4.515Other Operating Revenue 5.603 0.937 0.943 0.763Investment Income 0.000 0.000 0.000 0.000
Total Revenue Changes $7.331 $3.096 $3.748 $5.278
ExpensesLabor:Payroll ($5.701) ($5.023) ($5.306) ($5.500)Overtime (1.658) (1.185) (1.245) (1.281)Health and Welfare (0.337) (2.161) (1.248) (1.063)OPEB Current Payment 0.066 (0.124) 0.410 0.572Pensions 3.397 5.419 6.765 7.738Other Fringe Benefits (0.539) (0.480) (0.506) (0.523)Reimbursable Overhead 0.000 0.000 0.000 0.000
Total Labor Expense Changes ($4.773) ($3.554) ($1.130) ($0.057)
Non-Labor:Electric Power $0.210 $1.160 $1.214 $0.485Fuel 0.000 (0.066) (0.076) 0.077Insurance 0.172 2.528 4.289 6.541Claims (0.135) 0.000 0.000 0.000Paratransit Service Contracts 0.000 0.000 0.000 0.000Maintenance and Other Operating Contracts 0.354 2.815 2.406 (0.109)Professional Service Contracts (7.251) (5.309) (4.852) (2.497)Materials & Supplies (0.303) 0.040 0.111 0.111Other Business Expenses (0.271) 0.824 0.841 0.839
Total Non-Labor Expense Changes ($7.224) $1.994 $3.933 $5.447
Total Expenses before Depreciation and GASB Adjs. ($11.997) ($1.560) $2.803 $5.390
Add: Depreciation $0.000 $0.000 $0.000 $0.000 OPEB Obligation 13.539 14.215 14.926 15.673 Environmental Remediation 0.000 0.000 0.000 0.000
Total Expenses after Depreciation and GASB Adjs. $1.542 $12.656 $17.729 $21.062
Less: Depreciation $0.000 $0.000 $0.000 $0.000 OPEB Obligation 13.539 14.215 14.926 15.673
Total Expense Changes ($11.997) ($1.560) $2.803 $5.390
($4.666) $1.536 $6.551 $10.668
Deductions from IncomeCapitalized Assets $0.000 $0.000 $0.000 $0.000Capital Reserves 0.000 0.000 0.000 0.000GASB 45 Reserves 1.624 3.357 3.551 3.757
Total Deductions from Income $1.624 $3.357 $3.551 $3.757
($3.042) $4.893 $10.102 $14.425
$1,145.249 $1,138.295 $1,134.602 $1,125.496
MTA BRIDGES AND TUNNELSJuly Financial Plan 2015-2018
Changes Between Financial Plans by Generic Categories($ in millions)
Total Adjusted Baseline Changes
NON-REIMBURSABLE
Total Baseline Changes
2014 February Financial Plan - Adjusted Baseline Income
2014 July Financial Plan - Surplus/(Deficit)
V-23

2014 2015 2016 2017
$0.000 $0.000 $0.000 $0.000
Baseline Changes
RevenueVehicle Toll Revenue $0.000 $0.000 $0.000 $0.000Other Operating Revenue 0.000 0.000 0.000 0.000Capital and Other Reimbursement 0.000 0.000 0.000 0.000Investment Income 0.000 0.000 0.000 0.000
Total Revenue Changes $0.000 $0.000 $0.000 $0.000
ExpensesLabor:Payroll $0.000 $0.000 $0.000 $0.000Overtime 0.000 0.000 0.000 0.000Health and Welfare 0.000 0.000 0.000 0.000OPEB Current Payment 0.000 0.000 0.000 0.000Pensions 0.000 0.000 0.000 0.000Other Fringe Benefits 0.000 0.000 0.000 0.000Reimbursable Overhead 0.000 0.000 0.000 0.000
Total Labor Expense Changes $0.000 $0.000 $0.000 $0.000
Non-Labor:Electric Power $0.000 $0.000 $0.000 $0.000Fuel 0.000 0.000 0.000 0.000Insurance 0.000 0.000 0.000 0.000Claims 0.000 0.000 0.000 0.000Paratransit Service Contracts 0.000 0.000 0.000 0.000Maintenance and Other Operating Contracts 0.000 0.000 0.000 0.000Professional Service Contracts 0.000 0.000 0.000 0.000Materials & Supplies 0.000 0.000 0.000 0.000Other Business Expenses 0.000 0.000 0.000 0.000
Total Non-Labor Expense Changes $0.000 $0.000 $0.000 $0.000
Total Expenses before Depreciation $0.000 $0.000 $0.000 $0.000
Add: Depreciation $0.000 $0.000 $0.000 $0.000 OPEB Obligation 0.000 0.000 0.000 0.000 Environmental Remediation 0.000 0.000 0.000 0.000
Total Expenses after Depreciation and GASB Adjs. $0.000 $0.000 $0.000 $0.000
Less: Depreciation $0.000 $0.000 $0.000 $0.000 OPEB Obligation 0.000 0.000 0.000 0.000
Total Expense Changes $0.000 $0.000 $0.000 $0.000
Cash Adjustment Changes
Total Cash Adjustment Changes $0.000 $0.000 $0.000 $0.000
$0.000 $0.000 $0.000 $0.000
Deductions from IncomeCapitalized Assets $0.000 $0.000 $0.000 $0.000Capital Reserves 0.000 0.000 0.000 0.000GASB 45 Reserves 0.000 0.000 0.000 0.000
Total Deductions from Income $0.000 $0.000 $0.000 $0.000
$0.000 $0.000 $0.000 $0.000
$0.000 $0.000 $0.000 $0.000
Total Adjusted Baseline Changes
2014 July Financial Plan - Surplus/(Deficit)
July Financial Plan 2015-2018Changes Between Financial Plans by Generic Categories
Total Baseline Changes
($ in millions)
REIMBURSABLE
2014 February Financial Plan - Adjusted Baseline Income
MTA BRIDGES AND TUNNELS
V-24

2014 2015 2016 2017
$1,148.291 $1,133.402 $1,124.500 $1,111.071
Baseline Changes
RevenueVehicle Toll Revenue $1.728 $2.159 $2.805 $4.515Other Operating Revenue 5.603 0.937 0.943 0.763 Capital and Other Reimbursement 0.000 0.000 0.000 0.000Investment Income 0.000 0.000 0.000 0.000
Total Revenue Changes $7.331 $3.096 $3.748 $5.278
ExpensesLabor:Payroll ($5.701) ($5.023) ($5.306) ($5.500)Overtime (1.658) (1.185) (1.245) (1.281) Health and Welfare (0.337) (2.161) (1.248) (1.063) OPEB Current Payment 0.066 (0.124) 0.410 0.572 Pensions 3.397 5.419 6.765 7.738 Other Fringe Benefits (0.539) (0.480) (0.506) (0.523) Reimbursable Overhead 0.000 0.000 0.000 0.000
Total Labor Expense Changes ($4.773) ($3.554) ($1.130) ($0.057)
Non-Labor:Electric Power $0.210 $1.160 $1.214 $0.485Fuel 0.000 (0.066) (0.076) 0.077Insurance 0.172 2.528 4.289 6.541 Claims (0.135) 0.000 0.000 0.000Paratransit Service Contracts 0.000 0.000 0.000 0.000Maintenance and Other Operating Contracts 0.354 2.815 2.406 (0.109) Professional Service Contracts (7.251) (5.309) (4.852) (2.497) Materials & Supplies (0.303) 0.040 0.111 0.111 Other Business Expenses (0.271) 0.824 0.841 0.839
Total Non-Labor Expense Changes ($7.224) $1.994 $3.933 $5.447
Total Expenses before Depreciation and GASB Adjs. ($11.997) ($1.560) $2.803 $5.390
Add: Depreciation $0.000 $0.000 $0.000 $0.000 OPEB Obligation 13.539 14.215 14.926 15.673 Environmental Remediation 0.000 0.000 0.000 0.000
Total Expenses after Depreciation and GASB Adjs. $1.542 $12.656 $17.729 $21.062
Less: Depreciation $0.000 $0.000 $0.000 $0.000 OPEB Obligation 13.539 14.215 14.926 15.673
Total Expense Changes ($11.997) ($1.560) $2.803 $5.390
($4.666) $1.536 $6.551 $10.668
Deductions from IncomeCapitalized Assets $0.000 $0.000 $0.000 $0.000Capital Reserves 0.000 0.000 0.000 0.000GASB 45 Reserves 1.624 3.357 3.551 3.757
Total Deductions from Income $1.624 $3.357 $3.551 $3.757
($3.042) $4.893 $10.102 $14.425
$1,145.249 $1,138.295 $1,134.602 $1,125.496
2014 February Financial Plan - Adjusted Baseline Income
Total Adjusted Baseline Changes
2014 July Financial Plan - Surplus/(Deficit)
Total Baseline Changes
MTA BRIDGES AND TUNNELSJuly Financial Plan 2015-2018
Changes Between Financial Plans by Generic Categories($ in millions)
NON-REIMBURSABLE and REIMBURSABLE
V-25

NON-REIMBURSABLE and REIMBURSABLE 2014 2015 2016 2017
February Financial Plan - Adjusted Baseline Income $1,148.291 $1,133.402 $1,124.500 $1,111.071
Non-Reimbursable Major Changes
RevenueIncreased toll revenue based on recent traffic trends $1.728 $2.159 $2.805 $4.515Favorable re-estimates of several Other Operating Income sources 0.922 0.937 0.942 0.763Expected Tropical Storm Irene Recovery 2.166 0.000 0.000 0.000Expected Superstorm Sandy Recovery 2.515 0.000 0.000 0.000
Sub-Total Non-Reimbursable Revenue Changes $7.331 $3.096 $3.747 $5.278
Expenses
Pension Re-Forecast from NYC Office of the Actuary $3.397 $5.419 $6.765 $7.738Insurance re-estimates 0.172 2.529 4.289 6.541Reduced Credit/Debit Card Fees based on actual trends 1.000 1.000 1.000 1.000Energy re-estimates 0.210 1.198 1.259 0.653Lower E-ZPass Tag Expenses based on most recent inventory data 0.000 0.600 0.600 0.600Vacancies 1.380 0.000 0.000 0.000Sandy-related Expenses (4.870) 0.000 0.000 0.000Health & Welfare/OPEB re-estimates (0.411) (2.241) (0.792) (0.444)Retroactive Union Contract Settlements (3.374) 0.000 0.000 0.000Revised Plan for Union Contract Settlements (5.666) (6.488) (6.855) (7.098)GASB Fund Adjustments 1.624 3.357 3.551 3.757Higher bond issuance fees due to increased financing activities (1.906) (2.610) (2.740) (2.846)Higher anticipated write-off of outstanding E-ZPass account balances (1.000) 0.000 0.000 0.000Net miscellaneous re-estimates across a variety of facility maintenance areas (0.533) (0.365) (0.365) (0.366)New NYS Workers' Comp Board-Unified Employer Assessment fees (0.269) (0.269) (0.269) (0.269)Additional staffing for All Electronic Tolling program and Minority and Women-Owned Business Enterprise program (0.128) (0.264) (0.270) (0.276)Inflation 0.000 (0.069) 0.182 0.157
Sub-Total Non-Reimbursable Expense Changes ($10.373) $1.797 $6.355 $9.147
Total Non-Reimbursable Major Changes ($3.042) $4.893 $10.102 $14.425
Reimbursable Major Changes
RevenueNone 0.000 0.000 0.000 0.000
Sub-Total Reimbursable Revenue Changes
ExpensesNone 0.000 0.000 0.000 0.000
Sub-Total Reimbursable Expense Changes
Total Reimbursable Major Changes $0.000 $0.000 $0.000 $0.000
Total Accrual Changes ($3.042) $4.893 $10.102 $14.425
Cash Adjustment Changes
Total Cash Adjustment Changes $0.000 $0.000 $0.000 $0.000
Total Baseline Changes ($3.042) $4.893 $10.102 $14.425
July Financial Plan - Surplus/(Deficit) $1,145.249 $1,138.295 $1,134.602 $1,125.496
MTA BRIDGES AND TUNNELSJuly Financial Plan 2015-2018
Summary of Major Programmatic Changes Between Financial Plans($ in millions)
V-26

MTA BRIDGES AND TUNNELS 2015 Preliminary Budget
July Financial Plan 2015–2018 Traffic/Utilization
Year-to-Year Paid traffic is forecas t at 281.9 million ve hicles in 2 014 and increases by 1.4 million vehicles in 2015 bas ed primarily on projected regional employ ment growth of 1.4%. The traffic forecast developed in year s 2016 - 2018 for the July Financia l Plan incorporates the most recent economic projections, which include regional employment growth of 1.4% in 2016, 1.1% in 2017 a nd 0.5% in 2018. In addition, an up ward adjustment has been made for the extra day in the 2016 leap-year. Paid traffic is forecast at 285.3 million vehicles in 2016, 286.6 million in 2017, and 288.4 million in 2018. Plan-to-Plan Paid traffic volume is projected to reach 281.9 mi llion vehicles in 2014, which is 0.3 million vehicles above the February Financial Plan. Although harsh weather in January and February pushed traffic below orig inal projections by 1.5 million veh icles, trends have been favorable against Ad opted Budget levels since Ma rch, and the forecast for the remainder of 2014 incorporates this more favorable trend, offsetting the losses from earlier in the year. The July Plan forecast also incorporates the assumptions for regional employment growth cited above, which are higher than those used for the February Financial Plan by around 0.2% points each year. Forecast traffic levels in the July Plan are greater than the February Plan by 0.4 millio n vehicles in 2015, 0.5 million in 2 016, and 0.8 million in 2017.
V-27

2014 20152013 Mid-Year Preliminary
Actual Forecast Budget 2016 2017 2018
Traffic Volume 284.528 281.879 283.245 285.262 286.626 288.419
Toll Revenue 1,645.193$ 1,651.216$ 1,655.058$ 1,664.664$ 1,670.445$ 1,678.406$
July Financial Plan 2015-2018MTA BRIDGES AND TUNNELS
Traffic Volume (Utilization)
V-28

MTA BRIDGES AND TUNNELS 2015 Preliminary Budget
July Financial Plan 2015–2018 Positions
Position Assumptions Year-to-Year Total year-end headc ount is budgeted at 1,751 positions fo r each year of the July Financial Plan, which includes 88 reimbursable positions. Plan-to-Plan For 2014 through 2018, total July Plan y ear-end headcount is 1,751, which is 5 positions above the February Financ ial Plan level of 1,746 (both plans inc lude reimbursable headcount of 88 full-time equivalents). The additional headcount includes 2 newly funded positions. A ne w procurement position is required to cover additional duties associated with the expanding MTA-wide Minority and Women-Owned Busines s Enterprise (M/WOBE) program. A new legal position is neces sary to handle wide-ranging toll matters, projects and in itiatives, Authority-wide and with other tollin g agencies such as the E-ZPass Inter-Agency Group, including All-Electr onic Tolling (AET), Open Road T olling (ORT), environmental and procurement issues, supervision of collection counsel, violation enforcement legislation, adjudication of toll violations, toll increases and national interoperability. In addition, the AET program began as a pilot in 2011 and 3 AET-dedicated positi ons have been funded since t hen, but given the pilot program context, these positions haven't been included in budgeted headc ount. Since the program has bec ome more formalized subsequ ent to Board approval last May, it's appropriate to include these positions in budgeted headcount at this time.
V-29

2014 2015 2016 2017
2014 February Plan ‐ Total Baseline Positions 1,746 1,746 1,746 1,746
Total Plan-to-Plan Changes (5) (5) (5) (5)
2014 July Plan ‐ Total Baseline Positions 1,751 1,751 1,751 1,751
Total Year-to-Year Changes, July Plan 0 0 0
Total Plan‐to‐Plan Changes by Reporting Category:
Non‐Reimbursable (5) (5) (5) (5)Reimbursable 0 0 0 0
Total (5) (5) (5) (5)Full‐Time (5) (5) (5) (5)Full‐Time Equivalents 0 0 0 0
Total (5) (5) (5) (5)By Function Category ‐ Administration (8) (8) (8) (8) ‐ Operations 2 2 2 2 ‐ Maintenance (2) (2) (2) (2) ‐ Engineering/Capital 3 3 3 3 ‐ Public Safety 0 0 0 0
Total (5) (5) (5) (5)By Occupational Group ‐ Managers/Supervisors (185) (185) (185) (185) ‐ Professional, Technical, Clerical (3) (3) (3) (3) ‐ Operational Hourlies 183 183 183 183
Total (5) (5) (5) (5)
Total Plan‐to‐Plan Changes by Major Category:2014 BRPs 0 0 0 0New Needs 0 0 0 0Change in Reimbursable Positions (5) (5) (5) (5)
Re‐estimates & All Other 1 0 0 0 0Total (5) (5) (5) (5)
1 Includes Full‐time Equivalents
MTA BRIDGES & TUNNELS
July Financial Plan 2015‐2018Favorable/(Unfavorable)
Total Position Changes at a Glance
V-30

2014 20152013 Mid-Year Preliminary
Actual Forecast Budget 2016 2017 2018
AdministrationExecutive 2 2 2 2 2 2Law (1) 19 23 23 23 23 23CFO (2) 20 29 29 29 29 29Labor Relations 5 5 5 5 5 5Staff Services (3) 8 32 32 32 32 32EEO 1 1 1 1 1 1
Total Administration 55 92 92 92 92 92
OperationsRevenue Management 39 41 41 41 41 41Operations (Non-Security) 609 726 726 726 726 726
Total Operations 648 767 767 767 767 767
MaintenanceMaintenance 167 170 170 170 170 170Operations - Maintainers 162 173 173 173 173 173Technology 50 54 54 54 54 54Internal Security - Tech Svcs 10 8 8 8 8 8
Total Maintenance 389 405 405 405 405 405
Engineering/CapitalEngineering & Construction 160 169 169 169 169 169Health & Safety 6 10 10 10 10 10Law (1) 14 16 16 16 16 16Planning & Budget Capital 14 23 23 23 23 23
Total Engineering/Capital 194 218 218 218 218 218
Public SafetyOperations (Security) 232 232 232 232 232 232Internal Security - Operations 36 37 37 37 37 37
Total Public Safety 268 269 269 269 269 269
Total Baseline Positions 1,554 1,751 1,751 1,751 1,751 1,751
Non-Reimbursable 1,466 1,663 1,663 1,663 1,663 1,663Reimbursable 88 88 88 88 88 88
Total Full-Time 1,554 1,751 1,751 1,751 1,751 1,751Total Full-Time Equivalents 0 0 0 0 0 0
(1) Includes Legal and Procurement staff.
(2) Includes Controller and Operating Budget staff
(3) Includes Human Resources and Administration staff.
MTA BRIDGES AND TUNNELSJuly Financial Plan 2015-2018
Total Positions by Function and DepartmentNon-Reimbursable/Reimbursable and Full-time/Full-time Equivalents
FUNCTION/DEPARTMENT
V-31

2014 20152013 Mid-Year Preliminary
FUNCTION/OCCUPATIONAL GROUP Actual Forecast Budget 2016 2017 2018
Administration Managers/Supervisors 17 27 27 27 27 27 Professional, Technical, Clerical 38 65 65 65 65 65 Operational Hourlies - - - - - -
Total Administration 55 92 92 92 92 92
Operations Managers/Supervisors 56 200 200 200 200 200 Professional, Technical, Clerical 56 38 38 38 38 38 Operational Hourlies(1) 536 529 529 529 529 529
Total Operations 648 767 767 767 767 767
Maintenance Managers/Supervisors 31 35 35 35 35 35 Professional, Technical, Clerical 48 49 49 49 49 49 Operational Hourlies(2) 310 321 321 321 321 321
Total Maintenance 389 405 405 405 405 405
Engineering/Capital Managers/Supervisors 40 46 46 46 46 46 Professional, Technical, Clerical 154 172 172 172 172 172 Operational Hourlies - - - - - -
Total Engineering/Capital 194 218 218 218 218 218
Public Safety Managers/Supervisors 6 43 43 43 43 43 Professional, Technical, Clerical 28 28 28 28 28 28 Operational Hourlies(3) 234 198 198 198 198 198
Total Public Safety 268 269 269 269 269 269
Total Positions Managers/Supervisors 150 351 351 351 351 351 Professional, Technical, Clerical 324 352 352 352 352 352 Operational Hourlies 1,080 1,048 1,048 1,048 1,048 1,048
Total Positions 1,554 1,751 1,751 1,751 1,751 1,751
(1) Represents Bridge and Tunnel Officers, Sergeants and Lieutenants. These positions are paid annually, not hourly.(2) Represents maintenance personnel. These positions are paid annually, not hourly.(3) Represents Bridge and Tunnel Officers, Sergeants and Lieutenants performing public safety. These positions are paid annually, not hourly.
MTA BRIDGES AND TUNNELSJuly Financial Plan 2015-2018
Total Positions by Function and Occupation
V-32

Capital Construction Company

MTA CAPITAL CONSTRUCTION COMPANY 2015 Preliminary Budget
July Financial Plan 2015-2018
Overview MTACC’s core staff directly manages the d esign and construction of over $ 17 billion in capital projects, utilizing de dicated resources to efficiently ad dress the challenge s related to the planning, des ign, construction, regulat ory framework, and community participation requirements of large complex capital projects. Labor costs for administrative staff that support system e xpansion projects, a s well as non-project specific costs are charged to the Admini stration component of the capital budget. Select administrative functions that are highly technical in nature and performed mainly by engineers as well as project-specific cost s are funded directly from specific “mega” capital projects. A shortlist of the “Mega” Projects and associated “direct” position requirements include:
Second Avenue Subway – 22 positions East Side Access – 20 positions 7 Line Extension – 13 positions Fulton Center – 17 positions Security Program -10 positions
Annual staffing levels remain constant from the February Plan at 140 total positions and are comprised of 58 administrative positions and 82 “direct” project positions. Of the 58 positions, 40 are engineering/c apital MTACC technical empl oyees who will be directly charged to the mega projects, based on work assignments. Since its creation, MTACC has developed and implemented strategies to recruit staff with the experience and techn ical skills required for MTA’s c omplex construction projects on an as needed bas is only. Matrixed employees (employees from other Agencies and under temporary management by MTACC are not included in MTACC’s headcount–only their labor costs) and cons ultants support MTACC in lieu of hiring full-time staff. These expenses will be funded directly from specific capital progr am projects, including independent engineering and legal expens es that approximate $14 million. 2014 Mid-Year Forecast MTACC’s 2014 Mid- Year Forecast is projec ted to be $35.6 million reflecting a $0. 3 million increase from the 2014 Adopted Budget. Labor Costs are projected at $25. 4 million, a decrease of 8.2%, with a staffing level of 140 by year-end.
V-33

Non-Labor costs are project ed at $10.1 million, a n increase of 34.7% from 2014 Adopted Budget. Non-Labor costs are projected to increas e primarily due to the payment of 2013 and 2014 MTACC’s occ upancy expenses at 2 Broadwa y, in 2014. Funds have been budgeted for risk management software, new budget syste m implementation, archeological and environmental services, reimbursement of NYCT for administrative support staff and services, specia lized consultants, and other office costs including computer equipment upgrades and supplies. 2015 Preliminary Budget – Baseline MTACC projects 2015 expenses to be $36.3 million, an increase of 1.3% ($0.5 million) from the February Plan, and a year-end headcount of 140. Staffing expenditures will be reimbursed by each of the “me ga” projects for those empl oyees directly working o n projects. Labor and fringe expenses are projected at $27.7 million, a decrease of 2.4% ($0.7 million) from the Fe bruary Plan. Labor costs decrease due to lower fringe an d escalation rates. Non-Labor costs are projected at $8.6 million, a 15.3% increase from the February Plan. This increase of $1.1 million is primarily due to MTACC’s contribution to the Small Business Mentoring Program (SBMP), budget system expense estimates and a multi-agency fuel card contract for non-revenue cars. All other forecasted expenses included within the July Plan are on pa r with the February Plan. Addi tional projections include the reimbursement of NYCT for administrat ive support staff and services, temporary expert services (such as indefinite quantit y consultants and firms to support project controls, change order and claims management ), legal and engineering services, workforce development through employee tr aining, and other office costs such a s communications and computer equipment. MTA Audit quar terly chargebacks and All Agency Protective Liability insurance also remain in the July Plan. Independent engineering and legal expenses of approximately $4 million will be funded through the Administrative 2010-2014 Capital Program. Major assumptions and reconciliations to the Februar y Financial Plan are discussed later. 2016 - 2018 Projections MTACC expenses are projected to increase by 0.5%, 0.4% and 2.2%, respectively, in 2016, 2017 and 2018, in comparison with the February Financial Plan. Non-labor expenses increase from 2016 by 13.5% and continue to increase by 12.8% in 2017 and 28.2% in 2018, due to Small Businesses Mentoring Program (SBMP) and offset by a decrease in computer equipment, materials and supplies. Professional services
V-34

expenses are anticipated to increase from the February Plan by $1.0 million in 2016 due to the SBMP. In 2017, professional services expenses will remain steady at $4.4 million and in 2018 will drop to $3. 1 million, as a result of a de crease in engineering consulting services and the allocation of audit expen ses directly charged back to mega projects from Administration. Year-end staffing le vels of 140 employ ees remain constant through 2018. In comparison to the Februar y Financial Plan, July Plan ex penses increase by $0. 2 million in 2016 and 2017 and $0.8 million in 2018. Labor expenses drop through 2018 by approximately $0.8 millio n (2.6%), annual ly, due to revised payroll projections, benefits and escalation rates. Non-Labor expenses increase by appro ximately $1.0 million in 2016, $0.9 million in 2017 and $1.6 million in 2018, due to SBMP expenses. The administrative contributi on will be approxim ately 33% through 2018 (average of $12.0 million). The remainder of the expenses will be reimbursed by each of the mega projects.
V-35

REIMBURSABLE
2014 2015
2013 Mid-Year Preliminary
Actual Forecast Budget 2016 2017 2018
Revenue
Farebox Revenue $0.000 $0.000 $0.000 $0.000 $0.000 $0.000Toll RevenueOther Operating RevenueCapital and Other Reimbursements 26.239 35.557 36.271 36.383 37.278 36.941 Total Revenue $26.239 $35.557 $36.271 $36.383 $37.278 $36.941
Expenses
Labor:
Payroll $13.613 $14.534 $15.889 $16.188 $16.486 $16.781OvertimeHealth and Welfare 1.882 2.431 2.718 2.819 2.972 3.134 OPEB Current PaymentPensions 2.577 3.023 3.334 3.472 3.608 3.748 Other Fringe Benefits 4.018 5.428 5.735 5.866 6.001 6.133 Reimbursable Overhead Total Labor Expenses $22.090 $25.416 $27.676 $28.344 $29.066 $29.796
Non-Labor:
Electric Power $0.000 $0.000 $0.000 $0.000 $0.000 $0.000Fuel Insurance 0.255 0.286 0.343 0.411 0.493 0.592 Claims Paratransit Service Contracts Maintenance and Other Operating ContractsProfessional Service Contracts 3.407 4.276 5.049 4.417 4.400 3.108 Materials & Supplies 0.016 0.028 0.020 0.020 0.015 0.020 Other Business Expenses 0.472 5.551 3.182 3.191 3.304 3.425 Total Non-Labor Expenses $4.149 $10.141 $8.594 $8.039 $8.212 $7.145
Other Expenses Adjustments:
Other $0.000 $0.000 $0.000 $0.000 $0.000 $0.000Total Other Expense Adjustments $0.000 $0.000 $0.000 $0.000 $0.000 $0.000
Total Expenses before Depreciation $26.239 $35.557 $36.271 $36.383 $37.278 $36.941
Depreciation $0.000 $0.000 $0.000 $0.000 $0.000 $0.000
Total Expenses $26.239 $35.557 $36.271 $36.383 $37.278 $36.941
Baseline Surplus/(Deficit) $0.000 $0.000 $0.000 $0.000 $0.000 $0.000
($ in millions)
MTA CAPITAL CONSTRUCTIONJuly Financial Plan 2015-2018
Accrual Statement of Operations by Category
V-36

CASH RECEIPTS AND EXPENDITURES
2014 2015
2013 Mid-Year Preliminary
Actual Forecast Budget 2016 2017 2018
Receipts
Farebox Revenue $0.000 $0.000 $0.000 $0.000 $0.000 $0.000Vehicle Toll RevenueOther Operating RevenueCapital and Other Reimbursements 26.239 35.557 36.271 36.383 37.278 36.941 Total Receipts $26.239 $35.557 $36.271 $36.383 $37.278 $36.941
Expenditures
Labor:
Payroll $13.613 $14.534 $15.889 $16.188 $16.486 $16.781OvertimeHealth and Welfare 1.882 2.431 2.718 2.819 2.972 3.134 OPEB Current PaymentPensions 2.577 3.023 3.334 3.472 3.608 3.748 Other Fringe Benefits 4.018 5.428 5.735 5.866 6.001 6.133 Reimbursable Overhead Total Labor Expenditures $22.090 $25.416 $27.676 $28.344 $29.066 $29.796
Non-Labor:
Electric Power $0.000 $0.000 $0.000 $0.000 $0.000 $0.000Fuel Insurance 0.255 0.286 0.343 0.411 0.493 0.592 Claims Paratransit Service Contracts Maintenance and Other Operating ContractsProfessional Service Contracts 3.407 4.276 5.049 4.417 4.400 3.108 Materials & Supplies 0.016 0.028 0.020 0.020 0.015 0.020 Other Business Expenses 0.472 5.551 3.182 3.191 3.304 3.425 Total Non-Labor Expenditures $4.149 $10.141 $8.594 $8.039 $8.212 $7.145
Other Expenditure Adjustments:
Other - Restricted Cash Adjustment $0.000 $0.000 $0.000 $0.000 $0.000 $0.000Total Other Expenditure Adjustments $0.000 $0.000 $0.000 $0.000 $0.000 $0.000
Total Expenditures $26.239 $35.557 $36.271 $36.383 $37.278 $36.941
Baseline Cash Deficit $0.000 $0.000 $0.000 $0.000 $0.000 $0.000
($ in millions)
MTA CAPITAL CONSTRUCTIONJuly Financial Plan 2015-2018Cash Receipts & Expenditures
V-37

CASH FLOW ADJUSTMENTS
2014 2015
2013 Mid-Year Preliminary
Actual Forecast Budget 2016 2017 2018
Receipts
Farebox Revenue $0.000 $0.000 $0.000 $0.000 $0.000 $0.000Vehicle Toll RevenueOther Operating RevenueCapital and Other Reimbursements - - - - - - Total Receipts $0.000 $0.000 $0.000 $0.000 $0.000 $0.000
Expenditures
Labor:
Payroll $0.000 $0.000 $0.000 $0.000 $0.000 $0.000OvertimeHealth and Welfare - - - - - - OPEB Current PaymentPensions - - - - - - Other Fringe Benefits - - - - - - Reimbursable Overhead Total Labor Expenditures $0.000 $0.000 $0.000 $0.000 $0.000 $0.000
Non-Labor:
Electric Power $0.000 $0.000 $0.000 $0.000 $0.000 $0.000Fuel Insurance - - - - - - Claims Paratransit Service Contracts Maintenance and Other Operating ContractsProfessional Service Contracts - - - - - - Materials & Supplies - - - - - - Other Business Expenditures - - - - - - Total Non-Labor Expenditures $0.000 $0.000 $0.000 $0.000 $0.000 $0.000
Other Expenditures Adjustments:
Other $0.000 $0.000 $0.000 $0.000 $0.000 $0.000Total Other Expenditures Adjustments $0.000 $0.000 $0.000 $0.000 $0.000 $0.000
Total Cash Conversion Adjustments before Depreciation
$0.000 $0.000 $0.000 $0.000 $0.000 $0.000
Depreciation Adjustment $0.000 $0.000 $0.000 $0.000 $0.000 $0.000
Total Cash Conversion Adjustments $0.000 $0.000 $0.000 $0.000 $0.000 $0.000
($ in millions)
MTA CAPITAL CONSTRUCTIONJuly Financial Plan 2015-2018
Cash Conversion (Cash Flow Adjustments)
V-38

MTA CAPITAL CONSTRUCTION COMPANY 2015 Preliminary Budget
July Financial Plan 2015-2018 Year-to-Year Changes by Category - Baseline
Revenue Capital and Other Reimbursements:
All MTACC expenses are reimbursable from the MTA Capital Program.
Funds are made available in the MT A’s Capital Program and are drawn down as expenditures are incu rred; therefore, revenues (reimbursements) will always equal expenditures. Consequently, reduced expenses result in lower revenues.
Costs will be reimbursed from specific capital projects in accordance with how
the resources are utilized. Expenses Payroll:
2015 payroll costs reflect a full year of staffing levels of 140.
Payroll expenditures will increas e by 1.89%, 1.85% and 1.80% from 2016 to 2018. Annual staffing lev els will c ontinue to remain at 140 throughout th e plan.
Other Fringe Benefits:
In 2015, Health and Welfare, Pensi on and Other Fringe Benefits costs wi ll increase by 11.8%, 10.3% and 5.7% respec tively, due to the different agenc y billing rates for MTACC employees residing on various payrolls.
Overall benefit expenditu res will increase in 2016 by 3.1%. Fr om 2017 t o
2018, expenses will increase by 3.5%, per year, as a result of projected escalation rates from multi-agency payrolls.
V-39

Insurance:
Insurance costs are expected to in crease approximately by 20%, annua lly, from 2015 to 2018.
Professional Service Contracts:
2015 costs will increase by 18.1% due to the funding for the Small Businesses Mentoring Program, as directed by MTAHQ.
As MTACC mega projects approach the completion stage, fewer IQ
consultants and engineering support expenses will be incurred. Professional Services will decrease by 12.5%, 0. 4% and 29.4% from 2016 to 2018, respectively, due to a decrease in budget system implementation and consulting costs and MTA Audit chargebacks.
Materials and Supplies:
2015 through 2018 expenses reflect the ti ming of capital project needs for field safety equipment and supplies for agency staff.
Other Business Expenses:
2015 expenditures will decrease by $2. 4 million, 42.7%, pr imarily due to a single year payment of the 2015 occupancy expenses at 2 Broadway.
Expenditures remain relatively c onstant from 2016 through 2018 due to the timing of agency-wide initiatives and the life-cycle of office equipment.
V-40

REIMBURSABLE
2014 2015Change
2015 - 2014 2016Change
2016 - 2015 2017Change
2017 - 2016 2018Change
2018 - 2017RevenueFarebox Revenue $0.000 $0.000 $0.000 $0.000 $0.000 $0.000 $0.000 $0.000 $0.000Vehicle Toll RevenueOther Operating RevenueCapital and Other Reimbursements 35.557 36.271 0.713 36.383 0.112 37.278 0.895 36.941 (0.337)Total Revenue $35.557 $36.271 $0.713 $36.383 $0.112 $37.278 $0.895 $36.941 ($0.337)
ExpensesLabor:Payroll $14.534 $15.889 ($1.355) $16.188 ($0.299) $16.486 ($0.298) $16.781 ($0.295)OvertimeHealth and Welfare 2.431 2.718 (0.286) 2.819 (0.101) 2.972 (0.153) 3.134 (0.162)OPEB Current PaymentPensions 3.023 3.334 (0.311) 3.472 (0.137) 3.608 (0.136) 3.748 (0.140)Other Fringe Benefits 5.428 5.735 (0.307) 5.866 (0.131) 6.001 (0.135) 6.133 (0.133)Reimbursable Overhead Total Labor Expenses $25.416 $27.676 ($2.260) $28.344 ($0.668) $29.066 ($0.722) $29.796 ($0.730)
Non-Labor:Electric Power $0.000 $0.000 $0.000 $0.000 $0.000 $0.000 $0.000 $0.000 $0.000Fuel Insurance 0.286 0.343 (0.057) 0.411 (0.068) 0.493 (0.082) 0.592 (0.098)Claims Paratransit Service Contracts Maintenance and Other Operating ContractsProfessional Service Contracts 4.276 5.049 (0.773) 4.417 0.632 4.400 0.017 3.108 1.292Materials & Supplies 0.028 0.020 0.008 0.020 0.000 0.015 0.004 0.020 (0.005)Other Business Expenses 5.551 3.182 2.369 3.191 (0.009) 3.304 (0.113) 3.425 (0.122)Total Non-Labor Expenses $10.141 $8.594 $1.547 $8.039 $0.555 $8.212 ($0.173) $7.145 $1.067
Other Expenses Adjustments:Other 0.000 0.000 0.000 0.000 0.000 0.000 0.000 0.000 0.000Total Other Expense Adjustments $0.000 $0.000 $0.000 $0.000 $0.000 $0.000 $0.000 $0.000 $0.000
Total Expenses before Depreciation $35.557 $36.271 ($0.713) $36.383 ($0.112) $37.278 ($0.895) $36.941 $0.337
Depreciation 0.000 0.000 0.000 0.000 0.000 0.000 0.000 0.000 0.000
Total Expenses $35.557 $36.271 ($0.713) $36.383 ($0.112) $37.278 ($0.895) $36.941 $0.337
Baseline Net Surplus/(Deficit) $0.000 $0.000 $0.000 $0.000 ($0.000) $0.000 ($0.000) $0.000 $0.000
MTA CAPITAL CONSTRUCTIONJuly Financial Plan 2015 - 2018
Year-to-Year Changes by Category - Accrual Basis($ in millions)
Favorable/(Unfavorable)
V-41

CASH RECEIPTS & EXPENDITURES
2014 2015Change
2015 - 2014 2016Change
2016 - 2015 2017Change
2017 - 2016 2018Change
2018 - 2017
ReceiptsFarebox Revenue $0.000 $0.000 $0.000 $0.000 $0.000 $0.000 $0.000 $0.000 $0.000Vehicle Toll RevenueOther Operating RevenueCapital and Other Reimbursements 35.557 36.271 0.713 36.383 0.112 37.278 0.895 36.941 (0.337)Total Receipts $35.557 $36.271 $0.713 $36.383 $0.112 $37.278 $0.895 $36.941 ($0.337)
ExpendituresLabor:Payroll $14.534 $15.889 ($1.355) $16.188 ($0.299) $16.486 ($0.298) $16.781 ($0.295)OvertimeHealth and Welfare 2.431 2.718 (0.286) 2.819 (0.101) 2.972 (0.153) 3.134 (0.162)OPEB Current PaymentPensions 3.023 3.334 (0.311) 3.472 (0.137) 3.608 (0.136) 3.748 (0.140)Other Fringe Benefits 5.428 5.735 (0.307) 5.866 (0.131) 6.001 (0.135) 6.133 (0.133)Reimbursable Overhead Total Labor Expenditures $25.416 $27.676 ($2.260) $28.344 ($0.668) $29.066 ($0.722) $29.796 ($0.730)
Non-Labor:Electric Power $0.000 $0.000 $0.000 $0.000 $0.000 $0.000 $0.000 $0.000 $0.000Fuel Insurance 0.286 0.343 (0.057) 0.411 (0.068) 0.493 (0.082) 0.592 (0.098)Claims Paratransit Service Contracts Maintenance and Other Operating ContractsProfessional Service Contracts 4.276 5.049 (0.773) 4.417 0.632 4.400 0.017 3.108 1.292Materials & Supplies 0.028 0.020 0.008 0.020 0.000 0.015 0.004 0.020 (0.005)Other Business Expenses 5.551 3.182 2.369 3.191 (0.009) 3.304 (0.113) 3.425 (0.122)Total Non-Labor Expenditures $10.141 $8.594 $1.547 $8.039 $0.555 $8.212 ($0.173) $7.145 $1.067
Other Expenditure Adjustments:Other 0.000 0.000 0.000 0.000 0.000 0.000 0.000 0.000 0.000Total Other Expenditure Adjustments $0.000 $0.000 $0.000 $0.000 $0.000 $0.000 $0.000 $0.000 $0.000
Total Expenditures $35.557 $36.271 ($0.713) $36.383 ($0.112) $37.278 ($0.895) $36.941 $0.337
Baseline Net Cash Deficit $0.000 $0.000 $0.000 $0.000 $0.000 $0.000 $0.000 $0.000 $0.000
($ in millions)
MTA CAPITAL CONSTRUCTIONJuly Financial Plan 2015 - 2018
Year-to-Year Changes by Category - Cash Basis
V-42

MTA CAPITAL CONSTRUCTION COMPANY 2015 Preliminary Budget
July Financial Plan 2015-2018 Summary of Major Plan-to-Plan Changes
2014: July Financial Plan vs. February Financial Plan The July Financial Plan is $ 0.3 million (1.0 %) higher than the 2 014 Adopted Budget. This increase is due to t he 2013 and 2014 rental expe nses of MTACC’s office space at 2 Broadway paid in 2014 and budget system expens e projections related to design, implementation and roll-out. Labor expe nses are $2.3 millio n lower than the 2014 Adopted Budget, maintaining a staffing lev el of 140. Non-Labor co sts are expected to increase by $2.6 million. Administrative co sts captured within this plan are specialized consultant services, environmental and archeological resources, MTA Audit chargebacks, telecommunications, and I T expenditures such as risk management software and upgrades to existing equipment. 2015 - 2017: July Financial Plan vs. February Financial Plan Expenses for 2015 increase by $0.5 million fr om the February Financ ial Plan, primarily due to anticipated costs associated with the Small Businesses Mentoring Program and budget system expenses captur ed within Professional Services and Othe r Business Expenses. Overall, expenses are expected to increase minimally -- by $0.2 millio n (approximately 0.4%) in 2016 and 2017. Labor expenses decre ase by $0.7 million in 2015 and continue to decrease by $0.8 million through 2017. Non-labor expenditures are expected to increase by $1.1 million in 2015, $1.0 million in 2016 and $0.9 millio n 2017. The baseline includes re-estimates of engineering, environmental and temporary expert services.
V-43

2014 2015 2016 2017
$0.000 $0.000 $0.000 $0.000
Baseline Changes
RevenueFarebox Revenue $0.000 $0.000 $0.000 $0.000Vehicle Toll RevenueCapital and Other Reimbursement 0.336 0.469 0.180 0.162
Total Revenue Changes $0.336 $0.469 $0.180 $0.162
ExpensesLabor:Payroll $0.929 ($0.139) ($0.140) ($0.142)Health and Welfare 0.390 0.253 0.259 0.263OPEB Current PaymentPensions 0.242 0.047 0.030 0.018Other Fringe Benefits 0.715 0.510 0.625 0.629Reimbursable Overhead
Total Labor Expense Changes $2.277 $0.671 $0.775 $0.768
Non-Labor:Traction and Propulsion Power $0.000 $0.000 $0.000 $0.000Fuel for Buses and TrainsInsurance 0.000 0.000 0.000 0.000ClaimsParatransit Service ContractsProfessional Service Contracts (0.207) (1.120) (1.038) (0.990)Maintenance and Other Operating ContractsMaterials & Supplies 0.005 0.014 0.015 0.020Other Business Expenses (2.412) (0.035) 0.068 0.040
Total Non-Labor Expense Changes ($2.613) ($1.140) ($0.955) ($0.930)
Total Expense Changes ($0.336) ($0.469) ($0.180) ($0.162)
Other Expense Adjustments/Gap Closing ActionsOther - Restricted Cash Adjustment
Total Other Expenditure AdjustmentsChanges $0.000 $0.000 $0.000 $0.000
$0.000 $0.000 $0.000 $0.000
$0.000 $0.000 $0.000 $0.000
MTA CAPITAL CONSTRUCTIONJuly Financial Plan 2015-2018
Changes Between Financial Plans by Generic Categories($ in millions)
Total Baseline Changes
July Financial Plan - Cash Surplus/(Deficit)
REIMBURSABLE
February Financial Plan - Cash Surplus/(Deficit)
V-44

REIMBURSABLE 2014 2015 2016 2017
February Financial Plan - Cash Surplus/(Deficit) $0.000 $0.000 $0.000 $0.000
Non-Reimbursable Major Changes
Revenue
Sub-Total Non-Reimbursable Revenue Changes $0.000 $0.000 $0.000 $0.000
Expenses
Sub-Total Non-Reimbursable Expense Changes $0.000 $0.000 $0.000 $0.000
Total Non-Reimbursable Major Changes $0.000 $0.000 $0.000 $0.000
Reimbursable Major Changes
Revenue $0.336 $0.469 $0.180 $0.162
Sub-Total Reimbursable Revenue Changes $0.336 $0.469 $0.180 $0.162
Expenses ($0.336) ($0.469) ($0.180) ($0.162)
Sub-Total Reimbursable Expense Changes ($0.336) ($0.469) ($0.180) ($0.162)
Total Reimbursable Major Changes $0.000 $0.000 $0.000 $0.000
Total Accrual Changes $0.000 $0.000 $0.000 $0.000
Cash Adjustment Changes
Total Cash Adjustment Changes $0.000 $0.000 $0.000 $0.000
Total Baseline Changes $0.000 $0.000 $0.000 $0.000
July Financial Plan - Cash Surplus/(Deficit) $0.000 $0.000 $0.000 $0.000
MTA CAPITAL CONSTRUCTIONJuly Financial Plan 2015-2018
Summary of Major Programmatic Changes Between Financial Plans($ in millions)
V-45

MTA CAPITAL CONSTRUCTION COMPANY 2015 Preliminary Budget
July Financial Plan 2015-2018 Positions
Position Assumptions
All costs are reimbursable from the MTA C apital Program. The July Financial Plan projects 2014 year end staffing of 140 and remains constant at that level through 2018. Staffing needs are also met with a mix of employees matrixed* to the company from other agencies or pr ovided by third party consultants. The actual mix of MTACC employees, matrixed employees and consultant staff are dependent upon the particular needs of each project and the availability of the proper resources.
MTACC has carefully timed the hiring of em ployees to correspond with the needs of the projects and the mix of construction and de sign activities underway and a s a result, in the July Plan, the project ed year end em ployee quota will remain the same as the February Plan of 140. The breakdown of t he year-end staffing le vel of 140 is as follows: 18 MTAC C administrative positions and 122 positions implementing East Side Access, Second Avenue Subway, Lower Manhatt an, No. 7 Line and the syste m-wide security program. In the February Plan, MTACC anticipated a year end staff of 140 employees. *Employees of other agencies under temporary management by MTACC
V-46

2014 2015 2016 2017
2014 February Plan ‐ Total Baseline Positions 140 140 140 140
Total Plan‐to‐Plan Changes 0 0 0 0
2014 July Plan ‐ Total Baseline Positions 140 140 140 140
Total Year‐to‐Year Changes, July Plan 0 0 0
Total Plan‐to‐Plan Changes by Reporting Category:
Non‐Reimbursable 0 0 0 0Reimbursable 0 0 0 0
Total 0 0 0 0Full‐Time 0 0 0 0Full‐Time Equivalents 0 0 0 0
Total 0 0 0 0By Function Category ‐ Administration (2) (2) (2) (2) ‐ Operations 0 0 0 0 ‐ Maintenance 0 0 0 0 ‐ Engineering/Capital 2 2 2 2 ‐ Public Safety 0 0 0 0
Total 0 0 0 0By Occupational Group ‐ Managers/Supervisors 0 0 0 0 ‐ Professional, Technical, Clerical 0 0 0 0 ‐ Operational Hourlies 0 0 0 0
Total 0 0 0 0
Total Plan‐to‐Plan Changes by Major Category:2014 BRPs 0 0 0 0New Needs 0 0 0 0Change in Reimbursable Positions 0 0 0 0
Re‐estimates & All Other 1 0 0 0 0Total 0 0 0 0
1 Includes Full‐time Equivalents
MTA Capital Construction Company
July Financial Plan 2015‐2018Favorable/(Unfavorable)
Total Position Changes at a Glance
V-47

2013Actual
2014 Mid-Year Forecast
2015 Preliminary
Budget 2016 2017 2018
AdministrationMTACC 16 18 18 18 18 18
Engineering/CapitalMTACC 37 40 40 40 40 40East Side Access 18 20 20 20 20 26Second Avenue Subway 17 22 22 22 22 29Security Program 9 10 10 10 10 10Lower Manhattan Projects 17 17 17 17 17 177 Line Extension 9 13 13 13 13 0
Total Engineering/Capital 107 122 122 122 122 122
Total Baseline Positions 123 140 140 140 140 140
Non-Reimbursable - - - - - - Reimbursable 123 140 140 140 140 140
Total Full-Time 123 140 140 140 140 140Total Full-Time Equivalents - - - - - -
MTA CAPITAL CONSTRUCTIONJuly Financial Plan 2015-2018
Total Positions by Function and DepartmentNon-Reimbursable/Reimbursable and Full-Time/Full-Time Equivalents
FUNCTION/DEPARTMENT
V-48

FUNCTION/OCCUPATIONAL GROUP2013
Actual
2014 Mid-Year Forecast
2015 Preliminary
Budget 2016 2017 2018
Administration Managers/Supervisors Professional, Technical, Clerical 16 18 18 18 18 18 Operational Hourlies
Total Administration 16 18 18 18 18 18
Operations Managers/Supervisors Professional, Technical, Clerical Operational Hourlies
Total Operations - - - - - -
Maintenance Managers/Supervisors Professional, Technical, Clerical Operational Hourlies
Total Maintenance - - - - - -
Engineering/Capital Managers/Supervisors Professional, Technical, Clerical 107 122 122 122 122 122 Operational Hourlies
Total Engineering/Capital 107 122 122 122 122 122
Public Safety Managers/Supervisors Professional, Technical, Clerical Operational Hourlies
Total Public Safety - - - - - -
Total Baseline Positions Managers/Supervisors Professional, Technical, Clerical 123 140 140 140 140 140 Operational Hourlies
Total Baseline Positions 123 140 140 140 140 140
MTA CAPITAL CONSTRUCTIONJuly Financial Plan 2015-2018
Total Positions by Function and Occupation
V-49

[THIS PAGE INTENTIONALLY LEFT BLANK]
V-50

Long Island Rail Road

MTA LONG ISLAND RAIL ROAD 2015 Preliminary Budget
July Financial Plan 2015 - 2018
FINANCIAL OVERVIEW The July Financial Plan 2015 - 2018 maintains the MTA Long Island Rail Road’s (LIRR) commitment to delivering safe, secure, and reliable transportation while continuing to improve customer service. It contains the resources necessary for the LIRR to achiev e its performance goals in train s ervice, fleet performance and s ervice reliability. In addition, the July Financial Plan provides d edicated resources for the LIRR to achiev e its most important goal – the pr ovision of safe transportation services to its customers, employees and members of the local communi ty. These inves tments target several areas including track maintenance, rolling stock and training. Reflecting the recent settlement with the Transport Workers Union (TWU), this July Plan assumes the same pattern settlement for employees represented by unions without contract agreements. This assumption projects costs that are in excess of the February Plan provision, and a portion of this additional cost will be funded by the sus pension of contributions to the GASB account. Programmatic Investments: While the LIRR’s safety-first philosophy is longstanding, a series of rail safet y incidents in 2013 both locally and nationally, renewed e fforts in this area. The Long Island Ra il Road’s safety program is designed to engage every employee in promoting the value of safety and is a colla borative effort between the corpor ate Safety Department and all LIRR operating, support, and administrative departments. The LIRR Safety Department develops and oversees the implementation of a comprehensive Safety Management Plan. Comm unication of safety as a c ore agency value starts at the top and is constantly reinforced. The LIRR Safety Management Plan has four essential component s: a System Safety Pr ogram Plan, Labor Management Partnerships, Rail Incident and Accident Invest igations, and Training. Establishing a high level of safety performance positively impacts employee a vailability, productivity, equipment reliability and customer satisfaction. The LIRR’s System Safety Program Plan is in complianc e with Fe deral Transit Administration (FTA) requiremen ts and will be revised in anticipation of the pendin g Federal Railroad Administrati on (FRA) Risk Reduction/System Safety Program Plan rule, scheduled to be in place later this year. The program details specific corporate and department responsibilities and activities. Further, the LIRR voluntarily invites the American Public Transportation Association (APTA) to conduct an audit of our plan every three years. T hese proposed investments have been excluded from the LIRR’s
V-51

baseline and are included in Volume I on a consolidated basis as part of an agency-wide MTA safety initiative. In spite of the strength of its existing program, the LIRR acknowledges that there is always an opportunity for improvement. To this end, the LIRR recently launched or enhanced several safety related initiatives:
Chief Safety Officer - Established a Chief Safety Officer with a direct line of report to the agency president and re -organized Corporate Safety and Training into two separate departments.
Quarterly Safety Stand-Downs – Conducted safety sessions/discussions with staff across the LIRR on the sam e day to stress the importance of safety and to provide an opportunity for employees to share how they are experiencing safety at the LIRR.
Confidential Close Call Reporting System (C3RS) – A collaborative effort between Management, Labor Organizations and the Federal Railroad Administration, C3RS will provi de a mechanism for employees t o confidentially report c lose calls that could have re sulted in operating and safety incidents. These close calls ar e investigated by a peer review team consisting of management, parti cipating labor organization representatives and the FRA with the goal of proactively instituting measures to prevent incidents from occurring.
Rail Resource Management Training (RRM) – This tr aining is designed to instruct management and repr esented employees on how to work effectively as teams to mitigate human factor accident s. RRM is designed to address two key areas of employee behavior:
1. The ability of an e mployee, as member of a crew (team), to effectively use all available resour ces to achieve safe and efficient operations;
2. The ability of an employee, as member of a crew (team), to choose appropriate behaviors not only during routine operations but also during times of crisis.
To supplement these existi ng efforts, the LIRR is p roposing to launch s everal new initiatives as part of the July Financial Plan 2015 -2018. Thes e proposals stem from recent studies on track maintenance practices by an outside consultant group, recommendations from the MT A Blue Ribbon Panel on Track Safety, and the FRA’s analysis and Deep Dive Report reviews. Key elements include establishing a dedic ated Accident Investigation Unit . This unit would be tasked with conducting inv estigations of major accidents and incidents in an objective manner, making recommendations for corrective action, ensuring corrective actions are implemented, prov iding accident/incident review presentations to senior
V-52

staff, providing staff development in acci dent investigation tec hniques, and leadin g LIRR's support of major accidents. The Rail Joint Bar Elimination Initiative would address an estimated 3,000 rail joints that exist in continuous welded rail portions of the LIRR. The goal is to eliminate the backlog of bolted joints requiring welding by 2019. After the existing bolted joints are eliminated, the goal will be to weld newly created bolted joints within 6 months of creation. The LIRR would install a W heel Impact Load Detection and Measurement system that would provide axle load, tonnage and defect ive wheel information to Engineering personnel and alert LIRR personnel in the event of excess ive wheel force striking the rail. Another key safety proposal would provide fo r the installation of cameras and recording devices on board rolling stock equipment (M7 , C3 coaches , diesel locomotives). Cameras would be placed in the passenger compartments and locomotive engineer cab to record events to allow for future analysis and assist in investigations. Technology Investments The LIRR and Metro-North Ra ilroad (MNR) are collaborating on the implementation of mobile ticketing. This initiativ e would provide customers with a new, conv enient, and cost effective way to purchase tickets. Through the mobile ticketing program LIRR and MNR customers would be able t o purchase a train ticket by using a smartphone, tablet, or other mobile device, and then dis play the tick et on screen for ins pection by a conductor. Conductors would be able to either visually verify the di gital ticket or use a handheld device to scan and validate tickets. This convenient new option would ena ble railroad customers to purchase a rail ticket anytime/anywhere – avoiding long lines to buy tickets at stations. Mobile ticketing capability will also be linked to the LIRR smart phone app lication, which was launched in December 2013. The application, called LIRR Tr ain Time Mobile App, already has been downloaded by more than 108,000 customers - after only five months this level of response is very impressive. The LIRR is currently working o n several enhancements. Efficiency Initiatives The LIRR continues t o subject all areas of the budget to intensive review, specifically payroll-related operational costs, overtime, inventory and administration. For example, the Maintenance of Equipment Department continues to aggressively m anage and adjust its maintenance activities to reflec t component performance, while separate task force working groups continue to exam ine overtime, inventory, and employee availability.
V-53

The LIRR considers overtime management to be one of its highest priorities. Under certain conditions, overtime can be an efficient way to ensure sufficient levels of staff are deployed to complete required work, such as to staff activities that are temporary in nature (unscheduled maintenance and emergency response) or to backfill open jobs on an interim basis while new hires are brought in to the workforce. Nev ertheless, it i s critical for the LIRR to maintain tight control of overtime usage in order to ensure that it is used only when needed and that it is the most cost-effective approach. In 2014, there are several strategic areas of focus to address recent overtime challenges. These include: developing an enhanc ed tracking system to conti nue to examine overtime due to extra assignments for train and engine c rew and developing t ighter controls on the assignment of extra jobs in Customer Service; filling open jobs in all craft positions; developing a zero based budget to be us ed as a more realistic pr ojection for Engineering maintenance; and ex ploring opportunities to assi gn track work in such a way as to minimize overtime. For 2014, the LIRR has undertaken two new init iatives designed to control costs and protect revenue. A detail review of third party contractual cost compared to budget was initiated. This, coupled with enhanced efforts at cost control is projected to yield $2. 4 million in annual recurring savings. Transportation Services recently conducted a pilot deploy ing shuttle-style collector positions. These collector pos itions were strategically deployed to target trains known to have challenges with fare collection due to high passenger volumes between stations that are geographic ally close in proximity. Each collector an d train assigned was analyzed in terms of the operat ional and financial impact of th e collector position. The analysis explored various factors relevant to fare collection and validation for the specified time period and compared the result s of the pilot to the corresponding period of the previous year . The results demon strated a net positive, revenue gain. In addition, the pilot enabled the MTAPD to make several arrests related to the sale/use of fraudulent tickets. The July Financial Plan includes resources to sustain and build upon this initiative’s success. Ridership and Revenue Through April 2014 ridership was 1.2% above the 2014 Adopted Budget and 1.3% above 2013 levels (adjusted for the same num ber of work day s). In fact, ridership exceeded the budget each month during 2014 and has been above the prior year in six of the last seven months. The LIRR has posted favorable trends in both commutation and non-commutation ridership. A primary factor affecting ridership is the improving broader regional economy and employment levels. Also , pushing ridership above prior years is continued strong riders hip to Brooklyn, wher e ridership has increased due in large part to the B arclay’s Center big-dr aw entertainers and professional sportin g events. Looking ahe ad, the Barclay’s Ce nter will be ho me to the profession al hockey franchise, the New York Islanders, which is expected to draw large crowds from Long Island with the LIRR as the preferred method of transportation to the games.
V-54

Another major change contained in the proposed July Financial Plan is an adjustment to the funding allocation associated with the ramp-up to the delayed East Side Access opening day. The LIRR’s fin ancial plan reflects the operating funding required to prepare for and operate new East Side Acce ss service. This inc ludes providing increased train service to the new terminal and maintaining new rolling stock and right-of-way infrastructure elements. The ramp- up plan reflects the need to start hiring and training new personnel and as well as proc urement material and support s ervices prior to opening day. 2014 Mid-Year Forecast The LIRR’s 2014 Mid-Year Forecast is comprised of non-reimbursable revenue totaling $702.2 million and non-reimbur sable expenses inc luding depreciation, other post-employment benefits and envir onmental remediation of $1,874.9 million that generate an operating deficit of ($1, 172.7) million. The 2014 Mid-Y ear Forecast reimbursable revenue and expenses each total $281.0 million. Total non-reimbursable revenue is $0.4 million higher than the 2014 Adopt ed Budget. Farebox Revenue is $3.5 million higher due to higher overall ridership. Other Operating Revenue is $3.1 million lower due to the timing of a real estate sale. Total non-reimbursable expenses (excludi ng depreciation and Other Post-Employment Benefits (OPEB)) are higher by $ 72.2 million primarily as a result of higher wages. This is partially offset by lower Health & Welfare costs due to lower rates and fewer retiree/beneficiaries. The major cash adjustments from the 2014 Adopted Budget in clude timing from 2013, the GASB adjustment related to the new wage pattern and Reliab ility Centered Maintenance and Running Repair savings. Full-time positions total 7,001 in the 2014 Mid-Year Forecast, with 6,122 non-reimbursable positions and 879 reimbursable positions. 2015 Preliminary Budget - Baseline The LIRR’s Financial Plan is gea red toward achieving severa l key operational goals in 2015, including maint aining on-time performance at 95.1%, and a fleet-wide mean distance between failures (MDBF) of 153, 000 miles. The budget plan also reflects a continuing commitment to improve both empl oyee and customer safety and security. Other key assumptions incor porated in the baseline are di scussed in a later section, along with the reconciliation to the February Plan. The 2015 Prelimin ary Budget revenue total $972.6 million, of wh ich $706.8 million is non-reimbursable revenue and $265.8 million is reimbursable revenu e. The total expense budget is $2,097.8 million, of which $1,678.9 million is for operating expe nses,
V-55

and the balance is as sociated with non-cash items such as depreciation, other post -employment benefits and envir onmental remediation liab ility. Non-reimbursable operating expenses total $1, 413.2 million in the 2015 Preliminary Budget, while reimbursable expenses are $265.8 million. The cash budget for the 2015 Pr eliminary Budget incorporates $968.0 million in cash receipts and $1,688.0 million in cash disbursements. The baseline cash requirement of $720.1 million are driven by operating expen ses and revenues anticipated in the 2015 Preliminary Budget and other adjustments to cash flow. On an accrued basis, revenues and expenses are lower in the 2015 Preliminary Budget than the 2014 Mid-Year Forecast. Total re venues for 2015 are $972 .6 million, $10. 6 million lower than in the cu rrent 2014 Mid-Year Foreca st with no n-reimbursable revenues increasing by $4.6 million and Reimbur sable revenues declined by $15. 3 million. Ridership in the 2015 Preliminary Budget increases over the 2014 Mid-Year Forecast by 0.9 millio n rides, or 1.0%. To tal operating expenses before depreciation and OPEB of $1,678.9 million re flect a decline of $68.6 million over the 2014 Mid-Year Forecast. Non-reimbursable expenses decrease by $53.3 million and r eimbursable expenses decrease by $15.3 mil lion. While the resu lting total operating baseline defic it including non-cash items such as deprec iation, OPEB, and environmental remediation decreases by $4 7.5 million to $1,125.3 million in t he 2015 Preliminary Budget, th e projected baseline ca sh deficit (or subsid y requirement) of $720.1 million in the 2015 Preliminary Budget is lower by $69.2 million. Full-time positions total 7,056 in the 2015 Preliminary B udget, with 6,267 non-reimbursable positions and 789 reimbursable positions. Compared to the 2014 Mid -Year Forecast, this reflects a total increase of 55 positions, an increase of 145 non-reimbursable positions and a decrease of 90 reimbursable positions. The major driver of the non-reimbursable headcount change is due to timing of capital program activity resulting in a shift of 123 E ngineering positions from reim bursable to non-reimbursable as of December 31. Com pared with the February Financ ial Plan, there was a tota l position decrease of 131 positions, primarily driven by changes in the East Side Access ramp up schedule. Financial Plan 2016-2018 Projections The baseline projections for 2016 through 2018 re flect continuing initiatives launched in 2014. During this period, t he LIRR has increased its invest ments in the Reliabilit y Centered Maintenance program (RCM) as many compo nents start to enter critical maintenance stages. In addition, in 2016 - 2018, the LIRR financial plan reflects revised ramp-up costs for East Side Access readiness efforts. The baseline projections for 2016-2018 reflect these various impacts. Non-reimbursable revenues grow by less than 1% each year thereafter, while Re imbursable revenues increase by 2.1% in 2016, decrease by 6.3% in 2017 and increase by 0.3% in 2018.
V-56

The pace of expense growth is higher than the projected revenue growth, driven b y rates that exceed inflation in “uncontrollable costs”, such as health insurance (active employees and retirees), electric power and pension costs. Non-reimbursable expenses (before depreciation) grow by 1.7% from $1,413.2 million in 2015 to $1,437.3 millio n in 2016. They continue to rise by 5.0% in 2017 and 5.2% in 2018, reaching $1,58 8.5 million. The higher rate of gr owth in the ou t-years is primarily due to East S ide Access readiness efforts. R eimbursable expenses increase by 2.1% i n 2016, decrease by 6.3% in 2017 and increase by 0.3% in 2018. On a year-to-year basis, baseline positions decrease by 33 positions in 2016, and then increase by 102 pos itions in 2017 and 128 positions in 2018. Non-reimbursable positions increase by 2 positions in 20 16, 164 in 2017 and 136 in 2018. Thes e increases are primarily relat ed to East Side Access readiness efforts. For the period 2016 to 2018, reimbursable positions decrease by 35 in 2016, 62 in 2016 and 8 in 2017, reflecting the anticipated level of capital activity and the completion of Superstorm Sandy reconstruction projects and Maintenanc e of Equipment Posi tive Train Control efforts.
V-57

NON-REIMBURSABLE
2014 2015
2013 Mid-Year Preliminary
Actual Forecast Budget 2016 2017 2018
Operating Revenue
Farebox Revenue $632.089 $650.880 $657.318 $662.215 $666.098 $668.368Toll Revenue - - - - - - Other Operating Revenue 60.624 51.301 49.479 48.753 48.703 49.280 Capital and Other Reimbursements - - - - - - Total Revenue $692.713 $702.181 $706.797 $710.968 $714.801 $717.648
Operating Expenses
Labor:
Payroll $429.086 $504.419 $478.002 $486.553 $510.036 $538.492Overtime 92.924 115.712 100.909 98.584 100.801 103.126 Health and Welfare 92.601 96.409 102.880 104.893 113.578 123.476 OPEB Current Payment 81.978 58.563 61.807 63.746 67.206 70.876 Pensions 178.457 174.824 169.962 170.000 172.364 175.023 Other Fringe Benefits 113.174 127.360 122.664 125.400 132.169 139.488 Reimbursable Overhead (24.184) (28.836) (25.278) (27.640) (22.342) (21.877) Total Labor Expenses $964.036 $1,048.451 $1,010.946 $1,021.536 $1,073.812 $1,128.604
Non-Labor:
Electric Power $99.630 $106.392 $101.638 $104.339 $112.722 $118.397Fuel 28.610 29.718 28.129 26.989 27.609 28.356 Insurance 20.038 23.574 26.354 29.347 32.681 36.494 Claims 5.569 3.866 4.229 4.303 4.370 4.370 Paratransit Service Contracts - - - - - - Maintenance and Other Operating Contracts 50.891 71.505 65.837 68.258 72.908 75.143 Professional Service Contracts 28.274 38.266 30.625 29.930 30.933 33.119 Materials & Supplies 96.339 130.349 130.150 136.859 138.552 142.053 Other Business Expenses 13.214 14.400 15.281 15.779 16.054 21.937 Total Non-Labor Expenses $342.566 $418.070 $402.243 $415.804 $435.829 $459.869
Other Expenses Adjustments:
Other - - - - - - Total Other Expense Adjustments $0.000 $0.000 $0.000 $0.000 $0.000 $0.000
Total Expenses before Depreciation and GASB Adjs. $1,306.601 $1,466.521 $1,413.189 $1,437.340 $1,509.641 $1,588.473
Depreciation 332.978 333.377 343.332 346.750 350.202 353.689 OPEB Obligation 44.804 71.398 73.540 75.746 75.746 77.261 Environmental Remediation (13.524) 3.600 2.000 2.000 2.000 2.000
Total Expenses $1,670.859 $1,874.896 $1,832.061 $1,861.836 $1,937.589 $2,021.423
Baseline Surplus/(Deficit) ($978.146) ($1,172.715) ($1,125.264) ($1,150.868) ($1,222.788) ($1,303.775)
Cash Conversion Adjustments
Depreciation $332.978 $333.377 $343.332 $346.750 $350.202 $353.689Operating/Capital (18.363) (31.936) (13.664) (10.592) (10.227) (13.247) Other Cash Adjustment 44.907 82.027 75.538 73.303 71.333 73.319 Total Cash Conversion Adjustments $359.522 $383.468 $405.206 $409.461 $411.308 $413.761
Net Cash Surplus/(Deficit) ($618.624) ($789.247) ($720.058) ($741.407) ($811.480) ($890.014)
MTA LONG ISLAND RAIL ROAD
Accrual Statement of Operations by CategoryJuly Financial Plan 2015-2018
($ in millions)
V-58

REIMBURSABLE2014 2015
2013 Mid-Year PreliminaryActual Forecast Budget 2016 2017 2018
Revenue
Farebox Revenue $0.000 $0.000 $0.000 $0.000 $0.000 $0.000Toll Revenue - - - - - - Other Operating Revenue - - - - - - Capital and Other Reimbursements 226.717 281.008 265.757 271.458 254.351 255.126 Total Revenue $226.717 $281.008 $265.757 $271.458 $254.351 $255.126
Expenses
Labor:
Payroll $66.903 $87.741 $95.834 $97.959 $93.732 $93.552Overtime 18.339 17.930 15.938 17.443 15.348 14.845 Health and Welfare 14.429 16.307 16.894 17.542 16.424 16.224 OPEB Current Payment - - - - - - Pensions 21.752 24.368 24.701 25.565 24.048 23.842 Other Fringe Benefits 14.516 18.877 20.347 21.126 19.780 19.539 Reimbursable Overhead 24.184 28.836 25.278 27.640 22.342 21.877 Total Labor Expenses $160.123 $194.059 $198.992 $207.275 $191.674 $189.879
Non-Labor:
Electric Power $0.240 $0.581 $0.746 $0.494 $0.000 $0.000Fuel - - - - - - Insurance 3.511 5.370 5.955 6.235 5.853 5.780 Claims - - - - - - Paratransit Service Contracts - - - - - - Maintenance and Other Operating Contracts 15.507 13.614 10.443 10.665 10.471 10.437 Professional Service Contracts 6.628 4.178 4.858 1.916 1.543 1.211 Materials & Supplies 40.135 62.776 44.655 44.761 44.705 47.715 Other Business Expenses 0.572 0.430 0.108 0.112 0.105 0.104 Total Non-Labor Expenses $66.594 $86.949 $66.765 $64.183 $62.677 $65.247
Other Expenses Adjustments:
Other - - - - - - Total Other Expense Adjustments $0.000 $0.000 $0.000 $0.000 $0.000 $0.000
Total Expenses before Depreciation $226.717 $281.008 $265.757 $271.458 $254.351 $255.126
Depreciation - - - - - -
Total Expenses $226.717 $281.008 $265.757 $271.458 $254.351 $255.126
Baseline Surplus/(Deficit) $0.000 $0.000 $0.000 $0.000 $0.000 $0.000
MTA LONG ISLAND RAIL ROAD
($ in millions)
July Financial Plan 2015-2018Accrual Statement of Operations by Category
V-59

NON-REIMBURSABLE / REIMBURSABLE2014 2015
2013 Mid-Year PreliminaryActual Forecast Budget 2016 2017 2018
Revenue
Farebox Revenue $632.089 $650.880 $657.318 $662.215 $666.098 $668.368Toll Revenue - - - - - - Other Operating Revenue 60.624 51.301 49.479 48.753 48.703 49.280 Capital and Other Reimbursements 226.717 281.008 265.757 271.458 254.351 255.126 Total Revenue $919.430 $983.189 $972.554 $982.426 $969.152 $972.774
Expenses
Labor:
Payroll $495.989 $592.160 $573.836 $584.512 $603.768 $632.044Overtime 111.263 133.642 116.847 116.027 116.149 117.971 Health and Welfare 107.030 112.716 119.774 122.435 130.002 139.700 OPEB Current Payment 81.978 58.563 61.807 63.746 67.206 70.876 Pensions 200.208 199.192 194.663 195.565 196.412 198.865 Other Fringe Benefits 127.690 146.237 143.011 146.526 151.949 159.027 Reimbursable Overhead - - - - - - Total Labor Expenses $1,124.158 $1,242.510 $1,209.938 $1,228.811 $1,265.486 $1,318.483
Non-Labor:
Electric Power $99.871 $106.973 $102.384 $104.833 $112.722 $118.397Fuel 28.610 29.718 28.129 26.989 27.609 28.356 Insurance 23.549 28.944 32.309 35.582 38.534 42.274 Claims 5.569 3.866 4.229 4.303 4.370 4.370 Paratransit Service Contracts - - - - - - Maintenance and Other Operating Contracts 66.398 85.119 76.280 78.923 83.379 85.580 Professional Service Contracts 34.903 42.444 35.483 31.846 32.476 34.330 Materials & Supplies 136.474 193.125 174.805 181.620 183.257 189.768 Other Business Expenses 13.786 14.830 15.389 15.891 16.159 22.041 Total Non-Labor Expenses $409.160 $505.019 $469.008 $479.987 $498.506 $525.116
Other Expenses Adjustments:
Other - - - - - - Total Other Expense Adjustments $0.000 $0.000 $0.000 $0.000 $0.000 $0.000
Total Expenses before Depreciation and GASB Adjs. $1,533.318 $1,747.529 $1,678.946 $1,708.798 $1,763.992 $1,843.599
Depreciation $332.978 $333.377 $343.332 $346.750 $350.202 $353.689OPEB Obligation 44.804 71.398 73.540 75.746 75.746 77.261 Environmental Remediation (13.524) 3.600 2.000 2.000 2.000 2.000
Total Expenses $1,897.575 $2,155.904 $2,097.818 $2,133.294 $2,191.940 $2,276.549
Baseline Surplus/(Deficit) ($978.145) ($1,172.715) ($1,125.264) ($1,150.868) ($1,222.788) ($1,303.775)
Cash Conversion Adjustments
Depreciation $332.978 $333.377 $343.332 $346.750 $350.202 $353.689Operating/Capital (18.363) (31.936) (13.664) (10.592) (10.227) (13.247) Other Cash Adjustment 44.907 82.027 75.538 73.303 71.333 73.319 Total Cash Conversion Adjustments $359.522 $383.468 $405.206 $409.461 $411.308 $413.761
Net Cash Surplus/(Deficit) ($618.623) ($789.247) ($720.058) ($741.407) ($811.480) ($890.014)
($ in millions)Accrual Statement of Operations by Category
MTA LONG ISLAND RAIL ROADJuly Financial Plan 2015-2018
V-60

CASH RECEIPTS AND EXPENDITURES2014 2015
2013 Mid-Year PreliminaryActual Forecast Budget 2016 2017 2018
Receipts
Farebox Revenue $653.417 $676.583 $680.318 $685.215 $689.098 $691.368Vehicle Toll Revenue - - - - - - Other Operating Revenue 81.051 48.861 41.919 40.427 40.074 40.389 Capital and Other Reimbursements 183.429 263.472 245.725 254.137 237.292 234.889 Total Receipts $917.897 $988.916 $967.962 $979.779 $966.464 $966.646
Expenditures
Labor:
Payroll $487.527 $602.305 $571.328 $581.949 $601.205 $629.425Overtime 109.737 133.642 116.847 116.027 116.149 117.971 Health and Welfare 106.481 113.265 119.774 122.435 130.002 139.700 OPEB Current Payment 56.831 58.710 61.807 63.746 67.206 70.876 Pensions 215.052 185.598 194.663 195.565 196.412 198.865 Other Fringe Benefits 117.619 148.699 142.011 145.526 150.949 158.027 GASB Account 12.593 5.827 - - - 0.734 Reimbursable Overhead - - - - - - Total Labor Expenditures $1,105.839 $1,248.046 $1,206.430 $1,225.248 $1,261.923 $1,315.598
Non-Labor:
Electric Power $114.363 $112.575 $102.384 $104.833 $112.722 $118.397Fuel 27.639 30.894 28.129 26.989 27.609 28.356 Insurance 20.973 30.038 31.972 35.161 39.038 41.751 Claims 3.676 2.316 2.625 2.666 2.702 2.702 Paratransit Service Contracts - - - - - - Maintenance and Other Operating Contracts 57.712 99.830 76.280 78.923 83.379 85.580 Professional Service Contracts 31.842 43.181 31.976 28.173 28.629 30.301 Materials & Supplies 138.408 173.011 170.482 180.964 183.458 189.609 Other Business Expenses 12.949 15.272 14.742 15.229 15.484 21.366 Total Non-Labor Expenditures $407.560 $507.117 $458.590 $472.938 $493.021 $518.062
Other Expenditure Adjustments:
Other 23.190 23.000 23.000 23.000 23.000 23.000 Total Other Expenditure Adjustments $23.190 $23.000 $23.000 $23.000 $23.000 $23.000
Total Expenditures $1,536.590 $1,778.163 $1,688.020 $1,721.186 $1,777.944 $1,856.660
Cash Timing and Availability Adjustment 0.069 - - - - -
Baseline Cash Surplus/(Deficit) ($618.624) ($789.247) ($720.058) ($741.407) ($811.480) ($890.014)
July Financial Plan 2015-2018Cash Receipts & Expenditures
($ in millions)
MTA LONG ISLAND RAIL ROAD
V-61

CASH FLOW ADJUSTMENTS
2014 2015
2013 Mid-Year Preliminary
Actual Forecast Budget 2016 2017 2018
Receipts
Farebox Revenue $21.328 $25.703 $23.000 $23.000 $23.000 $23.000Vehicle Toll Revenue - - - - - - Other Operating Revenue 20.427 (2.440) (7.560) (8.326) (8.629) (8.891) Capital and Other Reimbursements (43.288) (17.536) (20.032) (17.321) (17.059) (20.237) Total Receipts ($1.533) $5.727 ($4.592) ($2.647) ($2.688) ($6.128)
Expenditures
Labor:
Payroll $8.462 ($10.145) $2.508 $2.563 $2.563 $2.619Overtime 1.526 - - - - - Health and Welfare 0.549 (0.549) - - - - OPEB Current Payment 25.147 (0.147) - - - - Pensions (14.844) 13.594 - - - - Other Fringe Benefits 10.071 (2.462) 1.000 1.000 1.000 1.000 GASB Account (12.593) (5.827) - - - (0.734) Reimbursable Overhead - - - - - - Total Labor Expenditures $18.319 ($5.536) $3.508 $3.563 $3.563 $2.885
Non-Labor:
Electric Power ($14.492) ($5.602) $0.000 $0.000 $0.000 $0.000Fuel 0.971 (1.176) - - - - Insurance 2.576 (1.094) 0.337 0.421 (0.504) 0.523 Claims 1.893 1.550 1.604 1.637 1.668 1.668 Paratransit Service Contracts - - - - - - Maintenance and Other Operating Contracts 8.687 (14.711) - - - - Professional Service Contracts 3.062 (0.737) 3.507 3.673 3.847 4.029 Materials & Supplies (1.934) 20.114 4.323 0.656 (0.201) 0.159 Other Business Expenditures 0.836 (0.442) 0.647 0.662 0.675 0.675 Total Non-Labor Expenditures $1.599 ($2.098) $10.418 $7.049 $5.485 $7.054
Other Expenditures Adjustments:
Other (23.190) (23.000) (23.000) (23.000) (23.000) (23.000) Total Other Expenditures Adjustments ($23.190) ($23.000) ($23.000) ($23.000) ($23.000) ($23.000)
Total Cash Conversion Adjustments before Depreciation and GASB Adjs.
($4.805) ($24.907) ($13.666) ($15.035) ($16.640) ($19.189)
Depreciation Adjustment $332.978 $333.377 $343.332 $346.750 $350.202 $353.689OPEB Obligation 44.804 71.398 73.540 75.746 75.746 77.261 Environmental Remediation (13.524) 3.600 2.000 2.000 2.000 2.000 Cash Timing and Availability Adjustment 0.069 - - - - -
Baseline Total Cash Conversion Adjustments $359.522 $383.468 $405.206 $409.461 $411.308 $413.761
($ in millions)Cash Conversion (Cash Flow Adjustments)
MTA LONG ISLAND RAIL ROADJuly Financial Plan 2015-2018
V-62

MTA Long Island Rail Road2014 Mid-Year Forecast
Non-Reimbursable/Reimbursable Overtime ($ in millions)
NON-REIMBURSABLE OVERTIME Hours $ %
Scheduled Service 373,539 19.414 16.8%
Unscheduled Service 125,141 7.136 6.2%
Programmatic/Routine Maintenance 570,419 27.347 23.6%
Unscheduled Maintenance 6,220 0.284 0.2%
Vacancy/Absentee Coverage 645,242 32.150 27.8%
Weather Emergencies 238,034 12.731 11.0%
Safety/Security/Law Enforcement 0.0%
Other 31,410 16.650 14.4%
Subtotal 1,990,007 115.712 100.0%
REIMBURSABLE OVERTIME 342,774 17.930
TOTAL OVERTIME 2,332,781 133.642
Total
V-63

MTA LONG ISLAND RAIL ROAD 2015 Preliminary Budget
July Financial Plan 2015 – 2018 Year-To-Year Changes by Category - Baseline
Revenue Farebox Revenue The regional econom y and employment trends are the primary dr ivers of Farebox
Revenue. Farebox revenue is increasing by 1.0% in 2015 over 2014 primarily due to the
anticipated ridership growth. Farebox revenue is increasing by 0.7% in 2016 over 2015 primarily due to
anticipated ridership growth. Passenger revenue forecasts in the outer years 2017 - 2018 reveal modest annual
growth due to increases in projected ridership. Other Operating Revenue Other revenues are lower in 2015 from the 2014 Mi d-Year Forecast due to Federal
Transportation Administration (FTA) reimbursements for Tropical Storms Sandy and Irene and Winter Storm Nemo in 2014, partially offset by one time real estate sale s in 2015.
Other Revenues decline further in 2016 as a resu lt of a one-time real estate sale in 2015.
Other Operating Rev enue is projected to change each year primarily t hrough contractual and inflationary increases.
Capital and Other Reimbursements Reflects the 2010 - 2014 Capital Program and other project activity in cluding
overbuilds and East Side Access materials. Expenses Projections include additional Payroll, Overtime, Pension, Health & Welfare, Other Fringe Benefits, Other Business Expense and Reimbursable Ov erhead expenses for those employees without cont ract agreements that are patte rned after the recent TWU settlement. Payroll Salaries for non-represented employees, w ho have not received a general salar y
increase during the last five years, are a ssumed to follow CPI-based increases. The 2014 Mid-Year Forecast baseline includes the compounding of r aises for 2012 and 2013; however, as of the July Plan, no raises have been granted.
2014 includes retroactive salary increases for represented employees for the period July 2010 through December 2013. Based on the recent pattern settlement with the
V-64

TWU, increases are assumed t o be 0.87%, 0.95%, 2.23% and 2.22% res pectively (all increases effective July 1 of each year).
2015 - 2018 includes CPI-based increas es for represented employees of 2.00% upon expiration of the pattern.
Almost all the headc ount increases from 2017 – 2018 are related to East Side Access readiness efforts.
Overtime 2014 - 2015 overtime decreased by $16.8 m illion or 12.6% is primarily ass ociated
with the 2014 anticipated one time retroactive wage payments based on the recently completed TWU agreement, lower weather related overtime in 2015 as well as lower project activity being performed on overtime.
2015 - 2018 changes primarily reflect normal wage growth. Health & Welfare 2014 – 2018 reflects an annual NYSHIP rate increase of approximately 1.3% (2014),
4.6% (2015), 1.3% (2016), 3. 8% (2017) and 3.8% (2018), fo r individual coverage and 2.0% (2014), 5.0% (2015), 2.6% (2016), 5.0% (2017) and 5.0% (2018) for family coverage.
Reflects impact of headcount changes eac h year, including ramp-up costs for East Side Access beginning in 2016.
Pensions Reflects the latest actuarial valuation for each year as well as estimate for impacts of
represented wage increases. Other Fringe Benefits Railroad Retirement Tax maximum limits are based on the projected maximum
earnings base from the Railroad Retireme nt Board and annual CPI increases; the tax rate for each tier is expected to remain unchanged.
Railroad Unemployment costs reflect a slig ht annual increase in the monthly charge per employee in each year.
Federal Employers Liability Act (FELA) Indemnity payments increase by CPI.
Electric Power 2014 is based on actuals thr ough March and reflects t he latest LIRR cons umption
estimates and inflationary increases. 2015 - 2018 reflects the latest LIRR consumption estimates and inflationary
increases.
Fuel 2014 is based on actuals thr ough March and reflects t he latest LIRR cons umption
estimates and inflationary increases. 2015 - 2018 reflects the latest inflationary increases.
V-65

Insurance 2014 - 2018 reflects the latest inflationar y increases and Force Account Insurance
estimates based on project activity. Gener ally, premium rates are assumed to increase by 10-14% per year during 2015-2018.
Claims 2014 reflects actual experience t hrough March and the anticipat ed settlement and
payout of claims for the balance of the year. 2015 - 2018 reflects inflationary increases.
Maintenance and Other Operating Contracts 2014 – 2015 decrease due to completion of the Elevator Maintenance major
overhaul program, lower equipment rental wit h the completion of the concrete tie replacement program, lower non-revenue vehicle repairs/replacement and completion of various security initiatives.
2015 – 2017 contractual and normal inflationary increases. 2018 includes East Side Access readiness efforts. Professional Service Contracts 2014 – 2015 decreas e reflects timing of IT system initiatives and timing of v arious
other professional services contracts. 2015 – 2016 decreases due to timing of IT syst em initiatives partially offset by
normal inflationary increases. 2016 – 2018 increas e due to timing of IT syst em initiatives and normal inflationary
increases. 2018 includes East Side Access readiness efforts.
Material and Supplies The decrease in materials from 2014 – 2015 is primarily due to East Side Access
construction material and other capital program activity and Operating Funded Capital projects.
2015 – 2016 increase includes change out of M7 Obsolete materials. 2016 – 2017 includes normal inflationary increases. 2018 includes East Side Access readiness efforts. Other Business Expenses 2014 – 2017 reflects normal inflationary increases. 2018 includes M3 decommissioning costs.
V-66

Depreciation Reflects depreciation of current assets as well as estimates for capital projects
based on their beneficial use. Cash Adjustments Expense
Insurance and Claims & Suits – payments versus accrued expenses. Timing of Concrete Tie reimbursements. GASB account contributions. Depreciation and other non-cash adjustments for each year 2014 - 2018. Timing from 2013 included in 2014 and shifts between 2014 and 2015. Material drawdown.
V-67

NON-REIMBURSABLE
2014 2015Change
2015 - 2014 2016Change
2016 - 2015 2017Change
2017- 2016 2018Change
2018 - 2017RevenueFarebox Revenue $650.880 $657.318 $6.438 $662.215 $4.897 $666.098 $3.883 $668.368 $2.270Vehicle Toll Revenue 0.000 0.000 0.000 0.000 0.000 0.000 0.000 0.000 0.000Other Operating Revenue 51.301 49.479 (1.822) 48.753 (0.726) 48.703 (0.050) 49.280 0.577Capital and Other Reimbursements 0.000 0.000 0.000 0.000 0.000 0.000 0.000 0.000 0.000Total Revenue $702.181 $706.797 $4.616 $710.968 $4.171 $714.801 $3.833 $717.648 $2.847
ExpensesLabor:Payroll $504.419 $478.002 26.417 $486.553 ($8.551) $510.036 ($23.483) $538.492 ($28.456)Overtime 115.712 100.909 14.803 98.584 2.325 100.801 (2.217) 103.126 (2.325)Health and Welfare 96.409 102.880 (6.471) 104.893 (2.013) 113.578 (8.685) 123.476 (9.898)OPEB Current Payment 58.563 61.807 (3.244) 63.746 (1.939) 67.206 (3.460) 70.876 (3.670)Pensions 174.824 169.962 4.862 170.000 (0.038) 172.364 (2.364) 175.023 (2.659)Other Fringe Benefits 127.360 122.664 4.696 125.400 (2.736) 132.169 (6.769) 139.488 (7.319)Reimbursable Overhead (28.836) (25.278) (3.558) (27.640) 2.362 (22.342) (5.298) (21.877) (0.465)Total Labor Expenses $1,048.451 $1,010.946 $37.505 $1,021.536 ($10.590) $1,073.812 ($52.276) $1,128.604 ($54.792)
Non-Labor:Electric Power $106.392 $101.638 $4.754 $104.339 ($2.701) $112.722 ($8.383) $118.397 ($5.675)Fuel 29.718 28.129 1.589 26.989 1.140 27.609 (0.620) 28.356 (0.747)Insurance 23.574 26.354 (2.780) 29.347 (2.993) 32.681 (3.334) 36.494 (3.813)Claims 3.866 4.229 (0.363) 4.303 (0.074) 4.370 (0.067) 4.370 0.000Paratransit Service Contracts 0.000 0.000 0.000 0.000 0.000 0.000 0.000 0.000 0.000Maintenance and Other Operating Contracts 71.505 65.837 5.668 68.258 (2.421) 72.908 (4.650) 75.143 (2.235)Professional Service Contracts 38.266 30.625 7.641 29.930 0.695 30.933 (1.003) 33.119 (2.186)Materials & Supplies 130.349 130.150 0.199 136.859 (6.709) 138.552 (1.693) 142.053 (3.501)Other Business Expenses 14.400 15.281 (0.881) 15.779 (0.498) 16.054 (0.275) 21.937 (5.883)Total Non-Labor Expenses $418.070 $402.243 $15.827 $415.804 ($13.561) $435.829 ($20.025) $459.869 ($24.040)
Other Expenses Adjustments:Other 0.000 0.000 0.000 0.000 0.000 0.000 0.000 0.000 0.000Total Other Expense Adjustments $0.000 $0.000 $0.000 $0.000 $0.000 $0.000 $0.000 $0.000 $0.000
Total Expenses before Depreciation and GASB Adjs. $1,466.521 $1,413.189 $53.332 $1,437.340 ($24.151) $1,509.641 ($72.301) $1,588.473 ($78.832)
Depreciation $333.377 $343.332 ($9.955) $346.750 ($3.418) $350.202 ($3.452) $353.689 ($3.487)OPEB Obligation 71.398 73.540 (2.142) 75.746 (2.206) 75.746 0.000 77.261 (1.515)Environmental Remediation 3.600 2.000 1.600 2.000 0.000 2.000 0.000 2.000 0.000
Total Expenses $1,874.896 $1,832.061 $42.835 $1,861.836 ($29.775) $1,937.589 ($75.753) $2,021.423 ($82.319)
Baseline Net Surplus/(Deficit) ($1,172.715) ($1,125.264) $47.451 ($1,150.868) ($25.604) ($1,222.788) ($71.920) ($1,303.775) ($79.472)
MTA LONG ISLAND RAIL ROADJuly Financial Plan 2015-2018
Year-to-Year Changes by Category - Accrual Basis($ in millions)
Favorable/(Unfavorable)
V-68

REIMBURSABLE
2014 2015Change
2015 - 2014 2016Change
2016 - 2015 2017Change
2017- 2016 2018Change
2018 - 2017RevenueFarebox Revenue $0.000 $0.000 $0.000 $0.000 $0.000 $0.000 $0.000 $0.000 $0.000Vehicle Toll Revenue 0.000 0.000 0.000 0.000 0.000 0.000 0.000 0.000 0.000Other Operating Revenue 0.000 0.000 0.000 0.000 0.000 0.000 0.000 0.000 0.000Capital and Other Reimbursements 281.008 265.757 (15.251) 271.458 5.701 254.351 (17.107) 255.126 0.775Total Revenue $281.008 $265.757 ($15.251) $271.458 $5.701 $254.351 ($17.107) $255.126 $0.775
ExpensesLabor:Payroll $87.741 $95.834 ($8.093) $97.959 ($2.125) $93.732 $4.227 $93.552 $0.180Overtime 17.930 15.938 1.992 17.443 (1.505) 15.348 2.095 14.845 0.503Health and Welfare 16.307 16.894 (0.587) 17.542 (0.648) 16.424 1.118 16.224 0.200OPEB Current Payment 0.000 0.000 0.000 0.000 0.000 0.000 0.000 0.000 0.000Pensions 24.368 24.701 (0.333) 25.565 (0.864) 24.048 1.517 23.842 0.206Other Fringe Benefits 18.877 20.347 (1.470) 21.126 (0.779) 19.780 1.346 19.539 0.241Reimbursable Overhead 28.836 25.278 3.558 27.640 (2.362) 22.342 5.298 21.877 0.465Total Labor Expenses $194.059 $198.992 ($4.933) $207.275 ($8.283) $191.674 $15.601 $189.879 $1.795
Non-Labor:Electric Power $0.581 $0.746 ($0.165) $0.494 $0.252 $0.000 $0.494 $0.000 $0.000Fuel 0.000 0.000 0.000 0.000 0.000 0.000 0.000 0.000 0.000Insurance 5.370 5.955 (0.585) 6.235 (0.280) 5.853 0.382 5.780 0.073Claims 0.000 0.000 0.000 0.000 0.000 0.000 0.000 0.000 0.000Paratransit Service Contracts 0.000 0.000 0.000 0.000 0.000 0.000 0.000 0.000 0.000Maintenance and Other Operating Contracts 13.614 10.443 3.171 10.665 (0.222) 10.471 0.194 10.437 0.034Professional Service Contracts 4.178 4.858 (0.680) 1.916 2.942 1.543 0.373 1.211 0.332Materials & Supplies 62.776 44.655 18.121 44.761 (0.106) 44.705 0.056 47.715 (3.010)Other Business Expenses 0.430 0.108 0.322 0.112 (0.004) 0.105 0.007 0.104 0.001Total Non-Labor Expenses $86.949 $66.765 $20.184 $64.183 $2.582 $62.677 $1.506 $65.247 ($2.570)
Other Expenses Adjustments:Other 0.000 0.000 0.000 0.000 0.000 0.000 0.000 0.000 0.000Total Other Expense Adjustments $0.000 $0.000 $0.000 $0.000 $0.000 $0.000 $0.000 $0.000 $0.000
Total Expenses before Depreciation $281.008 $265.757 $15.251 $271.458 ($5.701) $254.351 $17.107 $255.126 ($0.775)
Depreciation 0.000 0.000 0.000 0.000 0.000 0.000 0.000 0.000 0.000
Total Expenses $281.008 $265.757 $15.251 $271.458 ($5.701) $254.351 $17.107 $255.126 ($0.775)
Baseline Net Surplus/(Deficit) $0.000 $0.000 $0.000 $0.000 $0.000 $0.000 $0.000 $0.000 ($0.000)
Net Surplus/(Deficit) $0.000 $0.000 $0.000 $0.000 $0.000 $0.000 $0.000 $0.000 ($0.000)
MTA LONG ISLAND RAIL ROADJuly Financial Plan 2015-2018
Year-to-Year Changes by Category - Accrual Basis($ in millions)
Favorable/(Unfavorable)
V-69

NON-REIMBURSABLE / REIMBURSABLE
2014 2015Change
2015 - 2014 2016Change
2016 - 2015 2017Change
2017- 2016 2018Change
2018 - 2017RevenueFarebox Revenue $650.880 $657.318 $6.438 $662.215 $4.897 $666.098 $3.883 $668.368 $2.270Vehicle Toll Revenue 0.000 0.000 0.000 0.000 0.000 0.000 0.000 0.000 0.000Other Operating Revenue 51.301 49.479 (1.822) 48.753 (0.726) 48.703 (0.050) 49.280 0.577Capital and Other Reimbursements 281.008 265.757 (15.251) 271.458 5.701 254.351 (17.107) 255.126 0.775Total Revenue $983.189 $972.554 ($10.635) $982.426 $9.872 $969.152 ($13.274) $972.774 $3.622
ExpensesLabor:Payroll $592.160 $573.836 $18.324 $584.512 ($10.676) $603.768 ($19.256) $632.044 ($28.276)Overtime 133.642 116.847 16.795 116.027 0.820 116.149 (0.122) 117.971 (1.822)Health and Welfare 112.716 119.774 (7.058) 122.435 (2.661) 130.002 (7.567) 139.700 (9.698)OPEB Current Payment 58.563 61.807 (3.244) 63.746 (1.939) 67.206 (3.460) 70.876 (3.670)Pensions 199.192 194.663 4.529 195.565 (0.902) 196.412 (0.847) 198.865 (2.453)Other Fringe Benefits 146.237 143.011 3.226 146.526 (3.515) 151.949 (5.423) 159.027 (7.078)Reimbursable Overhead 0.000 0.000 0.000 0.000 0.000 0.000 0.000 0.000 0.000Total Labor Expenses $1,242.510 $1,209.938 $32.572 $1,228.811 ($18.873) $1,265.486 ($36.675) $1,318.483 ($52.997)
Non-Labor:Electric Power $106.973 $102.384 $4.589 $104.833 ($2.449) $112.722 ($7.889) $118.397 ($5.675)Fuel 29.718 28.129 1.589 26.989 1.140 27.609 (0.620) 28.356 (0.747)Insurance 28.944 32.309 (3.365) 35.582 (3.273) 38.534 (2.952) 42.274 (3.740)Claims 3.866 4.229 (0.363) 4.303 (0.074) 4.370 (0.067) 4.370 0.000Paratransit Service Contracts 0.000 0.000 0.000 0.000 0.000 0.000 0.000 0.000 0.000Maintenance and Other Operating Contracts 85.119 76.280 8.839 78.923 (2.643) 83.379 (4.456) 85.580 (2.201)Professional Service Contracts 42.444 35.483 6.961 31.846 3.637 32.476 (0.630) 34.330 (1.854)Materials & Supplies 193.125 174.805 18.320 181.620 (6.815) 183.257 (1.637) 189.768 (6.511)Other Business Expenses 14.830 15.389 (0.559) 15.891 (0.502) 16.159 (0.268) 22.041 (5.882)Total Non-Labor Expenses $505.019 $469.008 $36.011 $479.987 ($10.979) $498.506 ($18.519) $525.116 ($26.610)
Other Expenses Adjustments:Other 0.000 0.000 0.000 0.000 0.000 0.000 0.000 0.000 0.000Total Other Expense Adjustments $0.000 $0.000 $0.000 $0.000 $0.000 $0.000 $0.000 $0.000 $0.000
Total Expenses before Depreciation and GASB Adjs. $1,747.529 $1,678.946 $68.583 $1,708.798 ($29.852) $1,763.992 ($55.194) $1,843.599 ($79.607)
Depreciation $333.377 $343.332 ($9.955) $346.750 ($3.418) $350.202 ($3.452) $353.689 ($3.487)OPEB Obligation 71.398 73.540 (2.142) 75.746 (2.206) 75.746 0.000 77.261 (1.515)Environmental Remediation 3.600 2.000 1.600 2.000 0.000 2.000 0.000 2.000 0.000
Total Expenses $2,155.904 $2,097.818 $58.086 $2,133.294 ($35.476) $2,191.940 ($58.646) $2,276.549 ($83.094)
Baseline Net Surplus/(Deficit) ($1,172.715) ($1,125.264) $47.451 ($1,150.868) ($25.604) ($1,222.788) ($71.920) ($1,303.775) ($79.472)
MTA LONG ISLAND RAIL ROADJuly Financial Plan 2015-2018
Year-to-Year Changes by Category - Accrual Basis($ in millions)
Favorable/(Unfavorable)
V-70

CASH RECEIPTS & EXPENDITURES
2014 2015Change
2015 - 2014 2016Change
2016 - 2015 2017Change
2017- 2016 2018Change
2018 - 2017
ReceiptsFarebox Revenue $676.583 $680.318 $3.735 $685.215 $4.897 $689.098 $3.883 $691.368 $2.270Vehicle Toll Revenue 0.000 0.000 0.000 0.000 0.000 0.000 0.000 0.000 0.000Other Operating Revenue 48.861 41.919 (6.942) 40.427 (1.492) 40.074 (0.353) 40.389 0.315Capital and Other Reimbursements 263.472 245.725 (17.747) 254.137 8.412 237.292 (16.845) 234.889 (2.403)Total Receipts $988.916 $967.962 ($20.954) $979.779 $11.817 $966.464 ($13.315) $966.646 $0.182
ExpendituresLabor:Payroll $602.305 $571.328 $30.977 $581.949 ($10.621) $601.205 ($19.256) $629.425 ($28.220)Overtime 133.642 116.847 16.795 116.027 0.820 116.149 (0.122) 117.971 (1.822)Health and Welfare 113.265 119.774 (6.509) 122.435 (2.661) 130.002 (7.567) 139.700 (9.698)OPEB Current Payment 58.710 61.807 (3.097) 63.746 (1.939) 67.206 (3.460) 70.876 (3.670)Pensions 185.598 194.663 (9.065) 195.565 (0.902) 196.412 (0.847) 198.865 (2.453)Other Fringe Benefits 148.699 142.011 6.688 145.526 (3.515) 150.949 (5.423) 158.027 (7.078)GASB Account 5.827 0.000 5.827 0.000 0.000 0.000 0.000 0.734 (0.734)Reimbursable Overhead 0.000 0.000 0.000 0.000 0.000 0.000 0.000 0.000 0.000Total Labor Expenditures $1,248.046 $1,206.430 $41.616 $1,225.248 ($18.818) $1,261.923 ($36.675) $1,315.598 ($53.675)
Non-Labor:Electric Power $112.575 $102.384 $10.191 $104.833 ($2.449) $112.722 ($7.889) $118.397 ($5.675)Fuel 30.894 28.129 2.765 26.989 1.140 27.609 (0.620) 28.356 (0.747)Insurance 30.038 31.972 (1.934) 35.161 (3.189) 39.038 (3.877) 41.751 (2.713)Claims 2.316 2.625 (0.309) 2.666 (0.041) 2.702 (0.036) 2.702 0.000Paratransit Service Contracts 0.000 0.000 0.000 0.000 0.000 0.000 0.000 0.000 0.000Maintenance and Other Operating Contracts 99.830 76.280 23.550 78.923 (2.643) 83.379 (4.456) 85.580 (2.201)Professional Service Contracts 43.181 31.976 11.205 28.173 3.803 28.629 (0.456) 30.301 (1.672)Materials & Supplies 173.011 170.482 2.529 180.964 (10.482) 183.458 (2.494) 189.609 (6.151)Other Business Expenses 15.272 14.742 0.530 15.229 (0.487) 15.484 (0.255) 21.366 (5.882)Total Non-Labor Expenditures $507.117 $458.590 $48.527 $472.938 ($14.348) $493.021 ($20.083) $518.062 ($25.041)
Other Expenditure Adjustments:Other 23.000 23.000 0.000 23.000 0.000 23.000 0.000 23.000 0.000Total Other Expenditure Adjustments $23.000 $23.000 $0.000 $23.000 $0.000 $23.000 $0.000 $23.000 $0.000
Total Expenditures $1,778.163 $1,688.020 $90.143 $1,721.186 ($33.166) $1,777.944 ($56.758) $1,856.660 ($78.716)
Cash Timing and Availability Adjustment 0.000 0.000 0.000 0.000 0.000 0.000 0.000 0.000 0.000
Baseline Net Cash Deficit ($789.247) ($720.058) $69.189 ($741.407) ($21.349) ($811.480) ($70.073) ($890.014) ($78.534)
($ in millions)
Favorable/(Unfavorable)
MTA LONG ISLAND RAIL ROADJuly Financial Plan 2015-2018
Year-to-Year Changes by Category - Cash Basis
V-71

MTA LONG ISLAND RAIL ROAD 2015 Preliminary Budget
July Financial Plan 2015 - 2018 Plan-To-Plan Changes by Generic Category - Baseline
2014: Mid-Year vs. Adopted Budget 2014 Mid-Year Forecast is based on actual performance through March with projections for April through December based on current trends and known activities. Revenue
Passenger Revenue is favorable to plan primarily due to overall higher ridership and fare protection initiatives.
Other Operating Revenue is unfavorable due to the timing of a real estate sale. Capital and Other Reimbursements are higher primarily resulting from changes in
capital project activity and impac t due to the salary & wage update for the new wage pattern.
Expense Projections include additional Payroll, Overtime, Pension, Health & Welfare, Other Fringe Benefits, Other Business Expense a nd Reimbursable Overhead expenses for those employees without cont ract agreements that are patte rned after the recent TWU settlement
Payroll – Increased due to the new wage p attern established as a result of the recently completed TWU agreement and respective retroactive wage payments.
Other Fringe, inc luding Railroad Retirement Taxes, incr eased as a result of the new wage pattern and respective retroactive wage payments.
Overtime – increased as a result of the salary and wage update as a result of the new wage pattern and respectiv e retroactive wage payments as well as higher weather-related overtime in the first quarter.
Health and Welfare costs are lower due to the average number of vacant positions, lower NYSHIP rates, fewer retirees/beneficiaries (OPEB Current) and fewer active employees receiving family coverage than originally projected.
Pension increased due to t he new wage pattern establis hed as a result of the recently completed TWU agreement and respective retroactive wage payments.
Higher Electric Power is due to higher inflationary growth assumptions. Lower Diesel Power is due to lower inflationary growth assumptions. Lower Professional Services primarily due to a re-estim ate and timing of var ious
IT hardware, software and maint enance activities and reclassifying of security funding from Professional Services to Materials.
Higher Material due to the shifting of se curity funding from Professional Services to Materials and Operating Funded Capital Initiatives.
Other Business Expense is lower due to higher restitution of pr operty damage, lower office supplies and recruitment costs and timing of capital project activity.
V-72

2015 - 2017: July Financial Plan vs. February Financial Plan
Revenue Passenger Revenue is favorable to plan primarily due to overall higher rid ership
and fare protection initiatives. Other Operating Revenue is favorable in 20 15 due to the timing of a real estate
sale and 2016 – 2017 is higher due to hi gher projected freight and parking revenue including opening of new Wyandanch parking facility.
Capital and Other Reimburse ments are higher prim arily resulting from higher project activity, timing of positive train control and the impact of the salary and wage update as a result of the new wage pattern.
Expense Projections include additional Payroll, Overtime, Pension, Health & Welfare, Other Fringe Benefits, Other Business Expense a nd Reimbursable Overhead expenses for those employees without cont ract agreements that are patte rned after the recent TWU settlement.
Payroll - increases from the February Financial Plan due to the salary and wage update as a result of the new TWU wage pa ttern, partially offset in 2015 due to the revised East Side Access opening day being s hifted from 2019 to 2021 resulting in a 229 pos ition decrease in 2015. The headcount r eductions in 2016 through 2017 of 532 and 581 r espectively related to this shift result in lo wer overall payroll costs.
Overtime - increases primarily driven by the salary and wage update as a result of the new wage pattern.
Health and Welfare costs decrease due to lower rate s and fewer positions as a result of the delay in East Side Access opening day.
OPEB Current Payment costs decreas e due to lower rates and f ewer retiree/beneficiaries.
Pension decreased as a result of the revised East Side Access ramp up plan and latest actuarial estimates. This was parti ally offset by increases due to the new wage pattern established as a result of the recently completed TWU agreement.
Electric Power decreases, reflecting lower rates. Fuel decreases, reflecting lower rates. Minor changes in Maintenanc e and other O perating Contracts are due to timing
and re-estimates of various maintenance a nd other operating co ntracts in 2015 and 2016. The 2017 is lower due to the revised East Side Access ramp up plan.
Professional Services has slight fluctuat ions each year due to timing of capital project activity.
Material & Supplies increases each year due to addit ional costs associated wit h extended M3 retirement (through first quarter 2017), replacement of drop sash windows and change-out of obsolete parts on the M7. These expenses are offset in 2017 by the revised East Side Access ramp up plan.
V-73

2014 2015 2016 2017
($733.622) ($756.422) ($840.397) ($943.599)
Baseline Changes
RevenueFarebox Revenue $3.489 $5.279 $6.029 $7.065Vehicle Toll Revenue 0.000 0.000 0.000 0.000Other Operating Revenue (3.098) 2.996 1.288 1.383 Capital and Other Reimbursement 0.000 0.000 0.000 0.000
Total Revenue Changes $0.391 $8.275 $7.317 $8.448
ExpensesLabor:Payroll ($52.219) ($4.367) $19.309 $28.962Overtime (22.957) (8.373) (5.272) (6.638)Health and Welfare 6.947 7.284 17.442 20.820OPEB Current Payment 8.168 8.050 10.725 12.165Pensions (3.071) 3.216 7.154 6.445Other Fringe Benefits (11.007) (0.623) 4.635 4.750Reimbursable Overhead 2.742 4.739 7.265 4.495
Total Labor Expense Changes ($71.397) $9.926 $61.258 $70.999
Non-Labor:Electric Power ($2.637) $5.443 $7.241 $3.179Fuel 0.989 1.697 3.032 3.194Insurance 1.769 2.959 4.515 6.547Claims 0.290 0.000 0.000 0.000Paratransit Service Contracts 0.000 0.000 0.000 0.000Maintenance and Other Operating Contracts 0.046 (1.015) 2.566 16.681Professional Service Contracts 1.317 (0.318) 0.234 0.299Materials & Supplies (3.841) (5.534) (6.034) 2.144Other Business Expenses 1.267 0.519 0.713 0.853
Total Non-Labor Expense Changes ($0.800) $3.751 $12.267 $32.897
Total Expense Changes before Depreciation and GASB Adjs. ($72.197) $13.677 $73.525 $103.896
Depreciation ($21.828) ($22.483) ($22.708) ($22.935)OPEB Obligation 13.115 13.508 13.914 13.914Environmental Remediation (1.600) 0.000 0.000 0.000Total Expense Changes ($82.510) $4.702 $64.731 $94.875
Cash Adjustment ChangesTiming from 2013 ($20.933) $0.000 $0.000 $0.000Timing from 2013 included in accrued statements 0.009 0.000 0.000 0.000GASB 7.519 13.971 14.894 15.874Insurance 1.337 0.140 0.204 0.256Advertising Revenue 0.685 0.500 0.000 0.000Claims/FELA Reserves 0.740 0.775 0.790 0.803Reliability Centered Maintenance & Running Repair Savings 5.130 1.000 1.000 1.000Depreciation/OPEB/Environmental Remediation 10.313 8.975 8.794 9.021Other Miscellaneous (0.252) (0.266) (0.273) (0.268)Total Cash Adjustment Changes $4.549 $25.095 $25.409 $26.686
($77.570) $38.072 $97.457 $130.009
($811.192) ($718.350) ($742.940) ($813.590)
Total Baseline Changes
July Financial Plan - Cash Surplus/(Deficit)
NON-REIMBURSABLE
February Financial Plan - Cash Surplus/(Deficit)
MTA LONG ISLAND RAIL ROADJuly Financial Plan 2015-2018
Changes Between Financial Plans by Generic Categories($ in millions)
V-74

2014 2015 2016 2017
$0.000 $0.000 $0.000 $0.000
Baseline Changes
RevenueFarebox Revenue $0.000 $0.000 $0.000 $0.000Vehicle Toll Revenue 0.000 0.000 0.000 0.000Other Operating Revenue 0.000 0.000 0.000 0.000Capital and Other Reimbursement 0.924 16.709 26.770 11.365
Total Revenue Changes $0.924 $16.709 $26.770 $11.365
ExpensesLabor:Payroll $2.360 ($3.172) ($7.384) ($3.153)Overtime (2.604) (1.743) (3.754) (1.292)Health and Welfare (0.155) (0.393) (1.498) (0.361)OPEB Current Payment 0.000 0.000 0.000 0.000Pensions (2.863) (2.691) (4.125) (2.553)Other Fringe Benefits 0.576 (0.475) (1.804) (0.435)Reimbursable Overhead (2.742) (4.739) (7.265) (4.495)
Total Labor Expense Changes ($5.428) ($13.213) ($25.830) ($12.289)
Non-Labor:Electric Power ($0.535) ($0.712) ($0.494) $0.000Fuel 0.000 0.000 0.000 0.000Insurance 0.228 (0.214) (0.684) (0.325)Claims 0.000 0.000 0.000 0.000Paratransit Service Contracts 0.000 0.000 0.000 0.000Maintenance and Other Operating Contracts 0.276 (0.068) (0.260) (0.062)Professional Service Contracts 4.157 (1.166) 1.249 1.862Materials & Supplies (0.598) (1.333) (0.741) (0.549)Other Business Expenses 0.976 (0.003) (0.010) (0.002)
Total Non-Labor Expense Changes $4.504 ($3.496) ($0.940) $0.924
Total Expense Changes ($0.924) ($16.709) ($26.770) ($11.365)
Cash Adjustment ChangesTiming from 2013 20.306 0.000 0.000 0.000Operating Funded Capital 1.639 (1.708) 1.533 2.110Total Cash Adjustment Changes $21.945 ($1.708) $1.533 $2.110
$21.945 ($1.708) $1.533 $2.110
$21.945 ($1.708) $1.533 $2.110
REIMBURSABLE
February Financial Plan - Cash Surplus/(Deficit)
Total Baseline Changes
July Financial Plan - Cash Surplus/(Deficit)
MTA LONG ISLAND RAIL ROADJuly Financial Plan 2015-2018
Changes Between Financial Plans by Generic Categories($ in millions)
V-75

2014 2015 2016 2017
($733.622) ($756.422) ($840.397) ($943.599)
Baseline Changes
RevenueFarebox Revenue $3.489 $5.279 $6.029 $7.065Vehicle Toll Revenue 0.000 0.000 0.000 0.000Other Operating Revenue (3.098) 2.996 1.288 1.383Capital and Other Reimbursement 0.924 16.709 26.770 11.365
Total Revenue Changes $1.315 $24.984 $34.087 $19.813
ExpensesLabor:Payroll ($49.859) ($7.539) $11.925 $25.809Overtime (25.561) (10.116) (9.026) (7.930)Health and Welfare 6.792 6.891 15.944 20.459OPEB Current Payment 8.168 8.050 10.725 12.165Pensions (5.934) 0.525 3.029 3.892Other Fringe Benefits (10.431) (1.098) 2.831 4.315Reimbursable Overhead 0.000 0.000 0.000 0.000
Total Labor Expense Changes ($76.825) ($3.287) $35.428 $58.710
Non-Labor:Electric Power ($3.172) $4.731 $6.747 $3.179Fuel 0.989 1.697 3.032 3.194Insurance 1.997 2.745 3.831 6.222Claims 0.290 0.000 0.000 0.000Paratransit Service Contracts 0.000 0.000 0.000 0.000Maintenance and Other Operating Contracts 0.322 (1.083) 2.306 16.619Professional Service Contracts 5.474 (1.484) 1.483 2.161Materials & Supplies (4.439) (6.867) (6.775) 1.595Other Business Expenses 2.243 0.516 0.703 0.851
Total Non-Labor Expense Changes $3.704 $0.255 $11.327 $33.821
Total Expense Changes before Depreciation and GASB Adjs. ($73.121) ($3.032) $46.755 $92.531
Depreciation ($21.828) ($22.483) ($22.708) ($22.935)OPEB Obligation 13.115 13.508 13.914 13.914Environmental Remediation (1.600) 0.000 0.000 0.000Total Expense Changes ($83.434) ($12.007) $37.961 $83.510
Cash Adjustment ChangesTiming from 2013 ($0.627) $0.000 $0.000 $0.000Timing from 2013 included in accrued statements 0.009 0.000 0.000 0.000Operating Funded Capital 1.639 (1.708) 1.533 2.110GASB 7.519 13.971 14.894 15.874Insurance 1.337 0.140 0.204 0.256Advertising Revenue 0.685 0.500 0.000 0.000Claims/FELA Reserves 0.740 0.775 0.790 0.803Reliability Centered Maintenance & Running Repair Savings 5.130 1.000 1.000 1.000Depreciation/OPEB/Environmental Remediation 10.313 8.975 8.794 9.021Other Miscellaneous (0.252) (0.266) (0.273) (0.268)Total Cash Adjustment Changes $26.494 $23.387 $26.942 $28.796
($55.625) $36.364 $98.990 $132.119
($789.247) ($720.058) ($741.407) ($811.480)
($ in millions)
NON-REIMBURSABLE/REIMBURSABLE
February Financial Plan - Cash Surplus/(Deficit)
Total Baseline Changes
July Financial Plan - Cash Surplus/(Deficit)
Changes Between Financial Plans by Generic Categories
MTA LONG ISLAND RAILROADJuly Financial Plan 2015-2018
V-76

MTA LONG ISLAND RAIL ROAD 2015 Preliminary Budget
July Financial Plan 2015 - 2018 Summary of Major Plan-To-Plan Changes
Passenger Revenue is favorable to plan primarily due to overall higher ridership and fare protection initiatives in 2014 - 2017.
Fare collection initiatives that involve deploying Collector positions on key train s that have been identified as at risk for missed fare collection. The initial deployment will target trains that have s hort runs between high volume stations , such as Penn to Jamaica, Penn to Woodsid e, Penn to Bayside. This initiative will be at minimum cost neutral in 2014 - 2017.
Projections include additi onal Payroll, Overtime, Pension, Health & Welfa re, Other Fringe Benefits, Ot her Business Expense and Reimburs able Overhead expenses for those employees without co ntract agreements that are patterned after the recent TWU settlement. This a ssumption projects costs that are in excess of the February Plan provision, and a portion of this additional cost will be funded by the suspension of contributions to the GASB Account.
Retro Wage Payments due to new wage pattern in 2014. Health and Welfare rates lower in 20 14 – 2017 based on the most recent
revisions for Empire Plan cost assumptions provided by the NYS Department o f Civil Service and fewer projected retirees/beneficiaries for OPEB Current.
Pension savings based on latest actuarial estimates in 2014 - 2017. Lower Utility rate assumptions for Traction Power and Fuel in 2015 - 2017. All Maintenance of Equipment staff will need to be trained on the M9 beginning in
2017 M7 obsolete component strategy which includes change out of multifunction unit
and train operator display in 2016 - 2017. Additional cost due to extended M3 retirement date as a result of the delayed M9
procurement in 2015 - 2017. Revised estimate for East Side Access ramp up costs based on a 2021 opening
day in 2014 – 2017. Train Service Platform Investments based on anticipated ridership growth. Hillside Facility Lightning Protection in itiative based on the Lightning Risk
Assessment as per National Fire Protection Association's Lightning Protection Standard, NFPA 780 for the Installation of Lightning Protec tion Systems, Buildings #1, #2, #3, #7 and Sub-Station will require Lightning Protection System. The installation of Lightning Protection System for above mentioned buildings will protect critical equipment as well as keeping all critical DC power distribution systems on-line in 2015 - 2016.
With recent train crew hiring, additional assistant conductors must qualify as conductors within a 27 month period in 2014 -2015.
V-77

NON-REIMBURSABLE and REIMBURSABLE 2014 2015 2016 2017
February Financial Plan - Cash Surplus/(Deficit) ($733.622) ($756.422) ($840.397) ($943.599)
Non-Reimbursable Major Changes
RevenueFarebox Revenue $3.167 $3.874 $4.596 $5.603Fare Protection Initiative 0.322 1.405 1.433 1.462Bay Ridge Air Rights (3.000) 2.600 0.000 0.000All Other (0.098) 0.396 1.288 1.383
Sub-Total Non-Reimbursable Revenue Changes $0.391 $8.275 $7.317 $8.448
ExpensesSalary & Wage Update to New Wage Pattern (25.542) (24.484) (25.500) (28.469)Retro-Wage Payments-New Wage Pattern (61.055) 0.000 0.000 0.000Fare protection initiatives (0.322) (1.405) (1.433) (1.462)Train Service - Platform Investments (1.610) (2.241) (2.605) (2.697)Pension 0.600 1.500 2.200 2.900On Board Ticket Issueing Machines 1.300 (1.714) 0.000 0.000Reimbursable Overhead/Other impacts on Non-Reimbursable Budget 1.727 4.215 10.395 3.448Hillside Facility Lightning Protection 0.000 (1.600) (0.150) 0.000Conductor Qualification (0.359) (1.840) 0.000 0.000M9 Training 0.000 0.000 0.000 (2.098) Extended M3 retirement date 0.000 (4.857) (4.901) (0.518)M7 Obsolete Component Strategy 0.000 0.000 (6.195) (6.199)Budget Reduction Program - Improved Contractual Oversight 3.223 2.710 2.721 2.713Energy (Electric and and Fuel) rate related (1.723) 7.566 10.939 7.556 Health & Welfare/OPEB rate related 11.361 10.130 16.756 19.724 East Side Access Ramp Up costs 2.149 28.375 69.893 105.989 Depreciation/OPEB/Environmental Remediation (10.313) (8.975) (8.794) (9.021)All Other (1.946) (2.678) 1.405 3.009 Sub-Total Non-Reimbursable Expense Changes ($82.510) $4.702 $64.731 $94.875
Total Non-Reimbursable Major Changes ($82.119) $12.977 $72.048 $103.323
Reimbursable Major Changes
RevenueCapital and Other Reimbursement 0.924 16.709 26.770 11.365 Sub-Total Reimbursable Revenue Changes $0.924 $16.709 $26.770 $11.365
ExpensesSalary & Wage Update to New Wage Pattern ($5.165) ($6.140) ($6.609) ($6.106)
Other Miscellaneous 4.241 (10.569) (20.161) (5.259) Sub-Total Reimbursable Expense Changes ($0.924) ($16.709) ($26.770) ($11.365)
Total Reimbursable Major Changes ($0.000) $0.000 $0.000 $0.000
Total Accrual Changes ($82.119) $12.977 $72.048 $103.323
Cash Adjustment ChangesTiming from 2013 ($0.627) $0.000 $0.000 $0.000Timing from 2013 included in accrued statements 0.009 0.000 0.000 0.000Operating Funded Capital 1.639 (1.708) 1.533 2.110 GASB 7.519 13.971 14.894 15.874 Insurance 1.337 0.140 0.204 0.256 Advertising Revenue 0.685 0.500 0.000 0.000Claims/FELA Reserves 0.740 0.775 0.790 0.803 Reliability Centered Maintenance & Running Repair Savings 5.130 1.000 1.000 1.000 Depreciation/OPEB/Environmental Remediation 10.313 8.975 8.794 9.021 Other Miscellaneous (0.252) (0.266) (0.273) (0.268) Total Cash Adjustment Changes $26.494 $23.387 $26.942 $28.796
Total Baseline Changes ($55.625) $36.364 $98.990 $132.119
July Financial Plan - Cash Surplus/(Deficit) ($789.247) ($720.058) ($741.407) ($811.480)
MTA LONG ISLAND RAIL ROAD
July Financial Plan 2015-2018Summary of Major Programmatic Changes Between Financial Plans
($ in millions)
V-78

MTA LONG ISLAND RAIL ROAD
2015 Preliminary Budget July Financial Plan 2015 – 2018
Ridership/(Utilization)
RIDERSHIP/UTILIZATION PROJECTIONS Growth in the regional ec onomy and employment are the pr imary drivers of passenger ridership and revenue. Ridership thr ough April was 1.2% above the 2014 Adopted Budget and above the 2013 lev els by 1.3% ( adjusted for the same number of work days). The 2014 Mid-Year Forecast projects 2014 ridership to be 84.6 million , which is a 0.3% inc rease over the 2014 Adopted Budget. Ridership pr ojections for the outer years 2015-2018 reveal modest annual growth of 0.8% in 2015, 1.0% in 2016, 0.4% in 2017, and 0.5% in 2018.
V-79

2013Actual
2014Mid-YearForecast
2015Preliminary
Budget 2016 2017 2018
RIDERSHIP
Monthly 46.197 46.854 47.273 47.627 47.728 48.025Weekly 1.892 1.942 1.958 1.971 1.983 1.989Total Commutation 48.089 48.796 49.231 49.598 49.710 50.014
One-Way Full Fare 8.027 8.077 8.149 8.208 8.256 8.280One-Way Off Peak 17.461 17.732 17.943 18.073 18.179 18.232All Other 9.807 9.953 10.105 10.200 10.258 10.332Total Commutation 35.295 35.762 36.197 36.480 36.692 36.845
Total Ridership 83.384 84.558 85.428 86.079 86.402 86.859
FAREBOX REVENUE
Baseline Total Farebox Revenue $632.089 $650.880 $657.318 $662.215 $666.098 $668.368
MTA LONG ISLAND RAIL ROAD
July Financial Plan 2015-2018Ridership/(Utilization)
($ in millions)
V-80

Favorable/(Unfavorable)Administration Pos. 2014 Pos. 2015 Pos. 2016 Pos. 2017 Pos. 2018
None - 0.000 - 0.000 - 0.000 - 0.000 - 0.000Subtotal Administration - 0.000 - 0.000 - 0.000 - 0.000 - 0.000
Customer Convenience/AmenitiesNone - 0.000 - 0.000 - 0.000 - 0.000 - 0.000Subtotal Customer Convenience/Amenities - 0.000 - 0.000 - 0.000 - 0.000 - 0.000
Maintenance
None - 0.000 - 0.000 - 0.000 - 0.000 - 0.000Subtotal Maintenance - 0.000 - 0.000 - 0.000 - 0.000 - 0.000
Revenue EnhancementNone - 0.000 - 0.000 - 0.000 - 0.000 - 0.000Subtotal Revenue Enhancement - 0.000 - 0.000 - 0.000 - 0.000 - 0.000
SafetyNone - 0.000 - 0.000 - 0.000 - 0.000 - 0.000Subtotal Safety - 0.000 - 0.000 - 0.000 - 0.000 - 0.000
SecurityNone - 0.000 - 0.000 - 0.000 - 0.000 - 0.000Subtotal Security - 0.000 - 0.000 - 0.000 - 0.000 - 0.000
ServiceNone - 0.000 - 0.000 - 0.000 - 0.000 - 0.000Subtotal Service - 0.000 - 0.000 - 0.000 - 0.000 - 0.000
Service SupportNone - 0.000 - 0.000 - 0.000 - 0.000 - 0.000Subtotal Service Support - 0.000 - 0.000 - 0.000 - 0.000 - 0.000
OtherContract Savings - 3.223 - 2.710 - 2.721 - 2.713 - 2.710Subtotal Other - 3.223 - 2.710 - 2.721 - 2.713 - 2.710
Agency Submission - $3.223 - $2.710 - $2.721 - $2.713 - $2.710
MTA LONG ISLAND RAIL ROADJuly Financial Plan 2015-2018
2014 Budget Reduction Summary($ in millions)
V-81

MTA LONG ISLAND RAIL ROADJuly Financial Plan 2015-2018
2014 Budget Reduction Plan Worksheet
Category by Function: Other
Program: Contract Savings
Background Details:
Program Description/Implementation Plan:
Program Implementation Date: 4/1/2014 When will savings begin?: 4/1/2014
Are these savings recurring?: Yes
Other Issues:
2014 2015 2016 2017 2018Financial Impact (Operating):
Net Cash Savings (in millions) $3.223 $2.710 $2.721 $2.713 $2.710
Total Positions Required: 0 0 0 0 0
The LIRR has launched an effort to implement tighter controls and oversight on operating andadministrative departments non-payroll budgets and spending with particular emphasis oncontract services.
Savings derived through tighter oversight and budget controls.
None
Favorable/(Unfavorable)
V-82

MTA LONG ISLAND RAIL ROAD 2015 Preliminary Budget
July Financial Plan 2015 – 2018 Positions
Plan-to-Plan Summary of Changes
Position Assumptions
Positions are identified as of year-end (December 31) for each year in the financial plan and reflect an estimate of the total number of paid employees r equired to meet and achieve corporate goals as well as those in line with reimbursable activ ity. Positio n totals incorporate seasonal as well as other fluctuations in staffing requirements for capital projects.
2014 Changes
Total Positions of 7,001 in the 2014 Mid-Year Forecast represents an increase of 17 positions from the 2014 Adopted Budget. Year-end reimbursable positions increased by 85 and non-reimbursable positions decreased by 68 as a result of timing of capital project activity. 2015 Changes
The 2015 Preliminary B udget totals 7,056 positions, a decrease of 131 positions from the February Financ ial Plan. T he net dec rease of 173 non-reim bursable positions results primarily from the revi sed East Side Access Startup plan whic h results in a reduction of 229 positions, partially offset by additional positions for fare protection initiatives, additional tr ain Engineers to offset overtime, Customer Service Ambassadors, On Board Ticket Issuing Machine rollout and additional positions needed due to extended M3 retirement date. The net increase of 42 reimbursable positions is driven primarily by Maintenance of Equipment Positive Train Control initiative. 2016 – 2017 Changes The July Financial Plan in the years 2016 – 2018 reflects decreases of 442, 548, and 574 positions, respectively. Non- reimbursable positions decreased by 489 positions in 2016, 542 in 2017 and 570 in 2018, primarily due to the revised East Side Access startup plan, partially offset by many of the initiatives begun in 2015 continue through 2018. Reimbursable positions increase by 47 in 2016 due to Maintenance of Equipment Positive Train Control initiative, and decreased by 5 in 2017, due to project activity.
V-83

MTA LONG ISLAND RAIL ROAD 2015 Preliminary Budget
July Financial Plan 2015 – 2018 Positions
Year-To-Year Summary of Changes
Position Assumptions
Positions are identified as of year-end (December 31) for each year in the financial plan and reflect an estimate of the total number of paid employees r equired to meet and achieve corporate goals as well as those in line with reimbursable activ ity. Positio n totals incorporate the seasonal, as well as other fluctuations in staffing requirements for capital projects. 2014 - 2015 Changes
The 2015 Preliminary Budget to tals 7,056 positions, an incr ease of 55 positions from the 2014 Mid-Year Forecast. This incl udes an increase of 145 non-reimbursable positions and a decrease of 90 reimbursable positions. The primary cause of the non-reimbursable increase and reimbursable decr ease is the timing of capital program activity resulting in a shi ft of 123 Engineering positions from reimbursable to non-reimbursable as of December 31. Adjusting fo r this timing shift, the actual reimbursable position increase is due primarily to the s tart of Main tenance of Equipm ent Positive Train Control activities. 2016 – 2018 Changes Annual staffing levels decrease by 33 posit ions in 2016 and increase by 102 in 2017 and 128 in 2018. Non-reimbursabl e positions increase by 2 in 2016, 164 in 2017 and 136 in 2018. These increases are primarily related to East Side Access readiness efforts (increases of 19, 184, and 132 pos itions, respectively). Reimbursable position s decreased by 35 in 2016, 62 in 2017, and 8 in 2017 due to changes in pro ject activity and completion of Maintenance of Equipment Positive Train Control initiative.
V-84

2014 2015 2016 2017
2014 February Plan ‐ Total Baseline Positions 6,984 7,187 7,465 7,673
Total Plan-to-Plan Changes (17) 131 442 548
2014 July Plan ‐ Total Baseline Positions 7,001 7,056 7,023 7,125
Total Year-to-Year Changes, July Plan (55) 33 (102)
Total Plan‐to‐Plan Changes by Reporting Category:
Non‐Reimbursable 68 173 489 542Reimbursable (85) (42) (47) 5
Total (17) 131 442 548Full‐Time (17) 131 442 548Full‐Time Equivalents
Total (17) 131 442 548By Function Category ‐ Administration (1) 2 9 15 ‐ Operations (17) 118 226 227 ‐ Maintenance 18 28 224 323 ‐ Engineering/Capital (17) (17) (17) (17) ‐ Public Safety
Total (17) 131 442 548By Occupational Group ‐ Managers/Supervisors (8) 30 79 101 ‐ Professional, Technical, Clerical (23) (14) (18) (18) ‐ Operational Hourlies 14 114 380 464
Total (17) 131 442 548
Total Plan‐to‐Plan Changes by Major Category:2014 BRPsNew NeedsChange in Reimbursable Positions (85) (42) (47) 5
Re‐estimates & All Other 1 68 173 489 542Total (17) 131 442 548
1 Includes Full‐time Equivalents
MTA LONG ISLAND RAIL ROAD
July Financial Plan 2015‐2018Favorable/(Unfavorable)
Total Position Changes at a Glance
V-85

2013Actual
2014Mid-YearForecast
2015Preliminary
Budget 2016 2017 2018
Administration Executive VP 6 5 5 5 5 5Labor Relations 17 18 18 18 18 18Procurement & Logistics (excl. Stores) 85 83 84 84 81 81Human Resources 35 32 32 32 38 48Sr VP Administration 2 2 2 2 2 2Strategic Investments 26 32 32 32 32 32President 4 4 4 4 4 4VP & CFO/Pensions 3 5 5 5 5 5Information Technology 146 164 165 165 165 165Controller 41 46 46 46 46 46Management and Budget 17 19 21 21 21 21Process Re-Engineering 7 7 7 7 7 7VP - East Side Access & Special Projects 29 28 28 28 28 28Market Dev. & Public Affairs 61 70 70 70 70 70Gen. Counsel & Secretary 30 31 31 31 31 31Diversity Management 2 2 2 2 2 2System Safety 71 74 72 72 72 72Security 5 12 12 12 12 12Sr VP Operations/ Serv. Planning 21 24 24 24 26 26
Total Administration 608 658 660 660 665 675
OperationsTrain Operations 1,972 2,043 2,042 2,025 2,177 2,266Customer Service 296 298 298 296 295 295
Total Operations 2,268 2,341 2,340 2,321 2,472 2,561
MaintenanceEngineering 1,642 1,715 1,729 1,711 1,723 1,757Equipment 2,008 2,041 2,082 2,086 2,020 2,015Procurement (Stores) 91 93 93 93 93 93
Total Maintenance 3,741 3,849 3,904 3,890 3,836 3,865
Engineering/CapitalDepartment of Project Management 110 153 153 153 153 153
Total Engineering/Capital 110 153 153 153 153 153
Total Baseline Positions 6,727 7,001 7,056 7,023 7,125 7,253
Non-Reimbursable 6,136 6,122 6,267 6,269 6,433 6,568 Reimbursable 591 879 789 754 693 685
Total Full-Time 6,727 7,001 7,056 7,023 7,125 7,253 Total Full-Time Equivalents - - - - - -
FUNCTION/DEPARTMENT
MTA LONG ISLAND RAIL ROADJuly Financial Plan 2015-2018
Total Positions by Function and DepartmentNon-Reimbursable/Reimbursable and Full-Time/Full Time Equivalents
V-86

FUNCTION/OCCUPATIONAL GROUP2013
Actual
2014Mid-YearForecast
2015Preliminary
Budget 2016 2017 2018
Administration Managers/Supervisors 301 331 334 334 341 351 Professional, Technical, Clerical 307 327 326 326 324 324 Operational Hourlies - - - - - -
Total Administration 608 658 660 660 665 675
Operations Managers/Supervisors 317 328 327 327 325 322 Professional, Technical, Clerical 166 165 165 163 163 163 Operational Hourlies 1,785 1,848 1,848 1,831 1,984 2,076
Total Operations 2,268 2,341 2,340 2,321 2,472 2,561
Maintenance Managers/Supervisors 693 768 746 750 746 760 Professional, Technical, Clerical 257 280 267 267 269 270 Operational Hourlies 2,791 2,801 2,891 2,873 2,821 2,835
Total Maintenance 3,741 3,849 3,904 3,890 3,836 3,865
Engineering/Capital Managers/Supervisors 85 117 115 115 115 115 Professional, Technical, Clerical 25 36 38 38 38 38 Operational Hourlies - - - - - -
Total Engineering/Capital 110 153 153 153 153 153
Public Safety Managers/Supervisors - - - - - - Professional, Technical, Clerical - - - - - - Operational Hourlies - - - - - -
Total Public Safety - - - - - -
Total Baseline Positions Managers/Supervisors 1,396 1,544 1,522 1,526 1,527 1,548 Professional, Technical, Clerical 755 808 796 794 794 795 Operational Hourlies 4,576 4,649 4,739 4,704 4,805 4,911
Total Baseline Positions 6,727 7,001 7,056 7,023 7,125 7,253
MTA LONG ISLAND RAIL ROADJuly Financial Plan 2015-2018
Total Positions by Function and Occupation
V-87

[THIS PAGE INTENTIONALLY LEFT BLANK]
V-88

Metro-North Railroad

MTA METRO-NORTH RAILROAD
2015 Preliminary Budget July Financial Plan 2015 - 2018
FINANCIAL OVERVIEW The July Financial Plan 2015-2018 reflects a focus on key strategic investments required to support Metro-North’s mission to provi de safe, s ecure and reliable transportation service to its customers. In 2013, s everal operating inc idents prompted a crit ical evaluation of the Railroad ’s safety practices, infrastructure conditions, and maintenance procedures. Initial reviews that began over a year ago drove a series of actions starting in May 2013 to enhanc e safety and improve the track infrastructure . In 2014, Metro-North has tak en the next important step toward reestablis hing safe and reliable service th rough the development and implementation of its 100-Day Action Plan. This plan not only serves as a template for additional immediate improvements in the safety and reliability of the Railroad’s operations, but also identifies what is needed to start Metro-North on a long–term course to regain its status as the finest railroa d in its class. The 100-Day Plan includes recommendations from the Feder al Railroad Adminis tration’s (FRA) recently completed “Operation Deep Dive” review as well as feedback from customers, employees, industry experts, business partners, elected officials and other stakeholders. Further refinements will be incorporated pending completion of investigations by the Na tional Transportation Safety Board (NTSB) and recommendations by the MTA’s Blue Ribbon Panel on safety. Initiatives supporting this plan can be categorized into four main areas of focus:
Promoting a Culture of Safety in which s afety is embedded in all decis ions, actions, and initiatives
Adopting Concrete Safety Enhancements that guarantee safe operations and safe work practices
Restoring Reliable Service that provides train servic e that is not only safe but reliable and of high quality
Improving Communications of the railroad’s goals, o perations and policies so customers can make informed choices regarding the use of our servi ce and employees can provide the best customer service possible.
As of early June, 21 of the 32 initiatives identified in the 100-Day Action Plan have been completed and another seven ar e well underway. Actions have enabled a series of reforms touching v irtually every aspect of Me tro-North’s operations. Key overarching actions include a comprehensive outreach to ensure all employees understand that safety is the foundation of the railroad and its undisputed first priority. To this end, Metro-North has reorganized the Safety Departmen t, centralized ov ersight of all training
V-89

functions, and established work plans to addr ess each directed action identified in the FRA review. Proposed Safety Investments Metro-North is committed to st rengthening safety and service re liability as a cornerstone to its operating plan. Accordingly, a series of required safety-related invest ments have been presented for consideration and funding t hat will address regulatory requirement s or recommended actions by the FRA, NTSB , railroad industry experts and Metro-North management. These proposed investments hav e been excluded from the Metro-North’s baseline and are included in Volume I on a c onsolidated basis as part of an agency-wide MTA Safety initiative. These investments are summarized as follows:
Safety Department reorganization will add staff to pr omote changes to Metro-North’s safety culture and provide concre te safety enhancements. The safety and security function which was housed under one department have been separated to ensure dedicated attention to each of th ese important functions. In addition to enhancing the staff and skills, a review and overhaul of the System Safety Program Plan has been performed, em ployee safety training and testing programs will be undertaken, and a new Data Analys is and Incident Investigation Units are being created.
Training Department reorganization will significantly expand the Department’s scope of responsibility. Additional staffing will provide the necessary resources for the Department to: Provide oversight and coordination of all training functions across MNR. Undertake a comprehensive review, evaluation, and improvement of all
existing training programs. Develop and deliver new training programs. Assume responsibility for all training recordkeeping and reporting, including
auditing. Operations staff additions will improve oversight of train crew compliance with
required procedures and rules, mitigate risks associated with employee fatigue, and expand employee testing.
Positive Train Control (PTC) results in a significant increase in the volume of signal equipment and electr onic systems that will require additional staffing to ensure compliance with mandated inspection and repairs.
Video Cameras on Passenger Equipment and Locomotives to aid post-accident/incident investigations and form tr aining programs that will promote safe operating practices.
GCT Trainshed Bridge Inspection requires professional engineering services for FRA mandated inspections to ensure that the GCT T rainshed’s upper and lower level structures meet bridge safety standards.
Infrastructure Improvements require the following additional resources: Employ advanced ins pection technology to increase t he effectiveness of
track inspections.
V-90

Add on-call Track Engineering staff to supplement the existing workforce Procure track and power system geometry equipment to improve the
accuracy and efficiency of infrastructure testing and maintenance. Upgrade GCT Fire Life Safety systems
The July F inancial Plan identif ies the resources necessary to support new efforts, and continue existing ones. New Ne eds that fulf ill several immediate requirements includ e the purchase of maintenance and invent ory management equipment, GC T amenities, enterprise asset management and procurem ent compliance enhanc ements. These initiatives total $5 million in 2015 and are funded thro ugh internal efficiencies, resource reallocations and expenditure timing adjustments. Reflecting the recent labor settlement with the Transport Workers Union (T WU), MTA’s largest union, the July Financ ial Plan a ssumes the same pattern settl ement for employees represented by uni ons without contract agree ments. This assumption projects costs that are in ex cess of the February Financial Plan provision, and a portion of this add itional cost will be fu nded by th e suspension of contributions to the GASB Account. In addition, the July Financ ial Plan s ustains the savings achieved from previous cost reduction measures, limits 2015 expens e growth to approxim ately 2% over 2014 and incorporates a new budget r eduction program that reduces operating subsidies by $4.5 million annually, starting in 2014. Within these constraints, necessary improvements and repairs to the infrastructure will conti nue along with normal peri odic maintenance and upgrades of stations, facilities, and equipment. New Needs included in the July Financial Plan:
Power System Maintenance Catenary Maintenance Vehicles (CMVs) - Metro-North currently has two CMVs
that are current ly used to s ervice and repair the New Haven Line’s c atenary power system. T hese units have s urpassed their useful life and requi re replacement. Due to the age and condi tion of the current equipment as well as advances in electrical diagnostic technology over the past ten years, the benefi ts of new CMV’s far outweigh refurbishment. The cost for this equipment totals $4.5 million and is spread over 2015 - 2017.
AC Bus Duct Replacement – The DC traction power substations that provide third rail power for Metro-North’s Harlem and Hudson lines use a sys tem consisting of transformers and rectifiers that are joined by copper bars or AC Bus Ducts. This material is at the end of its useful life and the failure to replace them puts power substation reliability at risk. A five-year program starting in 2015 to change-out AC Bus Du cts has been inc orporated into the July Financial Plan at an annual cost of $0.5 million.
V-91

Enterprise Asset Management – Tracking and management of Metro- North’s assets is essential to ensuring they are adequately maintained or replaced on a timely ba sis. To this end, res ources have been included in the J uly Financial Plan to s upport the development and maintenance of an asset management system that will formalize and automate the supply of the information necessary to ensure assets are maintained in a state of good repair. Inventory & Supplies Warehouse Equipment – to maximize existing warehouse space and accommodate a reduction in the volum e of space with the consolidation of warehouse facilities at the Harmon Shop complex, the fo llowing additional warehouse management equipment is required in 2015:
Vertical Lift Machines (VLMs) – two VLMs will be a dded to the Harmon Material Distribution Center t o increase storage capacity for small it ems ($0.4 million).
Stacking System – a heavy duty r acking system is required to increase the storage capacity for large, heavy inventory items also stored at the Harm on Material Distribution Center ($1.5 million).
Grand Central Terminal – Several projects are included in response to cu stomer needs at GCT. Thes e include safety enhan cements to the platform between tracks 14 and 15 wher e riders ar e in c lose proximity to adjacent rail road activities, improved signage in the GCT North passageway, as well as se curity and maintenanc e enhancements at GCT entrances. Procurement Compliance – Additional staff to enhance Minority and Women-owned Business Enterprises (M/WBE) & Vet eran procurement compliance. The roles of this position are to ass ist with the increased number of audits, assist with training and state reporting requirements. Additionally, it will assist with the DDCR/Veteran Bill activities in identifying vendors for specific commodities.
Key On-Going Programs supported in the July Financial Plan
Infrastructure Improvement Program In 2013, $20.3 millio n was inv ested to corre ct areas of poor drainage u nder track beds, as well as to weld rail joints in order to improve safety & reliability and signal system continuity. This program will continue in 2014 with a forecast of $24.1 million for the labor, material and equipment to suppor t this work. An integral part of this program is the continued work of Transportation Technology Center Inc. (TTCI), to evaluate our right-of-way and provide critic al data and recommendations that target specific areas for improvement. This level of effort continues in 2015, followed by a reduced level of work starting in 2016 as t he infrastructure is stabilized and a more comprehensive cyclical maintenance program is begun.
V-92

Equipment Reliability – Metro-North commits signific ant resources towards the maintenance and revitalization of its rolling stock fleet, purchasing new equipment and remanufacturing select cars, coaches and locomotives. The July Financial Plan includes funding for the following equipment maintenance programs:
Installation of “alerter” devices will be completed on the M-3 and coach fleets by the 4th quarter of 2014.
M-8 Cars - in partnership with CDOT, Metro-North continues to phase-in the replacement of the entire New Haven Line electric car fleet with all new c ars expected to be in service by the end of 2014.
M-7 Cars – this car fleet will begin a 10-year life cycle maintenance program starting in 2014.
Locomotive Overhaul Programs will co ntinue and the July Financia l Plan includes the resources to complete the current Genesis overhaul program and begin the next ro und of overhauls on t his equipment as well as on the BL-20 and GP35 locomotives.
Customer service
Efforts continue for the installation of new customer information monitors and the replacement of outdated electronic pla tform signs at New York State (NYS) outlying stations to improve the quality of information communicated to customers. For Connecticut stations a plan has been re cently developed for the installation of station monitors which is under review for implementation.
Improvements to the Customer Call-in System (Interactive Voice Response (IVR) system) include the addition of new advanced call routing to increase custome r convenience and allow for a seamless navi gation through the interactive voice response system.
In a joint ef fort with the LIRR, work has begun to develop a Mobile Ticketing Application which will allow customers to purchase tickets using smartphones and other mobile devices. To date, a contract has been awarded for the development of the application with a planned rollout during the latter part of 2015.
The Station Enhancement Program will continue in 2014 that incorporates painting, lighting, s ignage, “scratchitti” replacement, recycling container rehabilitation, seat replacement and many other elements to enhance the stati on environment.
To improve convenience and reliability the overhaul of all GCT escalators was completed this past May and plans are no w underway to eventually replac e this equipment with new and heavier duty escalators.
Ridership
The 2014 Mid-Year Forecast estimates 84.3 million East an d West of Hudson riders, an increase of 1.2% over 2013.
Compared to the 2014 Ad opted Budget, the 2014 Mid- Year Forecast is 1.9% lower due to lower than projected grow th in non-commutation and commutation ridership resulting primarily from the adverse effects of winter weather disruptions
V-93

as well as a continuation of slower growth trends experienced since the latter part of 2013.
In 2015-2018 ridership is projected to grow approximately 1.7% annually with growth occurring across all commuter lines.
Financial plan projections assume no fare increases in New York State, and annual 1.0% fare increases in Connecticut through 2018.
Efforts to promote ri dership growth continue with increases in parking and promotional advertising, as well as a projected continuat ion of regional employment growth.
Overtime On a steady state basis, Metro-North’s bud get reflects conservative overtime expenditures required to addres s operating needs including train se rvice requirements, maintenance requirements, weather emergencies, employ ee availability and other programmatic needs. In the near term, Metro-North has increased its provision for overtime which continues to be driven by the following:
• Weather emergencies • The implementation of safety enhancements, • Safety responses to operational disruptions, • The continuation of the infrastructure improvement program, • The impact of implementing a rigorous on-going system wide track maintenance
program, • Attrition in personnel
Metro-North’s overtime exp enditure will d ecline slightly in 2015 as hiring a nd training programs provide qualified employees especiall y in the area of trai n and engine service. It is too early to determine when overtime spending for the current infrastructure improvement program and track maintenance programs will lev el off but our efforts will improve the infrastructure, minimize operating risks and i mprove our customer’s commute.
2014 MID-YEAR FORECAST The Non-Reimbursable 20 14 Mid-Year Forecast reflects revenue projections totaling $712.1 million and expenses, including non-cash liability adjustments, of $1,490.1 million that result in an ope rating deficit of $778 .0 million. The Opera ting revenue includes passenger revenue of $649.8 milli on that are $10.3 million unfavorable versus the 2014 Adopted Budget due to lower than anticipated ridership resulting from the adverse effects of winter weather, service disruptions , and in general lower ri dership growth as a result of slower growth trends experienced since the latter part of 2013. Non-passenger revenues of $62.3 million are $5.9 million better than t he 2014 Ado pted Budget. Excluding a planned assumption of storm reimbursement cost s of $9.7 million that ha d
V-94

been built into the budget, baseline revenue s are $0.3 million lower, mainly due to lower commissary revenues as a result of deco mmissioning the New Haven Line bar car s. The Non-Reimbursable operating expenses are $79.3 mil lion unfavorable compared to the 2014 Adopted Budget. This is primarily driven by the effe ct of an adjustment to the TWU patterned wage settlement provision ($60.5 m illion) and higher overtime costs, partly offset by vacancies. Non-labor expendi tures reflect costs related to the Spuyten Duyvil derailment repairs and Infrastructure Improvement Program costs.
The Reimbursable 2014 Mid-Year Forecast of expenditures (and receipts) is $216.1 million, which is $ 9.5 million higher than the 2014 Adopted Budget. This increas e reflects the effect of the adjustment to wa ge settlement estimate ($6.6 million) and th e rescheduling of various projects especially the Mainline Hi-Speed Turnouts and Cos Cob West Substation projects.
2015 PRELIMINARY BUDGET BASELINE
The Non-Reimbursable 2015 Pre liminary Budget reflects re venue projections totaling $723.2 million and expenses, including non-cash liability adjustments of $1,458.7 million that generate an operating defic it of $735.5 million. Non-Reimbursable East of Hudson Farebox revenue of $668.5 million is $18.7 m illion or 2.9% higher than the 2014 Mid -Year Forecast reflecting ridership growth of 2.2%, as well as a 1% Conn ecticut fare increase effective January 2014. Non-passenger revenue is projected to be $7.6 million lower than 2014 reflec ting the elimination of one-time 2014 recoveries of Tropical Storm Sandy and Irene da mages ($9.7 million), partly offset by hig her advertising and GCT retail revenue. Operating expenses of $1, 458.7 million reflect the TWU patterned wag e growth assumptions ($23 million), higher empl oyee benefit costs, ant icipated increases in electric power cost s and insurance as well as inflation-based increases for material. Labor costs also reflect fewer vacancies and a continuation of 2014 overtime levels to ensure adequate weather coverage, revenue collection, and job coverage for employees in training, and the higher levels of attrition and succession planning that are expected to continue in 2015.
The Reimbursable 2015 Proposed revenues and e xpenses total $253. 5 million, an increase of $37.5 million from the 2014 Mid-Year Forecast mo stly due to the impact of the TWU patterned wage adjust ment ($2.3 million), and in creased professional service contracts and materials & supply expenditures due to the acceler ation of the Pos itive Train Control (PTC) project.
2016-2018 PROJECTIONS The 2016 - 2018 expenditure projections reflect the TWU patterned wage gro wth assumption (average annual cos t is $27 million in total; $25 million Non-Reimbursable, $2 million Reimbursa ble) and will also allow Metro-North to continue in itiatives that maintain or enhance train service levels, c ontinue service reliability programs that maintain rolling stock and the right-of-way and incorporate projec ted cost changes in labor, energy, employee benefits, insurance and ma terial as well as capital projects.
V-95

Major assumptions reflected in the 2016 - 2018 projections and reconciliation to the February Financial Plan is furnished later in this document. Details for the Year-to-Year changes and reconc iliations of the July Financial Plan to the February Financial Plan are discussed in the Plan-to-Plan Summary of Changes as well as the assumptions guiding ridership and headcount.
V-96

NON-REIMBURSABLE
2014 20152013 Mid-Year Preliminary
Actual Forecast Budget 2016 2017 2018Operating RevenueFarebox Revenue $618.812 $649.769 $668.487 $682.207 $696.711 $707.254Toll Revenue 0.000 0.000 0.000 0.000 0.000 0.000Other Operating Revenue 62.094 62.338 54.717 55.641 57.059 58.531 MNR - MTA 0.000 0.000 0.000 0.000 0.000 0.000 MNR - CDOT 0.000 0.000 0.000 0.000 0.000 0.000 MNR - Other 0.000 0.000 0.000 0.000 0.000 0.000Capital and Other Reimbursements 0.000 0.000 0.000 0.000 0.000 0.000Total Revenue $680.906 $712.107 $723.204 $737.847 $753.770 $765.785
Operating ExpensesLabor:Payroll $412.077 $466.296 $453.173 $462.154 $471.194 $480.648Overtime 68.741 83.171 76.904 75.228 76.788 78.383Health and Welfare 90.742 99.567 102.022 107.092 113.280 118.819OPEB Current Payment 21.692 23.666 24.836 25.442 26.672 27.971Pensions 77.182 84.232 79.462 77.747 78.809 79.904Other Fringe Benefits 110.474 105.491 102.993 105.826 109.374 111.799Reimbursable Overhead (36.298) (43.080) (42.256) (43.061) (43.861) (44.680)Total Labor $744.610 $819.344 $797.135 $810.428 $832.256 $852.844
Non-Labor:Electric Power $74.416 $89.330 $84.670 $87.990 $100.105 $108.603Fuel 29.637 27.958 27.127 26.191 26.410 27.178Insurance 14.386 17.928 19.738 22.075 24.367 26.907Claims 39.328 2.000 1.000 1.000 1.000 1.000Paratransit Service Contracts 0.000 0.000 0.000 0.000 0.000 0.000Maintenance and Other Operating Contracts 95.298 104.850 107.795 111.717 115.167 116.104Professional Service Contracts 23.309 31.178 29.498 30.474 30.294 30.724Materials & Supplies 65.081 75.966 75.557 74.616 74.642 75.311Other Business Expenses 31.457 25.221 16.856 27.495 28.391 29.569Total Non-Labor $372.912 $374.429 $362.241 $381.558 $400.376 $415.396
Other Expenses Adjustments:Other 0.000 0.000 0.000 0.000 0.000 0.000Total Other Expense Adjustments $0.000 $0.000 $0.000 $0.000 $0.000 $0.000
Total Expenses before Depreciation and GASB Adjs. $1,117.522 $1,193.774 $1,159.376 $1,191.986 $1,232.632 $1,268.241
Depreciation $230.045 $227.237 $227.237 $227.237 $229.237 $231.237OPEB Obligation 57.724 65.098 68.316 69.982 73.366 76.940Environmental Remediation 1.927 4.001 3.800 3.800 3.800 3.800
Total Expenses $1,407.219 $1,490.110 $1,458.729 $1,493.006 $1,539.035 $1,580.218
Baseline Surplus/(Deficit) ($726.313) ($778.003) ($735.525) ($755.158) ($785.265) ($814.433)
Cash Conversion Adjustments:Depreciation $230.045 $227.237 $227.237 $227.237 $229.237 $231.237Operating/Capital (24.512) (35.879) (34.803) (27.709) (21.142) (18.690)Other Cash Adjustments 121.538 50.646 82.511 86.854 79.398 75.431Total Cash Conversion Adjustments $327.071 $242.003 $274.945 $286.381 $287.493 $287.977
Baseline Cash Surplus/(Deficit) ($399.242) ($536.000) ($460.580) ($468.777) ($497.773) ($526.456)
-- Differences are due to rounding.
MTA Metro-North RailroadJuly Financial Plan 2015 - 2018
Accrual Statement of Operations by Category($ in millions)
V-97

REIMBURSABLE
2014 20152013 Mid-Year Preliminary
Actual Forecast Budget 2016 2017 2018RevenueFarebox Revenue $0.000 $0.000 $0.000 $0.000 $0.000 $0.000Toll Revenue 0.000 0.000 0.000 0.000 0.000 0.000Other Operating Revenue 0.000 0.000 0.000 0.000 0.000 0.000 MNR - MTA 81.571 120.365 128.561 131.626 134.736 137.769 MNR - CDOT 58.111 75.585 106.619 83.876 54.826 55.853 MNR - Other 11.688 20.133 18.352 18.702 19.060 19.435Capital and Other Reimbursements 151.370 216.084 253.532 234.205 208.622 213.057Total Revenue $151.370 $216.084 $253.532 $234.205 $208.622 $213.057
ExpensesLabor:Payroll $36.561 $43.907 $42.335 $43.164 $44.008 $44.799Overtime 15.822 18.390 17.507 17.857 18.213 18.530Health and Welfare 12.040 13.280 13.199 13.444 13.750 14.105OPEB Current Payment 0.000 0.000 0.000 0.000 0.000 0.000Pensions 7.274 9.091 7.627 7.380 7.119 6.890Other Fringe Benefits 9.259 10.137 10.156 10.487 10.773 11.006Reimbursable Overhead 33.940 41.316 38.775 39.514 40.249 41.001Total Labor $114.896 $136.122 $129.599 $131.845 $134.113 $136.330
Non-Labor:Electric Power $0.215 $0.000 $0.000 $0.000 $0.000 $0.000Fuel 0.001 0.000 0.000 0.000 0.000 0.000Insurance 2.891 3.595 3.687 3.756 3.827 3.900Claims 0.000 0.000 0.000 0.000 0.000 0.000Paratransit Service Contracts 0.000 0.000 0.000 0.000 0.000 0.000Maintenance and Other Operating Contracts 14.605 16.680 16.955 17.250 17.521 17.807Professional Service Contracts 5.412 20.543 52.700 33.688 9.779 9.938Materials & Supplies 11.626 37.057 48.468 45.506 41.189 42.853Other Business Expenses 1.724 2.088 2.122 2.159 2.193 2.229Total Non-Labor $36.475 $79.962 $123.933 $102.359 $74.509 $76.726
Other Adjustments:Other 0.000 0.000 0.000 0.000 0.000 0.000Total Other Adjustments $0.000 $0.000 $0.000 $0.000 $0.000 $0.000
Total Expenses before Depreciation $151.370 $216.084 $253.532 $234.205 $208.622 $213.057
Depreciation $0.000 0.000 0.000 0.000 0.000 0.000OPEB Obligation 0.000 0.000 0.000 0.000 0.000 0.000Environmental Remediation 0.000 0.000 0.000 0.000 0.000 0.000
Total Expenses $151.370 $216.084 $253.532 $234.205 $208.622 $213.057
Baseline Surplus/(Deficit) $0.000 $0.000 $0.000 $0.000 $0.000 $0.000
Cash Conversion Adjustments:Depreciation $0.000 $0.000 $0.000 $0.000 $0.000 $0.000Operating/Capital 0.000 0.000 0.000 0.000 0.000 0.000Other Cash Adjustments 0.000 0.000 0.000 0.000 0.000 0.000Total Cash Conversion Adjustments $0.000 $0.000 $0.000 $0.000 $0.000 $0.000
Baseline Cash Surplus/(Deficit) $0.000 $0.000 $0.000 $0.000 $0.000 $0.000
-- Differences are due to rounding.
MTA Metro-North RailroadJuly Financial Plan 2015 - 2018
Accrual Statement of Operations by Category($ in millions)
V-98

NON-REIMBURSABLE / REIMBURSABLE
2014 2015
2013 Mid-Year Preliminary
Actual Forecast Budget 2016 2017 2018RevenueFarebox Revenue $618.812 $649.769 $668.487 $682.207 $696.711 $707.254Toll Revenue 0.000 0.000 0.000 0.000 0.000 0.000Other Operating Revenue 62.094 62.338 54.717 55.641 57.059 58.531 MNR - MTA 81.571 120.365 128.561 131.626 134.736 137.769 MNR - CDOT 58.111 75.585 106.619 83.876 54.826 55.853 MNR - Other 11.688 20.133 18.352 18.702 19.060 19.435Capital and Other Reimbursements 151.370 216.084 253.532 234.205 208.622 213.057Total Revenue $832.276 $928.191 $976.736 $972.052 $962.392 $978.841
ExpensesLabor:Payroll $448.638 $510.203 $495.508 $505.318 $515.202 $525.447Overtime 84.563 101.562 94.411 93.084 95.001 96.913Health and Welfare 102.782 112.847 115.221 120.536 127.030 132.924OPEB Current Payment 21.692 23.666 24.836 25.442 26.672 27.971Pensions 84.456 93.323 87.089 85.127 85.928 86.794Other Fringe Benefits 119.733 115.628 113.149 116.313 120.148 122.805Reimbursable Overhead (2.358) (1.764) (3.481) (3.547) (3.612) (3.679)Total Labor $859.506 $955.466 $926.734 $942.273 $966.369 $989.175
Non-Labor:Electric Power $74.630 $89.330 $84.670 $87.990 $100.105 $108.603Fuel 29.638 27.958 27.127 26.191 26.410 27.178Insurance 17.278 21.523 23.425 25.831 28.194 30.807Claims 39.328 2.000 1.000 1.000 1.000 1.000Paratransit Service Contracts 0.000 0.000 0.000 0.000 0.000 0.000Maintenance and Other Operating Contracts 109.904 121.529 124.750 128.967 132.688 133.910Professional Service Contracts 28.721 51.722 82.198 64.162 40.073 40.662Materials & Supplies 76.707 113.022 124.025 120.122 115.831 118.164Other Business Expenses 33.180 27.308 18.978 29.654 30.584 31.798Total Non-Labor $409.386 $454.392 $486.174 $483.917 $474.885 $492.123
Other Adjustments:Other 0.000 0.000 0.000 0.000 0.000 0.000Total Other Adjustments $0.000 $0.000 $0.000 $0.000 $0.000 $0.000
Total Expenses before Depreciation and GASB Adjs. $1,268.892 $1,409.858 $1,412.907 $1,426.191 $1,441.255 $1,481.297
Depreciation $230.045 $227.237 $227.237 $227.237 $229.237 $231.237OPEB Obligation 57.724 65.098 68.316 69.982 73.366 76.940Environmental Remediation 1.927 4.001 3.800 3.800 3.800 3.800
Total Expenses $1,558.589 $1,706.194 $1,712.260 $1,727.210 $1,747.657 $1,793.274
Baseline Surplus/(Deficit) ($726.313) ($778.003) ($735.525) ($755.158) ($785.265) ($814.433)
Cash Conversion Adjustments:Depreciation $230.045 $227.237 $227.237 $227.237 $229.237 $231.237Operating/Capital (24.512) (35.879) (34.803) (27.709) (21.142) (18.690)Other Cash Adjustments 121.538 50.646 82.511 86.854 79.398 75.431Total Cash Conversion Adjustments $327.071 $242.003 $274.945 $286.381 $287.493 $287.977
Baseline Cash Surplus/(Deficit) ($399.242) ($536.000) ($460.580) ($468.777) ($497.773) ($526.456)
-- Differences are due to rounding.
MTA Metro-North Railroad
July Financial Plan 2015 - 2018Accrual Statement of Operations by Category
($ in millions)
V-99

CASH RECEIPTS AND EXPENDITURES
2014 20152013 Mid-Year Preliminary
Actual Forecast Budget 2016 2017 2018
ReceiptsFarebox Revenue $627.680 $655.338 $674.233 $689.156 $704.473 $714.880Toll Revenue 0.000 0.000 0.000 0.000 0.000 0.000Other Operating Revenue 76.869 79.155 69.612 69.873 72.259 71.690 MNR - MTA 76.808 118.516 128.491 133.900 136.066 137.075 MNR - CDOT 59.747 78.135 108.074 85.333 55.674 55.703 MNR - Other 24.616 18.635 19.822 18.611 19.966 19.336Capital and Other Reimbursements 161.171 215.286 256.387 237.843 211.706 212.114
Total Receipts $865.720 $949.779 $1,000.232 $996.872 $988.438 $998.685
ExpendituresLabor:Payroll $443.133 $527.966 $497.936 $503.705 $515.371 $523.607Overtime 84.693 104.491 94.316 92.992 95.377 96.807Health and Welfare 104.543 121.784 119.455 125.222 131.095 137.875OPEB Current Payment 20.966 23.666 24.836 25.442 26.672 27.971Pensions 80.958 81.933 87.985 85.527 86.329 87.199Other Fringe Benefits 102.764 117.882 112.478 115.167 119.496 121.655GASB Account 0.000 0.000 0.000 0.000 0.000 0.207Reimbursable Overhead 0.000 0.000 0.000 0.000 0.000 0.000
Total Labor $837.057 $977.723 $937.008 $948.056 $974.341 $995.322
Non-Labor:Electric Power $75.677 $90.899 $86.329 $89.699 $101.865 $110.416Fuel 24.074 24.358 23.527 22.591 22.810 23.578Insurance 15.895 22.052 22.912 25.327 28.559 30.122Claims 1.423 0.146 1.146 1.146 1.146 1.146Paratransit Service Contracts 0.000 0.000 0.000 0.000 0.000 0.000Maintenance and Other Operating Contracts 123.780 139.280 126.594 127.606 134.288 141.276Professional Service Contracts 33.120 61.284 92.913 74.753 47.484 43.960Materials & Supplies 100.961 119.528 127.443 121.841 119.446 121.970Other Business Expenses 52.975 50.510 42.942 54.630 56.273 57.351Total Non-Labor $427.905 $508.057 $523.806 $517.592 $511.870 $529.819
Other Adjustments:Other $0.000 $0.000 $0.000 $0.000 $0.000 $0.000Cash Timing and Availability Adjustment 0.000 0.000 0.000 0.000 0.000 0.000Total Other Adjustments $0.000 $0.000 $0.000 $0.000 $0.000 $0.000
Total Expenditures $1,264.962 $1,485.780 $1,460.814 $1,465.648 $1,486.211 $1,525.140
Baseline Cash Deficit ($399.242) ($536.001) ($460.581) ($468.776) ($497.773) ($526.456)
SubsidiesMTA $333.789 $424.440 $366.666 $371.237 $397.727 $417.177CDOT 70.838 111.560 93.915 97.538 100.045 109.279Total Subsidies $404.627 $536.000 $460.581 $468.775 $497.772 $526.456
-- Differences are due to rounding.
MTA Metro-North RailroadJuly Financial Plan 2015 - 2018Cash Receipts & Expenditures
($ in millions)
V-100

CASH FLOW ADJUSTMENTS
2014 20152013 Mid-Year Preliminary
Actual Forecast Budget 2016 2017 2018
ReceiptsFarebox Revenue $8.868 $5.569 $5.746 $6.950 $7.762 $7.626Toll Revenue 0.000 0.000 0.000 0.000 0.000 0.000Other Operating Revenue 14.775 16.817 14.896 14.232 15.200 13.160 MNR - MTA (4.763) (1.849) (0.070) 2.273 1.330 (0.694) MNR - CDOT 1.636 2.550 1.455 1.457 0.848 (0.150) MNR - Other 12.928 (1.498) 1.470 (0.091) 0.906 (0.098)Capital and Other Reimbursements 9.801 (0.797) 2.855 3.639 3.084 (0.943)Total Receipts $33.444 $21.588 $23.496 $24.820 $26.046 $19.844
ExpendituresLabor:Payroll $5.505 $17.763 $2.428 ($1.612) $0.169 ($1.839)Overtime (0.130) 2.929 (0.095) (0.092) 0.376 (0.106)Health and Welfare (1.761) 8.937 4.234 4.686 4.065 4.951OPEB Current Payment 0.726 0.000 0.000 0.000 0.000 0.000Pensions 3.498 (11.390) 0.896 0.400 0.401 0.405Other Fringe Benefits 16.969 2.254 (0.671) (1.146) (0.652) (1.150)GASB Account 0.000 0.000 0.000 0.000 0.000 0.207Reimbursable Overhead (2.358) 1.764 3.481 3.547 3.612 3.679Total Labor $22.449 $22.257 $10.274 $5.783 $7.971 $6.147
Non-Labor:Electric Power ($1.046) $1.570 $1.659 $1.709 $1.760 $1.813Fuel 5.564 (3.600) (3.600) (3.600) (3.600) (3.600)Insurance 1.383 0.528 (0.513) (0.504) 0.365 (0.684)Claims 37.905 (1.854) 0.146 0.146 0.146 0.146Paratransit Service Contracts 0.000 0.000 0.000 0.000 0.000 0.000Maintenance and Other Operating Contracts (13.876) 17.750 1.844 (1.361) 1.600 7.366Professional Service Contracts (4.399) 9.563 10.715 10.591 7.411 3.298Materials & Supplies (24.254) 6.505 3.418 1.719 3.615 3.806Other Business Expenditures (19.795) 23.202 23.964 24.976 25.689 25.553Total Non-Labor ($18.518) $53.665 $37.632 $33.674 $36.985 $37.696
Other Adjustments:Other $0.000 $0.000 $0.000 $0.000 $0.000 $0.000Total Other Expenditure Adjustments $0.000 $0.000 $0.000 $0.000 $0.000 $0.000
Total Cash Conversion Adjustments before Depreciation and GASB Adjs. $37.375 ($54.334) ($24.410) ($14.637) ($18.910) ($24.000)
Depreciation Adjustment $230.045 $227.237 $227.237 $227.237 $229.237 $231.237OPEB Obligation 57.724 65.098 68.316 69.982 73.366 76.940Environmental Remediation 1.927 4.001 3.800 3.800 3.800 3.800
Baseline Total Cash Conversion Adjustments $327.071 $242.002 $274.943 $286.382 $287.493 $287.977
-- Differences are due to rounding.
MTA Metro-North RailroadJuly Financial Plan 2015 - 2018
Cash Conversion (Cash Flow Adjustments)($ in millions)
V-101

MTA METRO-NORTH RAILROAD2014 Mid-Year Forecast
Non-Reimbursable/Reimbursable Overtime ($ in millions)
NON-REIMBURSABLE OVERTIME Hours $ %
Scheduled Service 711,485 $29.884 35.9%
Unscheduled Service 0 0.000 0.0%
Programmatic/Routine Maintenance 544,134 25.358 30.5%
Unscheduled Maintenance 7,028 0.431 0.5%
Vacancy/Absentee Coverage 231,736 12.781 15.4%
Weather Emergencies 97,580 4.766 5.7%
Safety/Security/Law Enforcement 0 0.000 0.0%
Other* 20,531 9.951 12.0%
Subtotal 1,612,494 $83.171 100.0%
REIMBURSABLE OVERTIME 315,607 $18.390
TOTAL OVERTIME 1,928,101 $101.562
*Other includes RWA from 2010-2013
Total
V-102

MTA METRO-NORTH RAILROAD 2015 Preliminary Budget
July Financial Plan 2015 - 2018 Year-to-Year Changes by Category - Baseline
REVENUE FAREBOX REVENUE Non -Reimbursable
The 1.6% decrease in 2014 Farebox Revenue reflects the following impacts: 1.9% reduction in ridership reflecting lower than forecasted ridership and
the impact of multiple snow storms. A rescheduling of service improvement s from July to November which
includes increased service frequen cy on the upper Harlem and outer New Haven lines.
2015- 2018 reflects: 1.0% annual fare increase in the State of Connecticut, No NYS fare increases, Modest employment and economic growth resulting in ridership
increases projected at 2.2% in 2015, 1.7% in 2016, 1.8% in 2017 and 1.2% 2018.
Reimbursable Not applicable
Cash 2015-2018 cash adjustments include receipts from the sale of Metro Cards,
Westchester County bus fares and spec ial event promotions partially offset by credit card fees associated with the purchase of passenger tickets.
OTHER OPERATING REVENUE Non-Reimbursable
2015-2018 baseline revenue inc rease reflects continuing improvement in G CT retail revenues and higher advertising sales in 2015.
The $7.6 million decrease in 2015 reflec ts the elimination of 2014 extraordinary reimbursements for losses inc urred from Tropical Storms Sandy and Irene ($9.7 million).
Reimbursable Not applicable
Cash 2015-2018 adjustments include the normal reclassifications of Amtrak and
other railroad reimbursements, rev enue offsets for GCT revenue funded projects, reimbursements from CDOT, reimbursements for settlements, scrap material sales and ot her miscellaneous items. 2015-2018 cas h receipts are decreased ($11.2 million, $11.6 million, $11.9 mill ion and $12. 3 million,
V-103

respectively) by the Harlem/Hudson portion of advertising revenue that is being held at MTAHQ.
CAPITAL AND OTHER REIMBURSEMENTS Reimbursable
Capital project cost reimbursements in each year of the financial plan are based on recovering 100% of accrued project expenditures. 2014 accrued expenditures (and receipts ) total $216.1 million and are based
upon the latest projections of capital project activity. Higher reimbursements in 2014 are primarily attribut able to the following pr ojects: Cos Cob West Substation, Mainline Turnouts, Signal Systems replacement as well as t he MNR technology relocation, and several track program projects.
2015-2018 increases in accrued reimbursable receipts are higher based upon the latest projections of capital project activity and include the acceleration of Positive Train Control (PTC) in addition to the impact of inflationary growth.
Cash 2014-2018 includes adjustments for receipt timing differences. EXPENSES Projections include additional Payroll, Over time, Pension, Other Fringe Benefits, and Reimbursable Overhead expenses for those employees without contract agreements that are patterned after the recent TWU settlement. PAYROLL Non-Reimbursable Management Labor
Salaries for non-represented employees , who hav e not receiv ed a general salary increase during the last five y ears, are assumed to follow CPI-based increases. The 2014 Mid-Year Forecast baseline includes the compounding of raises for 2012 and 2013; however, as of t he July Plan, no rais es have been granted
Non-Agreement (NA) salaries inc lude provisions for cost of living increases in 2015 - 2018 of 1.85%, 1.89%, 1.85% and 1.80% respectively.
2014 decrease of $5.6 million is driven by vacancies. 2015 increase of $5.1 million is primarily due to the impact of fillin g vacant
positions and cost of living increases. Agreement Labor
Agreement salaries assume TWU settl ement patterned wage increases of 0.87%, 0.95%, 2.23%, 2.22% and 1.88% for the five years, July 16, 2010 through July 15, 2015, respectively. This reflects an effective rate increas e provision of 7.4% for 2010-2014 vs. the Adopted Budget increase of 2.9% over this period. As a result, the 2014 Mid- Year Forecast increase of $40.4 million compared to the 2014 Adopted Budget reflects the retroactive wage adjustment
V-104

associated with the TWU settlement wage assum ption ($42.4 million). This increase is partially offset by vacant positions.
2015–2018 wage inc reases are applied s tarting July 16, 2015 at 2.00% annually.
2015 includes the removal of the 2014 re tro-active wage adjustment described above, partially offset by the full year impact of 2014 hiring.
2016, 2017 and 201 8 cost increases of $7.6 millio n, $3.4 million and $7 .6 million, respectively, are driven primarily by the projected wage increases.
Reimbursable
Annual cost of living increases and w age contract increases for agreement employees follow the same rate assu mptions as the non-reimbursable costs noted above.
2014 costs are lower due to overall decr eases in Non-Agreement staffing requirements partially offset by increased T&E flagging protection.
Cash 2014-2018 cash adjustment s include timing differences, an Agreement
employee allowance (for uniforms, tools and shoes ), retirement and TW U settlement patterned wage pay ments, as well as employee c ontributions to healthcare coverage.
OVERTIME Non-Reimbursable
Overtime is inflated at the same rate as Agreement salaries which include the TWU settlement patterned wage growth 2010-2018.
The 2014 Mid-Year Forecast is $22.8 million higher t han Adopted Budget. Of this total, $8.7 million is the re sult of the TWU settlement patterned retroactive wage estimate 2010-2014. The remaining increa se ($14.1 million) is due to sch eduled train service coverage associated with new T&E employees in training ($3.7 million), winter storm cove rage ($2.5 million), vaca ncies ($1.8 million), the continuation of infrastructure impr ovements and improved track maintenance ($2.7 million), implementation of safety enhancements ($0.6 million), and FRA mandated equipment inspection and maintenance requirements ($1.8 million).
2015 decrease of $6.3 million is primarily due to the e limination of the 2014 one-time retro-active wage payment provision.
2016 decrease of $1 .7 million is a result of reduced Infrastructure Improvement Program costs, partially offset by the previously described wage growt h assumptions.
2017 and 2018 increases of $1 .7 million and $1.6 million, respectively, primarily reflect a continuation of prevailing wage growth assumptions.
Reimbursable Annual cost of living increases and wage contract increases for Agreement
employees follow the same rate assu mptions as the non-reimbursable costs noted above.
V-105

HEALTH AND WELFARE Non-Reimbursable and Reimbursable
2014 Mid-Year Forecast reflects pr emium increases of 1.89%. 2015-2018 include estimated annual rate increases of 4.94% in 2015, 2. 44% in 2016, 4.83% in 2017 and 4.87% in 2018.
Cash 2014-2018 cash adjustments include current and former management
employee contributions toward health insurance costs. OPEB CURRENT PAYMENT (GASB 45) Non-Reimbursable
Other Post Employment Benefit (OPEB) current payments reflect Metro-North’s estimated annual cost of health care for current retirees. The 2014 provision increases by $1.6 million du e to an increas ing level of retirees. The estimated annual costs are $24.8 million in 2015, $25 .4 million in 2016, $2 6.7 million in 2017 and $28.0 million in 2018 . The annual amounts reflect growth in annual health care premiums and a modest increase in the number of covered retirees.
PENSIONS Non-Reimbursable and Reimbursable
The 2014-2018 pension costs represent the inc lusion of all non–represented and most represented Metro-North employees in the MTA Defined Benefit Plan (DB Plan). Those employees not in t he DB Plan are participants in the MTA 401K Plan. Metro-North’s projected share of the increm ental funding requirements for the DB Plan is bas ed on draft projec tions prepared by actuarial consultants.
2014-2018 includes t he impact of the higher wage in crease assumptions for Agreement labor.
Cash 2014 cash requirements are decreased by $ 13.7 million to reflect an advance d
payment of 2014 costs in 2013. OTHER FRINGE BENEFITS Non-Reimbursable
Railroad Retirement tax rates for Tier I and II remain constant for 2015-2018 at 7.65% and 12.1%, respectively.
Maximum earnings level for Tier I is estimated at $116,400 in 2014, $119,700 in 2015, $123,900 in 2016 $128,100 in 2017 and $134,100 in 2018.
Maximum earnings level for Tier II is estimated at $86,400 in 2014, $88,800 in 2015, $92,100 in 2016 and $95,100 in 2017 and $99,600 in 2018.
2014-2018 includes t he impact of the higher wage in crease assumptions for Agreement labor and changes in staffing levels.
Non-reimbursable costs include estimate s for employee personal injury claims ($10.5 million annually for 2014-2016, $10.7 million in 2017 and $10.8 million in 2018).
V-106

Cash 2014-2018 adjustments include differenc es between expense accruals and
cash disbursements GASB ACCOUNT Cash
Reflects cash expenditures to fund a contribution to a s pecial GASB 45 (Government Accounting Standards Board) fund earmarked for Post-Retirement liabilities f or “Other than Pension Employee Benefits” (healthcare costs). 2014 cash deposit was prepaid in 2013. 2014-2018 cash contributions have been adjusted to reflect latest labor settlement funding assumptions.
REIMBURSABLE OVERHEAD Non-Reimbursable
Changes in overhead cost recoveries reflect revisions in Reimbursable project cost estimates.
Reimbursable Overhead costs for 2014 are based on a perc entage share of direct labor costs
charged to reimbursable projects. 2015-2018 overhead costs are based on the continuation of 2014 f orecast levels adjusted for inflationary increases in labor costs.
Material handling and equipment recovery increases are based on CPI-base d inflation rates.
ELECTRIC POWER Traction Power - Revenue Non-Reimbursable
2014 increases of $2.9 millio n are due to hi gher rates partially offset by lower consumption due to the resc heduling of service changes from July to November.
2015 incorporates a full year impact of November 2014 service increases. 2015-2018 includes adjustments for rate increases and the net cost change
associated with the integration of new M-8 cars into New Haven Line service. 2015-2018 costs reflect a decr ease of 6.1% in 2015, followed by annua l
increases of 3.7% in 2016, 12.4% in 2017 and 7.1% in 2018. Non-Traction Power – Non-Revenue Non-Reimbursable
2014 – $0.3 million increase reflects higher electric rates. 2015-2018 costs primarily reflect inflatio nary changes that include a decrease
of 13.1% in 2015, followed by annual increases of 1.1% in 2016, 18.6% in 2017 and 5.8% in 2018.
FUEL Revenue Vehicle Fuel Non-Reimbursable
V-107

2014 – $0.8 million increase is due to greater consumption partially offset by lower than budgeted diesel fuel rates.
2015-2016 prices are project ed to decrease by 3.6% in 2015 and 3.8% in 2016, followed by increases of 1.8% and 3.0% for 2017 and 2018, respectively.
Cash 2015-2018 include a credit (reduction to cash disbursements) for accrued fuel
costs at New Haven which are paid directly by CDOT. Non-Revenue Fuel Non-Reimbursable
2014 – $0.6 million increase reflects increased heating fuel consumption resulting from colder weather conditions.
2015-2018 prices are project ed to decrease by 3.4% in 2015, 3.6% in 2016 and 2017, respectively, and increase by 2.3% in 2018.
INSURANCE Non-Reimbursable and Reimbursable
Increases in 2015-2018 reflect revised insurance premium estimates. Cash
2015-2018 reflects increase in force acc ount payments as well as All-Agency insurance costs. 2015-2018 also incl udes the difference between exp ense accruals and cash payments.
CLAIMS Non-Reimbursable
2015-2018 reflect current claims trends fo r passenger injuries and miscellaneous claims.
Cash 2015-2018 reflects the timing of payments made for passenger inju ry and
miscellaneous claims. The Remaining Non-Reimbursable Cost Categories were inflated by CPI Increases in 2015-2018 of 1.65%, 1.74%, 1.57%, and 1.63% respectively. MAINTENANCE AND OTHER OPERATING CONTRACTS Non-Reimbursable
2014 is lower by $2.5 million du e to lower office space lease expenses, delays in locomotive overhaul progr ams and continued review of maintenance contracts generating operating efficiencies . These decreases are partially offset by higher NHL car disposal costs and Danbury Branch emergency bus services.
2015 increase reflects the beginning of a new cycle of locomotive overhauls ($2.2 million), customer enhancement projects in GCT ($0.5 million), power substation refurbishments ($0.5 million) and infla tionary increase of $1.8 million, partially offset by a decreas e for 2014 emergency bus service for the Danbury Branch ($1.4 million) and office space expenses ($0.5 million).
V-108

2016 includes increases for the next cycl e of locomotive overhaul programs ($4.4 million) and inflationary impacts ($1.6 million).
2017 reflects higher office sp ace expenses ($2.5 million) an d inflationary increases ($1.5 million).
2018 reflects inflationary increases ($1. 5 million) partially offset by the completion of power substation refurbishments ($0.5 million).
Reimbursable
In 2014, net expenditures increased by $ 4.7 million over the Adopted Budget reflecting revised project requirem ents for West of Hudson Signa l Improvements, Cos Cob West Substation, and West-Haven Station.
2015-2018 estimates predominately reflect the impact of Positive Train Contr ol (PTC) activity as well as a c ontinuation of 2014 project activity lev els adjusted for inflation.
Cash 2014-2018 cash adjustments include the elimination of non- cash GASB 49
environmental accruals and payment timing differences. 2014-2018 also includes reclassifications of revenue offsets for GCT revenue funded projects and payments on behalf of CDOT for station facilities and the MTA for utilities.
PROFESSIONAL SERVICES CONTRACTS Non-Reimbursable
2014 Mid-Year Forecast is $2 .2 million higher tha n the Ad opted Budget primarily due to the implementation of the new Financial Planning System.
2015 is lower by $1.7 million primar ily due to non-r ecurring implementation costs from 2014 for the new Financial Planning System.
2016 increase of $1.0 millio n primarily re flects the second year of a biann ual market share study.
2017 is lower due to the completion of the biannual market share study. 2018 increases reflect inflation.
Reimbursable
2014 expenditures remained fla t at $20.5 million re lative to the Ado pted Budget.
2015 increase of $32.2 million reflects t he costs associated with the installatio n of Positive Train Control (PTC) includ ing the accelerated timetable for this project.
2016-2018 expenses reflect inflationary growth assumptions as well as progressively diminishing costs for PTC.
MATERIAL AND SUPPLIES Non-Reimbursable
2014 increase of $3.2 million v s. the Ad opted Budget reflects Spuyten Duyvil derailment repairs ($1.2 millio n), the wr ite down of obsolete inventory ($2.1
V-109

million) and higher Infrastructure Im provement Program requirements ($1.6 million). These increases are partially offset by the rescheduling of the M- 7 seat change-out program ($0.5 mi llion) and New Ha ven Line derailment damaged car repairs ($1.3 million).
2015 is lower primarily due to the comp letion of several power reliability improvement projects ($1.2 million) partially offset by the start of the resched uled M-7 seat change-out program ($1.1 million).
2016 is lower primarily due to savings re lated to the reduction of the 2015 Infrastructure Improvement program ($3.0 million) par tially offset the contin uation of several power reliabilit y improvement projects, and an increas e related to the Equipment Replacement Plan ($1.8 million).
2017 reflects inflationary increases ($2.3 million) offset by savings related to the completion of New Haven Line derailm ent damaged car repairs and the Kr onos time clock replacement program ($2.3 million).
2018 is higher due to inflationa ry increases ($2.7 million) partially offset by the completion of the M-7 seat change-out program.
Reimbursable In 2014, the $1.2 million increase vs. the 2014 Adopted Budget is primarily due to
the Mainline/Yard Turnout project and severa l track programs, partially offse t by lower requirements for the Bronx Stations and East of Hudson Overhead bridge projects.
2015 increase of $11.4 million reflects the costs associated with the installation of Positive Train Control (PTC) including the accelerated timetable for this project.
2016-2018 levels assume a continuation of material requirements adjusted for the impact of inflation.
Cash Cash adjustments reflect differences between expense a ccruals and cash
requirements: 2015-2018 includes increased c ash requirements for M-8 spare part inve ntory
build-up ($2.3 million in 2015, $1.2 million in 2016, no c ash requirements in 2017, and $1.4 million in 2018).
2015-2018 includes adjustment for obsolete material reserve ($0.5 million for 2015-2018.
OTHER BUSINESS EXPENSES Non-Reimbursable
2014 Mid-Year Forecast is lower by $9.7 million vs. the Adopted Budget due to the transfer of the potential recovery for losses related to the Con Edison power outage on the New Haven Line from 2014 to 2015, partially offset by lower subsidy payments to NJT for West of Hudson operations due to improved ridership revenue and lower than expected inflation.
2015 decrease reflects the anticipated reim bursement for losses related to the Con Edison power outage on the New Hav en Line ($9.0 million), partially offset
V-110

by credit card fees for the Mobile Ticketing App ($0.2 million) and the Employee Diversity and Inclusion Program ($0.1 million).
2016 - 2018 inc ludes the impact of infl ationary growth for West of Hudson subsidy requirements.
Reimbursable
In 2014, the $1.4 million increas e from the Adopted Budget is primarily due to the costs associated with PBX Equipment Upgrade and t he New Haven Wheel True Shop.
2015-2018 levels are based upon a continuation of current requirements adjusted for the impact of inflation.
Cash 2015-2018 cash adj ustments include payments for receipt of Metro C ards,
Westchester County bus fares and s pecial promotions, partially offset by the reclassification of credit card fees as an offset to Farebox Revenue. 20 14-2018 also includes the reclassification of Am trak and other railroad reimbursements to the Other Operating Revenue category.
DEPRECIATION Non-Reimbursable
2015-2018 includes provisions for changes in Metro-North’s capital assets. OPEB OBLIGATION (GASB 45) Non-Reimbursable
2015-2018 costs reflect the liability for Post-Retirement Benefits (healthcar e costs) for future retirees based on an updated actuarial estimate.
ENVIRONMENTAL REMEDIATION (GASB 49) Non-Reimbursable
2015 – 2018 costs reflect the estimated liability for environmental remediation costs associated with capital projects.
V-111

NON-REIMBURSABLE
2014 2015Change
2015 - 2014 2016Change
2016 - 2015 2017Change
2017 - 2016 2018Change
2018 - 2017 RevenueFarebox Revenue $649.769 $668.487 $18.719 $682.207 $13.719 $696.711 $14.504 $707.254 $10.543Vehicle Toll Revenue 0.000 0.000 0.000 0.000 0.000 0.000 0.000 0.000 0.000Other Operating Revenue 62.338 54.717 (7.621) 55.641 0.924 57.059 1.418 58.531 1.472Capital and Other Reimbursements 0.000 0.000 0.000 0.000 0.000 0.000 0.000 0.000 0.000Total Revenue $712.107 $723.204 $11.097 $737.847 $14.644 $753.770 $15.922 $765.785 $12.015
ExpensesLabor:Payroll $466.296 $453.173 $13.123 $462.154 ($8.981) $471.194 ($9.040) $480.648 ($9.454)Overtime 83.171 76.904 6.267 75.228 1.676 76.788 (1.560) 78.383 (1.595)Health and Welfare 99.567 102.022 (2.455) 107.092 (5.070) 113.280 (6.188) 118.819 (5.540)OPEB Current Payment 23.666 24.836 (1.170) 25.442 (0.606) 26.672 (1.230) 27.971 (1.299)Pensions 84.232 79.462 4.769 77.747 1.715 78.809 (1.062) 79.904 (1.095)Other Fringe Benefits 105.491 102.993 2.498 105.826 (2.833) 109.374 (3.548) 111.799 (2.424)Reimbursable Overhead (43.080) (42.256) (0.824) (43.061) 0.805 (43.861) 0.800 (44.680) 0.819Total Labor Expenses $819.344 $797.135 $22.210 $810.428 ($13.293) $832.256 ($21.829) $852.844 ($20.588)
Non-Labor:Electric Power $89.330 $84.670 $4.660 $87.990 ($3.320) $100.105 ($12.115) $108.603 ($8.498)Fuel 27.958 27.127 0.831 26.191 0.936 26.410 (0.219) 27.178 (0.768)Insurance 17.928 19.738 (1.810) 22.075 (2.337) 24.367 (2.292) 26.907 (2.540)Claims 2.000 1.000 1.000 1.000 0.000 1.000 0.000 1.000 0.000Paratransit Service Contracts 0.000 0.000 0.000 0.000 0.000 0.000 0.000 0.000 0.000Maintenance and Other Operating Contracts 104.850 107.795 (2.945) 111.717 (3.922) 115.167 (3.450) 116.104 (0.936)Professional Service Contracts 31.178 29.498 1.680 30.474 (0.976) 30.294 0.180 30.724 (0.430)Materials & Supplies 75.966 75.557 0.409 74.616 0.941 74.642 (0.026) 75.311 (0.669)Other Business Expenses 25.221 16.856 8.365 27.495 (10.640) 28.391 (0.896) 29.569 (1.178)Total Non-Labor Expenses $374.429 $362.241 $12.189 $381.558 ($19.318) $400.376 ($18.818) $415.396 ($15.020)
Other Expenses Adjustments:Other $0.000 $0.000 $0.000 $0.000 $0.000 $0.000 $0.000 $0.000 $0.000Total Other Expense Adjustments $0.000 $0.000 $0.000 $0.000 $0.000 $0.000 $0.000 $0.000 $0.000
Total Expenses before Depreciation and GASB Adjs. $1,193.774 $1,159.376 $34.398 $1,191.986 ($32.611) $1,232.632 ($40.646) $1,268.241 ($35.608)
Depreciation $227.237 $227.237 $0.000 $227.237 $0.000 $229.237 ($2.000) $231.237 ($2.000)OPEB Obligation 65.098 68.316 (3.218) 69.982 (1.666) 73.366 (3.383) 76.940 (3.574)Environmental Remediation 4.001 3.800 0.201 3.800 0.000 3.800 0.000 3.800 0.000
Total Expenses $1,490.110 $1,458.729 $31.381 $1,493.006 ($34.277) $1,539.035 ($46.030) $1,580.218 ($41.182)
Baseline Net Surplus/(Deficit) ($778.003) ($735.525) $42.479 ($755.158) ($19.633) ($785.265) ($30.107) ($814.433) ($29.167)
-- Differences are due to rounding.
MTA METRO-NORTH RAILROADJuly Financial Plan 2015 - 2018
Year-to-Year Changes by Category - Accrual Basis($ in millions)
Favorable/(Unfavorable)
V-112

REIMBURSABLE
2014 2015Change
2015 - 2014 2016Change
2016 - 2015 2017Change
2017 - 2016 2018Change
2018 - 2017 RevenueFarebox Revenue $0.000 $0.000 $0.000 $0.000 $0.000 $0.000 $0.000 $0.000 $0.000Vehicle Toll Revenue 0.000 0.000 0.000 0.000 0.000 0.000 0.000 0.000 0.000Other Operating Revenue 0.000 0.000 0.000 0.000 0.000 0.000 0.000 0.000 0.000Capital and Other Reimbursements 216.084 253.532 37.448 234.205 (19.327) 208.622 (25.583) 213.057 4.434Total Revenue $216.084 $253.532 $37.448 $234.205 ($19.327) $208.622 ($25.583) $213.057 $4.434
ExpensesLabor:Payroll $43.907 $42.335 $1.572 $43.164 ($0.828) $44.008 ($0.844) $44.799 ($0.791)Overtime 18.390 17.507 0.883 17.857 (0.350) 18.213 (0.357) 18.530 (0.317)Health and Welfare 13.280 13.199 0.081 13.444 (0.246) 13.750 (0.306) 14.105 (0.355)OPEB Current Payment 0.000 0.000 0.000 0.000 0.000 0.000 0.000 0.000 0.000Pensions 9.091 7.627 1.465 7.380 0.247 7.119 0.261 6.890 0.230Other Fringe Benefits 10.137 10.156 (0.019) 10.487 (0.331) 10.773 (0.286) 11.006 (0.233)Reimbursable Overhead 41.316 38.775 2.541 39.514 (0.739) 40.249 (0.735) 41.001 (0.752)Total Labor Expenses $136.122 $129.599 $6.523 $131.845 ($2.247) $134.113 ($2.267) $136.330 ($2.217)
Non-Labor:Electric Power $0.000 $0.000 $0.000 $0.000 $0.000 $0.000 $0.000 $0.000 $0.000Fuel 0.000 0.000 0.000 0.000 0.000 0.000 0.000 0.000 0.000Insurance 3.595 3.687 (0.093) 3.756 (0.069) 3.827 (0.071) 3.900 (0.072)Claims 0.000 0.000 0.000 0.000 0.000 0.000 0.000 0.000 0.000Paratransit Service Contracts 0.000 0.000 0.000 0.000 0.000 0.000 0.000 0.000 0.000Maintenance and Other Operating Contracts 16.680 16.955 (0.275) 17.250 (0.295) 17.521 (0.271) 17.807 (0.286)Professional Service Contracts 20.543 52.700 (32.157) 33.688 19.012 9.779 23.909 9.938 (0.159)Materials & Supplies 37.057 48.468 (11.412) 45.506 2.962 41.189 4.317 42.853 (1.664)Other Business Expenses 2.088 2.122 (0.034) 2.159 (0.037) 2.193 (0.034) 2.229 (0.036)Total Non-Labor Expenses $79.962 $123.933 ($43.971) $102.359 $21.574 $74.509 $27.850 $76.726 ($2.217)
Other Expenses Adjustments:Other $0.000 $0.000 $0.000 $0.000 $0.000 $0.000 $0.000 $0.000 $0.000Total Other Expense Adjustments $0.000 $0.000 $0.000 $0.000 $0.000 $0.000 $0.000 $0.000 $0.000
Total Expenses before Depreciation $216.084 $253.532 ($37.448) $234.205 $19.327 $208.622 $25.583 $213.057 ($4.434)
Depreciation $0.000 $0.000 $0.000 $0.000 $0.000 $0.000 $0.000 $0.000 $0.000
Total Expenses $216.084 $253.532 ($37.448) $234.205 $19.327 $208.622 $25.583 $213.057 ($4.434)
Baseline Net Surplus/(Deficit) $0.000 $0.000 $0.000 $0.000 $0.000 $0.000 $0.000 $0.000 $0.000
-- Differences are due to rounding.
Favorable/(Unfavorable)
MTA METRO-NORTH RAILROADJuly Financial Plan 2015 - 2018
Year-to-Year Changes by Category - Accrual Basis($ in millions)
V-113

NON-REIMBURSABLE and REIMBURSABLE
2014 2015Change
2015 - 2014 2016Change
2016 - 2015 2017Change
2017 - 2016 2018Change
2018 - 2017 RevenueFarebox Revenue $649.769 $668.487 $18.719 $682.207 $13.719 $696.711 $14.504 $707.254 $10.543Vehicle Toll Revenue 0.000 0.000 0.000 0.000 0.000 0.000 0.000 0.000 0.000Other Operating Revenue 62.338 54.717 (7.621) 55.641 0.924 57.059 1.418 58.531 1.472Capital and Other Reimbursements 216.084 253.532 37.448 234.205 (19.327) 208.622 (25.583) 213.057 4.434Total Revenue $928.191 $976.736 $48.545 $972.052 ($4.683) $962.392 ($9.660) $978.841 $16.449
ExpensesLabor:Payroll $510.203 $495.508 $14.695 $505.318 ($9.809) $515.202 ($9.885) $525.447 ($10.244)Overtime 101.562 94.411 7.151 93.084 1.327 95.001 (1.917) 96.913 (1.912)Health and Welfare 112.847 115.221 (2.374) 120.536 (5.315) 127.030 (6.493) 132.924 (5.895)OPEB Current Payment 23.666 24.836 (1.170) 25.442 (0.606) 26.672 (1.230) 27.971 (1.299)Pensions 93.323 87.089 6.234 85.127 1.962 85.928 (0.801) 86.794 (0.865)Other Fringe Benefits 115.628 113.149 2.479 116.313 (3.164) 120.148 (3.834) 122.805 (2.657)Reimbursable Overhead (1.764) (3.481) 1.718 (3.547) 0.066 (3.612) 0.065 (3.679) 0.067Total Labor Expenses $955.466 $926.734 $28.732 $942.273 ($15.540) $966.369 ($24.096) $989.175 ($22.805)
Non-Labor:Electric Power $89.330 $84.670 $4.660 $87.990 ($3.320) $100.105 ($12.115) $108.603 ($8.498)Fuel 27.958 27.127 0.831 26.191 0.936 26.410 (0.219) 27.178 (0.768)Insurance 21.523 23.425 (1.902) 25.831 (2.406) 28.194 (2.363) 30.807 (2.612)Claims 2.000 1.000 1.000 1.000 0.000 1.000 0.000 1.000 0.000Paratransit Service Contracts 0.000 0.000 0.000 0.000 0.000 0.000 0.000 0.000 0.000Maintenance and Other Operating Contracts 121.529 124.750 (3.221) 128.967 (4.217) 132.688 (3.721) 133.910 (1.222)Professional Service Contracts 51.722 82.198 (30.476) 64.162 18.036 40.073 24.089 40.662 (0.590)Materials & Supplies 113.022 124.025 (11.003) 120.122 3.903 115.831 4.291 118.164 (2.333)Other Business Expenses 27.308 18.978 8.330 29.654 (10.676) 30.584 (0.930) 31.798 (1.214)Total Non-Labor Expenses $454.392 $486.174 ($31.782) $483.917 $2.256 $474.885 $9.032 $492.123 ($17.237)
Other Expenses Adjustments:Other $0.000 $0.000 $0.000 $0.000 $0.000 $0.000 $0.000 $0.000 $0.000Total Other Expense Adjustments $0.000 $0.000 $0.000 $0.000 $0.000 $0.000 $0.000 $0.000 $0.000
Total Expenses before Depreciation $1,409.858 $1,412.907 ($3.050) $1,426.191 ($13.283) $1,441.255 ($15.064) $1,481.297 ($40.043)
Depreciation $227.237 $227.237 $0.000 $227.237 $0.000 $229.237 ($2.000) $231.237 ($2.000)OPEB Obligation 65.098 68.316 (3.218) 69.982 (1.666) 73.366 (3.383) 76.940 (3.574)Environmental Remediation 4.001 3.800 0.201 3.800 0.000 3.800 25.583 3.800 0.000
Total Expenses $1,706.194 $1,712.260 ($6.066) $1,727.210 ($14.950) $1,747.657 ($46.030) $1,793.274 ($45.617)
Baseline Net Surplus/(Deficit) ($778.003) ($735.525) ($42.479) ($755.158) ($19.633) ($785.265) ($30.107) ($814.433) ($29.167)
-- Differences are due to rounding.
($ in millions)
MTA METRO-NORTH RAILROADJuly Financial Plan 2015 - 2018
Year-to-Year Changes by Category - Accrual Basis
Favorable/(Unfavorable)
V-114

Cash Receipts & Expenditures
2014 2015Change
2015 - 2014 2016Change
2016 - 2015 2017Change
2017 - 2016 2018Change
2018 - 2017
ReceiptsFarebox Revenue $655.338 $674.233 $18.896 $689.156 $14.923 $704.473 $15.317 $714.880 $10.407Vehicle Toll Revenue 0.000 0.000 0.000 0.000 0.000 0.000 0.000 0.000 0.000Other Operating Revenue 79.155 69.612 (9.543) 69.873 0.261 72.259 2.386 71.690 (0.569)Capital and Other Reimbursements 215.286 256.387 41.100 237.843 (18.543) 211.706 (26.137) 212.114 0.408Total Receipts $949.779 $1,000.232 $50.453 $996.872 ($3.360) $988.438 ($8.434) $998.685 $10.246
ExpendituresLabor:Payroll $527.966 $497.936 $30.030 $503.705 ($5.769) $515.371 ($11.666) $523.607 ($8.236)Overtime 104.491 94.316 10.174 92.992 1.324 95.377 (2.385) 96.807 (1.430)Health and Welfare 121.784 119.455 2.329 125.222 (5.767) 131.095 (5.873) 137.875 (6.781)OPEB Current Payment 23.666 24.836 (1.170) 25.442 (0.606) 26.672 (1.230) 27.971 (1.299)Pensions 81.933 87.985 (6.052) 85.527 2.458 86.329 (0.802) 87.199 (0.870)Other Fringe Benefits 117.882 112.478 5.404 115.167 (2.689) 119.496 (4.328) 121.655 (2.159)GASB Account 0.000 0.000 0.000 0.000 0.000 0.000 0.000 0.207 (0.207)Reimbursable Overhead 0.000 0.000 0.000 0.000 0.000 0.000 0.000 0.000 0.000Total Labor Expenditures $977.723 $937.008 $40.716 $948.056 ($11.049) $974.341 ($26.284) $995.322 ($20.981)
Non-Labor:Electric Power $90.899 $86.329 $4.570 $89.699 ($3.370) $101.865 ($12.166) $110.416 ($8.551)Fuel 24.358 23.527 0.831 22.591 0.936 22.810 (0.219) 23.578 (0.768)Insurance 22.052 22.912 (0.861) 25.327 (2.415) 28.559 (3.233) 30.122 (1.563)Claims 0.146 1.146 (1.000) 1.146 0.000 1.146 0.000 1.146 0.000Paratransit Service Contracts 0.000 0.000 0.000 0.000 0.000 0.000 0.000 0.000 0.000Maintenance and Other Operating Contracts 139.280 126.594 12.686 127.606 (1.012) 134.288 (6.682) 141.276 (6.988)Professional Service Contracts 61.284 92.913 (31.629) 74.753 18.160 47.484 27.270 43.960 3.524Materials & Supplies 119.528 127.443 (7.915) 121.841 5.602 119.446 2.395 121.970 (2.524)Other Business Expenses 50.510 42.942 7.569 54.630 (11.688) 56.273 (1.643) 57.351 (1.078)Total Non-Labor Expenditures $508.057 $523.806 ($15.749) $517.592 $6.214 $511.870 $5.721 $529.819 ($17.948)
Other Expenditure Adjustments: $0.000 $0.000 $0.000 $0.000 $0.000 $0.000 $0.000 $0.000 $0.000Other 0.000 0.000 0.000 0.000 0.000 0.000 0.000 0.000 0.000
Total Other Expenditure Adjustments $0.000 $0.000 $0.000 $0.000 $0.000 $0.000 $0.000 $0.000 $0.000
Total Expenditures $1,485.780 $1,460.814 $24.966 $1,465.648 ($4.835) $1,486.211 ($20.563) $1,525.140 ($38.929)
Baseline Net Cash Deficit ($536.001) ($460.581) $75.420 ($468.776) ($8.194) ($497.773) ($28.997) ($526.456) ($28.683)
SubsidiesMTA $424.440 $366.666 ($57.774) $371.237 $4.571 $397.727 $26.490 $417.177 $19.450CDOT 111.560 93.915 (17.645) 97.538 3.623 100.045 2.507 109.279 9.234Total Subsidies $536.000 $460.581 ($75.419) $468.775 $8.194 $497.772 $28.997 $526.456 $28.684
-- Differences are due to rounding.
Favorable/(Unfavorable)
($ in millions)
MTA METRO-NORTH RAILROADJuly Financial Plan 2015 - 2018
Year-to-Year Changes by Category - Cash Basis
V-115

MTA METRO-NORTH RAILROAD 2015 Preliminary Budget
July Financial Plan 2015 - 2018 Summary of Plan-to-Plan Changes by Generic Category
REVENUE FAREBOX REVENUE Non-Reimbursable
2014 – 2017 reflects lower ridership growth and results in lower revenue of $10.3 million in 2014, $5.5 million in 2015, $3.2 million in 2016, and improving in 2017 with a $0.4 million increase.
OTHER OPERATING REVENUE Non-Reimbursable
2014 increase from the Adopted Budget primarily reflects a deferred 2013 Tropical Storm Irene reimbursement of $6.2 million.
2015 - 2017 reflects continuing improvem ent in GCT retail an d advertising revenues.
CAPITAL AND OTHER REIMBURSEMENTS Reimbursable
Higher reimbursements in 2014 are prim arily attributable to several track replacement and s ignals improvement pr ojects as well as technology expenditures associated with Metro North’ s office relocation. These increases were partially offset by reduced labor requirements.
2015-2017 reimbursable project costs (and receipts) reflect the impact of the Positive Train Control (P TC) project as well as a continuation of baseline project levels from 2014.
Cash 2014 adjustments primarily reflect incr eases vs. the Adopt ed Budget ($1.2
million) for the receipt of a tenant contract ual obligation partially offset by lower scrap material sales.
2015–2017 adjustments primarily reflect decreases vs. the February Financia l Plan ($1.3 million, $2.1 million and $0.4 million, r espectively) due to t he anticipated reduction of scrap material sales.
EXPENSES PAYROLL Reflecting the recent labor settlement with the Transport Workers Union (T WU), MTA’s largest union, the July Financ ial Plan a ssumes the same pattern settl ement for employees represented by uni ons without contract agree ments. This assumption projects costs that are in ex cess of the February Financial Plan provision, and a portion
V-116

of this add itional cost will be fu nded by th e suspension of contributions to the GASB Account. Management Labor
Non-Agreement (NA) salaries inc lude provisions for cost of living increases in 2015 - 2017 of 1.85%, 1.89%, and 1.85%, respectively.
2014-2015 salary expense is lower by approximately $5.6 million an d $1.7 million, respectively, as a result of vacant positions.
2016 - 2017 salary expense is lo wer by approximately $2.0 million annually as a result of continuing vac ant positions as well as attrition associated with the succession planning efforts.
Agreement Labor 2014 Mid-Year Forecast increase of $40.4 million compared to the 201 4
Adopted Budget primarily reflects the TWU settlement patterned wage growth assumptions including the related retroactive adjustment for 2010-2013, partially offset by vacant positions.
2015 – 2017 are up by $15. 0 million, $18.9 million, and $15.3 million, respectively, and primarily due to the revised wage settlement estimate.
Reimbursable 2014 labor expenses are lower overall by $0.8 million to $43.9 million, reflecting
the TWU settlement patterned wage growth assumptions offset by vacant positions and changes to project requirements.
2015-2017 reimbursable project costs reflect a continuat ion of baseline project levels from 2014.
OVERTIME Non-Reimbursable
The 2014 Mid-Year Forecast is $22.8 million higher t han Adopted Budget. Of this total, $8.7 million is the result of the TWU settlement patterned wage gr owth assumptions including the related re troactive adjustment for 2010-2014. The remaining increase ($14.1 million) is due to scheduled train s ervice coverage associated with new T&E em ployees in training ( $3.7 million), winter storm coverage ($2.5 million), vacancies ($1.8 million), the cont inuation of infrastructure improvements and improved track maintenance ($2.7 million), implementation of safety enhancements ($0.6 million), and FRA mandated equipment inspection and maintenance requirements ($1.8 million).
V-117

2015–2017 increases of $18.0 million, $19.1 million, and $19.6 million, respectively are primarily due to t he revised MTA wage settlement estimate (over $3.0 million annually), and continuation of 2014 base line increases associated with: programmatic and routine maintenan ce, scheduled train s ervice coverage, and weather emergencies.
Reimbursable 2014 – 2017 increases are primarily due to the TWU settlement patterned wage growth assumptions for represented employees without contracts.
HEALTH AND WELFARE Non-Reimbursable and Reimbursable
2014 Mid-Year Forecast changes primarily reflect lower premium growth rates compared to 2014 Adopted Budget.
2015 -2017 reflects favorable changes in premiums. OPEB CURRENT PAYMENT (GASB 45) Non-Reimbursable
2014-2017 cash contributions have been adjusted to reflect latest funding assumption criteria for retirees and premiums.
PENSIONS Non-Reimbursable and Reimbursable
The 2014-2017 change in pension co sts represents updated actuarial estimates for the Defined Benefit Plan and the impac t of the revised wage settlement estimate.
Cash 2014 cash requirements are decreased by $13.7 million to reflect advance
payment of 2014 costs in 2013. OTHER FRINGE BENEFITS Non-Reimbursable and Reimbursable
2015–2017 reflect changes in Railroad Retirement taxes, adjustments t o employee claims and the revised wage settlement estimate.
REIMBURSABLE OVERHEAD Non-Reimbursable and Reimbursable
2014 decreased slightly by les s than $0.1 million due to lowe r requirements for straight-time labor costs which in turn directly impact reimbursable overhead.
2015-2017 levels are based upon ongoing project activity le vels adjusted for the impact of inflation.
ELECTRIC POWER Traction Power - Revenue Non-Reimbursable
V-118

2014 increases of $2.9 millio n are due to hi gher rates partially offset by lower consumption due to the resc heduling of service changes from July to November.
2015–2017 incorporates the impact of revised inflation factors and service plan changes.
Non-Traction Power – Non-Revenue Non-Reimbursable
2014 increase of $0.3 million reflects higher electric rates. 2015–2017 incorporates the impact of revised inflation rates.
FUEL Revenue Vehicle Fuel Non-Reimbursable
2014 increase of $0.8 million is due to higher consumption par tially offset by lower than budgeted diesel fuel rates.
2015-2017 incorporates the impact of revised inflation assumptions. Cash
2014-2017 include a credit (reduction to cash disbursements) for accrued fuel costs at New Haven which are paid directly by CDOT.
Non-Revenue Fuel Non-Reimbursable
2014 increase of $0.6 million vs. the Adopted Budget reflects increased heating fuel consumption resulting from colder weather conditions.
2015-2017 incorporates the impact of revised inflation assumptions. INSURANCE Non-Reimbursable and Reimbursable
2014-2017 incorporates the impact of revised premiums. Cash
2014-2017 includes an adjustment for the difference between expense accruals and cash payments.
CLAIMS Non-Reimbursable
2014 – 2017 reflect current passenger claim trends. MAINTENANCE AND OTHER OPERATING CONTRACTS Non-Reimbursable
2014-2015 decreases of $2.5 m illion in each year, reflect revised office sp ace lease expenses, rescheduling of locomo tive overhaul programs and continued review of maintenance contracts gene rating operating efficiencies. Thes e decreases are partially offset by higher NHL car dis posal costs due to timing, customer enhancements in GCT, power s ubstation refurbishments, and a one-time increase in 2014 for Danbury Branch emergency bus services.
V-119

2016-2017 increases reflect the continuati on of the I nfrastructure Improvement Program, NHL c ar disposal c osts, customer enhancement projects in GCT and power substation refurbishments, partially offset by revised office space leas e expenses and rescheduling of locomotive overhaul programs.
Reimbursable 2014 increase of $4. 7 million over the Ad opted Budget reflects revised project
requirements for West of Hudson Si gnal Improvements, Cos Cob West Substation, and West-Haven Station projects.
2015-2017 levels are based upon ongoing project activity le vels adjusted for the impact of inflation and the impact of acce lerating the Positive Train Control (PTC) project.
Cash 2014-2017 cash adj ustments include tim ing differences and reallocations to
accrued expenses. PROFESSIONAL SERVICES CONTRACTS Non-Reimbursable
2014 primarily reflects costs associated wi th the implementation of the Financial Planning System ($2.2 million).
2015-2017 increases reflect costs associated with the Infrastructure Improvement Program ($1.0 million) and maintenance costs ass ociated with the Financial Planning System ($0.3 million).
Reimbursable In 2014, expenditures remain essentially flat. 2015-2017 levels are based upon ongoing project activity le vels adjusted for the
impact of inflation plus the impact of the Positive Train Control (PTC) project. MATERIAL AND SUPPLIES Non-Reimbursable
2014 increase of $3.2 million v s. the Ad opted Budget reflects Spuyten Duyvil derailment repairs ($1.2 millio n), the wr ite down of obsolete inventory ($2.1 million) and higher Infrastructure Im provement Program requirements ($1.6 million). These increases are partially offset by the r escheduling of the M- 7 seat change-out program and New Haven Line derailment damaged car repairs.
2015 primarily reflects costs due to the M-7 seat change-out program, New Haven Line Derailment repairs, security system in stallations and inflat ion ($5.4 million) partially offset by the removal of obsolete inventory write down ($2.1 million).
2016-2017 reflects changes in inflationary growth. Reimbursable
In 2014, the increase is primarily attributable to cyclical track programs as well as the West of Hudson track project.
2015-2017 reflects increased pr oject requirements due primarily to the Positive Train Control (PTC) project.
Cash
V-120

2014-2017 reflects cash adjustments fo r the difference between expens es accruals and cash payments.
OTHER BUSINESS EXPENSES Non-Reimbursable
2014 Mid-Year Forecast is lowe r by $9.7 million vs. the Adopte d Budget due to the transfer of the potential recovery for losses related to the Con Edison power outage on the New Haven Line from 2014 to 2015, partially offset by lower subsidy payments to NJT for West of Hudson operations due to improved ridership revenue and lower than expected inflation.
2015-2017 lower plan-to-plan costs reflects the recovery for losses related to the Con Edison power outage in 2015 and lo wer subsidy expense from NJT on the West of H udson line due to improved rider ship revenue partially offset by the Employee Diversity & Inclusion Program.
DEPRECIATION Non-Reimbursable
2014-2017 includes provisions for changes in Metro-North’s capital assets.
OPEB OBLIGATION (GASB 45) Non-Reimbursable
2014-2017 costs reflect the liability for Post-Retirement Benefits (healthcar e costs) for future retirees based on an updated actuarial estimate.
ENVIRONMENTAL REMEDIATION (GASB 49) Non-Reimbursable
2014–2017 costs reflect the estimated liability for environmental remediation costs associated with capital projects.
V-121

NON-REIMBURSABLE
2014 2015 2016 2017
($460.175) ($461.209) ($465.601) ($490.500)
Baseline Changes
RevenueFarebox Revenue ($10.344) ($5.466) ($3.247) $0.430Vehicle Toll Revenue 0.000 0.000 0.000 0.000Other Operating Revenue 5.949 0.544 0.868 0.586Capital and Other Reimbursement 0.000 0.000 0.000 0.000
Total Revenue Changes ($4.395) ($4.922) ($2.378) $1.017
ExpensesLabor:Payroll ($34.775) ($12.042) ($15.567) ($15.829)Overtime (22.795) (17.955) (19.142) (19.642)Health and Welfare 7.181 10.351 9.417 10.038OPEB Current Payment (1.617) (1.959) (1.273) (1.136)Pensions (8.271) (2.435) (0.875) (1.034)Other Fringe Benefits (3.184) 3.616 2.465 1.677Reimbursable Overhead 2.566 2.267 2.323 2.366
Total Labor Expense Changes ($60.894) ($18.157) ($22.651) ($23.561)
Non-Labor:Electric Power ($3.163) $7.409 $10.021 $3.810Fuel (1.351) (1.371) (0.273) 0.250Insurance 0.384 1.386 2.142 3.468Claims (1.465) (0.465) (0.465) (0.465)Paratransit Service Contracts 0.000 0.000 0.000 0.000Maintenance and Other Operating Contracts 2.504 2.488 (3.644) (6.083)Professional Service Contracts (2.238) (1.479) (1.274) (1.331)Materials & Supplies (3.248) (3.345) (0.681) (0.529)Other Business Expenses (9.672) 10.347 1.838 2.574
Total Non-Labor Expense Changes ($18.249) $14.970 $7.665 $1.695
Total Expenses before Depreciation and GASB Adjustments ($79.143) ($3.187) ($14.986) ($21.866)
Depreciation $0.000 ($1.750) $0.250 $0.250OPEB Obligation 0.000 (0.774) 1.374 2.027Environmental Remediation (0.201) 0.000 0.000 0.000
Total Expense Changes ($79.344) ($5.711) ($13.362) ($19.589)
Cash Conversion Adjustment ChangesDepreciation ($0.000) $1.750 ($0.250) ($0.250)Operating/Capital 8.818 (2.961) (9.019) (2.452)Other Cash Adjustments (0.903) 12.473 21.835 14.002
Total Cash Conversion Adjustments $7.914 $11.262 $12.565 $11.300
($75.825) $0.629 ($3.175) ($7.273)
($536.000) ($460.580) ($468.777) ($497.773)
MTA METRO-NORTH RAILROADJuly Financial Plan 2015 - 2018
Changes Between Financial Plans by Generic Categories($ in millions)
2014 February Financial Plan - Cash Surplus/(Deficit)
Total Baseline Changes
2014 July Financial Plan - Cash Surplus/(Deficit)
-- Differences are due to rounding.
V-122

REIMBURSABLE
2014 2015 2016 2017
$0.000 $0.000 $0.000 $0.000
Baseline Changes
RevenueFarebox Revenue $0.000 $0.000 $0.000 $0.000Vehicle Toll Revenue 0.000 0.000 0.000 0.000Other Operating Revenue 0.000 0.000 0.000 0.000Capital and Other Reimbursement 9.510 38.902 11.522 (24.241)
Total Revenue Changes $9.510 $38.902 $11.522 ($24.241)
ExpensesLabor:Payroll $0.801 $3.234 $3.256 $3.284Overtime (2.528) (1.337) (1.383) (1.431)Health and Welfare 1.745 2.245 2.704 3.011OPEB Current Payment 0.000 0.000 0.000 0.000Pensions (0.188) 0.772 0.855 0.917Other Fringe Benefits 0.233 1.031 1.015 1.041Reimbursable Overhead (2.480) 0.805 0.806 0.820
Total Labor Expense Changes ($2.417) $6.749 $7.253 $7.642
Non-Labor:Electric Power $0.000 $0.000 $0.000 $0.000Fuel $0.000 $0.000 $0.000 $0.000Insurance 0.223 0.242 0.247 0.251Claims 0.000 0.000 0.000 0.000Paratransit Service Contracts 0.000 0.000 0.000 0.000Maintenance and Other Operating Contracts (4.670) 3.609 9.771 14.117Professional Service Contracts 0.016 (23.638) (4.729) 21.014Materials & Supplies (1.213) (24.391) (22.566) (17.260)Other Business Expenses (1.449) (1.473) (1.498) (1.522)
Total Non-Labor Expense Changes ($7.093) ($45.652) ($18.775) $16.599
Total Expense Changes ($9.510) ($38.902) ($11.522) $24.241
Cash Conversion Adjustment ChangesDepreciation $0.000 $0.000 $0.000 $0.000Operating/Capital 0.000 0.000 0.000 0.000Other Cash Adjustments 0.000 0.000 0.000 0.000
Total Cash Conversion Adjustments $0.000 $0.000 $0.000 $0.000
$0.000 $0.000 $0.000 $0.000
$0.000 $0.000 $0.000 $0.000
($ in millions)
-- Differences are due to rounding.
2014 February Financial Plan - Cash Surplus/(Deficit)
Total Baseline Changes
2014 July Financial Plan - Cash Surplus/(Deficit)
Changes Between Financial Plans by Generic Categories
MTA METRO-NORTH RAILROADJuly Financial Plan 2015 - 2018
V-123

NON-REIMBURSABLE and REIMBURSABLE
2014 2015 2016 2017
($460.175) ($461.209) ($465.601) ($490.500)
Baseline Changes
RevenueFarebox Revenue ($10.344) ($5.466) ($3.247) $0.430Vehicle Toll Revenue 0.000 0.000 0.000 0.000Other Operating Revenue 5.949 0.544 0.868 0.586Capital and Other Reimbursement 9.510 38.902 11.522 (24.241)
Total Revenue Changes $5.115 $33.980 $9.144 ($23.225)
ExpensesLabor:Payroll ($33.974) ($8.808) ($12.311) ($12.546)Overtime (25.323) (19.291) (20.524) (21.073)Health and Welfare 8.926 12.596 12.120 13.049OPEB Current Payment (1.617) (1.959) (1.273) (1.136)Pensions (8.458) (1.663) (0.019) (0.117)Other Fringe Benefits (2.951) 4.647 3.479 2.719Reimbursable Overhead 0.086 3.071 3.129 3.186
Total Labor Expense Changes ($63.311) ($11.407) ($15.398) ($15.919)
Non-Labor:Electric Power ($3.163) $7.409 $10.021 $3.810Fuel (1.351) (1.371) (0.273) 0.250Insurance 0.607 1.628 2.389 3.719Claims (1.465) (0.465) (0.465) (0.465)Paratransit Service Contracts 0.000 0.000 0.000 0.000Maintenance and Other Operating Contracts (2.166) 6.097 6.127 8.035Professional Service Contracts (2.222) (25.117) (6.002) 19.683Materials & Supplies (4.461) (27.736) (23.247) (17.789)Other Business Expenses (11.122) 8.874 0.340 1.052
Total Non-Labor Expense Changes ($25.342) ($30.682) ($11.110) $18.294
Total Expenses before Non-Cash Liability Adjs. ($88.653) ($42.089) ($26.508) $2.375
Depreciation $0.000 ($1.750) $0.250 $0.250OPEB Obligation 0.000 (0.774) 1.374 2.027Environmental Remediation (0.201) 0.000 0.000 0.000
Total Expense Changes ($88.854) ($44.613) ($24.884) $4.652
Baseline Net Surplus/(Deficit) Changes ($83.538) ($8.109) ($17.364) ($20.849)
Cash Conversion Adjustment ChangesDepreciation ($0.000) $1.750 ($0.250) ($0.250)Operating/Capital 8.818 (2.961) (9.019) (2.452)Other Cash Adjustments (0.903) 12.473 21.835 14.002
Total Cash Conversion Adjustments $7.914 $11.262 $12.565 $11.300
($75.825) $0.629 ($3.175) ($7.273)
($536.000) ($460.580) ($468.777) ($497.773)
Total Baseline Changes
2014 July Financial Plan - Cash Surplus/(Deficit)
-- Differences are due to rounding.
MTA METRO-NORTH RAILROAD
July Financial Plan 2015 - 2018Changes Between Financial Plans by Generic Categories
($ in millions)
2014 February Financial Plan - Cash Surplus/(Deficit)
V-124

MTA METRO-NORTH RAILROAD 2015 Preliminary Budget
July Financial Plan 2015 - 2018 Summary of Major Plan-to-Plan Changes
Revisions to Metro-North’s July F inancial Plan for years 2014-2018 reflects the effect of evolving economic c onditions, new needs , changes in timing of co st assumptions and resource allocations, as well as the impact of recently implemented cost reduction plans. Projections include additional Payroll, Over time, Pension, Other Fringe Benefits, and Reimbursable Overhead expenses for those employees without contract agreements that are patterned after the recent TWU settlement. 2014: JULY FINANCIAL PLAN vs. FEBRUARY FINANCIAL PLAN The 2014 Mid-Year Forecast cash subsid y requirement of $536.0 million for Non-Reimbursable operations is $75.8 million higher than the Adopted Budget. This reflects $4.4 million in lower total revenue in addition to a forecasted increase of $79.3 millio n in cash expenses. Operating rev enues of $ 712.1 million reflect passenger revenues of $649.8 million that ar e $10.3 mi llion unfavorable versus the Adopted Budg et resulting from lower than anticipated rider ship growth. Non-passenger revenues of $62.3 million are $5.9 million better than th e Adopted Budget mainly du e to reimbursements for damages incurred from Tropical Storms Ir ene and Sandy. Non-Reim bursable operating expenses of $1,490.1 million reflect an increase of $79.3 million, $63.7 million of which is attributable to the T WU settlement patte rned wage assum ptions for represented employees without contracts. The remaining increas e is due to higher ov ertime costs ($14.1 million) offset by savings from va cancies, lower fringe premiums and reduced office rent resulting from the relocation of offices to the Graybar Building. The increase in overtime is due to sc heduled train service coverage associated with new employees in training ($3.7 million), winter storm coverage ( $2.5 million), vacancies ($1.8 million), the continuation of infrastructure improv ements and improved track maintenance ($2.7 million), implementation of safety enhancements ($0.6 million ), and FRA mandated equipment inspection and maintenance ($1.8 million). The Reimbursable 2014 Mid-Year Forecast revenue and expense projections total $216.1 million which is $9.5 million higher than the 2014 Adopted Budget. This increas e is driven by the T WU settlement patte rned wage assum ptions for represented employees without contracts ($6.6 million) as well as the rescheduling of various projects resulting in lo wer labor costs, offset by increased non labor expenses - primarily Maintenance & Other Contract costs for seve ral key initiatives including Cos Cob West Substation and West of Hudson Signal Improvement projects.
V-125

2015 - 2017: JULY FINANCIAL PLAN vs. FEBRUARY FINANCIAL PLAN The 2015 - 2017 July Financial Plan subsidy requirements are lower by $0.6 million in 2015 and higher by $3.2 millio n in 2016 and $ 7.3 million in 2017, com pared to t he February Financial Plan. In general, this is primarily the result of lower Farebox revenue as a result of lower ridership, partly offset by higher advertising and GCT retail revenue. Increased expenses are largely due to the impact of the TWU settlement patterned wage growth assumptions ($23.0 million in 2015, $24.0 million in 2016 and $25.0 million in 2017), partly offset by the potential recovery for losses related to the Con Edison power outage on the New Haven Line in 2015 and the effect of lower inflationary factors applied to healthcare costs and electric rates. Reimbursable project costs (and receip ts) for 2015-2017 compared to the February Financial Plan are higher by $38. 9 million in 2015, $11.5 million in 2016 and lower b y $24.2 million in 2017, primarily driven by the TWU settlement patterned wag e growth assumptions ($2.3 million in 2015 and 2016, respectively, and $2.5 million in 2017) and the impact of the Positive Train Control (PTC) project.
V-126

NON-REIMBURSABLE and REIMBURSABLE
2014 2015 2016 2017
2014 February Financial Plan - Cash Surplus/(Deficit) ($460.175) ($461.209) ($465.601) ($490.500)
Non-Reimbursable Major Changes
RevenueIrene Recovery per MTA Guidance $6.270 $0.000 $0.000 $0.000Farebox Revenue - Reduced Ridership Growth (10.344) (5.466) (3.247) 0.430 Other Non-Passenger Revenue (Excludes BRP and Irene Recovery) (0.821) 0.044 0.368 0.086
BRP Revenue Items 0.500 0.500 0.500 0.500 Sub-Total Non-Reimbursable Revenue Changes ($4.395) ($4.922) ($2.378) $1.017
ExpensesUnion Labor Settlement - RWA 2010-13 ($33.404) $0.000 $0.000 $0.000Union Labor Settlement - Pension 2010-13 (5.712) 0.000 0.000 0.000Union Labor Settlement - Taxes 2010-13 (2.572) 0.000 0.000 0.000Union Labor Settlement - Adjustment 2014-2018 (17.661) (18.428) (19.215) (20.064)Union Labor Settlement - Pension 2014-2018 (3.020) (3.151) (3.286) (3.431)Union Labor Settlement - Taxes 2014-2018 (1.360) (1.419) (1.480) (1.545)Overtime - Revised Baseline (14.088) (14.711) (13.879) (13.590)Infrastructure Improvement Program - Increased Materials and Extend Progra (1.200) (1.200) (6.000) (6.000)Labor - Vacant Positions / Reimbursable Overhead 7.931 4.480 0.690 (0.190)Service Plan Changes 0.268 0.669 1.456 2.169Health and Welfare (Rates) 5.564 8.392 8.144 8.902Pension Adjustments (exclude RWA) 0.462 0.716 2.411 2.397Other Fringe Benefits - Employee Taxes (exclude RWA) 0.748 5.035 3.944 3.222Power (3.163) 7.409 10.021 3.810Insurance Premiums 0.384 1.386 2.142 3.468Occupancy Impact - Madison Avenue Relocation 3.396 3.016 3.111 0.507Maintenance and Other Operating Contracts (3.241) (5.353) (3.146) (3.298)Locomotive Overhauls Adjustment due to Capacity Constraints 0.000 5.500 0.000 0.000Car Disposals 0.900 (0.900) 0.000 0.000Bridgeport M8 Repairs 1.250 (2.500) (2.500) 0.000Financial Planning System Implementation (2.069) (0.334) (0.156) (0.155)Professional Services (0.169) (1.145) (1.118) (1.175)Con Edison Recovery Move Across Years (8.993) 8.993 0.000 0.000Other Net Expense Changes (7.537) (6.167) 1.498 1.385
BRP Expense Items 3.941 4.000 4.000 4.000 Sub-Total Non-Reimbursable Expense Changes ($79.344) ($5.711) ($13.362) ($19.589)
Total Non-Reimbursable Major Changes ($83.739) ($10.633) ($15.741) ($18.572)
Reimbursable Major Changes
RevenueProjections for 2014-2017 assume capital project activity levels similar to 2014 BUD adjusted for the winding down / completion / addition of projects, mainly addition of PTC; also reflects reimbursement of Union Labor Settlement RWA
9.510 38.902 11.522 (24.241)
Sub-Total Reimbursable Revenue Changes $9.510 $38.902 $11.522 ($24.241)
ExpensesProjections for 2014-2017 assume capital project activity levels similar to 2014 BUD adjusted for the winding down / completion / addition of projects, mainly addition of PTC; also includes Union Labor Settlement RWA
(9.510) (38.902) (11.522) 24.241
Sub-Total Reimbursable Expense Changes ($9.510) ($38.902) ($11.522) $24.241
Total Reimbursable Major Changes ($0.000) ($0.000) ($0.000) ($0.000)
Total Accrual Changes ($83.739) ($10.633) ($15.741) ($18.572)
Cash Adjustment Changes
Cash AdjustmentsOperating Capital Changes $8.818 ($2.961) ($9.019) ($2.452)OPEB Obligation 4.467 9.105 9.291 9.474RWA Accrued Not Paid 2013 (5.222) 0.000 0.000 0.000Other Net Cash Adjustments (0.149) 5.118 12.294 4.278
Total Cash Adjustment Changes $7.914 $11.262 $12.565 $11.300
Total Baseline Changes ($75.825) $0.629 ($3.175) ($7.273)
2014 July Financial Plan - Cash Surplus/(Deficit) ($536.000) ($460.580) ($468.777) ($497.773)
-- Differences are due to rounding.
MTA Metro-North RailroadJuly Financial Plan 2015 - 2018
Summary of Major Programmatic Changes Between Financial Plans($ in millions)
V-127

MTA METRO-NORTH RAILROAD 2015 Preliminary Budget
July Financial Plan 2015 - 2018 Ridership / (Utilization)
Ridership projections are dev eloped primarily by the application of the line s egment ridership forecasting models that incorporat e current trends (exc luding anomalies), the impact of economic and demog raphic factors, MTA suppl ied CPI, employment and population forecasts, the most current in formation for proposed parking, advertising, service expansion and connec ting services as well as government supported mass transit initiatives. In addition, internal pr ograms that affect serv ice, customer awareness and access to Metro-North are also incorporated into ridership forecasts.
Total East of Hudson ridership is projected at 82.7 million in 2014 whic h is 1.1% higher than 2013. Compared to the Adopted Budget, ridership is 1.9% lower due t o lower than projected growth in non-co mmutation and commutation rider ship resulting from the adverse effects of winter weather disruptions, as well as a continuation of slower growth trends experienced since the latter part of 2013. In 2015 through 2018, ridership is projected to grow 2.2%, 1.7%, 1.8%, and 1.2%, respectively, with growth occurring across all three commuter lines. Projections over this period assume no fare increase s in New York State and annual fare increases in Connec ticut of 1.0% in 2015 through 2018. Efforts to promote ridership growth continue with increases in programmed service expansion, increased parking and promotional advertising as well as a continuation of regional employment growth. West of Hudson utilization reflects 2014 customer levels that are 5.6% higher than 2013, reflecting a higher recovery from the Port Je rvis Line service outages that resulted from Tropical Storm Irene infrastructure damages. In 2015-2018, West of Hudson ridership is projected to grow 2.3%, 2.5% , 2.8% and 3.3%, respectively. Growth rates during this period reflect improvement in the economic clim ate, a resumption of customer growth in peak periods and service expansion for peak and off-peak and weekend periods on both the Port Jervis and Pascack Valley lines.
V-128

2014 20152013 Mid-Year Preliminary
Actual Forecast Budget 2016 2017 2018Ridership
Harlem Line 26.950 27.144 27.793 28.375 28.937 29.300Hudson Line 15.878 16.090 16.431 16.763 17.110 17.339New Haven Line 38.975 39.440 40.304 40.849 41.488 41.933
East of Hudson Total Ridership 81.802 82.673 84.529 85.987 87.535 88.572
West of Hudson 1.576 1.664 1.703 1.745 1.794 1.854
Total Ridership 83.379 84.338 86.231 87.732 89.329 90.426
Farebox Revenue Harlem Line $188.535 $193.020 $198.026 $202.372 $206.518 $209.163Hudson Line 136.024 139.397 142.577 145.582 148.716 150.771New Haven Line 294.890 316.930 327.453 333.811 341.022 346.844West of Hudson Mail & Ride 0.462 0.422 0.431 0.442 0.456 0.475
Baseline Total Farebox Revenue $619.910 $649.769 $668.487 $682.207 $696.711 $707.254
* Reflects East of Hudson Service
MTA Metro-North RailroadJuly Financial Plan 2015 - 2018
Ridership (Utilization) (in millions)
V-129

Administration Pos. 2014 Pos. 2015 Pos. 2016 Pos. 2017 Pos. 2018Non-Agreement Position Vacancies - $1.000 - $0.000 - $0.000 - $0.000 - $0.000Subtotal Administration - 1.000 - 0.000 - 0.000 - 0.000 - 0.000
Customer Convenience/AmenitiesNone - 0.000 - 0.000 - 0.000 - 0.000 - 0.000Subtotal Customer Convenience/Amenities - 0.000 - 0.000 - 0.000 - 0.000 - 0.000
MaintenanceTiming in Locomotive Overhaul Programs 1.441 0.000 0.000 0.000 0.000Changes to Genesis and BL20 Locomotive Overhaul Cycles 0.000 1.000 1.000 1.000 1.000Reduction in Provisions for Contracted Shop Equipment and Communication Equipment Maintenance
0.200 0.700 0.400 0.400 0.400
Lower Material Requirements for NHL New Car Fleet and Communications Equipment
0.300 0.800 0.800 0.800 0.800
Reduce Provision for M7 Car Seat Replacement Material0.000 0.500 0.500 0.500 0.500
Subtotal Maintenance - 1.941 - 3.000 - 2.700 - 2.700 - 2.700
Revenue EnhancementIncrease in GCT Retail and NWP Parking Spaces 0.500 0.500 0.500 0.500 0.500Subtotal Other - 0.500 - 0.500 - 0.500 - 0.500 - 0.500
Safety/SecurityNone - 0.000 - 0.000 - 0.000 - 0.000 - 0.000Subtotal Safety - 0.000 - 0.000 - 0.000 - 0.000 - 0.000
ServiceDelay Start of 2014 Service Change to November 1.000 0.000 0.000 0.000 0.000Eliminate 2015 Service Plan Provisional - 0.000 11 1.000 11 1.300 11 1.300 11 1.300Subtotal Service - 1.000 11 1.000 11 1.300 11 1.300 11 1.300
Service SupportNone - 0.000 - 0.000 - 0.000 - 0.000 - 0.000Subtotal Service Support - 0.000 - 0.000 - 0.000 - 0.000 - 0.000
Other- 0.000 - 0.000 - 0.000 - 0.000 - 0.000
Subtotal Other - 0.000 - 0.000 - 0.000 - 0.000 - 0.000
Agency Submission - $4.441 11 $4.500 11 $4.500 11 $4.500 11 $4.500
MTA Metro-North RailroadJuly Financial Plan 2015 - 2018
2014 Budget Reduction Plan Summary($ in millions)
Favorable/(Unfavorable)
V-130

MTA Metro-North RailroadJuly Financial Plan 2015 - 2018
2014 Budget Reduction Plan Worksheet
Category by Function: Administration
Program: Non-Agreement Position Vacancies
Background Details:
Program Description/Implementation Plan:
Program Implementation Date: Apr-14 When will savings begin?: Apr-14
Are these savings recurring?: No
Other Issues:
2014 2015 2016 2017 2018Financial Impact (Operating):
Net Cash Savings (in millions) $1.000 $0.000 $0.000 $0.000 $0.000
Total Positions Required:
The 2014 Budget Reduction Plan as communicated by the MTA contains a specified targetreduction for Metro-North Railroad of $4.5 million per year. Metro-North Railroad has identifiedseveral areas which will allow it to meet the budget reduction target. Some of the identifiedreductions are one-time events in single year, others are recurring expense reductions orrevenue increases through-out the five year forecast from 2014 through 2018.
One-Time Events:2014 - $1.0 million, Management Position Vacancies - Metro-North reached its 30 yearanniversary in 2013 and a significant number of senior management retirements have takenplace over the past 18 months. These positions have been difficult to fill given the unique skillsrequired for many of the operations positions and limited Human Resources staff to handle thehigher volume of vacant jobs.
Favorable/(Unfavorable)
V-131

MTA Metro-North RailroadJuly Financial Plan 2015 - 2018
2014 Budget Reduction Plan Worksheet
Category by Function: Maintenance
Program: Timing in Locomotive Overhaul Programs
Background Details:
Program Description/Implementation Plan:
Program Implementation Date: Apr-14 When will savings begin?: Apr-14
Are these savings recurring?: No
Other Issues:
2014 2015 2016 2017 2018Financial Impact (Operating):
Net Cash Savings (in millions) $1.441 $0.000 $0.000 $0.000 $0.000
Total Positions Required:
The 2014 Budget Reduction Plan as communicated by the MTA contains a specified targetreduction for Metro-North Railroad of $4.5 million per year. Metro-North Railroad has identifiedseveral areas which will allow it to meet the budget reduction target. Some of the identifiedreductions are one-time events in single year, others are recurring expense reductions or revenueincreases through-out the five year forecast from 2014 through 2018.
One-Time Events:2014 - $1.4 million, reschedule one Genesis Locomotive overhaul from 2014 to 2015, there aretwo units remaining from the cycle started in 2006.
Favorable/(Unfavorable)
V-132

MTA Metro-North RailroadJuly Financial Plan 2015 - 2018
2014 Budget Reduction Plan Worksheet
Category by Function: Maintenance
Program: Changes to Genesis and BL20 Locomotive Overhaul Cycles
Background Details:
Program Description/Implementation Plan:
Program Implementation Date: Jan-15 When will savings begin?: Jan-15
Are these savings recurring?: Yes
Other Issues:
2014 2015 2016 2017 2018Financial Impact (Operating):
Net Cash Savings (in millions) $0.000 $1.000 $1.000 $1.000 $1.000
Total Positions Required:
The 2014 Budget Reduction Plan as communicated by the MTA contains a specified targetreduction for Metro-North Railroad of $4.5 million per year. Metro-North Railroad has identifiedseveral areas which will allow it to meet the budget reduction target. Some of the identifiedreductions are one-time events in single year, others are recurring expense reductions orrevenue increases through-out the five year forecast from 2014 through 2018.
Recurring Reductions:2015-18 - $1.0 million, expected savings on new Genesis and BL20 Locomotive overhaul cyclesdue to scheduling changes in the start-up and ongoing implementation of the overhaul program.
Favorable/(Unfavorable)
V-133

MTA Metro-North RailroadJuly Financial Plan 2015 - 2018
2014 Budget Reduction Plan Worksheet
Category by Function: Maintenance
Program:
Background Details:
Program Description/Implementation Plan:
Program Implementation Date: Jul-14 When will savings begin?: Jul-14
Are these savings recurring?: Yes
Other Issues:
2014 2015 2016 2017 2018Financial Impact (Operating):
Net Cash Savings (in millions) $0.200 $0.700 $0.400 $0.400 $0.400
Total Positions Required:
Reduction in Provisions for Contracted Shop Equipment and Communication Equipment Maintenance
The 2014 Budget Reduction Plan as communicated by the MTA contains a specified targetreduction for Metro-North Railroad of $4.5 million per year. Metro-North Railroad has identifiedseveral areas which will allow it to meet the budget reduction target. Some of the identifiedreductions are one-time events in single year, others are recurring expense reductions or revenueincreases through-out the five year forecast from 2014 through 2018.
Recurring Reductions:2014-18 - $0.2 million in 2014 then $0.7 million in 2015 and then $0.4 million thereafter forreduced maintenance contracts for contracted shop equipment and communications equipmentmaintenance. This reflects the time and material nature of the maintenance contracts, recenttrends indicate that the current budgeted amounts are rarely totally consumed.
Favorable/(Unfavorable)
V-134

MTA Metro-North RailroadJuly Financial Plan 2015 - 2018
2014 Budget Reduction Plan Worksheet
Category by Function: Maintenance
Program:
Background Details:
Program Description/Implementation Plan:
Program Implementation Date: Jul-14 When will savings begin?: Jul-14
Are these savings recurring?: Yes
Other Issues:
2014 2015 2016 2017 2018Financial Impact (Operating):
Net Cash Savings (in millions) $0.300 $0.800 $0.800 $0.800 $0.800
Total Positions Required:
Lower Material Requirements for NHL New Car Fleet and Communications Equipment
The 2014 Budget Reduction Plan as communicated by the MTA contains a specified targetreduction for Metro-North Railroad of $4.5 million per year. Metro-North Railroad has identifiedseveral areas which will allow it to meet the budget reduction target. Some of the identifiedreductions are one-time events in single year, others are recurring expense reductions or revenueincreases through-out the five year forecast from 2014 through 2018.
Recurring Reductions:2014-18 - $0.3 million in 2014 and then $0.8 million thereafter reduced material usage for M8 carsunder warranty, M2s, M4s and M6s no longer in service and reduced Communications equipment.This reduction does not include materials required to maintain Positive Train Control systems.
Favorable/(Unfavorable)
V-135

MTA Metro-North RailroadJuly Financial Plan 2015 - 2018
2014 Budget Reduction Plan Worksheet
Category by Function: Maintenance
Program: Reduce Provision for M7 Car Seat Replacement Material
Background Details:
Program Description/Implementation Plan:
Program Implementation Date: Jan-15 When will savings begin?: Jan-15
Are these savings recurring?: Yes
Other Issues:
2014 2015 2016 2017 2018Financial Impact (Operating):
Net Cash Savings (in millions) $0.000 $0.500 $0.500 $0.500 $0.500
Total Positions Required:
The 2014 Budget Reduction Plan as communicated by the MTA contains a specified targetreduction for Metro-North Railroad of $4.5 million per year. Metro-North Railroad has identifiedseveral areas which will allow it to meet the budget reduction target. Some of the identifiedreductions are one-time events in single year, others are recurring expense reductions orrevenue increases through-out the five year forecast from 2014 through 2018.
Recurring Reductions:2015-18 - $0.5 million per year reduced materials spend for M7 car seat replacements. The planprovision reflects costs to do approximately 30 kits annually (one seat kit covers one marriedpair of cars). Capacity constraints among staff and material deliveries from vendors indicate that20-25 kits per year may be more realistic estimate.
Favorable/(Unfavorable)
V-136

MTA Metro-North RailroadJuly Financial Plan 2015 - 2018
2014 Budget Reduction Plan Worksheet
Category by Function: Revenue Enhancement
Program: Increase in GCT Retail and NWP Parking Spaces
Background Details:
Program Description/Implementation Plan:
Program Implementation Date: Jan-14 When will savings begin?: Jan-14
Are these savings recurring?: Yes
Other Issues:
2014 2015 2016 2017 2018Financial Impact (Operating):
Net Cash Savings (in millions) $0.500 $0.500 $0.500 $0.500 $0.500
Total Positions Required:
The 2014 Budget Reduction Plan as communicated by the MTA contains a specified targetreduction for Metro-North Railroad of $4.5 million per year. Metro-North Railroad has identifiedseveral areas which will allow it to meet the budget reduction target. Some of the identifiedreductions are one-time events in single year, others are recurring expense reductions or revenueincreases through-out the five year forecast from 2014 through 2018.
Recurring Reductions:2014-18 - $0.5 million per year increases to Other Operating Revenue from two sources. The firstis additional GCT retail revenues from several revised tenant leases. The second increase isresult of expanded parking space at North White Plains station parking facility.
Favorable/(Unfavorable)
V-137

MTA Metro-North RailroadJuly Financial Plan 2015 - 2018
2014 Budget Reduction Plan Worksheet
Category by Function: Service
Program: Delay Start of 2014 Service Change to November
Background Details:
Program Description/Implementation Plan:
Program Implementation Date: Jul-14 When will savings begin?: Jul-14
Are these savings recurring?: No
Other Issues:
2014 2015 2016 2017 2018Financial Impact (Operating):
Net Cash Savings (in millions) $1.000 $0.000 $0.000 $0.000 $0.000
Total Positions Required:
The 2014 Budget Reduction Plan as communicated by the MTA contains a specified targetreduction for Metro-North Railroad of $4.5 million per year. Metro-North Railroad has identifiedseveral areas which will allow it to meet the budget reduction target. Some of the identifiedreductions are one-time events in single year, others are recurring expense reductions or revenueincreases through-out the five year forecast from 2014 through 2018.
One-Time Events:2014 - $1.0 million, delay in start of 2014 Service Plan from July to November, no change toplanned service.
Favorable/(Unfavorable)
V-138

MTA Metro-North RailroadJuly Financial Plan 2015 - 2018
2014 Budget Reduction Plan Worksheet
Category by Function: Service
Program: Eliminate 2015 Service Plan Provisional
Background Details:
Program Description/Implementation Plan:
Program Implementation Date: Apr-15 When will savings begin?: Apr-15
Are these savings recurring?: Yes
Other Issues:
2014 2015 2016 2017 2018Financial Impact (Operating):
Net Cash Savings (in millions) $0.000 $1.000 $1.300 $1.300 $1.300
Total Positions Required:(List Title of Positions)
Engineers 3 3 3 3Conductors 8 8 8 8
The 2014 Budget Reduction Plan as communicated by the MTA contains a specified targetreduction for Metro-North Railroad of $4.5 million per year. Metro-North Railroad has identifiedseveral areas which will allow it to meet the budget reduction target. Some of the identifiedreductions are one-time events in single year, others are recurring expense reductions or revenueincreases through-out the five year forecast from 2014 through 2018.
Recurring Reductions:2015-18 - $1.0 million in 2015 and then $1.3 million thereafter, reflecting elimination of 2015provisional but not approved service changes, reducing crew needs and power/fuel expenses. Aprovision for ridership growth remains in the forecast.
Favorable/(Unfavorable)
V-139

MTA METRO-NORTH RAILROAD 2015 Preliminary Budget
July Financial Plan 2015 - 2018 Positions
POSITION ASSUMPTIONS Positions are stated as of December 31 of each year and reflect authorized staffing levels. YEAR-TO-YEAR CHANGES 2014 - 2015 The 2015 Preliminary Budget includes programmatic additions of seven Non-reimbursable positions versus 2014 reflecting three T&E positions in support of ridership growth, three management positions to support the enterprise asset management program and one management position to oversee communications with the Connecticut legislature. 2015 - 2016 2016 decreases by four positions which r eflects a decrease of 14 Non-Reimbursable positions resulting from the reduction of 20 Maintenance of Way positions due to the completion of the Infrastructure Improvement Plan partially offset by an increase of three T&E positions to support ridership growth and three positions to support new geom etry car equipment in MofW. There is also an increase of 10 Reimbursable positions for Positive Train Control (PTC). 2016 - 2017 2017 positions decrease by tw o which reflects a decreas e of two Non-Reimbursabl e positions resulting from a decrease of five MofW positions due t o the ramping down of the Right-of-Way clean-up efforts partially offset by three additional T&E positions to support ridership growth. 2017 - 2018 2018 includes an increase of three Non-Reimbursable T&E positions to support ridership growth.
V-140

MTA METRO-NORTH RAILROAD 2015 Preliminary Budget
July Financial Plan 2015 - 2018 Positions Plan-to-Plan Changes
PLAN TO PLAN CHANGES 2014 The 2014 Mid-Year Forecast refl ects a dec rease of one Non-Reimbursable position versus the 2014 Adopted Budget which incl udes a shift of one oper ating position to support capital program work and an inactivation of one Safety position, partially offset by the addition of the VP Chief Engineer position to head the MofW department. The 2014 Mid-Year Forecast reflects an increase of three Reimbursable positions versus the 2014 Adopted Budget which in cludes one manager position in MofW to support construction work in Connecticut and two Non-Agreement positio ns in t he Engineering & Design department to support the growing num ber and larger scope of projects in and around GCT. 2015 The 2015 Preliminary Budget shows a net decrease of eight Non-Reimbursable positions over the February Financial Plan. The posit ion change from 2014 noted above carry forward to 2015 (one position). There is also a reduction of 11 T&E positions resulting from eliminating the 2015 Servic e Plan initiative partially offset by the addition of three manag ement positions to suppor t the enterprise asset management program and one management position to oversee communications with the Connecticut legislature. The 2015 Pr eliminary Budget also shows a net increas e of three Reimbursable pos itions over th e February Financial Plan. All of these positions carry forward from the 2014 changes noted above. 2016 The July Financial Plan for 2016 shows a net decrease of 11 non-reimbursable positions over the February Fi nancial Plan. All of these pos itions carry forward from the 2015 c hanges noted above ( eight positions). There is also a reduction of three T&E positions resulting from eliminating the 2016 Service Plan initiative. The July Financial Plan for 2016 also s hows a net in crease of three Reimbursable positions over the February Financial Plan . All of these positions ca rry forward from the 2015 changes noted above. 2017 The July Financial Plan for 2017 shows a net decrease of 20 non-reimbursable positions over the February Fi nancial Plan. All of these pos itions carry forward from the 2016 changes noted above (11 positions). There is also a reduction of nine T &E positions resulting from eliminating the 2017 Service Plan initiative. The July Financial
V-141

Plan for 2017 also s hows a net increase of three Reimbursable positions over the February Financial Plan. All of these positions carry forward from the 2016 changes noted above.
V-142

2014 2015 2016 2017
2014 February Plan ‐ Total Baseline Positions 6,583 6,597 6,596 6,603
Total Plan‐to‐Plan Changes (2) 5 8 17
2014 July Plan ‐ Total Baseline Positions 6,585 6,592 6,588 6,586
Total Year‐to‐Year Changes, July Plan (7) 4 2
Total Plan‐to‐Plan Changes by Reporting Category:
Non‐Reimbursable 1 8 11 20
Reimbursable (3) (3) (3) (3)
Total (2) 5 8 17
Full‐Time (2) 5 8 17
Full‐Time Equivalents 0 0 0 0
Total (2) 5 8 17
By Function Category
‐ Administration (4) (5) (5) (5)
‐ Operations 1 9 12 21
‐ Maintenance 4 4 4 4
‐ Engineering/Capital (3) (3) (3) (3)
‐ Public Safety 0 0 0 0
Total (2) 5 8 17
By Occupational Group
‐ Managers/Supervisors (4) (4) (4) (4)
‐ Professional, Technical, Clerical (7) (11) (11) (11)
‐ Operational Hourlies 9 20 23 32
Total (2) 5 8 17
Total Plan‐to‐Plan Changes by Major Category:
2014 BRPs 0 11 11 11
New Needs (1) (5) (5) (5)
Change in Reimbursable Positions (3) (3) (3) (3)
Re‐estimates & All Other1
2 2 5 14
Total (2) 5 8 171 Includes Full‐time Equivalents
MTA METRO‐NORTH RAILROAD
July Financial Plan 2015 ‐ 2018
Favorable/(Unfavorable)
Total Position Changes at a Glance
V-143

2014 2015
2013 Mid-Year Preliminary FUNCTION/DEPARTMENT Actual Forecast Budget 2016 2017 2018
Administration
President 3 3 3 3 3 3Labor Relations 7 9 9 9 9 9Safety(1) 18 44 44 44 44 44COS/ Corporate & Public Affairs(1) 15 17 18 18 18 18Customer Service(1) 44 52 52 52 52 52Legal 18 18 18 18 18 18Claims 13 14 14 14 14 14Environmental Compliance & Svce 7 7 7 7 7 7VP Administration 3 3 3 3 3 3VP Human Resources 3 7 7 7 7 7Human Resources & Diversity 28 28 28 28 28 28Training 48 58 58 58 58 58Employee Relations & Diversity 5 5 5 5 5 5VP Planning 2 2 2 2 2 2Operations Planning & Analysis 15 19 19 19 19 19Capital Planning & Programming 13 16 16 16 16 16Business Development Facilities & Mktg(1) 26 0 0 0 0 0GCT & Corporate Development(1) 0 30 30 30 30 30Long Range Planning 8 8 8 8 8 8VP Finance & Info Systems(2) 1 3 3 3 3 3Controller 78 81 81 81 81 81Information Technology & Project Mgmt 99 125 125 125 125 125Budget(2) 17 18 18 18 18 18Procurement & Material Management(2) 30 42 42 42 42 42Corporate(1) 0 2 2 2 2 2
Total Administration 500 611 612 612 612 612
Operations
Operations Administration 49 61 64 64 64 64Operations Services (3) 1,749 1,457 1,460 1,463 1,466 1,469Customer Service(1) 228 239 239 239 239 239Business Development Facilities & Mktg (1) 36 0 0 0 0 0GCT & Corporate Development(1) 0 38 38 38 38 38Metro-North West 37 33 33 33 33 33
Total Operations 2,100 1,828 1,834 1,837 1,840 1,843
Maintenance
GCT(1) 370 0 0 0 0 0GCT & Corporate Development(1) 0 173 173 173 173 173Maintenance of Equipment (3) 1,249 1,735 1,735 1,745 1,745 1,745Maintenance of Way(1) 1,667 2,001 2,001 1,984 1,979 1,979Procurement & Material Management(2) 120 124 124 124 124 124
Total Maintenance 3,406 4,033 4,033 4,026 4,021 4,021
Engineering/CapitalConstruction Management 38 42 42 42 42 42Engineering & Design 57 71 71 71 71 71
Total Engineering/Capital 94 113 113 113 113 113
Baseline Total Positions 6,099 6,585 6,592 6,588 6,586 6,589
Non-Reimbursable 5,842 5,967 5,974 5,960 5,958 5,961Reimbursable 257 618 618 628 628 628
Total Full-Time 6,098 6,584 6,591 6,587 6,585 6,588Total Full-Time-Equivalents 1 1 1 1 1 1
(2)Reflects the following transfer of positions between departments or functional groups: - 2 positions transferred from the Budget Department to the VP Finance Department. - 4 Procurement Specialists were reclassified from Administrative to Maintenance functions.
Non-Reimbursable/Reimbursable and Full-Time/Full-Time Equivalents
MTA METRO-NORTH RAILROADJuly Financial Plan 2015 - 2018
Total Positions by Function and Department
(1)Reflects the January 2014 reorganization of the GCT and Business Development departments which combines the two depts to create GCT & Corporate Development and transfers a portion of the combined dept. to the Maintenance of Way, Safety, Customer Service, Corporate and Public Affairs departments.
(3)Reflects the January 2014 transfer of the Car Appearance Unit (363 in Operational Hourly positions & 7 in Managers/Supervisors) from Operations (Operation Services Dept.) to Maintenance (Maintenance of Equipment Dept.).
V-144

2014 20152013 Mid-Year Preliminary
FUNCTION/OCCUPATIONAL GROUP Actual Forecast Budget 2016 2017 2018
Administration Managers/Supervisors 168 194 194 194 194 194 Professional, Technical, Clerical 332 416 417 417 417 417 Operational Hourlies - - - - - -
Total Administration 500 611 612 612 612 612
Operations Managers/Supervisors 143 149 149 149 149 149 Professional, Technical, Clerical 222 238 241 241 241 241 Operational Hourlies 1,735 1,442 1,445 1,448 1,451 1,454
Total Operations 2,100 1,828 1,834 1,837 1,840 1,843
Maintenance Managers/Supervisors 482 549 549 549 549 549 Professional, Technical, Clerical 488 506 506 506 506 506 Operational Hourlies 2,436 2,979 2,979 2,972 2,967 2,967
Total Maintenance 3,406 4,033 4,033 4,026 4,021 4,021
Engineering/Capital Managers/Supervisors 39 51 51 51 51 51 Professional, Technical, Clerical 55 62 62 62 62 62 Operational Hourlies - - - - - -
Total Engineering/Capital 94 113 113 113 113 113
Public Safety Managers/Supervisors - - - - - - Professional, Technical, Clerical - - - - - - Operational Hourlies - - - - - -
Total Public Safety - - - - - - Total Baseline Positions
Managers/Supervisors 831 943 943 943 943 943 Professional, Technical, Clerical 1,098 1,222 1,226 1,226 1,226 1,226 Operational Hourlies 4,171 4,420 4,423 4,419 4,417 4,420
Total Baseline Positions 6,099 6,585 6,592 6,588 6,586 6,589
MTA METRO-NORTH RAILROADJuly Financial Plan 2015 - 2018
Total Positions by Function and Occupation
V-145

[THIS PAGE INTENTIONALLY LEFT BLANK]
V-146

MTA Headquarters

MTA HEADQUARTERS 2015 Preliminary Budget
July Financial Plan 2015–2018
FINANCIAL OVERVIEW MTA Headquarters’ (MTA HQ) operat ions include four distinct components: Policy and Oversight; Consolidated Functions (those departments that perform services on behalf of MTA agencies); the Business Service C enter (BSC); and MTA Sec urity, which includes the MTA Police Depar tment (MTA PD). Note: Reflecting the recent settlement with the Police Bene volence Association ( PBA), this July Pla n assumes the same pattern settlement for employees represent ed by unions without co ntract agreements. This assumption projects costs that are in excess of the February Plan provision, and a portion of this additional cost will be funded by the suspensi on of contributions to the GASB account. The MTA Headquarters’ Ju ly Financial Plan demon strates the organization’s commitment to streamlining operations and maxim izing efficiencies and revenue opportunities within the organization and across the MTA. At the s ame time, it also remains committed to maintaining an organization dedicated to communicating effectively and prom oting customer satisfaction, as well as enhanc ing safety and security throughout the MTA system. Policy, Oversight and Consolidated Functions MTA Headquarters’ July F inancial Plan contains self-funded programs and funding for MTA-wide initiatives considered to be the hi ghest priority by executive management. MTA HQ conducted a review of operations t hat identified recurring savings of almost $1.3 million. These savings are captured in the Plan, and are discussed more fully in the Budget Reductions Program (BRPs) section. The MTA Headquarters’ July Fi nancial Plan continues to provide funding for a number of high priority initiativ es. The creation of a new senior management safety position i s underway, and will appear in a later Plan, to ensure that safety is a top priority throughout all MTA operations. The consoli dation/relocation of the Administration offices from Madison Avenue to Two Broadw ay continues wit h most Headquarters departments scheduled to reloc ate in 2014. Reimbursement of this funding will come from the eventual disposition of the Madison Av enue properties. The net proceeds will go to the MTA Capit al Program. The July Fi nancial Plan supports the Enterprise Asset Management goal of ensuring t hat the MTA makes informed decisions that balanc e operating and capital investments, asset performance, and the operational risk inherent in asset management. Funding is also pr ovided for Transportation Reinvention Commission studies to examine the MTA's challenges and goals for the next century to prepare a mass transit network that is pr epared for extreme weat her and provides a better experience for riders. A dditional funding is also provide for Organizationa l Development to develop processes that facilitate such activities as succession planning, the performance management program, and the delivery of learning programs that build employee capability.
V-147

Currently underway are efforts that will consolidate both the Information Technology and Treasury functions at Headquarters. Funding is also included for projects and planning-related expenses, specifically, for oversi ght of the West Side Yards Development project, which has no net cost impact sinc e all funding is reimbursable by the project developer. MTA Security As the tra nsportation system e xpands, MTA is taking steps to ensure appropriate protection is provided for our customers, employees and facilities. The 2014 Adopte d Budget previously included funding in 2014 fo r the hiring of nine MTA Polic e positions, enabling the MTA PD to increas e its presence on Metro North Railroad’s (MNR) New Haven Line, which is MNR’s most heavily traveled line. Included in the Financia l Plan baseline in 2015 is fundin g for the hiring of five MTA PD pos itions for patrolling t he Moynihan project - an expans ion of the west end concourse at Pe nn Station. Als o included in the baseline is funding in 2018 for the MTA PD to begin a hiring schedule for approximately 30 new officers each year t hrough 2021. These officers will be us ed to augment safety and security throughout the MTA system and be available to establish a fully-trained security presence for East Side Access when it opens in 2021. Business Service Center (BSC) In order to transform the way the MTA conducts business, it established the BSC, which began operations on January 1, 2011. Under BSC , select administrative functions for all the MTA agencies are combined and a singl e Enterprise Resource Planning (ERP), Financial and Human Resources/Payroll system along with other technologies is utilized to process administrative and back-office trans actions as part of continued efforts to increase efficiencies and gener ate cost savings. A second p hase began in 2012, incorporating NYCT, MTA Bus and B&T Hum an Resources functions int o the BSC. Since its inception, the BS C has progressed to a steady state and is performing the basic functions it was set up to complete. The BSC continues cost savi ngs projects in such areas as automating the Accounts Payable voucher creation process. To further consolidate the Pension function, funding is provided for the next phase of the Pension project, bringing t he MaBSTOA pension information into the BSC. To enhance sec urity, funding is provided to upgrade primary software housing sensitive medical informati on for NYCT employ ees. Also, due to the build out of the accounting/human res ources system upgrade environment, expected to begin in the second half of 2014 and conclude in early 2016, funding is being provide d to upgrade the current backup st ructure which does not have the capacity required to accommodate the additional workload the accounting/human resources system upgrade project represents. 2014 Mid-Year Forecast The MTA Headquarters Baseline Deficit of $435.2 million in the July Plan includes total Non-Reimbursable Operating Revenues of $66.5 million and t otal expenses before
V-148

depreciation and other post-employment benefits of $380.6 million, consisting of $203.7 million in labor exp enses and $176.9 million in non-labor expenses. Total capital and other reimbursements are proj ected to be $95.2 million. Total reimbursable labor expenses are $78.9 million and non-labor expenses are $ 16.3 million. Cash adjustments prior to depreciation and OPEB obligation are unfavorable by $2.6 million. The Baseline Cash Deficit is pr ojected to be $31 6.7 million, a $9. 9 million favorable variance from the Adopted Budget of $326.6 million. Major operating cash changes include: Favorable
Higher recoverable expenses of $12.2 m illion mainly reflect prior year exp ense recoveries and higher MTA PD recoveries.
Revised Operating Capital of $8.7 million due prim arily to a timing shift of expenses to 2015.
Higher revenues of $9.3 million mainly due to increased Two Broadway rentals. Revised OPEB payments of $3.2 million.
Unfavorable
New Needs of $9.6 million include $4.2 million of Admini strative net New Needs including 10 positions (discussed more thoroughly in the Positions section); Enterprise Asset Management consulting needs partly recover able from the agencies; and other outside st udies. BSC New Needs of $1.1 million include funding for moving the MaBSTO A pension to the accounting/human resources system environment and for consulting assistance for re troactive wage adjustments and gross wage inc reases. C onsolidation IT New Needs of $4.1 million are primarily for se curity purposes. MTA PD New Nee ds of $0.2 million are for relocation.
Higher Support for Subsid iaries of $5. 3 million reflecting MTA’s share of the Verrazano-Narrows Bridge Toll Rebate Pr ogram (net of New York State’s 50% share of the program).
Higher MTA PD labor and retroactive wage costs of $4.5 million mainly reflecting the impact of the 2014 wage settlement.
Revised Two Broadway operating expenses of $2.2 million. Re-estimated IT Professional Services costs of $1.3 million. Change in Other Fringe Benefits of $0.7 million mainly reflecting revised MTA PD
Labor adjustments and increased headcount. Reimbursable expenses are projected to increase by $14.9 mil lion in 2014 mainly as a result of higher recoverable expenses from the benefiting agencies. Total baseline positions are projected to in crease by 15 positions to 1,780 positions, resulting from 14 administrat ive New Needs and the transfer of a Pension position from LIRR. This is discussed more thoroughly in the Positions section.
V-149

2015 Preliminary Budget - Baseline The MTA Headq uarters Baseline Deficit of $483.7 million in the 2015 Prelimin ary Budget includes total Non-Reimbursable Operating Revenues of $56.8 million and tot al expenses before dep reciation and other pos t-employment benefits of $399.3 millio n, consisting of $219.8 million in labor expenses and $179.5 million in non-labor expenses. Total capital and oth er reimbursements ar e projected to be $89.1 millio n. Total reimbursable labor e xpenses are $68.8 m illion and non-labor expenses are $20.3 million. Cash adjustments pr ior to depreciation and OPEB ob ligation are favorable b y $91.9 million primarily reflecting advertisi ng revenue receipts reassigned to MTA Headquarters from NYCT and the Commuter Railroads. The Baseline Cash Deficit is projected to be $250.6 million, a $52. 6 million unfavorable variance from the February Financial Plan of $198.0 million. Major operating cash changes include: Unfavorable
Higher cash adjustments of $29.1 millio n primarily from a shift in Operating Capital needs from 2014 and revised timing of MTAHQ relocation expenditures.
Increased New Needs of $18.5 million include $2.8 million of Administrative New Needs including 10 positions ( discussed more thoroughly in the Positions section); Enterprise Asset Management consulting needs; and other outside studies. BSC New Needs of $1.4 mill ion include funding for moving the MaBSTOA pension to the accounting/hum an resources system environment and for consulting assistance for retroac tive wage adjustments and gross wage increases. Consolidation IT net New Ne eds of $13.0 million ar e primarily for the addition of 63 positions as part of the MTA I T Transformation initiative to provide desktop support for P Cs and laptops at all the agencies by in-house staff rather than an off-site/off-shore vendor, and fo r security purposes. MTA PD New Needs of $1.3 million are for costs not previously incurred prior to relocation.
Higher Support for Subsid iaries of $7. 0 million reflecting MTA’s share of the Verrazano-Narrows Bridge Toll Rebate Pr ogram (net of reimbursements from New York State).
Re-estimated IT Professional Services and Maintenance costs of $5.5 million. Higher MTA PD labor costs of $2.7 mil lion mainly reflecting the impact of the
2014 Wage Settlement. Change in Other Fringe B enefits of $0.8 million mainly reflecting increased
headcount. Favorable
Revised OPEB current payment of $4.3 million. Revised recoverable expenses of $1.8 million ma inly higher recovery of
expenses from benefiting agencies. BRPs of $ 1.3 million mainly du e to reduced MTA He adquarters use of outsid e
vendors, consultants, and services, and MTA PD reduced contracts with outside vendors utilized primarily at MTA PD facilities.
Higher net Two Broadway rental revenues of $0.7 million.
V-150

Re-allocation of budget system costs of $0.7 million to the agencies. Reimbursable expenses are projected to increase by $5.1 mi llion in 2015 mainly as a result of higher recoverable expenses from the benefiting agencies. Total baseline positions are projected to in crease by 76 positions to 1,845 positions, mainly due to 63 New Need positions as part of the MTA IT Transformation initiative to provide desktop support for PCs and laptops at all the agencies by in-house staff rather than an of f-site/off-shore vendor, as well as 12 administrative New Needs and the transfer of a Pension position from LIRR. This is discussed more thoroughly in the Positions section. 2016-2018 Projections Operating cash deficits are projected to increase by $6 .5 million in 2016, $3.3 million in 2017 and $5.0 million in 2018 compared to the February Financial Plan. Major operating cash changes include: Unfavorable
New Needs of $13.1 million, $12.8 million and $13.6 m illion in 2016, 2017, and 2018 respectively inc lude Administrative New Needs of $2.8 in 2016 and $2.9 million in 2017 and 2018, inclu ding 10 p ositions each year (discussed more thoroughly in the Positions section), and Enter prise Asset Management consulting needs. BSC New Ne eds of $0.6 million, $0.3 million, and $0.4 million in 2016, 2017, and 20 18 respectively, include funding for moving the MaBSTOA pension to the accounting/human resources environment in 2016. Consolidat ion IT Net New Needs of $8.4 million, $8.3 million, and $9.0 millio n in 2016, 2017, and 2018 respectively, are primarily for the addition of 63 positions as part of the MTA IT Transformation initiative to pr ovide desktop support for PCs and laptops at all the agencies by in-house staff rather than an off-site/off-shore vendor, and for security purposes. MTA PD New Needs of $1.3 m illion from 2016 - 2018 are for costs not previously incurred prior to relocation.
Higher net Support for Subsid iaries of $7.0 million reflecting MTA’s share of the Verrazano-Narrows Bridge Toll Rebate Program from 2016 - 2018.
Re-estimated IT Professional Services an d Maintenance costs of $3.5 million i n 2016 and $3.2 million in 2017 and 2018.
Higher MTA PD labor costs of $2.9 million in 2016, $2.1 million in 2017 and $2.2 million in 2018 mainly reflecting the impact of the 2014 Wage Settlement.
Higher MTA PD oper ating expenses of $1.3 million from 201 6 - 2018 related to relocation.
Higher Other Fringe Benefits of $0.8 million, $0.7 million and $0.8 million in 2016, 2017, and 2018 respectively, mainly reflecting increased headcount.
V-151

Favorable Revised OPEB current payment of $5.5 mi llion, $6.6 million, an d $7.6 million in
2016, 2017, and 2018, respectively. Higher cash adjustments of $4.7 million in 2016 mainly due to revised recovery of
MTA HQ relocation expenditures. Revised MTA PD cos ts of $3.4 million in 2016, $8.8 million in 2017 and $7.4
million in 2018, resulting from hiring due to delay in East Side Access opening. Revised recoverable expenses of $1.8 million from 2016 – 2018, mainly reflect
higher recoveries of expenses from benefiting agencies. BRPs of $1.4 million from 2016 - 2018 mainly due to reduced MTA Headquarters
use of outside vendors, consultant s, and services, and MT A PD reduced contracts with outside services utilized primarily at MTA PD facilities.
Higher net Two Broadway rental revenues of $0.8 million in 2016, an d $1.0 million in 2017 and 2018.
Reimbursable expenses are projected to increase by $6.7 million in 2016, $6.8 million in 2017, and $7.0 million in 2018 mainly due to desktop budget savings. Total baseline positions are pr ojected to increase by 46 pos itions and 2 positions t o 1,845 positions in 2016 and 2017. This is mainly due to 63 New Need pos itions as part of the MTA IT Transformation initiative to provide desktop support for PCs and laptop s at all the agencies by in-house staff rather than an off-site/off-shore vendor, as we ll as 12 administrative New Needs and the transfer of a Pension pos ition from LIRR, partly offset by a revised MTA PD hiring plan du e to delay s in the opening of East Sid e Access. This is discussed more thoroughly in the Positions section. The MTA Headquarters Baseline Deficit of $492.8 million in 2016 includes total Non-Reimbursable Operating Reve nues of $58.6 million and total exp enses before depreciation and other post-employment benefits of $393.7 million, consisting of $222.3 million in labor exp enses and $171.3 million in non-labor expenses. Total capital and other reimbursements are proj ected to be $97.0 million. Total reimbursable labor expenses are $71.6 million and non-labor expenses are $ 25.4 million. Cash adjustments prior to depreciation and OPEB obligation are favorable by $192.1 million primarily reflecting advertising revenue r eceipts reassigned from NYCT and the Commuter Rails to MTA Headquarters. Tota l headcount is projected to be 1,845 positions in 2016. The 2017 Baseline Deficit of $510.1 million inc ludes total Non-Reimbursable Operating Revenues of $60.4 million and total exp enses before depreciation and other post-employment benefits of $399.8 million consisting of $226.5 million in lab or expenses and $173.3 million in non-labor expenses. Total capita l and other reimbursements are projected to be $98.1 million. Total reimbursable labor expenses are $72.6 million an d non-labor expenses are $25.5 million. Cash adjustments prior to depreciation and OPEB obligation are favorable by $128.8 million primarily reflecting advertising revenue receipts reassigned from NY CT and the Commuter Rails to MTA Headquarters. Total headcount is projected to be 1,845 positions in 2017.
V-152

The Baseline Deficit of $525.5 million in 2018 in cludes total Non-Re imbursable Operating Revenues of $62. 4 million and total expens es before depreciation and othe r post-employment benefits of $412.6 million, consisting of $234.9 million in lab or expenses and $177.7 m illion in non-labor expens es. Total capital and other reimbursements are projected to be $95.1 million. T otal reimbursable labor expenses are $73.6 million and non-labor expenses are $21.5 million. Cash adjustments prior to depreciation and OPEB obligation are favorabl e by $92.7 million pr imarily reflecting advertising revenue receipts reassigned from NYCT and the Commuter Rails to MT A Headquarters. Total headcount is projected to be 1,875 positions in 2018. Budget Reduction Program (BRPs) The July Plan includes BRPs of $1.3 million in 2015 and $1.4 million from 2016 – 2018. Administrative reductions are $0 .7 million in 2015 an d $0.8 million from 2016 – 20 18. MTA HQ savings are recurring through the reduction of the use of financial services consultants, advertising, legal services and other outside vendors, consultants, and services. MTA PD savings of $0.5 million fr om 2015 - 2018 results mainly from reduced contracts with outside vendors for maintenanc e and repair services, office supplies, office equipment and janitorial and custodial services at MTA PD facilities. BRP savings are inflated at the CPI-Urban rates of 1.74% , and 1.57%, an d 1.63%, in 2016, 2017 and 2018 respectively.
V-153

NON-REIMBURSABLE
2014 2015
2013 Mid-Year Preliminary
Actuals Forecast Budget 2016 2017 2018
Operating Revenue
Fare Revenue $0.000 $0.000 $0.000 $0.000 $0.000 $0.000Vehicle Toll Revenue - - - - - - Other Operating Revenue
Rental Income 51.434 57.242 46.853 48.626 50.461 52.370Advertising 0.000 0.000 0.000 0.000 0.000 0.000Other 10.348 9.253 9.925 9.939 9.985 10.034
Total Other Operating Revenue 61.782 66.495 56.778 58.565 60.446 62.404Capital and Other Reimbursements Total Revenue $61.782 $66.495 $56.778 $58.565 $60.446 $62.404
Operating Expenses
Labor:
Payroll $151.691 $171.759 $174.225 $176.664 $179.107 $184.073Overtime 10.467 7.006 6.572 6.522 6.493 6.607Health and Welfare 24.242 25.960 28.408 29.784 31.128 33.076OPEB Current Payment 7.974 9.900 10.395 10.665 11.199 11.758Pensions 44.182 41.280 42.523 43.008 43.381 44.433Other Fringe Benefits 14.284 14.723 15.490 15.951 16.329 16.946Reimbursable Overhead (45.428) (66.933) (57.784) (60.262) (61.116) (62.017)Total Labor Expenses $207.412 $203.695 $219.829 $222.332 $226.521 $234.876
Non-Labor:
Electric Power $8.253 $5.292 $6.420 $6.312 $7.333 $7.888Fuel 2.238 1.589 1.622 1.547 1.456 1.494 Insurance 2.868 1.787 1.902 2.084 2.342 2.519Claims 1.024 1.319 1.330 1.463 1.609 1.770 Paratransit Service Contracts - - - - - - Maintenance and Other Operating Contracts 61.430 72.716 69.484 70.227 71.067 72.220Professional Service Contracts 46.845 74.138 74.758 65.648 65.365 67.477Materials & SuppliesOther Business Expenses
MTA Internal Subsidy 4.200 14.000 18.600 18.600 18.600 18.600Other 9.291 6.074 5.368 5.451 5.535 5.712
Total Other Business Expenses 13.491 20.074 23.968 24.051 24.135 24.312Total Non-Labor Expenses $136.149 $176.915 $179.484 $171.332 $173.307 $177.680
Other Expenses Adjustments:
Other - - - - - - Total Other Expense Adjustments $0.000 $0.000 $0.000 $0.000 $0.000 $0.000
Total Expenses before Depreciation and GASB Adjs. $343.561 $380.610 $399.313 $393.664 $399.828 $412.556
Depreciation 41.922 31.043 36.180 40.425 40.669 32.784 OPEB Obligation 85.351 90.000 105.000 117.253 130.046 142.569 Environmental Remediation - - - - - -
Total Expenses $470.834 $501.653 $540.493 $551.342 $570.543 $587.909
Baseline Surplus/(Deficit) ($409.052) ($435.158) ($483.715) ($492.777) ($510.097) ($525.505)
($ in millions)
MTA HEADQUARTERSJuly Financial Plan 2015-2018
Accrual Statement of Operations by Category
V-154

REIMBURSABLE
2014 2015
2013 Mid-Year Preliminary
Actuals Forecast Budget 2016 2017 2018
Revenue
Fare Revenue $0.000 $0.000 $0.000 $0.000 $0.000 $0.000Vehicle Toll Revenue - - - - - - Other Operating Revenue - - - - - - Capital and Other Reimbursements 68.620 95.224 89.051 97.012 98.096 95.122Total Revenue $68.620 $95.224 $89.051 $97.012 $98.096 $95.122
Expenses
Labor:
Payroll $3.538 $3.838 $4.144 $4.216 $4.282 $4.352Overtime 8.717 6.353 5.000 5.000 5.000 5.000 Health and Welfare 0.592 0.667 0.725 0.957 1.006 1.059OPEB Current Payment - - - - - - Pensions 0.729 0.702 0.722 0.742 0.763 0.785Other Fringe Benefits 0.503 0.390 0.389 0.400 0.413 0.427Reimbursable Overhead 45.428 $66.933 $57.784 $60.262 $61.116 $62.017Total Labor Expenses $59.507 $78.883 $68.764 $71.577 $72.580 $73.640
Non-Labor:
Electric Power - - - - - - Fuel - - - - - - Insurance - - - - - - Claims - - - - - - Paratransit Service Contracts - - - - - - Maintenance and Other Operating Contracts 0.020 0.020 0.020 0.020 0.021 Professional Service Contracts 9.067 16.205 20.154 25.300 25.380 21.343 Materials & SuppliesOther Business Expenses
MTA Internal Subsidy - - - - - - Other 0.046 0.116 0.113 0.115 0.116 0.118
Total Other Business Expenses 0.046 0.116 0.113 0.115 0.116 0.118 Total Non-Labor Expenses $9.113 $16.341 $20.287 $25.435 $25.516 $21.482
Other Expenses Adjustments:
Other - - - - - - Total Other Expense Adjustments $0.000 $0.000 $0.000 $0.000 $0.000 $0.000
Total Expenses before Depreciation $68.620 $95.224 $89.051 $97.012 $98.096 $95.122
Depreciation - - - - - -
Total Expenses $68.620 $95.224 $89.051 $97.012 $98.096 $95.122
Baseline Surplus/(Deficit) $0.000 $0.000 $0.000 $0.000 $0.000 $0.000
Accrual Statement of Operations by Category($ in millions)
MTA HEADQUARTERSJuly Financial Plan 2015-2018
V-155

NON-REIMBURSABLE / REIMBURSABLE
2014 2015
2013 Mid-Year Preliminary
Actuals Forecast Budget 2016 2017 2018
Revenue
Fare Revenue $0.000 $0.000 $0.000 $0.000 $0.000 $0.000Vehicle Toll Revenue - - - - - - Other Operating Revenue
Rental Income 51.434 57.242 46.853 48.626 50.461 52.370 Other 10.348 9.253 9.925 9.939 9.985 10.034
Total Other Operating Revenue 61.782 66.495 56.778 58.565 60.446 62.404Capital and Other Reimbursements 68.620 95.224 89.051 97.012 98.096 95.122Total Revenue $130.402 $161.719 $145.829 $155.577 $158.542 $157.526
Expenses
Labor:
Payroll $155.229 $175.597 $178.369 $180.880 $183.389 $188.425Overtime 19.184 13.359 11.572 11.522 11.493 11.607 Health and Welfare 24.834 26.627 29.133 30.741 32.134 34.135 OPEB Current Payment 7.974 9.900 10.395 10.665 11.199 11.758 Pensions 44.911 41.982 43.245 43.750 44.144 45.218 Other Fringe Benefits 14.787 15.113 15.879 16.351 16.742 17.373 Reimbursable Overhead - - - - - - Total Labor Expenses $266.919 $282.578 $288.593 $293.909 $299.101 $308.516
Non-Labor:
Electric Power $8.253 $5.292 $6.420 $6.312 $7.333 $7.888Fuel 2.238 1.589 1.622 1.547 1.456 1.494 Insurance 2.868 1.787 1.902 2.084 2.342 2.519 Claims 1.024 1.319 1.330 1.463 1.609 1.770 Paratransit Service Contracts - - - - - - Maintenance and Other Operating Contracts 61.430 72.736 69.504 70.247 71.087 72.241 Professional Service Contracts 55.912 90.343 94.912 90.948 90.745 88.820 Materials & Supplies - - - - - - Other Business Expenses
MTA Internal Subsidy 4.200 14.000 18.600 18.600 18.600 18.600 Other Business Expenses 9.337 6.190 5.481 5.566 5.651 5.830
Total Other Business Expenses 13.537 20.190 24.081 24.166 24.251 24.430Total Non-Labor Expenses $145.262 $193.256 $199.771 $196.767 $198.823 $199.162
Other Expenses Adjustments:
Other $0.000 $0.000 $0.000 $0.000 $0.000 $0.000Total Other Expense Adjustments $0.000 $0.000 $0.000 $0.000 $0.000 $0.000
Total Expenses before Depreciation and GASB Adjs. $412.181 $475.834 $488.364 $490.676 $497.924 $507.678
Depreciation 41.922 31.043 36.180 40.425 40.669 32.784 OPEB Obligation 85.351 90.000 105.000 117.253 130.046 142.569 Environmental Remediation - - - - - -
Total Expenses $539.454 $596.877 $629.544 $648.354 $668.639 $683.031
Baseline Surplus/(Deficit) ($409.052) ($435.158) ($483.715) ($492.777) ($510.097) ($525.505)
MTA HEADQUARTERSJuly Financial Plan 2015-2018
Accrual Statement of Operations by Category($ in millions)
V-156

CASH RECEIPTS AND EXPENDITURES
2014 2015
2013 Mid-Year Preliminary
Actuals Forecast Budget 2016 2017 2018
Receipts
Fare Revenue $0.000 $0.000 $0.000 $0.000 $0.000 $0.000Vehicle Toll Revenue - - - - - - Other Operating Revenue
Rental Income 51.197 55.679 46.853 48.626 50.461 52.370Advertising 115.025 118.946 122.782 126.420 130.168 134.028Other 9.481 5.491 23.912 88.293 10.089 10.140Total Other Operating Revenue 175.703 180.116 193.547 263.339 190.718 196.538Capital and Other Reimbursements 65.820 99.092 89.051 97.012 98.096 95.122Total Receipts $241.523 $279.208 $282.598 $360.351 $288.814 $291.660
Expenditures
Labor:
Payroll $157.322 174.568 171.723 174.175 176.627 181.594Overtime 19.184 13.359 11.572 11.522 11.493 11.607Health and Welfare 23.325 25.454 28.015 29.601 30.969 32.945OPEB Current Payment 7.974 9.900 10.395 10.665 11.199 11.758Pensions 49.211 38.852 43.785 44.521 45.195 46.112Other Fringe Benefits 14.843 15.051 15.814 16.286 16.677 17.308GASB Account 1.451 0.990 0.000 0.000 0.000 0.112Reimbursable Overhead - - - - - - Total Labor Expenditures $273.310 $278.173 $281.304 $286.770 $292.160 $301.436
Non-Labor:
Electric Power $4.291 $6.285 $6.420 $6.312 $7.333 $7.888Fuel 1.110 1.883 1.622 1.547 1.456 1.494 Insurance 1.905 1.768 1.883 2.063 2.319 2.494Claims 1.721 1.319 1.330 1.463 1.609 1.770Paratransit Service Contracts - 0.000 0.000 0.000 0.000 0.000Maintenance and Other Operating Contracts 51.871 72.975 66.654 67.367 68.172 69.279Professional Service Contracts 44.228 95.607 88.146 84.486 84.303 82.529Materials & Supplies - 0.000 0.000 0.000 0.000 0.000Other Business Expenses
MTA Internal Subsidy 4.200 14.000 18.600 18.600 18.600 18.600Other Business Expenses 9.659 60.597 26.666 5.025 5.096 5.264
Total Other Business Expenses 13.859 74.60 45.27 23.625 23.696 23.864 Total Non-Labor Expenditures $118.985 $254.432 $211.321 $186.863 $188.888 $189.318
Other Expenditure Adjustments:
Capital 11.740 63.268 40.606 29.716 18.316 58.316 Unallocated Service Enhancement Policy Action - - - - - - Total Other Expenditure Adjustments $11.740 $63.268 $40.606 $29.716 $18.316 $58.316
Total Expenditures $404.035 $595.873 $533.231 $503.349 $499.364 $549.070
Baseline Cash Deficit ($162.512) ($316.665) ($250.632) ($142.998) ($210.550) ($257.410)
MTA HEADQUARTERSJuly Financial Plan 2015-2018Cash Receipts & Expenditures
($ in millions)
V-157

CASH FLOW ADJUSTMENTS
2014 2015
2013 Mid-Year Preliminary
Actuals Forecast Budget 2016 2017 2018
Receipts
Fare Revenue $0.000 $0.000 $0.000 $0.000 $0.000 $0.000Rental Income (0.237) (1.563) - - - - Advertising Revenue 115.025 118.946 122.782 126.420 130.168 134.028Other Operating Revenue (0.867) (3.762) 13.987 78.354 0.104 0.106Capital and Other Reimbursements (2.800) 3.868 - - - - Total Receipts $111.121 $117.489 $136.769 $204.774 $130.272 $134.134
Expenditures
Labor:
Payroll ($2.093) $1.029 $6.646 $6.705 $6.762 $6.831OvertimeHealth and Welfare 1.509 1.173 1.118 1.140 1.165 1.190OPEB Current Payment 0.000 0.000 0.000 0.000 0.000 0.000Pensions (4.300) 3.130 (0.540) (0.771) (1.051) (0.894)Other Fringe Benefits (0.056) 0.062 0.065 0.065 0.065 0.065GASB Account (1.451) (0.990) 0.000 0.000 0.000 (0.112)Reimbursable Overhead 0.000 0.000 0.000 0.000 0.000Total Labor Expenditures ($6.391) $4.405 $7.289 $7.139 $6.941 $7.080
Non-Labor:
Electric Power $3.962 ($0.993) $0.000 $0.000 $0.000 $0.000Fuel 1.128 (0.294) - - - - Insurance 0.963 0.019 0.019 0.021 0.023 0.025Claims (0.697) - - - - - Paratransit Service Contracts - - - - - - Maintenance and Other Operating Contracts 9.559 (0.239) 2.850 2.880 2.915 2.962Professional Service Contracts 11.684 (5.264) 6.766 6.462 6.442 6.291Materials & Supplies 0.000 0.000 0.000 0.000 0.000Other Business Expenses
MTA Internal SubsidyOther Business Expenses (0.322) (54.407) (21.185) 0.541 0.555 0.566
Total Other Business Expenses (0.322) (54.407) (21.185) 0.541 0.555 0.566Total Non-Labor Expenditures $26.277 ($61.176) ($11.550) $9.904 $9.935 $9.844
Other Expenditure Adjustments:
Capital ($11.740) ($63.268) ($40.606) ($29.716) ($18.316) ($58.316)Total Other Expenditure Adjustments ($11.740) ($63.268) ($40.606) ($29.716) ($18.316) ($58.316)
Total Cash Conversion Adjustments before Depreciation and GASB Adjs.
$119.267 ($2.550) $91.902 $192.101 $128.832 $92.742
Depreciation Adjustment 41.922 31.043 36.180 40.425 40.669 32.784
OPEB Obligation 85.351 90.000 105.000 117.253 130.046 142.569
Environmental Remediation - - - - - -
Baseline Total Cash Conversion Adjustments $246.540 $118.493 $233.082 $349.779 $299.547 $268.095
($ in millions)
MTA HEADQUARTERSJuly Financial Plan 2015-2018
Cash Conversion (Cash Flow Adjustments)
V-157 (a)

MTA Headquarters2014 Mid-Year Forecast
Non-Reimbursable/Reimbursable Overtime ($ in millions)
NON-REIMBURSABLE OVERTIME Hours $ %
Scheduled Service 0 $0.000 0%
Unscheduled Service 0 $0.000 0%
Programmatic/Routine Maintenance 0 $0.000 0%
Unscheduled Maintenance 0 $0.000 0%
Vacancy/Absentee Coverage 57,804 $2.662 38%
Weather Emergencies 0 $0.000 0%
Safety/Security/Law Enforcement 92,139 $3.988 57%
Other 9,269 $0.356 5%
Subtotal 159,213 $7.006 100%
REIMBURSABLE OVERTIME 140,017 $6.353
TOTAL OVERTIME 299,230 $13.359
1 Other & reimbursable budget includes PTE $'s only. Does not include hours.
Total
V-157 (b)

MTA HEADQUARTERS 2015 Preliminary Budget
July Financial Plan 2015-2018 Year-to-Year Changes by Category - Baseline
Receipts:
Rental and Other Income and Reimbursements In 2015 lower revenue reflects re-estimated charge-backs to Agencies for work
performed by MTA Headquarters on their behal f, and lost rental revenues as a result of the Madison Avenue buildings ’ disposition, partly offset by New York State support of the Verrazano-Narrows Bridge Toll Rebat e Program, and reimbursement of consolidation/ relocation expenses from the di sposition of the buildings, and higher advertising revenues.
Cash revenues in 2016 are higher mainly due t o the reimbursement of consolidation/relocation expenses from th e disposition of the Madison Avenue buildings.
Revenues in 2017 and 2018 are inflated by the CPI-Urban rate of 1.57% and 1.63%, respectively.
Expenditures: Projections include additional Payroll, Overtime, Pens ion, Health & Welfare and Other Fringe Benefits expenses for those employ ees without contract agreements that are patterned after the recent PBA settlement. Payroll
Payroll changes in t he 2014 Mid-Year Fo recast primarily reflect re-estimated departmental costs, revised MTA PD labor costs, including retroactive wages in 2014, resulting from the PBA Collective Ba rgaining agreement, a higher vacation accrual, and an increase of 15 positions, primarily through New Needs.
Payroll increases in 2015 primarily reflects the addition of 63 positions as part of the MTA IT Transformation initiative to provide desk top support for PCs and laptops at all the agencies by in-house s taff rather than an off-site/off-shore vendor.
MTA PD represented salaries are infl ated in accordance to the terms agreed through the collective bargaining process a nd also reflect the incr ease in patro l force necessary to provide greater covera ge on the Moynihan project in 2015, and the East Side Access (ESA) Project beginning in 2018.
Salaries for non-represented employees, who have not received a general s alary increase during the last five years, ar e assumed to follow CPI-based incr eases. The 2014 Mid-Year Forecast baseline inc ludes the compounding of raises for 2012 and 2013; however, as of the July Plan, no raises have been granted.
Overtime Overtime expenses throughout the July Financial Plan are primarily relate d to
MTA PD operations.
V-158

In 2014, overtime expenses are reduced fr om 2013 mainly due to efficiencie s agreed to in the ratified PBA Contract. The full-year impact of the overtime efficiencies are reflected in 2015.
Expenses in 2016, 2017, and 2018 are inflated by prevailing inflator assumptions.
Health and Welfare Based on revised Empire Plan cost assumptions provided by the NYS
Department of Civil Service, Health and Welfare medical insurance family coverage rates are projected to increase at a rate of 5.0% in 2015, 2.6% in 2016, and 5.0% in 2017 and each year thereafter. Individual coverage rates in 2015 are projected to increase at a rate of 4. 6%, 1.3% in 2016, and 3.8% in 2017 and each year thereafter.
OPEB Current Payment Year to year Increases are based on the pr ojected medical insurance coverage
rates to reflect higher coverage for retiree health benefit costs.
Pensions Reduced pension costs in 2014 primarily are based on estimated NYSLERS and
MTA Defined Benefits contributions. NYSLERS Rates are inflated by CPI 3 + 1% from 2015 – 2018. MTA Defined Benefits contributions es timates are based on ac tuarial growth
assumptions through 2018.
Other Fringe Benefits Projections are consistent with payroll rate increase assumptions.
Insurance and Claims The core of excess liability policies is inflated at approximately 23% annually.
Other Insurance premiums and claims ex penses are inflated at approximately 10% annually.
Maintenance and Other Operating Contracts Lower maintenance expenses in 2015 primarily reflect the impact of the
disposition of the Madison Avenue buildings. Expenses in 2016, 2017, and 2018 are inflated by the CPI-Urban rates of 1.74%,
1.57%, and 1.63%, respectively. Professional Service Contracts Professional services are reduced in 2015 but include New Needs of $13.7
million and re-estimates of $4.9 million primarily for IT-related expenses. Professional services in 2016 are $9.1 million favorable from 2015 mainly due to
reduced IT New Needs and re-estimates 2015, and lower IT hosting expenses at the BSC.
V-159

Professional services in 2018 increase by $2.1 million over 2017 mainly due to inflation at the CPI-Urban rate of 1. 63%, additional I T New Needs, and c osts related to MTA PD staffing up for East Side Access (ESA) project.
MTA Internal Subsidy The MTA Internal Subsidy of $14.0 million in 2014 is an increase of $10.5 million
over 2013 reflecting initiation of t he Verrazano-Narrows Bridg e Toll Rebate Program for part of the year. NYS’ sh are of the program is captured as a reduction in operating expenses. Also capt ured in this category is the continuing support requirement for the Rockaway Resident Discount Program of $3.5 million.
In 2015 and beyond, the MTA Internal Subsidy includes annual s upport requirements for the Rockaway Resid ent Discount Program of $4.6 million, and $14.0 million for the Verrazano-Narro ws Bridge Toll Rebate Program. Reimbursement for New York State’s s hare of the Verrazano-Narrows Bridge Toll Rebate Program is reflected in MTAHQ Other Revenues.
Other Business Expenses Expenses are reduced in 2015 related to the move from Madison Avenue and
consolidation/relocation of administrative offices to Two Broadway. In 2016, 2017 and 2018 expenses are normalized and are inflated by the CPI-
Urban rates of 1.74%, 1.57%, and 1.63%, respectively. Other Expenditure Adjustments:
Capital Expenditures Capital expenditures of $40.6 million in 2015 reflect delayed s pending on the
BSC’s Finance and Human Resources Upgrade. Capital expenditures of $29.7 m illion in 2016 are unchanged from the Adopted
Budget and reflect replacement of BSC equipment. Capital expenditures in 2017 ar e $18.3 million reflecting normal spending, and
$58.3 million in 201 8 reflecting further BSC Finan ce and Hu man Resources upgrades.
V-160

NON-REIMBURSABLE
2014 2015Change
2015 - 2014 2016Change
2016 - 2015 2017Change
2017 - 2016 2018Change
2018 - 2017RevenueFarebox Revenue $0.000 $0.000 $0.000 $0.000 $0.000 $0.000 $0.000 $0.000 $0.000Vehicle Toll Revenue - - - - - - - - - Other Operating Revenue - - - - - - - - - Rental Income 57.242 46.853 (10.389) 48.626 1.773 50.461 1.835 52.370 1.909 Other 9.253 9.925 0.672 9.939 0.014 9.985 0.046 10.034 0.049
Capital and Other ReimbursementsTotal Revenue $66.495 $56.778 ($9.717) $58.565 $1.787 $60.446 $1.881 $62.404 $1.958
ExpensesLabor:Payroll $171.759 $174.225 ($2.466) $176.664 ($2.439) $179.107 ($2.443) $184.073 ($4.966)Overtime 7.006 6.572 0.434 6.522 0.050 6.493 0.029 6.607 (0.114) Health and Welfare 25.960 28.408 (2.448) 29.784 (1.376) 31.128 (1.344) 33.076 (1.948) OPEB Current Payment 9.900 10.395 (0.495) 10.665 (0.270) 11.199 (0.534) 11.758 (0.559) Pensions 41.280 42.523 (1.243) 43.008 (0.485) 43.381 (0.373) 44.433 (1.052) Other Fringe Benefits 14.723 15.490 (0.767) 15.951 (0.461) 16.329 (0.378) 16.946 (0.617) Reimbursable Overhead (66.933) (57.784) (9.149) (60.262) 2.478 (61.116) 0.854 (62.017) 0.901 Total Labor Expenses $203.695 $219.829 ($16.134) $222.332 ($2.503) $226.521 ($4.189) $234.876 ($8.355)
Non-Labor:Electric Power $5.292 $6.420 ($1.128) $6.312 $0.108 $7.333 ($1.021) $7.888 ($0.555)Fuel 1.589 1.622 (0.033) 1.547 0.075 1.456 0.091 1.494 (0.038) Insurance 1.787 1.902 (0.115) 2.084 (0.182) 2.342 (0.258) 2.519 (0.177) Claims 1.319 1.330 (0.011) 1.463 (0.133) 1.609 (0.146) 1.770 (0.161) Paratransit Service Contracts - - - - - - - - - Maintenance and Other Operating Contracts 72.716 69.484 3.232 70.227 (0.743) 71.067 (0.840) 72.220 (1.153) Professional Service Contracts 74.138 74.758 (0.620) 65.648 9.110 65.365 0.283 67.477 (2.112) Materials & Supplies - - - - - - - - - MTA Internal Subsidy 14.000 18.600 (4.600) 18.600 - 18.600 - 18.600 - Other Business Expenses 6.074 5.368 0.706 5.451 (0.083) 5.535 (0.084) 5.712 (0.177) Total Non-Labor Expenses $176.915 $179.484 ($2.569) $171.332 $8.152 $173.307 ($1.975) $177.680 ($4.373)
Other Expenses Adjustments:Other - - - - - - - - - Total Other Expense Adjustments $0.000 $0.000 $0.000 $0.000 $0.000 $0.000 $0.000 $0.000 $0.000
Total Expenses before Depreciation and GASB Adjs. $380.610 $399.313 ($18.703) $393.664 $5.649 $399.828 ($6.164) $412.556 ($12.728)
Depreciation 31.043 36.180 (5.137) 40.425 (4.245) 40.669 (0.244) 32.784 7.885OPEB Obligation 90.000 105.000 (15.000) 117.253 (12.253) 130.046 (12.793) 142.569 (12.523)Environmental Remediation - - - - - - - - -
Total Expenses $501.653 $540.493 ($38.840) $551.342 ($10.849) $570.543 ($19.201) $587.909 ($17.366)
Baseline Net Surplus/(Deficit) ($435.158) ($483.715) ($48.557) ($492.777) ($9.062) ($510.097) ($17.320) ($525.505) ($15.408)
Favorable/(Unfavorable)
MTA HEADQUARTERSJuly Financial Plan 2015-2018
Year-to-Year Changes by Category - Accrual Basis($ in millions)
V-161

REIMBURSABLE
2014 2015Change
2015 - 2014 2016Change
2016 - 2015 2017Change
2017 - 2016 2018Change
2018 - 2017RevenueFarebox Revenue $0.000 $0.000 $0.000 $0.000 $0.000 $0.000 $0.000 $0.000 $0.000Vehicle Toll Revenue - - - - - - - - - Other Operating Revenue - - - - - - - - - Rental Income - - - - - - - - - Other - - - - - - - - -
Capital and Other Reimbursements 95.224 89.051 (6.173) 97.012 7.961 98.096 1.084 95.122 (2.974) Total Revenue $95.224 $89.051 ($6.173) $97.012 $7.961 $98.096 $1.084 $95.122 ($2.974)
ExpensesLabor:Payroll $3.838 $4.144 ($0.306) $4.216 ($0.072) $4.282 ($0.066) $4.352 ($0.070)Overtime 6.353 5.000 1.353 5.000 - 5.000 - 5.000 - Health and Welfare 0.667 0.725 (0.058) 0.957 (0.232) 1.006 (0.049) 1.059 (0.053) OPEB Current Payment - - - - - - - - - Pensions 0.702 0.722 (0.020) 0.742 (0.020) 0.763 (0.021) 0.785 (0.022) Other Fringe Benefits 0.390 0.389 0.001 0.400 (0.011) 0.413 (0.013) 0.427 (0.014) Reimbursable Overhead 66.933 57.784 9.149 60.262 (2.478) 61.116 (0.854) 62.017 (0.901) Total Labor Expenses $78.883 $68.764 $10.119 $71.577 ($2.813) $72.580 ($1.003) $73.640 ($1.060)
Non-Labor:Electric Power $0.000 $0.000 $0.000 $0.000 $0.000 $0.000 $0.000 $0.000 $0.000Fuel - - - - - - - - - Insurance - - - - - - - - - Claims - - - - - - - - - Paratransit Service Contracts - - - - - - - - - Maintenance and Other Operating Contracts 0.020 0.020 - 0.020 - 0.020 - 0.021 (0.001) Professional Service Contracts 16.205 20.154 (3.949) 25.300 (5.146) 25.380 (0.080) 21.343 4.037 Materials & Supplies - - - - - - - - - MTA Internal Subsidy - - - - - - - - - Other 0.116 0.113 0.003 0.115 (0.002) 0.116 (0.001) 0.118 (0.002) Total Non-Labor Expenses $16.341 $20.287 ($3.946) $25.435 ($5.148) $25.516 ($0.081) $21.482 $4.034
Other Expenses Adjustments:Other - - - - - - - - - Total Other Expense Adjustments $0.000 $0.000 $0.000 $0.000 $0.000 $0.000 $0.000 $0.000 $0.000
Total Expenses before Depreciation $95.224 $89.051 $6.173 $97.012 ($7.961) $98.096 ($1.084) $95.122 $2.974
Depreciation - - - - - - - - -
Total Expenses $95.224 $89.051 $6.173 $97.012 ($7.961) $98.096 ($1.084) $95.122 $2.974
Baseline Net Surplus/(Deficit) $0.000 $0.000 $0.000 $0.000 $0.000 $0.000 $0.000 $0.000 $0.000
Favorable/(Unfavorable)
Year-to-Year Changes by Category - Accrual Basis($ in millions)
MTA HEADQUARTERSJuly Financial Plan 2015-2018
V-162

CASH RECEIPTS AND EXPENDITURES
2014 2015Change
2015 - 2014 2016Change
2016 - 2015 2017Change
2017 - 2016 2018Change
2018 - 2017RevenueFarebox Revenue $0.000 $0.000 $0.000 $0.000 $0.000 $0.000 $0.000 $0.000 $0.000Vehicle Toll Revenue - - - - - - - - - Other Operating Revenue - - - - - - - - - Rental Income 55.679 46.853 (8.826) 48.626 1.773 50.461 1.835 52.370 1.909 Advertising 118.946 122.782 3.836 126.420 3.638 130.168 3.748 134.028 3.860 Other 5.491 23.912 18.421 88.293 64.381 10.089 (78.204) 10.140 0.051 Capital and Other Reimbursements 99.092 89.051 (10.041) 97.012 7.961 98.096 1.084 95.122 (2.974) Total Revenue $279.208 $282.598 $3.390 $360.351 $77.753 $288.814 ($71.537) $291.660 $2.846
ExpensesLabor:Payroll $174.568 $171.723 $2.845 $174.175 ($2.452) $176.627 ($2.452) $181.594 ($4.967)Overtime 13.359 11.572 1.787 11.522 0.050 11.493 0.029 11.607 (0.114) Health and Welfare 25.454 28.015 (2.561) 29.601 (1.586) 30.969 (1.368) 32.945 (1.976) OPEB Current Payment 9.900 10.395 (0.495) 10.665 (0.270) 11.199 (0.534) 11.758 (0.559) Pensions 38.852 43.785 (4.933) 44.521 (0.736) 45.195 (0.674) 46.112 (0.917) Other Fringe Benefits 15.051 15.814 (0.763) 16.286 (0.472) 16.677 (0.391) 17.308 (0.631) GASB Account 0.990 - 0.990 - - - - 0.112 (0.112) Reimbursable Overhead - - - - - - - - - Total Labor Expenditures $278.173 $281.304 ($3.131) $286.770 ($5.466) $292.160 ($5.390) $301.436 ($9.276)
Non-Labor:Electric Power $6.285 $6.420 ($0.136) $6.312 $0.108 $7.333 ($1.021) $7.888 ($0.555)Fuel 1.883 1.622 0.261 1.547 0.075 1.456 0.091 1.494 (0.038) Insurance 1.768 1.883 (0.115) 2.063 (0.180) 2.319 (0.256) 2.494 (0.175) Claims 1.319 1.330 (0.011) 1.463 (0.133) 1.609 (0.146) 1.770 (0.161) Paratransit Service Contracts - - - - - - - - - Maintenance and Other Operating Contracts 72.975 66.654 6.321 67.367 (0.713) 68.172 (0.805) 69.279 (1.107) Professional Service Contracts 95.607 88.146 7.461 84.486 3.660 84.303 0.183 82.529 1.774 Materials & Supplies - - - - - - - - - MTA Internal Subsidy 14.000 18.600 (4.600) 18.600 - 18.600 - 18.600 - Other Business Expenses 60.597 26.666 33.931 5.025 21.641 5.096 (0.071) 5.264 (0.168) Total Non-Labor Expenditures $254.432 $211.321 $43.111 $186.863 $24.458 $188.888 ($2.025) $189.318 ($0.430)
Other Expenditure Adjustments:Capital 63.268 40.606 22.662 29.716 10.890 18.316 11.400 58.316 (40.000) Total Other Expenditure Adjustment $63.268 $40.606 $22.662 $29.716 $10.890 $18.316 $11.400 $58.316 ($40.000)
Total Expenditures $595.873 $533.231 $62.642 $503.349 $29.882 $499.364 $3.985 $549.070 ($49.706)
Baseline Net Cash Deficit ($316.665) ($250.633) $66.032 ($142.998) $107.635 ($210.550) ($67.552) ($257.411) ($46.861)
($ in millions)
Favorable/(Unfavorable)
MTA HEADQUARTERSJuly Financial Plan 2015-2018
Year-to-Year Changes by Category - Cash Basis
V-163

MTA HEADQUARTERS 2015 Preliminary Budget
July Financial Plan 2015-2018 Summary of Plan-to-Plan Changes by Generic Category
2014: July Financial Plan vs. February Financial Plan Operating Revenue Changes Other operating revenues are projected to increase from the 2014 Adopted Budget by $9.3 million. Major generic category changes include:
Rental income is projected to incr ease by $5.3 million due to increased Two Broadway rentals and Transit Museum revenues.
Other revenues are projected to increase by $4.0 million mainly reflecting the 2014 reversal to revenue of an expense accrued in 2013, coupled with recoveries from Irene.
Operating Expense Changes Projections include additional Payroll, Overtime, Pens ion, Health & Welfare and Other Fringe Benefits expenses for those employ ees without contract agreements that are patterned after the recent PBA settlement. Total expenses before depreciation and post -employment benefits increase by $11.7 million. Total expenses including depreciation and post-employment benefits decrease by $0.5 million. Major generic category changes include:
Payroll increases of $11.2 million reflect re-estimated departmental costs, revised MTA PD labor costs, including retroac tive wages, resulting from the PBA Collective Bargaining agreement, a higher vacation accrual, and an increas e of 15 positions, primarily through New Needs.
The MTA Internal Su bsidy increases by $10.5 millio n reflecting initiation o f the Verrazano-Narrows Bridge Toll Rebate Program for part of the year.
Higher Maintenance and Other Operating C ontracts of $6.4 mill ion mainly due to higher Two Broadway real estate rentals due to the increase in the ground lease and IT New Needs.
Higher Professional Services of $5.7 m illion primarily reflect higher New Need s particularly related to the Enterprise Asset Management initiative.
Higher Other Business Expenses of $0.9 million due to higher metro mobility tax payments as well as realloca tion of existing budgeted funds from other expense lines.
V-164

Higher Other Fringe Benefits of $0.7 m illion mainly reflecting revised MTA PD Labor adjustments and increased headcount.
Higher reimbursable overhead of $16.4 million mainly reflects prior year expense recoveries, recovery from the agenc ies for Enterprise Ass et Management expenses, and higher MTA PD recoveries.
Revised other post-employment benefits current payment of $3.2 million to reflect actual level of required contributions.
Lower overtime expenses of $2.4 m illion due to efficiencies agreed to in the ratified PBA Contract.
Lower electric power of $1.5 million mainly due to revised Two Broadway needs. Lower pension costs of $0.5 million mainly based on estimated NYSLERS and
MTA Defined Benefits contributions. 2015: July Financial Plan vs. February Financial Plan Operating Revenue Changes Operating revenues a re projected to increas e from the February Plan by $ 8.5 million mainly due to New York State support fo r the Verrazano-Narrows Bridge T oll Rebate Program, and higher Two Broadway rentals. Operating Expense Changes Projections include additional Payroll, Overtime, Pens ion, Health & Welfare and Other Fringe Benefits expenses for those employ ees without contract agreements that are patterned after the recent PBA settlement. Excluding depreciation and po st-employment benefits decreases of $15.1 millio n, operating expenses increased by $31.6 million. Major generic category changes include:
The MTA Internal Subsidy incre ases by $14.0 millio n reflecting the full yea r impact of the Verrazano-Narrows Bridge Toll Rebate Program (offset by N YS’s share in Other Revenues).
Payroll increases of $11.9 million primarily reflect revi sed MTA PD lab or costs, including retroactive wages, resulting from the PBA Collective Barga ining agreement, and an increase of 76 positions, primarily through New Needs.
Higher Professional Services of $10.5 mi llion primarily reflect higher New Needs particularly related to the Enterprise Asset Management initiative.
Higher Maintenance and Other Operating C ontracts of $6.6 mill ion mainly due to higher Two Broadway real estate rentals due to the higher ground lease and IT New Needs.
Higher Other Fringe Benefits of $0. 9 million mainly reflecting incr eased headcount.
Higher Health and Welfare costs are $0.9 million higher tha n the Feb ruary Financial Plan mainly due to increased headcount.
V-165

Higher reimbursable overhead of $6.5 mill ion mainly reflects higher expense s recoverable from the benefiting agencies.
Revised other post-employment benefits current payments are favorable by $4.2 million.
Lower overtime expenses of $2.5 m illion due to efficiencies agreed to in the ratified PBA Contract.
2016 and 2017: July Financial Plan vs. February Financial Plan Operating Revenue Changes Operating revenues are projected to increase from the February Plan by $8.6 million in 2016 and $8.7 million in 2017 mainly due to Ne w York State support for the Verrazano-Narrows Bridge Toll Rebate Program, and higher Two Broadway rental revenues. Operating Expense Changes Projections include additional Payroll, Overtime, Pens ion, Health & Welfare and Other Fringe Benefits expenses for those employ ees without contract agreements that are patterned after the recent PBA settlement. Excluding depreciation and pos t-employment benefits decreases of $16.4 million i n 2016 and $11.0 million in 2017, operating e xpenses are unfavorable by $19.7 million in 2016, and $12.2 million in 2017. Major generic category changes include:
The MTA Internal Subsidy incre ases by $14.0 millio n reflecting the full yea r impact of the Verrazano-Narrows Bridge Toll Rebate Program (offset by N YS’s share in Other Revenues).
Payroll increases of $10.9 million in 2016 and $8. 0 million in 2017 primarily reflect revised MTA PD labor c osts, including retroactive wages, resulting from the PBA Collectiv e Bargaining agreement, and an in crease of 46 position s in 2016 and 2 positions in 2017, primarily through New Needs.
Higher Maintenance and Other Operating Contracts of $6.6 million in 2016 and $6.5 million in 2017 mainly due to higher Two Broad way real estate rentals and IT New Needs.
Higher Professional Services of $4.2 million and $3.4 m illion in 2016 and 2017 , respectively, primarily reflect higher IT New Needs and re-estimates.
Higher Other Fringe Benefits of $0. 9 million and $0.6 million in 2016 and 2017 , respectively, mainly reflecting increased headcount.
Higher reimbursable overhead of $8.0 m illion in 201 6 and $8.1 million in 201 7 mainly reflects higher expenses recoverable from the benefiting agencies.
Revised other post-employment benef its current payments are $5.5 millio n favorable in 2016 and $6.6 million favorable in 2017.
V-166

Lower overtime expenses of $2 .6 million, and $2.8 million in 2 016 and 2017, respectively, due to efficiencies agreed to in the ratified PBA Contract.
Lower pension costs of $1.1 million in 20 16 and $2 .7 million in 2017 mainly based on estimated NYSLERS and MTA Defined Benefits contributions an d the impact in the revised hiring schedule for MTA PD officers.
V-167

2014 2015 2016 2017
($326.570) ($198.020) ($136.533) ($207.227)
Baseline Changes
RevenueFarebox Revenue $0.000 $0.000 $0.000 $0.000Vehicle Toll Revenue - - - - Rental Income 5.297 1.531 1.624 1.738Advertising Revenue - - - - Other 4.045 6.989 6.948 6.950 Capital and Other Reimbursement - - - -
Total Revenue Changes $9.342 $8.520 $8.572 $8.688
ExpensesLabor:Payroll ($11.235) ($11.867) ($10.870) ($7.997)Overtime 2.397 2.520 2.599 2.800 Health and Welfare 0.115 (0.928) (0.174) 1.022 OPEB Current Payment 3.180 4.245 5.535 6.561 Pensions 0.541 0.244 1.137 2.709 Other Fringe Benefits (0.678) (0.934) (0.857) (0.565) Reimbursable Overhead 16.441 6.475 7.993 8.073
Total Labor Expense Changes 10.761 (0.245) 5.363 12.603
Non-Labor:Electric Power 1.485 0.020 0.298 (0.430) Fuel (0.331) (0.454) (0.418) (0.294) Insurance 0.087 0.096 0.107 0.118 Claims (0.110) - - - Paratransit Service Contracts - - - - Maintenance and Other Operating Contracts (6.437) (6.643) (6.628) (6.527) Professional Service Contracts (5.691) (10.544) (4.171) (3.435) Materials & Supplies 0.002 0.002 0.002 0.002 MTA Internal Subsidy (10.500) (14.000) (14.000) (14.000) Other Business Expenses (0.917) (0.293) (0.280) (0.277)
Total Non-Labor Expense Changes ($22.412) ($31.816) ($25.090) ($24.843)
Gap Closing Expenses :
Total Gap Closing Expenses $0.000 $0.000 $0.000 $.000
Total Expenses before Depreciation and GASB Adjs. ($11.651) ($32.061) ($19.727) ($12.240)
Depreciation ($3.768) $1.494 $2.385 ($2.857)OPEB Obligation $15.962 $13.600 $13.985 $13.829
Total Expense Changes $.543 ($16.967) ($3.357) ($1.268)
Cash Adjustment ChangesRevenue Adjustments (1.856) 0.742 4.147 0.000Expense Adjustments 1.875 (44.908) (15.826) (10.744)
Total Cash Adjustment Changes $0.019 ($44.166) ($11.679) ($10.744)
$9.904 ($52.613) ($6.464) ($3.324)
($316.665) ($250.632) ($142.998) ($210.550)
NON-REIMBURSABLE
February Financial Plan - Cash Surplus/(Deficit)
Total Baseline Changes
July Financial Plan - Cash Surplus/(Deficit)
MTA HEADQUARTERSJuly Financial Plan 2015-2018
Changes Between Financial Plans by Generic Categories($ in millions)
V-168

2014 2015 2016 2017
$0.000 $0.000 $0.000 $0.000
Baseline Changes
RevenueFarebox Revenue $0.000 $0.000 $0.000 $0.000Vehicle Toll Revenue - - - - Rental Income - - - - Advertising Revenue - - - - OtherCapital and Other Reimbursement 14.920 5.087 6.746 6.808
Total Revenue Changes $14.920 $5.087 $6.746 $6.808
ExpensesLabor:Payroll $1.058 $0.831 $0.852 $0.861Overtime (0.002) - - - Health and Welfare 0.220 0.217 0.040 0.048 OPEB Current Payment - - - - Pensions 0.218 0.215 0.217 0.221 Other Fringe Benefits (0.002) 0.040 0.044 0.045 Reimbursable Overhead (16.441) (6.475) (7.993) (8.073)
Total Labor Expense Changes ($14.949) ($5.172) ($6.840) ($6.898)
Non-Labor:Electric Power - - - - Fuel - - - - Insurance - - - - Claims - - - - Paratransit Service Contracts - - - - Maintenance and Other Operating Contracts - - - 0.001 Professional Services 0.031 0.080 0.089 0.085 Materials & Supplies - - - - MTA Internal Subsidy - - - - Other Business Expenses (0.001) 0.004 0.004 0.005
Total Non-Labor Expense Changes $.030 $.084 $.093 $.091
Gap Closing Expenses :
Total Gap Closing Expenses $0.000 $0.000 $0.000 $0.000
Total Expenses before Depreciation ($14.919) ($5.088) ($6.747) ($6.807)
Depreciation - - - -
Total Expense Changes ($14.920) ($5.087) ($6.746) ($6.808)
Cash Adjustment Changes - - - -
Total Cash Adjustment Changes $0.000 $0.000 $0.000 $0.000
$0.000 $0.000 $0.000 $0.000
$0.000 $0.000 $0.000 $0.000
Total Baseline Changes
July Financial Plan - Cash Surplus/(Deficit)
($ in millions)Changes Between Financial Plans by Generic Categories
February Financial Plan - Cash Surplus/(Deficit)
REIMBURSABLE
MTA HEADQUARTERSJuly Financial Plan 2015-2018
V-169

2014 2015 2016 2017
($326.570) ($198.020) ($136.533) ($207.227)
Baseline Changes
RevenueFarebox Revenue $0.000 $0.000 $0.000 $0.000Vehicle Toll Revenue - - - - Rental Income $5.297 $1.531 $1.624 $1.738Advertising Revenue - - - - Other 4.045 6.989 6.948 6.950 Capital and Other Reimbursement 14.920 5.087 6.746 6.808
Total Revenue Changes $24.262 $13.607 $15.318 $15.496
ExpensesLabor:Payroll ($10.177) ($11.036) ($10.018) ($7.136)Overtime 2.395 2.520 2.599 2.800 Health and Welfare 0.335 (0.711) (0.134) 1.070 OPEB Current Payment 3.180 4.245 5.535 6.561 Pensions 0.759 0.459 1.354 2.930 Other Fringe Benefits (0.680) (0.894) (0.813) (0.520) Reimbursable Overhead - - - -
Total Labor Expense Changes ($4.188) ($5.417) ($1.477) $5.705
Non-Labor:Electric Power 1.485 0.020 0.298 (0.430) Fuel (0.331) (0.454) (0.418) (0.294) Insurance 0.087 0.096 0.107 0.118 Claims (0.110) - - - Paratransit Service Contracts - - - - Maintenance and Other Operating Contracts (6.437) (6.643) (6.628) (6.526) Professional Services (5.660) (10.464) (4.082) (3.350) Materials & Supplies 0.002 0.002 0.002 0.002 MTA Internal Subsidy (10.500) (14.000) (14.000) (14.000) Other Business Expenses (0.918) (0.289) (0.276) (0.272)
Total Non-Labor Expense Changes ($22.382) ($31.732) ($24.997) ($24.752)
Gap Closing Expenses :
Total Gap Closing Expenses $0.000 $0.000 $0.000 $0.000
Total Expenses before Depreciation ($26.570) ($37.149) ($26.474) ($19.047)
Depreciation (3.768) 1.494 2.385 (2.857) OPEB Obligation 15.962 13.600 13.985 13.829
Total Expense Changes ($14.377) ($22.054) ($10.103) (8.076)
Cash Adjustment Changes - - - - Revenue Adjustments (1.856) 0.742 4.147 - Expense Adjustments 1.875 (44.908) (15.826) (10.744)
Total Cash Adjustment Changes $0.019 ($44.166) ($11.679) ($10.744)
$9.904 ($52.613) ($6.464) ($3.324)
($316.665) ($250.632) ($142.998) ($210.550)
July Financial Plan 2015-2018Changes Between Financial Plans by Generic Categories
Total Baseline Changes
July Financial Plan - Cash Surplus/(Deficit)
NON REIMBURSABLE/REIMBURSABLE
February Financial Plan - Cash Surplus/(Deficit)
($ in millions)
MTA HEADQUARTERS
V-170

MTA HEADQUARTERS 2015 Preliminary Budget
July Financial Plan 2015-2018 Summary of Major Plan-to-Plan Changes
2014: July Financial Plan vs. February Financial Plan Revenue Changes Total revenue is projected to increase from the 2014 Adopted Budget by $24.3 million. Major changes include:
Higher reimbursable overhead of $14.9 mill ion mainly reflects higher expenses recoverable from the benefiting agencies.
Rental income is projected to in crease by $5.3 million due to increased Two Broadway rentals and Transit Museum revenues.
Other revenues are projec ted to increase by $4.0 million mainly reflecting the 2014 reversal to revenue of an expens e accrued in 2013, coupled with recoveries from Irene and other.
Expense Changes Projections include additional Payroll, Overtime, Pens ion, Health & Welfare and Other Fringe Benefits expenses for those employ ees without contract agreements that are patterned after the recent PBA settlement. Total expenses increased by $14.4 million in 2014. Major changes include: Unfavorable
New Needs of $13.9 million inc lude $8.4 million of Administrative New Needs including 10 positions (discussed more thoroughly in the Positions section); Enterprise Asset Management consulting needs partly recover able from the agencies; and other outside st udies. BSC New Needs of $1.1 million include funding for moving the MaBSTO A pension to the accounting/human resources environment and for consulting assistance for one year to support the Retroactive Wage Adjustment/Gross Wage Increase processes that will b e needed onc e unions settle their individual cont ract disputes for retroactive wage adjustments and gross wage incr eases. Consolidatio n IT New Needs of $4.1 millio n are primarily for security purposes. MTA PD New Nee ds of $0.2 million ar e for relocation.
Higher Support for Subsidiaries of $5.3 million reflecting initiation of the Verrazano-Narrows Bridge Toll Rebate Program.
Higher MTA PD labor costs of $4.5 millio n mainly r eflecting the impact of the 2014 Wage Settlement as a result of the PBA Collective Bargaining agreement.
V-171

Revised Depreciation of $3.8 million. Higher vacation accrual of $3.0 million. Revised Two Broadway operating expenses of $2.2 million. Re-estimated IT Professional Services costs of $1.3 million. Higher Other Fringe Benefits of $0.7 m illion mainly reflecting revised MTA PD
labor adjustments and increased headcount. Favorable
Revised OPEB obligation expense and OPEB current payments of $19.1 million reflecting revised contribution amounts.
Cash Adjustments
Cash adjustments are virtually unchanged mainly due to favorable deprec iation, operating capital and timing of MTAHQ relocation cost s offset by unfavorable timing of payments for 2013 expenditures and the OPEB Obligation adjustment.
2015: July Financial Plan vs. February Financial Plan Revenue Changes Revenues are projected to increase from the February Plan by $13.6 million. Major changes include:
New York State support for the Verrazano-Narrows Bridge Toll Rebate Program. Higher reimbursable overhead of $5.1 mill ion mainly reflects higher expense s recoverable from the benefiting agencies.
Rental income is projected to incr ease by $1.5 million due to increased Two Broadway rentals and Transit Museum revenues.
Expense Changes Projections include additional Payroll, Overtime, Pens ion, Health & Welfare and Other Fringe Benefits expenses for those employ ees without contract agreements that are patterned after the recent PBA settlement. Total expenses are projected to increase by $22.1 million. Major changes include: Unfavorable
Increased New Needs of $23.2 million include $2.8 million of Administrative New Needs including 10 positions (discussed more thoroughly in the Pos itions section); Enterprise Asset Management consulting needs; and other outside studies. BSC New Needs of $1.4 mill ion include funding for moving the MaBSTOA pension to the accounting/hum an resources system environment and
V-172

for consulting assistance for retr oactive wage adjustments and gross wage increases. Consolidation IT New Needs of $17.7 mil lion are primarily for the addition of 63 positions as part of the MT A IT Transformation initiative to provide desktop support for P Cs and laptops at all the agencies by in-house staff rather than an off-site/off-shore vendor, and fo r security purposes. MTA PD New Needs of $1.3 million are for costs not previously incurred prior to relocation.
Higher Support for Subsidiaries of $14.0 million reflecting the Verrazano-Narrows Bridge Toll Rebate Program.
Re-estimated IT Professional Services and Maintenance costs of $5.5 million. Higher MTA PD labor costs of $2.7 mil lion mainly reflecting the impact of the
2014 Wage Settlement as a result of the PBA Collective Bargaining agreement. Change in Other Fringe B enefits of $0.8 million mainly reflecting increased
headcount. Revised Two Broadway operating expenses of $0.8 million.
Favorable
Revised OPEB ob ligation expense and OPEB current payment of $17.8 million reflecting revised contribution amounts.
Revised Depreciation of $1.5 million. BRPs of $ 1.3 million mainly due to reduced MTA HQ use of outside vend ors,
consultants, and services, and MTA PD reduced contracts with outside vendors utilized primarily at MTA PD facilities.
Allocation of Budget system costs of $0.7 million to the agencies. Cash Adjustments Cash adjustments are projected to be unfav orable by $44.2 million primarily due to unfavorable OPEB Obligat ion, depreciation, operating ca pital and timing of MTAHQ relocation costs. 2016 and 2017: July Financial Plan vs. February Financial Plan Revenue Changes Other operating revenues are pr ojected to increase from t he February Plan by $15.3 million in 2016 and $15.5 million in 2017. Major changes include:
New York State support for the Verra zano-Narrows Bridge Toll Rebate Program in 2016 and 2017.
Higher reimbursable overhead of $6.7 million, and $6.8 million in 20 16, and 2017, respectively, mainly reflects higher expenses recoverable from the benefiting agencies.
Rental income is projected to increas e by $1.6 million, and $1.7 million in 2 016 and 2017, respectively, due to increas ed Two Broadway r entals and Transit Museum revenues.
V-173

Expense Changes Projections include additional Payroll, Overtime, Pens ion, Health & Welfare and Other Fringe Benefits expenses for those employ ees without contract agreements that are patterned after the recent PBA settlement. Expenses increase by $10.1 million in 2016 and by $8.1 million in 2017. Major changes include: Unfavorable
New Needs of $19.3 million, and $19.1 million in 2016 and 2017 include $2.8 and $2.9 million in 2016 and 2017, respectively for Administrative New Needs including 10 positions (discussed more thoroughly in the Positions section), and Enterprise Asset Management consulti ng needs. BSC New Needs of $0.6 million and $0.3 million in 201 6 and 201 7, respectively, include funding for moving the MaBSTOA pension to the accounting/human resources system environment in 2016. Consolidation IT New Needs of $14.6 million and $14.5 million, in 2016 and 2017, resp ectively, are primarily for the a ddition of 63 positions as part of the MTA IT Transformation initiative to provide desk top support for PCs and laptops at all the agenc ies by in-house staff rather than an off-site/off-shore vendor, and for security purposes. MTA PD New Needs of $1.3 million in 2016 and 2017 are for relocation.
Higher Support for Subsidiaries of $14.0 million in 2016 and 2017 reflecting the Verrazano-Narrows Bridge Toll Rebate Program.
Re-estimated IT Professional Services an d Maintenance costs of $3.5 million i n 2016 and $3.2 million in 2017.
Revised depreciation of $2.9 million in 2017. Higher MTA PD labo r costs of $2.9 m illion in 201 6 and $2.1 million in 2017
mainly reflecting the impact of the 2014 PBA Wage Settlement. Higher MTA PD operating expenses of $1.3 million in 2016 and 2017 are
primarily for costs not incurred prior to relocation. Revised Two Broadway operating expenses of $0.8 million in 2016 and 2017.
Favorable
Revised OPEB obligation expense and OPEB current payment of $19.5 million , and $20.4 million in 2016 and 2017 reflecting revised contribution amounts.
Revised MTA PD cos ts of $3.4 million in 2016 and $8.8 million in 2017 resulting from hiring due to delay in East Side Access opening.
Revised depreciation of $2.4 million in 2016. Higher revenues of $1.6 million and $1.7 m illion in 2016 and 2017, mainly due to
higher Two Broadway rentals. BRPs of $1.3 million in 2016 and 2017 mainly due to reduced MTA HQ use of
outside vendors, consultants, and services, and MTA PD reduced contracts with outside vendors utilized primarily at MTA PD facilities.
V-174

Cash Adjustments Cash adjustments are projected to be unfavorable by $11.7 million in 2016 and $10.7 million in 2017 primarily reflecting unfavorable OPEB Obligation adjustments.
V-175

NON-REIMBURSABLE and REIMBURSABLE 2014 2015 2016 2017
February Financial Plan - Cash Surplus/(Deficit) ($326.570) ($198.020) ($136.533) ($207.227)
Non-Reimbursable Major Changes
Revenue
Revised Rental Revenues 5.297 1.531 1.624 1.738 Higher T.S. Irene reimbursement 0.161 - - - NYS Support of VNB Toll Rebate Program - 7.000 7.000 7.000 All Other 3.884 (0.011) (0.052) (0.050)
Sub-Total Non-Reimbursable Revenue Changes $9.342 $8.520 $8.572 $8.688
ExpensesMTAHQ Administrative New Needs (offsetting Recovery below) (8.448) (2.847) (2.830) (2.879) IT New Needs (offsetting Savings in Recovery) (4.105) (17.683) (14.606) (14.518) BSC New Needs (1.100) (1.367) (0.592) (0.348) MTA Police Operating Expense increase due to relocation (0.210) (1.262) (1.289) (1.310) Re-estimate of Professional Services (primarily IT costs) (1.335) (4.912) (2.907) (2.633) Re-estimate of Maintenance costs - (0.600) (0.557) (0.565) Higher Vacation Accrual (3.000) - - - Revised MTAPD Labor (incl. higher 2014 retro wages) (4.524) (2.651) (2.944) (2.084) VNB Toll Support net of NYS waiver of fees - 2014 only (5.250) - - - VNB Toll Support - 2015 and beyond (NYS Share in Revenue) - (14.000) (14.000) (14.000) Higher 2 Broadway operating expenses (2.239) (0.821) (0.835) (0.848) Re-estimated Treasury Dept Expenses (0.042) (0.093) (0.099) (0.105) Change in Other Fringe Benefits (0.661) (0.775) (0.808) (0.738) Revised BSC wages (0.460) (0.335) (0.348) (0.433) Change in Insurance & Claims (0.023) 0.096 0.107 0.118 Out year Electric Expense adjust due to rate change - - 0.446 (0.275) Out year Fuel Expense adjust due to rate change - - (0.021) (0.159) Re-allocation of budget systems costs to Agencies 0.219 0.730 0.730 0.730 MTA PD Shift in ESA Hiring - - 3.444 8.844 OPEB Current Payments 3.180 4.245 5.535 6.561 Higher Recoverable Expenses (includes offsets for New Needs) 16.441 6.475 7.993 8.073 Change in Billed & Forecasted Pension (NYSLERS/MTADB) 0.510 0.587 0.667 0.950 Lower Health and Welfare 0.442 0.344 0.397 0.727 Inflation Adjustments - (0.041) 0.119 0.018 Change in Depreciation (3.768) 1.494 2.385 (2.857) Change in OPEB Obligation Expense 15.962 13.600 13.985 13.829 BRPs - 1.244 1.264 1.286 Other (1.048) 1.608 1.402 1.351
Sub-Total Non-Reimbursable Expense Changes $0.543 ($16.966) ($3.358) ($1.268)
Total Non-Reimbursable Major Changes $9.885 ($8.446) $5.214 $7.420
Reimbursable Major ChangesRevised Reimbursable Revenue 14.920 5.087 6.746 6.808
Sub-Total Reimbursable Revenue Changes $14.920 $5.087 $6.746 $6.808
ExpensesHigher Recoverable Expenses (16.441) (6.475) (7.993) (8.073) All Other 1.522 1.388 1.247 1.265
Sub-Total Reimbursable Expense Changes ($14.920) ($5.087) ($6.746) ($6.808)
Total Reimbursable Major Changes $0.000 ($0.000) ($0.000) $0.000
Total Accrual Changes $9.885 ($8.446) $5.214 $7.420
Cash Adjustment Changes
Depreciation Adjustment 3.768 (1.494) (2.385) 2.857OPEB Obligation (15.962) (13.600) (13.985) (13.829)Operating Capital adjustments 8.748 (9.340) 0.000 0.000Timing of 2013 Expenses (not including Op Cap) (8.223) 0.000 0.000 0.000All Other Cash Adjustments 11.688 (19.732) 4.691 0.228
Total Cash Adjustment Changes $0.019 ($44.166) ($11.679) ($10.744)
Total Baseline Changes $9.904 ($52.612) ($6.465) ($3.324)
July Financial Plan - Cash Surplus/(Deficit) ($316.665) ($250.632) ($142.998) ($210.550)
MTA HEADQUARTERSJuly Financial Plan 2015-2018
Summary of Major Programmatic Changes Between Financial Plans($ in millions)
V-176

Favorable/(Unfavorable)Administration Pos. 2014 Pos. 2015 Pos. 2016 Pos. 2017 Pos. 2018
MTAPD Reductions $0.000 $0.500 $0.508 $0.517 $0.525Professional Services Reductions 0.000 0.744 0.756 0.769 0.782
Subtotal Administration - 0.000 - 1.244 - 1.265 - 1.287 - 1.307
Customer Convenience/AmenitiesNone - 0.000 - 0.000 - 0.000 - 0.000 - 0.000Subtotal Customer Convenience/Amenities - 0.000 - 0.000 - 0.000 - 0.000 - 0.000
Maintenance
NoneSubtotal Maintenance - 0.000 - 0.000 - 0.000 - 0.000 - 0.000
Revenue EnhancementTransit Museum Rentals 0.000 0.100 0.100 0.100 0.100Subtotal Revenue Enhancement - 0.000 - 0.100 - 0.100 - 0.100 - 0.100
SafetyNone - 0.000 - 0.000 - 0.000 - 0.000 - 0.000Subtotal Safety - 0.000 - 0.000 - 0.000 - 0.000 - 0.000
SecurityNone - 0.000 - 0.000 - 0.000 - 0.000 - 0.000Subtotal Security - 0.000 - 0.000 - 0.000 - 0.000 - 0.000
ServiceNone - 0.000 - 0.000 - 0.000 - 0.000 - 0.000Subtotal Service - 0.000 - 0.000 - 0.000 - 0.000 - 0.000
Service SupportNoneSubtotal Service Support - 0.000 - 0.000 - 0.000 - 0.000 - 0.000
OtherNone - 0.000 - 0.000 - 0.000 - 0.000 - 0.000Subtotal Other - 0.000 - 0.000 - 0.000 - 0.000 - 0.000
Total - $0.000 - $1.344 - $1.365 - $1.387 - $1.407
MTA HEADQUARTERSJuly Financial Plan 2015-2018
2014 Budget Reduction Summary($ in millions)
V-177

MTA HEADQUARTERS
2014 Budget Reduction Plan Worksheet
Category by Function: Administration
Program: MTAPD Reductions
Background Details:
Program Description/Implementation Plan:
Program Implementation Date: 1/1/2015 When will savings begin?: 1/1/2015
Are these savings recurring?: yes
Other Issues: None
2014 2015 2016 2017 2018
Financial Impact (Operating):
Net Cash Savings (in millions) $0.000 $0.500 $0.508 $0.517 $0.525
Total Positions Required:(List Title of Positions)
July Financial Plan 2015-2018
MTAPD has reduced other business expenses such as maintenance andrepair costs at facilities and contracts for outside vendors such as for janitorialservices.
Favorable/(Unfavorable)
V-178

MTA HEADQUARTERS
2014 Budget Reduction Plan Worksheet
Category by Function: Administration
Program: Professional Service Reductions
Background Details:
Program Description/Implementation Plan:
Program Implementation Date: 1/1/2015 When will savings begin?: 1/1/2015
Are these savings recurring?: yes
Other Issues: None
2014 2015 2016 2017 2018
Financial Impact (Operating):
Net Cash Savings (in millions) $0.000 $0.744 $0.756 $0.769 $0.782
Total Positions Required:
July Financial Plan 2015-2018
MTAHQ has reduced leases and rentals, and reduced the use of financialservices consultants, advertising, legal services, and other outside vendors,consultants, and services.
Favorable/(Unfavorable)
V-179

MTA HEADQUARTERS
2014 Budget Reduction Plan Worksheet
Category by Function: Revenue Enhancement
Program: Transit Museum Rentals
Background Details:
Program Description/Implementation Plan:
Program Implementation Date: When will savings begin?: 2015
Are these savings recurring?: yes
Other Issues: None
2014 2015 2016 2017 2018Financial Impact (Operating): $0.000 $0.100 $0.100 $0.100 $0.100
Net Cash Savings (in millions) $0.000 $0.100 $0.100 $0.100 $0.100
Total Positions Required:
July Financial Plan 2015-2018
The Museum's projected facility rental revenue in 2013 and continuing into 2014 exceeded projections due to an unexpected surge in interest. It seems clear that the surge was not an annomaly and as such the Museum projects revenue for this income stream to be at least $100 K higher than previous budget projections.
Favorable/(Unfavorable)
V-180

MTA HEADQUARTERS 2015 Preliminary Budget
July Financial Plan 2015-2018 Positions
POSITION ASSUMPTIONS 2014: July Financial Plan vs. February Financial Plan Total baseline positions are projected to increase by 15 positions, due to the following: New Needs (total increase of 13 Non-Reimbursable positions) include:
Two General Counsel positions include an upgrade of a co ntingent to full-t ime administrative position, and an Associate Counsel for Procurement matters.
Two Office Services mailroom clerks for the additional coverage required for Two Broadway.
Two Enterprise Asset Management positions for oversight of as set management program governance.
Two Capital Program Managem ent positions for the dire ction of the marketing strategy of the 5-Year Capital Plan to MTA stakeholders.
Two positions as part of the MTA IT Transformation initiative to provide desktop support for PCs and laptops at all the agencies by in-house staff rather than an off-site/off-shore vendor.
One Business Servic e center posit ion for Enterprise Learning Management training support.
One Human Resour ces position for t he Chairman’s Workforce Development initiative.
One Real Estate administrative positio n for the incr eased duties resulting from the ramp-up in West Side Yards activity. This is par tly reimbursed by Related Companies.
Change in Reimbursable Positions (total increase of 2 positions)
One Pension position transferred from LIRR. One Chief Investment Officer with oversight of retirement assets of approximately
$10 billion.
The increase of 15 positions by function inc luded 16 in Administration partly offset by a decrease of one Public Safety position due to an internal transfer. Position changes by occupat ional group are: Managers/S upervisors increase by 136 positions, and Operational Hourlies decrease by 124 posi tions due to revised reporting definitions for occupational groups. Professional, Technical, Clerical positions increase by three positions.
V-181

2015: July Financial Plan vs. February Financial Plan Total baseline positions are projected to increase by 76 positions as follows: New Needs (total increase of 74 Non-Reimbursable positions) include:
63 positions as part of the MTA IT Transformation initiative to provide desk top support for PCs and laptops at all the agenc ies by in-house staff rather than an off-site/off-shore vendor.
Two General Counsel positions include an upgrade of a contin gent to full-t ime administrative position, and an Associate Counsel for Procurement matters.
Two Office Services mailroom clerks for the additional coverage required for Two Broadway.
Two Enterprise Asset Management positions for oversight of as set management program governance.
Two Capital Program Management positions to direct t he marketing strategy of the 5-Year Capital Plan to MTA stakeholders.
One Business Servic e center posit ion for Enterprise Learning Management training support.
One Human Resour ces position for t he Chairman’s Workforce Development initiative.
One Real Estate administrative positio n for the incr eased duties resulting from the ramp-up in West Side Yards activity. This is par tly reimbursed by Related Companies.
Change in Reimbursable Positions (total increase of 2 positions)
One Pension position transferred from LIRR. One Chief Investment Officer with oversight of retirement assets of approximately
$10 billion. The increase of 76 positions by function inc luded 77 in Administration partly offset by a decrease of 1 Public Safety position due to an internal transfer. Position changes by occupat ional group are: Managers/S upervisors increase by 177 positions, and Operational Hourlies decrease by 124 posi tions due to revised reporting definitions for occupational groups. Professional, Technical, Clerical positions increase by 23 positions. 2016 and 2017: July Financial Plan vs. February Financial Plan Total baseline positions are projected to increase by 46 positions in 2016 and 2 positions in 2017 as follows: New Needs (total increase of 74 Non-Reimbursable positions in each year) include:
63 positions as part of the MTA IT Transformation initiative to provide desk top support for PCs and laptops at all the agenc ies by in-house staff rather than an off-site/off-shore vendor.
V-182

Two General Counsel positions include an upgrade of a co ntingent to full-t ime administrative position, and an Associate Counsel for Procurement matters.
Two Office Services mailroom clerks for the additional coverage required for Two Broadway.
Two Enterprise Asset Management positions for oversight of as set management program governance.
Two Capital Program Management positions to direct t he marketing strategy of the 5-Year Capital Plan to MTA stakeholders.
One Business Servic e center posit ion for Enterprise Learning Management training support.
One Human Resour ces position for t he Chairman’s Workforce Development initiative.
One Real Estate administrative positio n for the incr eased duties resulting from the ramp-up in West Side Yards activity. This is par tly reimbursed by Related Companies.
Change in Reimbursable Positions (total increase of 2 positions in each year) include:
One Pension position transferred from LIRR. One Chief Investment Officer with oversight of retirement assets of approximately
$10 billion. Re-estimates and All Ot her (total decrease of 30 positi ons in 2016 and 74 positions in 2017):
MTA PD reductions of 30 positions in 2016 and 74 positions in 2017 are due to revised hiring plans for East Side Access in anticipation of its delayed projected opening.
By function, the increase of 46 positions in 2016 and 2 positions in 2017 included 77 Administration positions in bot h years, and a reducti on of 31 Public Safety positions in 2016, and 75 positions in 2017. Position changes by occupat ional group are: Managers/S upervisors increase by 177 and 176 positions in 2016 and 2017, respectively, and Oper ational Hourlies decrease by 154 positions and 197 pos itions due to revised reporting definitions for occupational groups. Professional, Technical, Clerical positions increase by 23 positions. Year over Year 2015 over 2014 Total headcount incr eases by 65 pos itions to 1,845 posit ions mainly d ue to non-reimbursable increases of 61 positions as part of the MTA IT Transformation initiative to provide desktop support for PCs and laptops at all the agencies by in-house staff rather than an off-site/off-shore vendor, five non-reimbursable Public Safety positions resulting from increases for the Moynihan project at Penn Station, partly offset by the elimination of the two-year Excelsio r position in Capital Progr am Management that had been mandated by the New York Stat e. Non-reimbursable positi ons are 1,782 in 2015, and
V-183

reimbursable positions are 63. Occupational grou p increases include 41 positions for Managers/Supervisors to 662 positions, 19 Professional, Technical, Clerical positions to 613, and five Operational Hourly positions to 570. 2016 over 2015, 2017 over 2016 Total headcount remains unchanged at 1,845 positions. 2018 over 2017 In 2018, headcount increases by 30 non-reim bursable MTA PD positions to 1,875 positions due to the revised MT A PD hiring plan for East Side Access in anticipation of its projected opening in 2021. Total non-reimbursabl e headcount increases to 1,812 positions while reim bursable positions rema in unchanged at 63. Operational Hourly positions increase by 30 positions to 600 while Managers/Supervisors and Professional, Technical, Clerical remain unchanged at 662 and 613, respectively.
V-184

2014 2015 2016 2017
2014 February Plan ‐ Total Baseline Positions 1,765 1,769 1,799 1,843
Total Plan-to-Plan Changes (15) (76) (46) (2)
2014 July Plan ‐ Total Baseline Positions 1,780 1,845 1,845 1,845
Total Year-to-Year Changes, July Plan (65) 0 0
Total Plan‐to‐Plan Changes by Reporting Category:
Non‐Reimbursable (13) (74) (44) 0
Reimbursable (2) (2) (2) (2)Total (15) (76) (46) (2)
Full‐Time (15) (76) (46) (2)Full‐Time Equivalents
Total (15) (76) (46) (2)By Function Category ‐ Administration (16) (77) (77) (77) ‐ Operations ‐ Maintenance ‐ Engineering/Capital ‐ Public Safety 1 1 31 75
Total (15) (76) (46) (2)By Occupational Group ‐ Managers/Supervisors (136) (177) (177) (176) ‐ Professional, Technical, Clerical (3) (23) (23) (23) ‐ Operational Hourlies 124 124 154 197
Total (15) (76) (46) (2)
Total Plan‐to‐Plan Changes by Major Category:2014 BRPsNew Needs (13) (74) (74) (74)Change in Reimbursable Positions (2) (2) (2) (2)Re‐estimates & All Other 30 74
Total (15) (76) (46) (2)1 Includes Full‐time Equivalents
MTA HEADQUARTERS
July Financial Plan 2015‐2018Favorable/(Unfavorable)
Total Position Changes at a Glance
V-185

FUNCTION/DEPARTMENT2013
Actual
2014 Mid-Year Forecast
2015 Preliminary
Budget 2016 2017 2018
AdministrationOffice of Chairman 4 5 5 5 5 5Office of Couselor to the Chairman 2 2 2 2 2 2Office of Chief of Staff 6 6 6 6 6 6General Counsel 53 36 36 36 36 36Office of Diversity 25 29 29 29 29 29Labor Relations 5 6 6 6 6 6External Communication 11 13 13 13 13 13PCAC 4 4 4 4 4 4Audit 82 85 85 85 85 85Chief Financial Officer 64 85 85 85 85 85Real Estate 59 63 63 63 63 63Chief Operating Officer 1 2 2 2 2 2Federal Affairs 0 1 1 1 1 1Environmental, Sustain. & Compliance 5 0 0 0 0 0Spec. Project Develop/Planning 6 8 8 8 8 8Corporate Account 0 4 4 4 4 4Intergovernmental Relations 4 5 5 5 5 5Information Technology 56 66 127 127 127 127Corporate and Internal Communications 34 40 40 40 40 40Human Resources 12 14 14 14 14 14Pensions 19 58 58 58 58 58Capital Programs 26 43 42 42 42 42Business Service Center 371 406 406 406 406 406
Total Administration 849 981 1,041 1,041 1,041 1,041
Public Safety 754 799 804 804 804 834
Baseline Total Positions 1,603 1,780 1,845 1,845 1,845 1,875
Non-Reimbursable 1,563 1,717 1,782 1,782 1,782 1,812Reimbursable 40 63 63 63 63 63
Full-Time 1,603 1,780 1,845 1,845 1,845 1,875Full-Time Equivalents - - - - - -
MTA HEADQUARTERSJuly Financial Plan 2015-2018
Total Positions by Function and DepartmentNon-Reimbursable/Reimbursable and Full-Time/Full-Time Equivalents
V-186

FUNCTION/OCCUPATIONAL GROUP
2013 Actual
2014 Mid-Year Forecast
2015 Preliminary
Budget 2016 2017 2018
Administration Managers/Supervisors 388 460 501 501 501 501 Professional, Technical, Clerical 461 521 540 540 540 540 Operational Hourlies
Total Administration 849 981 1,041 1,041 1,041 1,041
Operations Managers/Supervisors Professional, Technical, Clerical Operational Hourlies
Total Operations - - - - - -
Maintenance Managers/Supervisors Professional, Technical, Clerical Operational Hourlies
Total Maintenance - - - - - -
Engineering/Capital Managers/Supervisors Professional, Technical, Clerical Operational Hourlies
Total Engineering/Capital - - - - - -
Public Safety Managers/Supervisors 11 161 161 161 161 161 Professional, Technical, Clerical 64 73 73 73 73 73 Operational Hourlies (Uniformed) 679 565 570 570 570 600
Total Public Safety 754 799 804 804 804 834
Total Positions Managers/Supervisors 399 621 662 662 662 662 Professional, Technical, Clerical 525 594 613 613 613 613 Operational Hourlies 679 565 570 570 570 600
Total Baseline Positions 1,603 1,780 1,845 1,845 1,845 1,875
MTA HEADQUARTERSJuly Financial Plan 2015-2018
Total Positions by Function and Occupation
V-187

MTA Headquarters
MTA Headquarters includes four distinct components: Polic y & Oversight, MTA Consolidated Functions, the Business Service Center, and MTA Security:
MTA HQ, Policy & Oversight incl udes MTA Executive Leadership and policy/oversight functions. All aspects of Administration strive to identify opportunities to streamline expenses and increase efficiencies.
MTA Consolidated Functions includes areas where savings have been achieved through function consolidations or areas w here the work can be more efficiently performed at Headquarters’. As MTA consolidates functions across the Agencies, it is likely that the net budget change associated wit h those functions will increase Headquarters’ costs, while staffing and expense leve ls decrease at a higher level at the Agencies.
The Business Service Center provides shared back-office financial, payroll,
procurement, and human resource services to all agencies.
Public Safety includes the M TA Police which patrols the MTA’s co mmuter railroads, and provides MTA-wide oversig ht of security and s afety services. Public Safety also leads emergency pr eparedness, and interfaces with multiple city, state and federal law enforcement agencies.
The following table breaks out the MTA HQ personnel Budgets by these categories.
V-188

MTA HEADQUARTERSJuly Financial Plan 2015 - 2018
Accrual Statement of Operations by Major Function($ in millions)
NON-REIMBURSABLE 2014 2015 2016 2017 2018
MTA Consolidated FunctionsOperating Revenue $15.291 $4.833 $4.917 $4.994 $5.076
Labor Expenses $11.327 $15.709 $15.131 $15.678 $16.250Non-Labor Expenses 19.331 19.958 16.159 15.902 16.684 Depreciation / OPEB Obligation 1.096 1.330 1.353 1.374 1.397 Total Expenses $31.754 $36.997 $32.644 $32.954 $34.331
Baseline Deficit ($16.463) ($32.164) ($27.727) ($27.959) ($29.255)
MTA HQ, Policy & OversightOperating Revenue $51.204 $51.945 $53.648 $55.452 $57.328
Labor Expenses $39.291 $47.203 $49.579 $50.825 $52.321Non-Labor Expenses 127.974 129.360 129.081 131.118 133.533 Depreciation / OPEB Obligation 113.013 132.917 149.271 162.176 166.675 Total Expenses $280.278 $309.479 $327.931 $344.119 $352.528
Baseline Deficit ($229.074) ($257.535) ($274.283) ($288.667) ($295.200)
Business Service CenterOperating Revenue $0.000 $0.000 $0.000 $0.000 $0.000
Labor Expenses $39.271 $39.924 $41.070 $42.143 $43.261Non-Labor Expenses 20.475 20.631 16.474 16.544 16.837 Depreciation / OPEB Obligation - - - - - Total Expenses $59.746 $60.555 $57.544 $58.686 $60.098
Baseline Deficit ($59.746) ($60.555) ($57.544) ($58.686) ($60.098)
Public SafetyOperating Revenue $0.000 $0.000 $0.000 $0.000 $0.000
Labor Expenses $113.806 $116.992 $116.551 $117.875 $123.044Non-Labor Expenses 9.136 9.535 9.617 9.743 10.626 Depreciation / OPEB Obligation 6.933 6.933 7.054 7.165 7.281 Total Expenses $129.875 $133.460 $133.222 $134.782 $140.951
Baseline Deficit ($129.875) ($133.460) ($133.222) ($134.782) ($140.951)
V-189

FUNCTION2013
Actual
2014 Mid-Year Forecast
2015 Preliminary
Budget 2016 2017 2018
MTA Consolidated Functions 258 329 328 328 328 328 MTA HQ, Policy & Oversight 220 246 307 307 307 307 Business Service Center 371 406 406 406 406 406 Public Safety 754 799 804 804 804 834
Baseline Total Positions 1,603 1,780 1,845 1,845 1,845 1,875
Non-Reimbursable 1,563 1,717 1,782 1,782 1,782 1,812 MTA Consolidated Functions 258 266 265 265 265 265 MTA HQ, Policy & Oversight 220 246 307 307 307 307 Business Service Center 371 406 406 406 406 406 Public Safety 754 799 804 804 804 834
- - - - - -
Reimbursable 40 63 63 63 63 63 MTA Consolidated Functions 40 63 63 63 63 63 MTA HQ, Policy & Oversight - - - - - - Business Service CenterPublic Safety - - - - - -
- - - - - -
Full-Time 1,603 1,780 1,845 1,845 1,845 1,875 Full-Time Equivalents - - - - - -
MTA HEADQUARTERSJuly Financial Plan 2015-2018Total Positions by Function
Non-Reimbursable/Reimbursable and Full-Time Positions/Full-Time Equivalents
V-190

MTA INSPECTOR GENERAL 2015 Preliminary Budget
July Financial Plan 2015-2018 Financial Overview The forecast for the Office of In spector General for the years 2015-2018 reflect the guidelines and assumptions used by MTA Headquarters, and provides adequate resources used to investigate and audit matters of concern throughout the MTA and its subsidiaries. 2014 Mid-Year Forecast In the 2014 Mid-Year Forecast a total of $13.1 million is projected in ba seline expenses, compared to $13.7 million in the 2014 Adopted Budget. The variance is primarily the result of vacancy savings. 2015 Preliminary Budget – Baseline In the 2015 Prelim inary Budget, a total of $13.9 million is projected in bas eline expenses compared to $14.0 million in the February Pl an. The v ariance results from revised fringe benefit forecasting, which is par tially offset by higher maintenance and other operating contracts resulting from the re-estimation of rental and telephone expenses. 2016-2018 Projections The forecast for the Office of Inspector General for the years 2016-2018 reflects inflationary growth according to the prevailing guidelines and assumptions.
V-191

REIMBURSABLE2014 2015
2013 Mid-Year PreliminaryActual Forecast Budget 2016 2017 2018
Revenue
Farebox Revenue $0.000 $0.000 $0.000 $0.000 $0.000 $0.000
Toll Revenue - - - - - - Other Operating Revenue - - - - - - Capital and Other Reimbursements 11.986 13.067 13.930 14.123 14.420 14.735 Total Revenue $11.986 $13.067 $13.930 $14.123 $14.420 $14.735
Expenses
Labor:
Payroll $6.133 $7.165 $7.510 $7.661 $7.787 $7.913Overtime - - - - - - Health and Welfare 0.773 1.086 1.289 1.324 1.393 1.466 OPEB Current Payment - - - - - - Pensions 1.132 1.278 1.355 1.390 1.425 1.464 Other Fringe Benefits 0.444 0.582 0.701 0.668 0.689 0.711 Reimbursable Overhead - - - - - - Total Labor Expenses $8.482 $10.111 $10.855 $11.043 $11.294 $11.554
Non-Labor:
Electric Power $0.000 $0.000 $0.000 $0.000 $0.000 $0.000
Fuel 0.037 0.040 0.040 0.041 0.042 0.043 Insurance 0.018 0.028 0.031 0.033 0.037 0.041 Claims - - - - - - Paratransit Service Contracts - - - - - - Maintenance and Other Operating Contracts 2.375 2.610 2.646 2.692 2.734 2.778 Professional Service Contracts 0.911 0.140 0.196 0.204 0.202 0.206 Materials & Supplies - - - - - - Other Business Expenses 0.109 0.118 0.107 0.110 0.111 0.113 Total Non-Labor Expenses $3.450 $2.936 $3.020 $3.080 $3.126 $3.181
Other Expenses Adjustments:
Other Total Other Expense Adjustments $0.000 $0.000 $0.000 $0.000 $0.000 $0.000
Total Expenses before Depreciation $11.932 $13.047 $13.875 $14.123 $14.420 $14.735
Depreciation 0.054 0.020 0.055 0.000 0.000 0.000
Total Expenses $11.986 $13.067 $13.930 $14.123 $14.420 $14.735
Baseline Surplus/(Deficit) $0.000 $0.000 $0.000 $0.000 $0.000 $0.000
MTA INSPECTOR GENERALJuly Financial Plan 2015 - 2018
Accrual Statement of Operations by Category($ in millions)
V-192

CASH RECEIPTS AND EXPENDITURES0 2014 2015 0 0 0
2013 Mid-Year Preliminary 0 0 0Actual Forecast Budget 2016 2017 2018
Receipts
Farebox Revenue $0.000 $0.000 $0.000 $0.000 $0.000 $0.000
Vehicle Toll Revenue - - - - - - Other Operating Revenue - - - - - - Capital and Other Reimbursements 11.932 13.047 13.875 14.123 14.420 14.735 Total Receipts $11.932 $13.047 $13.875 $14.123 $14.420 $14.735
Expenditures
Labor:
Payroll $6.133 $7.165 $7.510 $7.661 $7.787 $7.913Overtime - - - - - - Health and Welfare 0.773 1.086 1.289 1.324 1.393 1.466 OPEB Current Payment - - - - - - Pensions 1.132 1.278 1.355 1.390 1.425 1.464 Other Fringe Benefits 0.444 0.582 0.701 0.668 0.689 0.711 GASB Account - - - - - - Reimbursable Overhead - - - - - - Total Labor Expenditures $8.482 $10.111 $10.855 $11.043 $11.294 $11.554
Non-Labor:
Electric Power $0.000 $0.000 $0.000 $0.000 $0.000 $0.000
Fuel 0.037 0.040 0.040 0.041 0.042 0.043 Insurance 0.018 0.028 0.031 0.033 0.037 0.041 Claims - - - - - - Paratransit Service Contracts - - - - - - Maintenance and Other Operating Contracts 2.375 2.610 2.646 2.692 2.734 2.778 Professional Service Contracts 0.911 0.140 0.196 0.204 0.202 0.206 Materials & Supplies - - - - - - Other Business Expenses 0.109 0.118 0.107 0.110 0.111 0.113 Total Non-Labor Expenditures $3.450 $2.936 $3.020 $3.080 $3.126 $3.181
Other Expenditure Adjustments:
Other - Operating Capital $0.000 $0.000 $0.000 $0.000 $0.000 $0.000Total Other Expenditure Adjustments $0.000 $0.000 $0.000 $0.000 $0.000 $0.000
Total Expenditures $11.932 $13.047 $13.875 $14.123 $14.420 $14.735
Baseline Cash Deficit $0.000 $0.000 $0.000 $0.000 $0.000 $0.000
MTA INSPECTOR GENERALJuly Financial Plan 2015 - 2018Cash Receipts & Expenditures
($ in millions)
V-193

CASH FLOW ADJUSTMENTS
0 2014 2015 0 0 02013 Mid-Year Preliminary 0 0 0
Actual Forecast Budget 2016 2017 2018
Receipts
Farebox Revenue $0.000 $0.000 $0.000 $0.000 $0.000 $0.000Vehicle Toll Revenue - - - - - - Other Operating Revenue - - - - - - Capital and Other Reimbursements (0.054) (0.020) (0.055) - - - Total Receipts ($0.054) ($0.020) ($0.055) $0.000 $0.000 $0.000
Expenditures
Labor:
Payroll $0.000 $0.000 $0.000 $0.000 $0.000 $0.000Overtime - - - - - - Health and Welfare - - - - - - OPEB Current Payment - - - - - - Pensions - - - - - - Other Fringe Benefits - - - - - - GASB Account - - - - - - Reimbursable Overhead - - - - - - Total Labor Expenditures $0.000 $0.000 $0.000 $0.000 $0.000 $0.000
Non-Labor:
Electric Power $0.000 $0.000 $0.000 $0.000 $0.000 $0.000Fuel - - - - - - Insurance - - - - - - Claims - - - - - - Paratransit Service Contracts - - - - - - Maintenance and Other Operating Contracts - - - - - - Professional Service Contracts - - - - - - Materials & Supplies - - - - - - Other Business Expenditures - - - - - - Total Non-Labor Expenditures $0.000 $0.000 $0.000 $0.000 $0.000 $0.000
Other Expenditures Adjustments:
Other - Operating Capital $0.000 $0.000 $0.000 $0.000 $0.000 $0.000Total Other Expenditures Adjustments $0.000 $0.000 $0.000 $0.000 $0.000 $0.000
Total Cash Conversion Adjustments before Depreciation ($0.054) ($0.020) ($0.055) $0.000 $0.000 $0.000
Depreciation 0.054 0.020 0.055 0.000 0.000 0.000
Total Cash Conversion Adjustments $0.000 $0.000 $0.000 $0.000 $0.000 $0.000
Cash Conversion (Cash Flow Adjustments)($ in millions)
MTA INSPECTOR GENERALJuly Financial Plan 2015 - 2018
V-194

REIMBURSABLE
2014 2015Change
2015 - 2014 2016Change
2016 - 2015 2017Change
2017 - 2016 2018Change
2018 - 2017RevenueFarebox Revenue $0.000 $0.000 $0.000 $0.000 $0.000 $0.000 $0.000 $0.000 $0.000Vehicle Toll Revenue - - - - - - - - -
Other Operating Revenue - - - - - - - - -
Capital and Other Reimbursements 13.067 13.930 0.863 14.123 0.193 14.420 0.297 14.735 0.315Total Revenue $13.067 $13.930 $0.863 $14.123 $0.193 $14.420 $0.297 $14.735 $0.315
ExpensesLabor:Payroll $7.165 $7.510 ($0.345) $7.661 ($0.151) $7.787 ($0.126) $7.913 ($0.126)Overtime - - - - - - - - -
Health and Welfare 1.086 1.289 (0.203) 1.324 (0.035) 1.393 (0.069) 1.466 (0.073)OPEB Current Payment - - - - - - - - -
Pensions 1.278 1.355 (0.077) 1.390 (0.035) 1.425 (0.035) 1.464 (0.039)Other Fringe Benefits 0.582 0.701 (0.119) 0.668 0.033 0.689 (0.021) 0.711 (0.022)Reimbursable Overhead - - - - - - - - -
Total Labor Expenses $10.111 $10.855 ($0.744) $11.043 ($0.188) $11.294 ($0.251) $11.554 ($0.260)
Non-Labor:Electric Power $0.000 $0.000 $0.000 $0.000 $0.000 $0.000 $0.000 $0.000 $0.000Fuel 0.040 0.040 0.000 0.041 (0.001) 0.042 (0.001) 0.043 (0.001)Insurance 0.028 0.031 (0.003) 0.033 (0.002) 0.037 (0.004) 0.041 (0.004)Claims - - - - - - - - -
Paratransit Service Contracts - - - - - - - - -
Maintenance and Other Operating Contracts 2.610 2.646 (0.036) 2.692 (0.046) 2.734 (0.042) 2.778 (0.044)Professional Service Contracts 0.140 0.196 (0.056) 0.204 (0.008) 0.202 0.002 0.206 (0.004)Materials & Supplies - - - - - - - - -
MTA Internal Subsidy - - - - - - - - -
Other Business Expenses 0.118 0.107 0.011 0.110 (0.003) 0.111 (0.001) 0.113 (0.002)Total Non-Labor Expenses $2.936 $3.020 ($0.084) $3.080 ($0.060) $3.126 ($0.046) $3.181 ($0.055)
Other Expenses Adjustments:Other $0.000 $0.000 $0.000 $0.000 $0.000 $0.000 $0.000 $0.000 $0.000Total Other Expense Adjustments $0.000 $0.000 $0.000 $0.000 $0.000 $0.000 $0.000 $0.000 $0.000
Total Expenses before Depreciation $13.047 $13.875 ($0.828) $14.123 ($0.248) $14.420 ($0.297) $14.735 ($0.315)
Depreciation 0.020 0.055 (0.035) 0.000 0.055 0.000 0.000 0.000 0.000
Total Expenses $13.067 $13.930 ($0.863) $14.123 ($0.193) $14.420 ($0.297) $14.735 ($0.315)
Baseline Surplus/(Deficit) $0.000 $0.000 $0.000 $0.000 ($0.000) $0.000 $0.000 $0.000 ($0.000)
MTA INSPECTOR GENERALJuly Financial Plan 2015 - 2018
Year-to-Year Changes by Category - Accrual Basis($ in millions)
Favorable/(Unfavorable)
V-195

CASH RECEIPTS & EXPENDITURES
2014 2015Change
2015 - 2014 2016Change
2016 - 2015 2017Change
2017 - 2016 2018Change
2018 - 2017
ReceiptsFarebox Revenue $0.000 $0.000 $0.000 $0.000 $0.000 $0.000 $0.000 $0.000 $0.000Vehicle Toll Revenue - - - - - - - - -
Other Operating Revenue - - - - - - - - -
Capital and Other Reimbursements 13.047 13.875 0.828 14.123 0.248 14.420 0.297 14.735 0.315Total Receipts $13.047 $13.875 $0.828 $14.123 $0.248 $14.420 $0.297 $14.735 $0.315
ExpendituresLabor:Payroll $7.165 $7.510 ($0.345) $7.661 ($0.151) $7.787 ($0.126) $7.913 ($0.126)Overtime - - - - - - - - -
Health and Welfare 1.086 1.289 (0.203) 1.324 (0.035) 1.393 (0.069) 1.466 (0.073)OPEB Current Payment - - 0.000 - 0.000 - 0.000 - 0.000Pensions 1.278 1.355 (0.077) 1.390 (0.035) 1.425 (0.035) 1.464 (0.039)Other Fringe Benefits 0.582 0.701 (0.119) 0.668 0.033 0.689 (0.021) 0.711 (0.022)GASB Account - - - - - - - - -
Reimbursable Overhead - - - - - - - - -
Total Labor Expenditures $10.111 $10.855 ($0.744) $11.043 ($0.188) $11.294 ($0.251) $11.554 ($0.260)
Non-Labor:Electric Power $0.000 $0.000 $0.000 $0.000 $0.000 $0.000 $0.000 $0.000 $0.000Fuel 0.040 0.040 0.000 0.041 (0.001) 0.042 (0.001) 0.043 (0.001)Insurance 0.028 0.031 (0.003) 0.033 (0.002) 0.037 (0.004) 0.041 (0.004)Claims - - - - - - - - -
Paratransit Service Contracts - - - - - - - - -
Maintenance and Other Operating Contracts 2.610 2.646 (0.036) 2.692 (0.046) 2.734 (0.042) 2.778 (0.044)Professional Service Contracts 0.140 0.196 (0.056) 0.204 (0.008) 0.202 0.002 0.206 (0.004)Materials & Supplies 0.000 0.000 0.000 0.000 0.000 0.000 0.000 0.000 0.000MTA Internal Subsidy - - - - - - - - -
Other Business Expenses 0.118 0.107 0.011 0.110 (0.003) 0.111 (0.001) 0.113 (0.002)Total Non-Labor Expenditures $2.936 $3.020 ($0.084) $3.080 ($0.060) $3.126 ($0.046) $3.181 ($0.055)
Other Expenditure Adjustments:Other $0.000 $0.000 $0.000 $0.000 $0.000 $0.000 $0.000 $0.000 $0.000Total Other Expenditure Adjustments $0.000 $0.000 $0.000 $0.000 $0.000 $0.000 $0.000 $0.000 $0.000
Total Expenditures $13.047 $13.875 ($0.828) $14.123 ($0.248) $14.420 ($0.297) $14.735 ($0.315)
Baseline Cash Deficit $0.000 $0.000 0.000 $0.000 0.000 $0.000 0.000 $0.000 0.000
Favorable/(Unfavorable)
MTA INSPECTOR GENERALJuly Financial Plan 2015 - 2018
Year-to-Year Changes by Category - Cash Basis($ in millions)
V-196

REIMBURSABLE
2014 2015 2016 2017
2014 February Financial Plan - Operating Cash Income/(Deficit) $0.000 $0.000 $0.000 $0.000
Baseline:
Changes
Revenue:Capital and Other Reimbursements (0.665) (0.029) (0.187) (0.209)
Sub-Total Revenue Changes ($0.665) ($0.029) ($0.187) ($0.209)
Expenses:Payroll $0.345 $0.124 $0.126 $0.129Overtime - - - - Health and Welfare 0.160 0.008 0.052 0.066OPEB Current Payment - - - - Pensions 0.068 0.027 0.027 0.028Other Fringe Benefits 0.022 (0.047) 0.011 0.011Reimbursable Overhead - - - - Fuel 0.022 0.026 0.027 0.030Insurance (0.003) (0.003) (0.002) (0.003)Claims - - - - Paratransit Service Contracts - - - - Maintenance and Other Operating Contracts (0.172) (0.168) (0.168) (0.173)Professional Service Contracts 0.139 0.088 0.085 0.091Materials & Supplies - - - - Other Business Expenses 0.016 0.029 0.029 0.030Depreciation 0.068 (0.055) 0.000 0.000
Sub-Total Expense Changes $0.665 $0.029 $0.187 $0.209
Cash Adjustments:
Revenue Expense
Sub-Total Cash Adjustment Changes $0.000 $0.000 $0.000 $0.000
Total Baseline Changes $0.000 $0.000 $0.000 $0.000
Total Changes $0.000 $0.000 $0.000 $0.000
2014 July Financial Plan - Operating Cash Income/(Deficit) $0.000 $0.000 $0.000 $0.000
Summary of Changes Between Financial Plans by Generic Categories($ in millions)
MTA INSPECTOR GENERALJuly Financial Plan 2015 - 2018
V-197

2013Actual
2014 Mid-Year Forecast
2015 Preliminary
Budget 2016 2017 2018Administration
Office of the Inspector General 69 86 86 86 86 86Total Administration 69 86 86 86 86 86
Baseline Total Positions 69 86 86 86 86 86
Non-Reimbursable - - - - - - Reimbursable 69 86 86 86 86 86Total 69 86 86 86 86 86
Total Full-Time 69 86 86 86 86 86Total Full-Time Equivalents - - - - - -
FUNCTION/DEPARTMENT
MTA INSPECTOR GENERALJuly Financial Plan 2015 - 2018
Non-Reimbursable/Reimbursable and Full-Time Positions/Full Time EquivalentsTotal Positions by Function and Department
V-198

First Mutual Transportation Assurance Co. (FMTAC)

MTA FIRST MUTUAL TRANSPORTATION ASSURANCE COMPANY 2015 Preliminary Budget
July Financial Plan for 2015 - 2018 Mission Statement and Highlights of Operations The mission of the First Mutual Transporta tion Assurance Company (FMTAC) is to ac t as a pure captive ins urance company under Section 7005, Article 70 of the Insurance Law and Section 1266 subdiv ision 5 of the Public Authoritie s Law of the State of New York. FMTAC’s mission is to continue, de velop, and improve the insurance and ris k management needs as required by the MTA. FMTAC was established to maximize the flexibility and effectiveness of the MTA’s insurance program, while minimizing costs. FINANCIAL OVERVIEW FMTAC continues to utilize de dicated resources to efficiently ad dress the challenges related to insurance and risk management for the MTA. FMTAC continues to draw from the expertise and support services availabl e in other MTA agencies and outside service providers to support risk management. This is reflected in the current budget proposal. For all years, on a cash basis, FMTAC generates a net cash deficit of zero, which is the true cash impact of FMTAC on MTA cash balances. FMTAC cash reserves ar e separate and distinct from MT A and are necessary to maintain the appropriate capital and reserve levels pursuant to the State of New York Insurance guidelines. Insurance premiums from the Agencies (re venue) are recorded as credits to the Insurance expense line. Premiums are in creasing 10% annually wit h the exception of the Casualty Owner-Controlled Insurance Program (OCIP) pr ograms which earn premium based on a percentage of contract completion calculation. Additional expenses consist primarily of Claims and Other Business Expenses.
V-199

MTA FIRST MUTUAL TRANSPORTATION ASSURANCE COMPANY 2015 Preliminary Budget
July Financial Plan 2015 - 2018 2014 Mid-Year Forecast In the 2014 Mid-Year Forecast, a total of $ 17.2 million is projected in Baseline Surplus compared to the $2.6 million Baseline Defici t in the 2014 Ad opted Budget. This consists of a $23.9 million increa se in revenues and $4.1 million increase in expenses. The favorable outcome is primarily a result of higher Investment Income (change in net unrealized gains and losses from investm ents) and offset by decreased Insuranc e premium revenue (recorded as credits to the In surance expense line) than projected in the 2014 Adopted Budget. Claims are based on ac tuarial analysis of claim activity on an estimated bas is. Revenue and Other Business Expenses are based on trending actual results through April 2014. 2015 Preliminary Budget In the 2015 Preliminary Budget, a total of $ 22.2 million is projected in Baseline Surplus compared to the $3.9 million Baseline Surplus in the February Plan. This consists of a $24.2 million increase in revenues and $5.9 million increase in expenses. The favorable outcome is primarily a result of higher Investment Income (change in net unrealized gains and losses from inve stments) and offset by decreas ed Insurance premium revenue (recorded as credits to the Insurance expense line) than projected in the 2014 Adopted Budget. Claims are based on act uarial analysis of c laim activity on an estimated basis. 2016 – 2018 Projections 2016 – 2018 Projections are repr esentative of 2014 projecti ons with market increases. Investment Income and Other Operating Re venue are estimated to increase over 2014 projections at a rate equal to CPI . Claims are based on actuarial analys is of projected claims activities and adjus tments, whether favorable or unfavorable in required reserves. Other Business Expenses are es timated to increase over 2014 at a rate of 2% each year.
V-200

NON-REIMBURSABLE
2014 2015
2013 Mid-Year Preliminary
Actual Forecast Budget 2016 2017 2018
Operating Revenue
Farebox Revenue $0.000 $0.000 $0.000 $0.000 $0.000 $0.000Toll Revenue - - - - - - Other Operating Revenue 10.614 11.607 11.799 12.004 12.192 12.391Investment Income (7.768) 12.447 12.652 12.873 13.075 13.288Capital and Other Reimbursements - - - - - - Total Revenue $2.846 $24.054 $24.451 $24.876 $25.267 $25.679
Operating Expenses
Labor:
Payroll $0.000 $0.000 $0.000 $0.000 $0.000 $0.000Overtime - - - - - - Health and Welfare - - - - - - Pensions - - - - - - Other Fringe Benefits - - - - - - Reimbursable Overhead - - - - - - Total Labor Expenses $0.000 $0.000 $0.000 $0.000 $0.000 $0.000
Non-Labor:
Electric Power $0.000 $0.000 $0.000 $0.000 $0.000 $0.000Fuel for Buses and Trains - - - - - - Insurance (74.762) (84.224) (89.996) (96.691) (104.357) (113.050)Claims 90.810 79.291 80.188 76.992 82.012 81.764Paratransit Service Contracts - - - - - - Maintenance and Other Operating Contracts - - - - - - Professional Service Contracts - - - - - - Materials & Supplies - - - - - - Other Business Expenses 12.061 11.793 12.029 12.269 12.515 12.765 Total Non-Labor Expenses $28.109 $6.860 $2.221 ($7.430) ($9.830) ($18.521)
Other Expenses Adjustments:
Other $0.000 $0.000 $0.000 $0.000 $0.000 $0.000Total Other Expense Adjustments $0.000 $0.000 $0.000 $0.000 $0.000 $0.000
Total Expenses before Depreciation $28.109 $6.860 $2.221 ($7.430) ($9.830) ($18.521)
Depreciation - - - - - -
Total Expenses $28.109 $6.860 $2.221 ($7.430) ($9.830) ($18.521)
Baseline Surplus/(Deficit) ($25.263) $17.194 $22.230 $32.306 $35.097 $44.200
MTA FIRST MUTUAL TRANSPORTATION ASSURANCE COMPANYJuly Financial Plan 2015 - 2018
Accrual Statement of Operations by Category
($ in millions)
V-201

CASH RECEIPTS AND EXPENDITURES
2014 20152013 Mid-Year Preliminary
Actual Forecast Budget 2016 2017 2018
Receipts
Farebox Revenue $0.000 $0.000 $0.000 $0.000 $0.000 $0.000Vehicle Toll Revenue - - - - - - Other Operating Revenue 10.614 11.607 11.799 12.004 12.192 12.391Investment Income (7.768) 12.447 12.652 12.873 13.075 13.288Capital and Other Reimbursements - - - - - - Total Receipts $2.846 $24.054 $24.451 $24.876 $25.267 $25.679
Expenditures
Labor:
Payroll $0.000 $0.000 $0.000 $0.000 $0.000 $0.000Overtime - - - - - - Health and Welfare - - - - - - Pensions - - - - - - Other Fringe Benefits - - - - - - GASB Account - - - - - - Reimbursable Overhead - - - - - - Total Labor Expenditures $0.000 $0.000 $0.000 $0.000 $0.000 $0.000
Non-Labor:
Electric Power $0.000 $0.000 $0.000 $0.000 $0.000 $0.000Fuel for Buses and Trains - - - - - - Insurance (74.762) (84.224) (89.996) (96.691) (104.357) (113.050)Claims 90.810 74.104 74.942 71.955 75.937 75.708Paratransit Service Contracts - - - - - - Maintenance and Other Operating Contracts - - - - - - Professional Service Contracts - - - - - - Materials & Supplies - - - - - - Other Business Expenses 12.061 11.793 12.029 12.269 12.515 12.765 Total Non-Labor Expenditures $28.109 $1.673 ($3.025) ($12.467) ($15.905) ($24.577)
Other Expenditure Adjustments:
Other - Restricted Cash Adjustment (25.263) $22.381 $27.476 $37.343 $41.172 $50.256Total Other Expenditure Adjustments ($25.263) $22.381 $27.476 $37.343 $41.172 $50.256
Total Expenditures $2.846 $24.054 $24.451 $24.876 $25.267 $25.679
Baseline Cash Deficit $0.000 $0.000 $0.000 $0.000 $0.000 $0.000
MTA FIRST MUTUAL TRANSPORTATION ASSURANCE COMPANYJuly Financial Plan 2015 - 2018Cash Receipts & Expenditures
($ in millions)
V-202

CASH FLOW ADJUSTMENTS
2014 2015
2013 Mid-Year Preliminary
Actual Forecast Budget 2016 2017 2018
Receipts
Farebox Revenue $0.000 $0.000 $0.000 $0.000 $0.000 $0.000Vehicle Toll Revenue - - - - - - Other Operating Revenue 0.000 0.000 0.000 0.000 0.000 0.000Investment Income 0.000 0.000 0.000 0.000 0.000 0.000Capital and Other Reimbursements - - - - - - Total Receipts $0.000 $0.000 $0.000 $0.000 $0.000 $0.000
Expenditures
Labor:
Payroll $0.000 $0.000 $0.000 $0.000 $0.000 $0.000Overtime - - - - - - Health and Welfare - - - - - - Pensions - - - - - - Other Fringe Benefits - - - - - - GASB Account - - - - - - Reimbursable Overhead - - - - - - Total Labor Expenditures $0.000 $0.000 $0.000 $0.000 $0.000 $0.000
Non-Labor:
Electric Power $0.000 $0.000 $0.000 $0.000 $0.000 $0.000Fuel for Buses and Trains - - - - - - Insurance 0.000 0.000 0.000 0.000 0.000 0.000Claims 0.000 5.187 5.246 5.037 6.075 6.056Paratransit Service Contracts - - - - - - Maintenance and Other Operating Contracts - - - - - - Professional Service Contracts - - - - - - Materials & Supplies - - - - - - Other Business Expenditures - - - - - - Total Non-Labor Expenditures $0.000 $5.187 $5.246 $5.037 $6.075 $6.056
Other Expenditures Adjustments:
Other $25.263 ($22.381) ($27.476) ($37.343) ($41.172) ($50.256)Total Other Expenditures Adjustments $25.263 ($22.381) ($27.476) ($37.343) ($41.172) ($50.256)
Total Cash Conversion Adjustments before Depreciation
$25.263 ($17.194) ($22.230) ($32.306) ($35.097) ($44.200)
Depreciation Adjustment - - - - - -
Total Cash Conversion Adjustments $25.263 ($17.194) ($22.230) ($32.306) ($35.097) ($44.200)
MTA FIRST MUTUAL TRANSPORTATION ASSURANCE COMPANYJuly Financial Plan 2015 - 2018
Cash Conversion (Cash Flow Adjustments)($ in millions)
V-203

MTA FIRST MUTUAL TRANSPORTATION ASSURANCE COMPANY
July Financial Plan 2015 - 2018 Year-to-Year Changes by Category Baseline Narrative
Revenue Investment Income
A majority of Investment income is derived through FMTAC based on the managed investments managed.
Investment income is pr ojected based on the MTA Re gion All Urban Consumer
CPI inflation rates as provided in t he Economic and Demographic Forec asts, dated April 1, 2014.
Other Operating Revenue
This is the realiz ed earned investm ent income from bonds and eq uity investments.
Expenses Insurance
Insurance (premiums paid to FMTAC) is from the 2014 Mid-Year Forecast of the MTA Summary & Detailed Agency Insurance Cash Budgets and are based on increases in the market and expos ure, as well as increases in the claims expense and reserve adjustments. For the Casualty Owner-Controlled Insurance Program (OCIP) programs, an estimated of earned prem ium is also included, which is calculated based on percentage of contract completion.
Insurance (premiums) are estimated to increase 10%.
Claims
Claims expenses are determi ned by actuarial projecti on for 2015 – 2018 act ual claim expense paid and any adjustment ei ther favorable or unfavorable to reserves. In addition to the actuarial analysis, the claims increase follows simultaneously with the factors of the growth in expos ure (i.e. vehicle count) and higher insurance premiums.
V-204

Other Business Expenses
Other Business Expenses increase 2% for 2015 – 2018 and are representative of general increases for professional servic es provided and expenses not directly related to claims.
Restricted Cash Adjustment
Restricted cash grows as the net baseline surplus increases. Factors attributing to this growth are insurance premiums and related claims expenses.
V-205

NON-REIMBURSABLE
2014 2015Change
2015 - 2014 2016Change
2016 - 2015 2017Change
2017 - 2016 2018Change
2018 - 2017RevenueFarebox Revenue $0.000 $0.000 $0.000 $0.000 $0.000 $0.000 $0.000 $0.000 $0.000Vehicle Toll Revenue - - 0.000 - 0.000 - 0.000 - 0.000Other Operating Revenue 11.607 11.799 0.192 12.004 0.205 12.192 0.188 12.391 0.199Investment Income 12.447 12.652 0.205 12.873 0.220 13.075 0.202 13.288 0.213Capital and Other ReimbursementTotal Revenue $24.054 $24.451 $0.397 $24.876 $0.425 $25.267 $0.391 $25.679 $0.412
ExpensesLabor:Payroll $0.000 $0.000 $0.000 $0.000 $0.000 $0.000 $0.000 $0.000 $0.000Overtime - - 0.000 - 0.000 - 0.000 - 0.000Health and Welfare - - 0.000 - 0.000 - 0.000 - 0.000OPEB Current Payment - - 0.000 - 0.000 - 0.000 - 0.000Pensions - - 0.000 - 0.000 - 0.000 - 0.000Other Fringe Benefits - - 0.000 - 0.000 - 0.000 - 0.000Reimbursable Overhead - - 0.000 - 0.000 - 0.000 - 0.000Total Labor Expenses $0.000 $0.000 $0.000 $0.000 $0.000 $0.000 $0.000 $0.000 $0.000
Non-Labor:Electric Power $0.000 $0.000 $0.000 $0.000 $0.000 $0.000 $0.000 $0.000 $0.000Insurance (84.224) (89.996) 5.772 (96.691) 6.695 (104.357) 7.666 (113.050) 8.693Claims 79.291 80.188 (0.897) 76.992 3.196 82.012 (5.020) 81.764 0.248Paratransit Service Contracts - - 0.000 - 0.000 - 0.000 - 0.000Maintenance and Other Operating Contracts - - 0.000 - 0.000 - 0.000 - 0.000Professional Service Contracts - - 0.000 - 0.000 - 0.000 - 0.000Materials & Supplies - - 0.000 - 0.000 - 0.000 - 0.000Other Business Expenses 11.793 12.029 (0.236) 12.269 (0.241) 12.515 (0.245) 12.765 (0.250)Total Non-Labor Expenses $6.860 $2.221 $4.639 ($7.430) $9.650 ($9.830) $2.401 ($18.521) $8.691
Other Expenses Adjustments:Other - - 0.000 - 0.000 - 0.000 - 0.000Total Other Expense Adjustments $0.000 $0.000 $0.000 $0.000 $0.000 $0.000 $0.000 $0.000 $0.000
Total Expenses before Depreciation $6.860 $2.221 $4.639 ($7.430) $9.650 ($9.830) $2.401 ($18.521) $8.691
Depreciation - - 0.000 - 0.000 - 0.000 - 0.000
Total Expenses $6.860 $2.221 $4.639 ($7.430) $9.650 ($9.830) $2.401 ($18.521) $8.691
Baseline Surplus/(Deficit) $17.194 $22.230 $5.036 $32.306 $10.076 $35.097 $2.791 $44.200 $9.103
MTA FIRST MUTUAL TRANSPORTATION ASSURANCE COMPANYJuly Financial Plan 2015 - 2018
Year-to-Year Changes by Category - Accrual Basis($ in millions)
Favorable/(Unfavorable)
V-206

CASH RECEIPTS & EXPENDITURES
2014 2015Change
2015 - 2014 2016Change
2016 - 2015 2017Change
2017 - 2016 2018Change
2018 - 2017
ReceiptsFarebox Revenue $0.000 $0.000 $0.000 $0.000 $0.000 $0.000 $0.000 $0.000 $0.000Vehicle Toll Revenue - - 0.000 - 0.000 - 0.000 - 0.000Other Operating Revenue 11.607 11.799 0.192 12.004 0.205 12.192 0.188 12.391 0.199Investment Income 12.447 12.652 0.205 12.873 0.220 13.075 0.202 13.288 0.213Capital and Other ReimbursementTotal Receipts $24.054 $24.451 $0.397 $24.876 $0.425 $25.267 $0.391 $25.679 $0.412
ExpendituresLabor:Payroll $0.000 $0.000 $0.000 $0.000 $0.000 $0.000 $0.000 $0.000 $0.000Overtime - - 0.000 - 0.000 - 0.000 - 0.000Health and Welfare - - 0.000 - 0.000 - 0.000 - 0.000OPEB Current Payment - - 0.000 - 0.000 - 0.000 - 0.000Pensions - - 0.000 - 0.000 - 0.000 - 0.000Other Fringe Benefits - - 0.000 - 0.000 - 0.000 - 0.000GASB Account - - 0.000 - 0.000 - 0.000 - 0.000Reimbursable Overhead - - 0.000 - 0.000 - 0.000 - 0.000Total Labor Expenditures $0.000 $0.000 $0.000 $0.000 $0.000 $0.000 $0.000 $0.000 $0.000
Non-Labor:Electric Power $0.000 $0.000 $0.000 $0.000 $0.000 $0.000 $0.000 $0.000 $0.000Insurance (84.224) (89.996) 5.772 (96.691) 6.695 (104.357) 7.666 (113.050) 8.693Claims 74.104 74.942 (0.838) 71.955 2.987 75.937 (3.982) 75.708 0.229Paratransit Service Contracts - - 0.000 - 0.000 - 0.000 - 0.000Maintenance and Other Operating Contracts - - 0.000 - 0.000 - 0.000 - 0.000Professional Service Contracts - - 0.000 - 0.000 - 0.000 - 0.000Materials & Supplies - - 0.000 - 0.000 - 0.000 - 0.000Other Business Expenses 11.793 12.029 (0.236) 12.269 (0.241) 12.515 (0.245) 12.765 (0.250)Total Non-Labor Expenditures $1.673 ($3.025) $4.698 ($12.467) $9.441 ($15.905) $3.439 ($24.577) $8.672
Other Expenditure Adjustments:Other 22.381 27.476 (5.095) 37.343 (9.867) 41.172 (3.829) 50.256 (9.084)Total Other Expenditure Adjustments $22.381 $27.476 ($5.095) $37.343 ($9.867) $41.172 ($3.829) $50.256 ($9.084)
Total Expenditures $24.054 $24.451 ($0.397) $24.876 ($0.425) $25.267 ($0.391) $25.679 ($0.412)
Baseline Cash Deficit $0.000 $0.000 $0.000 $0.000 $0.000 $0.000 $0.000 $0.000 $0.000
Year-to-Year Changes by Category - Accrual Basis($ in millions)
Favorable/(Unfavorable)
MTA FIRST MUTUAL TRANSPORTATION ASSURANCE COMPANYJuly Financial Plan 2015 - 2018
V-207

MTA FIRST MUTUAL TRANSPORTATION ASSURANCE COMPANY July Financial Plan 2015 - 2018
Summary of Changes Between Financial Plans by Category 2014 – 2017 July Financial Plan vs February Financial Plan Revenue Revenue changes from the February Plan over the 2014 – 2017 periods include:
The increased baseline estimate for 2014 is due to increase inv estment income (change in net unrealized gains and losses from investment s) for the first four months of 2014. For 2015 – 2017, the inc reased baseline estimate for 2014 is then projected based on the MTA Region A ll Urban Consumer CPI inflation rates as provided in the Economic and Demographic Forecasts April 1, 2014.
Expenses Expense changes from the February Plan over the 2014 – 2017 periods include:
A decrease in Insurance (premium revenu e) as projected in the 2014 Mid- Year Forecast of the MTA Summary & Detailed Agency Insurance Cash Budgets.
Claim expenses res ulted in favorable developments due t o updated loss
projections from actuarial projections.
Other Business Expenses increased due to updated estimates based on actual results through April 2014. The inflation rate for Ot her Business Expenses is expected to increase 2% per year.
V-208

NON-REIMBURSABLE2014 2015 2016 2017
$0.000 $0.000 $0.000 $0.000
Baseline Changes
RevenueFarebox Revenue $0.000 $0.000 $0.000 $0.000Vehicle Toll Revenue - - - - Other Operating Revenue (0.397) (0.399) (0.422) (0.418)Investment Income 24.268 24.665 25.110 25.493Capital and Other Reimbursement - - - -
Total Revenue Changes $23.872 $24.266 $24.688 $25.075
ExpensesLabor:Payroll $0.000 $0.000 $0.000 $0.000Health and Welfare - - - - OPEB Current Payment - - - - Pensions - - - - Other Fringe Benefits - - - - Reimbursable Overhead - - - -
Total Labor Expense Changes $0.000 $0.000 $0.000 $0.000
Non-Labor:Electric Power $0.000 $0.000 $0.000 $0.000Insurance (4.197) (5.819) (8.013) (10.876)Claims 1.432 1.252 4.127 (0.087)Paratransit Service Contracts - - - - Maintenance and Other Operating Contracts - - - - Materials & Supplies - - - - Other Business Expenses (1.315) (1.341) (1.368) (1.395)
Total Non-Labor Expense Changes ($4.080) ($5.908) ($5.254) ($12.358)
Total Expenses before Depreciation and GASB Adjs.
Depreciation $0.000 $0.000 $0.000 $0.000OPEB Obligation - - - - Environmental Remediation - - - -
Total Expense Changes ($4.080) ($5.908) ($5.254) ($12.358)
Cash Adjustment Changes
0.000 0.000 0.000 0.000
(0.094) (0.787) (1.661) (1.373)0.000 0.000 0.000 0.000
Total Expense Changes (0.094) (0.787) (1.661) (1.373)
(19.698) (17.571) (17.773) (11.344)
Total Cash Adjustment Changes ($19.792) ($18.358) ($19.434) ($12.717)
$0.000 $0.000 $0.000 $0.000
$0.000 $0.000 $0.000 $0.000
Claims
Restricted Cash Adjustment
MTA FIRST MUTUAL TRANSPORTATION ASSURANCE COMPANYJuly Financial Plan 2015 - 2018
Changes Between Financial Plans by Generic Categories
Expenses:
($ in millions)
February Financial Plan - Cash Surplus/(Deficit)
Revenue:Other Operating Revenue
Other Business Expenses
Total Baseline Changes
July Financial Plan - Cash Surplus/(Deficit)
V-209

[THIS PAGE INTENTIONALLY LEFT BLANK]
V-210

New York City Transit

MTA NEW YORK CITY TRANSIT 2015 Preliminary Budget
July Financial Plan 2015 – 2018 FINANCIAL OVERVIEW MTA New York City Transit remains committed to providin g safe, secure and reliable services. Reflecting the recent settlement with the Transport Workers Union (TWU), this July Plan assum es the same pattern settlement for employees represented by unions without contract agreements. This as sumption projects costs that are in exces s of the February Plan provision, and a portion of this additional cost will be funded by the suspension of contributions to the GASB account. Funding is also provided in this plan to fund several impor tant initiatives critical in meetin g NYCT’s maintenance needs. A new Budget Reduction Program has been established, supported by several initiatives. All other expense/cash changes are either from re-estimates, adjustments reflecting the impact of inflation, or the projected timing of expenses, payments or reimbursements. Important programmatic initiatives, included in this financial plan, are summarized a s follows:
Bus Maintenance-Overage Fleet. 66 positions with co sts of $6.4 millio n in 2014, 48 positions with costs of $4.7 milli on in 2015 and costs of $2.8 million in 2016 are necessary to meet maintenan ce requirements associated wit h the significant population of buses over 12 years of age during this period.
Station Cleaning Headcount Support. 44 positions are required for each year with costs of $2.4 million in 20 14 and $3.3 million in s ubsequent years. These positions will replace current overtime coverage.
Track Construction Maintenance Workforce. 35 positions are required in 2014 with costs of $2.9 millio n and 25 po sitions with costs of $2.3 millio n are required in subsequent years. These additional non-reimbursable positions will be converted from reimbursable Track Construction personnel to support weekday maintenance-specific tasks and result in a better alignment of personnel. This circumstance has arisen due to a recent concentration of reimbursable track-work on weekends, causing reimbursable personnel to do non-reimbursable work during weekdays in light of a shortage of reimbursable work on weekdays.
Rapid Transit Operations-Lengthened Training Periods. 31 positions and costs of $2.9 million are required in 2014 and 15 posi tions with costs of $1.5 million are required in subs equent years to meet increased ind uction training days for several supervisor and hourly titles. These additional days are necessary to accommodate new course subjects to ensure new personne l receive the most appropriate instruct ions in or der to meet their job responsibilities.
V-211

The 2014 Budget Reduction Program is comprised of the following initiatives:
EGWP (Employee Group Waiver Plan) Program. Projected savings of $12.2 million in 2014 and $15.7 million in subsequent years are based on an Affordable Care Act prescription drug plan for Medica re-eligible members that is a more financially affordable alternative than other existing plans.
Medical Eligibility Initiative. Projected savings of $2.7 million in 2014 and $ 2.8
million in subsequent years are planned, predicated on improving the efficiency of eliminating ineligibles and the automation of transferri ng Medicare eligibles to primary status.
Subways Availability-Reduce “Injury-on-Duty” Lost Days. Projected Workers’ Compensation savings of $1.7 million per year beginning 2015 to be achieved through a more comprehensive and aggressive monitoring and r eview of Injury-on-Duty claims to reduce the number of days employees are out of work long-term.
Subways Availability-Video “RTK” Training at Home. Projected position reductions of 23 and savings of $0.7 million for eac h year beginning 2015, by implementing a Right-To-Know ( RTK) automated training tool at home, to result in increased Station Agent and Station Cleaner availability. RTK is a training module that deals with safety procedures for handling hazardous materials.
Subways Facility Cleaning Efficiency. Projected position reductions of 28 for each year and sav ings of $1. 5 million in 2 014 and $2.9 million in s ubsequent years to be achieved by implementing improved processes for car and facilit y cleaning.
Revenue Collection Efficiencies. Projected position reductions of 17 each year and savings of $1.9 million in 2 014 and $1.5 million in subsequent years, based on the opportunity to reduce labor costs resulting from the implementation of the $1 Green Fee charge which significantly reduced the number of new MetroCards produced. Positions to be reduced are in the areas of cashiers and revenue collecting agents.
Tower Operator Efficiencies. Projected position reductions of 2 in 2014 and 12 in subsequent years, and $1 .2 million of annual saving s for each year, based on a zero-based budget analysis of the Rapid Transit Subdivision B Tower Operator and Supervision functions.
Paratransit Savings-Prior Year Budget Reduction Program. Savings of $9.6 million in 2014, $13.7 million in 2015, $20.3 million in 2016, $30.9 million in 2017 and $41.1 million in 2018 are bas ed on a projected reductio n in trip activity, consistent with current trip levels , and a delay in full implement ation of the Fare Incentive Savings Program.
V-212

2014 Mid-Year Forecast MTA NYC Trans it’s 2014 Mi d-Year-Forecast includes total expens es before depreciation and oth er post-employment benef its of $8,234.5 million, co nsisting of $7,283.7 million of non-reimbu rsable expenses and $950.8 million of reimbursable expenses. Total rev enues are projected to be $5, 566.9 million, of which $4,616. 1 million are operating revenues and $ 950.8 million are capital reimbursements. Total baseline full-time and full-tim e equivalent positions ar e 47,447 (42,730 non -reimbursable positions and 4,717 reimbursable positions). The 2014 net operating cash def icit is projected to incr ease by $110.0 million from the 2014 Adopted Budget. Major operating cash changes include:
The impact of pattern labor adjustments, consistent with t he recent TWU labor contract agreement, resulting in payment s of $159.8 million, including r etro-payments of $32.7 million.
The adverse impact in early 2014 of multip le snowstorms, resulting in a co st of $36.1 million.
An unfavorable capital reimbur sement volume/processing lag adjustment of $40.0 million.
New programmatic initiatives, mostly maintenance-related, costing $14.7 million.
Savings from a new 2014 Budget Reducti on Program of $19.6 million and $16.7
million of additional paratransit expense savings applicable to a prior year BRP.
The favorable timing of cash results arising from 2013 of $93.0 million.
A reduction in GASB account funding o f $35.4 million, need ed to help fund excess cash requirements arising from the pattern labor adjustments.
Reimbursable expenses are projected to increase in 2014 by $6.0 million, due primarily to the impact of the pattern labor adjustments and programmatic construction/engineering changes, partly offset by vacancies. Total baseline positions are projected to in crease by 136, including a non-reimbursable increase of 164 and a reimbursable decrease of 28. The non-reimbursable increase represents 176 in s upport of new progr ammatic initiatives ( see beginning of this narrative for more detailed information). The reimbursable decrease is due mostly to 85 vacancies, partly offset by 54 positions required in support of Programmatic Construction/Engineering changes.
V-213

2015 Preliminary Budget MTA New York City Transit’s 2015 Preliminary Budget incl udes total expenses befor e depreciation and oth er post-employment benef its of $8,364.5 million, co nsisting of $7,410.0 million of non-reimbu rsable expenses and $954.4 million of reimbursable expenses. Total rev enues are projected to be $5, 564.9 million, of which $4,610. 4 million are operating revenues and $ 954.4 million are capital reimbursements. Total baseline full-time and full-ti me equivalent positions ar e 47,134, including 42,470 non-reimbursable positions and 4,664 reimbursable positions. The 2015 net operating cash defi cit is projected to increase by $20.5 million from the February Financial Plan. Major operating cash variances include:
The impact of pattern labor adjustments, consistent with t he recent TWU labor
contract agreement, resulting in payment s of $174.1 million, including r etro-payments of $32.9 million.
New programmatic initiatives, mostly maintenance-related, costing $11.8 million.
A re-estimate of GASB account funding, resulting in a reduction of $75.7 million, needed to help fund any excess cash requir ement arising from the pattern labor adjustments.
Savings from a new 2014 Budget Reducti on Program of $26.4 million and $22.6 million of additional paratransit expense savings applicable to a prior year BRP.
Updated inflation as sumptions, resulting in lower expenses o f $43.7 mi llion, mostly related to lower electric power prices.
Reimbursable expenses are projected to increase in 2015 by $4 5.9 million, due primarily to the impact of pattern labor adjustments, programmati c construction/engineering changes, te chnical requirements and over head rate adjustments. Total baseline positions are proj ected to increase by 96, incl uding a non-reimbursable increase of 26 and a reimbursable increas e of 70. The non-reimbursable increas e includes 132 positions in support of new programmatic initiati ves (see beginning of this narrative for detailed informati on), partly offset by 75 positi on reductions as part of the 2014 Budget Reduction Program (a lso detailed at the beginning of this narrative). The reimbursable increase is due to 35 pos itions supporting technical requirements and 24 positions representing procurement requirements.
V-214

2016-2017 Projections Net operating cash deficits are project ed to decrease by $85.2 million in 2016 and $123.3 million in 2017, relative to the February Financial Plan. Major operating cash changes include:
A re-estimate of GASB account funding, resulting in reductions of $83.2 million in
2016 and $90.7 million in 2017, needed to help fund any excess cash requirement arising from the pattern labor adjustments.
Savings from a new 2014 Budget Reduct ion Program of $26.4 million in both 2016 and 2017, and $33.5 million in 2016 and $50.0 million in 2017 of additional paratransit expense savings applicable to a prior year BRP.
Updated inflation ass umptions, resulting in lower expenses of $65.9 million in 2016 and $45.2 million in 2017, mostly related to lower electric power prices.
Re-estimates of pension expenses, resulting in savings of $19.7 million in 2 016
and $35.2 million in 2017.
The impact of pattern labor adjustments, consistent with t he recent TWU labor contract agreement, resulting in payments of $143.4 million in 2016 and $137.3 million in 2017.
Reimbursable expenses are projected to increase in 2016 by $40.9 million and by $42.5 million in 2017, due primarily to the im pact of pattern labor adjustments, technical requirements and overhead rate adjustments. Total baseline positions are projected to decrease by 11 in 2016 and 20 in 2017, including non-reimbursable decreases of 49 in 2016 and 48 in 2017. Reimbursable increases are 38 in 2016 and 28 in 2017. The non-reimbursable decreases are due mostly to 80 position decreas es in bot h years, resulting from the 2014 Bud get Reduction Program. The reimbursable increas es are due mostly to technical and procurement requirements.
V-215

MTA NEW YORK CITY TRANSITJuly Financial Plan 2015 - 2018
Accrual Statement of Operations by Category($ in millions)
NON-REIMBURSABLE2014 2015
2013 Mid-Year PreliminaryActual Forecast Budget 2016 2017 2018
Operating RevenueFarebox Revenue:Subway 3,030.746 3,123.375 3,172.108 3,223.225 3,250.798 3,275.560Bus 941.063 946.280 956.511 965.965 969.260 975.720Paratransit 16.465 16.993 18.525 19.821 21.209 22.693Fare Media Liability 63.567 69.538 44.770 44.770 44.770 44.770Farebox Revenue $4,051.841 $4,156.186 $4,191.914 $4,253.781 $4,286.037 $4,318.743Vehicle Toll Revenue $0.000 $0.000 $0.000 $0.000 $0.000 $0.000Other Operating Revenue:Fare Reimbursement 84.017 84.016 84.016 84.016 84.016 84.016Paratransit Reimbursement 169.615 176.180 181.921 198.721 220.992 239.507Other 260.073 199.684 152.595 155.961 159.425 162.990Other Operating Revenue $513.705 $459.880 $418.532 $438.698 $464.433 $486.513Capital and Other Reimbursements 0.000 0.000 0.000 0.000 0.000 0.000Total Revenue $4,565.546 $4,616.066 $4,610.446 $4,692.479 $4,750.470 $4,805.256
ExpensesLabor:Payroll 2,890.643 3,034.814 3,101.227 3,158.369 3,224.367 3,270.027Overtime 378.048 398.840 353.515 361.061 367.040 373.691Total Salaries & Wages 3,268.691 3,433.654 3,454.742 3,519.430 3,591.407 3,643.718Health and Welfare 618.044 690.831 749.592 801.973 862.784 932.654OPEB Current Payment 325.602 340.466 372.186 407.194 443.477 486.120Pensions 918.909 959.963 958.825 954.870 938.913 946.087Other Fringe Benefits 383.256 302.395 309.000 320.870 334.701 343.493Total Fringe Benefits 2,245.811 2,293.655 2,389.603 2,484.907 2,579.875 2,708.354Reimbursable Overhead (209.291) (198.066) (202.228) (196.729) (195.339) (198.280)Total Labor Expenses $5,305.211 $5,529.243 $5,642.117 $5,807.608 $5,975.943 $6,153.792
Non-Labor:Electric Power 298.593 334.855 307.582 321.511 371.603 402.991Fuel 160.588 168.024 169.023 162.049 164.982 171.800Insurance 62.492 68.090 77.076 88.570 101.828 117.361Claims 144.022 94.676 99.866 104.051 106.333 108.671Paratransit Service Contracts 366.751 382.004 391.754 427.124 480.292 522.580Maintenance and Other Operating Contracts 168.003 188.124 192.278 203.562 194.516 193.739Professional Service Contracts 144.929 137.228 138.423 136.070 138.345 142.800Materials & Supplies 270.690 303.419 307.521 306.804 309.378 313.218Other Business Expenses 62.965 78.057 84.402 86.121 82.607 84.117Total Non-Labor Expenses $1,679.033 $1,754.477 $1,767.925 $1,835.862 $1,949.884 $2,057.277
Other Expense Adjustments:Other 0.000 0.000 0.000 0.000 0.000 0.000Total Other Expense Adjustments $0.000 $0.000 $0.000 $0.000 $0.000 $0.000
Total Expenses beforeDepreciation and GASB Adjustments $6,984.244 $7,283.720 $7,410.042 $7,643.470 $7,925.827 $8,211.069
Depreciation 1,421.011 1,544.334 1,638.144 1,688.144 1,863.292 1,913.292OPEB Obligation 1,554.097 1,554.097 1,616.261 1,680.911 1,748.148 1,818.074Environmental Remediation 24.121 0.000 0.000 0.000 0.000 0.000
Total Expenses $9,983.473 $10,382.151 $10,664.447 $11,012.525 $11,537.267 $11,942.435
Net Surplus/(Deficit) ($5,417.927) ($5,766.085) ($6,054.001) ($6,320.046) ($6,786.797) ($7,137.179)
V-216

MTA NEW YORK CITY TRANSITJuly Financial Plan 2015 - 2018
Accrual Statement of Operations by Category($ in millions)
REIMBURSABLE2014 2015
2013 Mid-Year PreliminaryActual Forecast Budget 2016 2017 2018
RevenueFarebox Revenue 0.000 0.000 0.000 0.000 0.000 0.000Vehicle Toll Revenue 0.000 0.000 0.000 0.000 0.000 0.000Other Operating Revenue 0.000 0.000 0.000 0.000 0.000 0.000Capital and Other Reimbursements 965.068 950.797 954.419 936.142 921.284 935.281Total Revenue $965.068 $950.797 $954.419 $936.142 $921.284 $935.281
ExpensesLabor:Payroll 342.023 384.124 399.279 390.244 380.750 386.587Overtime 115.468 76.837 71.131 71.538 71.730 73.033Total Salaries & Wages 457.491 460.961 470.410 461.782 452.480 459.620Health and Welfare 23.270 26.950 29.045 30.033 30.917 32.509OPEB Current Payment 0.000 0.000 0.000 0.000 0.000 0.000Pensions 29.495 28.868 29.243 28.822 27.889 28.353Other Fringe Benefits 119.064 131.348 133.347 130.012 126.288 128.147Total Fringe Benefits 171.829 187.166 191.635 188.867 185.094 189.009Reimbursable Overhead 209.291 198.066 202.228 196.729 195.339 198.280Total Labor Expenses $838.611 $846.193 $864.273 $847.378 $832.913 $846.909
Non-Labor:Electric Power 0.345 0.252 0.252 0.252 0.252 0.252Fuel 0.019 0.023 0.023 0.023 0.023 0.023Insurance 0.000 0.000 0.000 0.000 0.000 0.000Claims 0.000 0.000 0.000 0.000 0.000 0.000Paratransit Service Contracts 0.964 0.000 0.000 0.000 0.000 0.000Maintenance and Other Operating Contracts 38.736 29.031 25.896 25.896 26.022 26.023Professional Service Contracts 22.910 17.779 16.239 16.592 16.324 16.324Materials & Supplies 61.550 58.263 45.813 44.077 43.827 43.827Other Business Expenses 1.933 (0.744) 1.923 1.924 1.923 1.923Total Non-Labor Expenses $126.457 $104.604 $90.146 $88.764 $88.371 $88.372
Other Expense Adjustments:Other 0.000 0.000 0.000 0.000 0.000 0.000Total Other Expense Adjustments $0.000 $0.000 $0.000 $0.000 $0.000 $0.000
Total Expenses beforeDepreciation $965.068 $950.797 $954.419 $936.142 $921.284 $935.281
Depreciation 0.000 0.000 0.000 0.000 0.000 0.000
Total Expenses $965.068 $950.797 $954.419 $936.142 $921.284 $935.281
Net Surplus/(Deficit) $0.000 $0.000 $0.000 $0.000 $0.000 $0.000
V-217

MTA NEW YORK CITY TRANSITJuly Financial Plan 2015 - 2018
Accrual Statement of Operations by Category($ in millions)
NON-REIMBURSABLE/REIMBURSABLE2014 2015
2013 Mid-Year PreliminaryActual Forecast Budget 2016 2017 2018
RevenueFarebox Revenue:Subway $3,030.746 $3,123.375 $3,172.108 $3,223.225 $3,250.798 $3,275.560Bus 941.063 946.280 956.511 965.965 969.260 975.720Paratransit 16.465 16.993 18.525 19.821 21.209 22.693Fare Media Liability 63.567 69.538 44.770 44.770 44.770 44.770Farebox Revenue $4,051.841 $4,156.186 $4,191.914 $4,253.781 $4,286.037 $4,318.743Vehicle Toll Revenue 0.000 0.000 0.000 0.000 0.000 0.000Other Operating Revenue:Fare Reimbursement 84.017 84.016 84.016 84.016 84.016 84.016Paratransit Reimbursement 169.615 176.180 181.921 198.721 220.992 239.507Other 260.073 199.684 152.595 155.961 159.425 162.990Other Operating Revenue 513.705 459.880 418.532 438.698 464.433 486.513Capital and Other Reimbursements 965.068 950.797 954.419 936.142 921.284 935.281Total Revenue $5,530.614 $5,566.863 $5,564.865 $5,628.621 $5,671.754 $5,740.537
ExpensesLabor:Payroll 3,232.666 3,418.938 3,500.506 3,548.613 3,605.117 3,656.614Overtime 493.516 475.677 424.646 432.599 438.770 446.724Total Salaries & Wages 3,726.182 3,894.615 3,925.152 3,981.212 4,043.887 4,103.338Health and Welfare 641.314 717.781 778.637 832.006 893.701 965.163OPEB Current Payment 325.602 340.466 372.186 407.194 443.477 486.120Pensions 948.404 988.831 988.068 983.692 966.802 974.440Other Fringe Benefits 502.320 433.743 442.347 450.882 460.989 471.640Total Fringe Benefits 2,417.640 2,480.821 2,581.238 2,673.774 2,764.969 2,897.363Reimbursable Overhead 0.000 0.000 0.000 0.000 0.000 0.000Total Labor Expenses $6,143.822 $6,375.436 $6,506.390 $6,654.986 $6,808.856 $7,000.701
Non-Labor:Electric Power 298.938 335.107 307.834 321.763 371.855 403.243Fuel 160.607 168.047 169.046 162.072 165.005 171.823Insurance 62.492 68.090 77.076 88.570 101.828 117.361Claims 144.022 94.676 99.866 104.051 106.333 108.671Paratransit Service Contracts 367.715 382.004 391.754 427.124 480.292 522.580Maintenance and Other Operating Contracts 206.739 217.155 218.174 229.458 220.538 219.762Professional Service Contracts 167.839 155.007 154.662 152.662 154.669 159.124Materials & Supplies 332.240 361.682 353.334 350.881 353.205 357.045Other Business Expenses 64.898 77.313 86.325 88.045 84.530 86.040Total Non-Labor Expenses $1,805.490 $1,859.081 $1,858.071 $1,924.626 $2,038.255 $2,145.649
Other Expense Adjustments:Other 0.000 0.000 0.000 0.000 0.000 0.000Total Other Expense Adjustments $0.000 $0.000 $0.000 $0.000 $0.000 $0.000
Total Expenses beforeDepreciation and GASB Adjustments $7,949.312 $8,234.517 $8,364.461 $8,579.612 $8,847.111 $9,146.350
Depreciation 1,421.011 1,544.334 1,638.144 1,688.144 1,863.292 1,913.292OPEB Obligation 1,554.097 1,554.097 1,616.261 1,680.911 1,748.148 1,818.074Environmental Remediation 24.121 0.000 0.000 0.000 0.000 0.000
Total Expenses $10,948.541 $11,332.948 $11,618.866 $11,948.667 $12,458.551 $12,877.716
Net Surplus/(Deficit) ($5,417.927) ($5,766.085) ($6,054.001) ($6,320.046) ($6,786.797) ($7,137.179)
V-218

MTA NEW YORK CITY TRANSITJuly Financial Plan 2015 - 2018Cash Receipts & Expenditures
CASH RECEIPTS AND EXPENDITURES2014 2015
2013 Mid-Year PreliminaryActual Forecast Budget 2016 2017 2018
ReceiptsFarebox Revenue 4,086.772 4,141.649 4,202.145 4,264.012 4,296.268 4,328.974Vehicle Toll Revenue 0.000 0.000 0.000 0.000 0.000 0.000Other Operating Revenue:Fare Reimbursement 99.052 84.016 84.016 84.016 84.016 84.016Paratransit Reimbursement 167.124 179.452 181.597 198.491 220.795 239.434Other 170.667 99.606 49.515 49.788 50.067 50.351Other Operating Revenue $436.843 $363.074 $315.128 $332.295 $354.878 $373.801Capital and Other Reimbursements 893.332 1,074.846 963.157 939.442 923.872 931.858Total Receipts $5,416.947 $5,579.569 $5,480.430 $5,535.749 $5,575.018 $5,634.633
ExpendituresLabor:Payroll 3,182.616 3,639.689 3,505.716 3,513.530 3,578.753 3,629.482Overtime 470.666 506.390 425.278 428.322 435.561 443.409Total Salaries & Wages 3,653.282 4,146.079 3,930.994 3,941.852 4,014.314 4,072.891Health and Welfare 657.042 712.331 772.231 825.120 886.298 957.205OPEB Current Payment 325.601 340.466 372.186 407.194 443.477 486.120Pensions 789.666 981.348 988.142 983.340 963.281 969.953Other Fringe Benefits 375.254 414.499 403.018 406.897 416.513 425.830Total Fringe Benefits 2,147.563 2,448.644 2,535.577 2,622.551 2,709.569 2,839.108GASB Account 66.688 34.047 0.000 0.000 0.000 8.528Reimbursable Overhead 0.000 0.000 0.000 0.000 0.000 0.000Total Labor Expenditures $5,867.533 $6,628.770 $6,466.571 $6,564.403 $6,723.883 $6,920.527
Non-Labor:Electric Power 296.780 335.107 307.834 321.763 371.855 403.243Fuel 164.316 168.047 169.046 162.072 165.005 171.823Insurance 58.338 72.033 79.974 89.143 102.639 121.428Claims 97.658 86.148 89.236 91.266 93.549 95.887Paratransit Service Contracts 372.787 380.004 389.754 425.124 478.292 520.580Maintenance and Other Operating Contracts 216.824 227.415 228.874 240.158 231.238 230.462Professional Service Contracts 165.371 154.134 139.662 137.662 139.669 144.124Materials & Supplies 357.783 347.682 349.334 346.881 349.205 353.045Other Business Expenditures 70.395 77.726 86.325 88.045 84.530 86.040Total Non-Labor Expenditures $1,800.252 $1,848.296 $1,840.039 $1,902.114 $2,015.982 $2,126.632
Other Expenditure Adjustments:Other 0.000 0.000 0.000 0.000 0.000 0.000Total Other Expenditure Adjustments $0.000 $0.000 $0.000 $0.000 $0.000 $0.000
Total Expenditures $7,667.785 $8,477.066 $8,306.610 $8,466.517 $8,739.865 $9,047.159
Net Cash Deficit ($2,250.838) ($2,897.497) ($2,826.180) ($2,930.768) ($3,164.847) ($3,412.526)
V-219
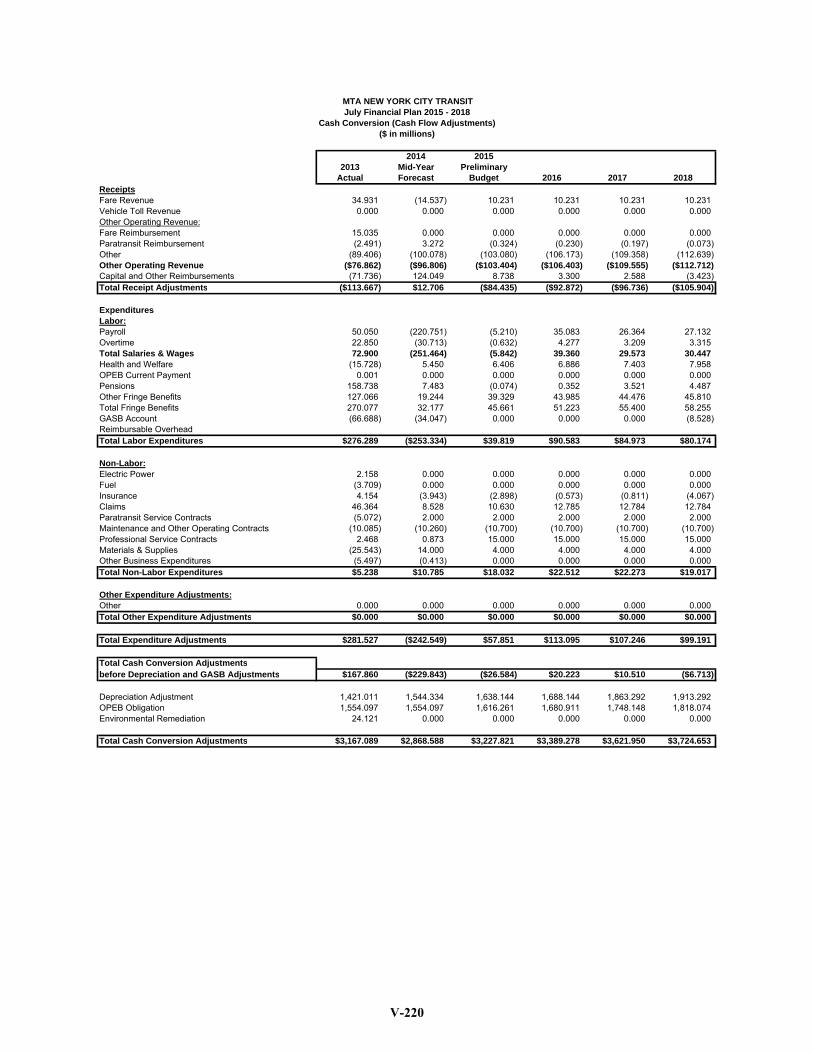
MTA NEW YORK CITY TRANSITJuly Financial Plan 2015 - 2018
Cash Conversion (Cash Flow Adjustments)($ in millions)
2014 20152013 Mid-Year Preliminary
Actual Forecast Budget 2016 2017 2018ReceiptsFare Revenue 34.931 (14.537) 10.231 10.231 10.231 10.231Vehicle Toll Revenue 0.000 0.000 0.000 0.000 0.000 0.000Other Operating Revenue:Fare Reimbursement 15.035 0.000 0.000 0.000 0.000 0.000Paratransit Reimbursement (2.491) 3.272 (0.324) (0.230) (0.197) (0.073)Other (89.406) (100.078) (103.080) (106.173) (109.358) (112.639)Other Operating Revenue ($76.862) ($96.806) ($103.404) ($106.403) ($109.555) ($112.712)Capital and Other Reimbursements (71.736) 124.049 8.738 3.300 2.588 (3.423)Total Receipt Adjustments ($113.667) $12.706 ($84.435) ($92.872) ($96.736) ($105.904)
ExpendituresLabor:Payroll 50.050 (220.751) (5.210) 35.083 26.364 27.132Overtime 22.850 (30.713) (0.632) 4.277 3.209 3.315Total Salaries & Wages 72.900 (251.464) (5.842) 39.360 29.573 30.447Health and Welfare (15.728) 5.450 6.406 6.886 7.403 7.958OPEB Current Payment 0.001 0.000 0.000 0.000 0.000 0.000Pensions 158.738 7.483 (0.074) 0.352 3.521 4.487Other Fringe Benefits 127.066 19.244 39.329 43.985 44.476 45.810Total Fringe Benefits 270.077 32.177 45.661 51.223 55.400 58.255GASB Account (66.688) (34.047) 0.000 0.000 0.000 (8.528)Reimbursable OverheadTotal Labor Expenditures $276.289 ($253.334) $39.819 $90.583 $84.973 $80.174
Non-Labor:Electric Power 2.158 0.000 0.000 0.000 0.000 0.000Fuel (3.709) 0.000 0.000 0.000 0.000 0.000Insurance 4.154 (3.943) (2.898) (0.573) (0.811) (4.067)Claims 46.364 8.528 10.630 12.785 12.784 12.784Paratransit Service Contracts (5.072) 2.000 2.000 2.000 2.000 2.000Maintenance and Other Operating Contracts (10.085) (10.260) (10.700) (10.700) (10.700) (10.700)Professional Service Contracts 2.468 0.873 15.000 15.000 15.000 15.000Materials & Supplies (25.543) 14.000 4.000 4.000 4.000 4.000Other Business Expenditures (5.497) (0.413) 0.000 0.000 0.000 0.000Total Non-Labor Expenditures $5.238 $10.785 $18.032 $22.512 $22.273 $19.017
Other Expenditure Adjustments:Other 0.000 0.000 0.000 0.000 0.000 0.000Total Other Expenditure Adjustments $0.000 $0.000 $0.000 $0.000 $0.000 $0.000
Total Expenditure Adjustments $281.527 ($242.549) $57.851 $113.095 $107.246 $99.191
Total Cash Conversion Adjustmentsbefore Depreciation and GASB Adjustments $167.860 ($229.843) ($26.584) $20.223 $10.510 ($6.713)
Depreciation Adjustment 1,421.011 1,544.334 1,638.144 1,688.144 1,863.292 1,913.292OPEB Obligation 1,554.097 1,554.097 1,616.261 1,680.911 1,748.148 1,818.074Environmental Remediation 24.121 0.000 0.000 0.000 0.000 0.000
Total Cash Conversion Adjustments $3,167.089 $2,868.588 $3,227.821 $3,389.278 $3,621.950 $3,724.653
V-220

MTA New York City Transit2014 Mid-Year Forecast
Non-Reimbursable/Reimbursable Overtime ($ in millions)
NON-REIMBURSABLE OVERTIME Hours $ %
Scheduled Service 3,809,365 $115.681 29.0%
Unscheduled Service 3,302,645 $100.293 25.1%
Programmatic/Routine Maintenance 3,968,213 $120.505 30.2%
Unscheduled Maintenance 31,580 $0.959 0.2%
Vacancy/Absentee Coverage 806,520 $24.492 6.1%
Weather Emergencies 811,492 $24.643 6.2%
Safety/Security/Law Enforcement 119,135 $3.618 0.9%
Other 1 284,785 $8.649 2.2%
Subtotal 13,133,735 $398.840 100.0%
REIMBURSABLE OVERTIME 2,427,427 $76.837
TOTAL OVERTIME 15,561,162 $475.677
1 Other & reimbursable budget includes PTE $'s only. Does not include hours.
Total
V-221

MTA NEW YORK CITY TRANSIT
2015 Preliminary Budget July Financial Plan 2015 – 2018
Year-to-Year Changes by Category-Baseline TOTAL REVENUE/RECEIPTS Farebox Revenue
Subway/bus farebox revenue annual gr owth based largely on the regional economy and updated NYC employment projections.
Farebox cash receipts include adjustm ents for expired MetroCards an d the timing of cash receipts from counti ng and depositing, which can cause some fluctuations in cash received from year to year.
Other Operating Revenue
NYC paratransit reimbursements includ e annual increases ( based on the lower of 120 percent of the prior calendar y ear total amounts billed or 33% of the current year net expenses subject to reim bursement) that serve to partially f und the annual growth in par atransit expenses and Ur ban Tax revenue gener ated from Commercial Real Estate Market transactions.
Other revenues include an nual increases mostly from advertising revenues, based upon current contracts in place. Also incl uded are projected storm insurance recoveries in 2014, which do not recur in 2015, thus resulting in most of the decrease from 2014 to 2015 of $47.1 million.
$17.5 million of storm recoveries, origi nally assumed to be re ceived in 2013, are now included in the 2014 forecast.
Capital and Other Reimbursements Annual reimbursement leve ls fluctuate year-to-year based upon reimbursable
expense levels driven mostly by capital project requirements. Annual cash adjustments are included to recognize changes in the timing of
receipts. 2014 includes $95.4 million of reimbursements originally assumed to be received
in 2013. TOTAL EXPENSES/EXPENDITURES Projections include additional Payroll, Overtime, Pension, Health & Welfa re, Other Fringe Benefits, Other Bu siness Expenses, and Reimbursable Overhead expens es attributable to the recent labor s ettlement with the T WU and the assumption that the same pattern will be applied for those employees without contract agreements. Payroll
Represented employee wage increase assumptions follow the TWU pattern upon expiration of existing c ontracts as follows: 0.87% , 0.95%, 2.23%, 2.22% and
V-222

1.88% for years 1,2,3,4, and 5. CPI-based increases of 2% are assumed for each year upon expiration of the pattern,
Salaries for non-represented employees, who have not received a general s alary increase during the last five years, ar e assumed to follow CPI-based incr eases. The 2014 Mid-Year Forecast baseline inc ludes the compounding of raises for 2012 and 2013; however, as of the July Plan, no raises have been granted.
2014 includes $1.7 million of favorable cash timing adjustments from 2013. Overtime
2015-2018 payroll wage rate increase assumptions apply. 2015 expenses decrease from 2014 by $45.3 million, due to o vertime
requirements in cover ing adverse weat her requirements in early 2014 an d a leveling-off of some 2014 planning assump tions such as vacancy and absentee coverage.
Health & Welfare Inflation assumptions for 2015-2018: Annu al employees: 2015 = 5.7%, 2016 =
3.8%, 2017-2018 = 4.7%; hourly employees = 8.5% per year. Pension
Projections are consistent with current actuarial information. Other Fringe Benefits
Projected increases y ear-to-year reflect staffing levels , programmatic chan ges, and inflationary payroll rate assumptions.
2014 includes $0.1 million of favorable cash timing adjustments from 2013.
Electric Power The financial plan reflects projected New York Power Authority and Con Edison
energy rate increases for both traction and non-traction power. 2014 includes $3.7 million of unfavorable cash timing adjustments from 2013.
Fuel The financial plan reflects diesel, CNG and heating fuel price assumptions.
Insurance Annual expenses include premium rates provided by MTA. 2014 includes $4.4 million of unfavorable cash timing adjustments from 2013.
Paratransit Service Contracts The primary driver of ex pense increases is projected annual ridership growth of
7% effective 2015. Cost-per-trip inflation projections refl ect carrier contracts, which provide for
annual rate increases based on CPI.
V-223

Maintenance and Other Operating Contracts Inflation assumptions are as follo ws: 2015=1.74%, 2016=1.77% , 2017=1.85%
and 2018=2.03%, based on a national CPI-U forecast. The year-to-year increase in 2 015 of $4.2 million is due to purchase s of
paratransit vehicles and the increase in 2016 over 2015 of $11.3 million is due to the timing of bus shop requirements, which were essentially offset in 2016.
2014 includes $7.9 million of unfavorable cash timing adjustments from 2013. Professional Service Contracts
Inflation assumptions are as follows: 2015 =1.74%, 2016=1.77%, 2017=1.85% and 2018=2.03%, based on a national CPI-U forecast.
2014 includes $3.0 million of unfavorable cash timing adjustments from 2013.
Materials and Supplies Inflation assumptions are as follo ws: 2015=2.16%, 2016=1.63% , 2017=1.42%
and 2018=1.36%. 2014 includes $2.7 million of unfavorable cash timing adjustments from 2013. Non-reimbursable expense lev els fluctuate year-to-year, primarily due to the
timing of subway and bus fleet maintenance program requirements. Other Business Expenses
Inflation assumptions are as follo ws: 2015=1.74%, 2016=1.77% , 2017=1.85% and 2018=2.03%.
The increase in 2015 over 2014 of $6. 3 million and in crease of $1.7 millio n in 2016 are primarily due to t he providing of railroad pa sses to TWU employees, based on the recent approved labor agreement. The decrease in 2017 from 2016 is mainly due to reimbursable account adjustments impacting non-reimbursable expenses.
Depreciation (non-cash) Annual expense incr eases are due to projections of additiona l capital as sets
reaching beneficial use. Examples of these assets include s ubway station rehabilitations, track & switches, and new subway cars and buses.
V-224

MTA New York City TransitJuly Financial Plan 2015 - 2018
Year-to-Year Changes by Category - Accrual Basis($ in millions)
NON-REIMBURSABLE Favorable/(Unfavorable)Change Change Change Change
2014 2015 2015-2014 2016 2016-2015 2017 2017-2016 2018 2018-2017RevenueFarebox Revenue:Subway $3,123.375 $3,172.108 $48.733 $3,223.225 $51.117 $3,250.798 $27.573 $3,275.560 $24.762Bus $946.280 956.511 10.231 965.965 9.454 969.260 3.295 975.720 6.460Paratransit 16.993 18.525 1.532 19.821 1.296 21.209 1.388 22.693 1.484Fare Media Liability 69.538 44.770 (24.768) 44.770 0.000 44.770 0.000 44.770 0.000Total Farebox Revenue $4,156.186 $4,191.914 $35.728 $4,253.781 $61.867 $4,286.037 $32.256 $4,318.743 $32.706Vehicle Toll Revenue 0.000 0.000 0.000 0.000 0.000 0.000 0.000 0.000 0.000Other Operating Revenue:Fare Reimbursement 84.016 84.016 0.000 84.016 0.000 84.016 0.000 84.016 0.000Paratransit Reimbursement 176.180 181.921 5.741 198.721 16.800 220.992 22.271 239.507 18.515Other 199.684 152.595 (47.089) 155.961 3.366 159.425 3.464 162.990 3.565Total Other Operating Revenue 459.880 418.532 (41.348) 438.698 20.166 464.433 25.735 486.513 22.080Capital and Other Reimbursements 0.000 0.000 0.000 0.000 0.000 0.000 0.000 0.000 0.000Total Revenue $4,616.066 $4,610.446 ($5.620) $4,692.479 $82.033 $4,750.470 $57.991 $4,805.256 $54.786
ExpensesLabor:Payroll 3,034.814 3,101.227 (66.413) 3,158.369 (57.142) 3,224.367 (65.998) 3,270.027 (45.660)Overtime 398.840 353.515 45.325 361.061 (7.546) 367.040 (5.979) 373.691 (6.651)Total Salaries & Wages 3,433.654 3,454.742 (21.088) 3,519.430 (64.688) 3,591.407 (71.977) 3,643.718 (52.311)Health and Welfare 690.831 749.592 (58.761) 801.973 (52.381) 862.784 (60.811) 932.654 (69.870)OPEB Current Payment 340.466 372.186 (31.720) 407.194 (35.008) 443.477 (36.283) 486.120 (42.643)Pensions 959.963 958.825 1.138 954.870 3.955 938.913 15.957 946.087 (7.174)Other Fringe Benefits 302.395 309.000 (6.605) 320.870 (11.870) 334.701 (13.831) 343.493 (8.792)Total Fringe Benefits 2,293.655 2,389.603 (95.948) 2,484.907 (95.304) 2,579.875 (94.968) 2,708.354 (128.479)Reimbursable Overhead (198.066) (202.228) 4.162 (196.729) (5.499) (195.339) (1.390) (198.280) 2.941Total Labor Expenses $5,529.243 $5,642.117 ($112.874) $5,807.608 ($165.491) $5,975.943 ($168.335) $6,153.792 ($177.849)
Non-Labor:Electric Power 334.855 307.582 27.273 321.511 (13.929) 371.603 (50.092) 402.991 (31.388)Fuel 168.024 169.023 (0.999) 162.049 6.974 164.982 (2.933) 171.800 (6.818)Insurance 68.090 77.076 (8.986) 88.570 (11.494) 101.828 (13.258) 117.361 (15.533)Claims 94.676 99.866 (5.190) 104.051 (4.185) 106.333 (2.282) 108.671 (2.338)Paratransit Service Contracts 382.004 391.754 (9.750) 427.124 (35.370) 480.292 (53.168) 522.580 (42.288)Mtce. and Other Operating Contracts 188.124 192.278 (4.154) 203.562 (11.284) 194.516 9.046 193.739 0.777Professional Service Contracts 137.228 138.423 (1.195) 136.070 2.353 138.345 (2.275) 142.800 (4.455)Materials & Supplies 303.419 307.521 (4.102) 306.804 0.717 309.378 (2.574) 313.218 (3.840)Other Business Expenses 78.057 84.402 (6.345) 86.121 (1.719) 82.607 3.514 84.117 (1.510)Total Non-Labor Expenses $1,754.477 $1,767.925 ($13.448) $1,835.862 ($67.937) $1,949.884 ($114.022) $2,057.277 ($107.393)
Other Expense Adjustments:Other 0.000 0.000 0.000 0.000 0.000 0.000 0.000 0.000 0.000Total Other Expense Adjustments $0.000 $0.000 $0.000 $0.000 $0.000 $0.000 $0.000 $0.000 $0.000
Total Expenses beforeDepreciation and GASB Adjustments $7,283.720 $7,410.042 ($126.322) $7,643.470 ($233.428) $7,925.827 ($282.357) $8,211.069 ($285.242)
Depreciation 1,544.334 1,638.144 (93.810) 1,688.144 (50.000) 1,863.292 (175.148) 1,913.292 (50.000)OPEB Obligation 1,554.097 1,616.261 (62.164) 1,680.911 (64.650) 1,748.148 (67.237) 1,818.074 (69.926)Environmental Remediation 0.000 0.000 0.000 0.000 0.000 0.000 0.000 0.000 0.000
Total Expenses $10,382.151 $10,664.447 ($282.296) $11,012.525 ($348.078) $11,537.267 ($524.742) $11,942.435 ($405.168)
Net Surplus/(Deficit) ($5,766.085) ($6,054.001) ($287.916) ($6,320.046) ($266.045) ($6,786.797) ($466.751) ($7,137.179) ($350.382)V-225

MTA New York City TransitJuly Financial Plan 2015 - 2018
Year-to-Year Changes by Category - Accrual Basis($ in millions)
REIMBURSABLE Favorable/(Unfavorable)Change Change Change Change
2014 2015 2015-2014 2016 2016-2015 2017 2017-2016 2018 2018-2017RevenueFarebox Revenue $0.000 $0.000 $0.000 $0.000 $0.000 $0.000 $0.000 $0.000 $0.000Vehicle Toll Revenue $0.000 $0.000 $0.000 $0.000 $0.000 $0.000 $0.000 $0.000 $0.000Other Operating Revenue $0.000 $0.000 $0.000 $0.000 $0.000 $0.000 $0.000 $0.000 $0.000Capital and Other Reimbursements $950.797 $954.419 $3.622 $936.142 ($18.277) $921.284 ($14.858) $935.281 $13.997Total Revenue $950.797 $954.419 $3.622 $936.142 ($18.277) $921.284 ($14.858) $935.281 $13.997
ExpensesLabor:Payroll 384.124 399.279 (15.155) 390.244 9.035 380.750 9.494 386.587 (5.837)Overtime 76.837 71.131 5.706 71.538 (0.407) 71.730 (0.192) 73.033 (1.303)Total Salaries & Wages 460.961 470.410 (9.449) 461.782 8.628 452.480 9.302 459.620 (7.140)Health and Welfare 26.950 29.045 (2.095) 30.033 (0.988) 30.917 (0.884) 32.509 (1.592)OPEB Current Payment 0.000 0.000 0.000 0.000 0.000 0.000 0.000 0.000 0.000Pensions 28.868 29.243 (0.375) 28.822 0.421 27.889 0.933 28.353 (0.464)Other Fringe Benefits 131.348 133.347 (1.999) 130.012 3.335 126.288 3.724 128.147 (1.859)Total Fringe Benefits 187.166 191.635 (4.469) 188.867 2.768 185.094 3.773 189.009 (3.915)Reimbursable Overhead 198.066 202.228 (4.162) 196.729 5.499 195.339 1.390 198.280 (2.941)Total Labor Expenses $846.193 $864.273 ($18.080) $847.378 $16.895 $832.913 $14.465 $846.909 ($13.996)
Non-Labor:Electric Power 0.252 0.252 0.000 0.252 0.000 0.252 0.000 0.252 0.000Fuel 0.023 0.023 0.000 0.023 0.000 0.023 0.000 0.023 0.000Insurance 0.000 0.000 0.000 0.000 0.000 0.000 0.000 0.000 0.000Claims 0.000 0.000 0.000 0.000 0.000 0.000 0.000 0.000 0.000Paratransit Service Contracts 0.000 0.000 0.000 0.000 0.000 0.000 0.000 0.000 0.000Mtce. and Other Operating Contracts 29.031 25.896 3.135 25.896 0.000 26.022 (0.126) 26.023 (0.001)Professional Service Contracts 17.779 16.239 1.540 16.592 (0.353) 16.324 0.268 16.324 0.000Materials & Supplies 58.263 45.813 12.450 44.077 1.736 43.827 0.250 43.827 0.000Other Business Expenses (0.744) 1.923 (2.667) 1.924 (0.001) 1.923 0.001 1.923 0.000Total Non-Labor Expenses $104.604 $90.146 $14.458 $88.764 $1.382 $88.371 $0.393 $88.372 ($0.001)
Other Expense Adjustments:Other 0.000 0.000 0.000 0.000 0.000 0.000 0.000 0.000 0.000Total Other Expense Adjustments $0.000 $0.000 $0.000 $0.000 $0.000 $0.000 $0.000 $0.000 $0.000
Total Expenses beforeDepreciation $950.797 $954.419 ($3.622) $936.142 $18.277 $921.284 $14.858 $935.281 ($13.997)
Depreciation 0.000 0.000 0.000 0.000 0.000 0.000 0.000 0.000 0.000
Total Expenses $950.797 $954.419 ($3.622) $936.142 $18.277 $921.284 $14.858 $935.281 ($13.997)
Net Surplus/(Deficit) $0.000 $0.000 ($0.000) $0.000 $0.000 $0.000 ($0.000) $0.000 ($0.000)
V-226

MTA New York City TransitJuly Financial Plan 2015 - 2018
Year-to-Year Changes by Category - Accrual Basis($ in millions)
NON-REIMBURSABLE and Favorable/(Unfavorable)REIMBURSABLE Change Change Change Change
2014 2015 2015-2014 2016 2016-2015 2017 2017-2016 2018 2018-2017RevenueFarebox Revenue:Subway $3,123.375 $3,172.108 $48.733 $3,223.225 $51.117 $3,250.798 $27.573 $3,275.560 $24.762Bus 946.280 956.511 10.231 965.965 9.454 969.260 3.295 975.720 6.460Paratransit 16.993 18.525 1.532 19.821 1.296 21.209 1.388 22.693 1.484Fare Media Liability 69.538 44.770 (24.768) 44.770 0.000 44.770 0.000 44.770 0.000Total Farebox Revenue $4,156.186 $4,191.914 $35.728 $4,253.781 $61.867 $4,286.037 $32.256 $4,318.743 $32.706Vehicle Toll Revenue 0.000 0.000 0.000 0.000 0.000 0.000 0.000 0.000 0.000Other Operating Revenue:Fare Reimbursement 84.016 84.016 0.000 84.016 0.000 84.016 0.000 84.016 0.000Paratransit Reimbursement 176.180 181.921 5.741 198.721 16.800 220.992 22.271 239.507 18.515Other 199.684 152.595 (47.089) 155.961 3.366 159.425 3.464 162.990 3.565Total Other Operating Revenue 459.880 418.532 (41.348) 438.698 20.166 464.433 25.735 486.513 22.080Capital and Other Reimbursements 950.797 954.419 3.622 936.142 (18.277) 921.284 (14.858) 935.281 13.997Total Revenue $5,566.863 $5,564.865 ($1.998) $5,628.621 $63.756 $5,671.754 $43.133 $5,740.537 $68.783
ExpensesLabor:Payroll 3,418.938 3,500.506 (81.568) 3,548.613 (48.107) 3,605.117 (56.504) 3,656.614 (51.497)Overtime 475.677 424.646 51.031 432.599 (7.953) 438.770 (6.171) 446.724 (7.954)Total Salaries & Wages 3,894.615 3,925.152 (30.537) 3,981.212 (56.060) 4,043.887 (62.675) 4,103.338 (59.451)Health and Welfare 717.781 778.637 (60.856) 832.006 (53.369) 893.701 (61.695) 965.163 (71.462)OPEB Current Payment 340.466 372.186 (31.720) 407.194 (35.008) 443.477 (36.283) 486.120 (42.643)Pensions 988.831 988.068 0.763 983.692 4.376 966.802 16.890 974.440 (7.638)Other Fringe Benefits 433.743 442.347 (8.604) 450.882 (8.535) 460.989 (10.107) 471.640 (10.651)Total Fringe Benefits 2,480.821 2,581.238 (100.417) 2,673.774 (92.536) 2,764.969 (91.195) 2,897.363 (132.394)Reimbursable Overhead 0.000 0.000 0.000 0.000 0.000 0.000 0.000 0.000 0.000Total Labor Expenses $6,375.436 $6,506.390 ($130.954) $6,654.986 ($148.596) $6,808.856 ($153.870) $7,000.701 ($191.845)
Non-Labor:Electric Power 335.107 307.834 27.273 321.763 (13.929) 371.855 (50.092) 403.243 (31.388)Fuel 168.047 169.046 (0.999) 162.072 6.974 165.005 (2.933) 171.823 (6.818)Insurance 68.090 77.076 (8.986) 88.570 (11.494) 101.828 (13.258) 117.361 (15.533)Claims 94.676 99.866 (5.190) 104.051 (4.185) 106.333 (2.282) 108.671 (2.338)Paratransit Service Contracts 382.004 391.754 (9.750) 427.124 (35.370) 480.292 (53.168) 522.580 (42.288)Mtce. and Other Operating Contracts 217.155 218.174 (1.019) 229.458 (11.284) 220.538 8.920 219.762 0.776Professional Service Contracts 155.007 154.662 0.345 152.662 2.000 154.669 (2.007) 159.124 (4.455)Materials & Supplies 361.682 353.334 8.348 350.881 2.453 353.205 (2.324) 357.045 (3.840)Other Business Expenses 77.313 86.325 (9.012) 88.045 (1.720) 84.530 3.515 86.040 (1.510)Total Non-Labor Expenses $1,859.081 $1,858.071 $1.010 $1,924.626 ($66.555) $2,038.255 ($113.629) $2,145.649 ($107.394)
Other Expense Adjustments:Other 0.000 0.000 0.000 0.000 0.000 0.000 0.000 0.000 0.000Total Other Expense Adjustments $0.000 $0.000 $0.000 $0.000 $0.000 $0.000 $0.000 $0.000 $0.000
Total Expenses beforeDepreciation $8,234.517 $8,364.461 ($129.944) $8,579.612 ($215.151) $8,847.111 ($267.499) $9,146.350 ($299.239)
Depreciation 1,544.334 1,638.144 (93.810) 1,688.144 (50.000) 1,863.292 (175.148) 1,913.292 (50.000)OPEB Obligation 1,554.097 1,616.261 (62.164) 1,680.911 (64.650) 1,748.148 (67.237) 1,818.074 (69.926)Environmental Remediation 0.000 0.000 0.000 0.000 0.000 0.000 0.000 0.000 0.000
Total Expenses $11,332.948 $11,618.866 ($285.918) $11,948.667 ($329.801) $12,458.551 ($509.884) $12,877.716 ($419.165)
Net Surplus/(Deficit) ($5,766.085) ($6,054.001) ($287.916) ($6,320.046) ($266.045) ($6,786.797) ($466.751) ($7,137.179) ($350.382)V-227

MTA New York City TransitJuly Financial Plan 2015 - 2018
Year-to-Year Changes by Category - Cash Basis($ in millions)
Favorable/(Unfavorable)Change Change Change Change
2014 2015 2015-2014 2016 2016-2015 2017 2017-2016 2018 2018-2017ReceiptsFarebox Revenue $4,141.649 $4,202.145 $60.496 $4,264.012 $61.867 $4,296.268 $32.256 $4,328.974 $32.706Vehicle Toll Revenue $0.000 $0.000 $0.000 $0.000 $0.000 $0.000 $0.000 $0.000 $0.000Other Operating Revenue:Fare Reimbursement $84.016 $84.016 $0.000 $84.016 $0.000 $84.016 $0.000 $84.016 $0.000Paratransit Reimbursement $179.452 $181.597 $2.145 $198.491 $16.894 $220.795 $22.304 $239.434 $18.639Other $99.606 $49.515 ($50.091) $49.788 $0.273 $50.067 $0.279 $50.351 $0.284Total Other Operating Revenue $363.074 $315.128 ($47.946) $332.295 $17.167 $354.878 $22.583 $373.801 $18.923Capital and Other Reimbursements $1,074.846 $963.157 ($111.689) $939.442 ($23.715) $923.872 ($15.570) $931.858 $7.986Total Receipts $5,579.569 $5,480.430 ($99.139) $5,535.749 $55.319 $5,575.018 $39.269 $5,634.633 $59.615
ExpendituresLabor:Payroll 3,639.689 3,505.716 133.973 3,513.530 (7.814) 3,578.753 (65.223) 3,629.482 (50.729)Overtime 506.390 425.278 81.112 428.322 (3.044) 435.561 (7.239) 443.409 (7.848)Total Salaries & Wages 4,146.079 3,930.994 215.085 3,941.852 (10.858) 4,014.314 (72.462) 4,072.891 (58.577)Health and Welfare 712.331 772.231 (59.900) 825.120 (52.889) 886.298 (61.178) 957.205 (70.907)OPEB Current Payment 340.466 372.186 (31.720) 407.194 (35.008) 443.477 (36.283) 486.120 (42.643)Pensions 981.348 988.142 (6.794) 983.340 4.802 963.281 20.059 969.953 (6.672)Other Fringe Benefits 414.499 403.018 11.481 406.897 (3.879) 416.513 (9.616) 425.830 (9.317)Total Fringe Benefits 2,448.644 2,535.577 (86.933) 2,622.551 (86.974) 2,709.569 (87.018) 2,839.108 (129.539)GASB Account 34.047 0.000 34.047 0.000 0.000 0.000 0.000 8.528 (8.528)Reimbursable Overhead 0.000 0.000 0.000 0.000 0.000 0.000 0.000 0.000 0.000Total Labor Expenditures $6,628.770 $6,466.571 $162.199 $6,564.403 ($97.832) $6,723.883 ($159.480) $6,920.527 ($196.644)
Non-Labor:Electric Power 335.107 307.834 27.273 321.763 (13.929) 371.855 (50.092) 403.243 (31.388)Fuel 168.047 169.046 (0.999) 162.072 6.974 165.005 (2.933) 171.823 (6.818)Insurance 72.033 79.974 (7.941) 89.143 (9.169) 102.639 (13.496) 121.428 (18.789)Claims 86.148 89.236 (3.088) 91.266 (2.030) 93.549 (2.283) 95.887 (2.338)Paratransit Service Contracts 380.004 389.754 (9.750) 425.124 (35.370) 478.292 (53.168) 520.580 (42.288)Mtce. and Other Operating Contracts 227.415 228.874 (1.459) 240.158 (11.284) 231.238 8.920 230.462 0.776Professional Service Contracts 154.134 139.662 14.472 137.662 2.000 139.669 (2.007) 144.124 (4.455)Materials & Supplies 347.682 349.334 (1.652) 346.881 2.453 349.205 (2.324) 353.045 (3.840)Other Business Expenditures 77.726 86.325 (8.599) 88.045 (1.720) 84.530 3.515 86.040 (1.510)Total Non-Labor Expenditures $1,848.296 $1,840.039 $8.257 $1,902.114 ($62.075) $2,015.982 ($113.868) $2,126.632 ($110.650)
Other Expenditure Adjustments:Other 0.000 0.000 0.000 0.000 0.000 0.000 0.000 0.000 0.000Total Other Expenditure Adjustments $0.000 $0.000 $0.000 $0.000 $0.000 $0.000 $0.000 $0.000 $0.000
Total Expenditures $8,477.066 $8,306.610 $170.456 $8,466.517 ($159.907) $8,739.865 ($273.348) $9,047.159 ($307.294)
Net Cash Deficit ($2,897.497) ($2,826.180) $71.317 ($2,930.768) ($104.588) ($3,164.847) ($234.079) ($3,412.526) ($247.679)
V-228

MTA New York City TransitJuly Financial Plan 2015 - 2018
Year-to-Year Changes by Category - Cash Conversion (Cash Flow Adjustments)($ in millions)
Favorable/(Unfavorable)Change Change Change Change
2014 2015 2015-2014 2016 2016-2015 2017 2017-2016 2018 2018-2017ReceiptsFarebox Revenue ($14.537) $10.231 $24.768 $10.231 $0.000 $10.231 $0.000 $10.231 $0.000Vehicle Toll Revenue $0.000 $0.000 $0.000 $0.000 $0.000 $0.000 $0.000 $0.000 $0.000Other Operating Revenue:Fare Reimbursement $0.000 $0.000 $0.000 $0.000 $0.000 $0.000 $0.000 $0.000 $0.000Paratransit Reimbursement $3.272 ($0.324) ($3.596) ($0.230) $0.094 ($0.197) $0.033 ($0.073) $0.124Other ($100.078) ($103.080) ($3.002) ($106.173) ($3.093) ($109.358) ($3.185) ($112.639) ($3.281)Total Other Operating Revenue ($96.806) ($103.404) ($6.598) ($106.403) ($2.999) ($109.555) ($3.152) ($112.712) ($3.157)Capital and Other Reimbursements $124.049 $8.738 ($115.311) $3.300 ($5.438) $2.588 ($0.712) ($3.423) ($6.011)Total Receipt Adjustments $12.706 ($84.435) ($97.141) ($92.872) ($8.437) ($96.736) ($3.864) ($105.904) ($9.168)
ExpendituresLabor:Payroll ($220.751) ($5.210) $215.541 $35.083 $40.293 $26.364 ($8.719) $27.132 $0.768Overtime ($30.713) ($0.632) $30.081 $4.277 $4.909 $3.209 ($1.068) $3.315 $0.106Total Salaries & Wages ($251.464) ($5.842) $245.622 $39.360 $45.202 $29.573 ($9.787) $30.447 $0.874Health and Welfare $5.450 $6.406 $0.956 $6.886 $0.480 $7.403 $0.517 $7.958 $0.555OPEB Current Payment $0.000 $0.000 $0.000 $0.000 $0.000 $0.000 $0.000 $0.000 $0.000Pensions $7.483 ($0.074) ($7.557) $0.352 $0.426 $3.521 $3.169 $4.487 $0.966Other Fringe Benefits $19.244 $39.329 $20.085 $43.985 $4.656 $44.476 $0.491 $45.810 $1.334Total Fringe Benefits $32.177 $45.661 $13.484 $51.223 $5.562 $55.400 $4.177 $58.255 $2.855GASB Account ($34.047) $0.000 $34.047 $0.000 $0.000 $0.000 $0.000 ($8.528) ($8.528)Reimbursable Overhead $0.000 $0.000 $0.000 $0.000 $0.000 $0.000 $0.000 $0.000 $0.000Total Labor Expenditures ($253.334) $39.819 $293.153 $90.583 $50.764 $84.973 ($5.610) $80.174 ($4.799)
Non-Labor:Electric Power $0.000 $0.000 $0.000 $0.000 $0.000 $0.000 $0.000 $0.000 $0.000Fuel $0.000 $0.000 $0.000 $0.000 $0.000 $0.000 $0.000 $0.000 $0.000Insurance ($3.943) ($2.898) $1.045 ($0.573) $2.325 ($0.811) ($0.238) ($4.067) ($3.256)Claims $8.528 $10.630 $2.102 $12.785 $2.155 $12.784 ($0.001) $12.784 $0.000Paratransit Service Contracts $2.000 $2.000 $0.000 $2.000 $0.000 $2.000 $0.000 $2.000 $0.000Mtce. and Other Operating Contracts ($10.260) ($10.700) ($0.440) ($10.700) $0.000 ($10.700) $0.000 ($10.700) $0.000Professional Service Contracts $0.873 $15.000 $14.127 $15.000 $0.000 $15.000 $0.000 $15.000 $0.000Materials & Supplies $14.000 $4.000 ($10.000) $4.000 $0.000 $4.000 $0.000 $4.000 $0.000Other Business Expenditures ($0.413) $0.000 $0.413 $0.000 $0.000 $0.000 $0.000 $0.000 $0.000Total Non-Labor Expenditures $10.785 $18.032 $7.247 $22.512 $4.480 $22.273 ($0.239) $19.017 ($3.256)
Other Expenditure Adjustments:Other $0.000 $0.000 $0.000 $0.000 $0.000 $0.000 $0.000 $0.000 $0.000Total Other Expenditure Adjustments $0.000 $0.000 $0.000 $0.000 $0.000 $0.000 $0.000 $0.000 $0.000
Total Expenditure Adjustments ($242.549) $57.851 $300.400 $113.095 $55.244 $107.246 ($5.849) $99.191 ($8.055)
Total Cash Conversion Adjustmentsbefore Depreciation ($229.843) ($26.584) $203.259 $20.223 $46.807 $10.510 ($9.713) ($6.713) ($17.223)
Depreciation Adjustment $1,544.334 $1,638.144 $93.810 $1,688.144 $50.000 $1,863.292 $175.148 $1,913.292 $50.000OPEB Obligation $1,554.097 $1,616.261 $62.164 $1,680.911 $64.650 $1,748.148 $67.237 $1,818.074 $69.926Environmental Remediation $0.000 $0.000 $0.000 $0.000 $0.000 $0.000 $0.000 $0.000 $0.000
Total Cash Conversion Adjustments $2,868.588 $3,227.821 $359.233 $3,389.278 $161.457 $3,621.950 $232.672 $3,724.653 $102.703
V-229

MTA NEW YORK CITY TRANSIT 2015 Preliminary Budget
July Financial Plan 2015 – 2018 Summary of Major Plan-to-Plan Changes by Generic Categories
2014: July Financial Plan vs. February Financial Plan Operating Revenue Changes Operating revenues are projected to increase from the February Financial Plan by $39.3 million. Major generic category changes include:
Farebox revenue incr eased by $20.7 milli on, due primarily to an increas e in
projected fare media liability expiration revenues, consistent with the March 2013 fare increase.
Other operating revenue improved by $18. 6 million, due largely to the favorable
timing of storm recoveries from 2013 and an increase in parat ransit urban tax revenue.
Operating Expense Changes Excluding an increase in other post-employment benefit expenses, operating expenses increased from the February Financial Plan by $ 166.9 million. Projections includ e additional Payroll, Overtime, Pension, Health & Welf are, Other Fringe Benefit, Other Business Expense, and Reimburs able Overhead expenses attributable t o the recent labor settlement with the TWU and the assumption that the same pattern will be app lied for those employees without contract agreements. Major generic category changes include:
Payroll is projected to increase by $9 0.5 million, du e mostly to the impa ct of
pattern labor wage adjustments, consist ent with the recent TWU labor contract agreement. Vacancies partly offset the wage adjustments.
Overtime is projected to increase by $70. 5 million, due primarily to the impact of adverse weather in early 2014 and pattern labor adjustments.
Health & welfare/OPEB current p ayment expenses are projected to decrease by
$31.3 million, due mostly to cost reduction programs and prior year credits.
Pension expenses are projected to incr ease by $14.5 million, based on current actuarial information and pattern labor adjustments.
V-230

Other fringe benefits are pr ojected to increase by $13.9 million, due mainly to pattern labor adjustment increases.
Electric power expenses are projected to increase by $11.1 million, due mostly to updated inflationary assumptions indicating higher prices.
Insurance expenses are pr ojected to underrun by $4.8 m illion, due to the timing
of interagency payments.
Paratransit service contract expenses are projected to decrease by $12.2 million, due mostly to reduced completed trips.
Maintenance contract expe nses are pr ojected to increase by $3.0 million, due mostly to a rollover of SMS fleet maintenance expenses from 2013.
Professional service contract expenses are projected to decrease by $6.7 million, including Workers’ Compensat ion Board savings, based on new legis lation, partly offset by overruns in bond service and Information Technology expenses.
Materials and supplies expenses are pr ojected to increase by $13.5 million, due
primarily to a rollover from 2013 of SMS fleet maintenance expenses.
Other business e xpenses are proj ected to increas e by $8.0 million , due to the providing of railroad passes to T WU employees, based on the recently appr oved labor agreement.
2015-2017: July Financial Plan vs. February Financial Plan
Operating Revenue Changes Operating revenues are projected to decrease from the February Financial Plan by $0.9 million in 2015, and to increase by $1.8 million in 2016 and $8.7 million in 2017. Major generic category changes include:
Increases in farebox r evenue of $3.3 mill ion in 2015, $9.7 m illion in 2016 and
$22.1 million in 2017, due primarily to higher employment projections. Other operating revenue decreases by $4.1 million in 2 015, $7.9 million in 2 016
and $13.4 million in 2017, du e largely to reductions in NYC paratransit reimbursements, consistent with additional paratransit expense savings.
V-231

Operating Expense Changes Excluding increases in other post-employment benefit ex penses, operating expenses increased from the February Fi nancial Plan by $51.4 million in 2015, and decreased by $0.7 million in 2016 and $23.0 milli on in 2 017. Projections inclu de additional Payroll, Overtime, Pension, Health & Welfare, Oth er Fringe Benefit, Other Business Expens e, and Reimbursable Overhead expenses attributable to the recent labor settlement with the TWU and the assumption that the same pattern will be applied for those employees without contract agreements. Major generic category changes include:
Payroll is projected to increase by $98.8 million in 2015, $97.5 million in 2016,
and $91.2 million in 2017, due mostly to the impact of pa ttern labor adjustments, consistent with the recent TWU labor contract agreement.
Overtime is projected to increase by $32.7 million in 2015, $36.0 million in 201 6, and $36.7 million in 2017, due mostly to the right-siz ing of over time levels and the impact of pattern labor adjustments.
Health & welfare/OPEB current p ayment expenses are projected to decrease by
$28.3 million in 2015, $35.2 million in 2016 and $38.6 million in 2017, due mostly to cost reduction programs.
Pension expenses are projected to increase by $7 .8 million in 201 5, and decrease by $10.8 million in 201 6 and $23.8 million in 2017, based on current actuarial information and pattern labor adjustments.
Other fringe benefit expe nses are projected to increase by $6.2 million in 2 015, $6.7 million in 2016 and $6.8 m illion in 2 017, caused by the impact of pattern labor adjustments.
Electric power expenses are project ed to decrease by $42.1 million in 2015,
$51.8 million in 2016 and $27.9 mill ion in 2017, due mostly to updated inflationary assumptions indicating lower prices.
Paratransit service contract expenses are projected to decrease by $19.8 million
in 2015, $29.5 million in 2016 and $45. 4 million in 2017, due mostly to a projected reduction in completed trip levels.
Other business expe nses are projected to increase by $12.5 million in 2015, $12.6 million in 2016 and $11.0 million in 2017 , due mainly to the providing of railroad passes to TWU employees, based on the recent TWU labor agreement.
V-232

MTA New York City TransitJuly Financial Plan 2015 - 2018
Changes Between Financial Plans by Generic Categories($ in millions)
NON-REIMBURSABLE2014 2015 2016 2017
($2,787.525) ($2,805.706) ($3,015.958) ($3,288.160)
Baseline Changes
RevenueFarebox Revenue $20.718 $3.279 $9.699 $22.110Other Operating Revenue 18.574 (4.136) (7.882) (13.426)Capital and Other Reimbursement 0.000 0.000 0.000 0.000
Total Revenue Changes $39.292 ($0.857) $1.817 $8.684
ExpensesLabor:Payroll ($90.466) ($98.832) ($97.514) ($91.222)Overtime (70.496) (32.708) (36.002) (36.737)Health and Welfare 15.185 10.112 14.712 16.813OPEB Current Payment 16.146 18.224 20.496 21.812Pensions (14.465) (7.817) 10.823 23.833Other Fringe Benefits (13.896) (6.165) (6.723) (6.788)Reimbursable Overhead 7.474 16.687 15.327 16.317
Total Labor Expense Changes ($150.518) ($100.499) ($78.881) ($55.972)
Non-Labor:Electric Power ($11.087) $42.064 $51.753 $27.907Fuel (1.549) (0.558) 6.403 7.449Insurance 4.830 8.819 13.030 18.420Claims (2.994) (5.276) (5.995) (5.799)Paratransit Service Contracts 12.212 19.752 29.466 45.442Maintenance and Other Operating Contracts (3.043) (3.148) (2.407) (3.424)Professional Service Contracts 6.738 1.051 1.957 2.043Materials & Supplies (13.477) (1.048) (2.105) (2.059)Other Business Expenses (8.043) (12.543) (12.560) (11.005)
Total Non-Labor Expense Changes ($16.413) $49.113 $79.542 $78.974
Depreciation $0.000 $0.000 $0.000 $0.000
Total Expense Changes ($166.931) ($51.386) $0.661 $23.002
Cash Adjustment Changes
Revenue (26.375) (6.389) (6.548) (6.828)Expense (0.751) 46.464 88.216 98.803Depreciation 0.000 0.000 0.000 0.000
Total Cash Adjustment Changes ($27.126) $40.075 $81.668 $91.975
($154.765) ($12.168) $84.146 $123.661
($2,942.290) ($2,817.874) ($2,931.812) ($3,164.499)
February Financial Plan - Cash
Total Baseline Changes
July Financial Plan - Cash Surplus/(Deficit)
V-233

MTA New York City TransitJuly Financial Plan 2015 - 2018
Changes Between Financial Plans by Generic Categories($ in millions)
REIMBURSABLE 2014 2015 2016 2017
$0.000 $0.000 $0.000 $0.000
Baseline Changes
RevenueFarebox RevenueOther Operating RevenueCapital and Other Reimbursement 6.018 45.882 40.870 42.540
Total Revenue Changes $6.018 $45.882 $40.870 $42.540
ExpensesLabor:Payroll $9.677 ($17.910) ($16.100) ($15.888)Overtime (7.346) (4.657) (4.358) (5.881)Health and Welfare 0.570 0.365 0.685 0.898OPEB Current Payment 0.000 0.000 0.000 0.000Pensions 1.162 1.317 1.809 2.190Other Fringe Benefits (0.019) (7.910) (7.563) (7.528)Reimbursable Overhead (7.474) (16.687) (15.327) (16.317)
Total Labor Expense Changes ($3.430) ($45.482) ($40.854) ($42.526)
Non-Labor:Electric Power $0.000 $0.000 $0.000 $0.000Fuel 0.000 0.000 0.000 0.000InsuranceClaims (0.002) (0.002) (0.002)Paratransit Service ContractsMaintenance and Other Operating Contracts (2.810) 0.175 0.175 0.175Professional Service Contracts (0.625)Materials & Supplies (1.807) (0.560) (0.174) (0.174)Other Business Expenses 2.654 (0.013) (0.015) (0.013)
Total Non-Labor Expense Changes ($2.588) ($0.400) ($0.016) ($0.014)
Total Expense Changes ($6.018) ($45.882) ($40.870) ($42.540)
Cash Adjustment Changes
Capital Reimbursement Timing 44.793 (8.306) 1.044 (0.348)
Total Cash Adjustment Changes $44.793 ($8.306) $1.044 ($0.348)
$44.793 ($8.306) $1.044 ($0.348)
$44.793 ($8.306) $1.044 ($0.348)
February Financial Plan - Cash
Total Baseline Changes
July Financial Plan - Cash Surplus/(Deficit)
V-234

MTA New York City TransitJuly Financial Plan 2015 - 2018
Changes Between Financial Plans by Generic Categories($ in millions)
NON-REIMBURSABLE and REIMBURSABLE
2014 2015 2016 2017
($2,787.525) ($2,805.706) ($3,015.958) ($3,288.160)
Baseline Changes
RevenueFarebox Revenue $20.718 $3.279 $9.699 $22.110Other Operating Revenue 18.574 (4.136) (7.882) (13.426)Capital and Other Reimbursement 6.018 45.882 40.870 42.540
Total Revenue Changes $45.310 $45.025 $42.687 $51.224
ExpensesLabor:Payroll ($80.789) ($116.742) ($113.614) ($107.110)Overtime (77.842) (37.365) (40.360) (42.618)Health and Welfare 15.755 10.477 15.397 17.711OPEB Current Payment 16.146 18.224 20.496 21.812Pensions (13.303) (6.500) 12.632 26.023Other Fringe Benefits (13.915) (14.075) (14.286) (14.316)Reimbursable Overhead 0.000 0.000 0.000 0.000
Total Labor Expense Changes ($153.948) ($145.981) ($119.735) ($98.498)
Non-Labor:Electric Power ($11.087) $42.064 $51.753 $27.907Fuel (1.549) (0.558) 6.403 7.449Insurance 4.830 8.819 13.030 18.420Claims (2.994) (5.278) (5.997) (5.801)Paratransit Service Contracts 12.212 19.927 29.641 45.617Maintenance and Other Operating Contracts (5.853) (3.148) (2.407) (3.424)Professional Service Contracts 6.113 1.051 1.957 2.043Materials & Supplies (15.284) (1.608) (2.279) (2.233)Other Business Expenses (5.389) (12.556) (12.575) (11.018)
Total Non-Labor Expense Changes ($19.001) $48.713 $79.526 $78.960
Depreciation $0.000 $0.000 $0.000 $0.000
Total Expense Changes ($172.949) ($97.268) ($40.209) ($19.538)
Cash Adjustment Changes
Revenue (26.375) (6.389) (6.548) (6.828)Expense (0.751) 46.464 88.216 98.803Capital Reimbursement Timing 44.793 (8.306) 1.044 (0.348)Depreciation 0.000 0.000 0.000 0.000
Total Cash Adjustment Changes $17.667 $31.769 $82.712 $91.627
($109.972) ($20.474) $85.190 $123.313
($2,897.497) ($2,826.180) ($2,930.768) ($3,164.847)
February Financial Plan - Cash
Total Baseline Changes
July Financial Plan - Cash Surplus/(Deficit)
V-235

MTA NEW YORK CITY TRANSIT 2015 Preliminary Budget
July Financial Plan 2015 – 2018 Summary of Major Plan-to-Plan Changes
2014: July Financial Plan vs. February Financial Plan Revenue Changes Total revenue changes from the February Financial Plan increased by $45.3 million. Major changes include:
Farebox revenue incr eased by $20.7 milli on, due primarily to an increas e in
projected fare media liability expiration revenues, consistent with the March 2013 fare increase.
Other operating revenue improved by $18. 6 million, due largely to the favorable
timing of storm recoveries from 2013 and an increase in parat ransit urban tax revenue.
Capital reimbursements increase by $6.0 million to provide for reimbursement of reimbursable expense increases. .
Expense Changes Excluding an increas e in ot her post-employment benefit expenses, total expenses increased from the February Financial Plan by $ 172.9 million. Projections includ e additional Payroll, Overtime, Pension, Health & Welf are, Other Fringe Benefit, Other Business Expense, and Reimburs able Overhead expenses attributable t o the recent labor settlement with the TWU and the assumption that the same pattern will be app lied for those employees without contract agreements. Major changes include:
The impact of pattern labor adjustments, consistent with t he recent TWU labor
contract agreement, resulting in expense increases of $127.1 million.
The adverse impact in early 2014 of multip le snowstorms, resulting in a co st of $36.1 million.
The unfavorable timing of expenses of $26.0 million from 2013.
New programmatic initiatives, mostly maintenance-related, costing $14.7 million.
V-236

Savings from a new 2014 Budget Reducti on Program of $19.6 million and $16.7 million of additional paratransit expense savings applicable to a prior year BRP.
Cash Adjustments Cash adjustments are projected to be a favorable by $17.7 million. Major changes include:
Favorable 2014 cash timing of $ 101.5 million from 2013, including $95.4 million of capital reimbursement timing.
A reduction in GASB account funding o f $35.4 million, need ed to help fund excess cash requirements arising from pattern labor adjustments.
An unfavorable capital reimbur sement volume/processing lag adjustment of
$40.0 million.
TWU labor contract retro payments of $32.7 million.
A reduction of farebox receipts of $23.8 million, represent ing a negative cash receipt lag resulting from the March 2013 fare increase.
2015-2017: July Financial Plan vs. February Financial Plan Revenue Changes Total revenue changes from t he February Financial Plan resu lt in increas es of $45.0 million in 2015, $42.7 million in 2016 and $51.2 million in 2017. Major changes include:
Increases in farebox r evenue of $3.3 mill ion in 2015, $9.7 m illion in 2016 and $22.1 million in 2017, due primarily to higher employment projections.
Other operating revenue decreased by $4.1 million in 2015, $7.9 million in 2016
and $13.4 million in 2017, du e largely to reductions in NYC paratransit reimbursement, consistent with additional paratransit expense savings.
Capital reimbursements increase by $45.9 million in 2015, $40. 9 million in 2016 and $42.5 million in 2017 to provide for reimbursement of reimbursable expense increases.
V-237

Expense Changes Excluding increases in ot her post-employment benefit expenses, total expenses increased by $97.3 million in 2015, $40.2 million in 2016 an d $19.5 million in 20 17. Projections include additional Payroll, Overtime, Pension, Health & Welfa re, Other Fringe Benefit, Other Business Expense, and Reimbursable Overhead expens es attributable to the recent labor s ettlement with the T WU and the assumption that the same pattern will be applied for those employees without contract agreements. Major changes include:
The impact of pattern labor adjustments, consistent with t he recent TWU labor
contract agreement, resulting in expense increases o f $141.2 million in 2015, $144.3 million in 2016 and $138.6 million in 2017.
Increased reimbursable expenses of $45.9 million in 2015, $40.9 million in 2016 and $42.5 million in 2016, due mostly to pattern labor adjustments.
New programmatic in itiatives, mostly maintenance-related, costing $11.8 million in 2015, $10.0 million in 2016 and $7.1 million in 2017.
Updated inflation ass umptions, resulting in lower expenses of $43.7 million in 2015, $65.9 millio n in 2016 and $45.2 million in 2017, mostly related to lo wer electric power prices.
Savings from a new 2014 B udget Reduction Program of $26.4 million for each year and $22.6 million in 2015, $33.5 million in 2016 and $50.0 million in 2017 of additional paratransit expense savings applicable to a prior year BRP.
Pension re-estimates, resulting in savings of $3.5 million in 2015, $19.7 million in 2016 and $35.2 million in 2017.
Cash Adjustments Cash adjustments are proj ected to be favorable by $31.8 million in 2015, $82.7 million in 2016 and $91.6 million in 2017. Major changes include:
Reductions in GASB account funding of $ 75.7 million in 2015, $83.2 million in 2016 and $90.7 million in 2017 , needed to help fun d excess cash requirements arising from pattern labor adjustments.
TWU labor contract retro payments of $32.9 million in 2015.
V-238

TOTAL NON-REIMBURSABLE and REIMBURSABLE
2014 2015 2016 2017
February Financial Plan - Cash Surplus/(Deficit) ($2,787.525) ($2,805.706) ($3,015.958) ($3,288.160)
Non-Reimbursable Major Changes
RevenueFarebox $20.718 $3.279 $9.699 $22.110Other Operating Revenue 18.574 (4.136) (7.882) (13.426) Sub-Total Non-Reimbursable Revenue Changes $39.292 ($.857) $1.817 $8.684
Expenses
Inflation-Related:
Electric Power (7.682) 42.158 51.847 28.001Health & Welfare Rates 6.604 4.388 10.047 12.693Bus/Heating Fuel ($1.646) ($1.202) $5.512 $6.230Materials, Rentals and Miscellaneous Expenses 0.000 (1.676) (1.470) (1.768)Sub-total Inflation-Related (2.724) 43.668 65.936 45.156
Programmatic Initiatives:Bus Maintenance-Overage Fleet (6.405) (4.681) (2.849) 0.000Station Cleaning Support (2.438) (3.292) (3.292) (3.292)Ttrack Construction Maintenance Workforce (2.944) (2.274) (2.274) (2.274)Rapid Transit Operations-Lengthened Training Periods ($2.940) ($1.545) ($1.545) ($1.545)Sub-total Programmatic Initiatives ($14.727) ($11.792) ($9.960) ($7.111)
Budget Reduction Programs:EGWP Program $12.229 $15.676 $15.676 $15.676Medical Eligibility Initiative 2.720 2.798 2.798 2.798Subways Availability-Reduce Injury On Duty Lost Days 0.000 1.729 1.729 1.729Subways Availability-Video RTK Training at Home 0.000 0.651 0.651 0.651Subways Car Equipment Division-Facility Cleaning Efficiency 1.480 2.864 2.864 2.864Revenue Collection Efficiencies 1.895 1.518 1.518 1.518Tower Operator Efficiencies 1.247 1.164 1.164 1.164Sub-total 2014 Budget Reduction Program 19.571 26.400 26.400 26.400Paratransit Savings-Prior Year BRP-Expense Savings Only 16.718 22.642 33.506 49.972Sub-total Budget Reduction Programs $36.289 $49.042 $59.906 $76.372
Technical Adjustments/Re-estimates:Pattern Labor Wage Adjustments ($127.101) ($141.249) ($144.295) ($138.613)Adverse Weather (36.073) 0.000 0.000 0.000Timing of 2013 Results Impacting 2014 (25.978) 0.000 0.000 0.000Pension Re-estimate ($6.637) $3.538 $19.694 $35.155Workers' Compensation Board Reforecast 7.415 7.961 7.961 7.960Insurance re-estimate 5.580 9.839 13.591 17.760Pubic Liability (2.992) (5.274) (5.993) (5.797)Bus Maintenance Overtime Adjustment (4.500) (4.941) (4.941) (4.941)Availablility/Pay Hour Adjustments (8.558) (8.118) (8.118) (8.118)Reimbursable Adjustments 9.333 9.696 7.957 8.206All Other 3.742 (3.756) (1.077) (3.027) (185.769) (132.304) (115.221) (91.415)
Sub-Total Non-Reimbursable Expense Changes* ($166.931) ($51.386) $.661 $23.002
Total Non-Reimbursable Major Change* ($127.639) ($52.243) $2.478 $31.686
Reimbursable Major Changes
RevenueIncreased Reimbursements-Higher Expenses 6.018 45.882 40.870 42.540 Sub-Total Reimbursable Revenue Changes $6.018 $45.882 $40.870 $42.540
ExpensesHigher Expenses (6.018) (45.882) (40.870) (42.540) Sub-Total Reimbursable Expense Changes ($6.018) ($45.882) ($40.870) ($42.540)
Total Reimbursable Major Changes $.000 $.000 $.000 $.000
Total Accrual Changes ($127.639) ($52.243) $2.478 $31.686
Cash Adjustment ChangesTiming of 2013 Results Impacting 2014 $101.475 $.000 $.000 $.000Capital Reimbursement Adjustments (49.291) (8.306) 1.044 (0.348)Salaries & Wages-Mostly Labor Contract Retro Payments (32.731) (32.913) 0.894 1.300GASB Account Payments 35.441 75.731 83.187 90.706Fringe Benefit Payment Timing (7.293) (8.954) (8.771) (5.871)Farebox Receipts (23.768) 0.000 0.000 0.000Other-Mostly Non-Labor Account Payment Timing (6.166) 6.211 6.358 5.840
Total Cash Adjustment Changes* $17.667 $31.769 $82.712 $91.627
Total Baseline Changes ($109.972) ($20.474) $85.190 $123.313
July Financial Plan - Cash Surplus/(Deficit) ($2,897.497) ($2,826.180) ($2,930.768) ($3,164.847)
*Excluding Other Post-Employment Benefit Long-Term Liability Changes
MTA NEW YORK CITY TRANSITJuly Financial Plan 2015- 2018
Summary of Major Programmatic Changes Between Financial Plans($ in millions)
V-239

MTA NEW YORK CITY TRANSIT 2015 Preliminary Budget
July Financial Plan 2015 – 2018
RIDERSHIP/ (UTILIZATION) The July 2014 Financial Plan baseline riders hip forecast assumes that the weathe r adjusted January-April 2014 trend, which was 0.4% above budget for subway and 0.7% below budget for bus, will continue for the rest of the year. As a result of higher tha n expected 2014 subway ridership, lower than expected bus ridership, a slower than expected ridership increase due to fare evas ion, and severe winter weather in January and February, projected 2014 s ubway and bus ridership is 22.5 million lower than the February 2014 Plan. In developing the 2015 ridership foreca st, 2014 ridership was adjusted upward to account for the severe winter weather in January and February 2014. 2015 subway ridership is projected to increase by ap proximately 1.6% based on the revis ed 2015 employment forecast, which was higher t han the August 2013 forecast used in the February 2014 Plan. 2015 bus ridership is pr ojected to increase by approximately 0.7%, based on a 40% factor appl ied to the employment forecast. The 40% bus factor was also used in the February Plan and is based on an analysis of his torical bus ridership showing a lower employment elas ticity on bus than on subway. The revised 2015 forecast also includes an 8.3 million r eduction in bus rider ship recovered through fare evasion enforcement. As a result of lower bus ridership and a lower estimate of recoverable bus ridership from fare evasi on enforcement, partially offset by higher subway ridership and a hig her 2015 employment forecas t, projected 2015 subway and bus ridership is 4.8 million lower than the February Plan. Working off the revised 2015 bas eline projection, 2016-2018 subway and bus ridership growth forecasts are based on the April 2014 employment forecast, which projects larger employment increases in 2016-2018 than the forecast used in the February 2014 Plan. The bus riders hip increase due to f are evasion enforcement is projected to be lower than the February Plan by 10.0 million in 2016, 8.3 million in 2017, and 6.7 million in 2018. The resulting ridersh ip is expected to be 1.6 m illion lower than the February Plan in 2016, and 5.9 million higher in 2017.
V-240

2013 Actual
2014 Mid-Year Forecast
2015 Preliminary
Budget 2016 2017 2018
RIDERSHIP
Subway 1,707.556 1,733.145 1,768.647 1,796.063 1,810.852 1,824.133 Bus 677.569 668.961 680.991 687.330 689.680 694.081 Paratransit 9.266 9.372 10.216 10.932 11.697 12.516
Total Ridership 2,394.391 2,411.478 2,459.854 2,494.325 2,512.229 2,530.730
FAREBOX REVENUE (Excluding fare media liability)
Subway 3,030.746 3,123.375 3,172.108 3,223.225 3,250.798 3,275.560 Bus 941.063 946.280 956.511 965.965 969.260 975.720 Paratransit 16.465 16.993 18.525 19.821 21.209 22.693
Total Farebox Revenue 3,988.274 4,086.648 4,147.144 4,209.011 4,241.267 4,273.973
MTA NEW YORK CITY TRANSITJuly Financial Plan 2015- 2018
Ridership/Traffic Volume (Utilization)($ in millions)
V-241

Administration Pos. 2014 Pos. 2015 Pos. 2016 Pos. 2017 Pos. 2018
EGWP Program 0 12.229 0 15.676 0 15.676 0 15.676 0 15.676Medical Eligibility Initiative 0 2.720 0 2.798 0 2.798 0 2.798 0 2.798Subtotal Administration 0 14.949 0 18.474 0 18.474 0 18.474 0 18.474
Customer Convenience/AmenitiesNone 0 0.000 0 0.000 0 0.000 0 0.000 0 0.000Subtotal Customer Convenience/Amenities 0 0.000 0 0.000 0 0.000 0 0.000 0 0.000
MaintenanceDOS Availability-Reduce IOD Lost Days 0 0.000 0 1.729 0 1.729 0 1.729 0 1.729DOS Availability-Video RTK Training at Home 0 0.000 23 0.651 23 0.651 23 0.651 23 0.651DCE Facility Cleaning Efficiency 28 1.480 28 2.864 28 2.864 28 2.864 28 2.864Subtotal Maintenance 28 1.480 51 5.244 51 5.244 51 5.244 51 5.244
Revenue EnhancementNone 0 0.000 0 0.000 0 0.000 0 0.000 0 0.000Subtotal Revenue Enhancement 0 0.000 0 0.000 0 0.000 0 0.000 0 0.000
SafetyNone 0 0.000 0 0.000 0 0.000 0 0.000 0 0.000Subtotal Safety 0 0.000 0 0.000 0 0.000 0 0.000 0 0.000
SecurityNone 0 0.000 0 0.000 0 0.000 0 0.000 0 0.000Subtotal Security 0 0.000 0 0.000 0 0.000 0 0.000 0 0.000
ServiceRevenue Collection Efficiencies 17 1.895 17 1.518 17 1.518 17 1.518 17 1.518Tower Operator Effifciencies 2 1.247 12 1.164 12 1.164 12 1.164 12 1.164Subtotal Service 19 3.142 29 2.682 29 2.682 29 2.682 29 2.682
Service SupportNone 0 0.000 0 0.000 0 0.000 0 0.000 0 0.000Subtotal Service Support 0 0.000 0 0.000 0 0.000 0 0.000 0 0.000
OtherNone 0 0.000 0 0.000 0 0.000 0 0.000 0 0.000Subtotal Other 0 0.000 0 0.000 0 0.000 0 0.000 0 0.000
Agency Submission 47 $19.571 80 $26.400 80 $26.400 80 $26.400 80 $26.400
NEW YORK CITY TRANSITJuly Financial Plan 2015-2018
2014 Budget Reduction Plan Summary($ in millions)
Favorable/(Unfavorable)
V-242

July Financial Plan 2015-2018
2014 Budget Reduction Plan Worksheet
Category by Function: Health & Welfare - Administration
Program: Employee Group Waiver Plan (EGWP)
Background Details:
Program Description/Implementation Plan:
Program Implementation Date: 1/1/2014 When will savings begin?: 1/1/2014
Are these savings recurring?: Yes
Other Issues:
2014 2015 2016 2017 2018Financial Impact (Operating): $12.229 $15.676 $15.676 $15.676 $15.676
Net Cash Savings (in millions) $12.229 $15.676 $15.676 $15.676 $15.676
Total Positions Required: N/A N/A N/A N/A N/A
NEW YORK CITY TRANSIT
NYCT has been the recipient in recent years of an annual Retiree Drug Subsidy (RDS) from thefederal government for continuing to offer a prescription drug plan to Medicare eligible membersthat is at least equal to a Medicare Part D prescription drug plan.The Affordable Care Act (“ACA”), through the Center for Medicare and Medicaid Services(“CMS”), makes provision for an Employer Group Waiver Plan (EGWP), which is more financiallyattractive alternative to RDS for Medicare eligible members.
NYCT has implemented EGWP with partners UHC and Perscription Solutions, and the agency iscurrently receiving significant scheduled rebates for drug costs from both the Drug Manufacturersand CMS for employees whom have elected to enroll in EGWP.
Favorable/(Unfavorable)
V-243

July Financial Plan 2015-2018
2014 Budget Reduction Plan Worksheet
Category by Function: Health & Welfare - Administration
Program: Medical Eligibility Initiative
Background Details:
Program Description/Implementation Plan:
Program Implementation Date: 1/1/2014 When will savings begin?: 1/1/2014
Are these savings recurring?: Yes
Other Issues:
2014 2015 2016 2017 2018Financial Impact (Operating): $2.720 $2.798 $2.798 $2.798 $2.798
Net Cash Savings (in millions) $2.720 $2.798 $2.798 $2.798 $2.798
Total Positions Required: N/A N/A N/A N/A N/A
NEW YORK CITY TRANSIT
In collaboration with BSC and Audit, NYCTA has been refining employee eligibility transmissionfiles to benefit providers. The approach has been two pronged: 1.) to clean up ineligibles, and to2.) automate transfer of medicare eligible employees to Medicare primary as they age into thecohort
A cross functional workgroup has been meeting bi-weekly to address a backlog of ineligibleemployees in both PeopleSoft as well as the benefit providor files. The team has identified andaddressed many technical hurdles to either resolve classification errors or to automateclassification with better timing triggers, resulting in reduced medical claims expense paid by the
Favorable/(Unfavorable)
V-244

July Financial Plan 2015-2018
2014 Budget Reduction Plan Worksheet
Category by Function: Maintenance
Program: DOS Availability - Reduce IOD Lost Days
Background Details:
Program Description/Implementation Plan:
Labor agreement concerns?: No If Yes, describe in Other Issues below. N/A
Layoffs required?: No If Yes, when?: N/A
Program Implementation Date: 1/1/2015 When will savings begin?: 1/1/2015
Are these savings recurring?: Yes
Other Issues:
2014 2015 2016 2017 2018Financial Impact (Operating):
Net Cash Savings (in millions) $0.000 $1.729 $1.729 $1.729 $1.729
Total Positions Required: N/A N/A N/A N/A N/A
NEW YORK CITY TRANSIT
Worker's Compensation savings for hourly employee's in the Department of Subways.
Savings will be achieved through a more comprehensive and aggressive monitoring and reviewof IOD (Injury-on-Duty) claims by the Department of Subways through the Division of OperationsSupport and Administration to reduce the number of days employees are out of work long-term.
Favorable/(Unfavorable)
V-245

July Financial Plan 2015-2018
2014 Budget Reduction Plan Worksheet
Category by Function: Maintenance
Program: DOS Availability - Video RTK Training at Home
Background Details:
Program Description/Implementation Plan:
Program Implementation Date: 1/12015 When will savings begin?: 1/12015
Are these savings recurring?: Yes
Other Issues:
2014 2015 2016 2017 2018Financial Impact (Operating):
Net Cash Savings (in millions) $0.000 $0.651 $0.651 $0.651 $0.651
Total Positions Required: 0 23 23 23 23
NEW YORK CITY TRANSIT
Implement the Right To Know (RTK) Training at Home using the "Automated Tool" developedthrough the Bombardier Settlement to increase Station Agent and Station Cleaner availabilitywhile increasing UOT as training will be done at home. Given the automation of training, areduction of 30% in training hours will be achieved. This results in eliminating the need forbackfill, but incurring overtime for training offset by a reduction in the training hours.
The RTK Training at Home will be implemented starting Jan 1, 2015. 13 Station Agents and 10Cleaners will be reduced given the increase in availability and UOT will be applied to the reducedhours of training done at home.
Favorable/(Unfavorable)
V-246

July Financial Plan 2015-2018
2014 Budget Reduction Plan Worksheet
Category by Function: Maintenance
Program: DCE Facility Cleaning Efficiency
Background Details:
Program Description/Implementation Plan:
Program Implementation Date: 7/1/2014 When will savings begin?: 7/1/2014
Are these savings recurring?: Yes
Other Issues:
2014 2015 2016 2017 2018Financial Impact (Operating):
Net Cash Savings (in millions) $1.480 $2.864 $2.864 $2.864 $2.864
Total Positions Required: 28 28 28 28 28
NEW YORK CITY TRANSIT
Implement improved processes for car and facility cleaning that will result in cleaning positionreductions and a decrease in OTPS expenses in Car Equipment's maintenance and overhaulshops.
Savings initiative will result in a 2% reduction in cleaner positions at 13 maintenance and 2overhaul shops.
Favorable/(Unfavorable)
V-247

July Financial Plan 2015-2018
2014 Budget Reduction Plan Worksheet
Category by Function: Service
Program: Revenue Efficiencies
Program Implementation Date: Jan-14 When will savings begin?: Jan-14
Are these savings recurring?: Yes
Other Issues:
2014 2015 2016 2017 2018Financial Impact (Operating):
Net Cash Savings (in millions) $1.895 $1.518 $1.518 $1.518 $1.518
Total Positions Required: 17 17 17 17 17
NEW YORK CITY TRANSIT
This initiative reflects reductions in labor costs resulting from the implementation of the Green Fee and other operational efficiencies. With the implementation of the Green fee charge the number of Metrocards produced has decreased resulting in the need for (8) fewer cashier positions. Revenue collections has reduced the number of collecting agents (9) based on historical operations. 2014 includes vacancy savings as well. Unscheduled overtime has also been reduced based on the same operating trends beginning in 2015.
Program Description/Implementation Plan: Reductions in budgeted staff began in January 2014 while overtime reductions begin in 2015.
Favorable/(Unfavorable)
V-248

July Financial Plan 2015-2018
2014 Budget Reduction Plan Worksheet
Category by Function: Service
Program: Tower Operation Efficiencies
Background Details:
Program Description/Implementation Plan:
Program Implementation Date: 1/1/2014 When will savings begin?: 1/1/2014
Are these savings recurring?: Yes
Other Issues:
2014 2015 2016 2017 2018Financial Impact (Operating):
Net Cash Savings (in millions) $1.247 $1.164 $1.164 $1.164 $1.164
Total Positions Required: 2 12 12 12 12
NEW YORK CITY TRANSIT
RTO Subdivision B Tower Operator and Supervision reduction resulting from a Zero Base Budget(ZBB) analysis of the function. Subdivision A has already been done.
2014 savings are being achieved through existing Tower Operator and supervision vacanciesprojected to year-end. In 2015, 2 Train Dispatcher and 10 Tower Operator positions will beeliminated from the Spring and Fall Picks based on the ZBB.
Favorable/(Unfavorable)
V-249

MTA NEW YORK CITY TRANSIT 2015 Preliminary Budget
July Financial Plan 2015 – 2018 Positions
POSITION ASSUMPTIONS 2014: July Financial Plan vs. February Financial Plan Total baseline positions are projected to in crease by 136, including a non-reimbursable increase of 164 and a reimbursable decrease of 28. Specifically: New Needs (total increase of 176 positions) includes:
66 positions for Bus Maintenance – Overage Fleet 31 positions for RTO – Lengthened Training Periods 44 positions for Station Cleaning 35 positions for Track Construction Maintenance
(These initiatives are summarized at the beginning of the introductory narrative.)
BRPs (total decrease of 47 positions) includes:
-28 positions for Car Equipment Facility Cleaning Efficiency -17 positions for Revenue Collection Efficiencies -2 positions for Tower Operations Efficiencies
Reimbursable and Re-estimate (net increase of 7 positions). The breakdown of the 136 position increase by function is as follows: Administration (total decrease of 84 positions) includes:
-149 positions reflects the impact of the TWU labor settlement and c apital engineering vacancy provisions.
37 positions to support procurement workload increase 28 positions for miscellaneous other
Operations (total increase of 104 positions) include:
60 positions in Buses mainly due to reallocation from maintenance. 52 positions for Subways Service Delivery training float adjustments -8 positions for miscellaneous other
Maintenance (total increase of 114 positions) includes:
105 positions in Subways mainly due to capital project requirements 9 position for miscellaneous other
V-250

Position increases by occupational group are: Managers/Supervisors +22, Professional, Technical, Clerical +25, and Operational Hourlies +89. For further details, please see position tables. 2015: July Financial Plan vs. February Financial Plan New Needs (total increase of 132 positions) includes:
48 positions for Bus Maintenance – Overage Fleet 15 positions for RTO – Lengthened Training Periods 44 positions for Station Cleaning 25 positions for Track Construction Maintenance
BRPs (total decrease of 80 positions) includes:
-28 positions for Car Equipment Facility Cleaning Efficiency -17 positions for Revenue Collection Efficiencies -23 positions for Subways availability improvement for video training at home -12 positions for Tower Operations Efficiencies
Reimbursable and Re-est imate (net increase of 44 positions) mainly due to Subways capital program support.
The breakdown of the 96 position increase by function is as follows:
Administration (total decrease of 21 positions) Operations (total increase of 69 pos itions) – mainly due to platform budget
changes and training float adjustments Maintenance (total increase of 43 pos itions) – mainly due to new needs noted
above. Public Safety (total increase of 5 positions)
Position increases by occupational group are: Managers/Supervisors +63, Professional, Technical, Clerical +44, and Operational Hourlies -11. 2016 - 2017: July Financial Plan vs. February Financial Plan New Needs (total increase of 84 positions in 2016 and 2017) includes:
15 positions for RTO – Lengthened Training Periods 44 positions for Station Cleaning 25 positions for Track Construction Maintenance
BRPs (total decrease of 80 positions in 2016 and 2017) includes:
-28 positions for Car Equipment Facility Cleaning Efficiency -17 positions for Revenue Collection Efficiencies
V-251

-23 positions for Subways availability improvement for video training at home -12 positions for Tower Operations Efficiencies
Reimbursable and Re-estimate (net decrease of 15 posi tions in 2016, and 24 pos itions in 2017). In 2016, the net decrease is 11 positions. In 2017, net decrease of 20 positions. There are no significant changes by functional category. Position increases by occ upational group in 2016 are: Managers/Su pervisors +39, Professional, Technical, Clerical +33, and Operationa l Hourlies -83. In 2017, positions increase among Managers/Supervisors +38, and Professional, Technical, Clerical +31 and Operational Hourlies -89. Year over Year 2015 over 2014 Total positions decrease by 313. The decr ease is mainly due to changes in Subway s due to platform budget – normal budget in creases and new needs, training float adjustments, SMS and capital project completion. 2016 over 2015 Total positions decrease by 445. The decr ease is mainly due to changes in Subway s due to platform budget – normal budget in creases and new needs, training float adjustments, SMS and capital project completion. 2017 over 2016 Total positions increase by 121 positions, mainly due to operating staff requirements for 2nd Avenue Subway. 2018 over 2017 Total positions decrease by 45 positions, mainly due to changes in Subways SMS program.
V-252

2014 2015 2016 2017
2014 February Plan ‐ Total Baseline Positions 47,311 47,038 46,700 46,830
Total Plan‐to‐Plan Changes (136) (96) 11 20
2014 July Plan ‐ Total Baseline Positions 47,447 47,134 46,689 46,810
Total Year‐to‐Year Changes, July Plan n/a 313 445 (121)
Total Plan‐to‐Plan Changes by Reporting Category:
Non‐Reimbursable (164) (26) 49 48Reimbursable 28 (70) (38) (28)
Total (136) (96) 11 20Full‐Time (136) (96) 11 20Full‐Time Equivalents 0 0 0 0
Total (136) (96) 11 20By Function Category ‐ Administration 84 21 30 29 ‐ Operations (104) (69) (40) (33) ‐ Maintenance (114) (43) 26 29 ‐ Engineering/Capital 0 0 0 0 ‐ Public Safety (2) (5) (5) (5)
Total (136) (96) 11 20By Occupational Group ‐ Managers/Supervisors (22) (63) (39) (38) ‐ Professional, Technical, Clerical (25) (44) (33) (31) ‐ Operational Hourlies (89) 11 83 89
Total (136) (96) 11 20
Total Plan‐to‐Plan Changes by Major Category:2014 BRPs 47 80 80 80New Needs (176) (132) (84) (84)Change in Reimbursable Positions 28 (70) (38) (28)
Re‐estimates & All Other 1 (35) 26 53 52Total (136) (96) 11 20
1 Includes Full‐time Equivalents
MTA NEW YORK CITY TRANSIT
July Financial Plan 2015 ‐ 2018Favorable/(Unfavorable)
Total Position Changes at a Glance
V-253

2013 Actual
2014 Mid-Year Forecast
2015 Preliminary
Budget 2016 2017 2018Administration
Office of the President 53 60 60 60 60 60 Law 267 278 278 277 277 277 Office of the EVP 40 42 42 40 40 40 Human Resources 247 219 215 214 214 214 Office of Management and Budget 36 40 40 40 40 40 Capital Planning & Budget 28 33 33 33 33 33 Corporate Communications 236 262 262 258 258 258 Technology & Information Services 427 447 444 442 442 442 Non-Departmental 1 (100) (29) (7) (6) (6) Labor Relations 85 96 96 96 96 96 Materiel 237 290 281 263 262 262 Controller 142 137 137 130 130 130
Total Administration 1,799 1,804 1,859 1,846 1,846 1,846
Operations Subways Service Delivery 7,679 7,730 7,614 7,561 7,582 7,581 Subways Operation Support /Admin 366 369 369 369 369 369 Subways Stations 2,633 2,632 2,612 2,612 2,612 2,612
Subtotal - Subways 10,678 10,731 10,595 10,542 10,563 10,562 Buses 10,521 10,756 10,706 10,706 10,706 10,706 Paratransit 194 213 213 213 213 213 Operations Planning 395 404 377 371 371 371 Revenue Control 431 448 448 448 448 448
Total Operations 22,219 22,552 22,339 22,280 22,301 22,300
Maintenance Subways Operation Support /Admin 190 200 183 158 158 158 Subways Engineering 323 329 315 294 291 290 Subways Car Equipment 4,197 4,317 4,368 4,243 4,109 4,068 Subways Infrastructure 1,423 1,476 1,447 1,436 1,434 1,434 Subways Elevator & Escalators 370 401 401 403 403 403 Subways Stations 3,476 3,637 3,605 3,610 3,765 3,765 Subways Track 2,705 2,732 2,732 2,732 2,732 2,732 Subways Power 593 624 594 580 580 580 Subways Signals 1,408 1,443 1,382 1,360 1,360 1,360 Subways Electronics Maintenance 1,399 1,477 1,463 1,435 1,435 1,435
Subtotal - Subways 16,084 16,636 16,490 16,251 16,267 16,225 Buses 3,700 3,762 3,728 3,652 3,736 3,734 Revenue Control 137 137 137 137 137 137 Supply Logistics 561 561 558 558 558 558 System Safety 88 91 91 88 88 88
Total Maintenance 20,570 21,187 21,004 20,686 20,786 20,742
Engineering/Capital Capital Program Management 1,237 1,274 1,299 1,244 1,244 1,244
Total Engineering/Capital 1,237 1,274 1,299 1,244 1,244 1,244
Public Safety Security 587 630 633 633 633 633
Total Public Safety 587 630 633 633 633 633
Total Baseline Positions 46,412 47,447 47,134 46,689 46,810 46,765
Non-Reimbursable 42,459 42,730 42,470 42,303 42,563 42,535 Reimbursable 3,953 4,717 4,664 4,386 4,247 4,230
Total Full-Time 46,165 47,289 46,991 46,546 46,667 46,622 Total Full-Time Equivalents 247 158 143 143 143 143
MTA New York City TransitJuly Financial Plan 2015 - 2018
Total Positions by Function and DepartmentNon-Reimbursable/Reimbursable and Full-Time/Full-Time Equivalents
V-254

FUNCTION/OCCUPATIONAL GROUP2013
Actual
2014 Mid-Year Forecast
2015 Preliminary
Budget 2016 2017 2018
Administration Managers/Supervisors 573 615 669 654 653 653 Professional, Technical, Clerical 1,204 1,138 1,167 1,169 1,170 1,170 Operational Hourlies 22 51 23 23 23 23
Total Administration 1,799 1,804 1,859 1,846 1,846 1,846
Operations Managers/Supervisors 2,534 2,664 2,610 2,588 2,588 2,587 Professional, Technical, Clerical 476 485 481 478 478 478 Operational Hourlies 19,209 19,403 19,248 19,214 19,235 19,235
Total Operations 22,219 22,552 22,339 22,280 22,301 22,300
Maintenance Managers/Supervisors 3,666 3,818 3,797 3,744 3,746 3,738 Professional, Technical, Clerical 973 1,042 1,003 951 946 942 Operational Hourlies 15,931 16,327 16,204 15,991 16,094 16,062
Total Maintenance 20,570 21,187 21,004 20,686 20,786 20,742
Engineering/Capital Managers/Supervisors 300 329 334 283 283 283 Professional, Technical, Clerical 935 943 963 959 959 959 Operational Hourlies 2 2 2 2 2 2
Total Engineering/Capital 1,237 1,274 1,299 1,244 1,244 1,244
Public Safety Managers/Supervisors 222 254 254 254 254 254 Professional, Technical, Clerical 32 40 40 40 40 40 Operational Hourlies 333 336 339 339 339 339
Total Public Safety 587 630 633 633 633 633
Total Baseline Positions Managers/Supervisors 7,295 7,680 7,664 7,523 7,524 7,515 Professional, Technical, Clerical 3,620 3,648 3,654 3,597 3,593 3,589 Operational Hourlies 35,497 36,119 35,816 35,569 35,693 35,661
Total Baseline Positions 46,412 47,447 47,134 46,689 46,810 46,765
MTA New York City TransitJuly Financial Plan 2015 - 2018
Total Positions by Function and Occupation
V-255

[THIS PAGE INTENTIONALLY LEFT BLANK]
V-256

MTA Bus Company

MTA BUS COMPANY 2015 Preliminary Budget
July Financial Plan 2015 – 2018 FINANCIAL OVERVIEW MTA Bus Company remains committed to providing safe, secure, reliable and cost efficient transportation service that fosters the continued vibrancy and prosperity of the New York region. To that end, the July Financial Plan presents the means to meet those needs and includes funding for several im portant programmatic initiat ives critical to meeting MTA Bus Company’s operati onal and maintenance needs. All other expense/cash changes result from either re-estimates, adjustments reflecting the impact of inflation, or the projected timing of expenses, payments or reimbursements. The salary and wage assumptions in the J uly Plan reflect the rece nt labor settlement with the T ransport Workers Union (TWU), the MTA’s largest union. The July Plan assumes the same pattern settlement for employees represented by unions without contract agreements. This assumption projects costs that are in excess of the February Plan provision; a portion of this addition al cost will be funded by the suspensio n of contributions to the GASB Account. Important programmatic initiatives, included in this financial plan, are summarized a s follows:
Bus Maintenance – Overage Fleet. 11 positions with a cost of $1.1 million in 2014 and 2015 are necessary to meet main tenance requirements associated with the significant populat ion of the buses over 12 years of age during this period.
Tires and Tubes for Low Floor Buses. The fleet size at MTABC has remained
relatively stable but the number of Low Floor (LF) buses since 2012 has increased from 389 to 601. The LF bus tires have a higher per mile cost than the high floor buses. This has led to an increase in tire costs and requires the budget to be adjusted to reflect the current mix of LF and HF tires. The increase is estimated at $1.0 million in 2014 and subsequent years.
Farebox Maintenance Workforce. 6 positions in 2015 and subsequent years,
with costs of $0.6 million in 2015 and 2016, and $0.7 million in 2017 and 2018, which is needed to address the poor farebox reliability.
• Minority, Women-owned and Disadvantaged Business Enterprise Program (MWDBE). 1 position in 2014 and subsequent years with a cost of $0.1 million in 2014, and $0.2 million in 2015 and subsequent years. As part of the All-Ag ency MTA Initiative, MTABC is requesting a dedicated manager of Procurement for the oversight of the MWDBE program.
V-257

The 2014 Budget Reduction Program is comprised of the following initiatives:
Shop Overhaul Program. Projected savings of $10.2 millio n in 2015, $5.1 million in 2016, $1.0 million in 2017 a nd $0.6 million in 2 018, based on not overhauling the 2005 and 2006 MCI buses.
Completion of the Scheduled Operations Pick-up Program (SOPU) Projected reductions of 6 positions in 2014 and subs equent years and projected savings of $0.6 million in 2014-2016 and $0.7 million in 2017 and 2018. This program has been successful in reversing the negative trend in MDBF and shifting the focus and culture from unscheduled reactive maintenance to the creation and establishment of a preventative maintenance mind set.
2014 Mid-Year Forecast
MTA Bus Company’s 2014 Mid-year Fore cast includes total expens es before depreciation and other post-employment benefits of $600.9 million, consisting of $595.3 million of non-reimbursable expenses and $5.7 million of reimbursable expenses. Total revenues are projected to be $232.0 million, of which $199.8 million is farebox revenues, $26.5 million is other operating revenue and $5.7 mil lion is capital and other reimbursements. Total baseline full-time a nd full-time equivalent positions are 3,710 (3,672 non-reimbursable positions and 38 reimbursable positions).
The 2014 net operating cash defi cit is projected to increase by $83.0 million from the Adopted Budget.
Major operating cash changes include:
The unfavorable 2013 timing adjustment of $68.4 million impacting 2014.
A Farebox Revenue decrease of $1.7 million due to a lower proportion of express bus ridership (which has higher average fa res than local bus), resulting in lower combined local and express average fares.
Investments increase of $2.1 million as a result of several programmatic
initiatives (see detailed information at the beginning of this narrative).
Payroll expenses net increase of $13.4 million primarily due to represented labor assumptions and retro-wage accrual.
Overtime expenses increase of $6.1 million due to inclement weather, coverag e
for vacancies and absences and additional maintenance on an aging bus fleet in order to maintain MDBF gains.
Health & Welfare re-estimate (includ ing OPEB current payments), resulting in an
expense decrease of $4. 6 million based on refining employee eligibility files and
V-258

implementing the Employee Group Waiver Plan (EGWP) with partners UHC and Prescription Solutions.
A favorable GASB adjust ment of $2.4 million whic h represents a suspension of
contributions to the GASB account to fund the increase in labor costs as a result of the labor settlement assumptions.
An adjustment of $68.4 million due to the 2013 timing of expenses. This includes $0.8 million for Tropical Storm Irene.
Reimbursable expenses are projected to dec rease by $2.9 million as a result of re-classifying 26 positions to Non-reimbursable. Total baseline positions are projected to increase by 6; this includes a Non-Reimbursable increase of 12 in support of new programmatic initiatives and a reduction of 6 positions for the BRP. 2015 Preliminary Budget MTA Bus Company’s 2015 preliminary budget includes total expens es before depreciation and other post-employment benefits of $641.4 million, consisting of $635.7 million of non-reimbursable expenses and $5.7 million of reimbursable expenses. Total revenues are projected to be $227.6 million, of which $201.4 million is farebox revenues, $20.4 million is other operating revenue and $5.7 mil lion is capital and other reimbursements. Total baseline full-time a nd full-time equivalent positions are 3,720 (3,682 non-reimbursable positions and 38 reimbursable positions). The 2015 net operating ca sh deficit is proj ected to decrease by $15.6 million from the Adopted Budget. Major operating cash changes include:
A Farebox Revenue decrease of $1.5 million due to a lower proportion of express bus ridership (which has higher average fa res than local bus), resulting in lower combined local and express average fares.
Investments increase of $4.1 million ma inly due to several programmatic
initiatives (see detailed information at the beginning of this narrative).
Payroll expenses increase of $4.4 million reflects the recent labor settlement with the TWU. The July Plan assum es the sa me pattern settlement for employees represented by Unions without contract agreements.
V-259

Health & Welfare (including OPEB curr ent payments), resulting in an expe nse decrease of $5.8 million ba sed on refi ning employee eligibility files and implementing the EGWP with partners UHC and Prescription Solutions.
Pension decrease of $3.1 million based on the most current actuarial re-estimate.
Fuel decrease of $3.9 million as a result of fuel efficie ncies and revised forecast assumptions.
Maintenance and Ot her Operating Contracts decrease of $1.1 million primarily
due to Shop Overhaul changes partially o ffset by a re-estimate for Tires and Tubes.
Materials & Supplies decrease of $3.0 million primarily due to c hanges in the Shop Overhaul program.
A favorable GASB adjust ment of $5.1 million whic h represents a suspension of contributions to the GASB account to fund the increase in labor costs as a result of the labor settlement assumptions.
Reimbursable expenses decreased by $ 2.9 million as a result of re-classifying 2 6 positions to Non-Reimbursable. Total baseline positions are projected to dec rease by 62 mainly due to the changes in the Shop Overhaul Program. 2016 - 2018 Projections Net operating cash d eficits are projected to decrease by $14.2 million in 2016, $3.8 million in 2017 and $9.1 million in 2018, relative to the Adopted Budget. Major operating cash changes include:
Revenue decrease of $1.6 million in 2016, $1.7 million in 2017 and $1.6 million in 2018, due to a lower proportion of expre ss bus ridership (which has higher average fares than local bus), resulting in lower combined loc al and exp ress average fares.
Investments increase of $2.9 million in 2016, $3.0 million in 2017 and $3.0 million in 2018, for several important programma tic initiatives (see detailed information at the beginning of this narrative).
Payroll increase of $5.1 million in 2016, $8.3 million in 2017 an d $5.8 million in
2018, primarily due to the recent labor settlement assumptions.
V-260

Health & Welfare expense (including OPEB current payments), resulting in an expense decrease of $6.7 million in 2016, $6.2 million in 2017 and $7.7 million in 2018, primarily due to refining employee eligibility files and implementing the Plan EGWP with partners UHC and Prescription Solutions.
Pension decrease of $3.3 million in 201 6, $2.9 million in 2017 and $3.6 million in
2018 based on the most current actuarial re-estimate.
Fuel decrease of $5. 6 million in 2016, $5. 9 million in 2017 and $6.2 million in 2018 as a result of fuel efficiencies and revised forecast assumptions.
A favorable GASB adjustm ents of $5.2 milli on in 2016 and $5.3 million in 201 7
and 2018, which represents the suspension of contributions to the GASB account to fund the increase in labor costs as a result of the l abor settlement assumptions.
Reimbursable expenses are pr ojected to decrease by $3.0 million in 2016 and $3.3 million in 2017 and 2018 as a result of reclassifying 26 positions to Non-Reimbursable. Total Baseline positions are projected to decrease by 42 in 2016, increase by 3 in 2017 and increase by 5 in 2018. The non–reimbursable decreas es are prim arily due t o reduction in positions resulting from the 2014 Budget Reduction Program.
V-261

NON-REIMBURSABLE 2014 2015
2013 Mid-Year Preliminary
Actual Forecast Budget 2016 2017 2018
Operating Revenue
Farebox Revenue $199.187 $199.810 $201.403 $202.917 $203.163 $204.038Other Operating Revenue 26.231 26.508 20.419 20.578 20.939 21.316 Capital and Other Reimbursements - - - - - -
Total Revenue $225.418 $226.318 $221.822 $223.495 $224.102 $225.354
Operating Expenses
Labor: 0.073 0.080 0.092 0.080 Payroll $240.852 $241.952 $246.648 $254.063 $259.870 $259.239Overtime 49.106 50.123 45.608 46.588 47.433 47.972 Health and Welfare 43.429 50.132 52.755 57.071 62.341 67.017 OPEB Current Payment 18.539 18.505 20.905 22.499 24.514 26.807 Pensions 45.550 44.732 44.057 44.580 45.542 46.375 Other Fringe Benefits 45.923 46.170 46.318 49.034 48.822 51.681 Reimbursable Overhead - - - - - -
Total Labor Expenses $443.399 $451.614 $456.291 $473.835 $488.522 $499.091
Non-Labor:
Electric Power $1.555 $1.949 $1.789 $1.865 $2.130 $2.301Fuel 35.004 37.560 35.676 34.445 35.180 36.208 Insurance 2.562 3.400 3.849 4.543 5.633 6.354 Claims 19.108 22.256 28.000 29.000 29.447 29.977 Maintenance and Other Operating Contracts 19.595 20.805 50.041 45.856 35.546 21.938 Professional Service Contracts 16.907 20.618 20.597 20.599 20.912 21.261 Materials & Supplies 37.757 34.170 36.654 40.982 38.714 32.957 Other Business Expenses 4.698 2.880 2.753 2.907 5.019 5.094
Total Non-Labor Expenses $137.186 $143.638 $179.359 $180.197 $172.581 $156.090
Other Expenses Adjustments:
Other - - - - - - Total Other Expense Adjustments $0.000 $0.000 $0.000 $0.000 $0.000 $0.000
Total Expenses before Depreciation & GASB Adj. $580.585 $595.252 $635.650 $654.032 $661.103 $655.181
Depreciation $48.887 $42.235 $42.236 $42.236 $42.887 $43.658OPEB Obligation 100.150 100.150 100.150 100.150 100.150 100.150 Environmental Remediation 1.742 - - - - -
Total Expenses $731.364 $737.637 $778.036 $796.418 $804.140 $798.989
Baseline Surplus/(Deficit) ($505.946) ($511.319) ($556.214) ($572.923) ($580.038) ($573.635)
MTA BUS COMPANYJuly Financial Plan 2015 - 2018
Accrual Statement of Operations by Category($ in millions)
V-262

REIMBURSABLE2014 2015
2013 Mid-Year PreliminaryActual Forecast Budget 2016 2017 2018
Revenue
Farebox Revenue - - - - - - Other Operating Revenue - - - - - - Capital and Other Reimbursements 6.357 5.663 5.738 5.812 5.625 5.723
Total Revenue $6.357 $5.663 $5.738 $5.812 $5.625 $5.723
Expenses
Labor:
Payroll $3.304 $2.684 $2.714 $2.743 $2.530 $2.576Overtime - - - - - - Health and Welfare 0.912 1.023 1.038 1.053 1.060 1.079 OPEB Current Payment - - - - - - Pensions 0.480 0.465 0.470 0.473 0.473 0.482 Other Fringe Benefits 0.668 0.456 0.462 0.469 0.472 0.481 Reimbursable Overhead 0.030 - - - - -
Total Labor Expenses $5.394 $4.628 $4.684 $4.738 $4.535 $4.618
Non-Labor:
Electric Power $0.000 $0.000 $0.000 $0.000 $0.000 $0.000Fuel - - - - - - Insurance - - - - - - Claims - - - - - - Maintenance and Other Operating Contracts 0.071 0.223 0.227 0.231 0.235 0.238 Professional Service Contracts - - - - - - Materials & Supplies 0.892 0.812 0.827 0.843 0.855 0.867 Other Business Expenses - - - - - -
Total Non-Labor Expenses $0.963 $1.035 $1.054 $1.074 $1.090 $1.105
Other Expenses Adjustments:
Other - - - - - - Total Other Expense Adjustments $0.000 $0.000 $0.000 $0.000 $0.000 $0.000
Total Expenses before Depreciation & GASB Adj. $6.357 $5.663 $5.738 $5.812 $5.625 $5.723
Depreciation - - - - - -
Total Expenses $6.357 $5.663 $5.738 $5.812 $5.625 $5.723
Baseline Surplus/(Deficit) $0.000 $0.000 $0.000 $0.000 $0.000 $0.000
MTA BUS COMPANYJuly Financial Plan 2015 - 2018
Accrual Statement of Operations by Category($ in millions)
V-263

NON-REIMBURSABLE / REIMBURSABLE2014 2015
2013 Mid-Year PreliminaryActual Forecast Budget 2016 2017 2018
Revenue
Farebox Revenue $199.187 $199.810 $201.403 $202.917 $203.163 $204.038Other Operating Revenue 26.231 26.508 20.419 20.578 20.939 21.316 Capital and Other Reimbursements 6.357 5.663 5.738 5.812 5.625 5.723
Total Revenue $231.775 $231.981 $227.560 $229.307 $229.727 $231.077
Expenses
Labor:
Payroll $244.156 $244.636 $249.362 $256.806 $262.400 $261.815Overtime 49.106 50.123 45.608 46.588 47.433 47.972 Health and Welfare 44.341 51.155 53.793 58.124 63.401 68.096 OPEB Current Payment 18.539 18.505 20.905 22.499 24.514 26.807 Pensions 46.030 45.197 44.527 45.053 46.015 46.857 Other Fringe Benefits 46.591 46.626 46.780 49.503 49.294 52.162 Reimbursable Overhead 0.030 - - - - -
Total Labor Expenses $448.793 $456.242 $460.975 $478.573 $493.057 $503.709
Non-Labor:
Electric Power $1.555 $1.949 $1.789 $1.865 $2.130 $2.301Fuel 35.004 37.560 35.676 34.445 35.180 36.208 Insurance 2.562 3.400 3.849 4.543 5.633 6.354 Claims 19.108 22.256 28.000 29.000 29.447 29.977 Maintenance and Other Operating Contracts 19.666 21.028 50.268 46.087 35.781 22.176 Professional Service Contracts 16.907 20.618 20.597 20.599 20.912 21.261 Materials & Supplies 38.649 34.982 37.481 41.825 39.569 33.824 Other Business Expenses 4.698 2.880 2.753 2.907 5.019 5.094
Total Non-Labor Expenses $138.149 $144.673 $180.413 $181.271 $173.671 $157.195
Other Expenses Adjustments:
Other - - - - - - Total Other Expense Adjustments $0.000 $0.000 $0.000 $0.000 $0.000 $0.000
Total Expenses before Depreciation & GASB Adj. $586.942 $600.915 $641.388 $659.844 $666.728 $660.904
Depreciation $48.887 $42.235 $42.236 $42.236 $42.887 $43.658OPEB Obligation 100.150 100.150 100.150 100.150 100.150 100.150 Environmental Remediation 1.742 - - - - -
Total Expenses $737.721 $743.300 $783.774 $802.230 $809.765 $804.712
Baseline Surplus/(Deficit) ($505.946) ($511.319) ($556.214) ($572.923) ($580.038) ($573.635)
MTA BUS COMPANYJuly Financial Plan 2015 - 2018
Accrual Statement of Operations by Category($ in millions)
V-264

CASH RECEIPTS AND EXPENDITURES2014 2015
2013 Mid-Year PreliminaryActual Forecast Budget 2016 2017 2018
Receipts
Farebox Revenue $197.285 $200.610 $201.403 $202.917 $203.163 $204.038Other Operating Revenue 26.059 27.288 20.419 20.578 20.939 21.316 Capital and Other Reimbursements 6.437 12.449 10.590 10.900 10.816 11.007
Total Receipts $229.781 $240.347 $232.412 $234.395 $234.918 $236.361
Expenditures
Labor:
Payroll $224.801 $279.212 $247.351 $254.779 $260.358 $259.736Overtime 49.529 50.123 45.608 46.588 47.433 47.972 Health and Welfare 53.676 50.744 53.379 57.707 62.981 67.668 OPEB Current Payment 18.537 18.505 20.905 22.499 24.514 26.807 Pensions 49.718 45.024 44.354 44.881 45.845 46.683 Other Fringe Benefits 37.454 48.377 46.609 49.330 49.121 51.985 GASB Account 4.909 2.586 0.001 - - - Reimbursable Overhead - - - - - -
Total Labor Expenditures $438.624 $494.571 $458.207 $475.784 $490.252 $500.851
Non-Labor:
Electric Power $2.480 $1.949 $1.789 $1.865 $2.130 $2.301Fuel 34.550 39.320 35.676 34.445 35.180 36.208 Insurance 0.428 6.294 3.849 4.543 5.633 6.354 Claims 18.150 23.680 24.000 25.000 25.385 25.842 Maintenance and Other Operating Contracts 17.866 29.228 50.268 46.087 35.782 22.176 Professional Service Contracts 14.676 24.893 20.597 20.599 20.912 21.261 Materials & Supplies 40.352 34.982 37.481 41.825 39.569 33.824 Other Business Expenses 2.175 4.874 2.753 2.908 5.019 5.094
Total Non-Labor Expenditures $130.677 $165.220 $176.413 $177.272 $169.610 $153.060
Other Expenditure Adjustments:
Other - - - - - - Total Other Expenditure Adjustments $0.000 $0.000 $0.000 $0.000 $0.000 $0.000
Total Expenditures $569.301 $659.791 $634.620 $653.056 $659.862 $653.911
Baseline Cash Deficit ($339.520) ($419.444) ($402.208) ($418.661) ($424.944) ($417.550)
(421.024) (404.810) (422.916) (427.990) (421.961)
MTA BUS COMPANYJuly Financial Plan 2015 - 2018Cash Receipts & Expenditures
($ in millions)
V-265

CASH FLOW ADJUSTMENTS
2014 20152013 Mid-Year Preliminary
Actual Forecast Budget 2016 2017 2018
Receipts
Farebox Revenue ($1.902) $0.800 $0.000 $0.000 $0.000 $0.000Other Operating Revenue (0.172) 0.780 - - - - Capital and Other Reimbursements 0.080 6.786 4.852 5.088 5.191 5.284
Total Receipts ($1.994) $8.366 $4.852 $5.088 $5.191 $5.284
Expenditures
Labor:
Payroll $19.355 ($34.576) $2.011 $2.027 $2.042 $2.079Overtime (0.423) - - - - - Health and Welfare (9.335) 0.411 0.414 0.417 0.420 0.428 OPEB Current Payment 0.002 - - - - - Pensions (3.688) 0.173 0.173 0.172 0.170 0.174 Other Fringe Benefits 9.137 (1.751) 0.171 0.173 0.173 0.177 GASB Account (4.909) (2.586) (0.001) - - - Reimbursable Overhead 0.030 - - - - -
Total Labor Expenditures $10.169 ($38.329) $2.768 $2.789 $2.805 $2.858
Non-Labor:
Electric Power ($0.925) $0.000 $0.000 $0.000 $0.000 $0.000Fuel 0.454 (1.760) - - - - Insurance 2.134 (2.894) - - - - Claims 0.958 (1.424) 4.000 4.000 4.062 4.135 Maintenance and Other Operating Contracts 1.800 (8.200) - - (0.001) - Professional Service Contracts 2.231 (4.275) - - - - Materials & Supplies (1.703) - - - - - Other Business Expenses 2.523 (1.994) - (0.001) - -
Total Non-Labor Expenditures $7.472 ($20.547) $4.000 $3.999 $4.061 $4.135
Other Expenditures Adjustments:
Other - - - - - - Total Other Expenditures Adjustments $0.000 $0.000 $0.000 $0.000 $0.000 $0.000
Total Cash Conversion Adjustments before Depreciation $15.647 ($50.510) $11.620 $11.876 $12.057 $12.277
Depreciation Adjustment $48.887 $42.235 $42.236 $42.236 $42.887 $43.658OPEB Obligation 100.150 100.150 100.150 100.150 100.150 100.150 Environmental Remediation 1.742 - - - - -
Baseline Total Cash Conversion Adjustments $166.426 $91.875 $154.006 $154.262 $155.094 $156.085
Cash Conversion (Cash Flow Adjustments)($ in millions)
MTA BUS COMPANYJuly Financial Plan 2015 - 2018
V-266

NON-REIMBURSABLE OVERTIME Hours $ %
Scheduled Service 592,023 $25.097 50.1%
Unscheduled Service 82,332 $3.375 6.7%
Programmatic/Routine Maintenance 182,046 $7.755 15.5%
Unscheduled Maintenance 0 $0.000 0.0%
Vacancy/Absentee Coverage 239,957 $10.555 21.1%
Weather Emergencies 74,301 $2.896 5.8%
Safety/Security/Law Enforcement 2,641 $0.128 0.3%
Other 3,802 $0.316 0.6%
Sub-Total 1,177,101 $50.123 100.0%
REIMBURSABLE OVERTIME 0 $0.000
TOTAL NR & R OVERTIME 1,177,101 $50.123
50.123 * Numbers may not add precisely due to arounding.
MTA Bus Company2014 Mid-Year Forecast
Non-Reimbursable/Reimbursable Overtime
Total
V-267

MTA BUS COMPANY 2015 Preliminary Budget
July Financial Plan 2015 – 2018 Year-to-Year Changes by Category-Baseline
TOTAL REVENUE/RECEIPTS Farebox Revenue
MTA Bus Farebox Revenue is t ied to annual growth forecasts based largely on the regional economy and updated NYC employment projections.
Year to year increases are as follows: 2015=0.8%; 2016=0.8%; 2017=0.1%; 2018=0.4%.
An increase in farebox revenue as follows: $1.6 million in 2015; $1.5 million in 2016; $0.2 million in 2017 and $0.9 million in 2018.
Other Operating Revenue
Other Operating Revenue decreased primarily due to the recovery of Super Storm Sandy related expenses in 2014.
The changes in 2016 thru 2018 are pr imarily due to the annual increase in advertising revenues, which are based upon current contracts in place and other miscellaneous recoveries.
Capital and Other Reimbursements
Year to year increases in capital and other reimbursements is as follows: $0.1 million in 2015 and 2016; a decrease of $0.2 million in 2017, an d an increase of $0.1 million in 2018.
TOTAL EXPENSES/EXPENDITURES Projections include additional Payroll and Other Fringe Benefit s expenses for those employees without c ontract agreements that are patter ned after the recent TWU settlement. Payroll
Represented employee wage increase assumptions follow the TWU pattern upon expiration of existing contracts as follows: 0.87% 0.95% 2.23%, 2.22% and 1.88% for years 1,2,3,4, and 5, respectively. CPI-based increases of 2% are assumed for each year upon expiration of the pattern.
Salaries for non-represented employees, who have not received a general s alary
increase during the last five years, ar e assumed to follow CPI-based incr eases. The 2014 Mid-Year Forecast baseline inc ludes the compounding of raises for 2012 and 2013; however, as of the July Plan, no raises have been granted.
V-268

Non-Reimbursable payroll expenses are projected to in crease by $4.7 million in 2015; $7.4 million in 2016; $5. 8 million in 2017 an d decrease by $0.6 million in 2018. The increase in 2015 to 2017 is mainly due to the labor wage assumptions and reclassification of reimbursable pos itions to non-reimbursable, as well as changes in the Shop Overhaul Program.
Overtime
Non-Reimbursable overtime expenses are projected to decrease by $4.5 m illion in 2015 and increase by $1.0 million in 2016, $0.8 million in 2017 and $0.5 million in 2018. The decrease in 2015 is main ly due to the elim ination of over time resulting from inclement weather and headcount to fund the maintenance of the overage fleet. The 2016 to 2018 increases are due t o the impact of the Shop Overhaul Program changes and CPI based rate increases.
Health & Welfare and OPEB Current Inflation assumptions for 2015-2018 are: 2015=8.6%; 2016=8.5%; 2017=8.5%;
2018=8.5%. This financial plan includes savings based on refining employee eligibility files and implementing the EGWP with partners UHC and Prescription Solutions.
Pension
Projections are consistent with current actuarial information. Other Fringe Benefits
Projected year-to-year increases reflect staffing levels , programmatic chan ges, inflationary payroll rate assumptions and the re-class of mobility tax to Other Business Expense.
Electric Power
The financial plan reflects the projected NYPA, LIPA and Con Ed Delivery energy forecast guidelines.
Fuel
Diesel fuel inflation a ssumptions are as follows: 2015= -3.32%; 2016= -3.46%; 2017= 1.63%; 2018= 2.80%.
Insurance
On average, insurance premium rates reflect guidelines.
Claims Projections are consistent with the current actuarial information.
Maintenance and Other Operating Contracts The 2015 increase is mainly due to Shop Program changes f or Hybrid Bus
conversion, MCI engine and structural upgrades. The 2016 to 2018 decre ases are mainly due to changes in the Shop Overhaul Program.
V-269

Professional Service Contracts 2015 – 2018 remained relatively unchanged.
Materials and Supplies
The Shop Overhaul Program is complex and the annual Material and Supplies needs are based on t he work scopes developed. As a result, the year-to-year changes in Materials and Supplies are prim arily due to timing of the bus fleet maintenance program requirement.
Other Business Expenses
Changes remain flat f rom 2015 and 2016. The 2017 and 2018 increase is due mainly to increased spending on office s upplies, automatic fare collection and ticket printing fees/charges, training courses, and travel & meetings.
Depreciation (non-cash) Annual expense incr eases are due to projections of additiona l capital as sets
reaching beneficial use.
V-270

NON-REIMBURSABLE
2014 2015Change
2015 - 2014 2016Change
2016 - 2015 2017Change
2017 - 2016 2018Change
2018 - 2017RevenueFarebox Revenue $199.810 $201.403 $1.593 $202.917 $1.514 $203.163 $0.246 $204.038 $0.875Other Operating Revenue 26.508 20.419 (6.089) 20.578 0.159 20.939 0.361 21.316 0.377 Capital and Other Reimbursements - - - - - - - - -
Total Revenue $226.318 $221.822 ($4.496) $223.495 $1.673 $224.102 $0.607 $225.354 $1.2520.8% 0.8% 0.1% 0.4%
ExpensesLabor: (0.073) (0.080) (0.092) (0.080) Payroll $241.952 $246.648 ($4.696) $254.063 ($7.415) $259.870 ($5.807) $259.239 $0.631Overtime 50.123 45.608 4.515 46.588 (0.980) 47.433 (0.845) 47.972 (0.539) Health and Welfare 50.132 52.755 (2.623) 57.071 (4.316) 62.341 (5.270) 67.017 (4.676) OPEB Current Payment 18.505 20.905 (2.400) 22.499 (1.594) 24.514 (2.015) 26.807 (2.293) Pensions 44.732 44.057 0.675 44.580 (0.523) 45.542 (0.962) 46.375 (0.833) Other Fringe Benefits 46.170 46.318 (0.148) 49.034 (2.716) 48.822 0.212 51.681 (2.859) Reimbursable Overhead - - - - - - - - -
Total Labor Expenses $451.614 $456.291 ($4.677) $473.835 ($17.544) $488.522 ($14.687) $499.091 ($10.569)
Non-Labor:Electric Power $1.949 $1.789 0.160 $1.865 ($0.076) $2.130 ($0.265) $2.301 ($0.171)Fuel 37.560 35.676 1.884 34.445 $1.231 35.180 ($0.735) 36.208 ($1.028)Insurance 3.400 3.849 (0.449) 4.543 (0.694) 5.633 (1.090) 6.354 (0.721) Claims 22.256 28.000 (5.744) 29.000 (1.000) 29.447 (0.447) 29.977 (0.530) Maintenance and Other Operating Contracts 20.805 50.041 (29.236) 45.856 4.185 35.546 10.310 21.938 13.608 Professional Service Contracts 20.618 20.597 0.021 20.599 (0.002) 20.912 (0.313) 21.261 (0.349) Materials & Supplies 34.170 36.654 (2.484) 40.982 (4.328) 38.714 2.268 32.957 5.757 Other Business Expenses 2.880 2.753 0.127 2.907 (0.154) 5.019 (2.112) 5.094 (0.075)
Total Non-Labor Expenses $143.638 $179.359 ($35.721) $180.197 ($0.838) $172.581 $7.616 $156.090 $16.491
Other Expenses Adjustments:Other - - - - - - - - -
Total Other Expense Adjustments $0.000 $0.000 $0.000 $0.000 $0.000 $0.000 $0.000 $0.000 $0.000
Total Expenses before Depreciation and GASB Adjs. $595.252 $635.650 ($40.398) $654.032 ($18.382) $661.103 ($7.071) $655.181 $5.922
Depreciation $42.235 $42.236 (0.001) $42.236 - $42.887 (0.651) $43.658 (0.771) OPEB Obligation $100.150 $100.150 - $100.150 - $100.150 - $100.150 - Environmental Remediation $0.000 $0.000 - $0.000 - $0.000 - $0.000 -
Total Expenses $737.637 $778.036 ($40.399) $796.418 ($18.382) $804.140 ($7.722) $798.989 $5.151
Baseline Net Surplus/(Deficit) ($511.319) ($556.214) ($44.895) ($572.923) ($16.709) ($580.038) ($7.115) ($573.635) $6.403
($44.895) ($16.709) ($7.115) $6.403$572.923 $580.038 $573.635
MTA BUS COMPANYJuly Financial Plan 2015 - 2018
Year-to-Year Changes by Category - Accrual Basis($ in millions)
V-271

REIMBURSABLE
2014 2015Change
2015 - 2014 2016Change
2016 - 2015 2017Change
2017 - 2016 2018Change
2018 - 2017Revenue
Farebox Revenue - - - - - - - - - Vehicle Toll Revenue - - - - - - - - - Other Operating Revenue - - - - - - - - - Capital and Other Reimbursements 5.663 5.738 0.075 5.812 0.074 5.625 (0.187) 5.723 0.098
Total Revenue $5.663 $5.738 $0.075 $5.812 $0.074 $5.625 ($0.187) $5.723 $0.098
ExpensesLabor:Payroll $2.684 $2.714 ($0.030) $2.743 ($0.029) $2.530 $0.213 $2.576 ($0.046)Overtime - - - - - - - - - Health and Welfare 1.023 1.038 (0.015) 1.053 (0.015) 1.060 (0.007) 1.079 (0.019) OPEB Current Payment - - - - - - - - - Pensions 0.465 0.470 (0.005) 0.473 (0.003) 0.473 - 0.482 (0.009) Other Fringe Benefits 0.456 0.462 (0.006) 0.469 (0.007) 0.472 (0.003) 0.481 (0.009) Reimbursable Overhead - - - - - - - - -
Total Labor Expenses $4.628 $4.684 ($0.056) $4.738 ($0.054) $4.535 $0.203 $4.618 ($0.083)
Non-Labor:Electric Power $0.000 $0.000 - $0.000 - $0.000 - $0.000 - Fuel - - - - - - - - - Insurance - - - - - - - - - Claims - - - - - - - - - Maintenance and Other Operating Contracts 0.223 0.227 (0.004) 0.231 (0.004) 0.235 (0.004) 0.238 (0.003) Professional Service Contracts - - - - - - - - - Materials & Supplies 0.812 0.827 (0.015) 0.843 (0.016) 0.855 (0.012) 0.867 (0.012) Other Business Expenses - - - - - - - - -
Total Non-Labor Expenses $1.035 $1.054 ($0.019) $1.074 ($0.020) $1.090 ($0.016) $1.105 ($0.015)
Other Expenses Adjustments:Other - - - - - - - - -
Total Other Expense Adjustments $0.000 $0.000 $0.000 $0.000 $0.000 $0.000 $0.000 $0.000 $0.000
Total Expenses before Depreciation $5.663 $5.738 ($0.075) $5.812 ($0.074) $5.625 $0.187 $5.723 ($0.098)
Depreciation - - - - - - - - -
Total Expenses $5.663 $5.738 ($0.075) $5.812 ($0.074) $5.625 $0.187 $5.723 ($0.098)
Baseline Net Surplus/(Deficit) $0.000 $0.000 $0.000 $0.000 $0.000 $0.000 $0.000 $0.000 $0.000
MTA BUS COMPANYJuly Financial Plan 2015 - 2018
Year-to-Year Changes by Category - Accrual Basis($ in millions)
V-272

CASH RECEIPTS AND EXPENDITURES
2014 2015Change
2015 - 2014 2016Change
2016 - 2015 2017Change
2017 - 2016 2018Change
2018 - 2017
ReceiptsFarebox Revenue $200.610 $201.403 $0.793 $202.917 $1.514 $203.163 $0.246 $204.038 $0.875Other Operating Revenue 27.288 20.419 (6.869) 20.578 0.159 20.939 0.361 21.316 0.377 Capital and Other Reimbursements 12.449 10.590 (1.859) 10.900 0.310 10.816 (0.084) 11.007 0.191
Total Receipts $240.347 $232.412 ($7.935) $234.395 $1.983 $234.918 $0.523 $236.361 $1.443
ExpendituresLabor:Payroll $279.212 $247.351 $31.861 $254.779 ($7.428) $260.358 ($5.579) $259.736 $0.622Overtime 50.123 45.608 4.515 46.588 (0.980) 47.433 (0.845) 47.972 (0.539) Health and Welfare 50.744 53.379 (2.635) 57.707 (4.328) 62.981 (5.274) 67.668 (4.687) OPEB Current Payment 18.505 20.905 (2.400) 22.499 (1.594) 24.514 (2.015) 26.807 (2.293) Pensions 45.024 44.354 0.670 44.881 (0.527) 45.845 (0.964) 46.683 (0.838) Other Fringe Benefits 48.377 46.609 1.768 49.330 (2.721) 49.121 0.209 51.985 (2.864) GASB Account 2.586 0.001 2.585 - 0.001 - - - - Reimbursable Overhead - - - - - - - - -
Total Labor Expenditures $494.571 $458.207 $36.364 $475.784 ($17.577) $490.252 ($14.468) $500.851 ($10.599)
Non-Labor:Electric Power $1.949 $1.789 $0.160 $1.865 ($0.076) $2.130 ($0.265) $2.301 ($0.171)Fuel $39.320 $35.676 $3.644 $34.445 $1.231 $35.180 ($0.735) $36.208 ($1.028)Insurance 6.294 3.849 2.445 4.543 (0.694) 5.633 (1.090) 6.354 (0.721) Claims 23.680 24.000 (0.320) 25.000 (1.000) 25.385 (0.385) 25.842 (0.457) Maintenance and Other Operating Contracts 29.228 50.268 (21.040) 46.087 4.181 35.782 10.305 22.176 13.606 Professional Service Contracts 24.893 20.597 4.296 20.599 (0.002) 20.912 (0.313) 21.261 (0.349) Materials & Supplies 34.982 37.481 (2.499) 41.825 (4.344) 39.569 2.256 33.824 5.745 Other Business Expenses 4.874 2.753 2.121 2.908 (0.155) 5.019 (2.111) 5.094 (0.075)
Total Non-Labor Expenditures $165.220 $176.413 ($11.193) $177.272 ($0.859) $169.610 $7.662 $153.060 $16.550
Other Expenditure Adjustments:Other - - - - - - - - -
Total Other Expenditure Adjustments $0.000 $0.000 $0.000 $0.000 $0.000 $0.000 $0.000 $0.000 $0.000
Total Expenditures $659.791 $634.620 $25.171 $653.056 ($18.436) $659.862 ($6.806) $653.911 $5.951
Baseline Net Cash Deficit ($419.444) ($402.208) $17.236 ($418.661) ($16.453) ($424.944) ($6.283) ($417.550) $7.394$17.236 ($16.453) ($6.283) $7.394
MTA BUS COMPANYJuly Financial Plan 2015 - 2018
Year-to-Year Changes by Category - Accrual Basis($ in millions)
V-273

MTA BUS COMPANY 2015 Preliminary Budget
July Financial Plan 2015 – 2018 Summary of Major Plan-to-Plan Changes by Generic Category
2014: July Financial Plan vs. February Financial Plan Operating Revenue Changes Operating revenues are projected to decrease from the February Financial Plan by $1.4 million. Major generic category changes include:
A decrease in Fareb ox Revenue of $1.7 million due to a lowe r proportion of express bus ridership (which has higher average fares than local bus), resulting in lower combined local and express average fares.
Operating Expense Changes Operating expenses increased from the February Plan by $15.6 million. Projections include additional Payroll and Other Fringe Benefit s expenses for those employees without c ontract agreements that are patter ned after the recent TWU settlement. Major generic category changes include:
Payroll is projected to increase b y $13.4 million which includes th e recent labor
settlement with the TWU. The July Plan assumes the same pattern settlement for employees represented by unions without contract agreements; and includes programmatic initiatives (discussed in the financial overview).
Overtime is projected to increase by $6.1 million due to inclement weather, coverage for vacancies and absences and additional maintenance on an aging bus fleet.
Health & Welfare/OPEB current payment expenses are projected to decrease b y a net $4.6 million based on refining em ployee eligibility files a nd implementing the EGWP with partners UHC and Prescription Solutions.
Fuel expenses are projected to decreas e by $2.8 million as a result of fuel efficiencies and revised forecast assumptions.
V-274

A favorable GASB adjust ment of $2.4 million whic h represents a suspension of contributions to the GASB account to fund the increase in labor costs as a result of the labor settlement assumptions.
An adjustment of $68.4 million due to the 2013 timing of expenses. This includes a $0.8 million for Tropical Storm Irene.
2015-2017: July Financial Plan vs. February Financial Plan
Operating Revenue Changes Operating revenues are projected to decrease from the February Financial Plan by $1.2 million in 2015; by $1.6 million in 2016 and by $1.7 million in 2017. Major generic category changes include:
A decrease in Farebox Revenue of $1.5 million in 2015; $1.6 million in 2016 and $1.7 million in 2017 due to a lower proportion of express bus ridership (which has higher average fares than local bus), re sulting in lower combined local and express average fares.
Operating Expense Changes Operating expenses decreased fr om the February Plan by $1 1.7 million in 2015; $10. 6 million in 2016 and $0.2 million in 2017. Major generic category changes include:
Payroll is projected to increase by $4.4 million in 2015; $5.1 million in 2016 and
$8.3 million in 201 7 primarily due to labor se ttlement assumptions and programmatic initiatives (described above), and Shop Other Programs.
Health & Welfare/OPEB current payment expenses are projected to decrease b y
$5.8 million in 2 015; $6.7 million in 2016 and $6.2 million in 2017 bas ed on refining employee eligibility files and implementing the EGWP with partners UHC and Prescription Solutions.
Pension expenses are projected to decrease by $3.1 million in 2015; $3.3 million in 2016 and $2.9 million in 2017 based on the most current actuarial re-estimate.
Fuel expenses are projected to decreas e by $3.9 million in 2015; $5.6 million in
2016, and $5.9 million in 201 7 due to revised forecast assumptions and fuel efficiencies.
V-275

Maintenance and Other Oper ating Contract expenses are projected to decrease by $1.1 million in 201 5 and 2016, and increase by $2.5 million in 2017. This is primarily due to additional tire costs, CNG engines and transmission work , and Life Extension Work on the 22 MCI buses at MTABC.
Materials and Supp lies expenses are proj ected to decrease by $3.0 millio n in 2015; increase by $0.6 millio n in 2016 and $2.9 million in 2017, primarily due to changes in the Shop Overhaul and Shop Other Programs.
GASB decreases of $5.1 million in 2015; $5.2 million in 2016; and $5.3 million in
2017 represents a suspension of contributions to the GASB acc ount to fund the increase in labor costs as a result of the labor settlement assumptions.
V-276

2014 2015 2016 2017
($336.426) ($417.784) ($432.839) ($428.771)
Baseline Changes
RevenueFarebox Revenue ($1.674) ($1.486) ($1.640) ($1.670)Other Operating Revenue 0.250 0.250 - - Capital and Other Reimbursements - - - -
Total Revenue Changes ($1.424) ($1.236) ($1.640) ($1.670)
ExpensesLabor:Payroll ($13.369) ($4.442) ($5.099) ($8.265)Overtime (6.137) 0.199 0.128 0.037 Health and Welfare 2.933 4.898 5.498 5.001 OPEB Current Payment 1.661 0.939 1.180 1.155 Pensions 0.962 3.100 3.287 2.918 Other Fringe Benefits (0.171) 0.708 0.618 0.287 Reimbursable Overhead - - - -
Total Labor Expense Changes ($14.121) $5.402 $5.612 $1.133
Non-Labor:Electric Power (0.696) (0.440) (0.411) (0.562) Fuel $2.771 $3.887 $5.574 $5.894Insurance 0.013 0.230 0.327 0.187 Claims - - - - Maintenance and Other Operating Contracts (0.900) 1.069 1.055 (2.548) Professional Service Contracts (0.817) (0.539) (0.068) (0.115) Materials & Supplies (0.924) 3.036 (0.565) (2.869) Other Business Expenses (0.920) (0.926) (0.922) (0.929)
Total Non-Labor Expense Changes ($1.473) $6.317 $4.990 ($0.942)
Other Expenditure Adjustments:Other - - - -
Total Other Expenditure Adjustments
Gap Closing Actions:- - - -
Total Gap Closing Actions $0.000 $0.000 $0.000 $0.000
Total Expenses before Depreciation and GASB Adjs. ($15.594) $11.719 $10.602 $0.191
Depreciation - - - - Depreciation - - - - Environmental Remediation - - - -
Total Expense Changes ($15.594) $11.719 $10.602 $0.191
Cash Adjustment ChangesGASB $2.389 $5.093 $5.216 $5.306
Timing (68.389) - - - Total Cash Adjustment Changes ($66.000) $5.093 $5.216 $5.306
Total Baseline Changes ($83.018) $15.576 $14.178 $3.827
($419.444) ($402.208) ($418.661) ($424.944)
NON-REIMBURSABLE
February Financial Plan - Cash Surplus/(Deficit)
July Financial Plan - Cash Surplus/(Deficit)
MTA BUS COMPANY
July Financial Plan 2015 - 2018Changes Between Financial Plans by Generic Categories
($ in millions)
V-277

2014 2015 2016 2017
$0.000 $0.000 $0.000 $0.000
Baseline Changes
RevenueFarebox Revenue - - - - Vehicle Toll Revenue - - - - Capital and Other Reimbursements ($2.888) ($2.941) ($2.997) ($3.252)
Total Revenue Changes ($2.888) ($2.941) ($2.997) ($3.252)
ExpensesLabor:Payroll $2.888 $2.941 $2.997 $3.252Overtime - - - - Health and Welfare - - - - OPEB Current Payment - - - - Pensions - - - - Other Fringe Benefits - - - - Reimbursable Overhead - - - -
Total Labor Expense Changes $2.888 $2.941 $2.997 $3.252
Non-Labor:Electric PowerFuel - - - - Insurance - - - - Claims - - - - Paratransit Service Contracts - - - - Maintenance and Other Operating Contracts - - - - Professional Service Contracts - - - - Materials & Supplies - - - - Other Business Expenses - - - -
Total Non-Labor Expense Changes - - - -
Total Expenses before Depreciation
Depreciation - - - -
Total Expense Changes $2.888 $2.941 $2.997 $3.252
Cash Adjustment Changes
Total Cash Adjustment Changes $0.000 $0.000 $0.000 $0.000
$0.000 $0.000 $0.000 $0.000
$0.000 $0.000 $0.000 $0.000July Financial Plan - Cash Surplus/(Deficit)
REIMBURSABLE
MTA BUS COMPANY
July Financial Plan 2015 - 2018
February Financial Plan - Cash Surplus/(Deficit)
Changes Between Financial Plans by Generic Categories($ in millions)
Total Baseline Changes
V-278

MTA BUS COMPANY 2015 Preliminary Budget
July Financial Plan 2015 – 2018 Summary of Major Plan-to-Plan Changes
2014: July Financial Plan vs. February Financial Plan Revenue Changes Total revenue decreased by $1.4 million from the February Financial Plan. Major changes include:
A decrease in Fareb ox Revenue of $1.7 million due to a lowe r proportion of express bus ridership (which has higher average fares than local bus), resulting in lower combined local and express average fares.
Expense Changes Operating expenses increased from the February Financial Plan by $15.6 million. Projections include additional Payroll and Other Fringe Benefit s expenses for those employees without c ontract agreements that are patter ned after the recent TWU settlement. Major changes include:
The impact of pattern labor adjustment reflects the recent labor s ettlement with
the TWU resulting in expenses of $13.4 million.
The adverse impact of multiple snowstorms, coverage for vacancies and absences and additional main tenance on an aging bus fleet resulted in an adverse impact of $6.1 million.
New programmatic initiatives costing $2.1 million.
Cash Adjustments Cash Adjustment is projected to be unfavorable by $66.0 million. Major changes include:
A favorable GASB adjustm ent of $2.4 mi llion representing a suspension of contributions to the GASB account to fund the increase in labor costs as a result of the labor settlement assumptions.
V-279

An adjustment of $68.4 million due to the 2013 timing of expenses. This includes a $0.8 million for Tropical Storm Irene.
2015-2017: July Financial Plan vs. February Financial Plan
Revenue Changes Total revenue changes from th e February Financial Plan result in a decrease of $1. 2 million in 2015; $1.6 million in 2016 and $1.7 million in 2017. Major changes include:
A decrease in Farebox Revenue of $1.5 million in 2015; $1.6 million in 2016 and $1.7 million in 2017 due to a lower proportion of express bus ridership (which has higher average fares than local bus), re sulting in lo wer combined local and express average fares.
Expense Changes Excluding increases in ot her post-employment benefit expenses, total expenses decreased by $11.7 million in 2015, $10.6 million in 2016 an d $0.2 millio n in 2 017. Projections include c hanges in Payroll, Over time, Pension, Health & Welfare, Other Fringe Benefit, and Other Business Expens e, attributable to the recent labor settlement with the T WU and t he assumption that the same pattern will be app lied for those employees without contract agreements. Major changes include:
The impact of pattern labor adjustments, consistent with t he recent TWU labor contract agreement, resulting in expense increases of $6.0 million in 2015, $5.5 million in 2016 and $5.6 million in 2017.
New programmatic initiatives co sting $4.1 million in 2 015, $2.9 million in 2 016
and $3.0 million in 2017.
Savings from the 2014 Budg et Reduction Program of $10. 8 million in 2015; $5.7 million in 2016, $1.6 million in 2017.
Pension expenses are projected to decrease by $3.1 million in 2015; $3.3 million in 2016 and $2.9 million in 2017 based on the most current actuarial re-estimate.
V-280

Cash Adjustments
Cash adjustments are projected to be favorable due t o GASB decrease of $5.1 million in 2015, $5.2 million in 2016, and $5.3 million in 2017. This represents a suspension of contributions to the GASB account to fund the increase in labor costs as a result of the labor settlement assumptions.
V-281

TOTAL NON-REIMBURSABLE and REIMBURSABLE
2014 2015 2016 2017
February Financial Plan - Cash Surplus/(Deficit) ($336.426) ($417.784) ($432.839) ($428.771)
Non-Reimbursable Major Changes
RevenueFarebox Revenue (1.674) (1.486) (1.640) (1.670) Other Operating Revenue 0.250 0.250 - - Sub-Total Non-Reimbursable Revenue Changes ($1.424) ($1.236) ($1.640) ($1.670)
Expenses
Programs:
Farebox Mtr - (0.619) (0.631) (0.683) Procurement Mgr (0.080) (0.160) (0.163) (0.177) Overage Fleet (1.088) (1.108) - - Catastrophic Accidents - (0.166) (0.169) (0.172) Pension Imaging Project - (0.150) - - Budget Analyst - (0.205) (0.209) (0.226) Budget System (0.614) (0.133) (0.096) (0.096) SOPU 0.580 0.591 0.602 0.653
Sub-Total Programs ($1.202) ($1.950) ($0.666) ($0.701)
Major Re-estimates/Technical Adjustments/Other:
Tires & Tubes (0.946) (0.961) (0.979) (0.994) Misc. Base Pay - (0.700) (0.700) (0.700) $7.5 m Capital & Other Reimbursement (7.500) - - - Shop Other Program - 2.722 1.059 (5.094) Weather (2.100) - - - Electric Power (0.696) (0.440) (0.411) (0.562)
Represented Labor retro (4.410) - - - Represented Labor charge (5.428) (6.047) (5.467) (5.623) CPI - Maintenance 0.046 (0.015) 0.060 (0.030) CPI - Materials & Supplies 0.076 (0.012) 0.053 (0.032) CPI - Professional 0.047 (0.006) 0.028 (0.019) CPI - Other Business 0.005 (0.001) 0.003 (0.004) Health & Welfare 3.548 4.378 5.311 5.648 Fuel 2.127 3.264 4.973 5.283 Fuel MPG efficiencies 0.644 0.623 0.601 0.611 Mobility Tax - - - - Insurance 0.013 0.230 0.327 0.187 Pension 1.659 2.727 3.140 3.333 Reimbursable Positions reclass to Non Reimbursable (2.888) (2.941) (2.997) (3.252) Shop Overhaul - 10.159 5.087 0.985 capital rev loss - - - - opeb 1.661 0.939 1.180 1.155 Bus Study (0.250) (0.250) - - Sub-Total Major Changes ($14.392) $13.669 $11.268 $0.892
Total Non-Reimbursable Major Changes ($17.018) $10.483 $8.962 ($1.479)
Reimbursable Major Changes
Revenue 0.000 0.000 0.000 0.000Reimbursable Positions reclass to Non Reimbursable (2.888) ($2.941) ($2.997) ($3.252) Sub-Total Reimbursable Revenue Changes ($2.888) ($2.941) ($2.997) ($3.252)
ExpensesReimbursable Positions reclass to Non Reimbursable 2.888 $2.941 $2.997 $3.252 Sub-Total Reimbursable Expenses Changes $2.888 $2.941 $2.997 $3.252
Sub-Total Reimbursable Expense Changes $2.888 $2.941 $2.997 $3.252
Total Reimbursable Major Changes $0.000 $0.000 $0.000 $0.000
Total Accrual Changes ($17.018) $10.483 $8.962 ($1.479)
Cash Adjustment ChangesGASB $2.389 $5.093 $5.216 $5.306Timing (68.389) - - - Total Cash Adjustment Changes ($66.000) $5.093 $5.216 $5.306
Total Baseline Changes ($83.018) $15.576 $14.178 $3.827
July Financial Plan - Cash Surplus/(Deficit) ($419.444) ($402.208) ($418.661) ($424.944)
MTA BUS COMPANYJuly Financial Plan 2015 - 2018
Summary of Major Programmatic Changes Between Financial Plans($ in millions)
V-282

MTA BUS COMPANY 2015 Preliminary Budget
July Financial Plan 2015 – 2018 RIDERSHIP/ (UTILIZATION)
Ridership The 2014 July Financial Plan baseline riders hip forecast assumes that the weathe r adjusted January-April 2014 local bus ridership trend, which was 1.1% ab ove budget, and the March-April express bus trend, whic h was 5.2% below b udget, will continue for the rest of the year. As a result of hig her than expected local bus ridership, lower than expected express bus ridership and severe winter weather in January and February, projected 2014 loca l and express ridership is 1.2 million lower than the 2014 Adopted Budget. In developing the 2015 local and express bus ridership forecast, 2014 ridership wa s adjusted upward to account for lower rider ship resulting from multiple snowstorms in January and February 2014. The 2015 local and express bus ridership is projected to increase by approximately 0.7% from the weather adjusted 2014 base, based on a 40% factor applied to the most re cent (April 2014) employment forecast, which projects a higher employment increase in 2015 than the forecast used in the February Plan. The February Plan used the 40% factor for local bus, but used the full employment forecast for express bus. The factor is based on an analys is of historical bus ridership showing lower employment elasticity on bus than on subway. The factor is now being used for express bus as well as local bus, due to several years of declining express bus ridership despite rising employment. The resulting pr ojected 2015 local and express r idership is slightly (0.1 million) higher than the February Plan. Working off the revised 2015 baseline proj ection, 2016-2018 local and express bus ridership growth forecasts are based on t he 2014 April employ ment forecast (with a 40% factor), which projects hi gher employment increases in 2016-2018 than th e forecast used in the February Plan. The resulting ridership is expected to be 0.2 million higher than the February Plan in 2016 and 2017, and 0.3 million higher in 2018. Revenue Projected Farebox Revenue is $1.7 million lo wer than the F ebruary Plan in 2014, $1.5 million lower in 2015, $1.6 millio n lower in 2016, $1.7 million lo wer in 2017, and $1.6 million lower in 2 018. The neg ative revenue variances compared to mostly pos itive ridership variances are due to a lower propor tion of express bus ri dership (which has higher average fares than local bus), result ing in lower combined local and express average fares.
V-283

2014 20152013 Mid-Year Preliminary
Actual Forecast Budget 2016 2017 2018
RIDERSHIP
Fixed Route 124.951 123.461 125.424 126.284 126.415 126.916
Baseline Total Ridership 124.951 123.461 125.424 126.284 126.415 126.916
FAREBOX REVENUE
Fixed Route $199.187 $199.810 $201.403 $202.917 $203.163 $204.038
Baseline Total Revenue $199.187 $199.810 $201.403 $202.917 $203.163 $204.038
July Financial Plan 2015 - 2018MTA BUS COMPANY
Ridership/(Utilization)(in millions)
V-284

Administration Pos. 2014 Pos. 2015 Pos. 2016 Pos. 2017 Pos. 2018None - 0.000 - 0.000 - 0.000 - 0.000 - 0.000Subtotal Administration - 0.000 - 0.000 - $0.000 - $0.000 - $0.000
Customer Convenience/AmenitiesNone - 0.000 - 0.000 - 0.000 - 0.000 - 0.000Subtotal Customer Convenience/Amenities - 0.000 - 0.000 - 0.000 - 0.000 - 0.000
MaintenanceSOPU 6 0.580 6 0.591 6 0.602 6 0.653 6 0.665Shop Overhaul - 0.000 57 10.159 29 5.087 5 0.985 2 0.603Subtotal Maintenance 6 0.580 63 10.750 35 5.689 11 1.638 8 1.268
Revenue EnhancementNone - 0.000 - 0.000 - 0.000 - 0.000 - 0.000Subtotal Revenue Enhancement - 0.000 - 0.000 - 0.000 - 0.000 - 0.000
SafetyNone - 0.000 - 0.000 - 0.000 - 0.000 - 0.000Subtotal Safety - 0.000 - 0.000 - 0.000 - 0.000 - 0.000
SecurityNone - 0.000 - 0.000 - 0.000 - 0.000 - 0.000Subtotal Security - 0.000 - 0.000 - 0.000 - 0.000 - 0.000
ServiceNone - 0.000 - 0.000 - 0.000 - 0.000 - 0.000Subtotal Service - 0.000 - 0.000 - 0.000 - 0.000 - 0.000
Service SupportNone - 0.000 - 0.000 - 0.000 - 0.000 - 0.000Subtotal Service Support - 0.000 - 0.000 - 0.000 - 0.000 - 0.000
OtherNone - 0.000 - 0.000 - 0.000 - 0.000 - 0.000Subtotal Other - 0.000 - 0.000 - 0.000 - 0.000 - 0.000
Agency Submission 6 $0.580 63 $10.750 35 $5.689 11 $1.638 8 $1.268
Favorable/(Unfavorable)
MTA BUS COMPANYJuly Financial Plan 2015 - 2018
2014 Budget Reduction Plan Summary($ in millions)
V-285

July Financial Plan 2015 - 20182014 Budget Reduction Plan Worksheet
Category by Function: Maintenance
Program: Scheduled Operation Pick-up (SOPU)
Background Details:
Program Description/Implementation Plan:
Program Implementation Date: When will savings begin?: 1/1/2014
Are these savings recurring?:
Other Issues:
2014 2015 2016 2017 2018Financial Impact (Operating): $0.580 $0.591 $0.602 $0.653 $0.665
Net Cash Savings (in millions)
Total Positions Required: 6 6 6 6 6
MTA BUS COMPANY
SOPU: Completion of the scheduled operations (SO) pickup program to shift focus fromunscheduled work to a preventive maintenance culture.
Favorable/(Unfavorable)
V-286

July Financial Plan 2015 - 20182014 Budget Reduction Plan Worksheet
Category by Function: Maintenance
Program: Shop Overhaul
Background Details:
Program Description/Implementation Plan:
Program Implementation Date: When will savings begin?: 1/1/2015
Are these savings recurring?:
Other Issues:
2014 2015 2016 2017 2018Financial Impact (Operating): $0.000 $10.159 $5.087 $0.985 $0.603
Net Cash Savings (in millions)
Total Positions Required: 57 29 5 2
MTA BUS COMPANY
Shop Overhaul: The Shop program is complex with significant issues including the following: Savings generated by not overhauling MCI '05 &'06 due to planned retirement in 2017. As a result of extending and eliminating MCI overhauls, 2011 CNGs have been accelerated to a 4 year overhaul cycle. MTA Bus is in the process of doing a tear down of the MCI engines ('06,'07 &'09) to finalize the scope of work. As a result, the number of MCI engines in 2015 has been reduced until the final workscope is determined, and the balance was reallocated to 2016 and 2017.
Favorable/(Unfavorable)
V-287

MTA BUS COMPANY 2015 Preliminary Budget
July Plan 2015 – 2018 Positions
POSITION ASSUMPTIONS 2014: July Financial Plan vs. February Financial Plan The total positions for 2014 in the February Plan were 3,704. There is a net increase of 6 positions which will result in 3,710 posit ions for 2014 in the July Plan. Th e changes are as follows:
1 position in support of the MTA wide MWDBE Program 11 Overage Fleet Maintenance positions -6 positions due to the completion of the SOPU Program
Reimbursable positions decrease by 26 mainly due to the transfer of Salvage and Scrap Program positions to Non-Reimbursable. 2015: July Financial Plan vs. February Financial Plan The total positions for 2015 in the February Plan were 3,782. There is a net decrease of 62 positions which will result in the sum of 3,720 positions for 2015 in the July Plan. The changes are as follows:
1 position in support of the MTA wide MWDBE Program 11 Overage Fleet Maintenance positions -6 positions due the completion of the SOPU Program 2 positions in support of Buses Real Time bus in formation and MTA corporate
wide Asset Management initiatives 6 positions in support of Farebox Maintenance -76 positions due to changes in the Shop Overhaul Program
Reimbursable positions decrease by 26 mainly due to the transfer of Salvage and Scrap Program positions to Non-Reimbursable.
2016: July Financial Plan vs. February Financial Plan The total positions for 2016 in the February Plan were 3,797. This is a net decrease of 42 positions which will result in 3,755 positions for 2016 in the July Plan. The changes are as follows:
V-288

1 position in support of the MTA wide MWDBE Program -6 positions due the completion of the SOPU Program 2 positions in support of Buses real time bus information and MTA corporate-
wide Asset Management initiative 6 positions in support of Farebox Maintenance -45 position due to changes in the Shop Overhaul Program
Reimbursable positions decrease by 26 mainly due to the transfer of Salvage and Scrap Program positions to Non-Reimbursable.
2017: July Financial Plan vs. February Financial Plan The total positions for 2017 in the February Plan were 3,763. This is a net increase of 3 positions which will result in the sum of 3,766 pos itions for 2017 in the J uly Plan. T he changes are as follows: 1 position in support of the MTA wide MWDBE Program -6 positions due the completion of the SOPU Program 2 positions in support of Buses Real Time bus information and MTA corporate-
wide Asset Management initiative 6 positions in support of Farebox Maintenance
Reimbursable positions decrease by 26 mainly due to the transfer of Salvage and Scrap Program positions to Non-Reimbursable. Year-to-Year Changes
2015 Changes Over 2014: The total number of positions in 2015 increase by 10 for a total of 3,720. The changes are as follows: 2015 - Net increase of 10 Positions 2 positions in support of the Shop Hybrid Program 6 positions in support of Farebox Maintenance 2 positions in support of Buses Real Time bus information and MTA corporate-
wide Asset Management initiative 6 positions in support of the Shop Overhaul Program -6 positions for the completion of shifting buses from Far Rockaway to JFK Depot
V-289

2016 Changes Over 2015: The total number of positions in 2016 increase by 35 for a total of 3,755. The changes are as follows: 2016 - Net increase of 35 Positions 4 positions in support of Buses Real Time bus information and MTA corporate-
wide Asset Management initiative 31 positions in support of the Shop Overhaul Program
2017 Changes Over 2016: The total number of positions in 2017 increase by 11 for a total of 3,766. The changes are as follows: 2017 - Net Change increase of 11 Positions 11 positions increase for Shop Overhaul Program
2018 Changes Over 2017: The total number of positions in 2018 decrease by 48 for a total of 3,718. The changes are as follows: 2018 - Net decrease of 48 Positions 48 positions decrease for Shop Overhaul Program
V-290

2014 2015 2016 2017
2014 February Plan ‐ Total Baseline Positions 3,704 3,782 3,797 3,763
Total Plan-to-Plan Changes (6) 62 42 (3)
2014 July Plan ‐ Total Baseline Positions 3,710 3,720 3,755 3,766
Total Year-to-Year Changes, July Plan (10) (35) (11)
Total Plan‐to‐Plan Changes by Reporting Category:
Non‐Reimbursable (32) 36 16 (29)Reimbursable 26 26 26 26
Total (6) 62 42 (3)Full‐Time (6) 62 42 (3)Full‐Time Equivalents 0 0 0 0
Total (6) 62 42 (3)By Function Category ‐ Administration 6 4 4 4 ‐ Operations (1) (7) (7) (7) ‐ Maintenance (11) 65 45 0 ‐ Engineering/Capital 0 0 0 0 ‐ Public Safety 0 0 0 0
Total (6) 62 42 (3)By Occupational Group ‐ Managers/Supervisors (3) (3) (1) (1) ‐ Professional, Technical, Clerical 0 (2) (2) (2) ‐ Operational Hourlies (3) 67 45 0
Total (6) 62 42 (3)
Total Plan‐to‐Plan Changes by Major Category:2014 BRPs 6 63 35 11New Needs (12) (20) (9) (9)Change in Reimbursable Positions 26 26 26 26
Re‐estimates & All Other 1 (26) (7) (10) (31)Total (6) 62 42 (3)
1IncludesFullTimeEquivalents
MTA BUS COMPANY
July Financial Plan 2015‐2018Favorable/(Unfavorable)
Total Position Changes at a Glance
V-291

2014 20152013 Mid-Year Preliminary
FUNCTION/DEPARTMENT Actual Forecast Budget 2016 2017 2018
AdministrationOffice of the EVP 2 3 3 3 3 3 Human Resources 9 6 6 6 6 6 Office of Management and Budget 12 14 16 16 16 16 Technology & Information Services 16 16 16 16 16 16 Materiel 14 19 19 19 19 19 Controller 19 15 15 15 15 15 Office of the President 5 6 6 6 6 6 System Safety Administration 1 5 5 5 5 5 Law 23 24 24 24 24 24 Corporate Communications 3 3 3 3 3 3 Strategic Office 11 12 12 16 16 16 Labor Relations - 4 4 4 4 4 Non Departmental - 11 14 6 10 4
Total Administration 115 138 143 139 143 137
OperationsBuses 2,142 2,211 2,211 2,211 2,211 2,211 Office of the Executive Vice President, Regional 1 1 1 1 1 1 Safety & Training 46 28 28 28 28 28 Road Operations 112 117 117 117 117 117 Transportation Support 21 20 20 20 20 20 Operations Planning 28 32 32 32 32 32 Revenue Control 20 21 27 27 27 27
Total Operations 2,370 2,430 2,436 2,436 2,436 2,436
MaintenanceBuses 738 765 685 705 750 750 Maintenance Support/CMF 173 157 236 255 217 175 Facilities 43 73 73 73 73 73 Supply Logistics 90 92 92 92 92 92
Total Maintenance 1,044 1,087 1,086 1,125 1,132 1,090
Engineering/CapitalCapital Program Management 31 37 37 37 37 37
Public SafetyOffice of the Senior Vice President 16 18 18 18 18 18
Total Positions 3,576 3,710 3,720 3,755 3,766 3,718
Non-Reimbursable 3,520 3,672 3,682 3,717 3,728 3,680 Reimbursable 56 38 38 38 38 38
Total Full-Time 3,559 3,695 3,705 3,740 3,751 3,703 Total Full-Time Equivalents 17 15 15 15 15 15
MTA BUS COMPANYJuly Financial Plan 2015 - 2018
Total Positions by Function & DepartmentNon-Reimbursable/Reimbursable and Full-Time/Full-Time Equivalents
V-292

2014 20152013 Mid-Year Preliminary
FUNCTION/OCCUPATIONAL GROUP Actual Forecast Budget 2016 2017 2018
Administration Managers/Supervisors 42 57 57 57 57 57 Professional, Technical, Clerical 73 70 72 76 76 76 Operational Hourlies - 11 14 6 10 4
Total Administration 115 138 143 139 143 137
Operations Managers/Supervisors 293 298 298 298 298 298 Professional, Technical, Clerical 54 52 52 52 52 52 Operational Hourlies 2,023 2,080 2,086 2,086 2,086 2,086
Total Operations 2,370 2,430 2,436 2,436 2,436 2,436
Maintenance Managers/Supervisors 196 207 209 207 207 205 Professional, Technical, Clerical 15 17 17 17 17 17 Operational Hourlies 833 863 860 901 908 868
Total Maintenance 1,044 1,087 1,086 1,125 1,132 1,090
Engineering/Capital Managers/Supervisors 16 21 21 21 21 21 Professional, Technical, Clerical 15 16 16 16 16 16 Operational Hourlies - - - - - -
Total Engineering/Capital 31 37 37 37 37 37
Public Safety Managers/Supervisors 10 14 14 14 14 14 Professional, Technical, Clerical 4 4 4 4 4 4 Operational Hourlies 2 - - - - -
Total Public Safety 16 18 18 18 18 18
Total Positions Managers/Supervisors 557 597 599 597 597 595 Professional, Technical, Clerical 161 159 161 165 165 165 Operational Hourlies 2,858 2,954 2,960 2,993 3,004 2,958
Total Baseline Positions 3,576 3,710 3,720 3,755 3,766 3,718
MTA BUS COMPANYJuly Financial Plan 2015 - 2018
Total Positions by Function and Occupation
V-293

[THIS PAGE INTENTIONALLY LEFT BLANK]
V-294

Staten Island Railway

MTA STATEN ISLAND RAILWAY 2015 Preliminary Budget
July Financial Plan 2015 - 2018 FINANCIAL OVERVIEW The 2014 Mid-Year Forecast, 2015 Preliminar y Budget and projections for the years 2016-2018 provide s ufficient funding to maintain current service levels as well as t o maintain MTA’s commitment to safety and security. Reflecting the recent labor settlement with the Transport Workers Union (TWU), MTA’s largest union, the July Plan assumes the same pattern settlement for employees represented by unions without contract agreements. This assumption projects costs that are in excess of the February Plan provision, and a portion of this additional cost will be funded by the sus pension of contributions to the GASB Acc ount. Perfo rmance indicators includ ing mean distance between failures and on-time performance remain within targeted levels. The primary new need included in this plan represents the necessity t o upgrade damaged and eroded gasoline and diesel fuel tanks locat ed at 293 Bay Street in order to avoid more erosion that coul d result in serious ris ks. The cost of this upgrade is estimated at $0.283 million. A 2014 Budget Reduction Program (BRP) is included in this financial plan and projects annual sav ings of $0.211 million, beginning in 2015. These savings are to result from the process of delaying hirin g to fill vacancies, based on the ass essment of vacant position functions and risks. 2014 Mid-Year Forecast MTA Staten Island Railway’s 20 14 Mid-Year Forecast reflects total expen ses before depreciation and other post-employment benefits (OPEB) of $50 .957 million, including $44.908 million of non-reimbur sable expenses and $6.049 million of reimbursable expenses. Total revenues are projected to be $16.142 million, of which $10.093 million are operating revenues and $6.049 million represent capital reimbursements. Total full-time positions are 305, including 268 non- reimbursable positions and 37 reimbursable positions. The 2014 Mid-Year F orecast operating cash deficit is projected to increase by $6.520 million in comparison with the 2014 Adopted Budget. Major variances include:
The unfavorable timing of cash results originating from 2013 of $3.332 million.
An update in wage pattern assumptions, consistent with the recent TWU labor contract agreement, resulting in additional salaries and wages of $1.066 million and estimated retro-wage payments of $1.879 million applicable to previous years since the current labor contracts expired.
V-295

A cost of $0.283 million to upgrade damaged/eroded fuel tanks.
2015 Preliminary Budget MTA Staten Island Railway’s 20 15 Preliminary Budget reflec ts total expenses before depreciation and O PEB of $55.891 million, inc luding $49.842 million of non-reimbursable expenses and $6.0 49 million of reimbursable ex penses. Total revenue s are projected to be $14.289 m illion, of which $8.240 million are operating revenues and $6.049 million repres ent capital reimbursem ents. Total full-time positions are 305, including 268 non-reimbursable positions and 37 reimbursable positions. The 2015 Preliminary Budget operating cash deficit is pr ojected to increase by $0.053 million. Major changes include:
An update in wage pattern assumptions, consistent with the recent TWU labor contract agreement, resulting in additional salaries and wages of $1.137 million.
Revised inflation assumptions, resulting in savings of $0.783 million, mostly in the areas of electric power and insurance expenses.
Budget reduction savings of $0.211 million, based on a managed delay in filling vacancies.
Financial Plan 2016-2017 Projections Operating cash deficits ar e projected to increase by $7.993 million in 2016 and decrease by $8.765 million in 2017. Included in these projections:
A change in the timing of implementat ion of an R44 car fleet maintenance program, reducing the main tenance period from two years to eighteen months, resulting in accelerating $8.466 million of expenses from 2017 to 2016.
An update in wage pattern assumptions, consistent with the recent TWU labor contract agreement, resulting in additional salaries and wages of $1.181 million in 2016 and $1.234 million in 2017
Revised inflation assumptions, resulting in savings of $1.307 million in 2016 and $1.061 million in 2017, mostly in the areas of electric power and insurance expenses.
Budget reduction savings of $0.211 million each year, based on a managed delay in filling vacancies.
V-296

NON-REIMBURSABLE
2014 2015
2013 Mid-Year Preliminary
Actual Forecast Budget 2016 2017 2018
Operating Revenue
Farebox Revenue $5.504 $5.750 $5.876 $5.964 $6.012 $6.064Toll RevenueOther Operating Revenue 4.251 4.343 2.364 2.385 2.407 2.430Capital and Other ReimbursementsTotal Revenue $9.755 $10.093 $8.240 $8.349 $8.419 $8.494
Operating Expenses
Labor:
Payroll $17.149 $18.572 $18.930 $19.338 $19.783 $20.208Overtime 2.369 2.269 0.734 0.748 0.761 0.775Health and Welfare 3.005 4.089 4.285 4.375 4.571 4.778OPEB Current Payment 1.745 0.874 0.917 0.938 0.981 1.027Pensions 5.832 5.751 5.751 5.851 5.851 5.951Other Fringe Benefits 4.322 2.610 1.623 1.650 1.677 1.709Reimbursable Overhead (0.954) (2.205) (2.205) (1.102) 0.000 0.000Total Labor Expenses $33.468 $31.960 $30.035 $31.798 $33.624 $34.448
Non-Labor:
Electric Power $3.957 $6.012 $5.413 $5.590 $6.461 $6.982Fuel 0.334 0.359 0.349 0.335 0.324 0.331Insurance 0.588 1.345 1.608 1.767 2.055 2.152Claims 0.014 0.083 0.088 0.093 0.099 0.104Paratransit Service Contracts 0.000 0.000 0.000 0.000 0.000 0.000Maintenance and Other Operating Contracts 0.869 3.041 10.815 18.970 1.786 1.824Professional Service Contracts 0.731 0.727 0.491 0.482 0.491 0.498Materials & Supplies 2.295 1.551 1.038 1.344 1.654 1.681Other Business Expenses 0.592 (0.170) 0.005 0.005 0.005 0.006Total Non-Labor Expenses $9.380 $12.948 $19.807 $28.586 $12.875 $13.578
Other Expenses Adjustments:
Other $0.000 $0.000 $0.000 $0.000 $0.000 $0.000Total Other Expense Adjustments $0.000 $0.000 $0.000 $0.000 $0.000 $0.000
Total Expenses before Depreciation and GASB A $42.848 $44.908 $49.842 $60.384 $46.499 $48.026
Depreciation $8.114 $8.300 $8.300 $8.300 $8.300 $8.300OPEB Obligation 1.413 2.300 2.300 2.300 2.300 2.300Environmental Remediation 0.000 0.000 0.000 0.000 0.000 0.000
Total Expenses $52.375 $55.508 $60.442 $70.984 $57.099 $58.626
Baseline Surplus/(Deficit) ($42.620) ($45.415) ($52.202) ($62.635) ($48.680) ($50.132)
MTA STATEN ISLAND RAILWAYJuly Financial Plan 2015-2018
Accrual Statement of Operations by Category
($ in millions)
V-297

REIMBURSABLE
2014 20152013 Mid-Year Preliminary
Actual Forecast Budget 2016 2017 2018
Revenue
Farebox Revenue $0.000 $0.000 $0.000 $0.000 $0.000 $0.000Toll Revenue 0.000 0.000 0.000 0.000 0.000 0.000Other Operating Revenue 0.000 0.000 0.000 0.000 0.000 0.000Capital and Other Reimbursements 4.073 6.049 6.049 3.864 1.680 1.680Total Revenue $4.073 $6.049 $6.049 $3.864 $1.680 $1.680
Expenses
Labor:
Payroll $1.328 $2.449 $2.449 $1.369 $0.288 $0.288Overtime 0.552 0.707 0.707 0.705 0.704 0.704 Health and Welfare 0.000 0.517 0.517 0.517 0.517 0.517 OPEB Current Payment 0.022 0.000 0.000 0.000 0.000 0.000Pensions 0.000 0.094 0.094 0.094 0.094 0.094 Other Fringe Benefits 0.152 0.077 0.077 0.077 0.077 0.077 Reimbursable Overhead 0.954 2.205 2.205 1.102 0.000 0.000Total Labor Expenses $3.008 $6.049 $6.049 $3.864 $1.680 $1.680
Non-Labor:
Electric Power $0.017 $0.000 $0.000 $0.000 $0.000 $0.000Fuel 0.000 0.000 0.000 0.000 0.000 0.000Insurance 0.000 0.000 0.000 0.000 0.000 0.000Claims 0.000 0.000 0.000 0.000 0.000 0.000Paratransit Service Contracts 0.000 0.000 0.000 0.000 0.000 0.000Maintenance and Other Operating Contracts 0.000 0.000 0.000 0.000 0.000 0.000Professional Service Contracts 0.000 0.000 0.000 0.000 0.000 0.000Materials & Supplies 1.048 0.000 0.000 0.000 0.000 0.000Other Business Expenses 0.000 0.000 0.000 0.000 0.000 0.000Total Non-Labor Expenses $1.065 $0.000 $0.000 $0.000 $0.000 $0.000
Other Expenses Adjustments:
Other Total Other Expense Adjustments $0.000 $0.000 $0.000 $0.000 $0.000 $0.000
Total Expenses before Depreciation $4.073 $6.049 $6.049 $3.864 $1.680 $1.680
Depreciation
Total Expenses $4.073 $6.049 $6.049 $3.864 $1.680 $1.680
Baseline Surplus/(Deficit) $0.000 $0.000 $0.000 $0.000 $0.000 $0.000
MTA STATEN ISLAND RAILWAY
Accrual Statement of Operations by CategoryJuly Financial Plan 2015-2018
($ in millions)
V-298

NON-REIMBURSABLE / REIMBURSABLE
2014 20152013 Mid-Year Preliminary
Actual Forecast Budget 2016 2017 2018
Revenue
Farebox Revenue $5.504 $5.750 $5.876 $5.964 $6.012 $6.064Toll Revenue 0.000 0.000 0.000 0.000 0.000 0.000Other Operating Revenue 4.251 4.343 2.364 2.385 2.407 2.430Capital and Other Reimbursements 4.073 6.049 6.049 3.864 1.680 1.680Total Revenue $13.828 $16.142 $14.289 $12.213 $10.099 $10.174
Expenses
Labor:
Payroll $18.477 $21.021 $21.379 $20.707 $20.071 $20.496Overtime 2.921 2.976 1.441 1.453 1.465 1.479Health and Welfare 3.005 4.606 4.802 4.892 5.088 5.295OPEB Current Payment 1.767 0.874 0.917 0.938 0.981 1.027Pensions 5.832 5.845 5.845 5.945 5.945 6.045Other Fringe Benefits 4.474 2.687 1.700 1.727 1.754 1.786Reimbursable Overhead 0.000 0.000 0.000 0.000 0.000 0.000Total Labor Expenses $36.476 $38.009 $36.084 $35.662 $35.304 $36.128
Non-Labor:
Electric Power $3.974 $6.012 $5.413 $5.590 $6.461 $6.982Fuel 0.334 0.359 0.349 0.335 0.324 0.331Insurance 0.588 1.345 1.608 1.767 2.055 2.152Claims 0.014 0.083 0.088 0.093 0.099 0.104Paratransit Service Contracts 0.000 0.000 0.000 0.000 0.000 0.000Maintenance and Other Operating Contracts 0.869 3.041 10.815 18.970 1.786 1.824Professional Service Contracts 0.731 0.727 0.491 0.482 0.491 0.498Materials & Supplies 3.343 1.551 1.038 1.344 1.654 1.681Other Business Expenses 0.592 (0.170) 0.005 0.005 0.005 0.006Total Non-Labor Expenses $10.445 $12.948 $19.807 $28.586 $12.875 $13.578
Other Expenses Adjustments:
Other $0.000 $0.000 $0.000 $0.000 $0.000 $0.000Total Other Expense Adjustments $0.000 $0.000 $0.000 $0.000 $0.000 $0.000
Total Expenses before Depreciation $46.921 $50.957 $55.891 $64.248 $48.179 $49.706
Depreciation $8.114 $8.300 $8.300 $8.300 $8.300 $8.300OPEB Obligation 1.413 2.300 2.300 2.300 2.300 2.300Environmental Remediation 0.000 0.000 0.000 0.000 0.000 0.000
Total Expenses $56.448 $61.557 $66.491 $74.848 $58.779 $60.306
Baseline Surplus/(Deficit) ($42.620) ($45.415) ($52.202) ($62.635) ($48.680) ($50.132)
MTA STATEN ISLAND RAILWAY
($ in millions)
July Financial Plan 2015-2018Accrual Statement of Operations by Category
V-299

CASH RECEIPTS AND EXPENDITURES
2014 20152013 Mid-Year Preliminary
Actual Forecast Budget 2016 2017 2018
Receipts
Farebox Revenue $5.567 $5.267 $5.875 $5.964 $6.012 $6.064Vehicle Toll Revenue 0.000 0.000 0.000 0.000 0.000 0.000Other Operating Revenue 3.497 5.726 2.364 2.385 2.407 2.430Capital and Other Reimbursements 3.367 7.398 6.049 3.864 1.680 1.680Total Receipts $12.431 $18.391 $14.288 $12.213 $10.099 $10.174
Expenditures
Labor:
Payroll $15.568 $24.236 $21.379 $20.707 $20.071 $20.496Overtime 2.627 3.270 1.441 1.453 1.465 1.479Health and Welfare 5.070 4.606 4.802 4.892 5.088 5.295OPEB Current Payment 1.136 0.874 0.917 0.938 0.981 1.027Pensions 3.974 7.585 5.845 5.945 5.945 6.045Other Fringe Benefits 0.901 1.821 1.700 1.727 1.754 1.786GASB Account 0.000 0.587 0.000 0.000 0.000 0.012Reimbursable Overhead 0.000 0.000 0.000 0.000 0.000 0.000Total Labor Expenditures $29.276 $42.979 $36.084 $35.662 $35.304 $36.140
Non-Labor:
Electric Power $3.995 $6.512 $5.413 $5.590 $6.461 $6.982Fuel 0.354 0.359 0.349 0.335 0.324 0.331Insurance 0.803 1.722 1.608 1.767 2.055 2.152Claims 0.017 0.083 0.088 0.093 0.099 0.104Paratransit Service Contracts 0.000 0.000 0.000 0.000 0.000 0.000Maintenance and Other Operating Contracts 3.356 3.041 10.815 18.970 1.786 1.824Professional Service Contracts 0.654 0.727 0.491 0.482 0.491 0.498Materials & Supplies 2.625 2.251 1.038 1.344 1.654 1.681Other Business Expenses 0.005 (0.170) 0.005 0.005 0.005 0.006Total Non-Labor Expenditures $11.809 $14.525 $19.807 $28.586 $12.875 $13.578
Other Expenditure Adjustments:
Other Total Other Expenditure Adjustments $0.000 $0.000 $0.000 $0.000 $0.000 $0.000
Total Expenditures $41.085 $57.504 $55.891 $64.248 $48.179 $49.718
Baseline Cash Deficit ($28.654) ($39.113) ($41.603) ($52.035) ($38.080) ($39.544)
Cash Receipts & Expenditures
MTA STATEN ISLAND RAILWAYJuly Financial Plan 2015-2018
($ in millions)
V-300

CASH FLOW ADJUSTMENTS
2014 2015
2013 Mid-Year PreliminaryActual Forecast Budget 2016 2017 2018
Receipts
Farebox Revenue $0.063 ($0.483) ($0.001) $0.000 $0.000 $0.000Vehicle Toll Revenue 0.000 0.000 0.000 0.000 0.000 0.000Other Operating Revenue (0.754) 1.383 0.000 0.000 0.000 0.000Capital and Other Reimbursements (0.706) 1.349 0.000 0.000 0.000 0.000Total Receipts ($1.397) $2.249 ($0.001) $0.000 $0.000 $0.000
Expenditures
Labor:
Payroll $2.909 ($3.215) $0.000 $0.000 $0.000 $0.000Overtime 0.294 (0.294) 0.000 0.000 0.000 0.000Health and Welfare (2.065) 0.000 0.000 0.000 0.000 0.000OPEB Current Payment 0.631 0.000 0.000 0.000 0.000 0.000Pensions 1.858 (1.740) 0.000 0.000 0.000 0.000Other Fringe Benefits 3.573 0.866 0.000 0.000 0.000 0.000GASB Account 0.000 (0.587) 0.000 0.000 0.000 (0.012)Reimbursable Overhead 0.000 0.000 0.000 0.000 0.000 0.000Total Labor Expenditures $7.200 ($4.970) $0.000 $0.000 $0.000 ($0.012)
Non-Labor:
Traction and Propulsion Power ($0.021) ($0.500) $0.000 $0.000 $0.000 $0.000Fuel for Buses and Trains (0.020) 0.000 0.000 0.000 0.000 0.000Insurance (0.215) (0.377) 0.000 0.000 0.000 0.000Claims (0.003) 0.000 0.000 0.000 0.000 0.000Paratransit Service Contracts 0.000 0.000 0.000 0.000 0.000 0.000Maintenance and Other Operating Contracts (2.487) 0.000 0.000 0.000 0.000 0.000Professional Service Contracts 0.077 0.000 0.000 0.000 0.000 0.000Materials & Supplies 0.718 (0.700) 0.000 0.000 0.000 0.000Other Business Expenditures 0.587 0.000 0.000 0.000 0.000 0.000Total Non-Labor Expenditures ($1.364) ($1.577) $0.000 $0.000 $0.000 $0.000
Other Expenditures Adjustments:
Other $0.000 $0.000 $0.000 $0.000 $0.000 $0.000Total Other Expenditures Adjustments $0.000 $0.000 $0.000 $0.000 $0.000 $0.000
Total Cash Conversion Adjustments before Depreciation and GASB Adjs.
$4.439 ($4.298) ($0.001) $0.000 $0.000 ($0.012)
Depreciation Adjustment $8.114 $8.300 $8.300 $8.300 $8.300 $8.300OPEB Obligation 1.413 2.300 2.300 2.300 2.300 2.300Environmental Remediation 0.000 0.000 0.000 0.000 0.000 0.000
Baseline Total Cash Conversion Adjustments $13.966 $6.302 $10.599 $10.600 $10.600 $10.588
Total Cash Conversion Adjustments $13.966 $6.302 $10.599 $10.600 $10.600 $10.588
($ in millions)
July Financial Plan 2015-2018Cash Conversion (Cash Flow Adjustments)
MTA STATEN ISLAND RAILWAY
V-301

MTA STATEN ISLAND RAILWAY 2015 Preliminary Budget
July Financial Plan 2015 - 2018 Year-to-Year Changes by Category-Baseline
TOTAL REVENUES/RECEIPTS Farebox Revenue
Farebox revenue improves by $0.126 million or 2.2% in 2015, due largely to a projected increase in employment. Farebox revenue is also projected to increase by $0.088 million or 1.5% in 2016, $0.048 million or 0.8% in 2017, and $0.052 million or 0.9% in 2018 due to updated employment projections. 2014 includes an unfavorable cash timing adjustment of $0.483 million, due to the timing of farebox receipt settlements with NYCT from 2013.
Other Operating Revenue
The major unfavorable change in 2015 over 2014 of $1.979 million or 45.6% was due to estimated Sandy and Irene recoveries in 2014 not recurring in 2015. 2014 includes a favorable cash timing adjustment of $1.456 million, due to delays in 2013 of receipt of student fare reimbursements.
Capital and Other Reimbursements
2014 includes $1.349 million of reimbursements delayed from 2013.
TOTAL EXPENSES/EXPENDITURES Projections include additional Payroll and Other Fringe Benefit s expenses for those employees without c ontract agreements that are patterned after the recent TWU settlement. Payroll
Represented employee wage increase assumptions follow the TWU pattern upon expiration of existing contracts as follows: 0.87% , 0.95%, 2.23%, 2.22% and 1.88% for years 1,2,3,4, and 5. CPI-based increases of 2% are assumed for each year upon expiration of the pattern,
Salaries for non-represented employees, who have not received a general salary increase during the last five years, are assumed to follow CPI-based increases. The 2014 Mid-Year Forecast baseline includes the compounding of raises for 2012 and 2013; however, as of the July Plan, no raises have been granted.
2014 includes $1.470 million of unfavorable payment timing from 2013. Overtime
Includes projected wage inflation increases as noted above for represented employees.
2014 includes $0.294 million of unfavorable payment timing from 2013.
V-302

Health & Welfare/OPEB Current Payment
2015-2018 includes projected rate increases of 4.87%, 2.17%, 4.60% and 4.60%, respectively.
Pension Projections are based on current actuarial information. 2014 includes $1.740 million of unfavorable payment timing from 2013.
Other Fringe Benefits 2015-2018 includes inflation increases of 1.74%, 1.77%, 1.85% and 2.03%,
respectively. Electric Power (Traction/Non-Traction)
2015-2018 inflation assumptions are based on projected New York Power Authority (NYPA)/Con Edison rate increases provided by MTA.
2014 includes $0.500 million of unfavorable payment timing from 2013. Fuel (Heating/Diesel)
2015-2018 reflects inflationary assumptions provided by MTA. Insurance
2015-2018 reflects inflationary assumptions provided by MTA. 2014 includes $0.377 million of unfavorable payment timing from 2013.
Claims 2015-2018 reflects inflationary assumptions of 1.74%, 1.77%, 1.85% and 2.03%,
respectively.
Maintenance and Other Operating Contracts 2015-2018 reflects inflationary increases of 1.74%, 1.77%, 1.85% and 2.03%,
respectively. The increase in 2015 from 2014 of $7.774M is due mostly to the mid-year 2015 beginning of an 18 month R44 car fleet maintenance program. The 2016 increase over 2015 increase of $8.155 million represents the full year cost of the fleet maintenance program in 2016, versus a half year program segment in 2015.
Professional Service Contracts
2015-2018 reflects inflationary increases of 1.74%, 1.77%, 1.85% and 2.03%, respectively.
Materials and Supplies
2015-2018 reflects inflationary increases of 2.16%, 1.63%, 1.42% and 1.36%, respectively. 2014 includes $0.700 million of unfavorable payment timing from 2013.
Other Business Expenses
V-303

2015-2018 reflects inflationary increases of 1.74%, 1.77%, 1.85% and 2.03%, respectively.
Depreciation
Annual expenses of $8.3 million do not increase during the Financial Plan, as no additional capital assets are projected to reach beneficial use.
V-304

NON-REIMBURSABLE
2014 2015Change
2015 - 2014 2016Change
2016 - 2015 2017Change
2017 - 2016 2018Change
2018 - 2017RevenueFarebox Revenue $5.750 $5.876 $0.126 $5.964 $0.088 $6.012 $0.048 $6.064 $0.052Vehicle Toll Revenue 0.000 0.000 0.000 0.000 0.000 0.000 0.000 0.000 0.000Other Operating Revenue 4.343 2.364 (1.979) 2.385 0.021 2.407 0.022 2.430 0.023Capital and Other Reimbursements 0.000 0.000 $0.000 0.000 $0.000 0.000 $0.000 0.000 $0.000Total Revenue $10.093 $8.240 ($1.853) $8.349 $0.109 $8.419 $0.070 $8.494 $0.075
ExpensesLabor:Payroll $18.572 $18.930 (0.358) $19.338 (0.408) $19.783 (0.445) $20.208 (0.425)Overtime 2.269 0.734 1.535 0.748 (0.014) 0.761 (0.013) 0.775 (0.014)Health and Welfare 4.089 4.285 (0.196) 4.375 (0.090) 4.571 (0.196) 4.778 (0.207)OPEB Current Payment 0.874 0.917 (0.043) 0.938 (0.021) 0.981 (0.043) 1.027 (0.046)Pensions 5.751 5.751 0.000 5.851 (0.100) 5.851 0.000 5.951 (0.100)Other Fringe Benefits 2.610 1.623 0.987 1.650 (0.027) 1.677 (0.027) 1.709 (0.032)Reimbursable Overhead (2.205) (2.205) 0.000 (1.102) (1.103) 0.000 (1.102) 0.000 0.000Total Labor Expenses $31.960 $30.035 $1.925 $31.798 ($1.763) $33.624 ($1.826) $34.448 ($0.824)
Non-Labor:Electric Power 6.012 5.413 0.599 5.590 (0.177) 6.461 (0.871) 6.982 (0.521)Fuel 0.359 0.349 0.010 0.335 0.014 0.324 0.011 0.331 (0.007)Insurance 1.345 1.608 (0.263) 1.767 (0.159) 2.055 (0.288) 2.152 (0.097)Claims 0.083 0.088 (0.005) 0.093 (0.005) 0.099 (0.006) 0.104 (0.005)Paratransit Service Contracts 0.000 0.000 0.000 0.000 0.000 0.000 0.000 0.000 0.000Maintenance and Other Operating Contracts 3.041 10.815 (7.774) 18.970 (8.155) 1.786 17.184 1.824 (0.038)Professional Service Contracts 0.727 0.491 0.236 0.482 0.009 0.491 (0.009) 0.498 (0.007)Materials & Supplies 1.551 1.038 0.513 1.344 (0.306) 1.654 (0.310) 1.681 (0.027)Other Business Expenses (0.170) 0.005 (0.175) 0.005 0.000 0.005 0.000 0.006 (0.001)Total Non-Labor Expenses $12.948 $19.807 ($6.859) $28.586 ($8.779) $12.875 $15.711 $13.578 ($0.703)
Other Expenses Adjustments:Other 0.000 0.000 0.000 0.000 0.000 0.000 0.000 0.000 0.000Total Other Expense Adjustments $0.000 $0.000 $0.000 $0.000 $0.000 $0.000 $0.000 $0.000 $0.000
Total Expenses before Depreciation and GASB Adjs. $44.908 $49.842 ($4.934) $60.384 ($10.542) $46.499 $13.885 $48.026 ($1.527)
Depreciation 8.300 8.300 0.000 8.300 0.000 8.300 0.000 8.300 0.000OPEB Obligation 2.300 2.300 0.000 2.300 0.000 2.300 0.000 2.300 0.000Environmental Remediation 0.000 0.000 0.000 0.000 0.000 0.000 0.000 0.000 0.000
Total Expenses $55.508 $60.442 ($4.934) $70.984 ($10.542) $57.099 $13.885 $58.626 ($1.527)
Net Surplus/(Deficit) ($45.415) ($52.202) ($6.787) ($62.635) ($10.433) ($48.680) $13.955 ($50.132) ($1.452)
MTA STATEN ISLAND RAILWAYJuly Financial Plan 2015-2018
Year-to-Year Changes by Category - Accrual Basis($ in millions)
Favorable/(Unfavorable)
V-305

REIMBURSABLE
2014 2015Change
2015 - 2014 2016Change
2016 - 2015 2017Change
2017 - 2016 2018Change
2018 - 2017RevenueFarebox Revenue $0.000 $0.000 $0.000 $0.000 $0.000 $0.000 $0.000 $0.000 $0.000Vehicle Toll Revenue 0.000 0.000 0.000 0.000 0.000 0.000 0.000 0.000 0.000Other Operating Revenue 0.000 0.000 0.000 0.000 0.000 0.000 0.000 0.000 0.000Capital and Other Reimbursements 6.049 6.049 $0.000 3.864 ($2.185) 1.680 ($2.184) 1.680 $0.000Total Revenue $6.049 $6.049 $0.000 $3.864 ($2.185) $1.680 ($2.184) $1.680 $0.000
ExpensesLabor:Payroll $2.449 $2.449 0.000 $1.369 1.080 $0.288 1.081 $0.288 0.000Overtime 0.707 0.707 0.000 0.705 0.002 0.704 0.001 0.704 0.000Health and Welfare 0.517 0.517 0.000 0.517 0.000 0.517 0.000 0.517 0.000OPEB Current Payment 0.000 0.000 0.000 0.000 0.000 0.000 0.000 0.000 0.000Pensions 0.094 0.094 0.000 0.094 0.000 0.094 0.000 0.094 0.000Other Fringe Benefits 0.077 0.077 0.000 0.077 0.000 0.077 0.000 0.077 0.000Reimbursable Overhead 2.205 2.205 0.000 1.102 1.103 0.000 1.102 0.000 0.000Total Labor Expenses $6.049 $6.049 $0.000 $3.864 $2.185 $1.680 $2.184 $1.680 $0.000
Non-Labor:Electric Power $0.000 $0.000 0.000 $0.000 0.000 $0.000 0.000 $0.000 0.000Fuel 0.000 0.000 0.000 0.000 0.000 0.000 0.000 0.000 0.000Insurance 0.000 0.000 0.000 0.000 0.000 0.000 0.000 0.000 0.000Claims 0.000 0.000 0.000 0.000 0.000 0.000 0.000 0.000 0.000Paratransit Service Contracts 0.000 0.000 0.000 0.000 0.000 0.000 0.000 0.000 0.000 Operating Contracts 0.000 0.000 0.000 0.000 0.000 0.000 0.000 0.000 0.000Professional Service Contracts 0.000 0.000 0.000 0.000 0.000 0.000 0.000 0.000 0.000Materials & Supplies 0.000 0.000 0.000 0.000 0.000 0.000 0.000 0.000 0.000Other Business Expenses 0.000 0.000 0.000 0.000 0.000 0.000 0.000 0.000 0.000Total Non-Labor Expenses $0.000 $0.000 $0.000 $0.000 $0.000 $0.000 $0.000 $0.000 $0.000
Other Expenses Adjustments:Other 0.000 0.000 0.000 0.000 0.000 0.000 0.000 0.000 0.000 Adjustments $0.000 $0.000 $0.000 $0.000 $0.000 $0.000 $0.000 $0.000 $0.000
Total Expenses before Depreciation $6.049 $6.049 $0.000 $3.864 $2.185 $1.680 $2.184 $1.680 $0.000
Depreciation 0.000 0.000 0.000 0.000 0.000 0.000 0.000 0.000 0.000
Total Expenses $6.049 $6.049 $0.000 $3.864 $2.185 $1.680 $2.184 $1.680 $0.000
Net Surplus/(Deficit) $0.000 $0.000 $0.000 $0.000 $0.000 $0.000 $0.000 $0.000 $0.000
($ in millions)Year-to-Year Changes by Category - Accrual Basis
Favorable/(Unfavorable)
July Financial Plan 2015-2018MTA STATEN ISLAND RAILWAYMTA STATEN ISLAND RAILWAY
V-306

NON-REIMBURSABLE/REIMBURSABLE
2014 2015Change
2015 - 2014 2016Change
2016 - 2015 2017Change
2017 - 2016 2018Change
2018 - 2017RevenueFarebox Revenue $5.750 $5.876 $0.126 $5.964 $0.088 $6.012 $0.048 $6.064 $0.052Vehicle Toll Revenue 0.000 0.000 0.000 0.000 0.000 0.000 0.000 0.000 0.000Other Operating Revenue 4.343 2.364 (1.979) 2.385 0.021 2.407 0.022 2.430 0.023Capital and Other Reimbursements 6.049 6.049 $0.000 3.864 ($2.185) 1.680 ($2.184) 1.680 $0.000Total Revenue $16.142 $14.289 ($1.853) $12.213 ($2.076) $10.099 ($2.114) $10.174 $0.075
ExpensesLabor:Payroll $21.021 $21.379 (0.358) $20.707 0.672 $20.071 0.636 $20.496 (0.425)Overtime 2.976 1.441 1.535 1.453 (0.012) 1.465 (0.012) 1.479 (0.014)Health and Welfare 4.606 4.802 (0.196) 4.892 (0.090) 5.088 (0.196) 5.295 (0.207)OPEB Current Payment 0.874 0.917 (0.043) 0.938 (0.021) 0.981 (0.043) 1.027 (0.046)Pensions 5.845 5.845 0.000 5.945 (0.100) 5.945 0.000 6.045 (0.100)Other Fringe Benefits 2.687 1.700 0.987 1.727 (0.027) 1.754 (0.027) 1.786 (0.032)Reimbursable Overhead 0.000 0.000 0.000 0.000 0.000 0.000 0.000 0.000 0.000Total Labor Expenses $38.009 $36.084 $1.925 $35.662 $0.422 $35.304 $0.358 $36.128 ($0.824)
Non-Labor:Electric Power 6.012 5.413 0.599 5.590 (0.177) 6.461 (0.871) 6.982 (0.521)Fuel 0.359 0.349 0.010 0.335 0.014 0.324 0.011 0.331 (0.007)Insurance 1.345 1.608 (0.263) 1.767 (0.159) 2.055 (0.288) 2.152 (0.097)Claims 0.083 0.088 (0.005) 0.093 (0.005) 0.099 (0.006) 0.104 (0.005)Paratransit Service Contracts 0.000 0.000 0.000 0.000 0.000 0.000 0.000 0.000 0.000 Operating Contracts 3.041 10.815 (7.774) 18.970 (8.155) 1.786 17.184 1.824 (0.038)Professional Service Contracts 0.727 0.491 0.236 0.482 0.009 0.491 (0.009) 0.498 (0.007)Materials & Supplies 1.551 1.038 0.513 1.344 (0.306) 1.654 (0.310) 1.681 (0.027)Other Business Expenses (0.170) 0.005 (0.175) 0.005 0.000 0.005 0.000 0.006 (0.001)Total Non-Labor Expenses $12.948 $19.807 ($6.859) $28.586 ($8.779) $12.875 $15.711 $13.578 ($0.703)
Total Expenses before Depreciation and GASB Adjs. $50.957 $55.891 ($4.934) $64.248 ($8.357) $48.179 $16.069 $49.706 ($1.527)
Depreciation 8.300 8.300 0.000 8.300 0.000 8.300 0.000 8.300 0.000OPEB Obligation 2.300 2.300 0.000 2.300 0.000 2.300 0.000 2.300 0.000Environmental Remediation 0.000 0.000 0.000 0.000 0.000 0.000 0.000 0.000 0.000
Total Expenses $61.557 $66.491 ($4.934) $74.848 ($8.357) $58.779 $16.069 $60.306 ($1.527)
Baseline Net Surplus/(Deficit) ($45.415) ($52.202) ($6.787) ($62.635) ($10.433) ($48.680) $13.955 ($50.132) ($1.452)
July Financial Plan 2015-2018Year-to-Year Changes by Category - Accrual Basis
MTA STATEN ISLAND RAILWAY
($ in millions)
Favorable/(Unfavorable)
V-307

2014 2015Change
2015 - 2014 2016Change
2016 - 2015 2017Change
2017 - 2016 2018Change
2018 - 2017
ReceiptsFarebox Revenue $5.267 $5.875 $0.608 $5.964 $0.089 $6.012 $0.048 $6.064 $0.052Other Operating Revenue 5.726 2.364 (3.362) 2.385 0.021 2.407 0.022 2.430 0.023Capital and Other Reimbursements 7.398 6.049 (1.349) 3.864 (2.185) 1.680 (2.184) 1.680 0.000Total Receipts $18.391 $14.288 ($4.103) $12.213 ($2.075) $10.099 ($2.114) $10.174 $0.075
ExpendituresLabor:Payroll 24.236 21.379 2.857 20.707 0.672 20.071 0.636 20.496 (0.425)Overtime 3.270 1.441 1.829 1.453 (0.012) 1.465 (0.012) 1.479 (0.014)Health and Welfare 4.606 4.802 (0.196) 4.892 (0.090) 5.088 (0.196) 5.295 (0.207)OPEB Current Payment 0.874 0.917 (0.043) 0.938 (0.021) 0.981 (0.043) 1.027 (0.046)Pensions 7.585 5.845 1.740 5.945 (0.100) 5.945 0.000 6.045 (0.100)Other Fringe Benefits 1.821 1.700 0.121 1.727 (0.027) 1.754 (0.027) 1.786 (0.032)GASB Account 0.587 0.000 0.587 0.000 0.000 0.000 0.000 0.012 (0.012)Reimbursable Overhead 0.000 0.000 0.000 0.000 0.000 0.000 0.000 0.000 0.000Total Labor Expenditures $42.979 $36.084 $6.895 $35.662 $0.422 $35.304 $0.358 $36.140 ($0.836)
Non-Labor:Electric Power 6.512 5.413 1.099 5.590 (0.177) 6.461 (0.871) 6.982 (0.521)Fuel 0.359 0.349 0.010 0.335 0.014 0.324 0.011 0.331 (0.007)Insurance 1.722 1.608 0.114 1.767 (0.159) 2.055 (0.288) 2.152 (0.097)Claims 0.083 0.088 (0.005) 0.093 (0.005) 0.099 (0.006) 0.104 (0.005)Paratransit Service Contracts 0.000 0.000 0.000 0.000 0.000 0.000 0.000 0.000 0.000Maintenance and Other Operating Contracts 3.041 10.815 (7.774) 18.970 (8.155) 1.786 17.184 1.824 (0.038)Professional Service Contracts 0.727 0.491 0.236 0.482 0.009 0.491 (0.009) 0.498 (0.007)Materials & Supplies 2.251 1.038 1.213 1.344 (0.306) 1.654 (0.310) 1.681 (0.027)Other Business Expenses (0.170) 0.005 (0.175) 0.005 0.000 0.005 0.000 0.006 (0.001)Total Non-Labor Expenditures $14.525 $19.807 ($5.282) $28.586 ($8.779) $12.875 $15.711 $13.578 ($0.703)
Other Expenditure Adjustments:Other 0.000 0.000 0.000 0.000 0.000 0.000 0.000 0.000 0.000Total Other Expenditure Adjustments $0.000 $0.000 $0.000 $0.000 $0.000 $0.000 $0.000 $0.000 $0.000
Total Expenditures $57.504 $55.891 $1.613 $64.248 ($8.357) $48.179 $16.069 $49.718 ($1.539)
Net Cash Deficit ($39.113) ($41.603) ($2.490) ($52.035) ($10.432) ($38.080) $13.955 ($39.544) ($1.464)
Favorable/(Unfavorable)
Year-to-Year Changes by Category - Cash Receipts and ExpendituresJuly Financial Plan 2015-2018
MTA STATEN ISLAND RAILWAY
($ in millions)
V-308

MTA STATEN ISLAND RAILWAY 2015 Preliminary Budget
July Financial Plan 2015-2018 Summary of Plan to Plan Changes-Baseline
2014: July Financial Plan vs. February Financial Plan Major Revenue Re-estimates
An increase in farebox revenue of $0.023 million, due mostly to projected higher ridership.
An increase in other operating revenue of $0.194 million, du e mostly to the
inclusion of estimated Tropical Storm Ir ene reimbursements, re sulting from the timing of revenues from 2013 and a reimbursement re-estimate.
Major Expense Re-estimates Projections include additional Payroll and Other Fringe Benefit s expenses for those employees without c ontract agreements that are patterned after the recent TWU settlement.
An update in wage pattern assumptions, consistent with the recent TWU labor
contract agreement, resulting in additional salaries & wages of $1.066 million.
An increase of $1.000 millio n of other fringe benefit ex penses, specifically for higher Workers’ Compensation reserve requirements.
A cost increase of $0.307 million in support of the installation of a new MTA-wide
budgeting system.
A cost of $0.283 million to upgrade damaged/eroded fuel tanks.
A pension expense re-estimate, result ing in an expense incr ease of $0.200 million.
Revised inflation assumptions, resulting in expense savings of $0.083 million.
Cash Adjustments
Unfavorable cash timing originating from 2013 of $3.332 million.
V-309

Estimated retro-wage payments of $1.879 million, resulting from an update in wage pattern assumptions and applicable to the previous years since the current labor contracts expired.
A favorable cash adjustment of $1.000 million to offset the non-cash expense increase based on additional Workers’ Compensation reserve requirements.
2015-2017: July Financial Plan vs. February Financial Plan Major Revenue Re-estimates
Increases in farebox r evenue of $0.070 million in 201 5, $0.087 million in 2 016 and $0.101 million in 2017, d ue to rider ship increases based on projected increases in employment.
Other operating revenues are projected to increase by $0.006 million each year,
based on a re-estimate of advertising revenues. Major Expense Re-estimates
An update in wage pattern assumptions, consistent with the recent TWU labor
contract agreement, resulting in additional salaries & wages of $1.137 million in 2015, $1.181 million in 2016, and $1.234 million in 2017.
Expense timing regarding an R44 car fl eet maintenance program, accelerating
$8.466 million of expenses from 2017 to 2016.
Budget reduction savings of $0.211 million each year, based on a ma naged delay in filling vacancies.
Pension expense re-estimates, resulting in expense increases of $0.100 million in 2015 and 2016.
Cost increases of $0. 066 million in 2015, and $0.048 million in both 2016 and 2017 in support of the installation of a new MTA-wide budgeting system.
Revised inflation assumptions, resulting in expense savings of $0.783 million in
2015, $1.307 million in 2016 an d $1.061 million in 2 017, mostly in the areas of electric power and insurance.
Cash Adjustments A re-estimate of OPEB GASB account pa yments, resulting in c ash savings of
$0.180 million in 2015, $0.191 million in 2016 and $0.202 million in 2017.
V-310

NON-REIMBURSABLE
2014 2015 2016 2017
($32.593) ($41.550) ($44.042) ($46.845)
Baseline Changes
RevenueFarebox Revenue 0.023 0.070 0.087 0.101 Other Operating Revenue 0.194 0.006 0.006 0.006Capital and Other ReimbursementTotal Revenue Changes $0.217 $0.076 $0.093 $0.107
ExpensesLabor:
Payroll (0.811) (0.860) (0.901) (0.951)Overtime 0.000 0.000 0.000 0.000Health and Welfare 0.123 0.068 0.211 0.262OPEB Current Payment (0.015) (0.030) (0.001) 0.007Pensions (0.200) (0.100) (0.100) 0.000Other Fringe Benefits (1.075) (0.065) (0.066) (0.068)Reimbursable Overhead 0.000 0.000 0.000 0.000Total Labor Expense Changes ($1.978) ($0.987) ($0.857) ($0.750)
Non-Labor:Traction and Propulsion Power (0.369) 0.504 0.697 0.181Fuel for Buses and Trains 0.009 0.001 0.000 0.018Insurance 0.335 0.251 0.407 0.601Claims 0.000 0.000 0.000 0.000Paratransit Service Contracts 0.000 0.000 0.000 0.000Maintenance and Other Operating Contracts (0.281) 0.001 (8.462) 8.470Professional Service Contracts (0.307) (0.066) (0.047) (0.047)Materials & Supplies (0.023) (0.013) (0.015) (0.017)Other Business Expenses 0.000 0.000 0.000 0.000Total Non-Labor Expense Changes ($0.636) $0.678 ($7.420) $9.206
Total Expense Changes before Depreciation & GASB Adjs. ($2.614) ($0.309) ($8.277) $8.456
Depreciation 0.000 0.000 0.000 0.000OPEB Obligation 0.000 0.000 0.000 0.000Environmental Remediation 0.000 0.000 0.000 0.000
Total Depreciation and GASB Adjs. Changes $0.000 $0.000 $0.000 $0.000
Cash Adjustment Changes Cash Timing from 2013 (3.332) 0.000 0.000 0.000Retro-Wage Adjustments (1.879) 0.000 0.000 0.000GASB Account Revision 0.088 0.180 0.191 0.202Cash Adjustment-Workers' Compensation Reserve Adjustment 1.000
Total Cash Adjustment Changes ($4.123) $0.180 $0.191 $0.202
($6.520) ($0.053) ($7.993) $8.765
($39.113) ($41.603) ($52.035) ($38.080)
MTA STATEN ISLAND RAILWAYJuly Financial Plan 2015-2018
Changes Between Financial Plans by Generic Categories($ in millions)
July Financial Plan - Cash Surplus/(Deficit)
February Financial Plan - Cash Surplus/(Deficit)
Total Baseline Changes
V-311

REIMBURSABLE
2014 2015 2016 2017
$0.000 $0.000 $0.000 $0.000
Baseline Changes
RevenueFarebox RevenueOther Operating RevenueCapital and Other Reimbursement
Total Revenue Changes $0.000 $0.000 $0.000 $0.000
ExpensesLabor:PayrollHealth and WelfareOPEB Current PaymentPensionsOther Fringe BenefitsReimbursable Overhead
Total Labor Expense Changes $0.000 $0.000 $0.000 $0.000
Non-Labor:Traction and Propulsion PowerFuel for Buses and TrainsInsuranceClaimsParatransit Service ContractsMaintenance and Other Operating ContractsMaterials & SuppliesOther Business Expenses
Total Non-Labor Expense Changes $0.000 $0.000 $0.000 $0.000
Total Expense Changes $0.000 $0.000 $0.000 $0.000
Cash Adjustment Changes
Total Cash Adjustment Changes $0.000 $0.000 $0.000 $0.000
$0.000 $0.000 $0.000 $0.000
$0.000 $0.000 $0.000 $0.000
MTA STATEN ISLAND RAILWAY
February Financial Plan - Cash Surplus/(Deficit)
Total Baseline Changes
Changes Between Financial Plans by Generic Categories($ in millions)
July Financial Plan - Cash Surplus/(Deficit)
July Financial Plan 2015-2018
V-312

NON-REIMBURSABLE/REIMBURSABLE2014 2015 2016 2017
($32.593) ($41.550) ($44.042) ($46.845)
Baseline Changes
RevenueFarebox Revenue 0.023 0.070 0.087 0.101 Other Operating Revenue 0.194 0.006 0.006 0.006Capital and Other ReimbursementTotal Revenue Changes $0.217 $0.076 $0.093 $0.107
ExpensesLabor:
Payroll (0.811) (0.860) (0.901) (0.951)Overtime 0.000 0.000 0.000 0.000Health and Welfare 0.123 0.068 0.211 0.262OPEB Current Payment (0.015) (0.030) (0.001) 0.007Pensions (0.200) (0.100) (0.100) 0.000Other Fringe Benefits (1.075) (0.065) (0.066) (0.068)Reimbursable Overhead 0.000 0.000 0.000 0.000Total Labor Expense Changes ($1.978) ($0.987) ($0.857) ($0.750)
Non-Labor:Traction and Propulsion Power (0.369) 0.504 0.697 0.181Fuel for Buses and Trains 0.009 0.001 0.000 0.018Insurance 0.335 0.251 0.407 0.601Claims 0.000 0.000 0.000 0.000Paratransit Service Contracts 0.000 0.000 0.000 0.000Maintenance and Other Operating Contracts (0.281) 0.001 (8.462) 8.470Professional Service Contracts (0.307) (0.066) (0.047) (0.047)Materials & Supplies (0.023) (0.013) (0.015) (0.017)Other Business Expenses 0.000 0.000 0.000 0.000
Additional Actions for Budget Balance: Expense ImpactTotal Non-Labor Expense Changes ($0.636) $0.678 ($7.420) $9.206
Total Expense Changes before Depreciation & GASB Adjs. ($2.614) ($.309) ($8.277) $8.456
Depreciation 0.000 0.000 0.000 0.000OPEB Obligation 0.000 0.000 0.000 0.000Environmental Remediation 0.000 0.000 0.000 0.000
Total Depreciation and GASB Adjs. Changes $0.000 $0.000 $0.000 $0.000
Cash Adjustment Changes Cash Timing from 2013 (3.332) 0.000 0.000 0.000Retro-Wage Adjustments (1.879) 0.000 0.000 0.000GASB Account Revision 0.088 0.180 0.191 0.202Cash Adjustment-Workers' Compensation Reserve Adjustment 1.000 0.000 0.000 0.000
Total Cash Adjustment Changes ($4.123) $0.180 $0.191 $0.202
($6.520) ($0.053) ($7.993) $8.765
($6.520) ($0.053) ($7.993) $8.765
($39.113) ($41.603) ($52.035) ($38.080)
Total Baseline Changes
Total Changes
July Financial Plan - Cash Surplus/(Deficit)
February Financial Plan - Cash Surplus/(Deficit)
MTA STATEN ISLAND RAILWAYJuly Financial Plan 2015-2018
Changes Between Financial Plans by Generic Categories($ in millions)
V-313

NON-REIMBURSABLE and REIMBURSABLE
2014 2015 2016 2017
February Financial Plan - Cash Surplus/(Deficit) ($32.593) ($41.550) ($44.042) ($46.845)
Non-Reimbursable Major Changes
Revenue Farebox Revenue 0.023 0.070 0.087 0.101
Other Operating Revenue 0.194 0.006 0.006 0.006
Sub-Total Non-Reimbursable Revenue Changes 0.217 0.076 0.093 0.107
Expenses
Wage Pattern Adjustment Impact (1.066) (1.137) (1.181) (1.234) R44 Fleet Maintenance Timing 0.000 0.000 (8.466) 8.466 Upgrade of Two Damaged Fuel Tanks (0.283) 0.000 0.000 0.000
Savings Programs 0.000 0.211 0.211 0.211
Pension Re-estimates (0.200) (0.100) (0.100) 0.000
Workers' Compensation Additional Reserve Requirements (1.000) 0.000 0.000 0.000
Costs to Install and New MTA-Wide Budgeting System (0.307) (0.066) (0.048) (0.048)
Revised Inflation Assumptions/Other Changes 0.242 0.783 1.307 1.061
Sub-Total Non-Reimbursable Expense Changes ($2.614) ($.309) ($8.277) $8.456
Total Non-Reimbursable Major Changes ($2.397) ($.233) ($8.184) $8.563
Reimbursable Major Changes
Sub-Total Reimbursable Revenue Changes 0.000 0.000 0.000 0.000
Sub-Total Reimbursable Expense Changes 0.000 0.000 0.000 0.000
Total Reimbursable Major Changes $0.000 $0.000 $0.000 $0.000
Total Accrual Changes ($2.397) ($0.233) ($8.184) $8.563
Cash Adjustment Changes Cash Timing from 2013 (3.332) 0.000 0.000 0.000Retro-Wage Adjustments (1.879) 0.000 0.000 0.000GASB Account Revision 0.088 0.180 0.191 0.202Cash Adjustment-Workers' Compensation Reserve Adjustment 1.000 0.000 0.000 0.000
Total Cash Adjustment Changes ($4.123) $0.180 $0.191 $0.202
Total Baseline Changes ($6.520) ($0.053) ($7.993) $8.765
July Financial Plan - Cash Surplus/(Deficit) ($39.113) ($41.603) ($52.035) ($38.080)
MTA Staten Island RailwayJuly Financial Plan 2015-2018
Summary of Major Programmatic Changes Between Financial Plans($ in millions)
V-314

MTA STATEN ISLAND RAILWAY 2015 Preliminary Budget
July Financial Plan 2015-2018 Ridership/(Utilization)
A re-estimate of non- student ridership is projected to increase ridership above the February Financial Plan by 0.007 million in 2014.
2015-2018 ridership growth pr ojects slightly higher annual employment growth
in 2015-2018 than the August 2013 forecast used for the February Financial Plan. As a result of the new employment forecast, ridership increases from the February Plan grow throughout the plan period.
Annual ridership is projected to be abov e the February Financial Plan by 0.033
million in 2015, 0.043 million in 2016, 0.052 million in 2017 and 0.060 million in 2018.
V-315

2013Actual
2014Mid-Year Forecast
2015 Preliminary
Budget 2016 2017 2018
RIDERSHIP
Fixed Route 4.221 4.327 4.403 4.458 4.488 4.521
- - - - - -
Baseline Total Ridership 4.221 4.327 4.403 4.458 4.488 4.521
FAREBOX REVENUE
Fixed Route $5.504 $5.750 $5.876 $5.964 $6.012 $6.064
Baseline Total Revenue $5.504 $5.750 $5.876 $5.964 6.012 6.064
MTA STATEN ISLAND RAILWAYJuly Financial Plan 2015-2018
Ridership/(Utilization)(in millions)
V-316

Administration Pos. 2014 Pos. 2015 Pos. 2016 Pos. 2017 Pos. 2018Vacany Maintenance/Management - 0.000 - 0.211 - 0.211 - 0.211 - 0.211Subtotal Administration - 0.000 - 0.211 - $0.211 - $0.211 - $0.211
Customer Convenience/AmenitiesNone - 0.000 - 0.000 - 0.000 - 0.000 - 0.000Subtotal Customer Convenience/Amenities - 0.000 - 0.000 - 0.000 - 0.000 - 0.000
Maintenance- 0.000 - 0.000 - 0.000 - 0.000 - 0.000
Subtotal Maintenance - 0.000 - 0.000 - 0.000 - 0.000 - 0.000
Revenue EnhancementNone - 0.000 - 0.000 - 0.000 - 0.000 - 0.000Subtotal Revenue Enhancement - 0.000 - 0.000 - 0.000 - 0.000 - 0.000
SafetyNone - 0.000 - 0.000 - 0.000 - 0.000 - 0.000Subtotal Safety - 0.000 - 0.000 - 0.000 - 0.000 - 0.000
SecurityNone - 0.000 - 0.000 - 0.000 - 0.000 - 0.000Subtotal Security - 0.000 - 0.000 - 0.000 - 0.000 - 0.000
ServiceNone - 0.000 - 0.000 - 0.000 - 0.000 - 0.000Subtotal Service - 0.000 - 0.000 - 0.000 - 0.000 - 0.000
Service SupportNone - 0.000 - 0.000 - 0.000 - 0.000 - 0.000Subtotal Service Support - 0.000 - 0.000 - 0.000 - 0.000 - 0.000
OtherNone - 0.000 - 0.000 - 0.000 - 0.000 - 0.000Subtotal Other - 0.000 - 0.000 - 0.000 - 0.000 - 0.000
Agency Submission - $0.000 - $0.211 - $0.211 - $0.211 - $0.211
MTA Staten Island RailwayJuly Financial Plan 2015-2018
2014 Budget Reduction Proposals - Accrual Basis($ in millions)
Favorable/(Unfavorable)
V-317

Category by Function: Administration
Program: Vacancy Maintenance/Management
Background Details:
Program Description/Implementation Plan:
Program Implementation Date: When will savings begin?: January 2015
Are these savings recurring?: Yes
Other Issues:
2014 2015 2016 2017 2018Financial Impact (Operating):
Net Cash Savings (in millions) $0.000 $0.211 $0.211 $0.211 $0.211
Total Positions Required:
Favorable/(Unfavorable)
MTA Staten Island RailwayJuly Financial Plan 2015-2018
2014 Budget Reduction Plan Worksheet
After review, it has been determined that the current SIR staffing level will need to be maintainedin order to meet operations, maintenance and administrative requirements. In order to achievethe MTA savings target of $2llK annually beginning 2015, SIR will manage a process of delayinghiring to fill vacancies, based on assessment of vacant position functions and risks.
See background details above.
V-318

MTA STATEN ISLAND RAILWAY
2015 Preliminary Budget July Financial Plan 2015-2018
Positions
2014-2017: July Financial Plan vs. February Financial Plan There were no position changes reflected in this financial Plan. Year over Year change 2016 over 2015 Total positions decrease by 34. The decrease is due to the planned c ompletion of Sandy reimbursable capital construction requirements.
V-319

2014 2015 2016 2017
2014 February Plan ‐ Total Baseline Positions 305 305 271 271
Total Plan-to-Plan Changes 0 0 0 0
2014 July Plan ‐ Total Baseline Positions 305 305 271 271
Total Year-to-Year Changes, July Plan 0 34 0
Total Plan‐to‐Plan Changes by Reporting Category:
Non‐Reimbursable 0 0 0 0Reimbursable 0 0 0 0
Total 0 0 0 0Full‐Time 0 0 0 0Full‐Time Equivalents 0 0 0 0
Total 0 0 0 0By Function Category ‐ Administration 0 0 0 0 ‐ Operations 0 0 0 0 ‐ Maintenance 0 0 0 0 ‐ Engineering/Capital 0 0 0 0 ‐ Public Safety 0 0 0 0
Total 0 0 0 0By Occupational Group ‐ Managers/Supervisors 0 0 0 0 ‐ Professional, Technical, Clerical 0 0 0 0 ‐ Operational Hourlies 0 0 0 0
Total 0 0 0 0
Total Plan‐to‐Plan Changes by Major Category:2014 BRPs 0 0 0 0New Needs 0 0 0 0Change in Reimbursable Positions 0 0 0 0
Re‐estimates & All Other 1 0 0 0 0Total 0 0 0 0
1Includes Full Time Equivalents
MTA Staten Island Railroad
July Financial Plan 2015‐2018Favorable/(Unfavorable)
Total Position Changes at a Glance
V-320

2013Actual
2014Mid-Year Forecast
2015 Preliminary
Budget 2016 2017 2018
AdministrationExecutive 16 13 13 13 13 13 General Office 5 6 6 6 6 6 Purchasing/Stores 6 6 6 6 6 6
Total Administration 27 25 25 25 25 25
OperationsTransportation 92 91 91 91 91 91
MaintenanceMechanical 40 43 43 43 43 43 Electronic/Electrical 12 15 15 15 15 15 Power/Signals 25 26 26 26 26 26 Maintenance of Way 44 46 46 46 46 46 Infrastructure 27 25 25 25 25 25
Total Maintenance 148 155 155 155 155 155
Engineering/CapitalNone - 34 34 - - -
Public SafetyPolice - - - - - -
Baseline Total Positions 267 305 305 271 271 271
Non-Reimbursable 259 268 268 268 268 268 Reimbursable 8 37 37 3 3 3
Total Full-Time 267 305 305 271 271 271 Total Full-Time Equivalents - - - - - -
MTA STATEN ISLAND RAILWAYJuly Financial Plan 2015-2018
Total Positions by Function and DepartmentNon-Reimbursable/Reimbursable and Full-Time/Full Time Equivalents
FUNCTION/DEPARTMENT
V-321

FUNCTION/OCCUPATIONAL GROUP2013
Actual
2014Mid-Year Forecast
2015 Preliminary
Budget 2016 2017 2018
Administration Managers/Supervisors 13 14 14 14 14 14 Professional, Technical, Clerical 14 11 11 11 11 11 Operational Hourlies - - - - -
Total Administration 27 25 25 25 25 25
Operations Managers/Supervisors 2 5 5 5 5 5 Professional, Technical, Clerical 2 3 3 3 3 3 Operational Hourlies 88 83 83 83 83 83
Total Operations 92 91 91 91 91 91
Maintenance Managers/Supervisors 12 8 8 8 8 8 Professional, Technical, Clerical 2 3 3 3 3 3 Operational Hourlies 134 144 144 144 144 144
Total Maintenance 148 155 155 155 155 155
Engineering/Capital Managers/Supervisors - 4 4 - - - Professional, Technical, Clerical - 2 2 - - - Operational Hourlies - 28 28 - - -
Total Engineering/Capital - 34 34 - - -
Public Safety Managers/Supervisors - - - - - - Professional, Technical, Clerical - - - - - - Operational Hourlies - - - - - -
Total Public Safety - - - - - -
Total Positions Managers/Supervisors 27 31 31 27 27 27 Professional, Technical, Clerical 18 19 19 17 17 17 Operational Hourlies 222 255 255 227 227 227
Baseline Total Positions 267 305 305 271 271 271
MTA STATEN ISLAND RAILWAYJuly Financial Plan 2015-2018
Total Positions by Function and Occupation
V-322