mt - HECSU › assets › assets › documents › GMT... · GMT winter2 2014_15_Layout 1...
24
g mt winter 2014/15 Inside this issue: Policy, skills and education in 2015 Careers policy reviews UniverCities – driving growth Graduate migration Australian gender wage gap Defining institutional prestige HEA employability update Information, debate and research into higher education, graduate employment and careers
Transcript of mt - HECSU › assets › assets › documents › GMT... · GMT winter2 2014_15_Layout 1...

gmtwinter 2014/15
Inside this issue:
Policy, skills and education in 2015
Careers policy reviews
UniverCities – driving growth
Graduate migration
Australian gender wage gap
Defining institutional prestige
HEA employability update
Information, debate and research into higher education, graduate employment and careers
GMT winter2 2014_15_Layout 1 28/01/2015 10:20 Page 1

With only two editions of GMT before thegeneral election in May, we have taken theopportunity to put together articles which addsomething to the debate. Shedding light onthe skills agenda, careers policy, universitysupport for local economies, graduate
mobility, international gender wage gaps and definingprestige in the UK higher education sector, this editionis one to be mulled over.
Summing up the education and skills debate in 2014and looking ahead to education, funding and partypolitics in 2015, GMT’s Aphrodite Papadatouinterviews Steve Besley, Head of UK Education Policyat Pearson Education Ltd.
Dr Deirdre Hughes gives us an overview of currentcareers policies across the UK and discusses theopportunities and challenges faced by those working inthe careers profession within and beyond HE.
Brhmie Balaram contributes a summary of the RSA’sCity Growth Commission report, co-authored byJonathan Schifferes, which assessed and maderecommendations to further the contribution ofuniversities to local economies across the UK.
Prospects Charlie Ball uses graduate destinations datato map out the movement of graduates across theregions in terms of their locations of domicile, studyand employment.
An article featured in GMT Futuretrack Special 2013investigated the gendered earning power of graduatesacross the UK and found a gender pay gap amongrecent graduates. There is documented evidence of agender pay gap in Australia and Graduate CareersAustralia’s Edwina Lindsay investigates how subjectchoice on entry to HE explains part of the gap butwhat is the cause for the rest?
Finally, an extra article for the digital version of GMT,Andrew McCulloch uses data from university leaguetables to investigate the prestige of UK highereducation institutions and looks at what part themoney factor plays.
I hope you enjoy this edition of GMT.
Kindest regards,
Jennifer Redman
GMT Summer2013
2in
this
issu
e 2 Note from the editor
3 News in brief
GMT interview4 Policy, skills and education in 2015
with Steve Besley
GMT policy7 Careers policy reviews: where next?
Dr Deirdre Hughes
GMT research11 UniverCities: the role of HEIs in
driving city growthBrhmie Balaram and Jonathan Schifferes
GMT research14 Loyals, stayers, returners and
incomers: graduate migration patternsCharlie Ball
GMT international research16 Are Australian graduates at the
mercy of the gender wage gap?Edwina Lindsay
GMT research
20 Institutional prestige and the money factorAndrew McCulloch
23 HEA: Employability update
Note from the editor
To subscribe to the GMT e-newsletter go to: www.hecsu.ac.uk/GMT_sign_up
GMT winter2 2014_15_Layout 1 28/01/2015 10:20 Page 2

GMT winter2014/15
3
New careers and enterprise companyThe Department for Education released a statementfrom the Education Secretary Nicky Morganannouncing the creation of a new company whichaims to bring employers and schools together toinspire the careers of young people. The new companywill be employer-led and independent of thegovernment and will focus on young people aged 12 to18. (December) www.gov.uk/government/news/new-careers-and-enterprise-company-for-schools
Patterns and trends in UK higher educationThis annual report released by Universities UKcontinues the review of the performance of the highereduction (HE) sector up to 2012/13 when the currentfee regime was introduced. Information provided bythe Higher Education Statistics Agency (HESA) onstudents, staff and finances in HE toward the end of2012/13 reveals patterns and trends prior to thesignificant change. (December) www.universitiesuk.ac.uk/highereducation/Pages/PatternsAndTrendsInUKHigherEducation2014.aspx#.VLaapctybIU
UCAS applications review 2014End of Year Application Cycle 2014 analyses therecruitment of students to full-time undergraduatecourses in the UK in 2014. UCAS placed more than500,000 applicants to HE. Just less than 700,000students applied for a place with an acceptance rate of73.2%. (December) www.ucas.com/sites/default/files/2014-ucas-end-of-cycle-report.pdf
Engineering UK report 2015A recently published report, The State of Engineering,warns that education at all levels doesn’t have the rateof growth or capacity to meet the predicted demandfor skilled engineers by 2022. Recommendationsencourage engineering employers to work closer witheducation providers in making engineering jobs moreattractive and offering good career progression.(January) www.engineeringuk.com/Research/Engineering_UK_Report_2015/
Careers of the futureUsing research, the UK Commission for Employmentand Skills put together a guide to showcase some jobopportunities in the coming years. Included is
information about entry requirements, pay,progression and personal development. Careers rangefrom farmers to secondary school teachers. (December)www.gov.uk/government/publications/careers-of-the-future
Apprenticeships: an employer surveyThe Department for Business, Innovation & Skills(BIS) published findings from a survey which askedover 4,000 employers of apprentices for their viewsand experiences of apprenticeships. The reporthighlights the satisfaction of most employers who haveseen a positive impact on their businesses as a result ofhaving had an apprentice. There is also a survey ofapprentices in conjunction with this report.(December) www.gov.uk/government/publications/apprentice-evaluation-employer-survey-2014
Confidence in the graduate labour marketAGCAS published findings from their survey of Headsof HE Careers Services asking for opinions as to theirconfidence in the graduate labour market. Confidenceis high as the majority of respondents agreed thatgraduate vacancies increased in 2014. (January)www.agcas.org.uk/articles/844-Graduate-labour-market-buoyant-report-heads-of-university-careers-services-
Student enrolments and qualifications obtained HESA published the Statistical First Release detailingstudent enrolments and qualifications obtained data for2013/14. Find out how many students enrolled onundergraduate and postgraduate courses and moreabout the trends in enrolments. There is concernsurrounding another drop in enrolments on part-timeundergraduate study. (January) www.hesa.ac.uk/pr/3349-statistical-first-release-210
The value of transnational educationThe report published by BIS details the activities ofhigher education institutions (HEIs) in the UKproviding transnational education, which is where theinstitution provides education to a student based in acountry other than where the institution is located.Modes of study, numbers of students and the value ofthese activities to UK HEIs are discussed in the report.(November) www.gov.uk/government/publications/transnational-education-value-to-the-uk
News in brief
To subscribe to the GMT e-newsletter go to: www.hecsu.ac.uk/GMT_sign_up
GMT winter2 2014_15_Layout 1 28/01/2015 10:20 Page 3

GMT winter2014/15
4
It is December 2014. GMT’s Aphrodite Papadatoucatches up with Steve Besley1. Head of UKEducation Policy at Pearson, Steve is a well-known figure in the education and skills sector,and a fountain of knowledge in all things skillspolicy. In this exclusive interview, Steve considersthe state of education and skills in the build up tothe general election. He discusses furthereducation (FE), higher education (HE),information, advice and guidance (IAG), funding,employer engagement, party politics and muchmore. There is no better person to round up 2014with his unique blend of knowledge, foresight,and humour which have for years made hisreviews so accessible. 2015 has arrived!
It has been a while since GMT last caught up withyou in Summer 20112 but what an exciting time tomeet again! Tell us what you have been up to in2014? What things keep you ticking and excite youand what do you most enjoy about your work ineducation policy?As ever it's been another hugely busy year in educationwith a lot happening around curriculum andqualification reform, developments around the skillsagenda and continuing debate about the future fundingand nature of HE so there's no shortage of things goingon. All of these things, and many more, matterenormously to individuals so the challenge remains notonly keeping up to speed with developments but alsoabout what sort of reactions they are generating. In factI'd say the biggest change having 'worked' in educationpolicy for so long has been the advent of social media.It's opened up a whole new world of comment, opinion,thought and yes sometimes comments you'd never havethought of or even wanted to but it's all an importantreflection of views and you need to keep up withit...there's always a gem in there somewhere.
Skills and education in an international context:Pearson stands in the forefront of this. But what isits importance in terms of the UK’s economicgrowth and the wellbeing of learners? The interesting thing is that skills policy has risen up the political agenda to become one of the biggest challenges
we face. Last month, for instance, we had nine majorreports, four keynote speeches, three set piececonferences and any amount of column space all on theissue of skills in some form: skills for the present, skillsfor the future, global skill challenges, skill levelsgenerally, skills funding and so on. The reason for thisburst of interest is of course that skills, or more preciselythe talent pipeline, is critical to economic recovery andwith employers continuing to express concerns aboutthe talent pool in their sector, government has taken adeep interest, so much so that there is talk of avocational 'arms race' breaking out. It's raised all sorts ofquestions about the nature of training, the role ofemployers and the changing nature of the jobs marketbut for us in the UK, two issues remain. One isstrengthening the school to work transfer for youngpeople and the other is securing the route throughhigher education.
2015 is a big year for British politics with thegeneral election in May. Based on the manifestoesand discussions held in last autumn’s partyconferences, how high up on the agenda of partypolitics are education and skills? I rememberclearly in 2010, all themes HE related wereparticularly ‘hot’ but where are we now, what dodifferent parties have to offer?With the general election just five months away and noone political party a clear favourite, this is an 'interesting'time for policy in general let alone education. Educationdoesn't feature very high as an electoral issue at present;in the latest reports on voter interest, it comes in aroundthe third or fourth issue behind the economy, NHS andimmigration. Nor has there been any sense ofsignificant gear change in education policy as there wasahead of both the 1997 and 2010 elections. The ‘hotissues’ remain pretty much the same including schoolstandards, 14-19 education, college responsiveness andHE tuition fee funding. There's broad agreement onmany of the issues across all the major parties but somemarked differences about approach within that. This canbe seen for example over issues such as schoolacademies, college specialisms and higher educationfunding. We reach the end of the year with both major parties pretty much neck and neck in all three major poll
Policy, skills and education in 2015with Steve Besley
GMT interview
To subscribe to the GMT e-newsletter go to: www.hecsu.ac.uk/GMT_sign_up
1 Steve Besley is Head of UK Education Policy at Pearson Education Ltd. 2 Download the pdf of the GMT interview with Steve Besley at: www.hecsu.ac.uk/assets/assets/documents/Steve_Besley_Summer_2011.pdf
GMT winter2 2014_15_Layout 1 28/01/2015 10:20 Page 4

GMT winter2014/15
5
ratings but with enthusiasm for the traditional two-partysystem seemingly waning. It's going to be an interestingfew months.
In what ways have recent budget cuts impactededucation, in your opinion?The most obvious answer is higher education where ofcourse the issue of tuition fees and what impact thesewould have on student numbers and therebyinstitutions has remained a constant theme throughoutthe last four years. However, the latest health check onthe system by HEFCE and the recent report on 2014admissions by UCAS3 suggest that the sector is bearingup well... although the issue won't go away. Schoolfunding, at least for ages 5-16, is ring fenced and manyschools too have been buttressed by the pupil premiumso the real 'victim' in all this and the one that often getslittle attention is FE and in particular budgets for 18 yearolds and for adult skills. Lots of figures have beenthrown around about the level of cuts and withoutgetting into specifics, this remains a real concern for thefuture particularly in the light of the Chancellor's latestAutumn Statement which indicated a further three tofour years of further cuts for departments such as theDepartment for Business, Innovation & Skills (BIS)4.
Arguably, IAG provision for young people hasbeen in crisis since the demise of Connexions.More recently, Education Secretary Nicky Morganannounced £20 million of funding for a new‘careers and enterprise company’5, which aims tobroker employers in the mix and supplement thework of the National Careers Service. Howsincere is this move? A political manoeuvre orsomething more meaningful? In other words, dowe see a change in direction and priorities – morefunding for IAG?I think the answer is that we don't know yet. The newcompany, which of course is more of an advisory orbrokerage company than a supplier of services, doesn'tget going until next spring and on the basis that this isjust before the election, it could be seen as a politicalmanoeuvre but hopefully not. The important thing isthat after months of suggesting that all was well and thatschools and colleges were doing what they had to, evenin the face of conflicting reports, the issue about careersguidance has at last been recognised. At present it's hardto see any more money being conjured up to supportIAG but the issue for the future may be more abouthow to modernise a system that on the one hand needsto be able to offer a personal service, while at the sametime offer a hi-tech model of fast moving employmentand training opportunities. I'm not sure we're quite
there yet in terms of how we do all this.
Vocational skills, work-based learning andapprenticeships – all three are pretty high onevery party’s agenda. Is FE the future ofemployability, and is the FE sector equippedenough to deliver?Last month, the Association of Colleges published aresponse to a UKCES report commenting on howclosely and with how many employers, colleges typicallyworked with6. Both they and training providers workclosely with employers in lots of different ways but thepolitical perception remains that they are still notaligned sufficiently with local labour market needs. This is why the Labour Party is talking about creatingemployer accredited Institutes of Technical Educationand the Conservatives are pushing the case for NationalColleges. The specialised college or training providermodel is not new, remember Centres of VocationalExcellence, and is likely to run as a theme well into 2015but the new challenge is localism: the devolvement ofkey public services, such as skills training, to local bodiesand partnerships. The blueprint for this is the recentGreater Manchester Agreement. It potentially shifts theskills system around a locally determined model ofprovision which in fairness the FE sector has been prettygood at responding to.
How can employers’ best work in partnership withcolleges and universities in deliveringemployability?Many employers sit on college and university boardsand committees in various capacities but there is a sensethat a stronger relationship needs to be created atregional or sub-regional level and that this will be anarea of development after the 2015 election. This alreadyhappens in some areas with local Chambers ofCommerce, Local Enterprise Partnerships and otherforms of local partnership but can be patchy and if thegovernment, either now or in the future, wants to shiftto a more regionally devolved model, then a nationallyrecognised structure of local business-education boardsmay need to be put in place.
Spearheaded by BIS, there has recently been aflurry of reports and ensuing debate about thevalue of different levels of qualifications in termsof earnings potential. In your opinion are therereliable sources of information about the value ofqualifications – both vocational and non –available to students and careers practitioners?There's considerable interest at present in movingbeyond performance table listing of qualifications to
To subscribe to the GMT e-newsletter go to: www.hecsu.ac.uk/GMT_sign_up
3 UCAS Undergraduate 2014 End of Cycle report is available to download at: www.ucas.com/sites/default/files/2014-ucas-end-of-cycle-report.pdf4 HM Treasury (2014) Autumn Statement 2014 available to download at: www.gov.uk/government/uploads/system/uploads/attachment_data/file/382327/44695_Accessible.pdf5 Read the press release about the Careers and Enterprise Company at: www.gov.uk/government/news/new-careers-and-enterprise-company-for-schools6 Association of Colleges (2014) response to UKCES Growth through People report. Available at: www.aoc.co.uk/news/aoc-responds-ukces-growth-through-people-report
GMT winter2 2014_15_Layout 1 28/01/2015 10:20 Page 5

GMT winter2014/15
6
actually trying to assess both the potential and the actualvalue of qualifications to the individual in terms of jobopportunities and wage returns. BIS has been consultingon ways of doing this throughout much of the year andis gradually building up an impressive database ofmarket intelligence intended to support this in thefuture. It's not an easy area but, rather like food labellingwhich allows the consumer to make an informedjudgement, so employment and wage return data hasthe potential to do the same for learners.
School leaver schemes: Employers are moreinterested in hiring school leavers. Nonetheless,alternatives to HE are still taboo themes in schoolcareers advice, as recent research shows(AGCAS/GTI – on parental influence in students’career choice decision making)7. What is youropinion on the future of these alternatives?School leavers are always going to take advice on careersfrom a range of sources and parents and familymembers will be one of those. What is interesting is
how attitudes are shifting whether because of socialnetworking or because of headlines about the economy,but young people are increasingly recognising labourmarket signals much more than perhaps we give themcredit for. We saw this in the summer for instance whenit became clear in the reporting of exam results thatyoung people were increasingly choosing subjects thatcould help secure them jobs in the future. So for me,this is very much an attitudinal thing, which may takesome time but is starting to happen. Nobody talkedmuch about apprenticeships that long ago but noweverybody is talking about the opportunities they canbring: that's the sort of attitudinal change that's takingplace now.
Finally Steve, what are you looking forward to in2015 in the world of skills and education? The Education Secretary recently said that, “education is apartnership; it isn't a battle or a war”. In an election year, itseemed a pretty good wish for the future.
7 AGCAS/GTI (2014) Parental influence on children’s academic and employment choices. Available at: www.agcas.org.uk/agcas_resources/750-Parental-influence-on-children-s-academic-and-employment-choices-
To subscribe to the GMT e-newsletter go to: www.hecsu.ac.uk/GMT_sign_up
Keep abreast of the latest developments in education through Policy Watch at:http://uk.pearson.com/home/policy-watch.html
GMT winter2 2014_15_Layout 1 28/01/2015 10:20 Page 6

GMT winter2014/15
7
To subscribe to the GMT e-newsletter go to: www.hecsu.ac.uk/GMT_sign_up
Careers policy reviews:where next?
GMT policy
Across the UK, there are clear signs of careerspolicies shifting as a result of formal reviews andrecommendations to governments. The role andresponsibilities of the state, employers, privateand voluntary sector organisations is highlytopical. In this article, Dr Deirdre Hughes1
considers patterns, trends and recent policydevelopments in the UK careers landscape. Itdiscusses the formation of a new careers andenterprise company in England and sets outsome opportunities and challenges that lie aheadfor those working in the careers profession bothwithin and outside of higher education.
Patterns and trendsBy 2020, nearly half of the UK workforce will bequalified to degree level and above, overtaking theUSA2. Universities UK published its latest ‘Patterns andTrends’ report outlining a range of data on the changingsize and shape of UK higher education (UUK, 2014)3.The decline of 6.3% in total student enrolments (2012-2013) illustrates the ongoing need for the highereducation sector to demonstrate its value toprospective students. The decline in numbers studyingpart-time has continued, as has the recent reversal ofthe growth in postgraduate taught study that occurredover the past decade, with a 7% drop in postgraduatetaught numbers between 2011-12 and 2012-13 (UUKop. cit.). Variations in the gender balance in differentsubjects also persist and need to be given carefulconsideration if the sector is to continue to produce abalanced graduate population. In the current economicclimate, weighing up the cost benefits of highereducation can be difficult for some young people (andadults) even though ‘in difficult conditions graduatescontinue to experience better outcomes than non-graduates in both lifetime earnings and employability’(UUK op. cit.). There is a clear problem to beaddressed by governments and their key partners in
making sure more young people are exposed tomeaningful career learning from an early age but thechallenge is how best to achieve this. Someimprovements in destination data and labour marketintelligence into school and college systems arebeginning to emerge.
In a new report, ‘Careers of the Future’, the UKCommission for Employment and Skills’ identifiescareers that labour market analysts believe offer someof the best opportunities for tomorrow’s job seekers(UKCES, 2014)4. This No 10 Downing Streetinitiative, responded to the Prime Minister’s concernthat insufficient careers information is available toyoung people on the realities of the labour market.There are widespread concerns across each of the fourhome nations that careers provision needs to beimproved. There is also recognition that careers workis a public as well as a private good. As a result,differing career policies in the four home nations areemerging. Some insights are presented below,including brief commentary on the potentialimplications for those working in the careers sector.
The English experimentIn England, the marketisation of career guidancepolicies and practices has expanded, with a growingassumption from government that market-based goods and services ensure greater responsiveness toconsumer choice and offer better and/or moreinnovative services for lower prices. However, verylittle research has been conducted into the effects ofmarket principles applied in career guidance focusingon the quantity and quality of the services (Meijers,2001)5 and the cost benefits to governments andindividuals (ELGPN, 2012)6. In recent years, thecareers marketplace has become crowded, confusedand complex, with a multiplicity of disjointed careersprovision (Hughes, 2014)7. Whilst some schools have
1 Dr Deirdre Hughes OBE is Associate Fellow at the Warwick Institute for Employment Research (IER) and former Chair of the National Careers Council in England(May 2012 – September 2014)2 The Telegraph (2014) available at: www.telegraph.co.uk/education/universityeducation/11037257/Britain-to-become-one-of-most-highly-qualified-countries-in-world.html3 Universities UK (2014) Patterns and trends in UK higher education. Available at: www.universitiesuk.ac.uk/highereducation/Documents/2014/PatternsAndTrendsInUKHigherEduca-tion2014.pdf4 UKCES (2014) Careers of the future. Available at: www.gov.uk/government/publications/careers-of-the-future5 Meijers, F. (2001). The effects of the marketisation of career guidance services in The Netherlands. International Journal for the Advancement of Counselling, 23 (2), 131-149.6 ELGPN (2012) Lifelong Guidance Policy Development: A European Resource Kit, Finland: University of Jyväskylä, 52. Available at: www.elgpn.eu/publications/elgpn-tools-no1-re-source-kit7 Hughes, D. (2014) Taking Action: Achieving a culture change in careers provision, London: National Careers Council, September 2014.
GMT winter2 2014_15_Layout 1 28/01/2015 10:20 Page 7

GMT winter2014/15
8
responded positively to their new statutory duties forimpartial and independent careers provision, manyhave not fully embraced this new requirement. Ofsted,in its sample survey, found that only a fifth of the 60schools it surveyed were giving the right careersinformation to pupils (Ofsted, 2013)8. There areserious concerns about skills mismatch, student drop-out rates and participation rates in both vocational andacademic pathways.
The National Careers Council (2012–2014) presented two formal reports to government9 settingout recommendations for the National Careers Serviceand wider careers support services. In September 2014,the Council reiterated its recommendation made inJune 2013 to implement an Employer-led AdvisoryBoard, comprising senior representatives fromemployers, education and career development sectorsto guide the work of an all-age National CareersService. It would provide decisive and robust strategicinfluence to drive forward high quality all-age careersprovision across all parts of England. The strategic roleof employers, careers professionals and educationalistsworking together to improve the ‘careers offer’ toyoung people was made explicit. The National CareersCouncil also set out funding options for greaterinvestment by government in careers provision,particularly for young people. The Chancellors’Autumn Statement (October, 2014) announcement ofa £20 million investment for careers advice andsupport for young people (para. 2.227)10 was warmlywelcomed.
In early December 2014, the Education Secretaryannounced plans for a new independent careers andenterprise company in England. This moved beyondthe recommendations proposed by the NationalCareers Council. The company will ‘ensure employersare supporting young people with decision-makingand career development at every stage of school life’11.The new careers and enterprise company’s work willbe aimed at schools, to transform the provision ofcareers education and advice for young people andinspire them about the opportunities offered by theworld of work. This will focus on young people aged12 to 18 and will ‘help to broker relationships betweenemployers on one hand and schools and colleges on
the other’ (Department for Education op. cit.).Christine Hodgson, Chair of Capgemini UK, hasagreed to chair the new company which will beemployer-led and independent of government, withgovernance and advisory board arrangements due to beestablished by March 201512. Advisory membershiprecently outlined to the Education Select Committeeincluded: the Association of Schools and Colleges(ASCL), the National Association of Headteachers(NAHT), the UK Career Development Institute(CDI), Business in the Community (BiTC), theEducation and Employers Taskforce (EETF), the CBI,the British Chambers of Commerce, and theFederation of Small Businesses. There was also somemention of involving Local Authorities, LEPs andpublic sector employers. The National Careers Servicewill form part of the advisory arrangements and willhave a ‘formal Memorandum of Understanding’ withthe new company. It currently has a 5% allocatedbudget from the Skills Funding Agency for ‘brokerageservices’ to schools and colleges.
The extent to which employers within the new careersand enterprise company may lead the way in settingout new careers policies and practices has yet to bedetermined. A recent report by Warwick UniversityIER, on behalf of the Department for BusinessInnovation & Skills (BIS), sets out findings from astudy focused on understanding the link betweenemployers and schools and the National CareersService (BIS, 2014)13. Whilst many employers aredoing great work with schools, colleges anduniversities more need to step up and offer youngpeople more work experiences and opportunities. Thisis a major challenge given findings from a survey ofjust over 300 employers which highlights over 50% didnot engage, had no plans to engage in working linkswith schools because they saw no real benefits to theirbusiness and there are too many restrictions to navigate(BIS op. cit.). This may help explain the governmentand Skills Funding Agency’s focus on the need tostrengthen ‘brokerage arrangements’ between schoolsand employers.
UKCES has welcomed calls for further strengtheningcollaborative work between higher educationinstitutions (HEIs) and employers14. Within this
To subscribe to the GMT e-newsletter go to: www.hecsu.ac.uk/GMT_sign_up
8 Ofsted (2013) www.gov.uk/government/news/careers-guidance-in-schools-not-working-well-enough 9 All reports from the National Careers Council are available at: www.gov.uk/government/collections/national-careers-council10 HM Treasury (2014) Autumn Statement 2014 available to download at: www.gov.uk/government/uploads/system/uploads/attachment_data/file/382327/44695_Accessible.pdf11 Department for Education (2014) www.gov.uk/government/news/new-careers-and-enterprise-company-for-schools12 Secretary of State for Education evidence to the House of Commons Select Committee available to download at: http://data.parliament.uk/writtenevidence/committeeev-dence.svc/evidencedocument/education-committee/careers-guidance-followup/oral/17257.pdf13 Bimrose, J., Brown, A., Behle, H., Barnes, S.A., Hughes, D., Andrews, D., Davies, E., and Wiseman, J. (2014). Understanding the link between employers and schools andthe National Careers Service. London: Department for Business, Innovation & Skills (BIS) Research Report Series, December 2014. Available at:www.gov.uk/government/uploads/system/uploads/attachment_data/file/386030/bis-14-1271-understanding-the-link-between-employers-and-schools-and-the-role-of-the-national-careers-service.pdf14 UKCES (2014) www.gov.uk/government/news/ukces-welcomes-report-on-university-business-collaboration-calling-for-action-from-both-sides-for-mutual-benefit
GMT winter2 2014_15_Layout 1 28/01/2015 10:20 Page 8
dynamic context, knowledge exchange is embeddedincreasingly as an established mission of every publiclyfunded HEI. Therefore, in my view HEIs and theircareers training and advisory services will have astrategic decision to make on whether or not to engagewith the new careers and enterprise company. Highereducation careers professionals with first-handexperience of working closely with students, nationaland local employers and sharing labour marketintelligence could potentially greatly benefit this neworganisation. A critical issue is whether they have theappetite and capacity for joint development work orprefer to have divided and separate responsibilities?
The process of ensuring high quality careers provision,at the right time and to the right people, through anewly established company will be a long term andpotentially complicated process, particularly coming upto a general election. There will be a need to establishclear protocols, mechanisms for agreeing the level ofinvestment funding for careers and enterprise activitiesand a process of distribution. The good news is that anew ‘wrap around’ framework, co-designed byemployers, educationalists and careers professionalsworking together with other key partners at a local andnational level, could significantly improve existingprovision. But in this crowded landscape the newcompany must be clear on the actual problem it istrying to solve. This may be to set up brokeragearrangements between schools and employers(something the National Careers Service has in itsdelivery remit from 1st October 2014 onwards withsmall-scale funding), to target ‘cold spots’ wherecareers provision is weak, to quality-assure scalable andsustainable careers and enterprise initiatives, to realign,re-evaluate or reinvent policies and practices that havebeen proven to work well in other parts of England.
On a positive note, there is a real chance for jointworkforce development in the careers and teachingsectors to be prioritised. The extent to which LordYoung’s enterprise agenda15 becomes the dominanttheme is something to be reconciled by the newcompany. Concrete agreements will need to be reachedand concrete careers information, advice and guidancefor students needs to be achieved. Government and theopposition must take immediate steps to not onlysupport a new independent company, but to improvequality standards and the impact of careers work in
order to make up for lost ground. This is truly a newera for careers work in England and this ‘experiment’needs to be closely monitored.
Celtic nationsThe Celtic nations have adopted a hybrid mix of‘softened’ neo-liberalism and social justice policystances. For example, in Scotland, the governmentrecently unveiled a plan aimed at cutting youthunemployment by 40% by 202116. The new youthemployment strategy will focus on forging closer linksbetween schools, colleges and employers. It comes inresponse to a report by Sir Ian Wood’s Commission forDeveloping Scotland’s Young Workforce17. TheCommission concluded that Scotland was notpreparing or equipping its young people for work. TheWood report, published in June 2014, made a total of39 recommendations. The Scottish government saidthe recommendations had informed the strategy’s aimsto enable young people of all backgrounds to succeedin a stronger, fairer and more equitable society. Keymeasures to be put into place over the next seven yearsinclude earlier careers guidance available from2015/16; a new standard for work experience by2015/16; and all secondary schools to have activepartnerships with employers by 2018/19. The role ofSkills Development Scotland in supporting the‘Curriculum for excellence teaching and learningframework’ (Scottish Government, 2008)18 and the‘My World of Work’ website19 underpins careersapproaches in both primary and secondary education.A pioneering approach in the integration of theoreticaland practice-based models of ‘career guidance andcoaching’ is well underway.
In Northern Ireland, the Minister for Employmentand Learning and the Minister of Education invitedBrian Ambrose, Chief Executive of Belfast CityAirport to chair a panel of experts from education,career guidance and business to conduct a formalreview of the careers system in Northern Ireland(Careers Review, 2014). With the comprehensiveinquiry carried out by the Assembly Employment andLearning Committee and other key publications as itsstarting point, the panel of experts undertook toexamine the careers system with the intention ofmaking recommendations on the way forward for thefuture delivery of careers education and guidance20.
To subscribe to the GMT e-newsletter go to: www.hecsu.ac.uk/GMT_sign_up
15 Lord Young (2014) Enterprise for all: The relevance of enterprise in education. Available to download at: www.gov.uk/government/uploads/system/uploads/attachment_data/file/338749/EnterpriseforAll-lowres-200614.pdf16 Careers, policy, research and practice. The blog of Dr Deirdre Hughes (2014) Scotland’s new plan to cut youth unemployment by 40%. Available at:http://deirdrehughes.org/2014/12/scotlands-new-plan-to-cut-youth-unemployment-by-40/17 Commission for Developing Scotland’s Young Workforce (2014) Available at: www.scotland.gov.uk/Topics/Education/edandtrainingforyoungple/commissiondevelopingscotlandsyoungworkforce18 Scottish Government (2008) Curriculum for excellence: Building the curriculum 3 – a framework for teaching and learning. Edinburgh: The Scottish Government; 2008. 19 My World of Work website can be found at: www.myworldofwork.co.uk/20 Careers Review 2014 (2014) A report by an independent panel of experts from education and employers on careers education and guidance in Northern Ireland.Available at: www.delni.gov.uk/careers-review-2014-final.pdf
GMT winter2014/15
9
GMT winter2 2014_15_Layout 1 28/01/2015 10:20 Page 9

GMT winter2014/15
10
In October 2014, a number of key themes emerged,for example, exposure to the world of work and strongpartnerships with employers; easily accessible, accurateinformation; access to impartial career guidance; andsupport from modern information systems. To ensureconsistency of delivery across all of these areas theexpert panel recognised the need for a clear qualityassurance framework for the entire careers system.
In Wales, the government's priority for the nationalcareers service is young people (in defined prioritygroups in schools and colleges and unemployed youngpeople up to the age of 25 who are most in need ofcareers information, advice, guidance and support).Careers service support for employer engagement witheducation, coupled with capacity-building support toschools to help institutions develop the ‘Careers andthe World of Work’ framework (including the CareersWales Quality Mark) remain a priority. However, therehave been significant cuts in budget and staffingresource. The Deputy First Minister is currently chair
of a Wales Careers Strategic Forum designed to fostercross-sector collaboration and co-ordination in respectof both policy and service delivery.
ConclusionIn all four home nations, employers’ activeparticipation in helping to transform careers provisionis apparent. The careers marketplace is becoming morecrowded with multiple players, including nationalcareers services, employers, careers and humanresource professionals, recruitment specialists andwork coaches, each seeking to transform the careerslandscape in some shape or form. Closer collaborationbetween employers, schools, colleges and universitiesis essential to ensure that there are clear pathwaysbetween institutions and workplaces. Those workingin the careers sector (and those who support it) muststrengthen their resolve to jointly make a strong casefor continued investment in careers professionals’work.
To subscribe to the GMT e-newsletter go to: www.hecsu.ac.uk/GMT_sign_up
For further information visit: http://deirdrehughes.org or email: [email protected]
GMT winter2 2014_15_Layout 1 28/01/2015 10:20 Page 10

GMT winter2014/15
11
To subscribe to the GMT e-newsletter go to: www.hecsu.ac.uk/GMT_sign_up
‘UniverCities’: the role ofHEIs in driving citygrowth
GMT research
Universities play an important role in the localeconomies within which they exist. As thegovernment devolve more powers to metrogovernments, the RSA City GrowthCommission’s report, UniverCities: The Knowledgeto Power UK Metros, considers how universitiescan contribute further to their local economies.Brhmie Balaram1 summarises the findings of thereport, co-authored by Jonathan Schifferes2, andshares some of the recommendations.
What does the rise of cities mean for the UKeconomy? The RSA City Growth Commissionembarked on a 12-month inquiry over the course of2014 to find out. Specifically, the Commissionexplored how businesses and government can enablestronger growth in the UK’s 15 largest metros. As partof this, the role of universities – key institutions of theknowledge economy – was examined andrecommendations were made on how the UK canmaximise the contribution made by the highereducation sector.
A major ambition of the Commission was to make thecase for devolving more decision-making powers andfunding to metro governments in an effort to supportdiverse urban areas in boosting their growth rates. Inits consideration of devolution of powers over publicexpenditure, the Commission reflected on other waysof securing best value from public investment tomaximise growth. Given that the higher educationsector is annually in receipt of more than £7 billion(exclusive of student loans) in public funds fromcentral government, it was natural that theCommission would be interested in the potential toenhance the return on investment. Its aim in thisregard was to focus on strengthening the impact of allhigher education expenditure on local economicgrowth.
The Commission set out its vision for universities inthe report UniverCities: The Knowledge to Power UKMetros. This report builds on the premise that thecalibre of the UK’s universities and their geographicalbreadth is a unique strength that benefits the UKeconomically, particularly in the UK’s metros. Of 123universities in the UK, 72 are in the UK’s 15 largestmetros. These universities have become key economicassets in every major UK metro, but they also are ascompetitive because higher education is exactly thekind of knowledge industry that benefits from, inaddition to contributing to, agglomeration effectswithin cities. The Commission is thus intent that theglobal competitiveness of these universities isreinforced through their metro contribution.
Adding valueThere are a number of ways in which universities addvalue: through research and teaching, producinggraduates, and supporting ‘innovation ecosystems’.The UK is formidable in its research, recognised in asurvey of executives by the World Economic Forum assecond best (preceded by Switzerland) in the world inquality of science research institutions3. However, inspite of its strength in this area, the House ofCommons Science and Technology Committee hasfound that the UK currently under-performs incapturing the economic benefits from its world-classscience base at a local level4. This failure was in partattributed to a lack of locally relevant information andadvice, but also because many of the financial andperformance incentives that universities are governedby are agnostic to where the impact created by highereducation institutions (HEIs) is felt. Notably, only afew regions, including London, have made an attemptto correct this through networking and umbrellabodies for the sector which connect HEIs andbusinesses.
1 Brhmie Balaram is a Researcher for the RSA (the Royal Society for the encouragement of Arts, Manufactures and Commerce).2 Jonathan Schifferes is a Senior Researcher for the RSA3 The Competitive Rankings for quality of scientific research institutions: http://reports.weforum.org/global-competitiveness-report-2014-2015/rankings/ 4 House of Commons Science and Technology Committee (2013) Bridging the valley of death: improving the commercialisation of research. Available at: www.publications.parliament.uk/pa/cm201213/cmselect/cmsctech/348/348.pdf
GMT winter2 2014_15_Layout 1 28/01/2015 10:20 Page 11

GMT winter2014/15
12
Employer engagementOf the 1.2 million small and medium enterprises(SMEs) estimated to innovate annually on products orprocesses, only 1,000 have collaborated with ResearchCouncils UK (RCUK)5. This may speak to howprohibitive many SMEs find engagement withuniversities. The underlying barriers are difficulties inpredicting future needs, raising investment capital andcommissioning research, but the ‘institutionalarchitecture’ is partially at fault. There is littleinvestment in coordination within and between HEIs,which means that businesses often struggle to navigatedifferent faculties, schools and departments and theiroffers.
Graduates in the labour marketLikewise, more could be done to integrate graduatingstudents into the labour market. In a 2014 survey ofHEIs, only one in seven identified that their HEI as awhole made a significant contribution to economicdevelopment through graduate retention6. Rates ofretention do vary by metro as longitudinal data fromthe Higher Education Statistics Agency (HESA)shows, but some metros are much weaker than othersat holding onto their share of graduates. This could befor a number of reasons, including that a higherconcentration of graduate-level jobs in the privatesector is found in London7. Between 2009 and 2012,35% of all jobs in London were graduate-level jobscompared to 26% for other large cities in the UK. Asrecruitment in the public sector wanes in accordancewith the recession and cuts to the public sector,graduates increasingly depend on the private sector foropportunities.
Another explanation may be that graduates find itchallenging to identify a wide range of possibilities oralternatives to job leads that did not pan outsuccessfully in their local areas. The Association ofGraduate Recruiters (AGR) has estimated thatnationwide there are 84 graduate applications rejectedper graduate appointed. These candidates could bemore suitable for other employers in the area, some ofwhich may be SMEs, but the connection is only likelyto be made if there are brokers.
Graduate entrepreneurialismGraduates may also not feel linked up to opportunitiesenabling entrepreneurialism. In the Commission’sresearch, graduate interviewees expressed that there
was still stigma surrounding enterprise. Studentsviewed it as a ‘minority sport’ compared toemployment, but they also perceived that faculty wasoften reluctant to support enterprise. There werereferences to faculty being ‘fearful of being seen toback something that isn’t a winner’ and some refusingto embed entrepreneurialism in the curriculumbecause they believed that ‘discussing businessapplications cheapens the theory’ of what they teach.Yet, the movement for further developing enterpriseeducation is gaining momentum and for good reason.Enterprise education is ‘a process which developsindividuals’ mindsets, behaviours, skills andcapabilities’ in order to create value in a range ofcontexts and environments – this usually has theknock-on effect of improving the employability ofgraduates overall8. An ‘entrepreneurial mindset’prepares graduates to compete in a more dynamiclabour market9.
However, as enterprise education expands and has newproponents, such as Lord Young and Sir Andrew Witty,there is still a dearth of capital for graduate start-ups.The graduates interviewed made it clear that socialcapital is just as important as financial capital;mentoring, support and access to networks ofcustomers and suppliers were all highly prized.
Harnessing the contribution of universitiesThe Commission has proposed a series ofrecommendations aimed at optimising research andteaching for metro growth, promoting graduateretention and utilisation, and encouraging enterprisingstudents, graduates and faculty. Theserecommendations are designed to ensure that as wellas being globally competitive, the contribution ofuniversities to metro growth is harnessed.
Metro funding to optimise research and teachingfor growthIn line with the overall belief that metros should havemore autonomy to act, the Commission suggests thatnew freedoms and flexibilities be given to metros toestablish Metro Investment Funds for HigherEducation (MIFHE). These funds would be derivedfrom devolved skills budgets, and could be used bymetros to top up existing pots of money for researchand teaching that specifically impact on local growthwithin their area. There are a number of advantages tocreating an MIFHE; for example, a metro approach to
5 Research Councils UK (2013) Impact report 2013. Available at: www.rcuk.ac.uk/rcuk-prod/assets/documents/publications/2013impactreport.pdf6 Respondents were prompted to select answers from a prescribed list: In which three areas do you see your HEI as a whole making the greatest contribution to (economic development? (HEFCE, ‘Higher Education – Business and Community Interaction Survey’, 2014)7 Centre for Cities (2014) Cities Outlook 2014. Available at: http://www.centreforcities.org/publication/cities-outlook-2014/8 K Hermann, P Hannon, J Cox and P Ternouth (2008), ‘Developing Entrepreneurial Graduates: Putting entrepreneurship at the centre of higher education’9 UKCES, (2014) ‘The Future of Work, Jobs and Skills in 2009’
To subscribe to the GMT e-newsletter go to: www.hecsu.ac.uk/GMT_sign_up
GMT winter2 2014_15_Layout 1 28/01/2015 10:20 Page 12

GMT winter2014/15
13
funding is likely to encourage collaboration betweenHEIs. The flexible nature of this fund could also meanthat metros are able to aggregate small-scaleinvestments from philanthropic funds or businesses, orchannel funding to widen participation among metroresidents.
Graduate incentives to stayThere are several initiatives that metros couldchampion with the aim of providing local graduateswith every opportunity to find employment in themetro labour market. The Commission has suggesteda ‘ReFreshers’ Week’ which can essentially bedescribed as a campaign with universities to supportstudents ahead of and in the months followinggraduation in their transition to working life in thelocal area. Extending roots can take time: graduatesmust find housing and work, as well as ways to feelmore connected to their off-campus community, suchas through volunteering opportunities or local events.
The introduction of a Graduate Clearing scheme mayhelp students diversify their job search, benefiting localSMEs. The scheme would be similar to the UCASclearing scheme; however, the difference would be thatgraduates who have not found a place in corporateschemes would be connected to other firms, includingSMEs, looking to recruit. It would entail a centralisedsystem which pools rejected graduate recruitmentapplications and then recycles them to local firms withvacancies. The model could be developed fromexisting infrastructure, such as the government’sGraduate Talent Pool portal, and could becommercialised after initial public investment.
To explicitly commit graduates to working in the localarea following graduation, industry associations, start-up incubators, or university careers services couldattract subscriptions from firms to support a studentloan repayment bonus, made after a graduate’s loyaltyperiod ends. Eligibility for this ‘golden handcuffs’scheme should require continuous (or near-continuous)
employment in identified industries and sectors,rewarding a medium term (three to five year)commitment from graduates to work locally. Thisshould be prioritised for industries or sectors withidentified skills shortages or growth potential, andshould extend to cover individuals who go on to start-up firms within the loyalty period.
Investing in enterpriseUniversities could also go the extra mile in supportingstart-up incubation and acceleration space ininnovative urban districts through co-investing withBusiness Improvement Districts (BIDs) and industrypartners. There is a pattern of success that can befollowed, including Engine Shed in Bristol, NorthernDesign Centre in Gateshead, C4DI in Hull, Collectivein Camden, London, and the Hatchery at UCL inLondon. As suggested by the House of CommonsScience and Technology Committee, universitiesshould consider investing a fraction of theirendowment, reserves, or pension funds in suchschemes10. This might also produce further resourcefor reinvesting in local spin-off enterprises of staff andalumni.
The Commission backs Lord Young’srecommendation that all students have access to anenterprise module. However, enterprise educationcould be elevated a notch by expanding options forflexible course provision, such as allowing forsandwich years and modular courses, which enableshort-term placements at shorter notice.
Notably, many of the ways in which universities canplay a more central role in driving growth do notactually require further devolution of powers beforethey can act. Universities have the potential to helpmetros realise greater prosperity, and a number havealready been pursuing this agenda for some time. TheCommission’s exploration of this matter is intended toinspire other universities and metros to recognise thispotential and spur them to act.
Download the full report, UniverCities: The Knowledge to Power UK Metros at:http://www.thersa.org/__data/assets/pdf_file/0012/1547778/UniverCities-City-Growth-Commission-October-2014.pdf
To subscribe to the GMT e-newsletter go to: www.hecsu.ac.uk/GMT_sign_up
10 House of Commons Science and Technology Committee (2013) Bridging the valley of death: improving the commercialisation of research
GMT winter2 2014_15_Layout 1 28/01/2015 10:20 Page 13

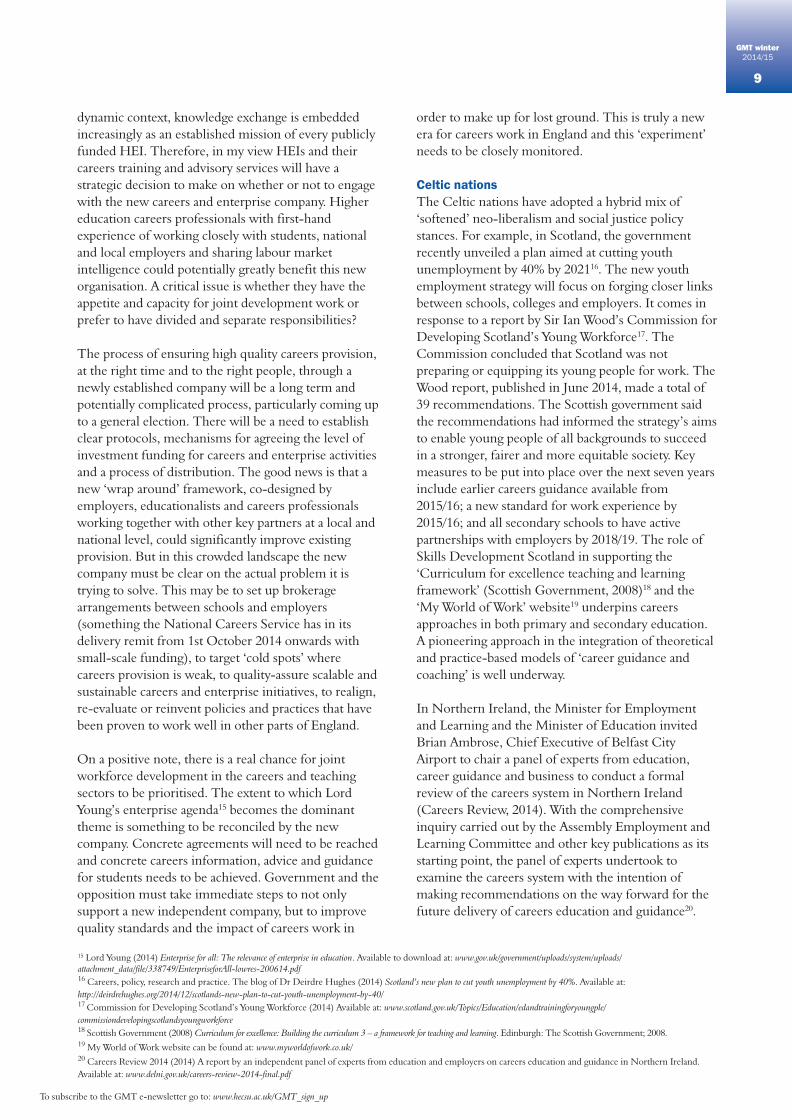
Charlie Ball1 introduces a section of the work he is undertaking investigating graduateemployment across the UK. He takes a look atUK-domiciled first degree graduates from2012/13 who were in employment in the UK sixmonths after graduation, and analyses patterns ofgraduate movement by region in terms of theirlocations of domicile2, study and employment.
The data used in this study comes from the HigherEducation Statistics Agency’s (HESA) Destinations of Leavers from Higher Education (DLHE) surveyfrom 2012/13, which surveyed graduates leavinguniversity in 2013, and examined what they weredoing six months after graduation. We have split theemployed population of graduates into four groups:
1. LoyalsThese are graduates who are domiciled in a region,went to study in the region, and remained to work inthat region. Nearly half of employed graduates (45.9%)from 2012/13 working in the UK six months aftergraduating fell into this category – not a significantchange from before the recession. Loyals tended to beslightly older, were more likely to be women and morelikely to have studied part-time than other groups.They were more likely to be from a background withlower participation in higher education (HE), and tohave a job in education.
2. ReturnersThese are graduates domiciled in a region, who goelsewhere to study, and then return to their homeregion for employment. Just under a quarter (24.7%)of employed graduates fell into this category, again nota significant change from before the recession, and40.5% of graduates working in the East of Englandwere from this group. They were the most likely groupto be in non-professional employment after sixmonths, except in London, where it is the Loyals.
3. StayersThese are graduates who travel away from their homeregion to study, and then remain in that region towork. Of the first degree graduates who were inemployment in the UK 11.5% were in this category,nearly one in six of whom (16.3%) were working ashealth professionals. They were also more likely thanother graduates to work in arts and media professions.This group were the most likely to be young (21-24)on graduation, to be white and to have studied full-time.
4. IncomersThese are graduates who go to work in a region inwhich they neither studied nor were domiciled, andmade up 18% of the population of employed graduatesfrom 2012/13. They often come to a region for jobswhich may be higher paid, in management,engineering, or business. This group were the mostlikely to be male and from the backgrounds with thehighest participation in HE. They were the least likely(17%) to be in a non-professional job. Business, HRand finance professions were the destinations for15.1% of Incomers six months after graduating, and11.9% went into marketing or PR. More than a third(34%) of graduates in engineering and 30.6% ofgraduates in employment in the sciences were in thiscategory.
Figure 1 (over the page) shows the breakdown ofregional employment into these groups. Incomersbecome more important the closer a region is to theemployment hotspots of London and the South East,and it is notable that the Scottish labour market nowsees more Loyals than Northern Ireland, most likely asa result of the different fees regime there.
Graduate retentionThere are a number of different potential forms ofgraduate retention. Here we examine two, retention ofgraduates originally domiciled in a region, and
Loyals, stayers, returnersand incomers: Graduatemigration patterns
GMT research
1 Charlie Ball is the Head of Higher Education Intelligence for Prospects, you can access more of his work on his blog at: http://hecsu.blogspot.co.uk/.2 Domicile refers to the region that the graduate lived in before they began studying at university.
GMT winter2014/15
14
GMT winter2 2014_15_Layout 1 28/01/2015 10:20 Page 14

Figure 1. Breakdown ofgraduates from 2012/13employed in each region aftersix months by migrationcategory
Source: HESA’s Destinations of Leaversfrom Higher Education survey 2012/13
0
10
20
30
40
50
60
70
80
90
100
Loyals
Stayers
Returners
Incomers
%
62.313.715.7
8.2
58.912.220.3
8.6
45.918.325.0
10.9
40.415.229.5
14.9
45.49.731.1
13.9
31.46.640.5
21.5
28.912.423.0
35.6
36.110.532.6
20.7
40.413.929.6
16.2
64.812.215.6
7.4
84.36.24.4
5.1
81.70.516.4
1.4
NE NW Yorks EMids
WMids
East London SE SW Wales Scot NIreland
There is more insight from Charlie’s full report on regional graduate migration at: http://www.hecsu.ac.uk/
Figure 2: Proportion ofgraduates from 2012/13originally domiciled, andproportion of graduateswho went to university ineach region, working in theregion six months aftergraduation.
0
10
20
30
40
50
60
70
80
90
100
Domiciled
Students
%NE NW Yorks E.
MidsW.
MidsEast London SE SW Wales Scot N.
Ireland
76.2
55.1
77.2
66.0
71.5
48.5
61.0
39.2
69.0
54.7
55.6
50.9
80.9
70.4
60.1
43.1
64.1
48.1
73.1
59.5
88.8
83.4
78.7
91.9
of g
radu
ates
ret
aine
d by
reg
ion Source: HESA’s Destinations of Leavers
from Higher Education survey 2012/13
GMT winter2014/15
15
retention of graduates who went to university in a region. Figure 2 examines the differences. With theexception of Northern Ireland, each region is morelikely to retain those originally from the region thanthose who studied there – not surprising, as
there are more Returners than Stayers. This doesdemonstrate the differences between different forms of ‘retention’ and the challenges in thinking ofgraduate retention, and what that might actually mean.
GMT winter2 2014_15_Layout 1 28/01/2015 10:20 Page 15

GMT winter2014/15
16
Persistent gender wage gap inequality amongrecent graduates in the UK was explored in theGMT Futuretrack special 20131. Is thisphenomenon felt only in the UK or is itexperienced in other graduate labour markets?Edwina Lindsay2 from Graduate CareersAustralia (GCA) analyses the GraduateDestinations Survey to explore the gender wagegap in the Australian graduate labour market.This article investigates the key determinants ofthe Australian graduate gender wage gap andprovides suggestions for future research.
As the national gender wage gap in Australia iscurrently sitting at a 20 year high of 18.2% in favour ofmales (ABS, 2014), the need to address the financialbarriers for Australian women is now stronger thanever. It is important to note, however, that this 18.2%figure does not take into account the many vital factorsthat influence salaries, such as differences in age andwork experience. The question is this: does this genderwage gap (i.e. the difference in earnings between malesand females) exist for Australian graduates? Sincegraduates enter the labour market at a time when theirhuman capital is arguably equal, there is no obviousreason to expect there to be differences in their startingsalaries.
Using 2013 Graduate Destinations Survey (GDS) data,we investigated whether a gender wage gap existswithin the labour market for recent Australiangraduates and, if so, the extent of the gender wage gapwhen the personal, enrolment and employmentcharacteristics of graduates were taken into account.
Some literature When reviewing the international literature examiningthe gender wage gap amongst graduates, overseasstudies have found that a major contributor to thegender wage gap is field of education (Finnie andWannell, 2004; Jewell, 2008). Finnie and Wannell’s(2004) longitudinal analysis of Canadian bachelor
degree graduates found that field of education was asignificant contributor to the overall wage gap, and thatwomen tended to be over-represented in lower-earning fields of education. Similarly, in her UK studyof University Reading graduates, Jewell (2008)reported field of education choice to be a major driverof the gender wage gap, and that the overall gap waspartly attributable to males being more likely to obtainjobs at the higher end of the pay scale.
Interestingly, Australian studies have found similarresults. In 2009, Birch, Li and Miller, using data fromthe 2003 GDS, found field of study to be a majordeterminant of Australian graduate starting salaries.They reported that particular majors were associatedwith a pay premium, and found a residual gender wagegap of around 3% favouring males in their pooledsample. Another study, conducted by Li and Miller in2012, again using GDS data, reported a slightly largergender wage gap of 5% in the Australian graduatelabour market.
Data and methodologyThe data used for this study came from GCA’s annualGraduate Destinations Survey 2013 (GDS). Previousstudies have established that the GDS data are reliableindicators of the full-time labour market outcomes ofrecent graduates (e.g. Guthrie and Johnson, 1997).
The data set for this analysis was restricted to a subsetof respondents who were Australian citizens orpermanent residents, had completed a bachelor degree,aged less than 25 at the time of the survey, in their firstfull-time employment in Australia, and had indicatedtheir gender. Graduates with missing data in any of thevariables of interest in this study were excluded fromthe sample, as were those with an annual salary below$A20,000 or above $A112,500. Following theseexclusions, the final sample contained 8,185 graduates,consisting of 3,103 males (37.9% of the sample) and5,082 females (62.1% of the sample).
To subscribe to the GMT e-newsletter go to: www.hecsu.ac.uk/GMT_sign_up
Are Australian graduatesat the mercy of the gender wage gap?
GMT international research
1 GMT (2013) Gendered Earning Power. Futuretrack Special. P.14. Available at: www.hecsu.ac.uk/current_projects_graduate_market_trends_archive.htm2 Edwina Lindsay is a Research Associate at Graduate Careers Australia (GCA). GCA works in association with the higher education sector, government and businessin Australia to provide employment and career opportunities to graduates, producing graduate-related publications and research that informs stakeholders about graduate employment and career development.
GMT winter2 2014_15_Layout 1 28/01/2015 10:20 Page 16

Model 1 Model 2 Model 3
GMT winter2014/15
17
The analysis consisted of three multiple regressionmodels predicting annual starting salary on the basis ofa set of potential influencing factors which includedpersonal, enrolment and occupational characteristics.
The dependent variable in this study was the naturallogarithm of the annual starting salary. Results fromthe three models are presented in Table 1.
To subscribe to the GMT e-newsletter go to: www.hecsu.ac.uk/GMT_sign_up
SexFemale -0.094 (0.006)** -0.047 (0.006)** -0.044 (0.006)**
Field of education (a)Accounting 0.070 (0.014)** 0.035 (0.013)**Agricultural science 0.069 (0.029)* 0.077 (0.027)**Architecture & building 0.061 (0.019)** 0.078 (0.018)**Art & design -0.121 (0.020)** -0.074 (0.018)**Biological sciences -0.002 (0.017) 0.028 (0.015)Computer sciences 0.125 (0.019)** 0.100 (0.018)**Dentistry 0.446 (0.052)** 0.452 (0.048)**Earth sciences 0.285 (0.033)** 0.197 (0.031)**Economics & business 0.059 (0.011)** 0.046 (0.010)**Education 0.177 (0.013)** 0.141 (0.013)**Engineering 0.306 (0.013)** 0.230 (0.012)**Law 0.152 (0.019)** 0.117 (0.017)**Mathematics 0.134 (0.038)** 0.074 (0.035)*Medicine 0.238 (0.021)** 0.130 (0.020)**Optometry 0.529 (0.060)** 0.504 (0.055)**Paramedical studies 0.155 (0.012)** 0.093 (0.011)**Pharmacy -0.110 (0.020)** -0.124 (0.019)**Physical sciences 0.101 (0.034)** 0.076 (0.031)*Pyschology 0.026 (0.020) 0.043 (0.018)*Social sciences 0.023 (0.029) 0.047 (0.026)Social work 0.028 (0.032) 0.035 (0.029)Veterinary science 0.024 (0.048) 0.054 (0.044)
Personal characteristicsDisability 0.023 (0.016) 0.006 (0.015)Non-English speaking background -0.003 (0.008) 0.000 (0.008)
Enrolment characteristicsHonours bachelor 0.114 (0.010)** 0.079 (0.010)**Double degree 0.107 (0.008)** 0.076 (0.007)**
Region, occupation, other employment characteristics Not included Not included Included Adjusted R2 .026 .203 .344F-statistic 221.85 78.03 80.57Sample size 8,185 8,185 8,185
† Standard errors are reported in parentheses. * = statistically significant at 5 per cent level; ** = statistically significant at 1 per cent level ¥ Reference categories: (a) humanities
Table 1: Gender differences in graduates' average annual starting salaries when controlling for variouspersonal, enrolment and employment characteristics, 2013†¥
GMT winter2 2014_15_Layout 1 28/01/2015 10:20 Page 17

GMT winter2014/15
18
FindingsAccording to Table 1, Model 1 reports that femalegraduates earn approximately 9.4% less than malegraduates, on average, controlling for no other factors.However, capturing the impact of gender alone is not atrue reflection of the determinants of the startingsalaries of graduates (Birch, Li and Miller, 2009),because men and women enrol in different fields ofeducation and have different occupational pathways asa result.
We then built on Model 1 by controlling for field ofeducation studied, and a range of other personalcharacteristics (disability status, language background)and enrolment characteristics (honours degree, doubledegree) that may influence graduates’ starting salariesto create Model 2. The results of Model 2 halved theaggregate 9.4% gender wage gap to 4.7%. In otherwords, female graduates earn approximately 4.7% less,on average, than male graduates when field ofeducation and other personal and enrolmentcharacteristics are taken into account.
So what are the key factors that contribute to theoverall 9.4% gap observed in Model 1? When lookingat the enrolment patterns of male and female graduates(Table 2), 24.6% of males and 3.7% of females studiedengineering. According to Model 2 (Table 1),engineering was associated with a 30.6% salaryadvantage compared with the reference category ofhumanities. When it came to humanities, femalesoutnumbered males, and humanities was ranked at thelower end of the salary distribution. This over-representation of males in fields of education thattypically have higher starting salaries, andconcentration of females in jobs at the lower end of thepay distribution seems to be a key contributor to theaggregate 9.4% gender wage gap observed in Model 1;consistent with the findings from Jewell (2008) andBirch, Li and Miller (2009).
In Model 3, we estimated the impacts of broadoccupation groupings and other employmentcharacteristics on graduates’ average annual startingsalaries. In addition to personal, field of education, andenrolment variables, Model 3 (Table 1) includes anextensive list of employment variables such as weeklyworking hours in logarithmic form, whether thegraduate was employed in a small or mediumenterprise, whether they worked in thepublic/government sector, were on a short-termcontract, whether they considered their field ofeducation to be of only limited importance to theircurrent employment, and whether they were
employed full-time in their final year of study. We alsoincluded 14 region of employment variables (eachAustralian state is split into regional and urbancategories) and seven broad occupation variables (withreference categories of regional South Australia, andCommunity and Personal Service workers).
The addition of the various employment variables inModel 3 only changed the female coefficientmarginally from -0.047 to -0.044. This small shiftappears to confirm the earlier finding that much of thegender wage gap for recent graduates is due to thedifferences in fields of education studied by male andfemale graduates, and the differences in occupationalpathways resulting from these choices.
It is unfortunate that even after controlling for anunusually detailed set of fields of education controls, aswell as an extensive set of personal, enrolment and
To subscribe to the GMT e-newsletter go to: www.hecsu.ac.uk/GMT_sign_up
Gender 37.9 62.1 100.0
Field of education Accounting 9.4 6.6 7.7Agricultural science 1.1 0.9 1.0Architecture &building 4.0 2.1 2.8Art & design 2.0 2.9 2.5Biological sciences 3.1 4.4 3.9Computer sciences 6.0 0.8 2.8Dentistry 0.2 0.4 0.3Earth sciences 1.4 0.4 0.8Economics & business 21.6 18.8 19.8Education 3.5 10.9 8.1Engineering 24.6 3.7 11.6Humanities 5.7 11.6 9.3Law 2.4 3.4 3.0Mathematics 1.0 0.3 0.6Medicine 2.3 2.0 2.1Optometry 0.2 0.2 0.2Paramedical studies 6.3 21.0 15.4Pharmacy 2.2 3.0 2.7Physical sciences 1.2 0.4 0.7Pyschology 1.1 3.3 2.4Social sciences 0.6 1.3 1.1Social work 0.2 1.3 0.8Veterinary science 0.0 0.6 0.4
Observations 3103 5082 8185
Male Female Total
Table 2. Graduates’ field of education enrolmentpatterns, by gender, 2013 (%)
GMT winter2 2014_15_Layout 1 28/01/2015 10:20 Page 18

GMT winter2014/15
19
employment characteristics, a statistically significantgender wage gap of 4.4% in favour of males remainedunexplained by our data set. Nevertheless, this 4.4%figure is similar to the results from other Australianstudies for example, 3% found by Birch, Li and Miller(2009) and 5% found by Li and Miller (2012).
Conclusions and future researchMajor findings from our analysis suggested that muchof the earnings gap between new male and femalegraduates in Australia can be explained by differencesin the choice of fields of education. In other words,half of the graduate gender wage gap can be explainedbefore graduates even enter the workforce (forexample, the field of education variables reduced thegender wage gap from 9.4% to 4.7%).
If higher earnings are of importance to students, thenthe strategic selection of field of education at an earlierpoint in their education is likely to reward them withhigher earnings in the labour market. The 9.4%aggregate gap could be narrowed if females were givenmore information about career choices andopportunities at school with encouragement toconsider training for occupations that are oftentraditionally thought of as male roles. These includetraining and occupations in STEM subjects.
We also found that, after further controlling forpersonal, enrolment and broad occupationalcharacteristics of male and female graduates, a genderwage gap of 4.4% remained unexplained by our data.While the gap could be partly due to other differencesbetween men and women not captured in our data andmodels, it could also be explained by genderdifferences in negotiating behaviour as well asdiscriminatory practices within the workplace. If true,this could be addressed by organisations implementinggender-neutral wage practices that ensure equal wagestructures for males and females who work incomparable levels of employment, and training staffand managers on the issue of gender bias. The
Workplace Gender Equality Agency3 is currentlyrunning a campaign to encourage CEOs to analysetheir pay structures within their respective workforces.So far the campaign has established 58 pay equityambassadors (CEOs who have pledged to achievegender equity within their organisations).
Finally, other studies have concluded that the genderwage gap tends to widen with age. Finnie and Wannell(2004), for example, found that the gender wage gapfor graduates narrowed two years after coursecompletion, but widened two to five years out for allcohorts. The analysis undertaken in our study waslimited in that the GDS data relate exclusively torecent graduates at the beginning of their careers. Thislimitation may be addressed by future research basedon longitudinal data such as those contained within theBeyond Graduation Survey4, in order to determinewhether the magnitude of the gender wage gap forrecent Australian graduates fluctuates over time.
ReferencesABS (2014) Average Weekly Earnings, Australia, May 2014, cat. no.6302.0 [online]. Australian Bureau of Statistics. Available from:www.abs.gov.au/ausstats/[email protected]/mf/6302.0
Birch, E. R., Li, I., & Miller, P. W. (2009) ‘The influence ofinstitution attended and field of study on graduates’ starting salaries’,The Australian Economic Review, 42 (1), 42-63.
Finnie, R., & Wannell, T. (2004) ‘Evolution of the gender earningsgap among Canadian university graduates’, Applied Economics, 36,1967-78.
Guthrie, B., & Johnson, T.J. (1997) Study of Non-Response to the 1996Graduate Destination Survey. Canberra: Department of Employment,Education Training and Youth Affairs.
Jewell, S. (2008) Human Capital Acquisition and Labour MarketOutcomes in UK Higher Education. UK: Centre for CareerManagement Skills, The University of Reading.
Li, M., & Miller, P. (2012) Gender Discrimination in the AustralianGraduate Labour Market. Discussion Paper Series No. 6595.Germany: The Institute for the Study of Labour (IZA)
To subscribe to the GMT e-newsletter go to: www.hecsu.ac.uk/GMT_sign_up
Download the full journal article with more detail about the data and methodology employed at:www.graduatecareers.com.au/wp-content/uploads/2014/06/GCA Gender Wage Gap Paper -
2013 GDS - 17 June 2014 FINAL.pdf
3 For more information, visit: www.inyourhands.org.au.4 Graduate Careers Australia’s Beyond Graduation Survey investigates the activities and outcomes of graduates three and five years after course completion.
GMT winter2 2014_15_Layout 1 28/01/2015 10:20 Page 19

GMT winter2014/15
20
Are universities prestigious because they are richor rich because they are prestigious? Differentleague tables use different methodologies andrarely compare like with like and financialfactors usually determine where a university sitsin the rankings. Andrew McCulloch examinesthe role of league tables in helping defineinstitutional prestige.
Published annually by several newspapers, includingthe Times, the Independent and the Guardian, leaguetables use a set of indicators to try to rank UKuniversities. These tables attempt to rank universitiesalong a single dimension. What exactly this dimensionrepresents is not explained in detail by any of thepublications, but we can broadly think of it as'prestige'. Universities do pay attention to theirposition in the league tables and in particular tochanges in where they are ranked relative to other
comparator institutions. Institutions are concerned that a fall in a league table position from one year to thenext may impact on their prestige and reputation. Thisis because the reputation of an institution is animportant factor influencing the decisions made bystudents about where to study.
Example 1. Guardian league tablesAlthough institutions may be concerned about theimpact of changes in league table position on thenumber of applications they receive, both league tableposition and the number of applications show a strongpattern of stability. Using the Guardian league tables,figure 1 shows the relationship between league tableranking in 2009 and 2012, with research-baseduniversities (the Russell Group and the 1994 Group)distinguished from remaining institutions. There is avery positive correlation (r = 0.9) between leagueposition in 2009 and league position in 2012. The
Institutional prestige and the money factor
GMT research
Figure 1. The relationship between league tableposition in 2009 and 2012 for Russell Group, 1994Group and other institutions
Figure 2. The relationship between number ofapplications in 2009 and 2012 for Russell Group,1994 Group and other institutions
To subscribe to the GMT e-newsletter go to: www.hecsu.ac.uk/GMT_sign_up
GMT winter2 2014_15_Layout 1 28/01/2015 10:20 Page 20

GMT winter2014/15
21
stability of position within the league table isparticularly marked for the research-based universities,with seventeen institutions remaining in the toptwenty in both years. Outside the group of research-based universities, there is greater movement in leaguetable position from year to year, although long-termmovement in position still tends to be uncommon.
Figure 2 shows the relationship between the numberof UCAS applications received by universities in 2009and 2012. The correlation between the number ofapplications received in 2009 and the number in 2012is remarkably high (r = 0.96) with a few universities –Manchester Metropolitan, Leeds, Nottingham,Edinburgh and Manchester – receiving more than45,000 applications in both years.
The stability shown by universities' positions in leaguetables and the number of applications they receivesuggests that the relationship between league tablerankings and number of applications is likely to berelatively weak. Research studies confirm this view,and a recent study using data at the subject level hasfound that a unit change in league table score isassociated with a 0.5% change in applications(Chevalier and Jia 2013)1.
Example 2. The Times league tablesFigure 3 plots the relationship between the entryqualifications of students against the student/staff ratioand figure 4 plots the relationship between the entryqualifications of students against the spending onservices for universities in the most recent league tablepublished by the Times. Figure 4 shows that there is apositive relationship between entry qualifications andspending on services (r = 0.71) while entryqualifications show a negative relationship to thestudent/staff ratio (r = -0.77) (figure 3). In otherwords, the higher qualified the average student, themore the university spends on services, and the lowerthe student/staff ratio is.
The figures also show that research-based institutionstend to have lower staff/student ratios and higher levelsof spending in comparison to other institutions.Meanwhile, the magnitude of the variation in studentspending and staff resources across institutions seemsto be quite large. For example, although differences inthe subjects taught at different institutions willinfluence the costs of education, the spending onservices vary widely from over £3,000 per student atOxford and Cambridge to less than £1,000 per studentat the universities of Bolton and Cumbria. The league
Figure 3. The relationship between the entrypoints of students and the staff/student ratio forRussell Group, 1994 Group and other institutions
Figure 4. The relationship between the entrypoints of students and the services facilitiesspend for Russell Group, 1994 Group and otherinstitutions
1 Chevalier A, Jia X, 2013, Subject specific league tables and students’ application decisions. Available at: www.sheffield.ac.uk/polopoly_fs/1.247178!/file/A3_jia.pdf
To subscribe to the GMT e-newsletter go to: www.hecsu.ac.uk/GMT_sign_up
GMT winter2 2014_15_Layout 1 28/01/2015 10:20 Page 21

GMT winter2014/15
22
table positions of the more prestigious institutions arenot therefore due to a single factor, but instead a rangeof advantages, including the level of financial and staffresources which they have available.
The effect of financial advantageThe financial advantages that the most prestigiousuniversities have over other institutions are not trivialdespite the majority of institutions charging the sametuition fee of £9,000 per year. For example, the ViceChancellor of Oxford recently complained that theuniversity was spending around £70 million of its ownmoney each year on the education of its students2. Ifwe put aside the argument that as a charitableorganisation there is nothing remarkable aboutproviding services at less than their market price, it stillleaves the university with a significant funding gapeach year. For universities such as Oxford, the extrafinancial resources that they spend on teaching comefrom a range of sources, but include a significantcomponent from donations made by former students.Information on the amount of money received indonations by UK universities has been collected by theRoss Case survey since 2001/02 (NatCen, 2014)3. TheRoss Group is a network of leading fundraisingprofessionals from the research-based universities.Figures from the most recent survey show that Oxfordand Cambridge are a case apart from remaininginstitutions, with total alumni donations to Oxford andCambridge exceeding £350 million in the academicyear 2012/13. Among the remaining institutions, theolder universities tend to receive more in donationsthan the newer universities. Institutions establishedprior to 1960 received on average around £6 millionper year, while the 1960s universities received around£2 million and the 1990s universities around £640,000.
The magnitude of donations to Oxford andCambridge tells us quite a lot about the kinds ofprocesses that produce inequalities between highereducation institutions. The amount received by auniversity in terms of donations is related to how
successful its former students have been in the labourmarket, which in turn is related to the level of prestigeof the institution they attended. This highlights thestrong pattern of cumulative causation that runsthrough higher education.
Can anything be done to level the playing field?Recent government initiatives have tried to increasethe role of donations as a source of cash foruniversities, with the Pearce Report setting a target of£2 billion per year in donations from 630,000 donorsby 2022 (HEFCE, 2012)4. It is not a bad idea toencourage alumni who have benefited from theireducation to donate to their former institutions.However, it would seem likely that greater reliance ondonations as a source of finance would tend to increasedifferences between institutions. While the mostprestigious institutions would likely prosper, with avirtuous cycle of generous financial assistanceattracting the most qualified students who go on to thebest jobs, those at the bottom of the league tableswould not have the same degree of support fromformer students and would likely find it difficult tomaintain the quality of their services.
Although the quality of our research-based universitiesdoes attract a lot of attention, it is not a particularlyuseful way to gauge the quality of an education systemas a whole. It is likely that the prestigious institutionsin the UK could prosper without government support.A reduction in the level of government support and anincrease in competition between institutions mighthave a positive effect for a handful of universities, butwould very likely lead to an increase in inequalitiesbetween institutions. From what we know, this wouldlikely make it more difficult for young people fromless well-off backgrounds to go to university.Government regulation and financial support willtherefore remain key both to the quality of theeducation system as a whole and to the level ofinvestment we make in education as a country.
2 www.independent.co.uk/student/news/we-need-tuition-fees-of-up-to-16000-says-oxford-vicechancellor-professor-andrew-hamilton-8867323.html3 NatCen (2014) Giving to excellence. Available at: www.natcen.ac.uk/our-research/research/ross-case-survey/4 HEFCE (2012) Review of philanthropy in UK higher education. Available at: www.hefce.ac.uk/pubs/rereports/year/2012/philanthropyreview/
To subscribe to the GMT e-newsletter go to: www.hecsu.ac.uk/GMT_sign_up
GMT winter2 2014_15_Layout 1 28/01/2015 10:20 Page 22

GMT winter2014/15
23
To subscribe to the GMT e-newsletter go to: www.hecsu.ac.uk/GMT_sign_up
Higher EducationAcademy: Employability update
Learning and teaching in cyber security grants awardedThe Higher Education Academy (HEA) and the Department for Business, Innovation and Skills (BIS)have awarded Development Fund grants of up to £40,000 to Newcastle College, Birmingham CityUniversity, Edge Hill University and Liverpool John Moores University. Following a National AuditOffice landscape review on the UK cyber security strategy, the HEA and BIS invited proposals forinnovative projects that would improve cyber security teaching and learning. The four institutions will use the funding to develop individual projects that will help improve the skills of graduates, address theshortage of cyber security skills and future proof the country’s IT sector, making it more resilient topossible cyber-attacks.
Further information is available at: www.heacademy.ac.uk/about/news/10279
EventsStudent transitions: journeying into, through and beyond higher education – 19th February2015, LondonThis one-day enhancement event will focus on the student journey as a transitional experience, beginningwhen students first decide to enter higher education, and continuing through to graduate employment.The keynote address will reflect on the challenges and opportunities encountered by students entering andtransiting through higher education. Delegates can choose from a number of workshops which provideopportunities to network and share best practice with colleagues. Find out more and book your place at:www.heacademy.ac.uk/events-conferences/event10248
The role of disciplines in interdisciplinary learning and teaching – 5th March 2015, BelfastStudents need to be prepared for a world of complex social and economic challenges which often requireinterdisciplinary solutions. Addressing this requires the development of curriculum and pedagogy that cansupport students in developing skills such as problem solving and the ability to think across intellectual,cultural and linguistic borders. This event will provide an opportunity for delegates to share theirexperiences and perspectives of interdisciplinary education and the role of discipline teaching and learningwithin this. Find out more and book your place at: https://www.heacademy.ac.uk/events-conferences/event10303
For information on all HEA events visit: www.heacademy.ac.uk/events-conferences
New resourcesEnhancing employability through enterprise educationThis new HEA resource seeks to share, disseminate and encourage good practice in enterprise educationacross the disciplines. The case studies represent higher education providers (HEPs) across the UK andprovide diverse and innovative approaches to addressing enterprise education at a discipline and universitylevel. The resource can be accessed at: www.heacademy.ac.uk/node/10233A launch event and workshop was held on 4th December 2014 in Cardiff. A blog on this is available at:http://bit.ly/1E2ED7E
GMT winter2 2014_15_Layout 1 28/01/2015 10:20 Page 23

Engaged learning in MOOCs: a study using the UK engagement survey (2015)This study looked at the learning taking place in Massive Open Online Courses (MOOCs). It shows thatparticipants can and do experience engaged, high quality learning. The study sets out to answer thequestion: how can we know what learning is taking place in MOOCs, and identify MOOCs’ potential forfuture use in HE? Available at: www.heacademy.ac.uk/node/10346
For information on all HEA resources go to: www.heacademy.ac.uk/resources
Professional development and recognition Become a Fellow of the HEA: applying for recognitionThe scheme is closely referenced to the UK Professional Standards Framework (UKPSF):www.heacademy.ac.uk/ukpsf.
Benefits to gaining recognition as an Academy Fellow include:• National recognition of your commitment to professionalism in teaching and learning in higher
education;• Demonstrates that your practice is aligned with the UKPSF;• Provides an indicator of professional identity for higher education practitioners, including the
entitlement to use post-nominal letters;• It is a portable asset that has UK-wide relevance and which is increasingly recognised by higher and
further education institutions.
The HEA’s new online application process is now available for use. This enables individuals andinstitutions to make applications for professional recognition with the HEA via the My Academy portal:https://my.heacademy.ac.uk/
For further information go to: www.heacademy.ac.uk/professional-recognition
The Higher Education Academy (HEA) is the national body for enhancing learning and teaching in higher education (HE). We are committed to excellent learning and teaching, supporting UK HE organisations with an emphasis on improving the student experience. For further informationon our services go to: www.heacademy.ac.uk/
GMT winter2 2014_15_Layout 1 28/01/2015 10:20 Page 24