MT-Fundamental Recap 2007-2009 Final
23
1 MACRO TIDES Macro Factors and their impact on Monetary Policy, the Economy, and Financial Markets [email protected] Recap 2007 - 2009 The following is a recap of the economic and stock market analysis provided in our monthly investment letter “Macro Tides” from January 2007 to December 2009. The majority of economists and financial advisors failed to see the credit crisis coming in 2007, and also failed to appreciate its magnitude as it unfolded in 2008. One of the reasons this occurred was because the macro economic environment had been so constructive since 1982, spending much time on the macro was a waste of time. Between 1982 and 2007, the U.S. economy had only experienced two shallow recessions that each lasted just 8 months, and the Federal Reserve had very adroitly handled the stock market crash in 1987, the 1998 dislocation from the collapse of Long Term Capital Management, and the bursting of the dot.com bubble in 2001. However, the credit creation process is one of the most important macro determinants, and it had evolved significantly since the late 1970’s. Back then, banks provided almost 75% of total credit. By 2007, banks were providing only 35% of total credit, while the securitization markets were generating 40% of total credit. As the securitization markets began to shut down after August 2007, and banks were raising lending standards as they absorbed more housing related losses, most economists and market strategists failed to understand how dependent our economy had become on credit creation and how interdependent financial institutions had become on the securitization process itself. Our approach combines both fundamental analysis and technical analysis, which is unusual. Most economists and financial advisors rely almost exclusively on fundamental analysis, which focuses on the economy and estimates for corporate earnings. Technical analysis utilizes measures of price momentum, moving averages, and charts of the major market indices like the DJIA and S&P 500. We believe the combination of both disciplines is better, since each provides a different perspective. The probability is higher that our analysis is on target, when the fundamentals and technical indicators are aligned, especially at major turning points in the economy and stock market. As you will see, this was the case when the market was topping between July and October 2007, and bottoming in February and March 2009. We think you will find this piece informative and worth your time. Jim Welsh Macro Tides
Transcript of MT-Fundamental Recap 2007-2009 Final
1
MACRO TIDES
Macro Factors and their impact on Monetary Policy,
the Economy, and Financial Markets [email protected]
Recap 2007 - 2009
The following is a recap of the economic and stock market analysis provided in our monthly
investment letter “Macro Tides” from January 2007 to December 2009. The majority of economists
and financial advisors failed to see the credit crisis coming in 2007, and also failed to appreciate its
magnitude as it unfolded in 2008. One of the reasons this occurred was because the macro
economic environment had been so constructive since 1982, spending much time on the macro was
a waste of time. Between 1982 and 2007, the U.S. economy had only experienced two shallow
recessions that each lasted just 8 months, and the Federal Reserve had very adroitly handled the
stock market crash in 1987, the 1998 dislocation from the collapse of Long Term Capital
Management, and the bursting of the dot.com bubble in 2001. However, the credit creation process
is one of the most important macro determinants, and it had evolved significantly since the late
1970’s. Back then, banks provided almost 75% of total credit. By 2007, banks were providing only
35% of total credit, while the securitization markets were generating 40% of total credit. As the
securitization markets began to shut down after August 2007, and banks were raising lending
standards as they absorbed more housing related losses, most economists and market strategists
failed to understand how dependent our economy had become on credit creation and how
interdependent financial institutions had become on the securitization process itself.
Our approach combines both fundamental analysis and technical analysis, which is unusual. Most
economists and financial advisors rely almost exclusively on fundamental analysis, which focuses
on the economy and estimates for corporate earnings. Technical analysis utilizes measures of price
momentum, moving averages, and charts of the major market indices like the DJIA and S&P 500.
We believe the combination of both disciplines is better, since each provides a different
perspective. The probability is higher that our analysis is on target, when the fundamentals and
technical indicators are aligned, especially at major turning points in the economy and stock
market. As you will see, this was the case when the market was topping between July and October
2007, and bottoming in February and March 2009.
We think you will find this piece informative and worth your time.
Jim Welsh
Macro Tides
2
2007
Fundamental Analysis Most economists point to the bankruptcy of Lehman Brothers on September 15, 2008 as the focal point of the financial crisis. There is no question that the demise of Lehman Brothers shook the global financial system to its core. For most economists, the Lehman collapse was when the train left the tracks. However, there were numerous warnings signs, as early as the first quarter of 2007 that a sea change in the availability of credit had begun.
March 25, 2007 - SUB-PRIME MORTGAGE WOES
An intense debate is raging on whether the woes in the sub-prime mortgage market will spread to
other areas of mortgage lending. As far as we’re concerned, it already has spread in one important
way – lending standards. As we mentioned last month, in January, the Federal Reserve’s quarterly
lending survey found that more institutions had increased lending standards than at any time since
1991. Let’s think about what that means in the real world. Even though the Fed has kept rates
unchanged for months, monetary policy has been effectively tightened by many lending
institutions. This is just the opposite of what was happening as the Fed was increasing the Federal
funds rate from 1.0% to 5.25%. The drag effect of those increases did not fully impact the
economy, since many mortgage lenders continued to offer consumers mortgage rates of 1% to 2%.
The pendulum has now swung the other way. Lending standards are not just being raised for sub-
prime borrowers, but for borrowers across the board.
Higher lending standards will curb demand, even as foreclosures increase. It is hard to believe that
less demand and more supply will not depress home values more than we’ve already seen. When
the Fed does lower rates, the higher lending standards will still be maintained for some extended
time. The Fed will only lower rates, if the expected late 2007 rebound in the economy looks
doubtful, or the housing market weakens sharply. If the economy warrants Fed easing, mortgage
payment delinquencies and foreclosures will be rising. That is not an environment conducive to
lowering lending standards, and lending institutions won’t. This means the drag on the economy
from tighter lending standards will continue even after the Fed lowers rates. This also means the
stimulus normally provided the economy from rate reductions will not completely pass through to
consumers. Just as mortgage lenders negated the drag from higher rates between 2004 and 2006,
they will limit the beneficial effects of lower rates, just as the economy will need them the most.
Since delinquency rates and foreclosure rates will continue to increase for sub-prime mortgages in
coming months, accompanied by a rise in non sub-prime mortgages too, the level of risk for the
markets and the economy from this problem will also increase. To put it simply, it is way too early
to think the worst is already behind us.
The abundance of liquidity in the banking system and the securitization markets, not only contributed to the housing bubble, but also financed a record volume of private equity transactions and a record amount of corporate stock buybacks. The
3
demand from these two sources was very supportive of the stock market in 2006 and the first half of 2007.
June 24, 2007 – THE LIQUIDITY STORY
Ample liquidity has not only fueled the economy, but it has also funded some corporate stock buy
backs and most private equity deals. In the last 18 months, these transactions have reduced the
overall supply of stock by an amazing 8%. This factor has certainly supported the trend up in the
stock market. Last month, we wrote about “The New ‘New’ Paradigm”, which compared the
current wave of corporate stock buy backs and private equity deals funded by available credit, to
the technology New Paradigm of 1999 and 2000. As Warren Hellman, considered a pioneer in the
leverage buyout business, stated in a May Wall Street Journal interview, “The mistake made most
frequently is that there are an awful lot of recovering investment bankers in private equity, and the
philosophy of investment banking is that if it comes to you, you say, “Let’s see how to do it”, rather
than “Let’s not do anything.” The hardest thing in times like these is keeping your discipline. Last
year there were $274 billion in closed private-equity deals. That’s clearly a private-equity bubble.”
I also quoted the Chairman of Bank of America who said in early May, “We are close to a time
when we’ll look back and say we did some stupid things.”
The peak in liquidity is behind us, and the gradual lessening in liquidity seen in recent months is
likely to accelerate. Lending standards are rising, and not just for sub-prime mortgages. Over the
last week, two large hedge funds run by Bear Stearns have teetered on the brink of liquidation.
These funds levered $1.2 billion in equity, into more than $20 billion of sup-prime mortgage
derivatives. On June 22, Bear Stearns decided to loan these hedge funds $3.2 billion to keep them
afloat. While this should stabilize the sub-prime mortgage market in the near-term, there are more
chapters to be written in coming months, as the implosion of the sub-prime market unfolds. While
there will be less money available for the mortgage market, it also represents a shot across the bow
of risky lending in general.
Stocks
As long as the S&P holds above 1480, the S&P could rally one more time above the highs at 1540.
If the market is so kind as to rally one more time, investors should use it to cut exposure or hedge
positions. Aggressive investors can establish short positions. If the S&P drops below 1480, a
decline to 1425 – 1450 could quickly follow, which would open the door to making a run at 1400.
The ride is about to get a little bumpy. (The S&P topped on July 16 at 1555, and then declined by
more than 10%.)
The first shock wave to sweep through the financial system struck between August 8 and August 20, 2007. During this nine day window the 90-day Treasury bill yield plunged from 4.8% to 2.4% on August 20th.
4
August 27, 2007 – THE CREDIT BUBBLE
The intensity and scope of the current crisis is not just due to the sub-prime mortgage mess, as
we have endeavored to point out. The increase in lending standards is going to persist for an
extended time, even after the Fed lowers rates. The collective credit problems we face have the
potential to burst the credit bubble, which would be very difficult to reflate once popped, and could
easily lead to something worse than a recession. It is estimated that there is up to $400 billion in
buyout deals working their way through the banking system. The original plan was for the banks to
provide ‘temporary’ bridge financing, until bonds could be sold to investors by private equity firms
to pay for their acquisitions and mergers. The problem for the banking system is if the “temporary”
bridge financing can’t be replaced by bonds sold to credit market participants, the “temporary”
loans must be carried on the books of the banks. This has the potential to become a serious
problem, since it could materially affect future lending by banks. Since our economy is fueled by
lending and credit growth, impaired lending from banks will result in slower economic growth.
Over the last 18 months, as real estate decelerated, a rising stock market was able to offset the
weakness in housing. However, much of the strength in stocks came from corporate stock buy
backs and private equity activity, which were funded by easy lending terms and extraordinarily
narrow risk spreads that are no longer available. If the stock market declines meaningfully, while
housing prices continue to deflate, the impact on the balance sheets of many consumers would be
negative. The record high level of debt carried by many consumers is supported by real estate and
equity asset prices. A simultaneous decline in both asset classes could pose a considerable
challenge for the Federal Reserve. The one bubble the Federal Reserve cannot allow to burst is
the credit bubble.
In response to the dislocation in the financial markets, the Federal Reserve lowered the Federal funds rate and the Discount rate. The Fed’s decision was hailed as a bold and decisive action, which helped the S&P 500 to rally from 1405 to 1538 on September 19.
September 24, 2007 – FEDERAL RESERVE
Although the actions by the Federal Reserve to lower the Discount rate and the Federal funds rate
have helped, it is premature to say the cuts are doing much more than keeping things from getting
worse. Most investors think that the reaction of the stock market is a sign that we’ve turned the
corner. We don’t think so.
Throughout the Pacific Ocean there are sounding buoys to determine if a 100 foot tsunami traveling
500 miles per hour, or a 2 foot wading wave has developed after a large earthquake. The disruption
that swept through credit markets worldwide in August was equivalent to an 8.4 magnitude
earthquake. While seismologists know if a tsunami was created within a couple of hours, we won’t
know for a number of months the full economic impact. But the displacements that took place leave
no doubt that a significant seismic event occurred. In just seven days, T-bill yields plunged from
4.9% to 2.5%. In a month, the $2.2 trillion commercial paper market has contracted by more than
15%. Even as the ECB pushed well over $250 billion of liquidity into their banking system, the 90-
day LIBOR rate jumped from 5.36% to 5.73%. In August, the issuance of junk bonds dropped by
5
93%, as the appetite for risk disappeared. This caused the spread between Treasury bonds and junk
bonds to surge from 2.6% in June to 4.6% in less than six weeks.
In August, the number of foreclosures surged 115% from last year, and increased a whopping 36%
from July. With almost 2 million adjustable rate mortgages resetting in the next two years, the
number of foreclosures will continue to soar. The imbalance between supply and demand in the
housing market is likely to take far longer to stabilize than most people realize. Between 1968 and
2000, the ratio of the median home price to median household income fluctuated in a narrow range
between 2.8 and 3.2. During this 32 year period, increases in home prices were supported by a rise
in household income. This relationship provided underlying support for home prices, even when
recessions developed in 1970, 1974, 1981, 1990 and 200l. However, between 2000 and 2006, the
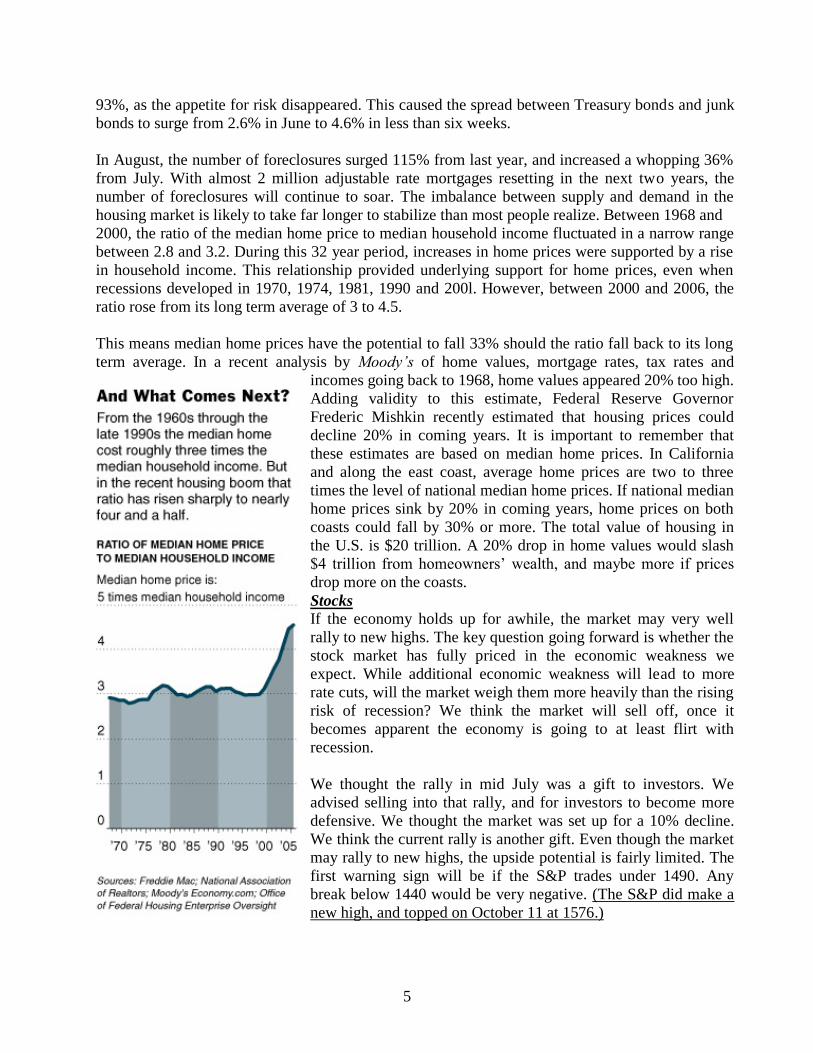
ratio rose from its long term average of 3 to 4.5.
This means median home prices have the potential to fall 33% should the ratio fall back to its long
term average. In a recent analysis by Moody’s of home values, mortgage rates, tax rates and
incomes going back to 1968, home values appeared 20% too high.
Adding validity to this estimate, Federal Reserve Governor
Frederic Mishkin recently estimated that housing prices could
decline 20% in coming years. It is important to remember that
these estimates are based on median home prices. In California
and along the east coast, average home prices are two to three
times the level of national median home prices. If national median
home prices sink by 20% in coming years, home prices on both
coasts could fall by 30% or more. The total value of housing in
the U.S. is $20 trillion. A 20% drop in home values would slash
$4 trillion from homeowners’ wealth, and maybe more if prices
drop more on the coasts.
Stocks
If the economy holds up for awhile, the market may very well
rally to new highs. The key question going forward is whether the
stock market has fully priced in the economic weakness we
expect. While additional economic weakness will lead to more
rate cuts, will the market weigh them more heavily than the rising
risk of recession? We think the market will sell off, once it
becomes apparent the economy is going to at least flirt with
recession.
We thought the rally in mid July was a gift to investors. We
advised selling into that rally, and for investors to become more
defensive. We thought the market was set up for a 10% decline.
We think the current rally is another gift. Even though the market
may rally to new highs, the upside potential is fairly limited. The
first warning sign will be if the S&P trades under 1490. Any
break below 1440 would be very negative. (The S&P did make a
new high, and topped on October 11 at 1576.)
6
One of the investment themes that gained traction in the fourth quarter of 2007 was that the rest of the world economy would ‘decouple’ from the U.S. and continue to grow. October 25, 2007 - ECONOMY If there is one overriding consensus regarding the economy, it is that global growth will save the
day. While global growth may help the U.S. avoid a recession, we wouldn’t describe 1.5% GDP
growth as boon times. As we pointed out in the August letter, consumer spending comprises 70%
of GDP, while U.S. exports represent only 12% of GDP. And, guess what, global growth is going
to slow during the next twelve months. As the U.S. slows, Americans will be buying fewer goods
made in China, Japan, and Europe. The Financial Times of London reports that the 13-nation
European Union purchasing managers’ index fell for the fourth straight month in October to its
lowest level in two years. More importantly, the European Central Bank reported that in their
quarterly survey of lending standards, 31% of the banks tightened credit standards in the third
quarter. That was up from 3% in the second quarter. Just as the tightening of credit standards in
January in the U.S. signaled a sea change in the growth of credit here, the third quarter survey by
the ECB signals that credit growth has already slowed in Europe. This will translate into slower
economic growth in Europe. This is a crack in the global growth story not yet recognized.
As we noted last month, as credit creation slows, consumer spending weakens and as investors
shun risk, the velocity of money slows down. The Fed is going to cut rates further, just to avoid a
recession. We don’t think investors fully realize how long economic growth is going to remain
sluggish.
Stocks
The Fed’s decision to cut rates by 50 basis points on September 18 suggests they appreciate the risk
to the economy. If credit growth slows too much, the Fed will be dealing with a weaker economy,
narrower profit margins, increasing layoffs, less consumer demand, recession, lower stock prices,
and lower home values. Not a pretty picture. The Fed will cut rates by 25 basis points on October
31. The stock market loved both of the rate reductions. Don’t expect the same reaction on October
31. Selling pressure will pick up quickly, once the rally falters under S&P cash 1535-1545. The
important question is whether the market holds support at 1490, which was cited last month and
tested on October 22 and 24. Sooner or later, we think the S&P will break below 1490, and quickly
drop to 1430–1450, maybe as soon as the end of November. (The S&P dropped to 1406 on
November 26.)
Many economists were heartened by the continued growth in non-farm payroll jobs throughout 2007. However, there were storm clouds on the horizon that most economists had overlooked. It began raining on January 4, 2008, when the Labor Department reported that non-farm jobs had declined in December 2007. With this jumpstart, the bear market of 2008 was launched.
November 19, 2007 - FEDERAL RESERVE
The headlines on November 3 proclaimed a gain of 166,000 jobs in October. But the household
survey recorded a decline of 211,000 in October. Year to date, employment growth in the

7
household survey is 80% weaker than last year. If the past is any guideline, the headline number
from the business survey won’t be so rosy in coming months. In 2000, a decline in temporary
employment began 10 months before a downturn in overall employment in 2001. Temporary
employment has dropped every month since February, although it did rise in October. The Labor
Department’s measure of the total number of hours worked in the economy was up 1.5% last
month versus October 2006. A year ago, the total number of hours worked was growing 2.6%. The
growth rate in this important measure of labor market strength has weakened 42% over the last
year. When the weakness in the household survey, temporary employment, and hours worked are
added together, it is clear that headline employment growth is going to weaken. The only question
is when the first negative number will be reported, not if.
In mid 2002, the Federal Reserve studied how the Bank of Japan had handled the onset of deflation
in Japan in the early 1990’s that resulted from a decline in real estate and stock values. The Fed’s
conclusion was that the Bank of Japan had erred in not pushing short term rates below the rate of
inflation. Once the inflation rate dropped below 0%, the Bank of Japan had lost its leverage to
prevent deflation from taking hold. With prices falling in Japan by 2% and short term rates at .15%,
the real rate was more than 2.0%, which was not accommodative. The Fed’s research into the Bank
of Japan’s experience led the Fed to lower the Federal funds rate below the level of inflation in
2002 and 2003. The Fed believed that by pushing ‘real’ rates into negative territory, the risk of
deflation could be minimized. In our opinion, the risk of deflation is higher now than in 2002, due
to the fall in home prices and the contraction in credit that could easily intensify in coming
quarters, if the economy slips into recession or the stock market weakens significantly in the
second half of 2008.
Stocks
Another test of 1490 is possible, since seasonality is favorable. However, the market is vulnerable
to a quick shake out to near the August low of 1370, if 1430 fails to hold. The news on the US
economy isn’t going to get better.
When someone says, “It’s different this time”, the Wall Street axiom is to run the other way as fast as you can. In December 2007, we explained why investors did not realize. “It really is different this time.”
December 16, 2007 - FEDERAL RESERVE
Despite the rate cuts by the Federal Reserve and other attempts to contain the credit market
tsunami, the economic engine of growth, credit creation, has stalled. More boats are being
swamped as the economy slows, which only increases the stress on the economy and banking
system. In the last 25 years, banks have made a concerted effort to move as much lending as
possible off their balance sheets, thus empowering the role of the market place to create credit. As
the market place has supplied a greater proportion of credit creation to finance growth for our
economy, the Federal Reserve’s capability to manage the credit creation engine has diminished.
During 2006 and the first half of 2007, investors were willing to buy securities with very low risk
premiums. Structured Investment Vehicles and other business models were extraordinarily
dependent on market provided financing, and assumed a never ending supply of liquidity would
always be available to fund their operations. This error in judgment, regarding risk and liquidity
was touched on by Alan Greenspan in 2005. “But what investors perceive as newly abundant
8
liquidity can readily disappear. Any onset of increased investor caution elevates risk premiums and
lowers asset values and promotes the liquidation of the debt that supported higher asset prices.
This is the reason that history has not dealt kindly with the aftermath of protracted periods of low
risk premiums.”
Although the Fed can still change bank reserve requirements and total bank reserves, the pass
through effect on total credit creation will be less than in the past, since the impact on the market’s
capability to create credit will hardly be affected. This has meant that interest rates have
increasingly become the Fed’s primary policy lever. During the $7 trillion dot.com bust, the Fed
could lower interest rates and provide support for the overall economy, since the banking and
market place’s capacity to create credit was fully functional. That is not the case in the current
environment, which is why this crisis is quite different than the other crises faced by the Fed in
the last 20 years
Stocks
The economy is going to weaken further in the first half of 2008. This will expose even more credit
problems, and there will be further deterioration in the housing market. It is going to take a fair
amount of time to work through all these problems, given the magnitude of this crisis. The market
has been able to hold up, as investors have believed global growth will help the U.S. avoid a
recession. Investors also want to believe that the Fed is up to the task of managing this crisis, as
they have in the past. If global growth falters, or investors begin to question whether the Fed is
behind the curve in forestalling a recession, the market will be vulnerable to a significant sell off.
Most investors really don’t understand the credit creation process, and as a result, don’t
comprehend the scope of this crisis, or the Fed’s limited ability to deal with it. It really is different
this time. (In four weeks, the S&P fell from 1498 to 1270 on January 23, 2008.)
2008
In the first quarter of 2008, the majority of economists believed the combination of fiscal stimulus and Federal Reserve rate cuts would result in a rebound in the second half of 2008. This forecast failed to recognize the serious impairment in credit creation.
March 24, 2008 - ECONOMY
One of the remarkable features of this credit crisis has been Wall Street’s and most economist’s
inability to recognize the magnitude of the problem, and their willingness to embrace each move by
the Fed as the solution to the credit crisis. What still remains under appreciated is how future
lending is going to be curtailed and how that is going to dampen future economic growth. The
consensus remains that the economy will rebound in the second half of 2008, with GDP
approaching 3% or more in 2009. The biggest headwind is the contraction of credit that has seized
up bank lending and liquidity in the credit market. Banks have increased their lending standards
substantially, and are not going to lower them, while they are booking more losses on mortgages,
home equity loans, credit cards, auto loans, and commercial real estate loans. Participants in the
credit market have increased their lending standards too. The Asset Backed Commercial Paper
market and Municipal Bond Auction market have ceased to function, and risk spreads on even high
9
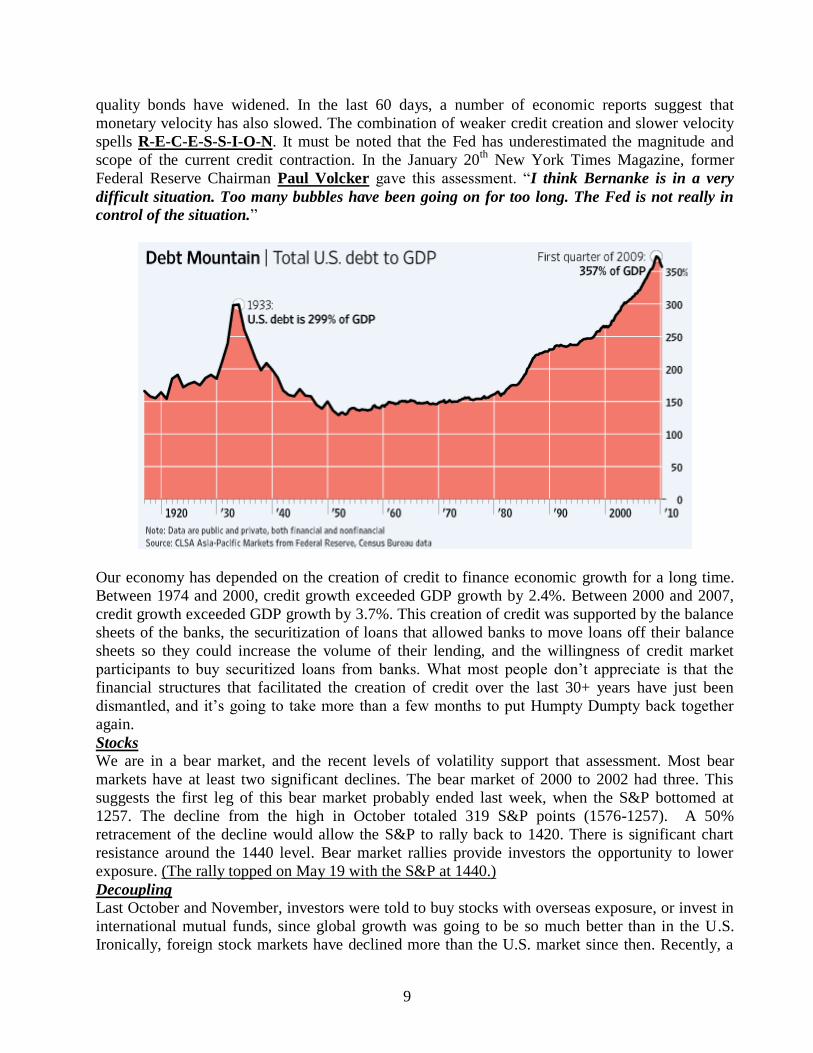
quality bonds have widened. In the last 60 days, a number of economic reports suggest that
monetary velocity has also slowed. The combination of weaker credit creation and slower velocity
spells R-E-C-E-S-S-I-O-N. It must be noted that the Fed has underestimated the magnitude and
scope of the current credit contraction. In the January 20th
New York Times Magazine, former
Federal Reserve Chairman Paul Volcker gave this assessment. “I think Bernanke is in a very
difficult situation. Too many bubbles have been going on for too long. The Fed is not really in
control of the situation.”
Our economy has depended on the creation of credit to finance economic growth for a long time.
Between 1974 and 2000, credit growth exceeded GDP growth by 2.4%. Between 2000 and 2007,
credit growth exceeded GDP growth by 3.7%. This creation of credit was supported by the balance
sheets of the banks, the securitization of loans that allowed banks to move loans off their balance
sheets so they could increase the volume of their lending, and the willingness of credit market
participants to buy securitized loans from banks. What most people don’t appreciate is that the
financial structures that facilitated the creation of credit over the last 30+ years have just been
dismantled, and it’s going to take more than a few months to put Humpty Dumpty back together
again.
Stocks
We are in a bear market, and the recent levels of volatility support that assessment. Most bear
markets have at least two significant declines. The bear market of 2000 to 2002 had three. This
suggests the first leg of this bear market probably ended last week, when the S&P bottomed at
1257. The decline from the high in October totaled 319 S&P points (1576-1257). A 50%
retracement of the decline would allow the S&P to rally back to 1420. There is significant chart
resistance around the 1440 level. Bear market rallies provide investors the opportunity to lower
exposure. (The rally topped on May 19 with the S&P at 1440.)
Decoupling Last October and November, investors were told to buy stocks with overseas exposure, or invest in
international mutual funds, since global growth was going to be so much better than in the U.S.
Ironically, foreign stock markets have declined more than the U.S. market since then. Recently, a
10
variation on the global growth story has emerged – decoupling. According to the decoupling
theory, the rest of the world is going to decouple from the U.S., as the U.S goes into a recession.
Last November, we thought the global growth story was tenuous. The U.S. is in a recession, most
of the countries in the European Union are growing less than 2% and are slowing, Great Britain is
slowing toward 1% GDP growth, and Japan is growing less than .5%. If 71% of world GDP is
slowing and only grows 1.5% or less in 2008, how and where is the decoupling going to take place?
Malaysia?
Despite mounting evidence to the contrary, most economists continued to believe that global growth would keep the U.S. out of recession.
May 21, 2008 - ECONOMY
The Federal Reserve has cut rates from 5.25% to 2.0%. It now accepts types of collateral from
commercial banks (asset backed securities rated AAA) that it never did previously, and is allowing
investment banks the same access as commercial banks for the first time in history. However, the
extraordinary increase in lending standards by the banking system is preventing the full impact of
the Fed’s liquidity from reaching the economy. Although borrowing costs are down, the banks have
increased their loan spreads, so the full benefit of the lower rates isn’t getting to the borrower. The
credit market has recovered somewhat, but the volume of new credit issuance is still depressed. The
reduced level of credit creation is going to hamper economic growth well into 2009.
Global growth has helped cushion the slowdown in the U.S. economy since last summer, as exports
have added about 1% to GDP. Without the gain in exports, the U.S. would have been in a
recession, irrespective of faulty government inflation estimates. However, global growth is
slowing, so exports won’t provide any additional strength in this year’s second half, and may slow.
China’s central bank has increased bank reserve requirements three times this year, which will slow
lending. In April, the Bank of India also increased reserve requirements. Less lending will slow
growth in China and India. Last week, the European Central Bank released its lending standards
survey in the 15-nation Euro zone. It showed that European banks are tightening lending standards,
while demand for loans from companies is slowing sharply. Approximately 40% of the banks
tightened lending standards, and 28% of the banks reported weaker loan demand. Even though the
ECB has kept rates steady in recent months, the increase in lending standards represents a
tightening of monetary policy by the banks in the EU. The decline in loan demand suggests the
slowdown in the 16 countries in the EU is broadening and deepening.
Stocks
We think the economy is going to struggle more than the consensus, which expects the economy to
rebound in the second half. If there are more credit related problems as we think likely, the rally
from the March low was a nice bear market rally. As we wrote in both the March and April letters,
bear market rallies provide investors the opportunity to lower exposure, so doing some selling
when the S&P trades between 1420 – 1440 is a good idea.
(The rally topped on May 19 with the S&P at 1440.)
The bursting of the housing bubble also popped the credit bubble which has been inflating for decades. The majority of economists and strategists did not recognize this connection, and underestimated its impact on an overleveraged financial system.
11
July 26, 2008 - ECONOMY
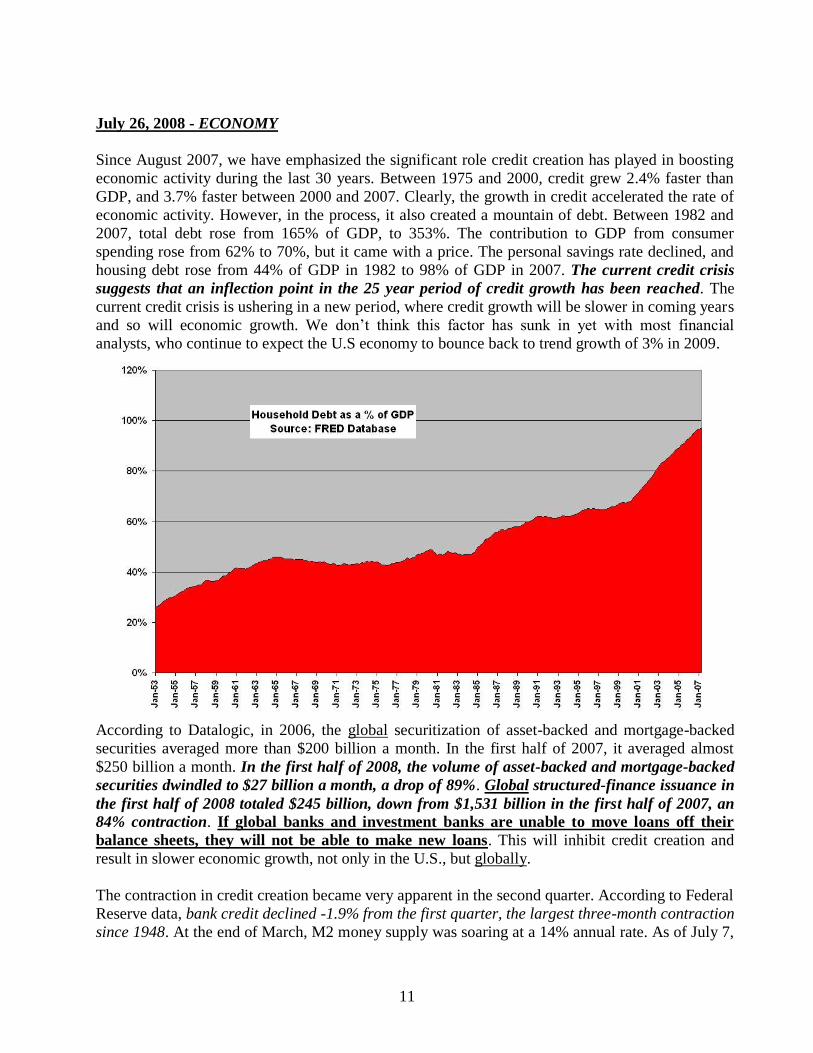
Since August 2007, we have emphasized the significant role credit creation has played in boosting
economic activity during the last 30 years. Between 1975 and 2000, credit grew 2.4% faster than
GDP, and 3.7% faster between 2000 and 2007. Clearly, the growth in credit accelerated the rate of
economic activity. However, in the process, it also created a mountain of debt. Between 1982 and
2007, total debt rose from 165% of GDP, to 353%. The contribution to GDP from consumer
spending rose from 62% to 70%, but it came with a price. The personal savings rate declined, and
housing debt rose from 44% of GDP in 1982 to 98% of GDP in 2007. The current credit crisis
suggests that an inflection point in the 25 year period of credit growth has been reached. The
current credit crisis is ushering in a new period, where credit growth will be slower in coming years
and so will economic growth. We don’t think this factor has sunk in yet with most financial
analysts, who continue to expect the U.S economy to bounce back to trend growth of 3% in 2009.
According to Datalogic, in 2006, the global securitization of asset-backed and mortgage-backed
securities averaged more than $200 billion a month. In the first half of 2007, it averaged almost
$250 billion a month. In the first half of 2008, the volume of asset-backed and mortgage-backed
securities dwindled to $27 billion a month, a drop of 89%. Global structured-finance issuance in
the first half of 2008 totaled $245 billion, down from $1,531 billion in the first half of 2007, an
84% contraction. If global banks and investment banks are unable to move loans off their
balance sheets, they will not be able to make new loans. This will inhibit credit creation and
result in slower economic growth, not only in the U.S., but globally.
The contraction in credit creation became very apparent in the second quarter. According to Federal
Reserve data, bank credit declined -1.9% from the first quarter, the largest three-month contraction
since 1948. At the end of March, M2 money supply was soaring at a 14% annual rate. As of July 7,

12
M2 growth was barely positive, at +.4%. According to an analysis of Federal Reserve data by
Goldman Sachs, commercial bank lending declined more than 9% between June 30, 2007 and June
30, 2008. Even though the Federal Reserve has slashed rates from 5.25% to 2%, and pumped
hundreds of billions of dollars into the banking system, the balance sheets of large banks are so
burdened, and the credit market is so dysfunctional the net effect is a tightening of monetary
policy. As we noted months ago, the availability of credit is far more important than the price of
credit. Right now availability is strained, and rates on mortgages are higher.
As we cautioned in the August 2007 letter, “If the stock market declines meaningfully, while
housing prices continue to deflate, the impact on the balance sheets of many consumers would be
negative. The record high level of debt carried by many consumers is supported by real estate and
equity prices. A simultaneous decline in both asset classes could pose a considerable challenge for
the Federal Reserve. The one bubble the Federal Reserve cannot allow to burst is the credit
bubble.” Unfortunately, the contraction in bank credit and the collapse in M2 money supply growth
in the second quarter, coupled with the 80%+ decline in issuance of global securitization of
syndicated loans and global asset-backed and mortgage-backed securities over the last year,
indicates that the credit bubble is deflating.
Stocks
Since last fall (2007), many analysts have recommended buying stocks with international exposure,
since the rest of the world would simply “decouple” from the U.S., providing a safe haven for
investors. In effect, the engines of global growth – Brazil, Russia, India and China – would release
the caboose (U.S.) from the growth train, and merrily keep on truckin’. A number of months ago,
we suggested that a slowdown in the global economy was likely to become far more apparent in the
third quarter, since that was 6 to 9 months after the sharp deceleration the U.S. experienced in the
first quarter. This means that companies with international exposure are going to be facing earnings
pressure in the next six months. The next shoe to drop is the realization that the earnings of non-
financial and internationally exposed companies are going down. In a real bear market, there is no
place to hide. If the S&P manages to rally to 1310-1325, it will present another opportunity to
lighten up. (The S&P reached 1310 on August 11.)
On the eve of the collapse of Lehman Brothers, the consensus view was that the U.S. economy would not experience a recession, even though it had begun in December 2007. Despite extraordinary actions by the Federal Reserve, the contraction in credit was accelerating.
August 23, 2008 – FEDERAL RESERVE
In our September 2007 letter we used the metaphor of a tsunami to describe the convulsion that
swept through the credit markets in August 2007. There is the perception that a tsunami is a single
giant wave of water that sweeps away everything in its path once it reaches land. As financial
market participants have painfully learned over the past year, a tsunami is actually a series of giant
waves, each one causing more destruction.
What most financial experts have failed to appreciate is that the current credit crisis has been
building for 25 years. The last 25 years have been a glorious period of economic growth in the
United States. There have only been two shallow recessions, each lasting 8 months. As we have
13
noted many times over the last year, this remarkable period of growth was facilitated by credit
creation. Between 1975 and 2000, credit grew 2.4% faster than GDP growth, and 3.7% faster from
2000 to 2007. In the process, debt as a percent of GDP ballooned from 165% to 353%. The
enormous expansion in debt was made possible by a decline in inflation, a fall in short term interest
rates from 21% in 1981 to 2% today, and a fall from 15% to 4% on longer term Treasury bonds.
The decline in the cost of money launched a secular bull market in the stock market, with the DJIA
rising from 780 in 1982 to 14,200 in 2007. Since monthly payments are determined by the cost of
credit, lower interest rates made it possible for consumers to carry an ever increasing amount of
debt. Consumer debt as a percent of GDP has soared from 44% in 1982 to over 100% today.
One of the most dangerous experiences a pilot can face is if his airplane rolls into a spiral decline.
As the plane falls and begins to spin, the pilot loses orientation, which makes it difficult to regain
control. As the plane falls, it gains air speed, making it even more difficult to pull out of the spiral.
The pilot usually has less than 30 seconds to make all the correct decisions. If he doesn’t, the
airplane gains so much downward momentum, it becomes impossible to pull out of the spiral.
Pilots refer to this as a ‘death spiral’. The Federal Reserve has done everything it can to reflate the
deflating credit bubble, and we’re sure they will be forced to do even more in coming months, since
the plane they are piloting is still spinning and falling.
Stocks
Since the July 15 low in the stock market, Wall Street has a new investment theme, which is to
avoid international stocks, since the global economy is slowing. Their belief is that since the U.S.
was the first one into this slowdown, we’ll be the first one out, especially since the Fed has cut rates
so much and the other central banks haven’t even started cutting. The best thinkers on Wall Street
believe the best way to cash in on this new theme is to buy small cap stocks, since they aren’t
dependent on international sales. There are several problems with this advice. Small cap stocks may
not be dependent on international sales for growth, but they are dependent on the economic
environment in the U.S., which is likely to be hostile. Even strong small companies need bank
financing to finance their growth. As noted, bank lending standards are at record high levels for
small companies, so getting financing is going to remain difficult for some time. Last week, the
National Federation of Independent Business reported that the percent of small companies that plan
to increase capital expenditures was the lowest since 1975. Small cap stocks have maybe 5% upside
potential, but they could fall more than 20% from current levels.
The stock market is in a cyclical bear market that did not end on July 15. Last month, we suggested
a rally to 1310-1325 would present another opportunity to sell. So far the high is 1313. Sooner or
later, the Treasury is going to nationalize Fannie Mae and Freddie Mac. Nationalizing the GSE’s
will not reflate the credit bubble, or prevent housing prices from falling further.
The securitization of mortgages and auto loans played a significant role in keeping the 2001 recession short and shallow. As noted in December 2007, the securitization markets were providing more credit creation than the banking system, and the Fed had no control over the securitization markets. When they collapsed in 2008, the Federal Reserve and Treasury Department were hamstrung.
14
September 23, 2008 - ECONOMY
When desperate men take desperate actions, we can be certain there will be unintended
consequences. Treasury Secretary Henry Paulsen and Federal Reserve Chairman Ben Bernanke
have launched the largest ‘Hail Mary’ pass in our nation’s financial history. By the time this
financial football finishes its flight toward the end zone, how our financial markets function will be
remade, the level of government involvement will be ratcheted up, the role of individual
responsibility and freedom will be diminished, and the influence of capitalism throughout our
economy will be less. There appears to be bipartisan agreement that the play called by Paulsen and
Bernanke wasn’t just necessary, but unavoidable. But that is why every last second, desperate Hail
Mary pass is attempted.
Since March 2007, we have chronicled why we thought the brewing credit crisis was far bigger
than most investment professionals realized. Whenever the stock market reversed higher after an
intervention by the Fed or Treasury (August 2007, January 2008, March 2008, and July 2008) the
majority of investment strategists remained bullish, since they haven’t understood the primary
underlying problem – a progressive contraction in credit creation. During the deflation threat
posed in 2001 and 2002 by the loss of $7 trillion in stock market wealth, credit creation was never
impaired. In the wake of 9/11, the automakers could offer 0% financing, since the capability to
securitize every auto loan was possible. This kept assembly lines humming, all the workers
associated with the production of motor vehicles working, and current on their mortgage, credit
card, and personal auto loan payments. As the Fed lowered interest rates to reduce the risk of
deflation, consumers were able to refinance their existing mortgage, lowering their monthly
payments and increasing their disposable income. Lower rates also made housing more affordable,
so many other consumers could afford to buy their first home, which boosted construction activity
and jobs. All this related housing activity was made possible because the capability to securitize
every refinanced and new home loan was never impaired.
Stocks
In late July we were included in an article in the San Diego Union entitled “Five Experts’ Advice
for Tough Times.” July 29, 2008--San Diego Union Tribune: In that article, we stated we were in a
bear market, and thought the DJIA would decline to 8,000. (The DJIA was 11,500 at the time).
Now that the S&P has traded down to 1135, and we have The Plan waiting in the wings, it is worth
asking if the bear market is over. Given the poor outlook for the economy and credit creation, we
don’t think this cyclical bear market is over.
The ratio of median homes prices to median incomes stretched from 3 to 1 to 4.6 to 1 in 2006, 50% above its long-term average. The Federal Reserve, nor the rating agencies (S&P, Moody’s, Fitch), average home owner, SEC, FDIC, or the Wall Street investment banks, who used 30 to 1 leverage, recognized that home prices would eventually regress to the mean, and decline at least 30% in the process.
15
November 19, 2008 - ECONOMY
Whenever we are asked how we got into this mess, we explain how the long term relationship
between median income and median homes prices played a significant role. Between 1965 and
2000, the median home price held around 3 times median household income. When the median
annual income was $30,000, the median home sold near $90,000. As incomes increased, home
prices appreciated accordingly, which meant homeowners’ ability to pay their mortgage on time
was on a firm foundation and stable. In 2000, median household income was $42,500, and the
median home price was $140,000. From 2000 until 2006, that ratio shot up to 4.7. Although median
household income had grown 13% to $48,200 in those six years, the median home price had shot
up to $240,000 by the end of 2006, an increase of more than 70%. With income levels lagging so
far behind home prices, and the cost of financing on the rise, the risk of a nationwide decline in
median home prices had also increased markedly. But the rating agencies never incorporated
this dynamic into their risk evaluations. Fannie Mae and Freddie Mac, banks, and mortgage
brokers, all kept funding mortgages, and selling them to Wall Street for securitization. More than
$2 trillion of mortgage backed securities have been sold by Wall Street. No industry strives to
satisfy an insatiable appetite like Wall Street. If investors are clamoring for a product, whether it is
an IPO for a technology start up, or a sliced and diced mortgage pool, Wall Street will create
enough product until investors choke on it. Investors simply ignored the many signs of a housing
bubble, and just kept buying. Everyone in the credit creation and securitization process made
billions of dollars, until the music stopped. With many firms using leverage of 30 to 40 to 1, it
didn’t take much of a drop in home prices to wipe out, or seriously impair the capital base of
everyone involved.
Stocks If the DJIA drops below 7,882, traders should look for an entry. Needless to say, with the VIX
above 70, this is not for the feint of heart. Where ever you choose to go long, use DJIA 7,200 as a
stop, and raise the stop to the DJIA low, if the DJIA climbs above 8,200. (The DJIA fell below
7882 and bottomed at 7507 on November 20. The S&P was trading between 748 and794.)
2009
Most consumers are facing a daunting challenge in coming years. They need to pay down debt, so the ratio of household debt to GDP is significantly lowered from 98%. With home values down by almost 30%, the need to increase savings is an imperative, especially for baby boomers who were counting on their home value to fund a portion of their retirement. These needs are going to cause a philosophical shift in consumer’s attitudes toward spending.
January 19, 2009 - ECONOMY
As we discussed in April 2008, one of the secular trends we expected to develop was an increase in
the savings rate. Many baby boomers had planned on their home equity to fortify their retirement
plans, and the significant decline in home prices was an unexpected shock. The decline in home
values and the stock market has wiped out around $12 trillion in assets, or more than 20% of
consumer wealth. Household debt as a percent of GDP has climbed from 44% in 1982 to 98% in
16
2007, limiting future economic growth from debt accumulation. With home prices not likely to
rebound anytime in the next few years, many Americans are being smacked with a very unpleasant
thought – “Oh, my gosh, we’re going to have to start saving!” What’s good for the soul is not
necessarily good for the economy. For the first time since the Federal Reserve began tracking it in
1952, household debt fell in the third quarter of 2008. And, not surprisingly, the savings rate has
started to climb. If the savings rate increases from 2% to near 8% over the next 3 years, annual
GDP will be 1.25% weaker, than when we were a country of happy spendthrifts.
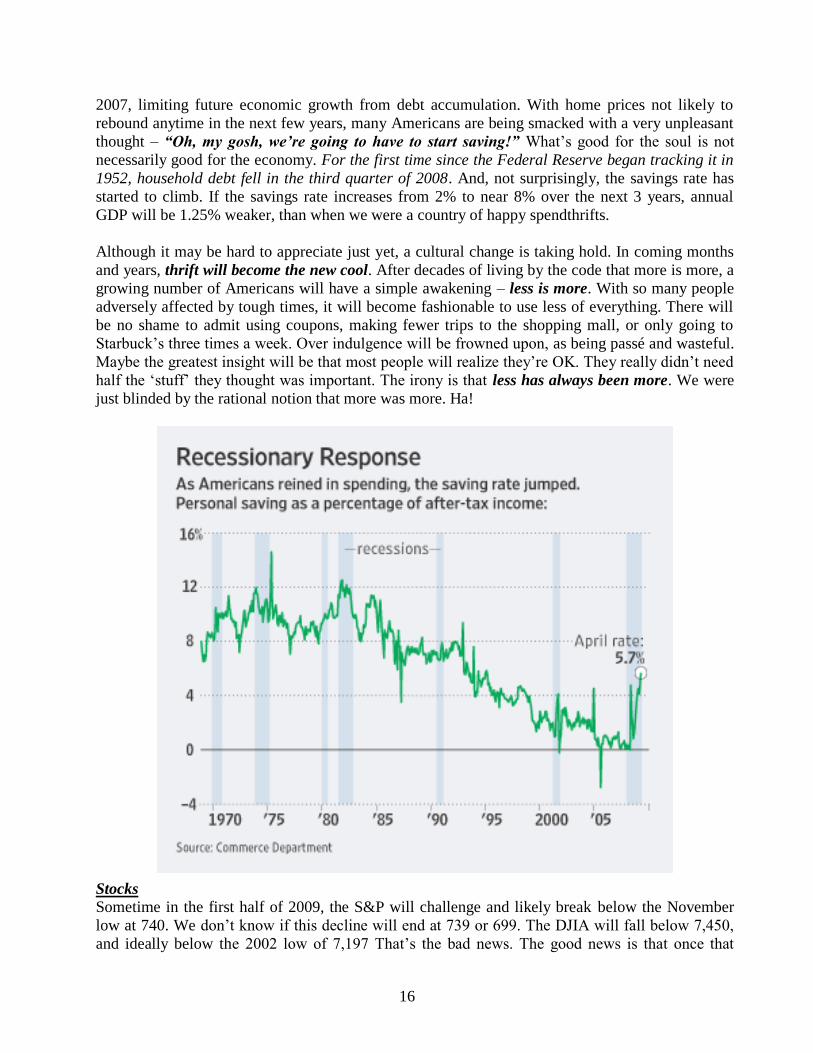
Although it may be hard to appreciate just yet, a cultural change is taking hold. In coming months
and years, thrift will become the new cool. After decades of living by the code that more is more, a
growing number of Americans will have a simple awakening – less is more. With so many people
adversely affected by tough times, it will become fashionable to use less of everything. There will
be no shame to admit using coupons, making fewer trips to the shopping mall, or only going to
Starbuck’s three times a week. Over indulgence will be frowned upon, as being passé and wasteful.
Maybe the greatest insight will be that most people will realize they’re OK. They really didn’t need
half the ‘stuff’ they thought was important. The irony is that less has always been more. We were
just blinded by the rational notion that more was more. Ha!
Stocks
Sometime in the first half of 2009, the S&P will challenge and likely break below the November
low at 740. We don’t know if this decline will end at 739 or 699. The DJIA will fall below 7,450,
and ideally below the 2002 low of 7,197 That’s the bad news. The good news is that once that

17
decline is over, the market will enjoy the largest rally since the bear market began in October 2007.
It will be ignited by economic statistics showing that the rate of decline in the economy is getting
less bad. The optimists will jump to the conclusion that less bad equals recovery. (The S&P fell
below 740 on February 27 and bottomed on March 6 at 667.)
Stocks
Sometime in the first half of 2009, the S&P will challenge and likely break below the November
low at 740. We don’t know if this decline will end at 739 or 699. The DJIA will fall below 7,450,
and ideally below the 2002 low of 7,197 That’s the bad news. The good news is that once that
decline is over, the market will enjoy the largest rally since the bear market began in October 2007.
It will be ignited by economic statistics showing that the rate of decline in the economy is getting
less bad. The optimists will jump to the conclusion that less bad equals recovery. (The S&P fell
below 740 on February 27 and bottomed on March 6 at 667.)
February 17, 2009 - ECONOMY
The collapse of the banking system and almost complete breakdown of the securitization markets
represent a structural fissure in the credit creation process. What many economists and investment
professionals have failed to understand is that there is no easy or quick fix. By their nature,
structural problems take years to repair, not just a few quarters. Unfortunately these are not the
only structural problems challenging policy makers. As discussed in the April 2008 letter,
household debt as a percent of GDP has climbed from 44% in 1982 to 98%. The ratio of total credit
to GDP has more than doubled, rising from 165% to 353%. As debt levels were growing over the
last 26 years, GDP grew as consumers used debt to buy homes, cars, vacations, and lots of ‘stuff’.
With GDP now falling, the burden of these debt loads is growing, without the benefit of economic
growth. The decline in home values is making mortgage debt more onerous, as the ratio of equity
to home prices continues to sink to all time lows. The next secular period of economic growth will
need the ratios of total debt and household debt to GDP to be lower than they are today. This will
require a painful adjustment, either from forced debt liquidation, or an extended period of reduced
consumer spending and borrowing. If the ratios of debt are lowered from forced debt liquidation,
the odds of a depression will increase. And we are going to have some forced debt liquidation. But
if the adjustment comes more from consumers embracing the less is more philosophy we discussed
last month, the economy will be lousy for years, but not dreadful. This is a longer term structural
problem that will not be solved with one stimulus package.
According to the Bureau of Economic Analysis, state and local spending grew 34% between 2003-
2007, while inflation rose 19%, and population grew just 5%. Since 1998, state and local budgets
have almost doubled to $2 trillion, with debt increasing from $1.4 trillion to $2.23 trillion in 2008.
According to the Census Bureau these figures do not include the nearly $1.5 trillion in unfunded
health and pension liabilities. States have been living large, but that’s going to change. With tax
revenues from sales taxes, personal taxes, and real estate falling, states are facing a $200 billion
short fall that will force many states to raise taxes and fees and cut services. Although the stimulus
plan will cushion some of the pain that states are experiencing, many states must learn in coming
years how to operate in a world far different than the spending spree years of the past decade.
18
Stocks
Not much has changed since last month’s letter. “Sometime in the first half of 2009, the S&P will
challenge and likely break below the November low at 740. we don’t know if this decline will end at
739 or 699. The DJIA will fall below 7,450, and ideally below the 2002 low of 7,197. That’s the
bad news. The good news is that once that decline is over, the market will enjoy the largest rally
since the bear market began in October 2007. It will be ignited by economic statistics showing that
the rate of decline in the economy is getting less bad. The optimists will jump to the conclusion that
less bad equals recovery.” (The S&P fell below 740 on February 27 and bottomed on March 6 at
667.)
Although GDP will give the appearance of a V-shaped recovery, the structural and secular headwinds will make it difficult for a self sustaining recovery to take hold.
May 22, 2009 - ECONOMY
As noted in the March and April letters, there is a good chance that GDP will post a positive print
in the fourth quarter of this year, and maybe in the third quarter. However, the most important
issue in the next 12 to 15 months is whether the rebound in the second half of 2009 and first half
of 2010 will gain enough traction to launch a self sustaining economic recovery. The short
answer is no one knows. What we do know is that the drag to GDP from housing, inventories, and
exports will be less in coming quarters. And, with the push coming from the stimulus plan, there
will be a positive GDP print in the fourth quarter, if not the third quarter. Although most of the
‘growth’ will be statistical nonsense (less bad confused as actual growth), most economists will be
satisfied since they assume that an increase in GDP automatically means a lasting recovery will
follow. This view overlooks the many cyclical and secular hurdles that collectively threaten to
transform the U.S. economy in coming years.
The combination of all the cyclical issues is daunting. The extraordinary weakness in the U.S. labor
market will pressure consumer spending well into 2010. The record level of excess capacity will
narrow profit margins, delay and limit companies’ need to increase business investment, and
restrain hiring. The banking system, from large banks down to community banks, will remain
stressed through 2010, which will limit the availability of credit and result in higher lending rates.
States will be forced to lower their spending and raises taxes, which will offset a portion of the
federal fiscal stimulus plan. And the synchronized nature and depth of the global recession means
there is no place to hide. Although China and India are in far better shape, they represent less than
10% of world GDP.
Stocks
Since we expect GDP to turn positive in the fourth quarter, my expectation has been that the rally
from the March low would take an up, down, up form. The down portion likely began after the
S&P reached 930 on May 8. We had thought the S&P might have a quick rally to 940 once it
closed above 878. A ‘normal’ pull back would bring the S&P down to 830-850. Anything much
deeper will depend on a pickup in selling pressure. After this correction, the market should rally as
investors refocus on the potential of GDP turning positive later this year. However, the next few
weeks could be a bit tricky, since we believe the economy remains in worse shape than the V-shape
crowd realizes. In recent weeks there has been virtually no selling pressure. This has been a bit
surprising, but underscores how convinced institutions are in the second half recovery story.
19
The coming recovery will be far weaker than prior recoveries.
July 22, 2009 - ECONOMY
In tracking the end of a recession, the National Bureau of Economic Research (NBER) is merely
identifying when the economy in aggregate reached its lowest point. It tells us virtually nothing
about the quality and strength of the recovery that follows the trough. In the three worst recessions
since World War II (1957-1958, 1973-1975, 1981-1982), real GDP (nominal GDP less inflation)
averaged 5.6% in the first full calendar year after the recession ended. If measured from the trough
of those recessions, real GDP growth averaged 7.8%. The coming recovery will be far weaker than
prior recoveries. Those recessions were precipitated by the Federal Reserve increasing rates
enough to significantly slow economic growth, causing a buildup of inventories, a reduction in
production to pare inventory levels, and an increase in unemployment. Since the higher cost of
money negatively impacted demand for homes and cars, pent up demand was unleashed as soon as
the Federal Reserve lowered interest rates, which launched a strong self sustaining recovery.
The current recession was precipitated by the largest global financial crisis in history, not by a
large increase in interest rates. The collapse in credit creation has resulted in the deepest
synchronized contraction in global trade and economic growth since the 1930’s. The depth of this
recession, and commensurate increase in unemployment, and declines in business investment and
trade, has made this financial crisis worse and more protracted. The magic elixir of lower rates,
which spurred the strong recoveries after the 1957-1958, 1973-1975, and 1981-1982 recessions, has
proven a placebo. Lower rates have helped, but the demand for housing and cars has collapsed, so
there is no pent up demand for the recovery to draw upon. The banking system remains crippled.
Lending standards are very high for most forms of credit, credit availability remains restrained, and
the volume of securitized credit is still off by more than 80%.
Although government stimulus spending will give the economy a lift into the first half of 2010,
consumer spending will remain weak, as the unemployment rate breaches 10%, and the
underemployment rate flirts with 20%. Business investment will be retarded by excess capacity,
and a cost control mindset by executives. Spending by states is going to be weak certainly by
historical standards. We’re going to get what looks like a V-shaped recovery in GDP, and it will
pack the nutritional value of a Twinkee.
Stocks
Short term the market is overbought and near the resistance at 956, so a pull back to 920-930 is
likely. After this pullback, the next rally should break above 960 and carry the S&P up to 1007,
which was the November 4, 2008 high. (The S&P climbed above 1007 on August 7.)
Our approach combines both fundamental analysis and technical analysis, which is unusual. Most economists and market strategists rely almost exclusively on fundamental analysis, which focuses on the economy and estimates for corporate earnings. Technical analysis utilizes measures of price momentum, moving averages, and charts of the major market indices like the DJIA and S&P 500. We believe the combination of both disciplines is better, since each provides a different perspective. The probability is higher that my analysis is on target, when the

20
fundamentals and technical indicators are aligned, especially at major turning points in the economy and stock market. This was the case when the market was topping between July and October 2007, and bottoming in February and March 2009.
August 26, 2009 - HOW TECHNICAL ANALYSIS CAN IMPROVE FUNDAMENTAL ANALYSIS
Most of the economists who saw the housing crisis coming turned negative on the economy and
stock market in 2006. Although housing was clearly rolling over, technical indicators of the stock
market’s health uniformly showed that the uptrend in the stock market was intact. Throughout
2006, the advance/decline line continued to make higher highs after every decline. Companies were
buying enormous quantities of their own stock and private equity firms were using cheap credit to
take over a record number of firms. In total, almost 5% of the supply of existing shares was
absorbed thru buybacks and takeovers. As we noted numerous times throughout 2006, this was a
very supportive supply/demand dynamic at work. This underlying demand was not met with much
selling since the economy was in good shape.
There were numerous warning flags in the second half of 2007 and first half of 2008 of the
impending crisis that the majority of economists failed to see. The most significant warning flag
was not understanding that the Federal Reserve was going to be far more limited in dealing with
this crisis. Had these economists incorporated a measure of technical analysis into their
fundamental views, they would have seen how technically weak the market was as it was making
new all time highs in October 2007. The advance/decline line was noticeably lower than in July
2007. They would have also seen how the market broke down in January 2008, which suggested
their sanguine view of the economy was on shaky ground.
As the stock market was plunging to new lows in early March 2009, every measure of market
momentum was not nearly as oversold as they were in November. This suggested that selling
pressure was lessening. In addition, the economic stats had gotten so bad; they had to get less bad
given all the fiscal and monetary stimulus. Putting these two pieces together made it possible for
me to anticipate the largest rally since the October 2007 top. (January, February 2009)
Since we won’t know for a number of months whether a self sustainable recovery is at hand, or a
double dip, combining technical analysis with fundamental analysis could prove valuable, as it did
in October 2007 and March 2009. At some point, the stock market and economy will come to an
inflection point, and the economy will have to deliver on the expectations for a recovery. As long
as the advance/decline line and other measures of market momentum remain strong, corrections
will likely be confined to a range of 4% to 7%.
Stocks
After pausing between August 4 and August 20, the S&P has pushed to 1037. On a short term
basis, our Intermediate Trend indicator is below its August 10 high, even though the S&P has
moved higher. This also happened between the early May peak and June high, and led to the
correction into early July. This ‘divergence’ suggests the market is close to a pullback, likely down
to the 980 to 1000 level, before another push above 1037. The high on October 14, 2008 was 1044,
so this is the next target. (The S&P moved above 1044 on September 10.)
21
Traditional asset allocation assumes that diversification alone provides all the risk management needed for most investors to reach their investment and retirement goals. However, traditional asset fails to preserve capital during large market declines, and especially during secular bear markets, as investors have learned since 2000. Given the structural problems we are facing, the stock market could struggle for another four to six years.
October 18, 2009 - LONG TERM STABILITY OR INSTABILITY?
From a historical perspective, visualize a pendulum that oscillates between stability and instability,
with each period reaching an extreme after 15 to 20 years. The period of stability that ended in
1966 was heralded with the political phrase “The Great Society”. The ensuing 16 years were many
things, but few would describe it reflective of a Great Society or stable. The next period of stability
began in 1981-1982, probably reached its extreme as investors embraced the ‘New Paradigm’ in
1999, and bid technology stocks to absurd valuations. In response to the bursting of the tech
bubble, the Federal Reserve aggressively lowered interest rates to keep the economy from
deflating. Ironically, the extended period of economic stability between 1982 and 2000 encouraged
market participants to take on highly leveraged risks, even as the pendulum was already swinging
away from stability toward instability. This new 15 to 20 year period of instability began in 2001
or 2007, but it did not end in March 2009. Why do investment professionals advise their clients to
simply buy and hold, whether we are in a period of stability or instability?
The next potential challenge within the current period of instability will develop in the next six to
nine months, as the U.S. economy will: A) smoothly transition into a self sustaining economic
expansion, B) experience a modest dip, with GDP growth sagging to around 1% to 1.5% before
reaccelerating, C) experience a more pronounced dip lasting up to two quarters with one quarter of
GDP near 0% before rebounding, D) perform a flawless one and one-half gainer after the V-shape
recovery stalls and go to hell in a hand basket. The correct answer to this question is important
since the financial markets will obviously respond accordingly.
Stocks
The overall technical health of the market is in good shape. The advance/decline line is making
new recovery highs along with market averages, and the daily number of stocks making new highs
continues to expand. Last week 802 stocks made new 52 week highs. This suggests that the 1 to 3
month outlook remains
constructive.
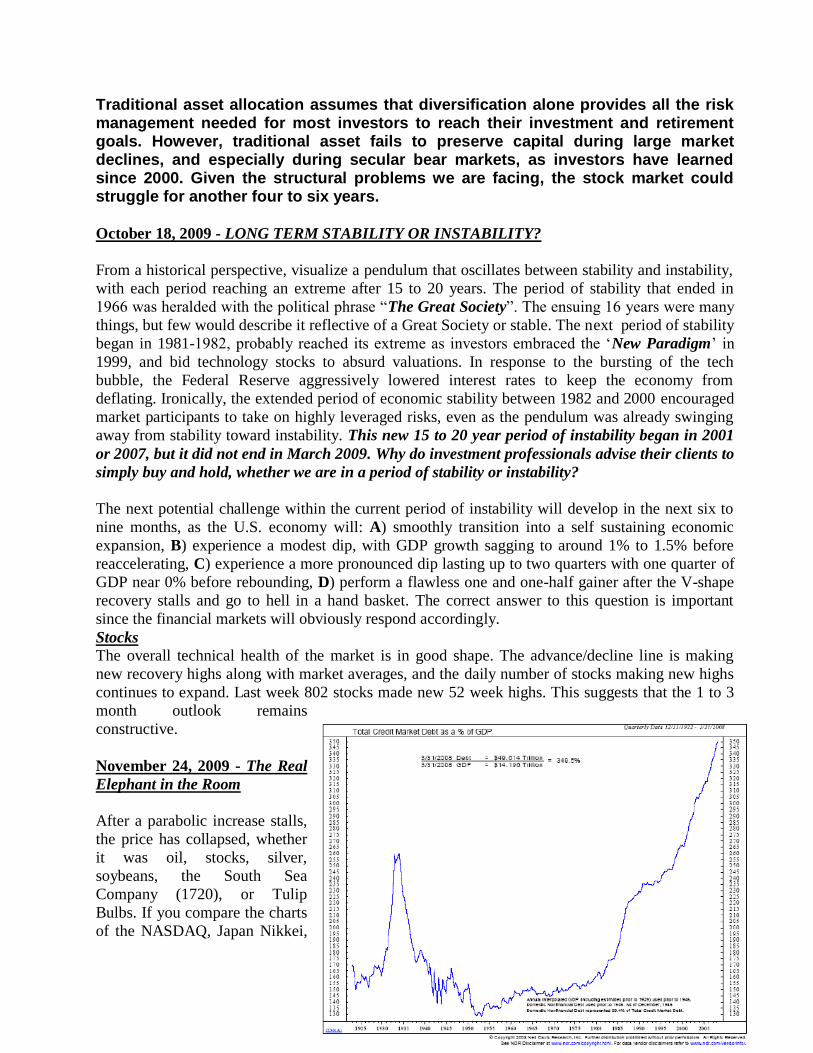
November 24, 2009 - The Real
Elephant in the Room
After a parabolic increase stalls,
the price has collapsed, whether
it was oil, stocks, silver,
soybeans, the South Sea
Company (1720), or Tulip
Bulbs. If you compare the charts
of the NASDAQ, Japan Nikkei,
22
South Sea Company and Tulip Bulbs to the following chart, the parabolic increase is clearly
evident. The only difference is that the collapse in price after the parabolic stalls has not begun. The
Federal Reserve has and will continue to do everything it can to prevent a collapse, since this chart
is the ratio of total debt to GDP. Since 1982, this ratio has soared from $1.65 of debt to $3.70 of
debt for each $1.00 of GDP. Over the last 12 months, as consumer borrowing has declined, Federal
government debt spending has expanded rapidly, which has pushed the ratio even higher. This is
unsustainable. But there is no easy or painless solution.
In order for the ratio of debt to GDP to stabilize, GDP must grow faster than the growth in debt.
This has not happened in the last 30 years. A good portion of GDP growth since 1982 came from
the increase in debt, which means GDP growth will on average be lower, without the debt steroids
of the past 25 years. Slower economic growth in coming years will generate less tax revenue for all
levels of government, which will force most states to raise taxes. The Federal government is
expected to run $1 trillion deficits for a number of years, which will cause the debt to GDP ratio to
continue to rise. At some point, the Federal government will be forced to increase taxes on anything
that moves, including the middle class. Higher state and Federal taxes will reduce disposable
personal income, which will already be growing more slowly due to weaker overall GDP growth.
Shrinking disposable income will make it more difficult for stretched consumers to service and pay
down existing debt, resulting in an increase in the number of consumers who are forced to default
on their debts.
Stocks
Since peaking in mid October, the internal strength of the market continues to weaken. On October
14, 462 stocks made a new high. That dropped to 318 on November 16, and 190 on November 23,
even as the DJIA has pushed almost 4% above its mid October high. The Russell 2000 has made a
series of lower peaks, and is 5% below its October high. These statistics show that fewer stocks are
participating in the advance, which is often a fairly reliable precursor of a market decline. A close
below 1080 on the S&P should confirm that a short term top is in, with a decline to 1030 likely to
follow. Given the technical deterioration in the market, the largest decline since the March low is
likely. The only caveat is that seasonality is a positive going into year end.
(The S&P held support at 1080.)
The recovery should continue in the first half of 2010. December 22, 2009 - ECONOMY
As we enter 2010, the largely statistical recovery to date should strengthen, and include more gains
from inventory accumulation, fiscal stimulus, and an irregular improvement in job growth. The loss
of only 11,000 jobs in November likely overstated the near term health of the labor market, but
there were other positives signs. Temporary employment changes are a good leading indicator, and
in November, temporary jobs increased 52,400, the fourth consecutive month of gains. The
workweek rose to 33.2 hours from a record low of 33.0 hours, and overtime hours also increased.
As noted previously, job growth of 125,000 is needed to reduce the ranks of unemployed workers,
and could appear by the end of the first quarter.
Stocks
In our Special Update on December 8, we noted the following. “On November 11, the S&P
reached 1105.37. Since then, the S&P has traded in a fairly tight range between 1085 and 1,115,

23
with a couple of very brief spikes to 1117 and 1119. The price pattern since November 11 appears
to be forming a five point (a, b, c, d, e) expanding triangle. Today’s drop below Friday’s low of
1096 could be providing the finishing touch to wave e of the expanding triangle. Unless the S&P
closes below 1080, which has been my expectation, the completion of the triangle implies that the
market will rally above the resistance around 1115. This rally would have the potential to reach
1145 to 1165. (The S&P exceeded 1115 on December 21 and climbed to 1150 by mid January.)