MSME TRAINING SERIES #03: Energy Efficiency Approach ...
158
MSME TRAINING SERIES #03: Energy Efficiency – Approach, Opportunities and Technology 28 th January 2021| 3 PM – 5:15 PM IST Supported by: Image credit: Surya Prakash/unsplash
Transcript of MSME TRAINING SERIES #03: Energy Efficiency Approach ...

MSME TRAINING SERIES
#03: Energy Efficiency – Approach, Opportunities and Technology
28th January 2021| 3 PM – 5:15 PM IST
Supported by:
Image credit: Surya Prakash/unsplash

INTRODUCTIONShubhangi Gupta, Consultant, WRI India

MSME Training Series #3 28-01-2021 3
▪ Attendees will remain in listen-only mode.
▪ Today’s presentation is being recorded and will
be shared with registered participants.
▪ Please use the “Questions” pane to type in your
comments or questions during the webinar.
GUIDELINES

MSME Training Series #3 28-01-2021 4
OBJECTIVES
RESILIENT, PROFITABLE
SUSTAINABLE
MSME SECTOR
Build Awareness
Build Skills
Build Preparedness Build
Resilience
Leverage Opportunities
OBJECTIVES OF THE TRAINING SERIES

TOPICS COVERED IN THE TRAINING SERIES
RENEWABLE
ENERGY
RESOURCE
EFFICIENCY
FINANCE &
POLICIES
CLIMATE CHANGE*GHG ACCOUNTING
& REPORTING*
ENERGY
EFFICIENCY
* Hyperlink to event page with session recording and materials attached

MSME Training Series #3 28-01-2021 6
ABOUT THE TRAINING SERIES
▪ Part of the Carbon Market Simulation Project, facilitated by WRI India and supported
by MacArthur Foundation
▪ Conducted in partnership with Confederation of Indian Industry (CII)
Comprehensive Topics
Open for All
Online
Expert Trainers
Free
Certificate of Participation
ABOUT THE TRAINING SERIESABOUT THE TRAINING SERIES

MSME Training Series #3 28-01-2021 7
NEED FOR ENERGY EFFICIENCY
Meet procurement requirements of corporate customers
Prepare for current &
future regulations
Reduce energy consumption
costs
Easy access to financing options
High impact, cost effective
way of emission reduction
NEED FOR ENERGY EFFICIENCY

MSME Training Series #3 28-01-2021 8

MSME Training Series #3 28-01-2021 9
AGENDA
Introduction Shubhangi Gupta, WRI India
Approach to Energy Efficiency in MSMEs Akshay Koul, CII-GBC
Energy Efficiency in Value Chain:
OEM PerspectivesAmol M. Magdum, Godrej & Boyce Mfg. Co
Opportunities from Energy Efficiency:
MSME PerspectivesSuresh Manoharan, Best Colour Solutions
Energy Efficiency in MSMEs:
Success StoriesKajol, Manager, WRI India
Question & Answer Session I
IoT/AI Solutions for Energy Efficiency Vinit Kulkarni, Greenovative Energy Solutions
Energy Efficiency in Compressed Air Systems Hidhay K., Systel Group of Companies
Energy Efficiency in Heating and Cooling Systems Navin Kumar and Sandeep Koundinya, Aspiration Energy and Energy &
Emissions Lab
Question & Answer Session II
Closing Remarks Atik Sheikh, Counsellor, CII-GBC
AGENDA

APPROACH TO ENERGY EFFICIENCY IN MSMEs
Akshay Koul, Associate Counsellor, CII-GBC

© Confederation of Indian Industry
Energy efficiency enabling cost saving and reducing environment impacts
28 January, 2021

© Confederation of Indian Industry
Background – Energy Efficiency (EE)
• Optimal utilization of energy without any trade-offs in smoother operations and safety
• Results in improved operation and reduced costs
• Mature concept in large industry and medium scale units
• Energy Efficiency is cross sectoral and continual

© Confederation of Indian Industry
Approach towards Energy Efficiency
Three-pronged
approach
Capacity Utilization
Fine-tuning
Technology upgradation

© Confederation of Indian Industry
EE – Opportunities
EE Opportunities
Electrical
Thermal
Compressed Air
Pumping
Process

© Confederation of Indian Industry
EE Measures - Electrical
❖Electrical Distribution
• Optimum transformers loading
• Power Factor Optimisation• Automatic Power Factor Controller
• Voltage Optimisation
• Energy Efficient Motor System
• Application of Variable Frequency Drive
• Energy Monitoring Systems

© Confederation of Indian Industry
EE Measures – Pumps & Compressors
❖Pumps• Optimum design (margin)
• Installation of Energy Efficient Pump sets
• Installation of VFD for capacity control
• Hydrophobic Coating
❖Compressed Air• Arresting Leakages• Optimum Generation Pressure• Application of VFD
(Loading/unloading)• Use of Electrical instead of
pneumatic equipment • Waste Heat Recovery from
compressors • Sensor based auto drain valves• Heat of Compression Dryer• Installation of EE Compressor

© Confederation of Indian Industry
EE Measures – Boiler & Steam Distribution
❖Boiler
• VFD for Feedwater Pump
• Automatic Blowdown and flash steam recovery
• Optimization of Combustion air
• WHR (Economizer/preheater)
• Multi-stage burner
• Optimum insulation
• EE Boiler (>80% eff.)
❖Steam Distribution
• Selection and maintenance of traps
• Installation of Micro turbine
• Condensate recovery
• Insulation to prevent heat loss
• Arresting Steam leakages
• Design of distribution line

© Confederation of Indian Industry
Energy Efficiency – Key Drivers
Leadership and core business strategy – Benchmarking; ISO 50001 EnMS
Leveraging Digitalization forEnergy Efficiency
Fostering Innovation – process & technology
Innovative Implementation Models

© Confederation of Indian Industry
ISO 50001 – Energy Management System
▪ A Guidance/Standard Document for
• Structured approach to management of energy use
• Voluntary global management system standard
• Guide to Improve Energy Performance
▪ Intent
• To enable organisation to establish system and processes necessary to improve energy performance, thus reduce GHG emissions, environment impacts and COSTS! (measurable improvement in performance)
© Confederation of Indian Industry
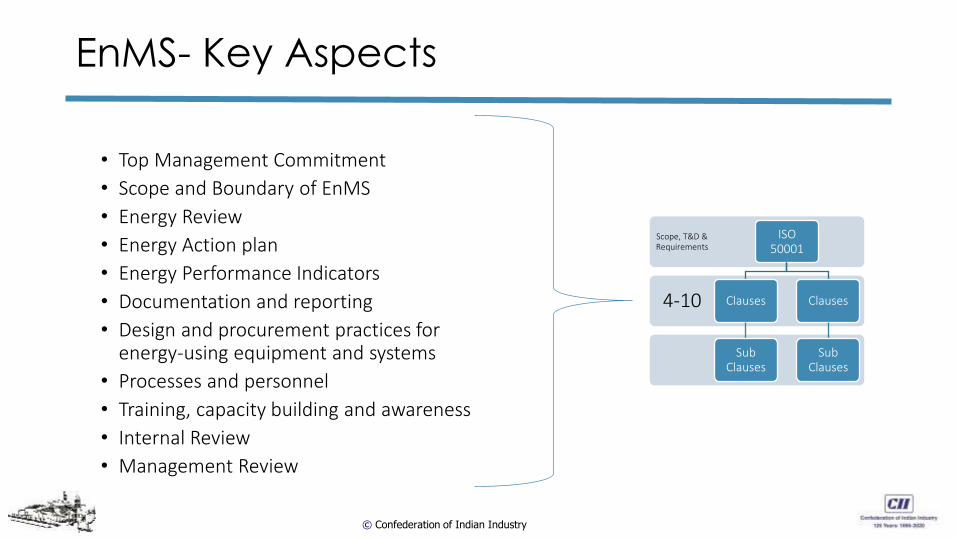
EnMS- Key Aspects
• Top Management Commitment
• Scope and Boundary of EnMS
• Energy Review
• Energy Action plan
• Energy Performance Indicators
• Documentation and reporting
• Design and procurement practices for energy-using equipment and systems
• Processes and personnel
• Training, capacity building and awareness
• Internal Review
• Management Review
4-10
Scope, T&D & Requirements
ISO 50001
Clauses
Sub Clauses
Clauses
Sub Clauses

© Confederation of Indian Industry
Immediate outcome of EnMS
• Establishment of a baseline of energy use
• Conducting review of energy use
• Resource allocation for energy conservation and efficiency activities
• Awareness at levels
• Continual improvement in energy intensity
• Document savings for internal and potentially external use

© Confederation of Indian Industry
ESCO – Implementation Model
Client ESCO
FIs
ESPC
Financing Payment
Payment
Service
Financial Agreement

© Confederation of Indian Industry
Contact: Akshay KoulCII - Godrej Green Business Centre, India
[email protected] +91 9550253830
http://energy.greenbusinesscentre.com/
THANK YOU!
For any queries related to energy efficiency log in @
For latest updates on energy efficiency please visit
http://energy.greenbusinesscentre.com/sup/
@CII_GBC cii--godrej-gbc
Follow us on:

MSME Training Series #3 28-01-2021 24

MSME Training Series #3 28-01-2021 25

MSME Training Series #3 28-01-2021 26

ENERGY EFFICIENCY IN VALUE CHAIN: OEM PERSPECTIVE
Amol M. Magdum, Associate Chief Manager, Godrej & Boyce Mfg. Co.

Energy Efficiency
Improvement in
Supply chain

The Foundation
Discipline
Culture
JIT Culture
Adherence
Culture
Team Work
Culture
Productivity
Improvement
Culture
ZERO Defect
Culture
First Godrej & Boyce plant to join CII Hybrid Manufacturing Cluster.

Idea of Making Supplier Clusters
Inspired by the Lean Management principles
of the Cluster, and the transformation of the
Shirwal factory, an idea was mooted.
“Why not extend the learnings to our
suppliers ?
- Mr. Jamshyd N GodrejChainman & Managing Director, Godrej & Boyce Mfg Co Ltd.
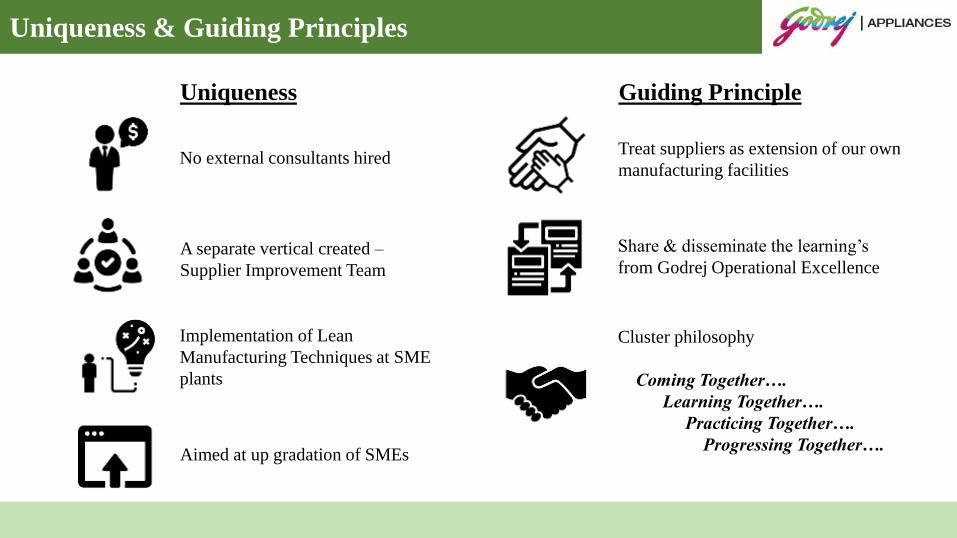
Uniqueness & Guiding Principles
No external consultants hired
A separate vertical created –
Supplier Improvement Team
Implementation of Lean
Manufacturing Techniques at SME
plants
Aimed at up gradation of SMEs
Uniqueness Guiding Principle
Treat suppliers as extension of our own
manufacturing facilities
Share & disseminate the learning’s
from Godrej Operational Excellence
Cluster philosophy
Coming Together….
Learning Together….
Practicing Together….
Progressing Together….

Organisation Structure
Well defined role & responsibilities of individuals

Supplier Cluster Roadmap
Balancing manufacturing growth and a clean environment.
Productivity Improvement Culture
Zero Defect Culture
Environment Culture
Zero Breakdown Culture
Self Discipline

First Cluster Roll Out
1st Cluster roll out – Jun’13
Shree Ashtavinayak
Glass
Win WinTechnologies
Gurukrupa Industries
United Gaskets
Emm Bee Ind
Feric Formers
Pan Plast
Jay Casting
Master Craft Ind
Mill Tec India
Satyam Auto Components
Shirwal 1st Group
Mohali1st Group
Mohali2nd Group

Methodology – Energy Efficiency Improvement
Energy Efficiency Improvement Methodology
Commitment
Energy Management
Team
Employee Involvement
Energy Monitoring
System
Energy Efficiency
Improvement Measures
Benchmarking

Commitment
▪ Vision
▪ Policy
▪ Target Setting
▪ Financial Allocation
▪ Review Mechanism

Green Vision
Vision communicates organization’s value and its commitment to achieving its goals
Gre
en
Vis
ion
Environment friendly products &
processes
Energy Conservation
Water Conservation
Resource Conservation
Systems
RoHS compliant
products & processes
40% Reduction in Energy
consumption by 2023
Water positive by 2022
Zero waste to land fill
By 2022
ISO 9001:2015 (AY 2016)
ISO 14001:2015 (AY 2019)
Use of energy efficient equipment and
energy efficiency operational practices
20 Lakh Litre water harvesting beyond
the fence in FY 21-22 in collaboration
with PAANI FOUNDATION
Replacement of raw material by
recycled material / waste from 30% to
50% in FY 21-22
ISO 45001:2018 (FY 21-22)
GreenCo Platinum Plus (FY 21-22)
Ensure 100% RoHS Compliance in
future

Green Policy
Policy define the goals and provide guidance about how to achieve objectives
Committed to conserve all key resources
such as ENERGY, water and other raw
materials by optimizing their use

Target Setting
Setting goals is the first step in turning invisible into visible
Green Vision
Green PolicyGreen Vision
Guidelines
Green Policy
Guidelines
Energy Audit
Countermeasures
against audit
observations
Benchmarking
Internal Performance
External Benchmark

Action Plan & Financial Allocation
Resourcing waiting for ideas, not ideas waiting for resources
Present
Consumption
(FY 19-20)
Short Term
(FY 20-21)
Mid Term
(FY 21-22)
Long Term
(FY 22-23)
SEC Target
(kWh/MT)108 102 (5%) 97 (10%) 92 (15%)
SN InitiativeYear of
Implementation
Benefit
(kWh/year)
Investment
(Rs. Lacs)
1 Use of energy efficient motors for all machines 2022 18700 2.5
2
Installation of energy monitoring software for
monitoring specific energy consumption for all
electrical equipments of machines
2021 --- 1.5
3Purchase bolt for new auto 4 stage bolt former
for reduce the energy2023 12000 22
4 Up-gradation of Hardening Oven 2021 2400 0.60
5 Upgrade the plating plant 2022 2400 5.5
6 Installation of Screw compressor AC-CD 7.5 2022 1500 5.5

Review Mechanism
Performance monitoring by Top Management
▪ Review of section-wise energy
consumption
▪ Analysis of daily energy consumption for
high energy consumption machines
▪ Discuss action plan on deviations
▪ Ideation for new energy conservation
projects
▪ Review status of work in progress projects
MRM – Supplier Cluster Program
Presentation by Cluster Suppliers
GEMBA Visit
Classroom Training
Agenda
Welcome Remarks by Host
Company
Performance review of Host
Company
Gemba visit
Observation feedback using
photographs
Performance review of other
participating cluster members
Finalisation of next MRM, venue
and date.
Training on next module of Cluster
Roadmap
Closing Remarks by GAD
Management
MRM – Supplier End

Total Employee Involvement
TEI helps builds a work culture of collaborative workforce for better growth & success
Employee
ParticipationEvent CelebrationCommunication
Training Program
Tool Box Meeting
Contact Program
Energy
Conservation
Week
Safety Week
Environment Day
Suggestion Scheme
Quality Circles
Kaizen
Small Group
Activity
Reward &
Recognition
Best Kaizen Award
Best Energy
Captain
Energy Efficient
Section
Employee Involvement Strategy

Training & Capacity Building
Strategy
Training & Capacity Building
Godrej Supplier Cluster Program
CII - GreenCo Kick Off
Supplier Handholding by Godrej
Attending Conferences & Summits
Visit to GreenCo Certified Suppliers
Implementation of concepts of Lean & Green
Manufacturing
Training on SME GreenCo Rating System & all 8
parameters of GreenCo by CII
Training, Visits, Reviews & Preparation
Green Processes & Technologies, New ideas on
Resource Conservation
Infrastructure, GreenCo Implementation Team,
Review Mechanism & Green Initiatives
Initiative Outcome

Training & Capacity Building

Energy Management Team
▪ Director & Plant Head –
✓ Review & approve energy
conservation projects.
✓ Create different platforms for
spreading awareness on energy
conservation amongst all employees.
▪ Energy Manager –
✓ Data analysis.
✓ Identification, feasibility study,
payback calculation of energy
conservation projects.
✓ Getting approval for new projects
from the management.
▪ Energy Management Cell –
✓ Creating energy conservation
awareness in the company.
✓ Sharing of ideas between various
departments.
✓ Implementation of energy saving
projects.
Role & Responsibilities
Mr. Nikhil Khivansara
Managing Director
Mr. Santosh Shinde
(Energy Manager)
Mr. Vishal Patil
(Electrical Energy)Mr. Vilas Pawar
(Renewable Energy)
Mr. Abdul Rehman(Plant Head)
Mr. Vilas Sable
(Thermal Energy)

Energy Monitoring System
▪ Energy Metering
▪ Daily Variance Analysis
▪ Corrective Action on Deviation

Energy Metering
>80% energy monitoring through energy meters
Plant Incoming
APFC panel
Furnace Utilities
Crane
Canteen
Lightings
Office Area Compressor
15 Hp
40 Hp
Insulating Area
Pre Processing Area
Bottero Cutting
BSJ Double edger
Seaming machine
Bentlerwashing
Golive Double Edger
Mitering machine
BSJ Washing
Drilling
PE double edger
Frame bending machine
DG
250 kVA
Solar panel supply Energy meter location

Online Energy Monitoring
Cloud based system with storage space up to 3 years
Real Time Energy Monitoring Software
Provides data
✓ kWh
✓ Voltage
✓ Current
✓ Consumption
✓ Department wise Consumption
✓ Machine wise Consumption
✓ Daily reports to all energy
members

Daily Variance Analysis
0.00
20.00
40.00
60.00
80.00
100.00
120.00
140.00
160.00
180.00
1-2
-20
2-2
-20
3-2
-20
4-2
-20
5-2
-20
6-2
-20
7-2
-20
8-2
-20
9-2
-20
10
-2-2
0
11
-2-2
0
12
-2-2
0
13
-2-2
0
14
-2-2
0
15
-2-2
0
16
-2-2
0
17
-2-2
0
18
-2-2
0
19
-2-2
0
20
-2-2
0
21
-2-2
0
22
-2-2
0
23
-2-2
0
24
-2-2
0
25
-2-2
0
26
-2-2
0
27
-2-2
0
28
-2-2
0
29
-2-2
0
Energy Kwh/kg
Average
Ener
gy K
WH
/Kg
Now cold forging machine
CF-03 drive motor mounting
vertical downward in direction due
to this motor & pulley runs
smoothly without any jerk and
vibration and also electric current
is maintained at 3.3 Amp.
Cold forging machine
CF-03 drive motor fitted
vertical upward condition
and pulley found overhang
, rotating pulley running
off centre due electrical
motor excess current
drown 4.2 Amp.
Daily Variance Analysis- cold Forging Header

Corrective Action on Deviation
Analysis of Deviation
Problem Status High energy consumption in Cold forging Header machine CF-
03
Why 1 High energy consumption in 16th to 18th Feb-20
Why 2 Machine motor was drawing excess current (Required 3 to 3.2 amp
& actual 4,2 amp)
Why 3 Pulley running off centre & overhang
Why 4 Motor bearing wear out due to shaft bend
Route cause Motor bearing wear out due to shaft bend

Corrective Action on Deviation
Motor bearing damaged due to
shaft & bearing misalignment.
Pulley running off Centre due to
overhang
▪ Shaft & bearing alignment corrected & motor bearing
changed
▪ Frequency set for shaft alignment (Once in year)
▪ Drive motor & pulley location charged to avoid overhang
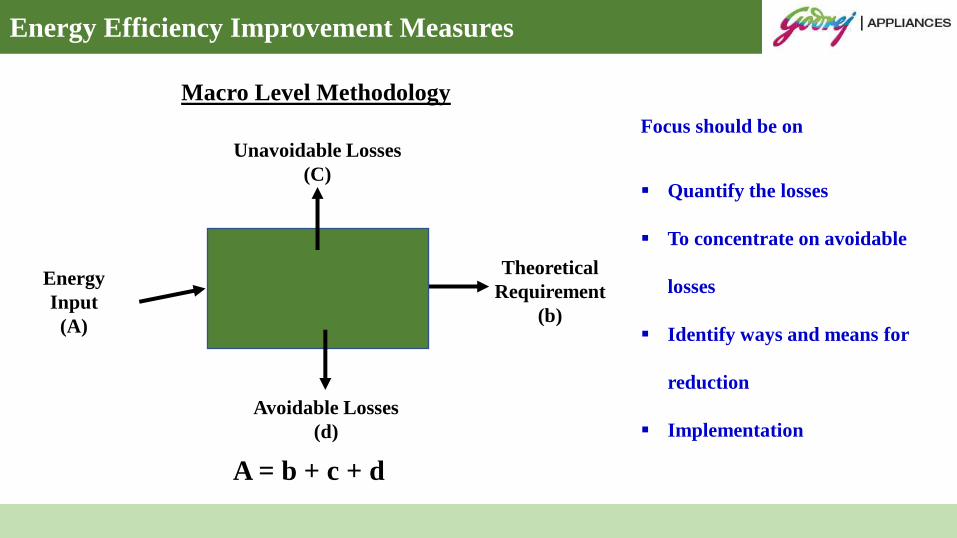
Energy Efficiency Improvement Measures
Energy
Input
(A)
Theoretical
Requirement
(b)
Unavoidable Losses
(C)
Avoidable Losses
(d)
A = b + c + d
Macro Level Methodology
Focus should be on
▪ Quantify the losses
▪ To concentrate on avoidable
losses
▪ Identify ways and means for
reduction
▪ Implementation

Energy Efficiency Improvement Measures
▪ Maintaining power factor close to unity or unity
▪ Measuring efficiencies of motor and replacement of old
inefficient motors
▪ Maximum usage of daylight (transparent sheets / sky lights)
▪ Lux mapping across the plant level and provide exact
lighting as per requirement
▪ Lowering the heights of luminaires wherever possible
Lighting & Electrical Systems

Energy Efficiency Improvement Measures
▪ Monitoring of air leakages and taking corrective actions
▪ Segregation of pressure lines
▪ Aluminium piping for compressed air network
▪ Installation of VFDs
▪ Use of transvector nozzles
❖ Saving potential 50%
Compressed Air

Energy Efficiency Improvement Measures
▪ Arresting leakages in water pipe lines and air ducts
▪ Monitoring of efficiencies
▪ Installation of VFDs
▪ Use of coatings to reduce friction in pumps and
increase efficiency
Pumps, Fans, Blowers
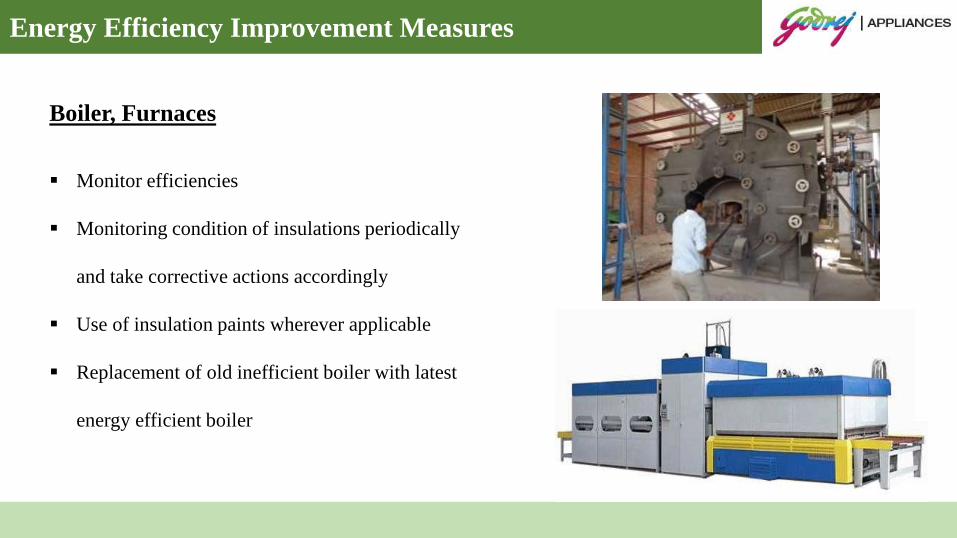
Energy Efficiency Improvement Measures
▪ Monitor efficiencies
▪ Monitoring condition of insulations periodically
and take corrective actions accordingly
▪ Use of insulation paints wherever applicable
▪ Replacement of old inefficient boiler with latest
energy efficient boiler
Boiler, Furnaces


GreenCo for SME Supply Partners
1st in India to launch GreenCo for SME supply partners
GreenCo for SMEs – Roll out at GAD Shirwal on 16th
Feb’16
(1st in India)
SME GreenCo Rollout – GAD, Shirwal
SN Supplier Name GreenCo Rating
1 Shree Ashtavinayak Glass Pvt Ltd Platinum
2 Khutale Engineering Pvt Ltd Platinum
3 Ajay Poly Pvt Ltd Gold
Registering suppliers for GreenCo Certification
Supplier Training on GreenCo Rating System by CII
Supplier Training on various module of GreenCo by Godrej
Supplier Handholding for GreenCo certification preparation by CII &
Godrej
Supplier Site Assessment by CII
Approach

Scaling Up
Maximum number of GreenCo certified supplier partners for any OEM in India
19
45
58
71
0
20
40
60
80
I II III IV
Suppliers Cluster Program
Phase
Su
pp
lier
s (C
um
m. N
os.
)
6
23
37
46
6369
0
10
20
30
40
50
60
70
80
15-16 16-17 17-18 18-19 19-20 20-21
Su
pp
lier
s (C
um
m.N
os.
)
GreenCo Certified Suppliers

Benefits
29% reduction in energy consumption in value chain
29% reduction in energy consumption
37% reduction in fresh water
consumption
31% reduction in waste
32% reduction in GHG emissions
84% of local buy from GreenCo
certified suppliers
17% reduction in GHG emissions from
transportation
47% reduction in incoming
packaging waste
100% RoHS complied outsourced
parts / products
Supplier Godrej Appliances

Thank You….

OPPORTUNITIES FROM ENERGY EFFICICNEY: MSME
PERSPECTIVESuresh Manoharan, Executive Director, Best Colour Solutions

Best Colour Solutions India Pvt Ltd
Textile dye house located in SIPCOT, Perundurai, Erode
District, Tamil Nadu.
Dyeing capacity: 6,500 kgs per day
Operation since: Jan 2008
Annual Turnover: Rs.25 Crore
Category: MSME - Small
Mr. Suresh Manoharan, Best Colour Solutions

Fashion Industry
Without textile dyeing, there is no value
addition in the textile supply chain.
Mr. Suresh Manoharan, Best Colour Solutions

Apprehensions about Textile Dyeing
High water consumption, resulting in
huge effluent generation.
High energy consumption.
Mr. Suresh Manoharan, Best Colour Solutions

Zero Liquid Discharge Scheme (ZLDS)
Mr. Suresh Manoharan, Best Colour Solutions
Under ZLDS, there is no discharge of (liquid)effluent, neither outside the factory nor insidethe factory.
Entire effluent generated is treated, recoveredand reused.
Only 10% of fresh water is required for top-up.

Energy Consumption in Production
Mr. Suresh Manoharan, Best Colour Solutions
Dyeing requires heating fresh water to hightemperatures (60o c to 12oo c)
At the same time, dyeing effluents are drained athot temperatures (60o c to 80o c)
Hence, planned on implementing:
“Heat Recovery System”

Solution Overview
Mr. Suresh Manoharan, Best Colour Solutions
Integrated heating solution for dyeing processwaste heat recovery from different sources:
Energy recovery from wastewater in dyeingprocess
Energy recovery from cooling process in dyeingmachines
Energy recovery from boiler flue gas
Vendor: Bosch Limited

Solution Overview
Mr. Suresh Manoharan, Best Colour Solutions
Stratification Tank
Make up water
SteamHot water supply @ 80 oC
Drain
BOILER
DYEING MACHINES
Sump Tank
Hot Effluent
Cold water
Hot water
Effluent drain to sump tank
Cold Effluent
Hot water supply @ 60 oC
Economizer
Soft water
Cooling return water
Vendor: Bosch Limited

Energy Efficiency Solution
Mr. Suresh Manoharan, Best Colour Solutions
Vendor: Bosch Limited

Cost Savings Calculation
Mr. Suresh Manoharan, Best Colour Solutions

Economics
Mr. Suresh Manoharan, Best Colour Solutions
Avg wood consumption for processing = 7,000 kgs
Fuel savings = 24%
Wood savings per day = 1,680 kgs
= 1,680 * Rs.4.90
= Rs. 8,200
Annual Savings = 290 days * Rs. 8,200
= Rs. 24 Lakhs
Investment = Rs. 85 Lakhs
Return of Investment : 3.5 years

Benefits of Implementation
Mr. Suresh Manoharan, Best Colour Solutions
Reduced steam consumption resulting in 24%fuel savings.
Lower temperature discharge of effluent to ETP reducesthe effluent treatment cost.
Hot water direct consumption in the machines results inreduction of steam peak load from the boiler. Theelimination of pressure fluctuation improves the boilerperformance.
One of two existing boiler moved to standby mode.

CII GreenCo Certification
Mr. Suresh Manoharan, Best Colour Solutions
In the process of obtaining CII GreenCoCertification through CII - Sohrabji Godrej GreenBusiness Centre, Hyderabad.

Shortcomings Observed in MSMEs
Mr. Suresh Manoharan, Best Colour Solutions
Not investing in utility monitoring equipment.
Steam Flow Meters:
3 TPH Boiler
2 TPH Boiler
Process House
ETP – Multiple Effect Evaporator (MEE)
ETP – Agitated Thin Film Dryer (ATFD)
Weighing Scales:
3 TPH Boiler Fuel Feeding
2 TPH Boiler Fuel Feeding
Energy Meters:
3 TPH Boiler
2 TPH Boiler
BOSCH Heat Recovery System

Shortcomings Observed in MSMEs
Mr. Suresh Manoharan, Best Colour Solutions
Vendor: Ideatec Softwares India Pvt Ltd
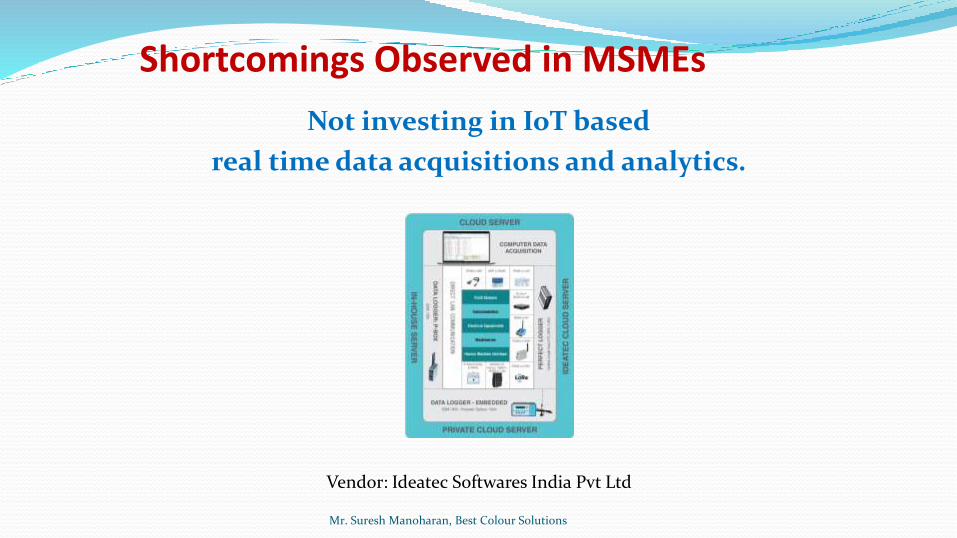
Shortcomings Observed in MSMEs
Mr. Suresh Manoharan, Best Colour Solutions
Not investing in IoT based
real time data acquisitions and analytics.
Vendor: Ideatec Softwares India Pvt Ltd

Mr. Suresh Manoharan
Executive Director
Best Colour Solutions India Pvt Ltd
www.linkedin.com/in/suresh-manoharan

ENERGY EFFICIENCY IN MSMEs: SUCCESS STORIES
Kajol, Manager, Energy Group, WRI India


Lessons and Insights from Naroda and Aurangabad
DEMAND AGGREGATION FOR CLEAN ENERGY IN
MSME CLUSTERS
WRI INDIA, JAN 29, 2020, INDIA INTERNATIONAL CENTER, DELHI

WHY IS DEMAND AGGREGATION IMPORTANT?
• 63.3 million MSMEs. Of which 31% are manufacturing units; account for 25% of the industrial sector’s energy consumption.
• Large companies have more or less figured out avenues for clean energy interventions– Workable avenues for MSMEs
• Key argument for aggregation – economies of scale
42%
24%
18%
9%
6% 1%Electricity consumption in 2017-18
Industry
Residential
Agriculture
Commercial
Others

ANCHOR PARTNERS AND LOCAL PARTNERS
Naroda Aurangabad Supply Chain
Anchor Partner Naroda Industries Association (NIA)
Marathwada Association of Small Scale Industries and Agriculture (MASSIA)
H&M
Local Partner Gujarat Cleaner Production Center (GCPC)
Eco Energy Management System (EEMS)

METHODOLOGY
Mapping GHG Emissions
Technical, Regulatory and
Financial Analysis
Building Low Carbon
Pathways
Demonstrating Proof of Concept
Industry Associations
Supply Chains
Operationalising the GHG protocol
EE and RE procurement and deployment within aggregators

SNAPSHOT OF FINDINGS
NAME NARODA INDUSTRIES ASSOCIATION MARATHWADA ASSOCIATION OF
SMALL-SCALE INDUSTRIES
SUPPLY CHAIN UNITS OF
H&M
No. of units studied 70 units 75 units 31 units
Type Chemical Cluster Automobile cluster Garment manufactures
Primary Fuel Piped Natural Gas (PNG) and wood
Grid based electricity Grid and diesel-based electricity
Secondary Fuel Grid based electricity LPG and furnace oil. Coal and oil
Baseline GHG emission (tonnes of CO2 eq. )
56592.5 15150.13 421985
Emission potential Scope 1 emission was higher than scope 2 emission
Scope 2 emission was higher than Scope 1 emission
Scope 1 emission was higher than Scope 2 emission
Potential reduction in emissions (tonnes of CO2 eq. )*#
24,000* 24,278 6000
*extrapolated for chemical sub cluster of 200 units
# - where required this is extrapolated from the sample size that we worked with.

WHILE NOT SUCCESSFUL ON EE, THERE WERE LEARNINGS
• Ownership and control over the constituent industries are
a key determinant in factors like data collection
• Location of units plays a great role when it comes to RE
interventions

CASE STUDY: ROOFTOP SOLAR – NARODA AND
AURANGABAD

KEY STAKEHOLDERS AND THEIR ROLE

MOTIVATIONS TO JOIN THE DEMAND AGGREGATION

INFLUENCING FACTOR
• The following factors are critical to the successful implementation of the demand
aggregation for solar PV systems project:
– Technical Awareness
– Securing the support of and working closely with the industries and association
– Transparent vendor selection process
– Presence of a local partner
– Infrastructure and logistics challenge
– State regulatory commission policy


THANK YOU

Question and Answer Session I

IoT/AI SOLUTIONS FOR ENERGY EFFICIENCY
Vinit Kulkarni, Co-Founder, Greenovative Energy Solutions


Introduction
• Equips the organizations with technology & data analytics
• Asist to thrive sustainability and reduceOpex
• At least top 3 clients from every majorsector with Successfully deployed at over200+ facilities across India & MEA region
OEE
Asset Monitoring
Energy Management
System
IIoT
Industry 4.0
We continue to maximize efficiency and improve long-term reliability for our clients on a day-to-day basis

“uncovers Energy Intelligence through data and
technology helping customers consume less energy,
improve system utilization, increase reliability &
generate insights to help optimize resources &
achieve sustainability”
Value Proposition & Underlying Magic


Diagnosing 1 Billion+energy unit every hour
Maintenance Cost Reduced
by 6% ($0.12 Mn*)
Amplified equipment
uptime by 14%
Member of MCCIA
Assisting IMC in Egypt
Key Metrics & Recognition
❖ Smart Startup of the year 2020 by India Smart Grid
Forum For power quality at EV charging station
❖ Winner of BIZ Arena by Proctor & Gamble 2019
Decrease in energy
consumption by 12-15% ($5 Mn*)
Maintaining reports
complied with ISO 50001
Increased Productivity
Throughout up to 8%
Recognized member of Department of Industrial Policy and Promotion (DIPP) India
❖ Winner – Emergx “Highway to a 100 Unicorns” –
Microsoft for Startups 2020
❖ Winner of Maharashtra Start Up Week 2018, India
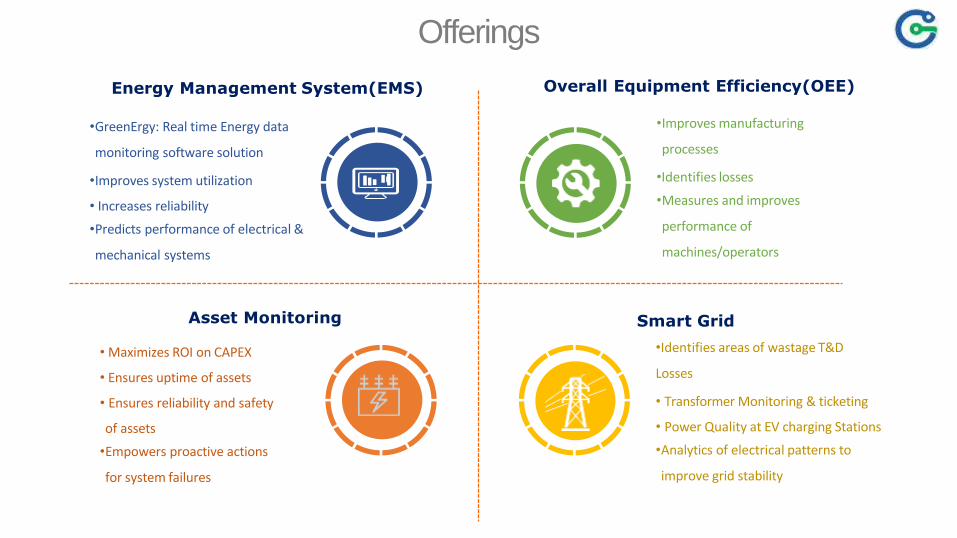
Offerings
Overall Equipment Efficiency(OEE)
•Improves manufacturing
processes
•Identifies losses
•Measures and improves
performance of
machines/operators
Smart Grid
•Identifies areas of wastage T&D
Losses
• Transformer Monitoring & ticketing
• Power Quality at EV charging Stations
•Analytics of electrical patterns to
improve grid stability
Energy Management System(EMS)
•GreenErgy: Real time Energy data
monitoring software solution
•Improves system utilization
• Increases reliability
•Predicts performance of electrical &
mechanical systems
Asset Monitoring
• Maximizes ROI on CAPEX
• Ensures uptime of assets
• Ensures reliability and safety
of assets
•Empowers proactive actions
for system failures

Illustration & Benefit
Ce
ntr
alSe
rve
rC
lou
dSe
rve
r
OR
Benefits
In-depth ReportingDaily, Weekly,Monthly, Quarterly, Yearly, SEC, ISO50001
Cost Savings Reduction inEnergy Consumption, Enhanced Productivity, Reduction in breakdown
Advanced AnalyticsDemand Calculations, Lossanalysis, machine runninghours, alerts, and events
Integration of Multiple SystemsCreate hassle free useraccess to a single platform
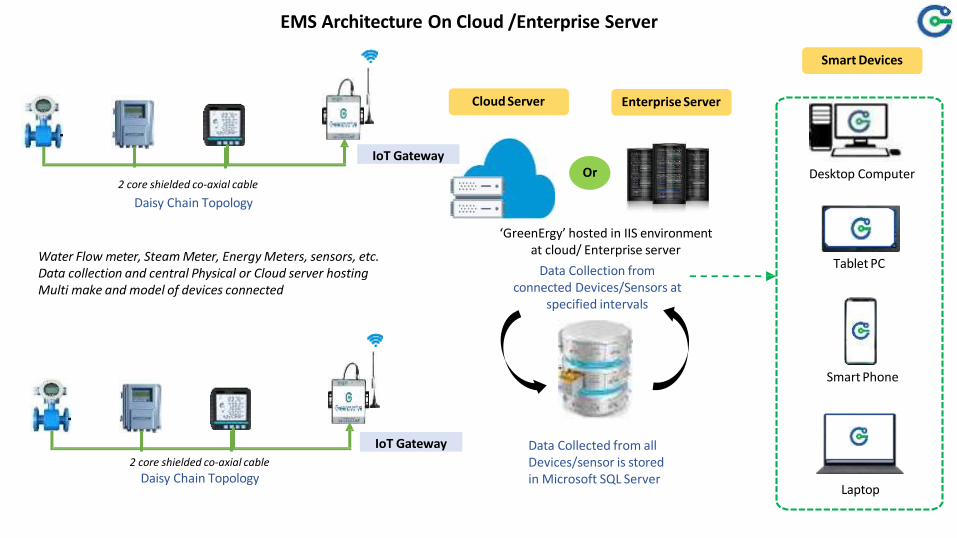
Smart Devices
Desktop Computer
Tablet PC
Smart Phone
Laptop
Application Hosting
2 core shielded co-axial cable
Daisy Chain Topology
2 core shielded co-axial cable
Daisy Chain Topology
Smart Devices
Desktop Computer
Tablet PC
Smart Phone
Laptop
Cloud Server
‘GreenErgy’ hosted in IIS environmentat cloud/ Enterprise server
Data Collection from connected Devices/Sensors at
specified intervals
Data Collected from all Devices/sensor is stored in Microsoft SQL Server
Enterprise Server
Or
IoT Gateway
IoT Gateway
Water Flow meter, Steam Meter, Energy Meters, sensors, etc. Data collection and central Physical or Cloud server hosting Multi make and model of devices connected
EMS Architecture On Cloud /Enterprise Server

Dashboard
https://www.mysmartems.com/Smart Sensors Data Analytics
Single Line Diagram Alerts & EventsReporting
Sample Screens


35
64
26
33
63
15
75
3329
175
28
38
16
0
3560
835
3153
295
3300
455
3447
650
3527
690
35
46
35
5
34
65
11
1
31
02
14
7
35
30
52
3
1000000
500000
0
4000000
3500000
3000000
2500000
2000000
1500000
Kw
h
Base Line Facility level ( Electrical)
Electricity FY19
ElectricityFY18
0.710
0.700
0.690
0.680
0.670
0.660
0.650
0.640
0.630
0.620
0.610
0.600
Kw
h/K
g
Base Line EnPI-Facility level(Kwh/Kg)
Facility Level EnPI FY19 ( Electrical)
Facility level EnPI-Electricity
ENPIReport

#uncoverEnergyIntelligence
Greenovative Energy Pvt. Ltd.
Plot No. 20, Bhagwati Nagar, Behind Croma Store, Baner, Pune-411045,Maharashtra, India
Ph.: 020 2729 5000, E:[email protected]
www.greenovative.com

ENERGY EFFICIENCY IN COMPRESSED AIR SYSTEMS
Hidhay K., Managing Director, Systel Group of Companies

Systel’s Industry 5.0 Solutions for
Compressed Air Systems
s u p p o r t @ s y s t e l . a s i a h t t p s : / / s y s t e l . a s i a+ 9 1 - 9 6 5 5 0 2 8 7 1 5

18 Years of Operation
Over 1600 Compressed Air Projects
Over 50 Million MWH of Energy Savings
ISO 11011 Certified
First to Introduce Industry 5.0 in Indian
Market
VISION - TO SIMPLIFY COMPRESSED AIR MANAGEMENT
ABOUT US
An Indo Danish Venture
s u p p o r t @ s y s t e l . a s i a h t t p s : / / s y s t e l . a s i a+ 9 1 - 9 6 5 5 0 2 8 7 1 5

Energy Costs Capital Costs Maintenance Costs
6,48,000 kWh
Rs 48,60,000 @ Rs 7.5 / kWh
100 Tons of Green House Gas
5.1 Million Litres of Cooling H20
1,04,560 Litres of Condensate
2,54,500 Thermal Energy (Btu/hr)
Annual Impact Of A 100 HP Compressors
s u p p o r t @ s y s t e l . a s i a h t t p s : / / s y s t e l . a s i a+ 9 1 - 9 6 5 5 0 2 8 7 1 5

ENERGY CONSUMED IN A COMPRESSED AIR SYSTEM
s u p p o r t @ s y s t e l . a s i a h t t p s : / / s y s t e l . a s i a+ 9 1 - 9 6 5 5 0 2 8 7 1 5

Compressed Air Puzzles ?
How Much Air Is Produced ?
s u p p o r t @ s y s t e l . a s i a h t t p s : / / s y s t e l . a s i a+ 9 1 - 9 6 5 5 0 2 8 7 1 5
What Are The Equipment Efficiencies ?
How Much is The Actual Requirement ?
What Are The System Losses ?
ABD
C

Result of In-Efficiencies
FREQUENT BREAK-DOWN
Resulting in the Need for Identical
Back Up Capacities
s u p p o r t @ s y s t e l . a s i a h t t p s : / / s y s t e l . a s i a+ 9 1 - 9 6 5 5 0 2 8 7 1 5
HIGH MAINTENANCE COSTS
Nearly 25 % Increased Costs due to
Frequent Wear & Tear
HEAVY LEAKAGES
Leakages Upto 30 % Drain Your
Energy & Money
HIGHER COST OF OWNERSHIP
Overall Operating Costs Can
Increase as Much as 30%
POOR AIR QUALITY
High Contaminants Create Rusting,
Scaling in Pipelines and Damage
Costly Pneumatic Equipments
PRODUCTION INTERUPTIONS
Fluctuating System Pressure Often
Leads to Production Halts
HIGH ENERGY COSTS
Specific Power (kW/CFM) can
increase as much as 30 %

Rise Above
s u p p o r t @ s y s t e l . a s i a h t t p s : / / s y s t e l . a s i a+ 9 1 - 9 6 5 5 0 2 8 7 1 5
Low Cost of
Ownership
High Operational Efficiency
High Green House
Gas Emissions
Energy & Cost
Wastages
Ownership Costs
Save Upto 40 % in Reduced Cost of Ownership
Efficiency
Industry 5.0 Can Help You Achieve Maximum Operating Efficiencies of
Your Compressed Air Equipments
Emissions
Every 1 H.P of Compressor Capacity Annually Emits 1 Ton of Green
House Gas Emissions
Losses
Inefficient Systems Often Waste As Much As 30 - 50 % ofEnergy
Systematic & Smart Improvements
s u p p o r t @ s y s t e l . a s i a h t t p s : / / s y s t e l . a s i a+ 9 1 - 9 6 5 5 0 2 8 7 1 5

Deploying Industry 5.0 for
Compressed Air Systems
s u p p o r t @ s y s t e l . a s i a h t t p s : / / s y s t e l . a s i a+ 9 1 - 9 6 5 5 0 2 8 7 1 5

From Wastefulness to Wastelessness
s u p p o r t @ s y s t e l . a s i a h t t p s : / / s y s t e l . a s i a+ 9 1 - 9 6 5 5 0 2 8 7 1 5

What is Industry 5.0 ?
The Term Industry 5.0 Refers to People Working
Alongside Smart Machines.
It’s About Smart Technology Helping Humans
Work Better and Faster by Leveraging Advanced
Techniques Like the Internet of Things (IoT) and
Big Data.
It Adds a Personal Human Touch to the Industry
4.0 Pillars of Automation and Efficiency.
s u p p o r t @ s y s t e l . a s i a h t t p s : / / s y s t e l . a s i a+ 9 1 - 9 6 5 5 0 2 8 7 1 5

Advancing from Industry 4.0 to
Industry 5.0
The Objective of Industry 4.0 Is to Interconnect Machines, Processes and Systems for Maximum Performance Optimization.
Industry 5.0 Takes Such Efficiency and Productivity a Step Further.
It’s About Refining the Collaborative Interactions Between Humans and Machines.
s u p p o r t @ s y s t e l . a s i a h t t p s : / / s y s t e l . a s i a+ 9 1 - 9 6 5 5 0 2 8 7 1 5
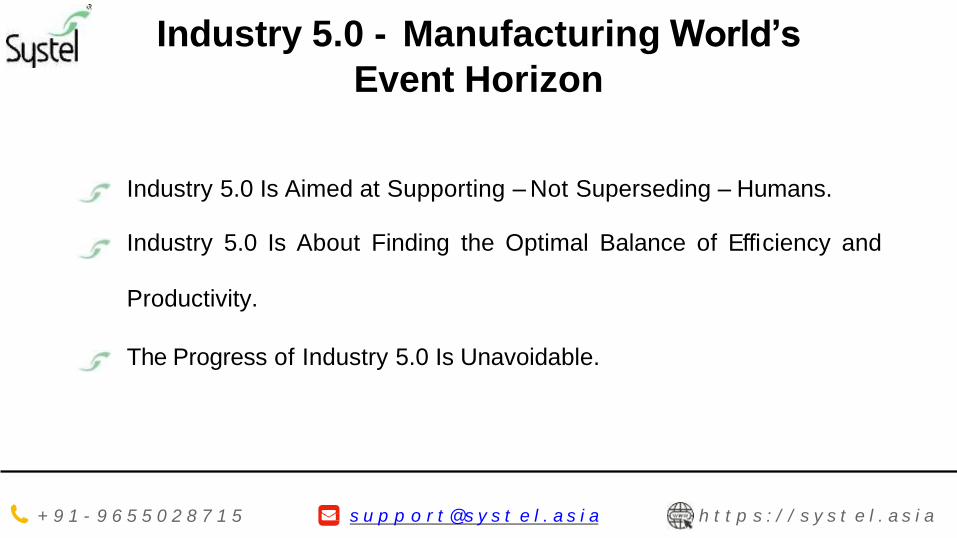
Industry 5.0 - Manufacturing World’s
Event Horizon
Industry 5.0 Is Aimed at Supporting – Not Superseding – Humans.
Industry 5.0 Is About Finding the Optimal Balance of Efficiency and
Productivity.
The Progress of Industry 5.0 Is Unavoidable.
s u p p o r t @ s y s t e l . a s i a h t t p s : / / s y s t e l . a s i a+ 9 1 - 9 6 5 5 0 2 8 7 1 5

Baselining Operating Data’s With Smart Sensors
s u p p o r t @ s y s t e l . a s i a h t t p s : / / s y s t e l . a s i a+ 9 1 - 9 6 5 5 0 2 8 7 1 5

Leakages
Artificial DemandMisuses
Demand Side Optimization
s u p p o r t @ s y s t e l . a s i a h t t p s : / / s y s t e l . a s i a+ 9 1 - 9 6 5 5 0 2 8 7 1 5

Define Goals
LEAKAGES
Maintain Leakages at Less Than 5 % of
Generation
SYSTEM PRESSURE
Maintain Dual Pressure Zones for High &
Low Pressure Requirements
PRESSURE DROP
Should Not Exceed 0.5 Bar from Wet
Receiver to the Actual Point of Use
PRESSURE DEW POINT
Should Not Exceed 3 0CTD for
Refrigerant Dryers and - 50 0CTD for
Dessicant Dryers
kW / CFM
Overall System Efficiency Should not
Exceed 0.17 kW / CFM
s u p p o r t @ s y s t e l . a s i a h t t p s : / / s y s t e l . a s i a+ 9 1 - 9 6 5 5 0 2 8 7 1 5

Implementing Corrections
s u p p o r t @ s y s t e l . a s i a h t t p s : / / s y s t e l . a s i a+ 9 1 - 9 6 5 5 0 2 8 7 1 5

Implementing Corrections
s u p p o r t @ s y s t e l . a s i a h t t p s : / / s y s t e l . a s i a+ 9 1 - 9 6 5 5 0 2 8 7 1 5

Smart Tracking of KPIs
s u p p o r t @ s y s t e l . a s i a h t t p s : / / s y s t e l . a s i a+ 9 1 - 9 6 5 5 0 2 8 7 1 5

Automated Reports
s u p p o r t @ s y s t e l . a s i a h t t p s : / / s y s t e l . a s i a+ 9 1 - 9 6 5 5 0 2 8 7 1 5

Case Study - Speciality Steel Plant
Project Objectives
Install Monitoring
Measure Flow, Power,
Pressure, Dew Point
and System Efficiency
Define Operating Baselines
Set Baseline and
Define Goals for
Improvement
Take Corrective Actions
Implement Leak
Repairs, Eliminate
Artificial Demand /
Misuses & Improve
Supply Efficiency
Realise Energy
Savings & Reduce
Carbon Footprints
Achieve Annual Energy Savings of Upto 488 kWH
& Reduce Carbon Foot Prints By 3162 Tons /
(Equivalent of 15811 Trees Required to Offset
these Emissions)
Energy Savings - 17.5 %
Carbon Reductions - 3162 Tons
Equivalent to Planting of 15811 Fully Grown Trees
s u p p o r t @ s y s t e l . a s i a h t t p s : / / s y s t e l . a s i a+ 9 1 - 9 6 5 5 0 2 8 7 1 5
Rs 2.32 Crores Cost Savings

Case Study - Speciality Steel Plant
Pressure
Measurements at
Orifice Plate Flow
Sensors
Energy Loss
Inlet (in barg) Outlet (in barg) In kWH In kWH / Day
6.9 6.7 46 1104
s u p p o r t @ s y s t e l . a s i a h t t p s : / / s y s t e l . a s i a+ 9 1 - 9 6 5 5 0 2 8 7 1 5
The Return on Investment for installing the 3
Nos of Pitot Tube Flow Sensors was only 83
Days or Just Under 3 Months.

Case Study - Speciality Steel Plant
The Factory loses upto 750 CFM in
Air Leakages and thereby Wasting
upto 1718 kWH / day.
s u p p o r t @ s y s t e l . a s i a h t t p s : / / s y s t e l . a s i a+ 9 1 - 9 6 5 5 0 2 8 7 1 5
The Return on Investment for installing the 3 Nos of
WADS 205 Pressure Dew Point Sensors with Buzzer
Alarm and Indicator Lights was only 27 Days or Just
Under 1 Month.

Case Study - Speciality Steel Plant
The Plant was forced to increase the Loading Set Points at the
Compressor by upto 1 bar resulting in Energy Loss of Upto 1872
kWH / day. Since the Plant was having unregulated pressure
usage at multiple production machines, the artificial demand was
measured was at 736 CFM or equivalent to 3456 kWH Per Day.
s u p p o r t @ s y s t e l . a s i a h t t p s : / / s y s t e l . a s i a+ 9 1 - 9 6 5 5 0 2 8 7 1 5
There has been a realised energy savings of upto 1862 kWH /
day. PCI Department now works with stable pressure and
without any pressure related problems. The Return on
Investment for installing 21 Nos of WAFS 106 Smart Thermal
Mass Flow Sensors was Just Under 9 Months.

2.5 %
2.5 %
5 %
2.5 %
Pressure Fluctuations
Supply Efficiency
7.5 %
Artificial Demand
5 %
Leak Losses
2.5 %
Case Study - Speciality Steel Plant
s u p p o r t @ s y s t e l . a s i a h t t p s : / / s y s t e l . a s i a+ 9 1 - 9 6 5 5 0 2 8 7 1 5
Energy Savings - 17.5 %
Carbon Reductions - 3162 Tons
Equivalent to Planting of 15811 Fully Grown Trees
Cost Savings - Rs 2.32 Crores
Return on Investment - 6 Months

w w w . s y s t e l . a s i a+ 9 1 - 9 6 5 5 0 2 8 7 1 5 s u p p o r t @ s y s t e l . a s i a
CONTACT US
ADDRESS - ASIA
Systel Business Centre, # 12 Sri
Venkatalakshmi Nagar, Singanallur,
Coimbatore - 641005. India
ADDRESS - EUROPE
Pilestraede 58, DK-1112
Copenhagen,
Denmark.
+91-9655028715
https://www.facebook.com/systel.asia
https://twitter.com/systelasia
PHONE
+45-36992197
PHONE

ENERGY EFFICIENCY IN HEATING & COOLING SYSTEMS
Navin Kumar and Sandeep Koundinya, Aspiration Energy and Energy & Emissions Lab, IIT-Madras

MSME training series #03# – Energy efficiency
Energy efficient innovations in heat pumps.
Navin KumarSandeep Koundinya
Aspiration Energy and Energy & Emissions Lab, IIT-Madras
Indian Institute of Technology | Madras
Aspiration EnergyLeaders in Sustainable Heating Solutions
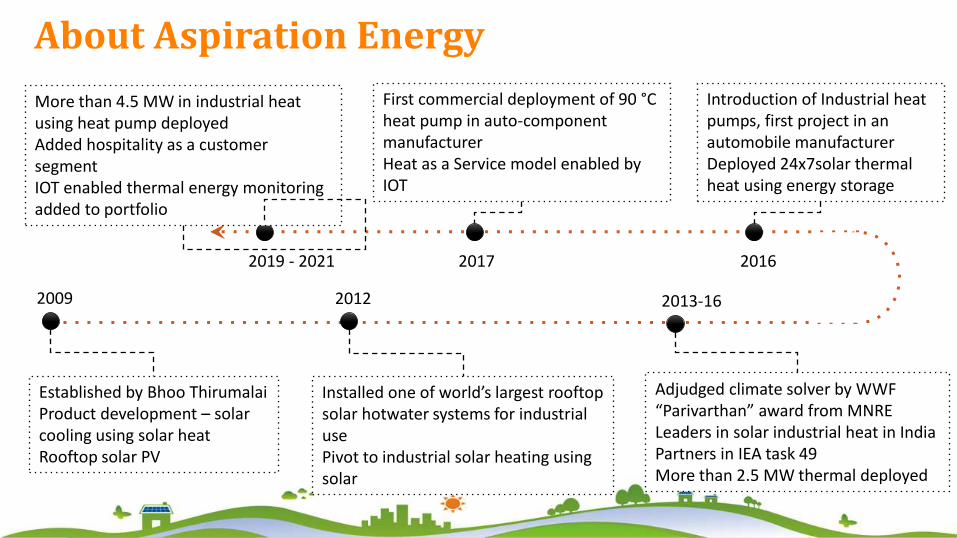
About Aspiration Energy
Established by Bhoo ThirumalaiProduct development – solar cooling using solar heatRooftop solar PV
Installed one of world’s largest rooftop solar hotwater systems for industrial usePivot to industrial solar heating using solar
2009 2012
2019 - 2021 2017 2016
2013-16
Introduction of Industrial heat pumps, first project in an automobile manufacturerDeployed 24x7solar thermal heat using energy storage
First commercial deployment of 90 °C heat pump in auto-component manufacturerHeat as a Service model enabled by IOT
More than 4.5 MW in industrial heat using heat pump deployedAdded hospitality as a customer segmentIOT enabled thermal energy monitoring added to portfolio
Adjudged climate solver by WWF“Parivarthan” award from MNRELeaders in solar industrial heat in IndiaPartners in IEA task 49More than 2.5 MW thermal deployed

Product line
ThermaGen Heatpumps
> Up to 90 C process temp
> 3000 kW installed
> Unique rental model for heatpump trials
> Thermal energy PPA
Solar Heating
Up to 90 C process temp
> ~ 2.4 MW installed till date
> India’s first 24x7 process heat with thermal battery
Thermelgy -Thermal Energy
Monitoring> Remote monitoring of thermal energy for heat pumps, solar heat and process heating
> IOT enabled billing, health monitoring, preventive health
Product innovation
CO2 Heat pumps
120 C Heat pumps
Heat Pump Dryers
Coming soon…Pilot trials…

Industrial Heat Pumps
Indian Institute of Technology | Madras
Compressor Condenser
Expansion valve
Evaporator
Controller
Tem
pe
ratu
re (
K)

Unit Cost/1000kcal

Applications

Success Story

Sl. no Particulars value Units1 Avg. LPG Consumption Per Day 650 kg2 Avg. Chiller Consumption Per Day 700 kWh3 Thermal Energy used per day for
boiler 4420 KWh4 Electrical energy used per day for
chiller 700 KWh5 Heat pump electrical consumption
per day 1800 KWh6 Total Energy saved per day 3320 KWh7 Total Energy saved per year 996 MWh
Energy Saving calculation:
Sl. no Emission component value Units1 chiller 195.3 Metric Tons2 Boiler 590 Metric Tons3 Heat Pump 502.2 Metric Tons4 Total emission saved 283 Metric Tons
CO2 Emission calculation:
NOTE: Assumption of 300 working days per year have been taken for calculation
Sl. no Particulars value Units1 Avg. LPG Consumption Per Day 650 kg2 Avg. Chiller Consumption Per Day 700 kWh3 LPG Rate per Kg 50 Rs.4 Cost of Electricity 8 Rs/kWh5 Number of Working Days per
year 300 days6 Amount spent for LPG per year 97,50,000 Rs.
7 Amount spent for Chiller per year 16,80,000 Rs.
8 Total amount spent for boiler and chiller per year
1,14,30,000Rs.
9 Electrical Consumption for heat pump per day
1,800 kWh
10 Amount spent for heat pump running per year 43,20,000 Rs.
11Total Savings per year 71,10,000 Rs.
Cost Saving calculation:
Innovation BenefitsIndian Institute of Technology | Madras

S.noParticulars value Units
1 Avg. LPG Consumption Per Day 650 kg2 Avg. Chiller Consumption Per Day 700 kWh3 LPG Rate per Kg 50 Rs4 Cost of Electricity 8 Rs/kWh5 Number of Working Days per year 300 days6 Amount spent for LPG per year 97,50,000.00 Rs.
7 Amount spent for Chiller per year 16,80,000.00 Rs.8
Total amount spent for boiler and chiller1,14,30,000.00
Rs.9
Electrical Consumption for heat pump per day1,800.00
kWh10
Amount spent for heat pump running 43,20,000.00 Rs11
Total Savings per year 71,10,000.00 Rs12
Investment for Heat Pump 78,08,338.00 Rs13 Payback 13 Months
Payback calculation

Cost of Technology
Typical installation cost/kW:Rs. 10,000/kW-33,000/kW
• Depends on: Integration method, hot water delivery temperature, online remote monitoring and diagnostics.
• The project described here was implemented at Rs. 30,032/kW
In most applications, the heat pump system is installed as a hybrid:
• Existing heating source in by-pass or back-up mode
• Direct or indirect heat exchange method:
• Indirect: additional heat exchanger is integrated with the customer process.
• Direct heating, process fluid is brought in to the heat pump and returned after heating.

If the heat delivery temperature can be breached beyond 100 C, nearly 40-50 % of the global industrial heat can be served using heat pumps, from < 20% currently

AEPL ongoing Innovations
120 ℃ steam generator

AEPL ongoing Innovations
CO2 Heat pump
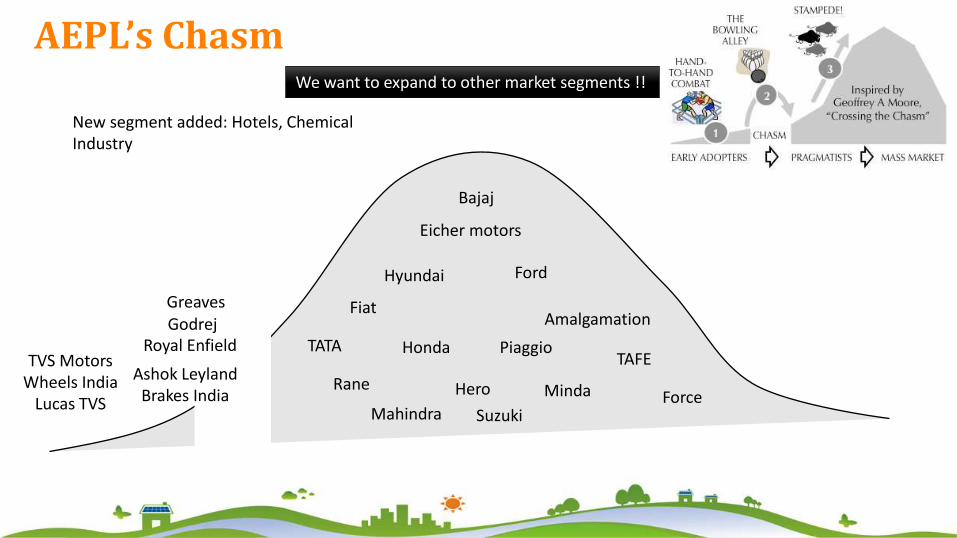
AEPL’s Chasm
Eicher motors
Hyundai Ford
TATA
Rane
Honda
Hero
Piaggio
Minda
Amalgamation
TAFE
Force
Fiat
Mahindra Suzuki
Bajaj
TVS MotorsWheels India
Lucas TVS
Ashok LeylandBrakes India
Royal EnfieldGodrejGreaves
New segment added: Hotels, Chemical Industry
We want to expand to other market segments !!

A Negawatt is better than the Megawatt!!
>> Leaders in sustainable heating solutions!! >>Contact us @ [email protected]/044-42185301

Question and Answer Session II


CLOSING REMARKSAtik Sheikh, Counsellor, CII-GBC

THANK YOU
Contact Us:
▪ Megha Nath | Senior Project Associate, WRI India | [email protected]
▪ Atik Sheikh | Counsellor, CII | [email protected]
The current activities under this project
are supported the MacArthur
Foundation