MSHA HANDBOOK SERIES - Mine Safety and Health ... · Staff, Ventilation Division Pittsburgh Health...
21
MSHA HANDBOOK SERIES U. S. Department of Labor Mine Safety and Health Administration Directorate of Technical Support December 2009 Handbook Number PH09-II-1 ANEMOMETER CALIBRATION PROCEDURES
Transcript of MSHA HANDBOOK SERIES - Mine Safety and Health ... · Staff, Ventilation Division Pittsburgh Health...

MSHA HANDBOOK SERIES
U. S. Department of Labor Mine Safety and Health Administration Directorate of Technical Support December 2009
Handbook Number PH09-II-1
ANEMOMETER CALIBRATION PROCEDURES
UNITED STATES DEPARTMENT OF LABOR MINE SAFETY AND HEALTH ADMINISTRATION
TECHNICAL SUPPORT DIVISION
ANEMOMETER CALIBRATION PROCEDURE
December 2009
by
Staff, Ventilation Division
Originating Office
Pittsburgh Safety and Health Technology Center Ventilation Division
Richard T. Stoltz, Chief Cochrans Mill Road, P.O. Box 18233
Pittsburgh, Pennsylvania 15236

TABLE OF CONTENTS
Page INTRODUCTION .......................................................................................................................... 1
TESTING PROCEDURE
ILLUSTRATIONS
............................................................................................................... 1
CALCULATIONS.......................................................................................................................... 4
Figure 1 - Sample Anemometer Calibration Data Sheet Completed for Step 8 of Testing Procedure ......... 5
Figure 2 - Sample Anemometer Calibration Data Sheet Completed for Step 10 of Testing Procedure ....... 6
Figure 3 - Sample Anemometer Calibration Data Sheet Completed for Step 11 of Testing Procedure ....... 7
Figure 4 - Sample Anemometer Calibration Data Sheet Completed for Step 12 of Testing Procedure ....... 8
Figure 5 - Sample Anemometer Calibration Data Sheet Completed for Step 13 of Testing Procedure ....... 9
Figure 6 - Sample Calibration Curve for Low Speed Bench Standard Anemometer (Serial No. 34677) .. 10
Figure 7 - Sample Anemometer Calibration Data Sheet Completed for Step 2 of Calculations ................ 11
Figure 8 - Sample Anemometer Calibration Data Sheet Completed for Step 3 of Calculations ................ 12
Figure 9 - Sample Calibration Curve for Low Speed Anemometer (Serial No. 22860)............................. 13
Figure 10 - Sample Calibration Curve for Low Speed Anemometer (Serial No. 22881)........................... 14
Figure 11 - Sample Calibration Curve for Low Speed Anemometer (Serial No. 24678)........................... 15
Figure 12 - Sample Calibration Curve for Low Speed Anemometer (Serial No. 23001)........................... 16
Figure 13 - Sample Correction Factor Charts for Calibrated Anemometers............................................... 17
Figure 14 - Combined Sample Calibration Curves for Low Speed Anemometers ..................................... 18
Release 1 (December 2009)

ANEMOMETER CALIBRATION PROCEDURE
by
Staff, Ventilation Division Pittsburgh Health Technology Center
Mine Safety and Health Administration
INTRODUCTION
While calibration curves for various anemometers are indicative of the calibration curve for the type and manufacturer of the instrument, the individual curves vary due to slight differences in composition and wear of the inner components of each instrument. As a result, in order to obtain the most accurate velocity determinations possible, each anemometer must be calibrated.
The Mine Safety and Health Administration (MSHA) has established an anemometer calibration program which utilizes an open jet wind tunnel and various primary reference instruments calibrated by the National Institute of Standards and Technology (NIST). Current policy dictates that workbench standard anemometers and field anemometers must be calibrated on at least an annual basis. To ensure that calibration throughout MSHA is uniform and can be traced back to the NIST standard reference instruments, a standard calibration procedure must be followed by all responsible personnel.
The following step-by-step procedure is used by the Ventilation Division of the Pittsburgh Safety and Health Technology Center (PSHTC) to calibrate a workbench standard and should be followed to calibrate field anemometers.
TESTING PROCEDURE
1. The Airflow Dynamic Open Jet Wind Tunnel should be set up as described in the manufacturer's operating manual. Care should be taken to prevent air disturbances (open doors and windows) from interfering with airflow from the wind tunnel.
2. Set the anemometer test stand so that anemometers are exactly six inches away from the jet opening of the wind tunnel.
3. For the 4-inch rotating vane anemometer, normal calibration includes the determination of seven points along the calibration curve: 2000 fpm, 1500 fpm, 1000 fpm, 750 fpm, 500 fpm, 250 fpm and 100 fpm.
4. Start fan. Allow the fan to run 15-20 minutes prior to beginning calibration to allow the system to stabilize.
Release 1 (December 2009) 1

Note: Each anemometer should be checked to ensure that the vanes spin freely at an approximate velocity of 100 fpm before beginning the calibration process. This should be done so that time is not wasted calibrating an anemometer at the higher velocities only to discover it will not turn at the lower velocities. If an anemometer does not spin freely at an approximate velocity of 100 fpm, then the anemometer should be repaired or discarded.
5. Approximate velocities are set using the following table which provide the velocity versus the pressure drop across the orifice to select the orifice plate best suited for the calibration velocity being run:
Velocity Orifice Diameter Pressure Drop Across Orifice(fpm) (inches) (inches of water)
2000 6.450 0.29
1500 4.000 1.69
1000 4.000 0.76
750 4.000 0.42
500 4.000 0.19
250 2.842 0.18
100 1.268 0.77
Insert orifice into orifice plate clamp. Close the clamp.
Note: Actual velocities are determined with the reference instrument. It was decided not to use the orifice plate as a reference because calculations involving temperature and barometric pressure corrections on the pressure drop across the orifice would be as time-consuming as taking a velocity reading with the reference instrument.
6. Use the rheostat to set the pressure drop across the orifice on manometer to correspond to orifice pressure at the desired velocity.
Note: It may be necessary to change orifice plate when changing from one test velocity to another.
7. Wait two minutes to assure the wind tunnel air velocity is stabilized.
Release 1 (December 2009) 2
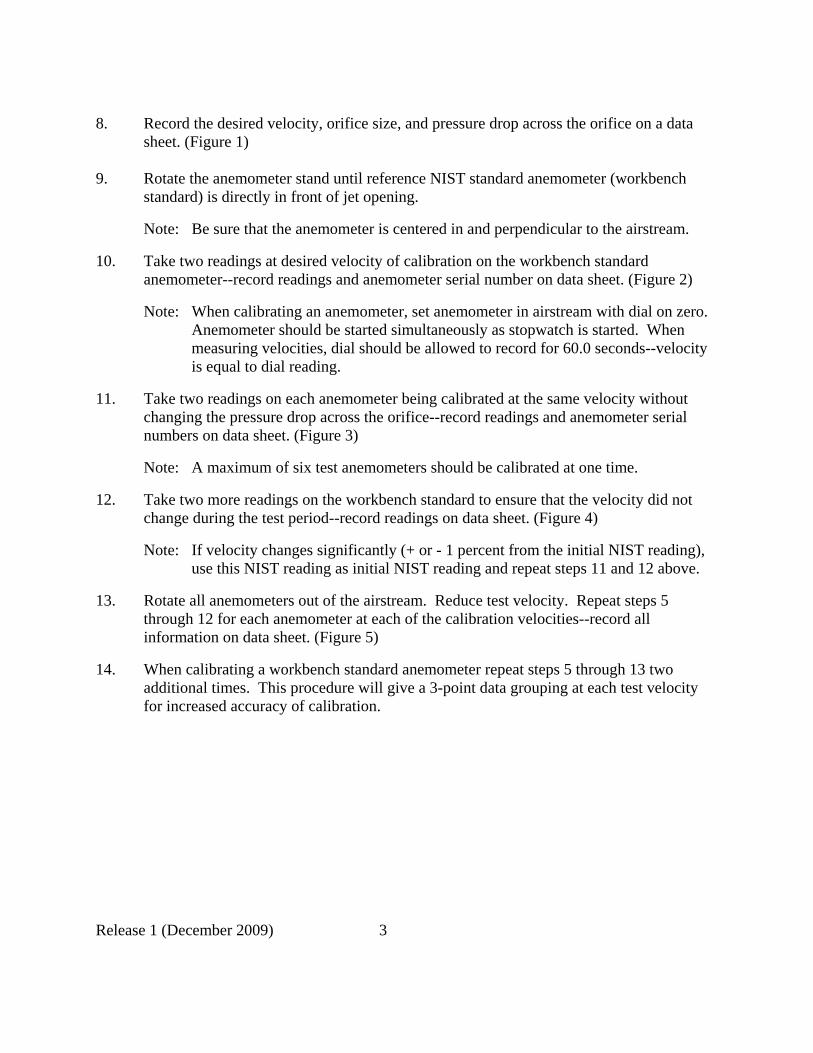
8. Record the desired velocity, orifice size, and pressure drop across the orifice on a data sheet. (Figure 1)
9. Rotate the anemometer stand until reference NIST standard anemometer (workbench standard) is directly in front of jet opening.
Note: Be sure that the anemometer is centered in and perpendicular to the airstream.
10. Take two readings at desired velocity of calibration on the workbench standard anemometer--record readings and anemometer serial number on data sheet. (Figure 2)
Note: When calibrating an anemometer, set anemometer in airstream with dial on zero. Anemometer should be started simultaneously as stopwatch is started. When measuring velocities, dial should be allowed to record for 60.0 seconds--velocity is equal to dial reading.
11. Take two readings on each anemometer being calibrated at the same velocity without changing the pressure drop across the orifice--record readings and anemometer serial numbers on data sheet. (Figure 3)
Note: A maximum of six test anemometers should be calibrated at one time.
12. Take two more readings on the workbench standard to ensure that the velocity did not change during the test period--record readings on data sheet. (Figure 4)
Note: If velocity changes significantly (+ or - 1 percent from the initial NIST reading), use this NIST reading as initial NIST reading and repeat steps 11 and 12 above.
13. Rotate all anemometers out of the airstream. Reduce test velocity. Repeat steps 5 through 12 for each anemometer at each of the calibration velocities--record all information on data sheet. (Figure 5)
14. When calibrating a workbench standard anemometer repeat steps 5 through 13 two additional times. This procedure will give a 3-point data grouping at each test velocity for increased accuracy of calibration.
Release 1 (December 2009) 3

CALCULATIONS
1. When calibration is performed on a workbench standard anemometer by the Ventilation Division, PSHTC, a plot is constructed showing indicated velocity versus velocity correction factor. This curve is mailed out along with the calibrated instrument to responsible personnel. It must be used in conjunction with the reference instrument for subsequent calibration of field anemometers. (Figure 6)
2. The velocity correction from this curve should be added or subtracted from average indicated velocity readings on the NIST anemometer in columns 4 and 18 of the data sheet to obtain true velocities in columns 5 and 19. (Figure 7)
3. To obtain the velocity correction in Columns 7, 9, 11, 13, 15 and 17, subtract average indicated readings in columns 6, 8, 10, 12, 14 and 16 from the average true velocities. (Figure 8)
Note: Calculate an average true velocity for each test with the following equation:
Column 5 Column19
2
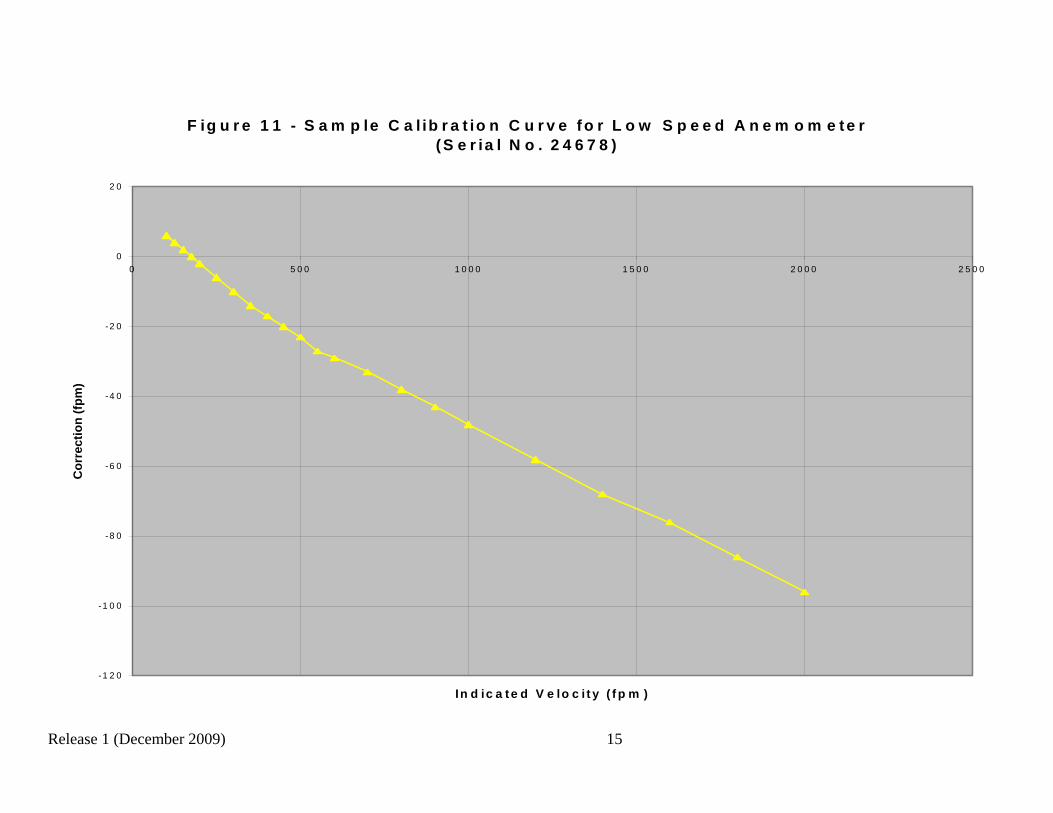
4. Plot on a graph the velocity correction vs. indicated velocity for each instrument. Connect the points with a smooth curve. It is important to realize that velocity correction factors cannot be extrapolated. Therefore, the graphs can not be extended beyond the lowest and highest indicated velocities obtained during calibration. (Figures 9 - 12)
Note: If the anemometer is a workbench standard, there will be three data points to be plotted at each test velocity. The points must be within + or - 1 percent of each other or the odd point must be run again.
5. Read the values from the graph and fill in the correction factor chart for each anemometer calibrated. Tape one copy of the chart to the instrument for quick reference and keep a copy of the charts on file. (Figure 13)
Note: If the lowest indicated velocity obtained during calibration was 100 fpm, then the correction chart cannot be completed for indicated velocities less than 100 fpm.
Release 1 (December 2009) 4

Figure 1 - Sample Anemometer Calibration Data Sheet Completed for Step 8 of Testing Procedure
1 2 3 4 5 6 7 8 9 10 11 12 13 14 15 16 17 18 19 Desired Velocity
Orifice Size
P NIST Anem. Read.
True Vol.
Anem. Read.
1
Corr. Fact.
Anem. Read.
2
Corr. Fact.
Anem. Read.
3
Corr. Fact.
Anem. Read.
4
Corr. Fact.
Anem. Read.
5
Corr. Fact.
Anem. Read.
6
Corr. Fact.
NIST Anem. Read.
True Vol.
2000 6.450 0.29
1500 4.000 1.69
1000 4.000 0.76
750 4.000 0.42
500 4.000 0.19
250 2.842 0.18
100 1.268 0.77
Release 1 (December 2009) 5

Figure 2 - Sample Anemometer Calibration Data Sheet Completed for Step 10 of Testing Procedure
1 2 3 4 5 6 7 8 9 10 11 12 13 14 15 16 17 18 19 Desired Velocity
Orifice Size
P NIST Anem. Read
True Vol.
Anem. Read.
1
Corr. Fact.
Anem. Read.
2
Corr. Fact.
Anem. Read.
3
Corr. Fact.
Anem. Read.
4
Corr. Fact.
Anem. Read.
5
Corr. Fact.
Anem. Read.
6
Corr. Fact.
NIST Anem. Read.
True Vol.
Serial # 34677
2000 6.450 0.29 2141 2142
1500 4.000 1.69
1000 4.000 0.76
750 4.000 0.42
500 4.000 0.19
250 2.842 0.18
100 1.268 0.77
Release 1 (December 2009) 6

Figure 3 - Sample Anemometer Calibration Data Sheet Completed for Step 11 of Testing Procedure
1 2 3 4 5 6 7 8 9 10 11 12 13 14 15 16 17 18 19 Desired Velocity
Orifice Size
P NIST Anem. Read.
True Vol.
Anem. Read.
1
Corr. Fact.
Anem. Read.
2
Corr. Fact.
Anem. Read.
3
Corr. Fact.
Anem. Read.
4
Corr. Fact.
Anem. Read.
5
Corr. Fact.
Anem. Read.
6
Corr. Fact.
NIST Anem. Read.
True Vol.
Serial # 34677
22860
22881 24678 23001
2000 6.450 0.29 2141 2142
2149 2147
2190 2188
2152 2154
2160 2165
1500 4.000 1.69
1000 4.000 0.76
750 4.000 0.42
500 4.000 0.19
250 2.842 0.18
100 1.268 0.77
Release 1 (December 2009) 7

Figure 4 - Sample Anemometer Calibration Data Sheet Completed for Step 12 of Testing Procedure
1 2 3 4 5 6 7 8 9 10 11 12 13 14 15 16 17 18 19 Desired Velocity
Orifice Size
P NIST Anem. Read.
True Vol.
Anem. Read.
1
Corr. Fact.
Anem. Read.
2
Corr. Fact.
Anem. Read.
3
Corr. Fact.
Anem. Read.
4
Corr. Fact.
Anem. Read.
5
Corr. Fact.
Anem. Read.
6
Corr. Fact.
NIST Anem. Read.
True Vol.
Serial # 34677
22860
22881 24678 23001 34677
2000 6.450 0.29 2141 2142
2149 2147
2190 2188
2152 2154
2160 2165
2140 2143
1500 4.000 1.69
1000 4.000 0.76
750 4.000 0.42
500 4.000 0.19
250 2.842 0.18
100 1.268 0.77
Release 1 (December 2009) 8
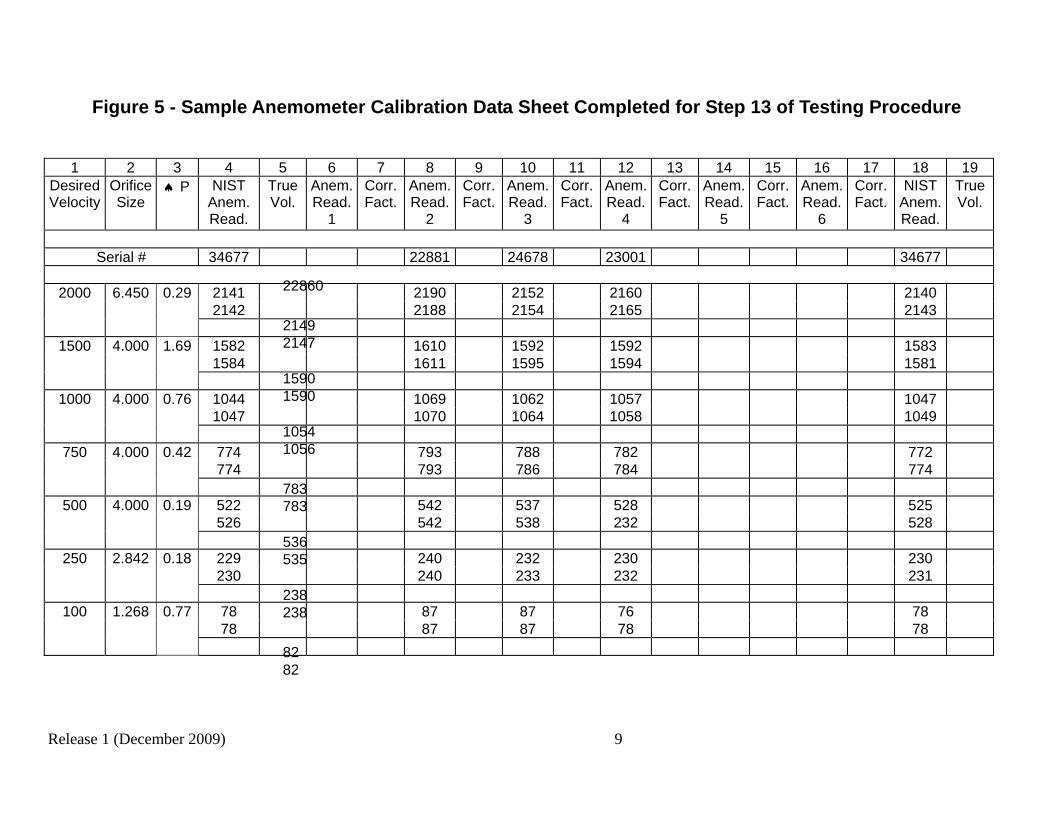
Figure 5 - Sample Anemometer Calibration Data Sheet Completed for Step 13 of Testing Procedure
1 2 3 4 5 6 7 8 9 10 11 12 13 14 15 16 17 18 19 Desired Velocity
Orifice Size
P NIST Anem. Read.
True Vol.
Anem. Read.
1
Corr. Fact.
Anem. Read.
2
Corr. Fact.
Anem. Read.
3
Corr. Fact.
Anem. Read.
4
Corr. Fact.
Anem. Read.
5
Corr. Fact.
Anem. Read.
6
Corr. Fact.
NIST Anem. Read.
True Vol.
Serial # 34677
22860
22881 24678 23001 34677
2000 6.450 0.29 2141 2142
2149 2147
2190 2188
2152 2154
2160 2165
2140 2143
1500 4.000 1.69 1582 1584
1590 1590
1610 1611
1592 1595
1592 1594
1583 1581
1000 4.000 0.76 1044 1047
1054 1056
1069 1070
1062 1064
1057 1058
1047 1049
750 4.000 0.42 774 774
783 783
793 793
788 786
782 784
772 774
500 4.000 0.19 522 526
536 535
542 542
537 538
528 232
525 528
250 2.842 0.18 229 230
238 238
240 240
232 233
230 232
230 231
100 1.268 0.77 78 78
82 82
87 87
87 87
76 78
78 78
Release 1 (December 2009) 9

500 1000 1500 2000 0
Figure 6 - Sam ple Calibration Curve for Low Speed Bench Standard Anem om eter (Serial No. 34677)
2500
20
0
-20
-40
-60
-80
-100
Indicated Velocity (fpm )
Cor
rect
ion
(fpm
)
Release 1 (December 2009) 10

Figure 7 - Sample Anemometer Calibration Data Sheet Completed for Step 2 of Calculations
1 2 3 4 5 6 7 8 9 10 11 12 13 14 15 16 17 18 19 Desired Velocity
Orifice Size
P NIST Anem. Read.
True Vol.
Anem. Read.
1
Corr. Fact.
Anem. Read.
2
Corr. Fact.
Anem. Read.
3
Corr. Fact.
Anem. Read.
4
Corr. Fact.
Anem. Read.
5
Corr. Fact.
Anem. Read.
6
Corr. Fact.
NIST Anem. Read.
True Vol.
Serial # 34677
22860
22881 24678 23001 34677
2000 6.450 0.29 2141 2142
2149 2147
2190 2188
2152 2154
2160 2165
2140 2143
2142 2053 2142 2053 1500 4.000 1.69 1582
1584 1590 1590
1610 1611
1592 1595
1592 1594
1583 1581
1583 1519 1582 1518 1000 4.000 0.76 1044
1047 1054 1056
1069 1070
1062 1064
1057 1058
1047 1049
1046 1008 1048 1010 750 4.000 0.42 774
774 783 783
793 793
788 786
782 784
772 774
774 748 773 747 500 4.000 0.19 522
526 536 535
542 542
537 538
528 232
525 528
524 509 527 512 250 2.842 0.18 229
230 238 238
240 240
232 233
230 232
230 231
230 232 231 233 100 1.268 0.77 78
78 82 82
87 87
87 87
76 78
78 78
78 92 78 92
Release 1 (December 2009) 11

Figure 8 - Sample Anemometer Calibration Data Sheet Completed for Step 3 of Calculations
1 2 3 4 5 6 7 8 9 10 11 12 13 14 15 16 17 18 19 Desired Velocity
Orifice Size
P NIST Anem. Read.
True Vol.
Anem. Read.
1
Corr. Fact.
Anem. Read.
2
Corr. Fact.
Anem. Read.
3
Corr. Fact.
Anem. Read.
4
Corr. Fact.
Anem. Read.
5
Corr. Fact.
Anem. Read.
6
Corr. Fact.
NIST Anem. Read.
True Vol.
Serial # 34677
22860
22881 24678 23001 34677
2000 6.450 0.29 2141 2142
2149 2147
2190 2188
2152 2154
2160 2165
2140 2143
2142 2053 2148 -95 2189 -136 2153 -100 2163 -110 2142 2053 1500 4.000 1.69 1582
1584 1590 1590
1610 1611
1592 1595
1592 1594
1583 1581
1583 1519 1519 -71 1611 -92 1594 -75 1593 -74 1582 1518 1000 4.000 0.76 1044
1047 1054 1056
1069 1070
1062 1064
1057 1058
1047 1049
1046 1008 1055 -47 1070 -62 1063 -55 1058 -50 1048 1010 750 4.000 0.42 774
774 783 783
793 793
788 786
782 784
772 774
774 748 783 -35 793 -45 787 -39 783 -35 773 747 500 4.000 0.19 522
526 536 535
542 542
537 538
528 232
525 528
524 509 536 -27 542 -18 538 -29 530 -21 527 512 250 2.842 0.18 229
230 238 238
240 240
232 233
230 232
230 231
230 232 238 -6 240 -8 233 -1 231 1 231 233 100 1.268 0.77 78
78 82 82
87 87
87 87
76 78
78 78
78 92 82 10 87 5 87 5 77 15 78 92
Release 1 (December 2009) 12

0 5 0 0 1 0 0 0 1 5 0 0 2 0 0 0
F ig u re 9 - S a m p le C a lib ra tio n C u rv e fo r L o w S p e e d A n e m o m e te r (S e r ia l N o . 2 2 8 6 0 )
2 5 0 0
2 0
0
-2 0
-4 0
-6 0
-8 0
-1 0 0
In d ic a te d V e lo c ity ( fp m )
Cor
rect
ion
(fpm
)
Release 1 (December 2009) 13

0 500 1000 1500 2000
Figure 10 - Sam ple Calibration Curve for Low Speed Anem om eter (Serial No. 22881)
2500
20
0
-20
-40
-60
-80
-100
-120
-140
Indicated Velocity (fpm )
Cor
rect
ion
(fpm
)
Release 1 (December 2009) 14
0 5 0 0 1 0 0 0 1 5 0 0 2 0 0 0
F ig u r e 1 1 - S a m p le C a l ib r a t io n C u r v e fo r L o w S p e e d A n e m o m e te r (S e r ia l N o . 2 4 6 7 8 )
2 5 0 0
Cor
rect
ion
(fpm
)
2 0
0
-2 0
-4 0
-6 0
-8 0
-1 0 0
-1 2 0
In d ic a te d V e lo c i t y ( f p m )
Release 1 (December 2009) 15

0 500 1000 1500 2000
Figure 12 - Sam ple Calibration Curve for Low Speed Anem om eter (Serial No. 23001)
2500
Cor
rect
ion
(fpm
)
20
0
-20
-40
-60
-80
-100
-120
Indicated Velocity (fpm )
Release 1 (December 2009) 16

Figure 13 - Sample Correction Factor Charts for Calibrated Anemometers
Serial No. 22860 1/18/1989
Serial No. 22881 1/18/1989
Serial No. 24678 1/18/1989
Serial No. 23001 1/18/1989
Serial No. 34677 5/1988
Ind. Vel. Corr. Ind. Vel. Corr. Ind. Vel. Corr. Ind. Vel. Corr. Ind. Vel. Corr 100 8 100 6 100 6 100 12 100 14 125 5 125 3 125 4 125 10 250 2 150 2 150 0 150 2 150 8 500 -15 175 0 175 -2 175 0 175 6 750 -26 200 -2 200 -4 200 -2 200 4 1000 -38 250 -4 250 -8 250 -6 250 0 1500 -64 300 -10 300 -10 300 -10 300 -4 2000 -89 350 -14 350 -13 350 -14 350 -8 400 -17 400 -16 400 -17 400 -10 450 -20 450 -20 450 -20 450 -15 500 -23 500 -23 500 -23 500 -18 550 -25 550 -26 550 -27 550 -22 600 -28 600 -29 600 -29 600 -24 700 -32 700 -36 700 -33 700 -30 800 -36 800 -43 800 -38 800 -36 900 -40 900 -48 900 -43 900 -43
1000 -45 1000 -55 1000 -48 1000 -48 1200 -53 1200 -68 1200 -58 1200 -59 1400 -62 1400 -80 1400 -68 1400 -69 1600 -70 1600 -93 1600 -76 1600 -79 1800 -79 1800 -106 1800 -86 1800 -88 2000 -88 2000 -120 2000 -96 2000 -97
Release 1 (December 2009) 17

Cor
rect
ion
(fpm
)
20
0
20
40
60
80
100
120
140
Figure 14 - Combined Sample Calibration Curves for Low Speed Anemometers
0 500 1000 1500 2000 2500
Serial No. 22860 Serial No. 22881 Serial No. 24678 Serial No. 23001
Indicated Velocity (fpm)
Release 1 (December 2009) 18


![MINE HEALTH AND SAFETY ACT MINE HEALTH AND SAFETY … · 2020. 3. 3. · MINE HEALTH AND SAFETY ACT Act 29 of 1996. MINE HEALTH AND SAFETY REGULATIONS [Updated to 10 July 2015] GoN](https://static.fdocuments.net/doc/165x107/5fbae47e1285806f6b225315/mine-health-and-safety-act-mine-health-and-safety-2020-3-3-mine-health-and.jpg)