MSE 3300-Lecture Note 15-Chapter 09 Phase Diagrams
24
MSE 3300 / 5300 UTA Spring 2015 Lecture 15 - Lecture 15. Phase Diagrams (2) Learning Objectives After this lecture, you should be able to do the following: 1. Understand and describe binary eutectic systems. 2. Understand and describe the iron–iron carbide phase diagram. Reading • Chapter 9: Phase Diagrams (9.11–9.20) Multimedia • Virtual Materials Science & Engineering (VMSE): http://www.wiley.com/college/callister/CL_EWSTU01031_S/vmse/ 1
description
MSE 3300-Lecture Note 15-Chapter 09 Phase Diagrams
Transcript of MSE 3300-Lecture Note 15-Chapter 09 Phase Diagrams
MSE 3300 / 5300 UTA Spring 2015 Lecture 15 -
Lecture 15. Phase Diagrams (2)
Learning ObjectivesAfter this lecture, you should be able to do the following:
1. Understand and describe binary eutectic systems. 2. Understand and describe the iron–iron carbide phase diagram.
Reading• Chapter 9: Phase Diagrams (9.11–9.20)
Multimedia• Virtual Materials Science & Engineering (VMSE):
http://www.wiley.com/college/callister/CL_EWSTU01031_S/vmse/
1
MSE 3300 / 5300 UTA Spring 2015 Lecture 15 -
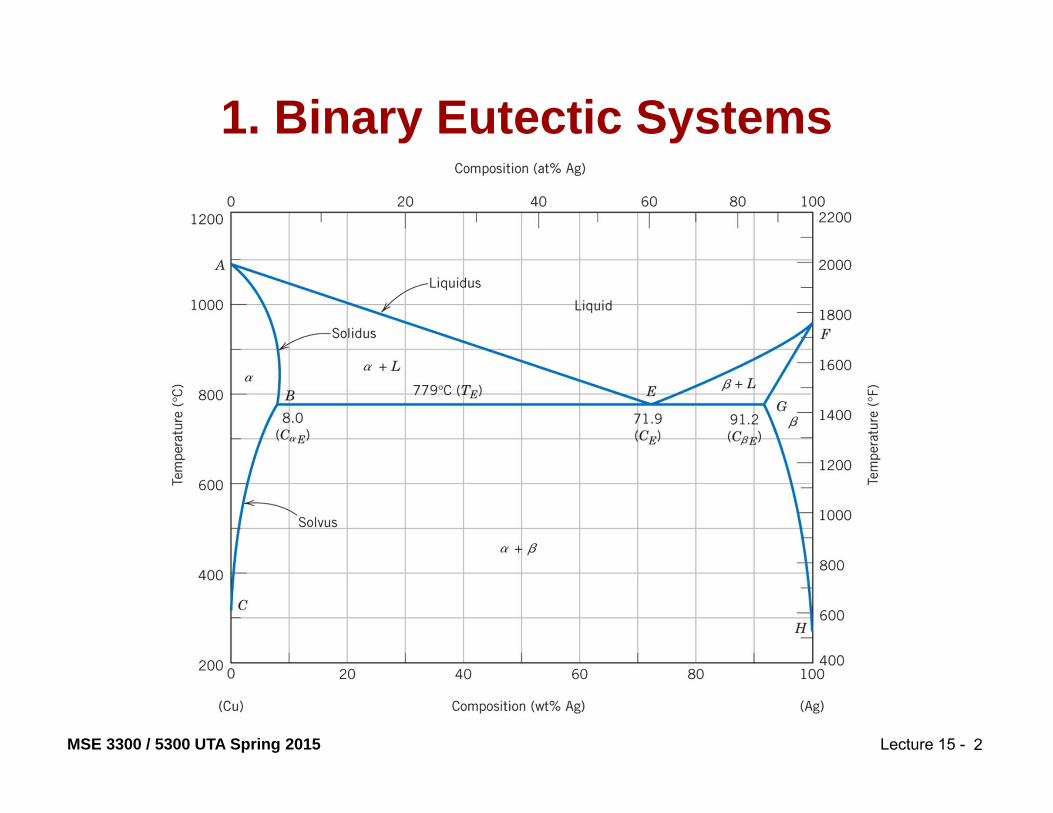
1. Binary Eutectic Systems
2
MSE 3300 / 5300 UTA Spring 2015 Lecture 15 -
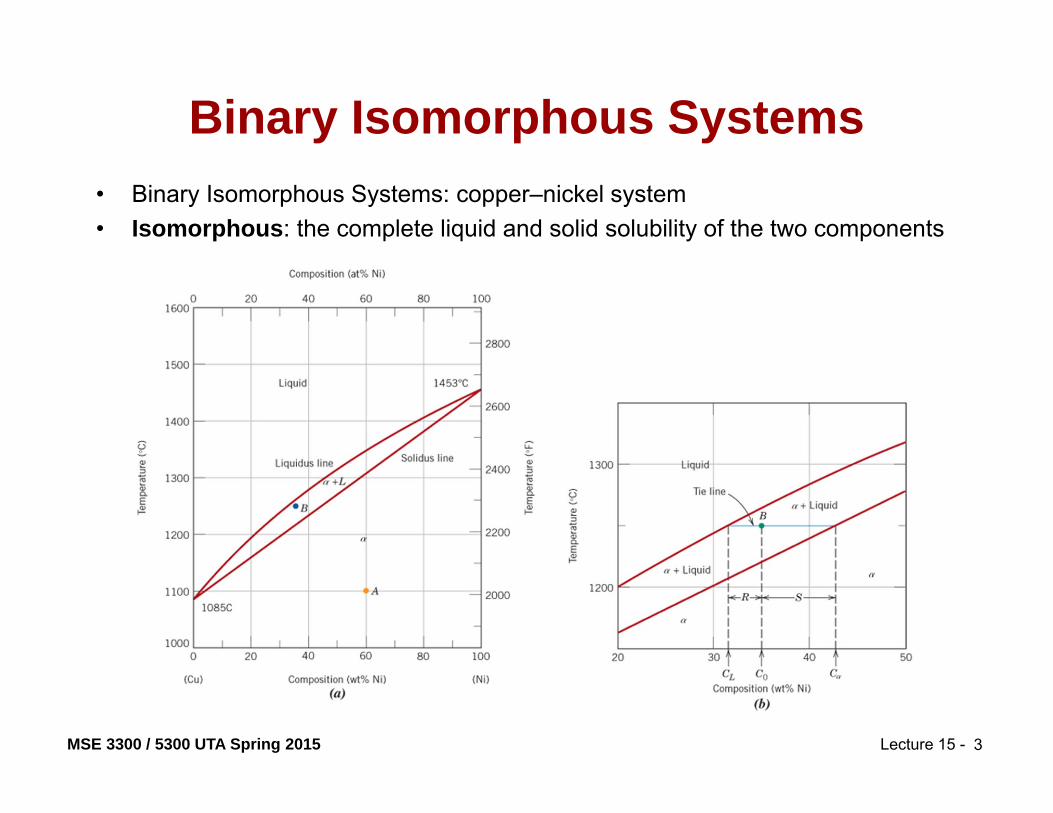
Binary Isomorphous Systems
3
• Binary Isomorphous Systems: copper–nickel system• Isomorphous: the complete liquid and solid solubility of the two components

MSE 3300 / 5300 UTA Spring 2015 Lecture 15 - 4
2 componentshas a special compositionwith a min. melting T.
Binary-Eutectic Systems
• 3 single phase regions (L, α, β)
• Limited solubility: α: mostly Cu β: mostly Ag
• TE : No liquid below TE
: Composition at temperature TE
• CE
Ex.: Cu-Ag systemCu-Agsystem
L (liquid)
α L + α L+ββ
α β
C, wt% Ag20 40 60 80 1000
200
1200T(°C)
400
600
800
1000
CE
TE 8.0 71.9 91.2779°C
cooling
heating
• Eutectic reactionL(CE) α(CαE) + β(CβE)
MSE 3300 / 5300 UTA Spring 2015 Lecture 15 -
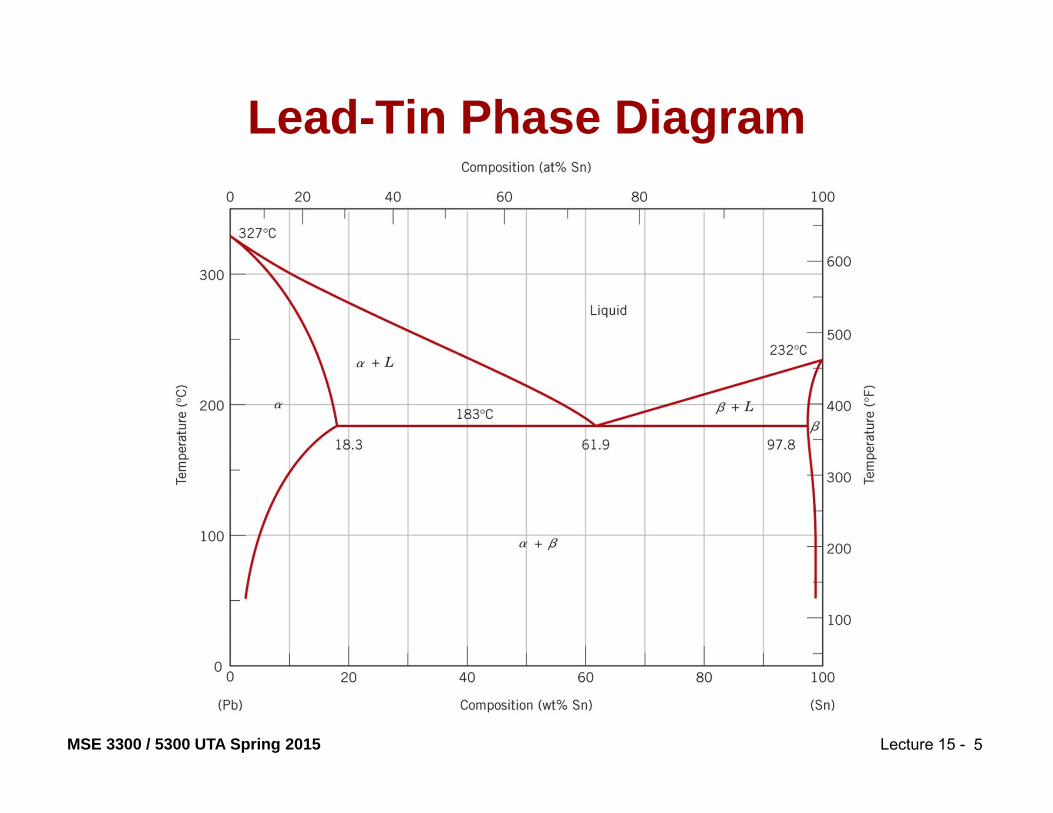
Lead-Tin Phase Diagram
5

MSE 3300 / 5300 UTA Spring 2015 Lecture 15 - 6
L+αL+β
α +β
200
T(°C)
18.3
C, wt% Sn20 60 80 1000
300
100
L (liquid)
α 183°C61.9 97.8
β
• For a 40 wt% Sn-60 wt% Pb alloy at 150°C, determine:-- the phases present Pb-Sn
system
EX 1: Pb-Sn Eutectic System
Answer: α + β-- the phase compositions
-- the relative amountof each phase
150
40C0
11Cα
99Cβ
SR
Answer: Cα = 11 wt% SnCβ = 99 wt% Sn
Wα=Cβ - C0Cβ - Cα
= 99 - 4099 - 11 = 59
88 = 0.67
SR+S =
Wβ=C0 - CαCβ - Cα
=RR+S
= 2988
= 0.33= 40 - 1199 - 11
Answer:
MSE 3300 / 5300 UTA Spring 2015 Lecture 15 - 7
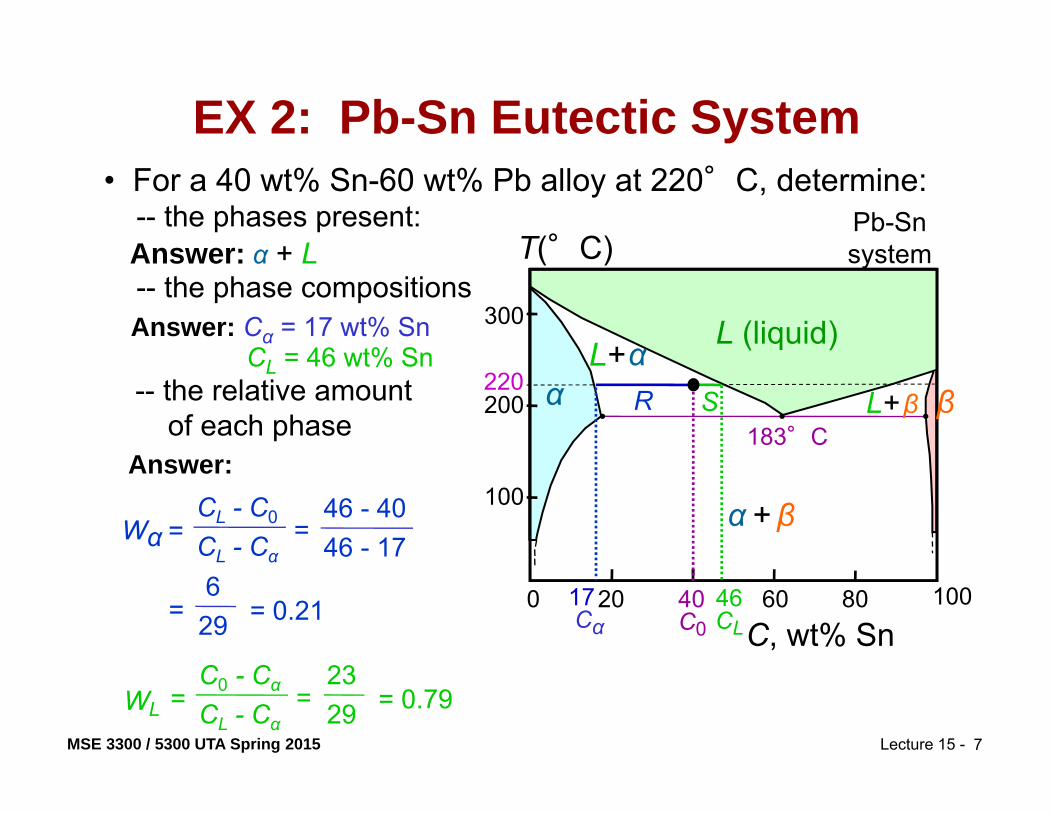
Answer: Cα = 17 wt% Sn-- the phase compositions
L+β
α +β
200
T(°C)
C, wt% Sn20 60 80 1000
300
100
L (liquid)
α βL+ α
183°C
• For a 40 wt% Sn-60 wt% Pb alloy at 220°C, determine:-- the phases present: Pb-Sn
system
EX 2: Pb-Sn Eutectic System
-- the relative amountof each phase
Wα =CL - C0
CL - Cα=
46 - 4046 - 17
=629 = 0.21
WL =C0 - Cα
CL - Cα=
2329 = 0.79
40C0
46CL
17Cα
220SR
Answer: α + L
CL = 46 wt% Sn
Answer:

MSE 3300 / 5300 UTA Spring 2015 Lecture 15 - 8
• For alloys for which C0 < 2 wt% Sn
• Result: at room temperature-- polycrystalline with grains of
α phase having composition C0
Microstructural Developments in Eutectic Systems I
0
L+ α200
T(°C)
C, wt% Sn10
2
20C0
300
100
L
α
30
α+β
400
(room T solubility limit)
TE(Pb-SnSystem)
αL
L: C0 wt% Sn
α: C0 wt% Sn
Fig. 9.11, Callister & Rethwisch 9e.

MSE 3300 / 5300 UTA Spring 2015 Lecture 15 - 9
• For alloys for which 2 wt% Sn < C0 < 18.3 wt% Sn
• Result: at temperatures in α + β range-- polycrystalline with α grainsand small β-phase particles
Fig. 9.12, Callister & Rethwisch 9e.
Microstructural Developments in Eutectic Systems II
Pb-Snsystem
L + α
200
T(°C)
C, wt% Sn10
18.3
200C0
300
100
L
α
30
α+ β
400
(sol. limit at TE)
TE
2(sol. limit at Troom)
Lα
L: C0 wt% Sn
αβ
α: C0 wt% Sn

MSE 3300 / 5300 UTA Spring 2015 Lecture 15 - 10
• For alloy of composition C0 = CE• Result: Eutectic microstructure (lamellar structure)
-- alternating layers (lamellae) of α and β phases.
Fig. 9.13, Callister & Rethwisch 9e.
Microstructural Developments in Eutectic Systems III
This microstructure consists of alternating layers of a lead rich -phase solid solution (dark layers), and a tin-rich -phase solid solution (light layers).
160μm
Micrograph of Pb-Sn eutectic microstructure
Pb-Snsystem
Lβ
αβ
200
T(°C)
C, wt% Sn20 60 80 1000
300
100
L
α βL+ α
183°C
40
TE
18.3
α: 18.3 wt%Sn
97.8
β: 97.8 wt% Sn
CE61.9
L: C0 wt% Sn
MSE 3300 / 5300 UTA Spring 2015 Lecture 15 - 11
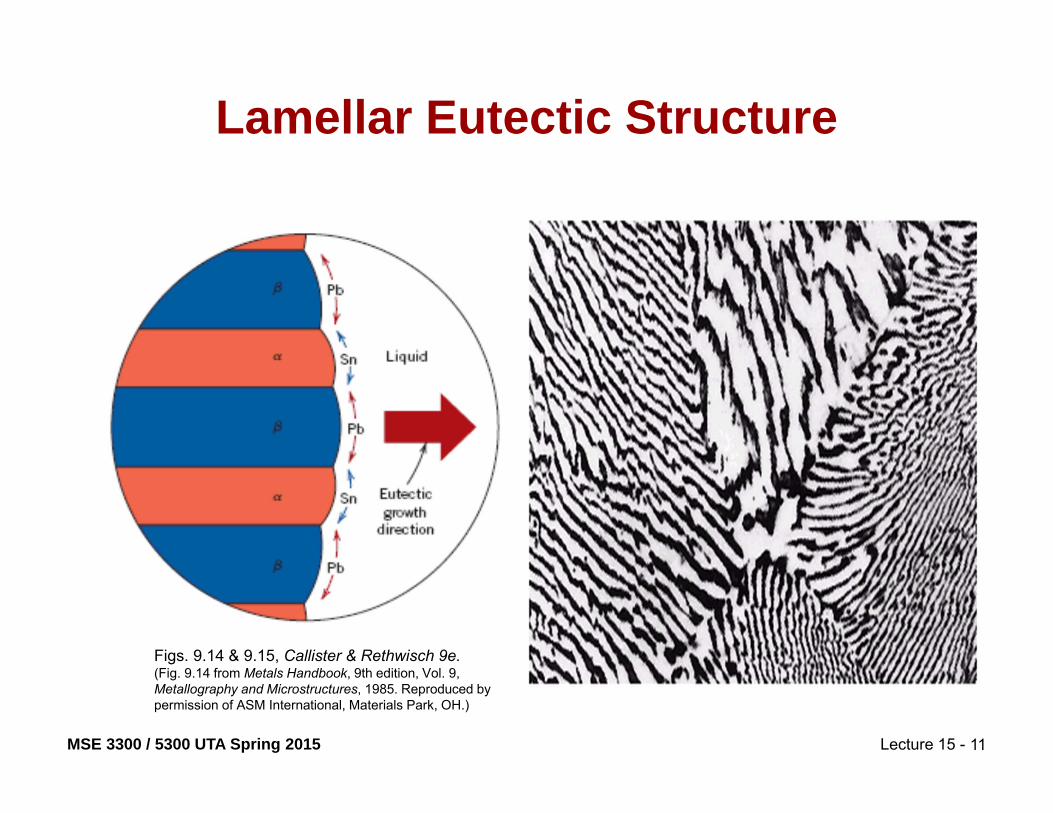
Lamellar Eutectic Structure
Figs. 9.14 & 9.15, Callister & Rethwisch 9e.(Fig. 9.14 from Metals Handbook, 9th edition, Vol. 9, Metallography and Microstructures, 1985. Reproduced by permission of ASM International, Materials Park, OH.)

MSE 3300 / 5300 UTA Spring 2015 Lecture 15 - 12
• For alloys for which 18.3 wt% Sn < C0 < 61.9 wt% Sn• Result: α phase particles and a eutectic microconstituent
Microstructural Developments in Eutectic Systems IV
18.3 61.9
SR
97.8
SR
primary αeutectic α
eutectic β
WL = (1-Wα) = 0.50
Cα = 18.3 wt% SnCL = 61.9 wt% Sn
SR + S
Wα = = 0.50
• Just above TE :
• Just below TE :Cα = 18.3 wt% SnCβ = 97.8 wt% Sn
SR + S
Wα = = 0.73
Wβ = 0.27Fig. 9.16, Callister & Rethwisch 9e.
Pb-Snsystem
L+β200
T(°C)
C, wt% Sn
20 60 80 1000
300
100
L
α βL+α
40
α+ β
TE
L: C0 wt% Sn LαLα
MSE 3300 / 5300 UTA Spring 2015 Lecture 15 - 13
L+αL+β
α +β
200
C, wt% Sn20 60 80 1000
300
100
L
α βTE
40
(Pb-Sn System)
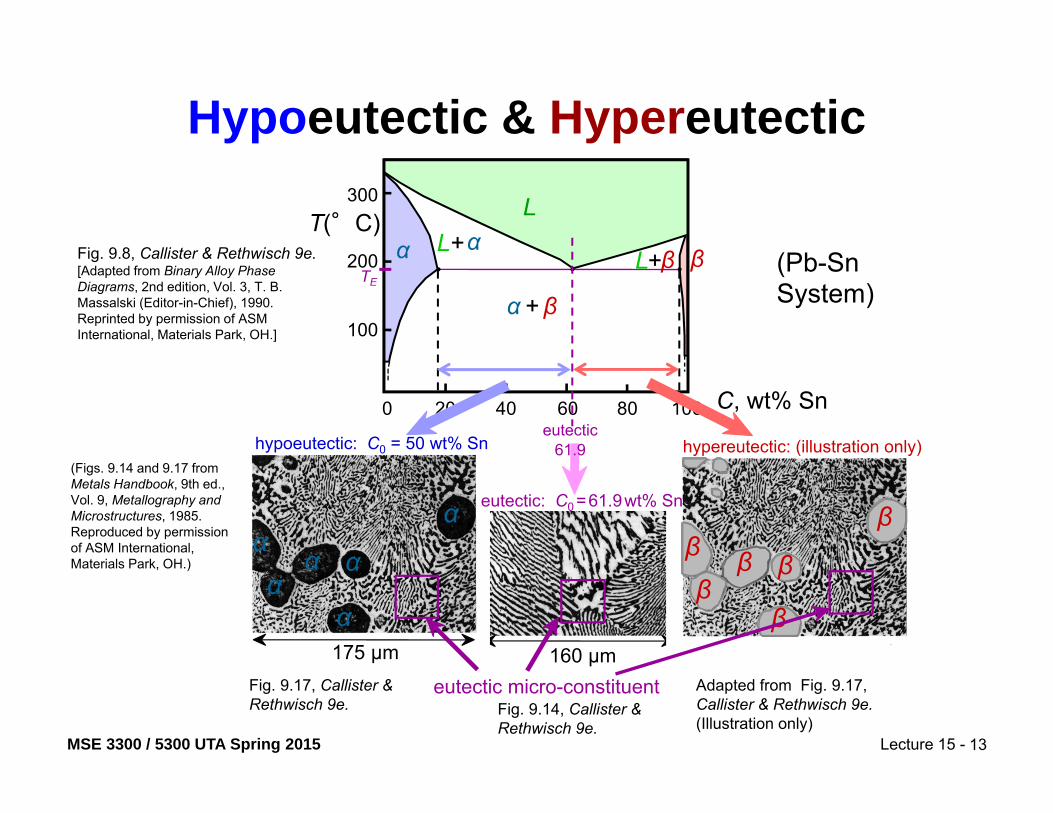
Hypoeutectic & Hypereutectic
Fig. 9.8, Callister & Rethwisch 9e.[Adapted from Binary Alloy Phase Diagrams, 2nd edition, Vol. 3, T. B. Massalski (Editor-in-Chief), 1990. Reprinted by permission of ASM International, Materials Park, OH.]
160 μmeutectic micro-constituent
Fig. 9.14, Callister & Rethwisch 9e.
hypereutectic: (illustration only)
β
βββ
β
β
Adapted from Fig. 9.17, Callister & Rethwisch 9e.(Illustration only)
(Figs. 9.14 and 9.17 from Metals Handbook, 9th ed., Vol. 9, Metallography and Microstructures, 1985.Reproduced by permission of ASM International,Materials Park, OH.)
175 μm
α
α
α
ααα
hypoeutectic: C0 = 50 wt% Sn
Fig. 9.17, Callister & Rethwisch 9e.
T(°C)
61.9eutectic
eutectic: C0 =61.9wt% Sn
MSE 3300 / 5300 UTA Spring 2015 Lecture 15 -
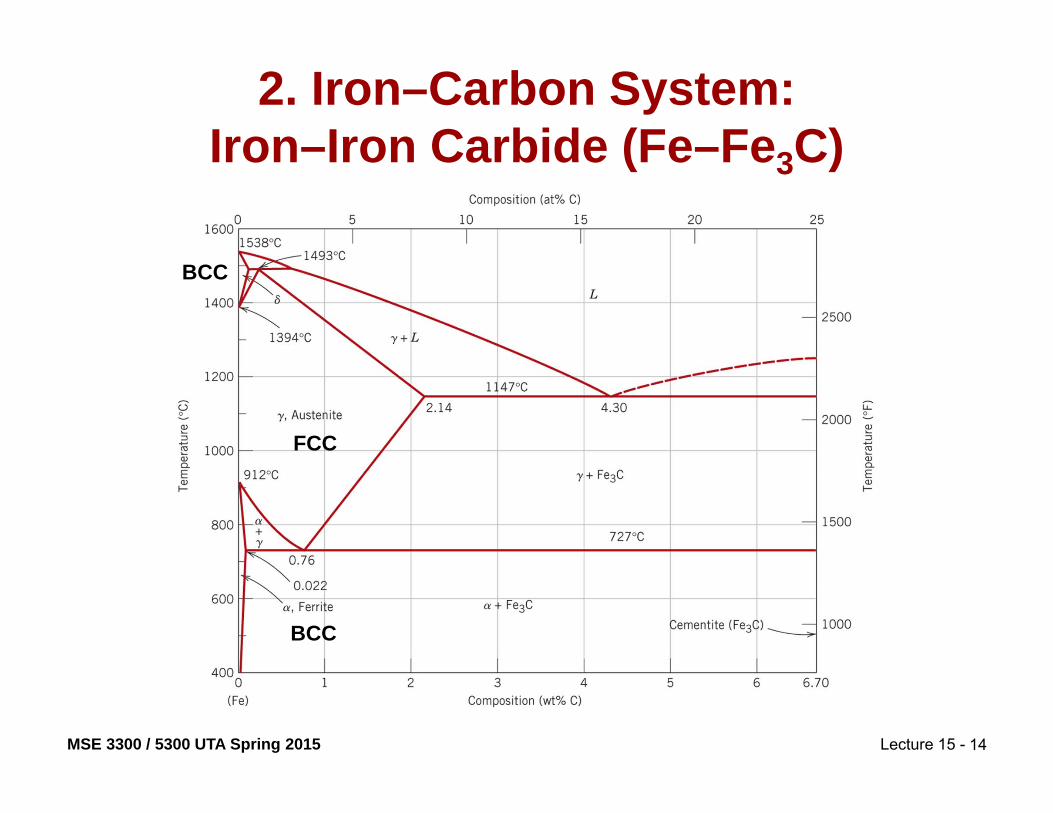
2. Iron–Carbon System:Iron–Iron Carbide (Fe–Fe3C)
14
BCC
FCC
BCC
MSE 3300 / 5300 UTA Spring 2015 Lecture 15 - 15
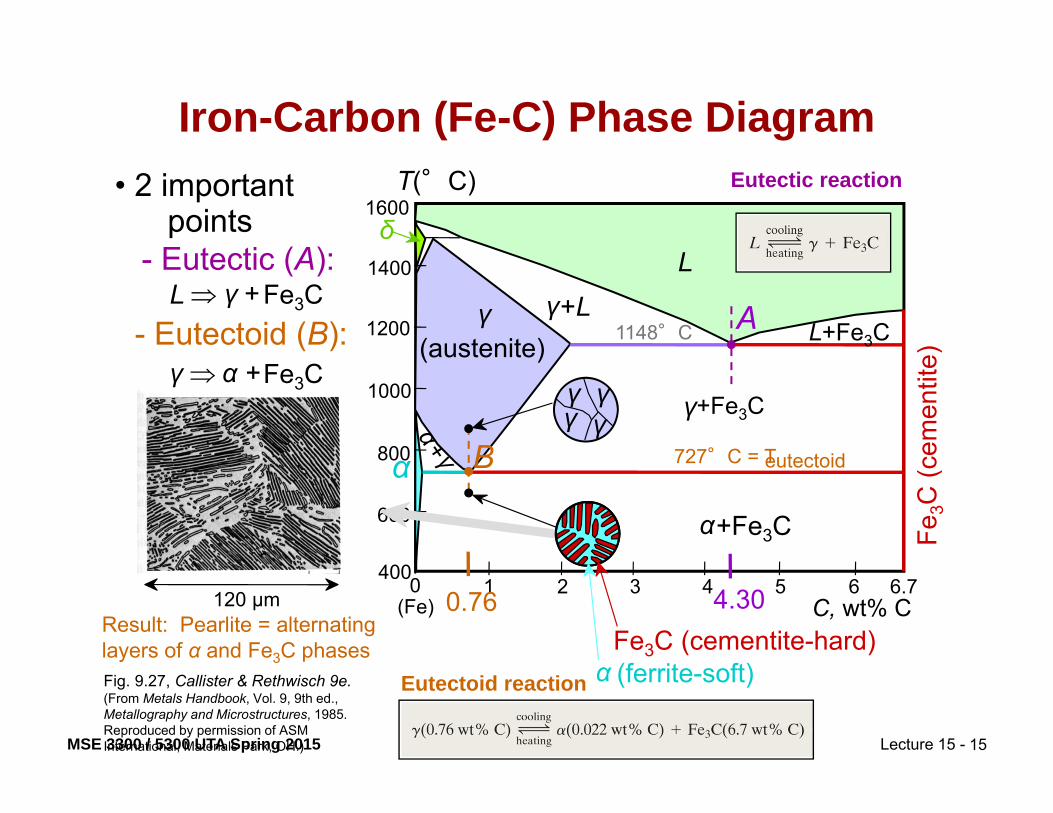
Iron-Carbon (Fe-C) Phase Diagram• 2 important
points
- Eutectoid (B):γ α +Fe3C
- Eutectic (A):L γ +Fe3C
Fe3C
(cem
entit
e)
1600
1400
1200
1000
800
600
4000 1 2 3 4 5 6 6.7
L
γ(austenite)
γ+L
γ+Fe3C
α+Fe3C
δ
(Fe) C, wt% C
1148°C
T(°C)
α 727°C = Teutectoid
4.30Result: Pearlite = alternatinglayers of α and Fe3C phases
120 μm
Fig. 9.27, Callister & Rethwisch 9e.(From Metals Handbook, Vol. 9, 9th ed.,Metallography and Microstructures, 1985.Reproduced by permission of ASM International, Materials Park, OH.)
0.76
Bγ γ
γγ
A L+Fe3C
Fe3C (cementite-hard)α (ferrite-soft)
Eutectic reaction
Eutectoid reaction
MSE 3300 / 5300 UTA Spring 2015 Lecture 15 - 16Fe
3C (c
emen
tite)
1600
1400
1200
1000
800
600
4000 1 2 3 4 5 6 6.7
L
γ(austenite)
γ+L
γ + Fe3C
α + Fe3C
L+Fe3C
δ
(Fe) C, wt% C
1148°C
T(°C)
727°C
(Fe-C System)
C0
0.76
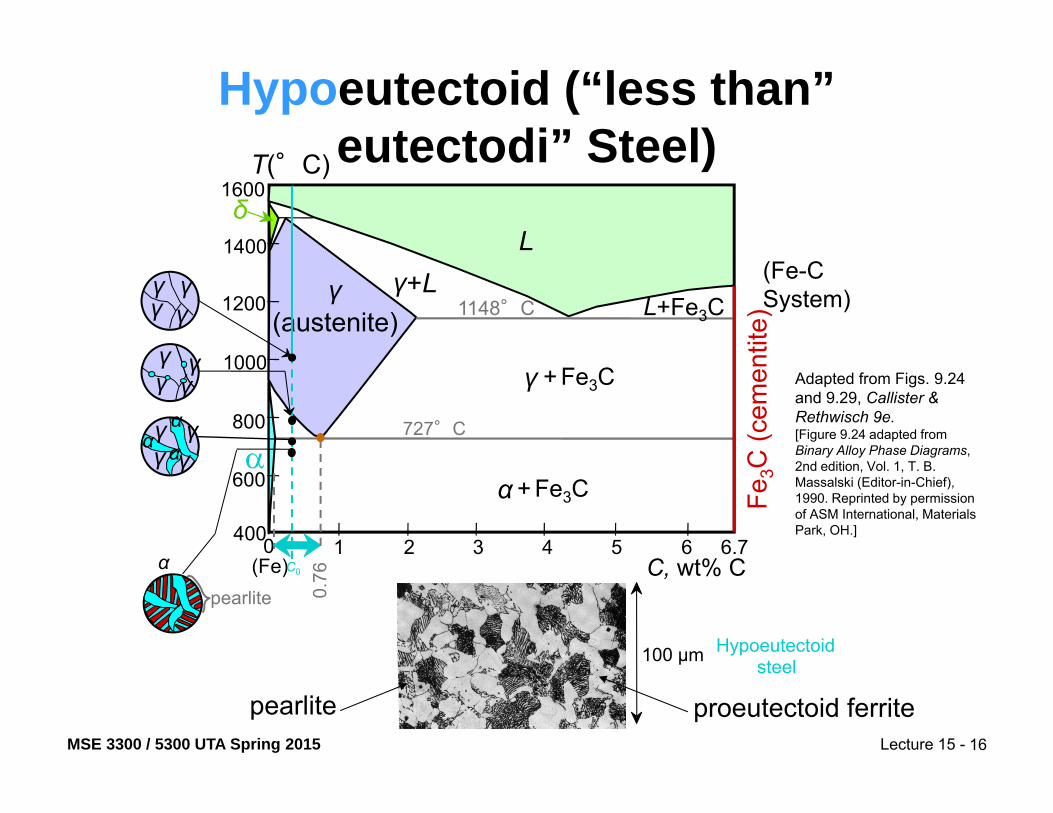
Hypoeutectoid (“less than” eutectodi” Steel)
Adapted from Figs. 9.24 and 9.29, Callister & Rethwisch 9e.[Figure 9.24 adapted from Binary Alloy Phase Diagrams, 2nd edition, Vol. 1, T. B. Massalski (Editor-in-Chief), 1990. Reprinted by permission of ASM International, Materials Park, OH.]
proeutectoid ferritepearlite
100 μm Hypoeutectoidsteel
α
pearlite
γγ γ
γααα
γγγ γ
γ γγγ

MSE 3300 / 5300 UTA Spring 2015 Lecture 15 - 17Fe
3C (c
emen
tite)
1600
1400
1200
1000
800
600
4000 1 2 3 4 5 6 6.7
L
γ(austenite)
γ+L
γ + Fe3C
α + Fe3C
L+Fe3C
δ
(Fe) C, wt% C
1148°C
T(°C)
α727°C
(Fe-C System)
C0
0.76
Hypoeutectoid Steel
γγ γ
γααα
srWα = s/(r +s)Wγ =(1 - Wα)
R Sα
pearlite
Wpearlite = WγWα’ = S/(R +S)W =(1 – Wα’)Fe3C
Adapted from Fig. 9.30, Callister & Rethwisch 9e.(Photomicrograph courtesy of Republic Steel Corporation.)
proeutectoid ferritepearlite
100 μm Hypoeutectoidsteel
Adapted from Figs. 9.24 and 9.29, Callister & Rethwisch 9e.[Figure 9.24 adapted from Binary Alloy Phase Diagrams, 2nd edition, Vol. 1, T. B. Massalski (Editor-in-Chief), 1990. Reprinted by permission of ASM International, Materials Park, OH.]
MSE 3300 / 5300 UTA Spring 2015 Lecture 15 -Fe
3C (c
emen
tite)
1600
1400
1200
1000
800
600
4000 1 2 3 4 5 6 6.7
L
γ(austenite)
γ+L
γ + Fe3C
α + Fe3C
L+Fe3C
δ
(Fe) C, wt% C
1148°C
T(°C)
α727°C
(Fe-C System)
C0
18
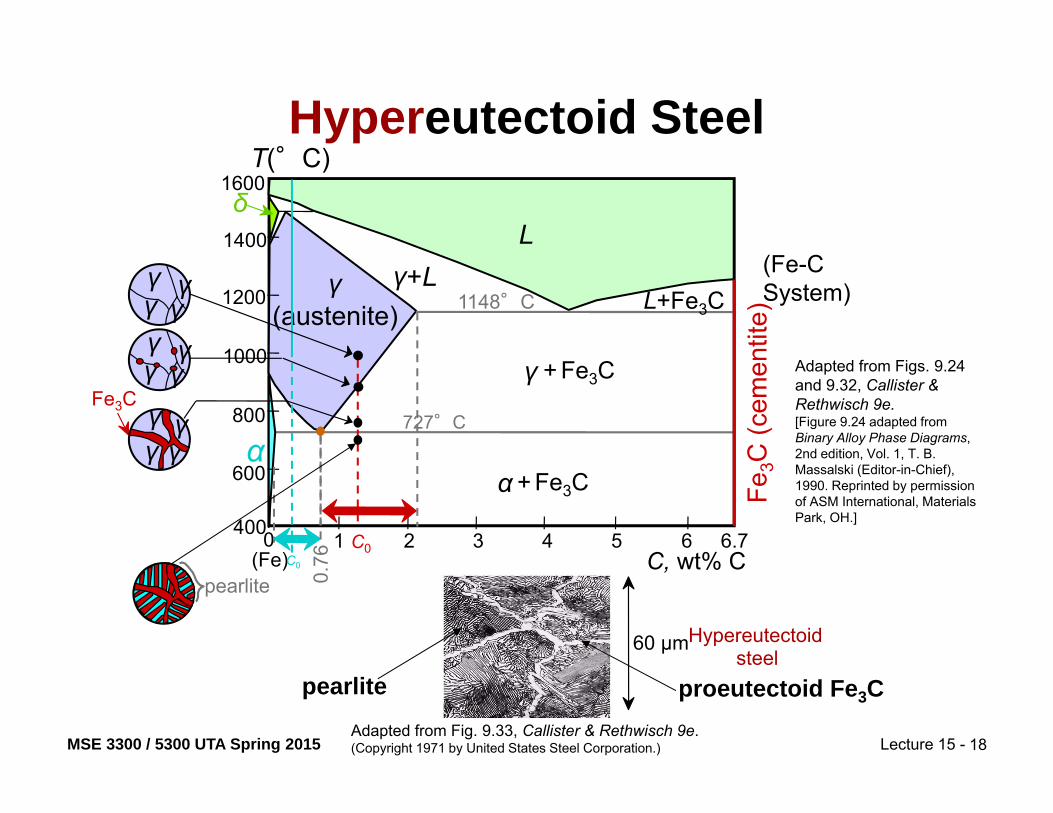
Hypereutectoid Steel
0.76
C0
Fe3C
γγγ γ
γγγ γγγ
γ γ
Adapted from Fig. 9.33, Callister & Rethwisch 9e. (Copyright 1971 by United States Steel Corporation.)
proeutectoid Fe3C
60 μmHypereutectoid steel
pearlite
pearlite
Adapted from Figs. 9.24 and 9.32, Callister & Rethwisch 9e.[Figure 9.24 adapted from Binary Alloy Phase Diagrams, 2nd edition, Vol. 1, T. B. Massalski (Editor-in-Chief), 1990. Reprinted by permission of ASM International, Materials Park, OH.]
MSE 3300 / 5300 UTA Spring 2015 Lecture 15 -Fe
3C (c
emen
tite)
1600
1400
1200
1000
800
600
4000 1 2 3 4 5 6 6.7
L
γ(austenite)
γ+L
γ + Fe3C
α + Fe3C
L+Fe3C
δ
(Fe) C, wt% C
1148°C
T(°C)
α727°C
(Fe-C System)
C0
Adapted from Fig. 9.33, Callister & Rethwisch 9e. (Copyright 1971 by United States Steel Corporation.)
proeutectoid Fe3C
60 μmHypereutectoid steel
pearlite
Adapted from Figs. 9.24 and 9.32, Callister & Rethwisch 9e.[Figure 9.24 adapted from Binary Alloy Phase Diagrams, 2nd edition, Vol. 1, T. B. Massalski (Editor-in-Chief), 1990. Reprinted by permission of ASM International, Materials Park, OH.]
19
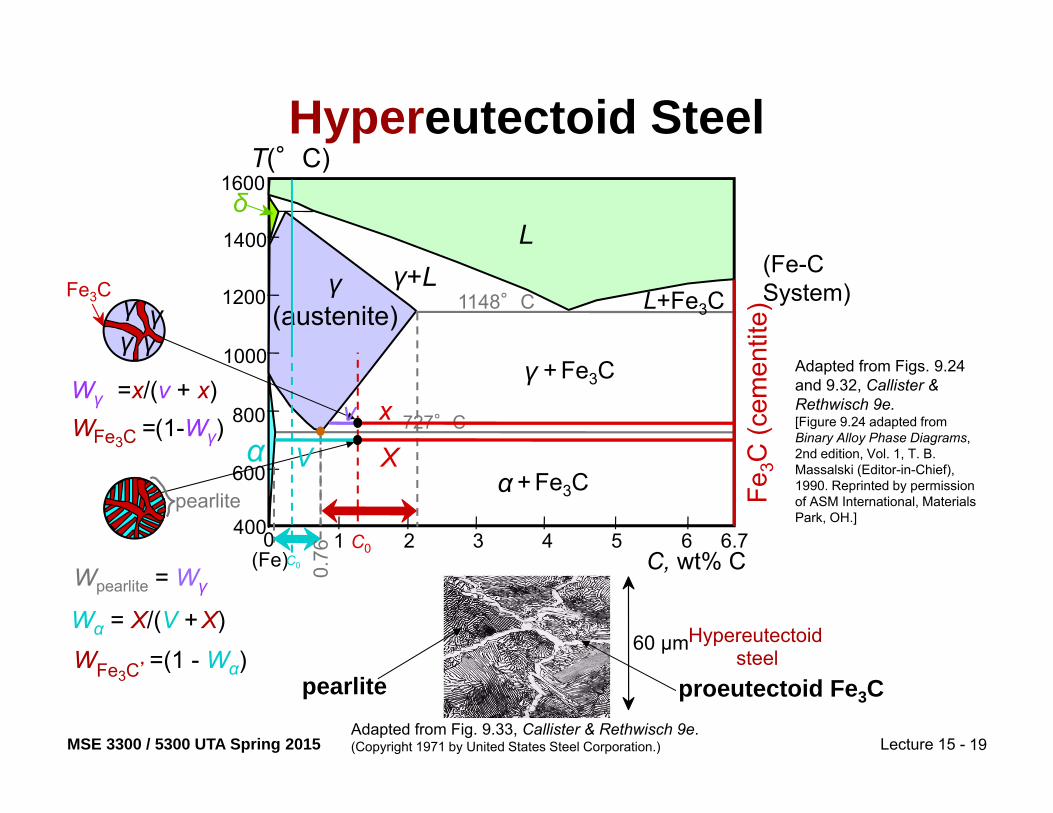
Hypereutectoid Steel
0.76
C0
pearlite
Fe3C
γγγ γ
xv
V X
Wpearlite = Wγ
Wα = X/(V +X)
W =(1 - Wα)Fe3C’
W =(1-Wγ)Wγ =x/(v + x)
Fe3C

MSE 3300 / 5300 UTA Spring 2015 Lecture 15 - 20
Example ProblemFor a 99.6 wt% Fe-0.40 wt% C steel at a
temperature just below the eutectoid, determine the following:
a) The compositions of Fe3C and ferrite (α).b) The amount of cementite (in grams) that
forms in 100 g of steel.c) The amounts of pearlite and proeutectoid
ferrite (α) in the 100 g.
MSE 3300 / 5300 UTA Spring 2015 Lecture 15 - 21
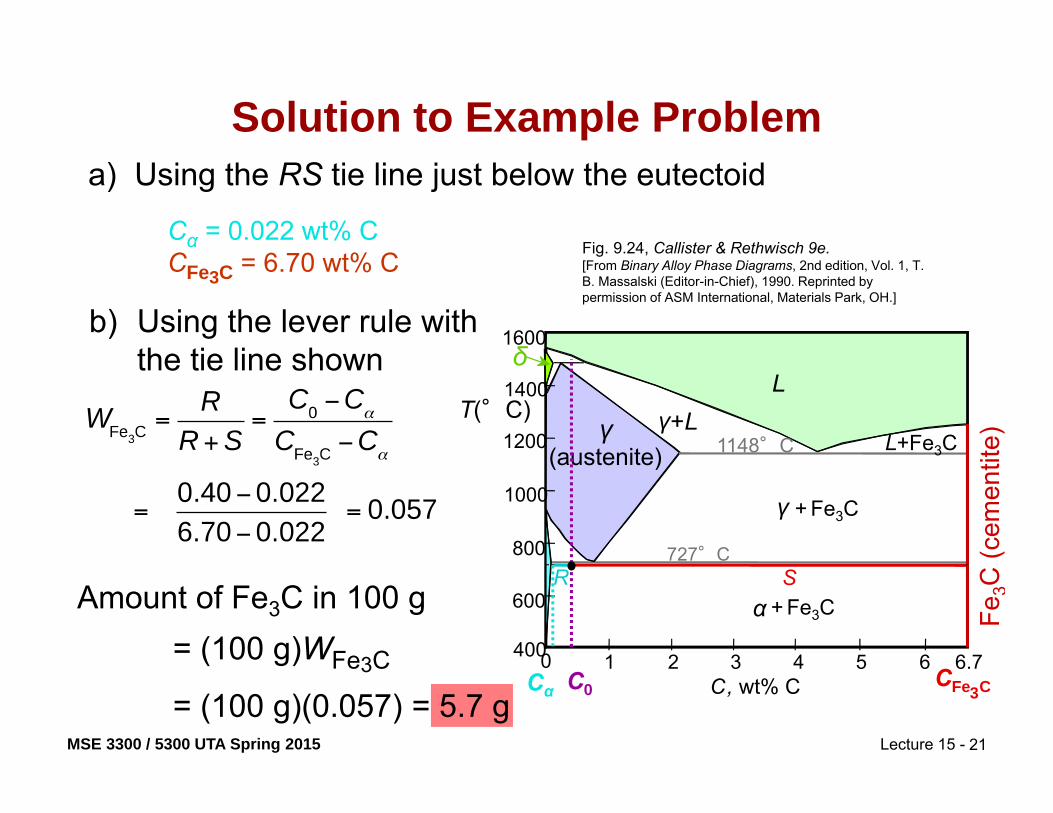
Solution to Example Problem
b) Using the lever rule with the tie line shown
a) Using the RS tie line just below the eutectoid
Cα = 0.022 wt% CCFe3C = 6.70 wt% C
Fe3C
(cem
entit
e)
1600
1400
1200
1000
800
600
4000 1 2 3 4 5 6 6.7
L
γ(austenite)
γ+L
γ + Fe3C
α + Fe3C
L+Fe3C
δ
C, wt% C
1148°C
T(°C)
727°C
C0
R S
CFe C3Cα
Amount of Fe3C in 100 g = (100 g)WFe3C
= (100 g)(0.057) = 5.7 g
Fig. 9.24, Callister & Rethwisch 9e.[From Binary Alloy Phase Diagrams, 2nd edition, Vol. 1, T. B. Massalski (Editor-in-Chief), 1990. Reprinted by permission of ASM International, Materials Park, OH.]
MSE 3300 / 5300 UTA Spring 2015 Lecture 15 -
Fe3C
(cem
entit
e)
1600
1400
1200
1000
800
600
4000 1 2 3 4 5 6 6.7
L
γ(austenite)
γ+L
γ + Fe3C
α + Fe3C
L+Fe3C
δ
C, wt% C
1148°C
T(°C)
727°°C
22
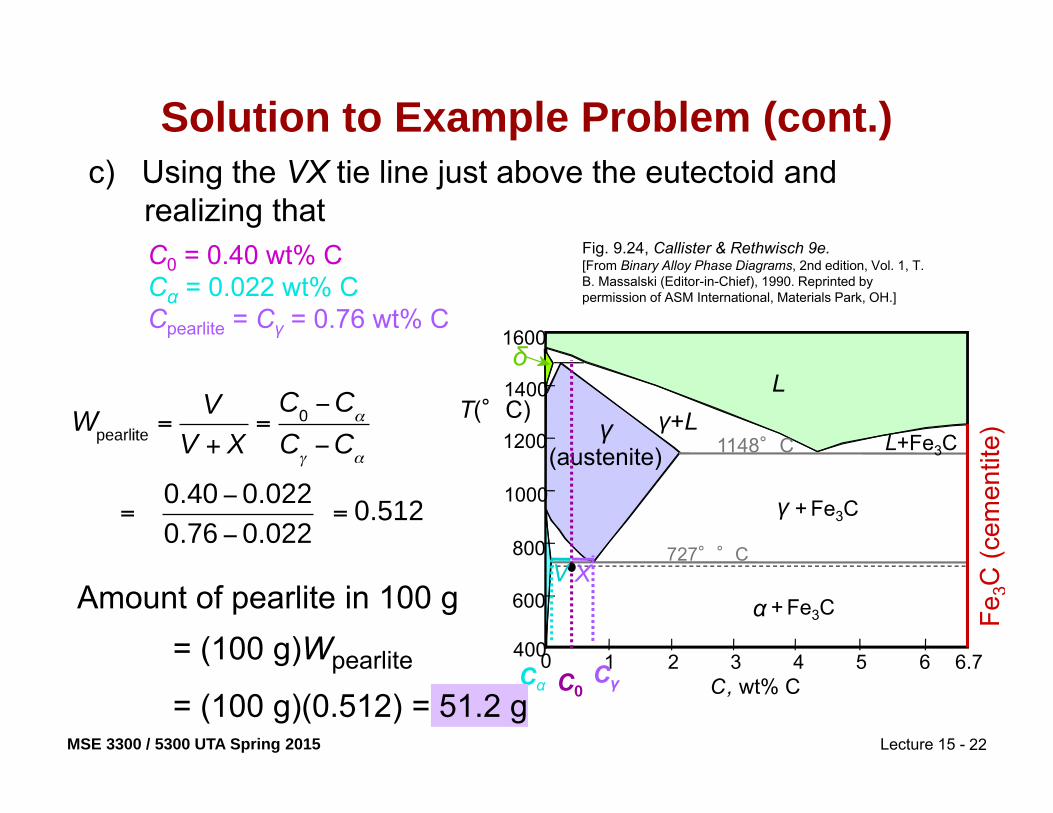
Solution to Example Problem (cont.)c) Using the VX tie line just above the eutectoid and
realizing thatC0 = 0.40 wt% CCα = 0.022 wt% CCpearlite = Cγ = 0.76 wt% C
C0
V X
CγCα
Amount of pearlite in 100 g = (100 g)Wpearlite
= (100 g)(0.512) = 51.2 g
Fig. 9.24, Callister & Rethwisch 9e.[From Binary Alloy Phase Diagrams, 2nd edition, Vol. 1, T. B. Massalski (Editor-in-Chief), 1990. Reprinted by permission of ASM International, Materials Park, OH.]

MSE 3300 / 5300 UTA Spring 2015 Lecture 15 -
Summary1. Binary eutectic systems 2. Iron–iron carbide phase diagram
23
MSE 3300 / 5300 UTA Spring 2015 Lecture 15 -
Homework 7• 9.7, 9.14, 9.18, 9.21, 9.38, 9.43
9.43: Use Figure 9.20
* Problems from Callister, 9th Edition
24