
MSc Programme in Urban Management and Development
54
MSc Programme in Urban Management and Development Rotterdam, The Netherlands September 2018 Thesis Title: Surviving and succeeding: Determinants of firm performance in the Gauteng City Region’s urban informal economy. Name: Hannah Itcovitz Supervisor: Paula Nagler Specialization: Urban Competitiveness and Resilience UMD 14
Transcript of MSc Programme in Urban Management and Development

MSc Programme in Urban Management and Development Rotterdam, The Netherlands September 2018 Thesis Title: Surviving and succeeding: Determinants of firm performance in the Gauteng City Region’s urban informal economy. Name: Hannah Itcovitz Supervisor: Paula Nagler Specialization: Urban Competitiveness and Resilience UMD 14

ii
MASTER’S PROGRAMME IN URBAN MANAGEMENT AND DEVELOPMENT
(October 2017 – September 2018)
Surviving and Succeeding: determinants of firm performance in the Gauteng City Region’s urban
informal economy.
Hannah Itcovitz United Kingdom
Supervisor: Paula Nagler
UMD 14 Report number: 1242
Rotterdam, September 2018

iii
Acknowledgements I would first like to thank my supervisor, Dr. Paula Nagler, for her guidance and advice throughout the thesis process. Her knowledge in, and enthusiasm for, the informal economy instigated discussions which fuelled my interest in the research topic, while her attention to detail encouraged me to be meticulous in my analysis and question my decision-making process, particularly regarding my methodology. I also valued her sense of humour during stressful times. I wish her all the best at IHS and in the future.
I would also like to acknowledge Prof. Spiros Stavropoulos, the second reader of this thesis, for his valuable comments and recommendations for improvement.
I extend my utmost gratitude to the GCRO for giving me access to the dataset for this thesis and for their hospitality in providing me with a desk space for six weeks in Johannesburg. Here, I attended conferences involving local government, NGOs and informal traders to gain insight into the current level of cooperation, and engaged with local informal entrepreneurs to comprehend their experiences and struggles. It was invaluable to immerse myself in the context of my research and to meet some of the authors whose work this thesis was based on. This would not have been possible without the GCRO, whose work I greatly admire.
Lastly, I would like to thank the Institute for Housing and Development Studies, including the staff who helped with administrative questions and offered literature suggestions, as well as the other students in my specialisation for their support with technical queries regarding STATA and feedback during colloquiums to refine my ideas.
Thank you.
Hannah Itcovitz

iv
Abbreviations ANC African National Congress
DTI Department of Trade and Industry
GCR Gauteng City Region
GCRO Gauteng City Region Observatory
GDP Gross Domestic Product
ILO International Labour Organisation
MCQ Multiple Choice Question
OLS Ordinary Least Squares
QoL Quality of Life Survey
QR Quantile Regression
SALGA South African Local Government Association
SERI Socio-Economic Rights Institute of South Africa
SME Small and Medium Enterprises
WEF World Economic Forum
WIEGO Women in Informal Employment, Globalizing and Organizing
WB World Bank
Keywords Informal economy; Profit determinants; South Africa; Gauteng; Quantile Regression.

v
Table of Contents
Acknowledgements ................................................................................................................ iii Abbreviations .......................................................................................................................... iv
Keywords ................................................................................................................................. iv
Table of Contents ..................................................................................................................... v
List of Figures ......................................................................................................................... vii List of Tables .......................................................................................................................... vii Chapter 1: Introduction .......................................................................................................... 1
1.1 Background ............................................................................................................................ 1 1.2 Problem Statement ................................................................................................................. 2 1.3 Research Objectives .............................................................................................................. 2 1.4 Research Questions ............................................................................................................... 3 1.5 Relevance of the Study .......................................................................................................... 3 1.6 Scope and Limitations ........................................................................................................... 4
Chapter 2 Literature Review .................................................................................................. 5
2.1 Defining Informality ..................................................................................................................... 5 2.2 Characterising Informality ............................................................................................................ 6
2.2.1 Global and Regional Trends ................................................................................................................. 6 2.2.2 Trends in the Gauteng City-Region...................................................................................................... 8
2.3 Defining Success for Informal Enterprises ................................................................................... 9 2.4 Determinants of Informal Firm Success ..................................................................................... 10
2.4.1. Individual Characteristics .................................................................................................................. 10 2.4.2 Firm Attributes ................................................................................................................................... 12 2.4.3 External Factors ................................................................................................................................. 13
Chapter 3: Research Design and Methods .......................................................................... 16
3.1 Research Strategy ....................................................................................................................... 16 3.2 Sample ........................................................................................................................................ 17
3.2.1 Participants ......................................................................................................................................... 17 3.2.2 Sampling Procedure ........................................................................................................................... 17
3.3 Research Instruments .................................................................................................................. 18 3.4 Methodology ............................................................................................................................... 19
3.4.1 Descriptive Statistics .......................................................................................................................... 20 3.4.2 Base Specification .............................................................................................................................. 20 3.4.3 Disaggregated Regressions ................................................................................................................ 21 3.4.4 Quantile Regressions .......................................................................................................................... 21
Chapter 4: Results and Research Findings ......................................................................... 22
4.1 Descriptive Statistics .................................................................................................................. 22 4.1.1 Dependent variable: ........................................................................................................................... 22 4.1.2 Independent variables ......................................................................................................................... 26
4.2 Inferential Analysis ..................................................................................................................... 28 4.2.1 Baseline Regression Results............................................................................................................... 28 4.2.2 Disaggregated Regression Results ..................................................................................................... 31 4.2.3 Quantile Regression Results............................................................................................................... 32
Chapter 5: Conclusions and Recommendations ................................................................. 35
Bibliography ........................................................................................................................... 39
Annex 1: Table of Operationalisation .................................................................................. 43

vi
Annex 2: Data cleaning and indicator derivation process ................................................. 45
Annex 3: Output for alternative dependent variable ......................................................... 46
Annex 3: IHS copyright form ............................................................................................... 47
vii
List of Figures
Figure 1: Conceptual framework of the informal sector ................................................................... 6
Figure 2: Map of interview locations ................................................................................................. 18
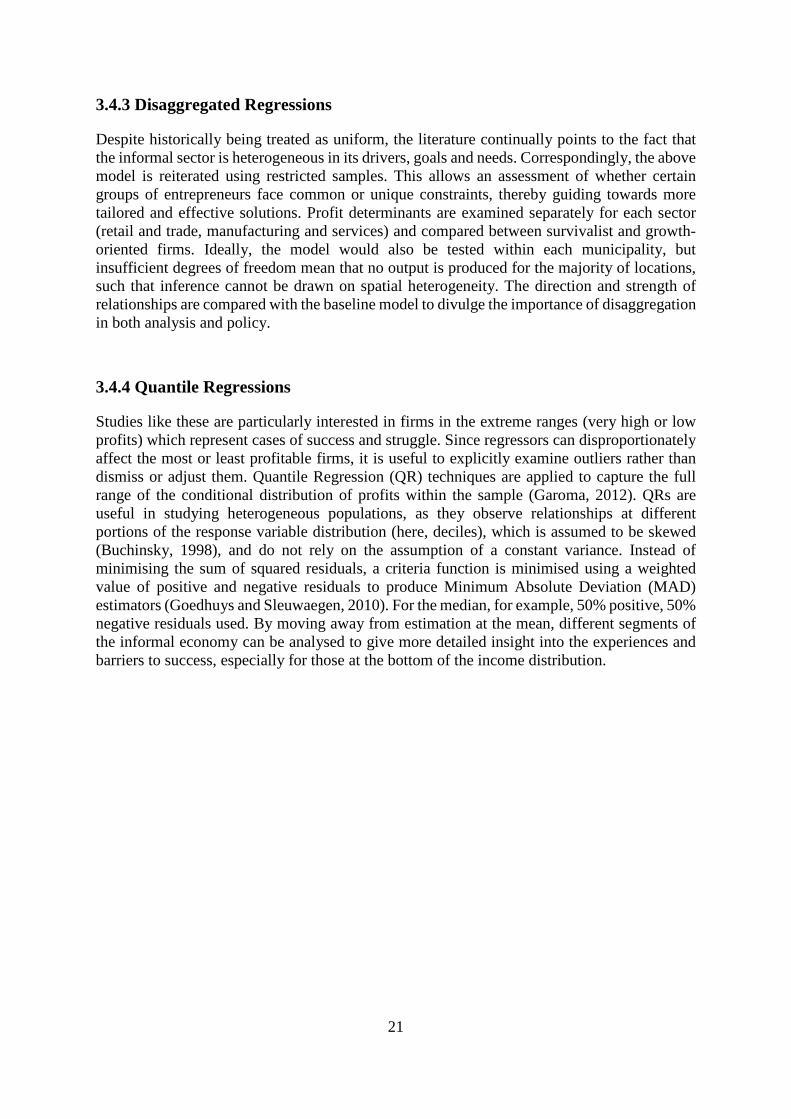
Figure 3: Distribution of profits by sector ........................................................................................ 22
Figure 4: Distribution of profits by municipality ............................................................................. 23
Figure 5: Distribution of profits by socioeconomic variables ......................................................... 24
List of Tables
Table 1: Descriptive statistics and sample composition................................................................... 26
Table 2: OLS Regression output........................................................................................................ 29
Table 3: Quantile Regression output ................................................................................................. 33

1
Chapter 1: Introduction
1.1 Background
Since South Africa’s transition to democracy in 1994, national wealth has remained highly concentrated, while formal job creation and infrastructure have failed to keep pace with growing urban populations (Sihlongonyane, 2018). After a series of neo-liberalist policies exposed the country to global competition and high rates of immigration, Gauteng province, the nation’s economic and political heartland, saw its landscapes evolve rapidly, with premature de-industrialisation of former mining areas, inner-city deterioration and a northward shift in tertiary activity from Johannesburg towards Pretoria (Ashman and Newman, 2018). Compounded by legacies of spatially-fragmentated development (Cheruiyot, 2018), weakened public institutions (ILO, 2015), and the economic crisis of 2008, impacts of these processes have been hard-felt and uneven, exacerbating structural issues such as high unemployment and resource inefficiency.
A major outcome has been the persistence and growth of the informal economy (Jütting and de Laiglesia, 2009). In 2013, the sector contributed 5.9% to South African GDP and 35% to national non-agricultural employment (Peberdy, 2018). Informal activities are widespread and diverse, with notable concentrations among the urban poor in former black and coloured townships such as Soweto, Sebokeng and Mamelodi, where access to formal markets and institutions is limited, and in over-saturated sectors with limited productivity and income growth (Burdett, 2006), including low-skilled trade and services. High proportions of women and migrants add a further social equity dimension to the challenge. Given these socio-spatial trends, reflecting continued core-periphery development and marginalisation, a serious discussion about inclusive growth cannot logically take place without involving the informal economy (Heintz, 2012).
And yet, historically, it has (see Sihlongonyane, 2018, for a full discussion of post-Apartheid governance). Originally regarded as lying outside the mainstream economy, first as survivalists and later as illicit tax avoiders, policy either ignored the informal secutor or implemented punitive measures to deter operations. Decentralisation and municipal by-laws have authorised local governments to “deal with” informal street vending, often aggressively, without understanding the livelihood or social implications (Rogerson, 2015). South Africa is not alone in this regard; informal enterprises in Malawi, Tunisia and Zimbabwe, to name a few, have all experienced forms of repression ranging from the confiscation of goods to violent evictions. Continual breaching of trust and communication is damaging in a situation which requires unusually high rates of participation and stakeholder engagement. More recently, the importance of channelling the informal economy has been recognised at national level due to its magnitude, potential capacity and linkages with the formal sector and across borders. For instance, the government aims to source 75% of all publicly procured goods from local township enterprises by 2030 (Seedat, 2015). Despite progressive discourse, commitments have been described as ‘rhetorical’ and ‘superficial’ (Rogerson, 2015) in that they embody reductive goals and maintain existing forms of trade rather than supporting the transition to more competitive industries. Indeed, none of the administrations since Apartheid have successfully curbed or captured the informal economy, suggesting either limited will, capacity or understanding. Aside from being discontinuous and inconsistent across scales of government (Devey et al, 2006; Kraemer-Mbula, 2016), policy decisions have echoed deterministic theories rather than contextual evidence, resulting in failed attempts to address the diversity of needs and
2
challenges (Crush et al, 2015). A narrow focus on formalisation has diverted attention away from equity and efficiency considerations (Chen, 2007) and avoided confronting issues such as accessibility, opportunity and security, which lie at the root of this complex problem. Sectorally- and spatially-targeted interventions aimed at boosting the productivity and stability of informal enterprises, which have until now been ad-hoc, under-funded and poorly implemented, should be a priority of future development strategies (Lund and Skinner, 2005; Burdett, 2006; Rogerson, 2015).
Two major obstacles remain in establishing frameworks for inclusive growth. The first is coordinated governance, which requires clear roles and responsibilities, transparency and communication among stakeholders, and realignment between the Business Act of 1991and the Constitution of 1996 (SERI, 2018). The second is the scarcity of data and lack of knowledge surrounding the informal economy, including the spatial and sectoral distribution of activity (Garoma, 2012; Peberdy 2018). Research has looked in depth at the causes and characteristics of informality, yet effective policies require a better understanding of behaviours, linkages and, as this thesis seeks to learn, the drivers of success. Observing that economic growth alone is not an automatic cure for informality, organised and active efforts to tackle the sector’s negative consequences whilst harnessing its potential contributions is crucial in addressing regional development challenges (Crush et al, 2015).
1.2 Problem Statement
Gauteng’s informal economy employed over one million individuals in 2015 (Vom Hofe and Cheruiyot, 2018), a figure predicted to increase annually with the growth in working-age population. While informal work offers flexibility and livelihood strategies for poor households, a source of affordable goods and services for consumers, and a reduction in the administrative and financial burden placed on governments, high levels of urban informality pose many social and economic challenges (Gatune, 2015; Peberdy, 2018). The sector continues to be marked by low income and skill levels and sluggish productivity (Charmes, 2012), while access to healthcare, pensions and education is almost non-existent, minimising social security. Excessive informality can undermine the redistributive efforts of governments and weaken formal sector bargaining power (Hayter and Lee, 2015), creating reinforcing cycles of marginalisation, poverty and inequality.
In light of this situation, policies aimed at boosting productivity and employment, which have traditionally been biased in favour of larger, registered firms (Reinecke, 2002), can no longer neglect the informal sector. However, the dynamic behaviour of businesses, plus their unique constraints and the conditions needed for them to thrive, remain poorly understood (Rogerson, 2016). Without grasping whether barriers to growth are more structural or individual in nature, and how they vary across space and industry, SME policies will continue to manage informality superficially and ineffectively.
1.3 Research Objectives
Recognising the need for evidenced-based policy which maximises the role of the informal economy in inclusive growth and poverty alleviation, this thesis aims to:
3
Empirically examine the conditions driving success for informal enterprises within the Gauteng City Region, by identifying the obstacles to, and facilitators of, economic performance for distinct groups of entrepreneurs.
In doing so, it seeks to expand the body of knowledge in this field and inform policymakers on which combined interventions will help informal firms to reach their potential, highlighting key stakeholders in this process.
1.4 Research Questions
The following main research question and supporting sub-questions are addressed:
What are the multi-level determinants of profits for firms operating within the Gauteng City Region’s urban informal economy?
1) How do profits vary within the GCR’s informal economy? How are they distributed among different geographic, demographic and socioeconomic cohorts?
2) Which factors significantly increase/decrease enterprise profits? Do these factors differ among sub-groups, for example, between municipalities, sectors, survivalist and growth-oriented enterprises, or high- and low-profit enterprises?
1.5 Relevance of the Study
The current study contributes to existing academic literature in two main ways. Empirically, by using a dataset which captures the experiences of 1,567 informal entrepreneurs and applying both multivariate Ordinary Least Squares (OLS) and Quantile Regression (QR) techniques, it delivers a detailed quantitative analysis on the plausible determinants of informal sector performance. This helps to bridge the gap between aggregate cross-country research, which is de-contextualised and ignores heterogeneity at the entrepreneur or firm level, and localised case studies, which lack testability and are therefore limited in their scope for wider inference. Theoretically, where research has previously focused on the drivers of informality or on isolated barriers to success such as microcredit and schooling, this analysis widens our understanding of informal sector dynamics by taking a more holistic approach and allowing a better assessment of competing theories. It therefore represents an important step in deducing the complexity of this relatively unknown sector.
Moreover, from a social perspective, this study helps to identify the role of government in managing informality and highlights areas for immediate policy attention. By realising conditions for success at multiple levels, the disjuncture between intention and outcome, which has hampered efforts to date, can be gradually eradicated. The research has additional salience in the wider context of the UN’s 2030 Sustainable Development Goals and the New Urban Agenda (City of Johannesburg, 2018), by effecting positive change and helping informal entrepreneurs reach their full potential (Rogan and Cichello, 2017).

4
1.6 Scope and Limitations
Similarities in informal sector profiles and stages of development make the methods and conclusions of this thesis relevant for studying informal enterprises in other Sub-Saharan African cities, particularly those in neighbouring Zimbabwe, Mozambique and Botswana. Nonetheless, the history of the GCR sets it apart from other emerging economies in terms of its unique and embedded constraints. Consequently, the results pertain specifically to this region and must be applied with caution in other contexts, especially with regard to informing local policies.
The extensive and detailed dataset from the Gauteng City Region Observatory (GCRO) provides a wealth of evidence regarding regional informal activity and obstacles for growth. Nonetheless, there remain some challenges for analysis. Cross-sectional surveys naturally prevent the elimination of fixed-effects, such as long-standing regulations or unobservable entrepreneur characteristics, as well as the lagged effect of recent investments on firm profits. Secondary datasets limit the number of predictors available, while the sample composition impedes multi-level modelling which would best suit the data structure. This limits the extent to which causal relationships can be inferred. In addition, a focus on empirical analysis identifies the barriers to profit generation but does not explain the mechanisms at play in the relationships with firm performance. These methods and questions become natural extensions for future research.

5
Chapter 2 Literature Review
This chapter provides an overview of existing research on informality. The first sections build an understanding of the concept and prevailing trends. It becomes apparent that a general lack of empirical studies exist on the research topic, inhibiting causal inference; subsequently, the chapter discusses the current state of knowledge regarding barriers to success, leading towards a new empirical model. An emphasis is placed on studies emanating from Africa (and, where possible, Gauteng) due to the uncertainty with which results translate across different contexts. 2.1 Defining Informality
Since Keith Hart coined the term in the 1970s to describe activities of the urban poor occurring beyond public and private establishments, debates around defining the informal economy have never reached consensus (see Charmes, 2012; Heintz, 2012). Dominant perspectives have shifted in tandem with academic paradigms governing the agency and motivations of informal actors, as well as their relationship with the formal sphere and significance for economic development (Chen, 2012; Peberdy, 2018). While the traditional view regards the pool of surplus labour characterised by low-income subsistence work, legal orientations consider individuals and enterprises operating outside tax and regulatory frameworks (Becker, 2004). More recent literature offers romanticised depictions of dynamic and innovative micro-enterprises who represent an engine for growth and job creation (Neuwirth, 2011; Kraemer-Mbula, 2016). Diverse conceptualisations give rise to equally varied measures of the scale of informal activity (Heintz, 2012), making it hard to collect meaningful or reliable data.
These ideas highlight a historic tendency towards uniform definitions of informality. Such determinism, fuelled by prevailing theory and political ideology, has led to blanket solutions ranging from deterrence to laissez-faire to facilitation (Williams, 2006; Crush et al, 2015). Yet research repeatedly demonstrates the heterogeneity of informal activity (Grimm et al, 2012; GCRO, 2015), rendering universal and narrow definitions inappropriate, despite their usefulness for comparison.
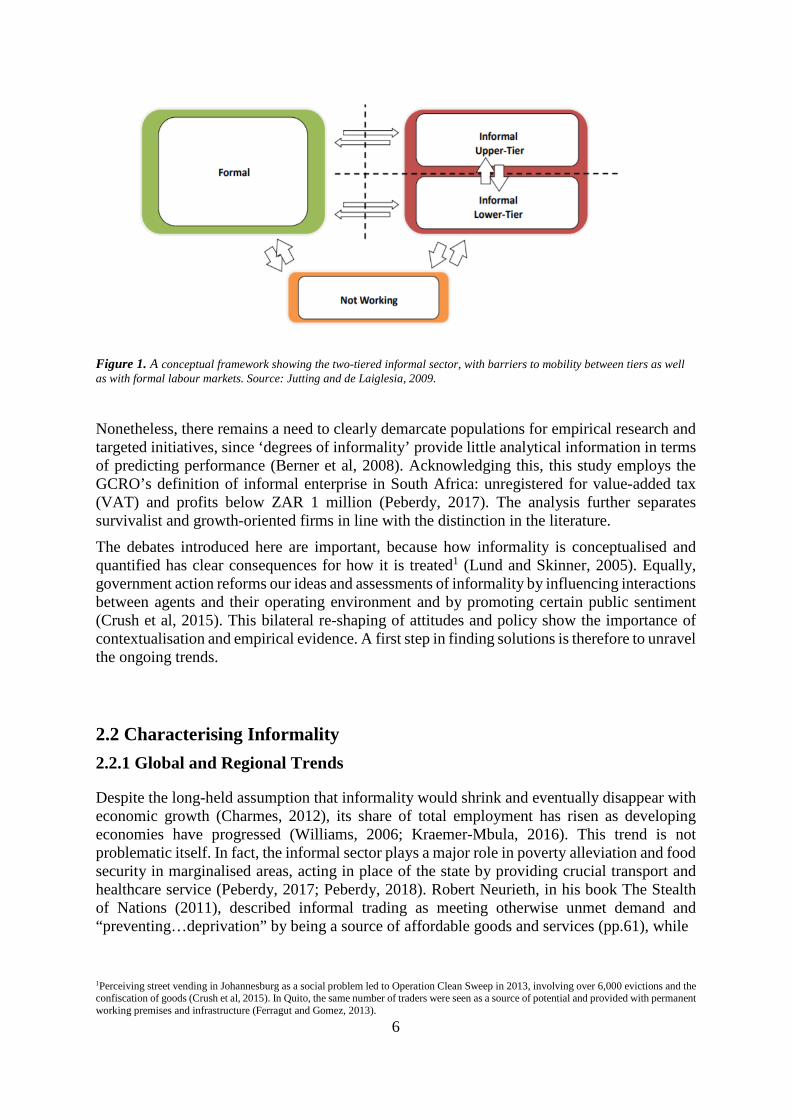
Attempting to capture its diversity, many authors have begun to disaggregate the informal economy into subgroups, distinguishing between businesses operating informally through choice and opportunity (Figure 1), considered “growth-oriented” or the “upper-tier”, and those driven by exclusion and necessity, labelled “survivalists” or the “lower-tier” (Berner et al, 2008; Jutting and de Laiglesia, 2009; Margolis, 2014). These deconstructions allow the identification of firms with high growth-potential versus those trapped in reinforcing cycles of poverty and marginalisation, recognising the need for tailored policy which addresses their unique needs more effectively than generic support mechanisms (Lund and Skinner, 2005).
Becker (2004) argues against discrete classifications, claiming that oversimplification masks the sector’s true dynamics. The author advocates a continuum, ranging from small-scale manufacturing and service enterprises (who may be registered but employ casual labour) to individual street vendors and waste collectors (who are relatively autonomous but lack protection). Neuwirth (2011) illustrates these blurry boundaries, describing firms lying “one toe in, one toe out” of the mainstream economy (pp.76). Adriaenssens and Hendrickx (2015, p.628) maintain the existence of “as many possible dimensions of informality as there are rules”. From this perspective, dichotomous classifications, which label economic units as either formal or informal, voluntary or forced, impede our understanding of complex structures and linkages, inhibiting effective solutions (Charmes, 2012; Grimm et al, 2012; Heintz, 2012).
6
Figure 1. A conceptual framework showing the two-tiered informal sector, with barriers to mobility between tiers as well as with formal labour markets. Source: Jutting and de Laiglesia, 2009.
Nonetheless, there remains a need to clearly demarcate populations for empirical research and targeted initiatives, since ‘degrees of informality’ provide little analytical information in terms of predicting performance (Berner et al, 2008). Acknowledging this, this study employs the GCRO’s definition of informal enterprise in South Africa: unregistered for value-added tax (VAT) and profits below ZAR 1 million (Peberdy, 2017). The analysis further separates survivalist and growth-oriented firms in line with the distinction in the literature.
The debates introduced here are important, because how informality is conceptualised and quantified has clear consequences for how it is treated1 (Lund and Skinner, 2005). Equally, government action reforms our ideas and assessments of informality by influencing interactions between agents and their operating environment and by promoting certain public sentiment (Crush et al, 2015). This bilateral re-shaping of attitudes and policy show the importance of contextualisation and empirical evidence. A first step in finding solutions is therefore to unravel the ongoing trends.
2.2 Characterising Informality 2.2.1 Global and Regional Trends
Despite the long-held assumption that informality would shrink and eventually disappear with economic growth (Charmes, 2012), its share of total employment has risen as developing economies have progressed (Williams, 2006; Kraemer-Mbula, 2016). This trend is not problematic itself. In fact, the informal sector plays a major role in poverty alleviation and food security in marginalised areas, acting in place of the state by providing crucial transport and healthcare service (Peberdy, 2017; Peberdy, 2018). Robert Neurieth, in his book The Stealth of Nations (2011), described informal trading as meeting otherwise unmet demand and “preventing…deprivation” by being a source of affordable goods and services (pp.61), while
1Perceiving street vending in Johannesburg as a social problem led to Operation Clean Sweep in 2013, involving over 6,000 evictions and the confiscation of goods (Crush et al, 2015). In Quito, the same number of traders were seen as a source of potential and provided with permanent working premises and infrastructure (Ferragut and Gomez, 2013).

7
Cichello and Rogan (2018) found that 100 jobs destroyed in the informal sector in South Africa is equivalent to 63 lost in the formal sector, showcasing their comparable capacity for poverty reduction. Informal work also provides flexibility for people facing domestic obligations, notably women (SERI, 2018). To this extent, it may complement the formal economy, helping growth to become more inclusive rather than crowding it out.
Nonetheless, cross-country patterns reveal a strong negative correlation between the share of informal employment and GDP per capita (Kraemer-Mbula, 2016, pp.37). Informal work is frequently characterized by low levels of household income and lacks the protection, rights and benefits associated with property and labour contracts and formal credit systems (Hayter and Lee, 2015; Medina et al, 2017). Indeed, working conditions can be extremely poor, hours long, and product and service quality unchecked. At a macro level, activity in the wrong sectors due to insufficient skills and capital can hinder productivity (Charmes, 2012), while the absence of entry barriers leads to congested markets and inequitably low prices. High levels of informality undermine the ability of governments and trade unions to provide amenities and income opportunities (Gatune, 2015; ILO, 2018), creating a two-way relationship with poverty and inequality, however, the interventions needed to break this negative cycle remain unclear.
It is also not well understood whether informality fluctuates in tandem with, or in opposition to, the mainstream economy. While some claim it expands during recessions as a safety net in the absence of unemployment insurance (Loayza and Rigolini, 2011), literature highlighting strong supply-chain linkages and interdependence with formal businesses suggests the contrary (Davies and Thurlow, 2009). Perhaps these arguments can be synthesised by applying the division between survivalist and growth-oriented firms, whereby the former behave counter-cyclically and the latter pro-cyclically. Unravelling this behaviour would indicate whether formal and informal firms face similar or distinct barriers to growth, which is important for policy development.
A new body of literature documents the innovative strategies adopted by informal enterprises in the face of scarce resources and intense competition. Kraemer-Mbula (2016) records the highly-developed knowledge systems, both indigenous and modern, which are unique to the sector in adopting and improving ideas and technologies. Many authors discuss the entrenched principles of reciprocity, sharing and cooperation among informal agents which generate resilience (Simone, 2004; La Mantia, 2018). Berner et al (2008) note that one essentially foregoes their “membership” in the social network upon exiting the informal market, making it risky and costly. This paper also highlights the diversification of products and services within informal firms, contrasting typical approaches to competitiveness which focus on economies of scale to increase profits. These practices help to secure livelihoods and smooth consumption, thereby decreasing vulnerability (Neuwirth, 2011). To this extent, the current drive for modernisation, formalisation, and specialisation could be counter-productive. On the other hand, such strategies may act as a hinderance to growth by restricting a firm’s ability to generate (through lack of scale) and reinvest (through familial obligations) profits. So far, these trends are only understood in a qualitative sense. The precise speed and mechanisms through which knowledge is diffused, plus the net effect of networks and strategies on firm performance, is largely unknown, making it difficult to implement effective changes.
8
2.2.2 Trends in the Gauteng City-Region
Despite common global patterns, informality emerges and evolves under unique pressures within each urban context (Williams, 2006). An expanding body of reports provide a detailed statistical profile of informal activity in Gauteng (see GCRO, 2015; Seedat, 2015; Peberdy, 2018). In the 2015 Quality of Life Survey (QoL), an impressive 65% of business owners operated in the informal economy (Peberdy, 2018). 62% of informal businesses were owner-operated, another third hiring between one and five employees, and just 5% six or more. The profits of two thirds of informal firms lay below personal and business tax thresholds, and the vast majority had no job security or benefits like pensions, maternity leave or sick pay. These statistics confirm regional informality as substantial, small-scale and highly vulnerable.
Compared to the formal economy, a disproportionate amount of low-educated, black-African, female and migrant entrepreneurs were evident. Disparities are considered a legacy of Apartheid, where certain socioeconomic groups were trapped in urban and societal peripheries and denied access to skills and opportunities (Lund and Skinner, 2005; Seedat, 2015). Reflecting this physical marginalisation, informal activities in the QoL were concentrated in former townships (in Lesedi, 92% of businesses were informal) and in run-down areas within the CBD. Minimal spatial clustering by type of business was observed, illustrating limited agglomeration patterns, however, a high degree of proximity between large and small businesses was evident (Peberdy, 2018, pp.194). Indeed, 64% of consumers report regularly purchasing goods informally, while 77% of informal enterprises source inputs from registered firms (City of Johannesburg, 2018). This signifies an interdependence which should not be overlooked, though informal value chains are otherwise poorly understood.
Almost 4/5 informal businesses in the GCR function in the trade and services sector (Vom Hofe and Cheruiyot, 2018), notably in un-skilled, low-productive, non-tradeable retail or personal services, which lack increasing returns (Ashamn and Newman, 2018). Activity is scarce in high-growth sectors such as manufacturing and advanced producer services (Peberdy, 2018), which require significant amounts of capital that informal entrepreneurs are both unable and reluctant to invest due to credit constraints and the threat of eviction or confiscation (Berner et al, 2008). The difference between the contribution to employment and gross value-added is stark. The insurance sector employed 230,615 workers in 2015, all formally, with a total GVA of ZAR 97,566.4 million (Vom Hofe and Cheruiyot, 2018, pp.114). Trade (which is highly ‘informalised’) hired 1,124,756 workers, yet its GVA amounted to just ZAR 125,078.4 million. Equally low compensation was received by the community and social services and construction clusters, each with a high proportion of informal labour. This is evidence of the vast income inequality and resource inefficiency associated with urban informality, demonstrating the need for improved labour regulations and sectoral adjustments.
Such descriptive information provides a preliminary indication of the potentials and limits of informal entrepreneurship by identifying which groups rely heavily on this type of work and how activity is organised within the GCR. It enables a comparison with the formal sphere, suggesting whether informal enterprises can be reached by widening the scope of existing SME policy or whether new frameworks are required to tackle the unique nature of the sector (Rogerson, 2015). It also confirms an urgent need for tailored policy to target certain communities, industries, and socioeconomic groups who suffer disproportionately the costs of informality. Nonetheless, descriptive research is limited in its ability to guide towards specific policy instruments. It remains unclear whether obstacles are structural, individual or a mix of both. Correlations between profits, race, location and sector are apparent, but have not thus far been tested empirically. Without controlling for other factors which may distort or dampen the effect of interventions in one area, treatments will continue to be superficial.
9
2.3 Defining Success for Informal Enterprises
While most informal enterprises begin small in size and value, and the majority stay this way, some have broken away to achieved growth and expansion (Grimm et al, 2012). The question stands as to why this divergence in performance occurs. Which enabling environmental factors, business strategies or personal characteristics are harnessed to expand market share and surpass competitors? The research landscape on this topic remains relatively sparse. To start with, the definition of success is itself contested. Moreover, papers on the determinants of success pertain mostly to larger, formal businesses in advanced economies, though increasing attention is being paid to small and medium enterprises (SMEs) in developing countries.
Throughout political agendas and academic discourse, the goal of formalisation - “bringing activity into the mainstream”; “shifting resources into value-added activities within the regulated economy” (City of Johannesburg, 2018) - is promoted as the ultimate solution to informality. Thus, formalisation has become rhetorically analogous with success, prompting the proposal of solutions involving reduced administration costs, streamlined bureaucratic processes and improved service delivery. Arguably, formalisation is flawed as an end objective. First, it has different connotations for different stakeholders, creating conflicts of interest and hindering negotiation processes (Chen, 2007). To policymakers, it represents the licencing and taxation of businesses and the imposition of standards, namely, the costs of formalising. To informal operators themselves, legitimacy should be linked to job and income security, employment benefits and access to business services. Larger, registered firms associate formalisation with revenue loss due to intensified competition and value-chain disturbance (Crush et al, 2015; Peberdy, 2018), while consumers fear restricted access to affordable goods and services if the costs of formalising are passed on. The presence of winners and losers implies that the normative goal of formalisation is not always feasible or desirable (Kanbur and Keen, 2015).
Second, the concept of formalisation is somewhat arbitrary (Keen, 2015). Statistically reducing the size of the informal economy does not necessarily remove its negative impacts. For example, in Quito, improvements in living and working conditions did not automatically follow from large-scale formalisation (Ferragut and Gomez, 2013). In fact, one could completely eradicate informality by altering conceptual thresholds or relaxing formal regulations. To this extent, formalisation risks disguising the need for any real reductions in poverty and inequality, showcasing the need for more basic policy objectives.
Third, formalisation should represent less a status change and more a dynamic process of recognition and upgrading (Hayter and Lee, 2015). Incentive-based policies, such as tax reductions or fines for non-compliance, have the tendency to reach those at the margin rather than the most vulnerable groups who cannot afford the costs of transition nor the risks of new ventures (Becker, 2004; Berner et al, 2008). Pressure to formalise can therefore exacerbate the inequality and marginalisation which policymakers seek to abate, and interventions should instead prioritise expanding the productive capacity of communities (Burdett, 2006; Kanbur and Keen, 2015). Moreover, since the decision to remain formal is a continuous choice, it is crucial to approach transition in a smooth, inclusive and sustainable way to avoid retraction (City of Johannesburg, 2018).
Due to multiple conceptual and practical issues, it becomes appropriate to use less normative measures of success. A common example is survival - a firm’s ability to sustain activities beyond the current period (Garoma, 2012). Continuity indicates a level of competitiveness and resilience in terms of predicting market fluctuations and overcoming unforeseen shocks. The GCRO brief (2015) reported that, in 2013, the modal group (28%) of informal firms in Gauteng
10
were less than one year in operation, compared to 13% of formal enterprises (p.11). Moreover, 23% of formal businesses were over 10 years old, versus 12% of informal businesses, showing marked disparities in longevity. Correspondingly, Reinecke (2002) notes high death rates among informal firms.
At first glance, these statistics seem to indicate the failure of many informal enterprises during start-up. However, they could equally reflect the transition of businesses to the formal economy as they mature (although most related studies report graduation rates to be very low, between 1% and 10% (Berner et al, 2008)). Even where firms have closed, these closures cannot be assumed as forced. The flexibility of the informal sector lends itself to frequent reallocation of resources, thus closure may reflect a planned and efficient shift in production, which arguably illustrates success. The incidence of young businesses does not, therefore, imply failure. Due to this selection bias, employing age as a measure of success becomes invalid.
A more conceptual issue, similar to formalisation, is that survival cannot objectively be deemed equivalent to thriving. Firstly, it depends on the rationale behind entry (Garoma, 2012). If activity is driven by securing household income and satisfying basic needs, then indeed survival could represent success, however, if motivations are more growth-oriented, then mere survival is inadequate (Berner et al, 2008; Margolis, 2014). Secondly, maintaining the status quo or current growth path seems insufficient for dealing with the immense challenges faced by developing countries, including widespread poverty, a growing urban labour force and rising consumer demand. A measure of success is therefore required which has neutral connotations and effectively captures variation in progress among informal businesses.
The most objective measures of success relate to business performance, including net worth, employment and profits (Daniels, 2001; Garoma, 2012). Performance reflects the ability of firms to create economies of scale and select ventures with decent prospects, so it provides an indication of resource efficiency, individual competence and sectoral capacity. Furthermore, informal profits circulate directly back to local economies rather than being extracted by big market players, while employment in the sector absorbs the surplus labour force and provides income opportunities (SERI, 2018). Despite issues with measurement, performance account for many of the shortfalls of the preceding variables by being measurable and having real effects on communities.
2.4 Determinants of Informal Firm Success
From the research, economic performance can be influenced by three dimensions: individual characteristics, firm attributes and contextual factors (Garoma, 2012). In addition, studies have begun looking at relational factors, such as the strength and structure of business and social networks as well as value chain positioning (Davies and Thurlow, 2009), though these theories are not yet fully developed.
2.4.1. Individual Characteristics
Individual characteristics refer to both the inherent and acquired traits of entrepreneurs which determine their decision-making ability, productive capacity and socioeconomic position. These factors have added relevance in micro-enterprises, where the entrepreneur has more autonomy and plays a crucial role in firm development (Garoma, 2012). One set of characteristics surround the socioeconomic background of firm owners and tend to be
11
measurable and observable. A second set involves the personal nature and cognition of entrepreneurs, which are less tangible but equally impact decision-making and business outcomes.
Gender: Studies focusing on the impact of gender on firm performance (McPherson, 1996; Berner et al, 2008) highlight the additional constraints faced by women in informality. Domestic obligations often make informal work the only viable option due to flexibility of working hours and location (SERI, 2018). Female entrepreneurs frequently have lower education and business experience than their male competitors and have been found less likely to engage in innovative processes (Gebreeyesus, 2009). In addition, restricting operations to in or near the home means that women tend to work in low-return trades and services such as haircare or food and household products (Garoma, 2012). With no maternity leave, childcare or healthcare, this group of women are particularly vulnerable to income shocks which in turn decreases their chances of success (Grimm et al, 2012).
Age: Two opposing effects of owner age on firm performance are cited in the literature. While additional years provide experience and sector-specific knowledge (McPherson, 1996), older entrepreneurs have also been shown as less pro-active in adopting and implementing new technologies (Gebreeyesus, 2009), perhaps due to greater learning costs or a resistance to deviate from traditional practices. Young entrepreneurs are considered more ambitious, adaptable and risk-seeking (Garoma, 2012). It is therefore the net effect of experience and drive which is observed in regression outputs.
Education: Returns to schooling have been examined across multiple countries and sectors. Educational achievement indicates problem-solving abilities, the handling of information and numeracy (Garoma, 2012), and is often taken as a proxy for the level of human capital (McPherson, 1996). The majority of studies on this topic focus on small-enterprises in the formal sector. For example, Goedhuys and Sleuwaegen (2010) find that education affects the lower quantiles of the earnings distribution but has negligible influence in the upper quantiles. Other authors doubt whether success in the informal sector is contingent upon receiving a formal education, or whether the relevant skills and specific market knowledge are better acquired through experience with running a business, on-the-job training and apprenticeships (Garoma, 2012).
Nationality: Migrant status has an ambiguous relationship with firm performance in the literature. Starting a business from scratch without documentation or social networks, and whilst facing acts of xenophobia (Crush et al, 2015), creates extra financial, informational and bureaucratic obstacles for this group, hindering performance relative to local entrepreneurs. On the other hand, personality traits specific to those who choose to migrate, notably ambition and risk-taking (Peberdy, 2016), plus the creation of new networks and trust relations (Goedhuys and Sleuwaegen, 2010), have been shown to overcome these constraints. Plausibly, the effect on profits changes through time, from negative to positive, as networks are built and migrants assimilate and establish reputation.
Race: In South Africa, race has dictated where people live, the education they receive, which jobs they can partake in, access to loans and various social and economic opportunities (Cheruiyot, 2018). Despite the termination of the Apartheid regime and various black empowerment programs, racial divides are still embedded within local culture and race-based inequality is stark. This trend is plausibly more exaggerated in the informal sector due to the racial decomposition of marginalised township economies who rely heavily on informal work (Lund and Skinner, 2005).

12
Grimm et al (2012) tested these observable characteristics using a probit model to create a profile of top performing informal entrepreneurs. They concluded that male, older and better educated entrepreneurs were more likely to be in the group of top performers (the highest 10% in terms of capital stock and profitability).
Baum et al (2001) examined personality traits, competences, strategies and motivations to determine their bearing on firm performance. Personality traits refer to an entrepreneur’s pre-disposition to, for example, take risks or be proactive in implementing changes. Individual competences reflect the skills and knowledge (regarding technology, communication and management) which allow entrepreneurs to recognise and seize business opportunities. Strategies concern the degree of customer or innovation focus as well as quality considerations and cost reduction practices, all of which make firms more competitive. Motivations reveal the extent of goal-orientation and the intentions for running the business, including long- versus short-term focus and the drive for profit versus subsistence. As discussed earlier in the chapter, the purpose of starting the business is a key variable in classifying informal firms, as growth-oriented and survivalist firms are seen to face different barriers to growth (Jutting and de Laiglesia, 2009; Margolis, 2014). The study found competencies, strategies and motivations to be direct predictors of venture growth, while personality traits acted as a mediator in these relationships. These findings advocate the consideration of unobservable factors and non-linear relationships when explaining successful enterprises, though it remains a challenge to find reliable indicators which accurately measure these concepts.
2.4.2 Firm Attributes
Firm attributes concern the choices made by firms during start-up and operation to establish and maintain a competitive position. These factors work to reduce costs, increase revenues and maximise efficiency. They stem from the neoclassical or resource-based view concerning the scale and allocation of capital, labour and technology as seen in production functions.
Sector: Multiple studies find that manufacturing firms achieve higher rates of innovation and growth than primary or tertiary industry (Gebreeyesus, 2009, Ashman and Newman, 2018), due to large returns to scale and the accumulation of assets. Manufacturing is relatively absent in the GCR’s informal economy (Peberdy, 2017). It is speculated that excessive capital requirements and a reluctance to accumulate assets (due to the threat of confiscation or theft) deter entrepreneurs from entering the manufacturing sector and therefore from allocating resources efficiently. Conversely, Garoma (2012) proposes that local demand, cost structures and market saturation all influence which sectors thrive in a given region, so it cannot be assumed that greater success would automatically follow from re-orientating firms towards manufacturing.
Innovation: The role of innovation in success stems from Schumpeter’s theory of “creative destruction”, whereby wealth is created through a shifting of resources towards more modern or productive activities (Lumpkin and Dess, 1996). Innovation increases the capacity of businesses, expands their market reach and improves product quality, making them more competitive and profitable (Gebreeyesus, 2009; Goedhuys and Sleuwaegen, 2010). For informal firms, innovation is more incremental in nature, meaning that they tend to adopt or adapt existing technologies rather than creating brand new ones (Garoma, 2012; Kraemer-Mbula, 2016). Examples include the use of internet, marketing and sales tactics, new materials, product diversification and the spreading of risk and costs through joint ventures, shared premises and pooled purchasing.

13
Tenure: Ownership can provide a sense of security and stability which encourages the accumulation of assets and the pursuit of risky ventures, while monthly rents present a substantial (and sometimes fluctuating) expenditure which crowds out profit. Yet case studies have shown that ownership does not necessarily translate into better livelihoods in the absence of amenities or enforced building standards (Quito -Ferrugat and Gomez, 2013). SERI (2018) discuss the trend in Johannesburg whereby the allocation of stalls for rent in organised informal marketplaces attracts competitors who sell for free just outside, capitalising on infrastructure and rendering those who pay rent worse-off through extra costs and aggressive price competition. Tenure must therefore be complimented by a combination of clear regulations and business services.
Premise: The permanence of business premise has opposing effects on firm success (Garoma, 2012). While mobile entrepreneurs remain flexible to seek out new and growing markets, they forego consistency in terms of a loyal customer base. Though they can avoid intense competition by relocating, they sacrifice the sharing of infrastructure and trust building with permanent entrepreneurs. Success also depends on where premises are located. Berner et al (2008) found home-based firms, despite being permanent, to have higher closure rates than those operating in more commercial districts, reflecting differences in access to markets. The gendered nature of home-based activity makes these findings socially important.
Start-up capital: Gebreeyesus (2009) found that less capital-constrained firms grow faster than their constrained counterparts. A lack of start-up capital can prevent firms from entering desired or productive sectors, hiring labour and investing to scale up operations. This results in resource inefficiency and has been claimed to create poverty-traps, especially when conditions for borrowing are strict or loans are non-existent. In contrast, McKenzie (2006) observed higher returns to capital at low levels of capital stock, refuting the notion of path dependence where initial capital determines the ultimate size of the firm. Conceivably, initial capital is a bigger hindrance for sectors who face large upfront costs for materials and equipment.
Employment: It is somewhat of a stylised fact that larger firms are more successful due to economies of scale, division of labour and lower average costs. This is less relevant for informal firms, which are usually owner-operated or micro-sized. It is suggested that instead of the absolute number of workers, productivity in this sector depends on the number of non-paid (family) workers or the ratio of household to non-household employment. It could be argued that the quality of employment matters rather than the quantity. The concepts of job matching and skilled labour has not yet been explored in the informal economy.
Age: Two hypotheses exist regarding the relationship between firm age and profits. On the one hand, firms establish business networks over time and learn of their strengths and capacities to become more efficient and maximise performance. On the other hand, older firms tend to lie further from the technology frontier than young start-ups, reducing their competitive edge. Due to the young average age of informal enterprises, one could expect the first effect to be stronger.
2.4.3 External Factors
Policy discussions frequently raise the subject of an “enabling business environment” for informal firms, providing incentives for growth and easing the costs of doing business (Reinecke, 2002; SERI, 2018). Adrianssens and Hendrickx (2015) argue that success requires more than the existence of facilitating institutions, but also a level of trust and reputation between actors, as well as laws and regulations which are clearly stated and consistently and effectively enforced (Garoma, 2012; Grimm et al, 2012). Part of this process is ensuring

14
coordination between various governing bodies (SERI, 2018). The current mismatch between the national constitution, which acknowledges and supports individuals in their right to make a living via informal work, and local by-laws, which grant authorities discretion to manage and control informality, has resulted in contradictory messages, slack implementation and unreprimanded transgressions of the constitution.
Studies on SME success often place emphasis on financial institutions, banking quality and credit facilities (Boston, 2007), promoting tools such as interest rates and lax loan criteria to encourage savings and investment. These conclusions hinge on the assumption that informal enterprises face identical constraints to formal businesses, or at least respond to incentives in the same way, and that general SME policies will spillover to this sector. Yet informal actors may deviate from rational decision making if their goal is not to maximise profit and their strategy is not to take risks (Berner et al, 2008). Furthermore, providing opportunity for loans seems futile if entrepreneurs lack the knowledge to utilise them or if the physical, economic and social environments hinder returns to investment. A single-edged focus on finance is therefore insufficient.
Location: McPherson (1992) observed that firms in the urban core grow faster than those in the periphery. Burdett (2006) recognised distance to markets as a key challenge in Gauteng. Township economies with poor amenities do not currently attract large businesses or customers, while transport to areas where these are dense is either non-existent or highly costly in both time and monetary terms (Seedat, 2015). The regions of the GCR are extremely varied in terms of infrastructure, opportunity and wealth (Cheruiyot, 2018), driving large differences in potential profits between more developed metropolitan districts and the surrounding municipalities.
Economic Environment: The classical economic concepts of supply and demand are undoubtedly important in determining enterprise profits. The informal economy is known for high levels of competition with both other informal entrepreneurs and larger formal retailers (Neurieth, 2011); aggressive pricing tactics are common, while affordable supplies are strategically sourced. Informal businesses rely heavily on day-to-day sales, so are sensitive to changes in the ability and willingness of customers to pay. Overall market health exacerbates these issues further through the level of uncertainty, corruption and regulation.
Operating Environment: A series of basic services are required by informal firms for daily operation, including storage and sanitation facilities, water and electricity, waste management, roads, communication and internet (SERI, 2018). The poor reap disproportionate benefits from basic services through reducing hazard and vulnerability. Goedhuys and Sleuwaegen (2010) highlight the distance bridging effect of transport and IT connections, effectively bringing markets closer, stimulating demand and shifting the growth distribution of firms to the right.
Policing Environment: Informal businesses and local authorities have a contentious relationship due to the blurred laws surrounding the rights and regulations of the sector (SERI, 2018). Harassment, confiscation, eviction and arrests are documented as daily experiences of informal traders (Crush et al, 2015). Not only does this infringe upon human rights and abuse discretionary power, making it immoral, such action negatively affects a firm’s asset position, ability to trade and ultimately the livelihood of those it supports.
Discrimination Environment: Physical and verbal attacks by customers, authorities and other entrepreneurs based on race, gender or nationality can occur regularly in communities with high levels of diversity and competition. Acts of violence can be damaging to stock, sales and the motivation of entrepreneurs (Crush et al, 2015). Living in fear or under threat may result in

15
decisions which are suboptimal for firm performance, including shorter operating hours, closure at night, or becoming more mobile to avoid crime and conflict.
A number of key ideas can be taken away from the literature on informality. First, the notion of the informal economy clearly covers a diverse range of actors and activities. Correspondingly, the determinants of success must be examined within specific strata and contexts for optimal management and development. Second, many concepts surrounding informality are still contested or ambiguous, so defining and constructing indicators becomes an important task in empirical research. Third, multiple factors at different scales potentially impact firm performance; in some cases, the direction of the hypothesised relationship remains unclear. For conclusions to be drawn, variables must be embedded within an empirical model and tested for their combined significance. This will permit an evaluation of the theories debated above and directly tackle the research question.
16
Chapter 3: Research Design and Methods This thesis uses a unique dataset from the Gauteng City Region Observatory (GCRO)2 which captures the background, decisions and experiences of 1,567 informal business owners within the GCR, along with the spatial distribution of their activities. The 2014 survey presents a rare and exciting research opportunity, because until now, such granular information on the informal economy has been largely unavailable, preventing quantitative analysis at this scale.
This chapter lays out the framework and scientific process used to interpret the data and satisfy the research objectives. It rationalises the strategy chosen, appraises the GCRO’s sampling procedure and instrumental design, and details the empirical methodology followed by this study. Both theoretical and practical drawbacks of the research design and methodology are considered throughout to gage potential threats to validity and reliability. A clear distinction is made between limitations and de-limitations, the former being beyond the control of the researcher employing secondary data (such as original questionnaire design) while the latter are imposed deliberately but justified upon weighing up their costs and benefits (such as the choice of specification). Where possible, measures are taken to overcome analytical issues which confound the interpretation of findings and, if not addressed, lead to misinformed policy recommendations (Thomas and Heck, 2001).
3.1 Research Strategy
The aim of this thesis, to explain the variation in profits among informal firms within Gauteng, demands data for a large number of units and variables across a relatively wide geographic reach. Obtaining data of this scale and scope has been a major limitation for research on the urban informal sector (Garoma, 2012), thus the current dataset permits a novel quantitative investigation of the research problem. The chosen survey focuses on informal businesses operating in 5 provinces (3 metropolitan areas and 2 municipal districts) of the GCR, thus it earmarks the population and area targeted by the main research question. Collected in 2014, the data remains relevant in the current business climate, however, a single time-period obscures concepts like lagged returns and fixed-effects, constraining dynamic causal inference. Due to the mobility and unrecorded nature of informal activity, panel data remains largely unavailable in this field, nonetheless, cross-sectional analysis provides a good starting point.
An important consideration is the original purpose of the survey, since “trivial sources of error…may be magnified when a survey is put to other than its original use” (Kiecolt and Nathan, 2011). The GCRO aimed to discover the challenges faced by informal entrepreneurs and understand their relation and contribution to the South African economy (Peberdy, 2018). However, a focus on migrants means it was not specifically geared towards firm performance; numerous desired concepts, including profits, are inefficiently captured by a single recall question, while items pertaining to remittances, export activity and xenophobia are irrelevant. The inability to manipulate variable selection and operationalisation ex-post presents a major drawback of secondary research. Given the information available, only a partial explanation of
2The GCRO is an independent research institute operating in Johannesburg, with a mandate to “build the knowledge base that government, business, civil society and residents all need to make the Gauteng City-Region competitive, spatially integrated, environmentally sustainable and socially inclusive” (GCRO, 2016, pp.12). Specifically, it seeks to create partnerships and identify key opportunities and challenges to regional development, an agenda compatible with the goals of this thesis. In addition, standardised procedures and the extensive local knowledge of staff leads to high-quality, reliable data which is used to inform government at multiple levels.
17
firm profits may be possible; more crucially, omitted variables may cause bias in parameter estimations. That being acknowledged, the survey covers a rich set of macro and micro-level factors which shed valuable insight on a relatively unexplored topic. More recent surveys, exclusively focusing on the costs of doing business in this sector, are in their preliminary stages but not yet of the size or quality to facilitate valid analysis of the research problem, thus the current dataset remains the most appropriate.
3.2 Sample 3.2.1 Participants The sample is composed of 1,567 entrepreneurs who own a business within Gauteng which is unregistered for value-added tax (VAT) and has a turnover of less than ZAR 1 million per annum. This is the definition of informal enterprise employed by the GCRO during survey collection. While this measure captures the illegitimate and small-scale character of informal activity, it admittedly neglects other aspects (such as employment) and therefore overlooks “semi-formal” enterprises who are registered yet hire labour or subcontract informally. Furthermore, self-identification risks losing those who are unwilling to disclose their legal status or earnings. Nonetheless, clear and consistent threshold criteria, which are explicitly stated at the beginning of the questionnaire along with assurance of anonymity, make participants directly comparable and are thus useful from an empirical standpoint.
Sample businesses are located throughout the GCR (Figure 2). The hidden nature of informal activity makes it difficult to assess the composition and characteristics of the baseline population and therefore to judge the sample’s true representativeness (Peberdy, 2017), although an extensive sample size arguably compensates for this uncertainty. Previously informal businesses which either failed or graduated, who are arguably key in identifying profit determinants, cannot be studied, though this does not impact the study’s internal validity.
3.2.2 Sampling Procedure
The GCRO administered the survey in major Central Business Districts, inner city residential areas, townships and informal settlements where informal businesses are known to operate (Peberdy, 2017). On designated streets within these locations, the first participant was selected at random; thereafter every third entrepreneur was chosen. The sampling design therefore comprises a mix of purposive, random and fixed interval elements. Participants were screened for eligibility using citizenship, business ownership and the above informality criteria. Questionnaires were conducted at the respondent’s place of business and in person, allowing the spatial mapping of activities and avoiding problems associated with misinterpretation or uneven access to technology.
A natural clustering exists of lower-level units within higher ones, namely firms within sectors and firms within municipalities. Observations within these groups are bound to be correlated. Ideally, hierarchical multi-level models would be employed to disaggregate individuals and correct for within-cluster homogeneity which deflates standard errors and leads to type one errors (see a full discussion in Thomas and Heck, 2001). However, the lack of more complex sampling design, such as multi-stage stratification, renders some subgroups (especially municipalities such as Randfontein and Ekurhuleni, visible in Figure 2, and the manufacturing

18
sector) too small to enable this form of statistical analysis and arguably underrepresented when compared against Peberdy (2018, pp.194). Meanwhile, an emphasis on women and migrants poses a risk of oversampling from these categories.
Figure 2: Map of all interview locations in the GCRO survey. Source: Peberdy, 2017.
3.3 Research Instruments
The GCRO constructed a closed-ended, structured questionnaire to gather information on the demographic and socioeconomic characteristics of entrepreneurs, attributes and activities of their firms, and the quality of the external environment (see Appendix for a full breakdown of indicators), with the enterprise as the unit of observation. A mix of quantitative and qualitative data across multiple dimensions allows a better understanding of the underlying issues (Garoma, 2012). The main tools used in the survey to obtain quantitative data on opinion-based variables are discrete answer Multiple-Choice Questions (MCQs) and ordinal Likert Scales.
19
A few features warrant discussion. First, proxies were used to measure the conduciveness of the economic, operating, policing and social environments. Specifically, respondents were asked the frequency (often, sometimes or never) with which their firm experiences problems with various actors and institutions, including competitors, customers and authorities. Their total score for each category was calculated and re-scaled. This may at first seem an unreliable way to establish business obstacles, yet perceived costs of trade undoubtedly dictate managers’ investment decisions, thereby impacting profits. A prime example is the perceived threat of goods confiscation or theft and the impact on investment and asset accumulation. Furthermore, implementation issues regarding regulations (Lund and Skinner, 2005) render ‘real costs’ almost less compelling as an indicator.
Second, estimates of microenterprise profits rely on a single recall question. This method is renowned for being inaccurate and unreliable compared to, for instance, separating revenues and expenditures or repeating the question at frequent time intervals (Daniels, 2001; De Mel et al, 2009). It is plausible that certain groups (namely, tax eligible firms or those in extreme poverty) are more likely to refuse or exaggerate profits, causing systematic measurement error. A second measure of performance, firm size (the number of employees plus one for the owner), is therefore used as an alternative dependent variable for robustness3. Results are verified against outcomes from profit regressions to evaluate the scale of bias in the original model.
Third, MCQs lack a method of ranking of importance. The selection of multiple goods and services, or motivations for starting the business, makes it difficult to allocate firms to a specific industry or distinguish more broadly between survivalists and growth-oriented enterprises. This is solved by grouping responses (effectively collapsing the number of categories) and assigning observations to either the modal or highest mean response category in order to generate dummy variables for these indicators (see appendix for a description of this process).
Last, numerous determinants emphasised in the literature as being significant for firm performance are not available in the survey, for instance, personality and competence at the owner level (Garoma, 2012), innovation practices plus competition and networking strategies at the firm level (Kraemer-Mbula, 2016), and the provision and quality of local infrastructure or access to technology at the external level (Goedhuys and Sleuwaegen, 2010). At best, this reduces the predictive power of the model; at worst, it misleads inference through endogenous error terms. This is partially overcome by constructing variables for growth-orientation (capturing personality and risk appeal) and the operating environment (capturing storage facilities and training programs), and including dummies for specific strategies, namely specialisation and joint ventures.
3.4 Methodology
After identifying the variables which best capture the concepts highlighted in the literature, a process of data cleaning and indicator derivation is undertaken (detailed data preparation steps are found in the appendix), including diagnostic tests for assumptions of linearity, normality and outliers, plus the correction of violations. The research questions are then addressed through the following techniques and deliverables:
3 It was attempted to create an annual growth indicator to contrast the static nature of profits. This was done by taking the current value of the business, subtracting the value of start-up capital and dividing by the age of the enterprise. However, with the first two variables being categorical, calculations became unreliable and firm size was considered a sounder choice.
20
3.4.1 Descriptive Statistics The first sub-question is answered using descriptive statistics, including composite bar charts to contrast the profit distributions between different subgroups. Sample decompositions and measures of central tendency and spread are tabulated, providing initial insight into key profit determinants and highlighting trends which appear to support or contradict the literature reviewed in Chapter 2.
3.4.2 Base Specification
The second sub-question employs multivariate regressions to examine the plausible determinants of profits within the sample. Regression outputs are presented cumulatively, with the first three specifications looking separately at owner, firm and external dimensions, and thereafter in combination to observe changes in parameter values and/or significance levels. The final model to be estimated takes the general log-linear form:
(1) Log Profitsi = α + β1 Owner characteristicsi + β2 Firm characteristicsi + β3 External factorsi + ε i
Where:
Profits are defined as the self-reported average monthly net profit of enterprise i. The logarithm is taken to account for the skewed nature of profits within the sample as well as certain non-linear trends, thereby satisfying the assumptions of OLS methods.
Owner characteristics represents a row vector including the respondent’s age in years, highest level of completed education and dummy variables for race (black versus non-black), gender, nationality (international migrant versus South African citizen) and main motivation for starting the business (survivalist versus growth-oriented).
Firm characteristics denotes a vector of attributes including firm sector, whether the business is a lone or joint venture, premise type (mobile, temporary, permanent or in the home), tenure status (whether the premise is owned, rented or free), the logged value of rent paid monthly (if rented), the initial value of the business (start-up capital), and a binary variable for whether the firm is diversified or specialised in terms of goods and services, as well as controlling for firm age (indicating the lifecycle stage of the firm) and firm size (specifically employment, either owner-operated, micro-enterprise with 1-5 employees, or small-enterprise with more than 5 employees).
External factors include the geographic location of the firm and indicators for the frequency (regularly, sometimes or often) of perceived obstacles with the supply, demand, operating, policing and discrimination environments, capturing issues with competition and prices, sales, crime and infrastructure, government burden and social cohesion respectively;
The βs are parameter vectors estimating the effect of regressors on profits; ε is the stochastic error term. A table of operationalisation and expected coefficient signs can be found in the appendix. Variables with a question mark are ambiguous in the direction of impact.
Robustness checks will include, as aforementioned, the use of an alternative dependent variable, as well as testing for non-linearities and interaction terms. Models will be evaluated using t-tests, the R-squared for fit, Ramsey tests for omitted variables and variance inflation factors for multi-collinearity.
21
3.4.3 Disaggregated Regressions
Despite historically being treated as uniform, the literature continually points to the fact that the informal sector is heterogeneous in its drivers, goals and needs. Correspondingly, the above model is reiterated using restricted samples. This allows an assessment of whether certain groups of entrepreneurs face common or unique constraints, thereby guiding towards more tailored and effective solutions. Profit determinants are examined separately for each sector (retail and trade, manufacturing and services) and compared between survivalist and growth-oriented firms. Ideally, the model would also be tested within each municipality, but insufficient degrees of freedom mean that no output is produced for the majority of locations, such that inference cannot be drawn on spatial heterogeneity. The direction and strength of relationships are compared with the baseline model to divulge the importance of disaggregation in both analysis and policy.
3.4.4 Quantile Regressions
Studies like these are particularly interested in firms in the extreme ranges (very high or low profits) which represent cases of success and struggle. Since regressors can disproportionately affect the most or least profitable firms, it is useful to explicitly examine outliers rather than dismiss or adjust them. Quantile Regression (QR) techniques are applied to capture the full range of the conditional distribution of profits within the sample (Garoma, 2012). QRs are useful in studying heterogeneous populations, as they observe relationships at different portions of the response variable distribution (here, deciles), which is assumed to be skewed (Buchinsky, 1998), and do not rely on the assumption of a constant variance. Instead of minimising the sum of squared residuals, a criteria function is minimised using a weighted value of positive and negative residuals to produce Minimum Absolute Deviation (MAD) estimators (Goedhuys and Sleuwaegen, 2010). For the median, for example, 50% positive, 50% negative residuals used. By moving away from estimation at the mean, different segments of the informal economy can be analysed to give more detailed insight into the experiences and barriers to success, especially for those at the bottom of the income distribution.
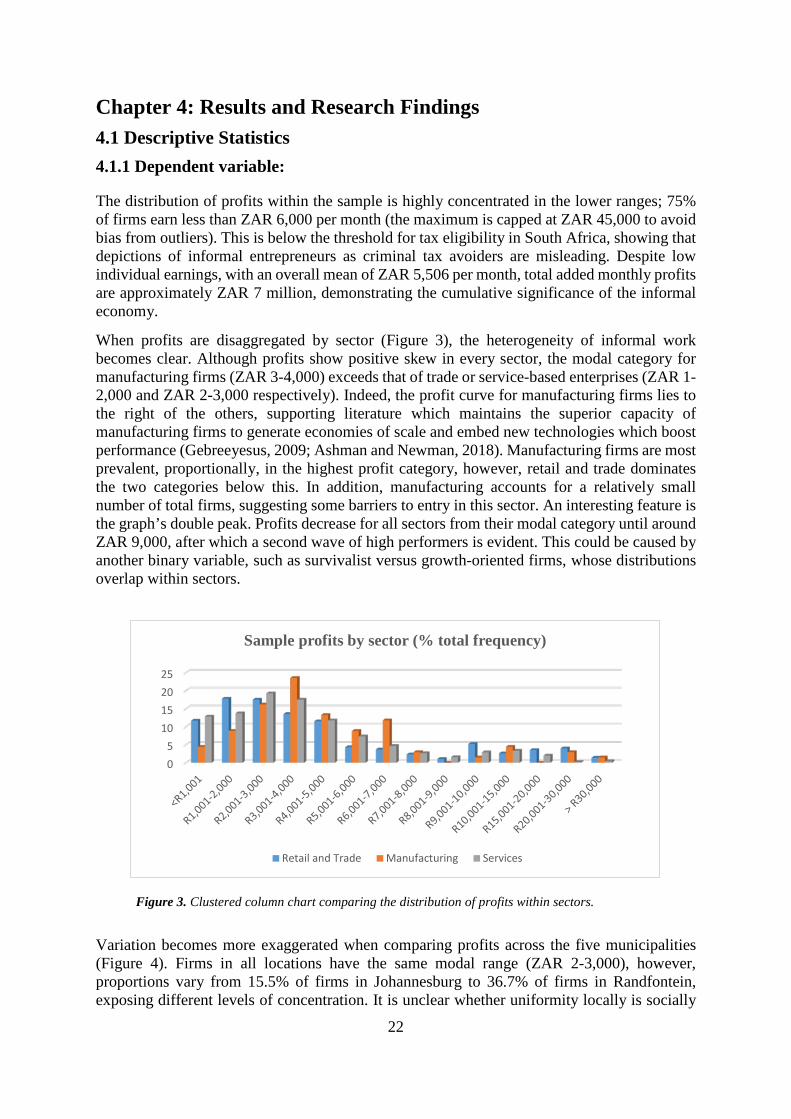
22
Chapter 4: Results and Research Findings 4.1 Descriptive Statistics 4.1.1 Dependent variable:
The distribution of profits within the sample is highly concentrated in the lower ranges; 75% of firms earn less than ZAR 6,000 per month (the maximum is capped at ZAR 45,000 to avoid bias from outliers). This is below the threshold for tax eligibility in South Africa, showing that depictions of informal entrepreneurs as criminal tax avoiders are misleading. Despite low individual earnings, with an overall mean of ZAR 5,506 per month, total added monthly profits are approximately ZAR 7 million, demonstrating the cumulative significance of the informal economy.
When profits are disaggregated by sector (Figure 3), the heterogeneity of informal work becomes clear. Although profits show positive skew in every sector, the modal category for manufacturing firms (ZAR 3-4,000) exceeds that of trade or service-based enterprises (ZAR 1-2,000 and ZAR 2-3,000 respectively). Indeed, the profit curve for manufacturing firms lies to the right of the others, supporting literature which maintains the superior capacity of manufacturing firms to generate economies of scale and embed new technologies which boost performance (Gebreeyesus, 2009; Ashman and Newman, 2018). Manufacturing firms are most prevalent, proportionally, in the highest profit category, however, retail and trade dominates the two categories below this. In addition, manufacturing accounts for a relatively small number of total firms, suggesting some barriers to entry in this sector. An interesting feature is the graph’s double peak. Profits decrease for all sectors from their modal category until around ZAR 9,000, after which a second wave of high performers is evident. This could be caused by another binary variable, such as survivalist versus growth-oriented firms, whose distributions overlap within sectors.
Figure 3. Clustered column chart comparing the distribution of profits within sectors.
Variation becomes more exaggerated when comparing profits across the five municipalities (Figure 4). Firms in all locations have the same modal range (ZAR 2-3,000), however, proportions vary from 15.5% of firms in Johannesburg to 36.7% of firms in Randfontein, exposing different levels of concentration. It is unclear whether uniformity locally is socially
05
10152025
Sample profits by sector (% total frequency)
Retail and Trade Manufacturing Services
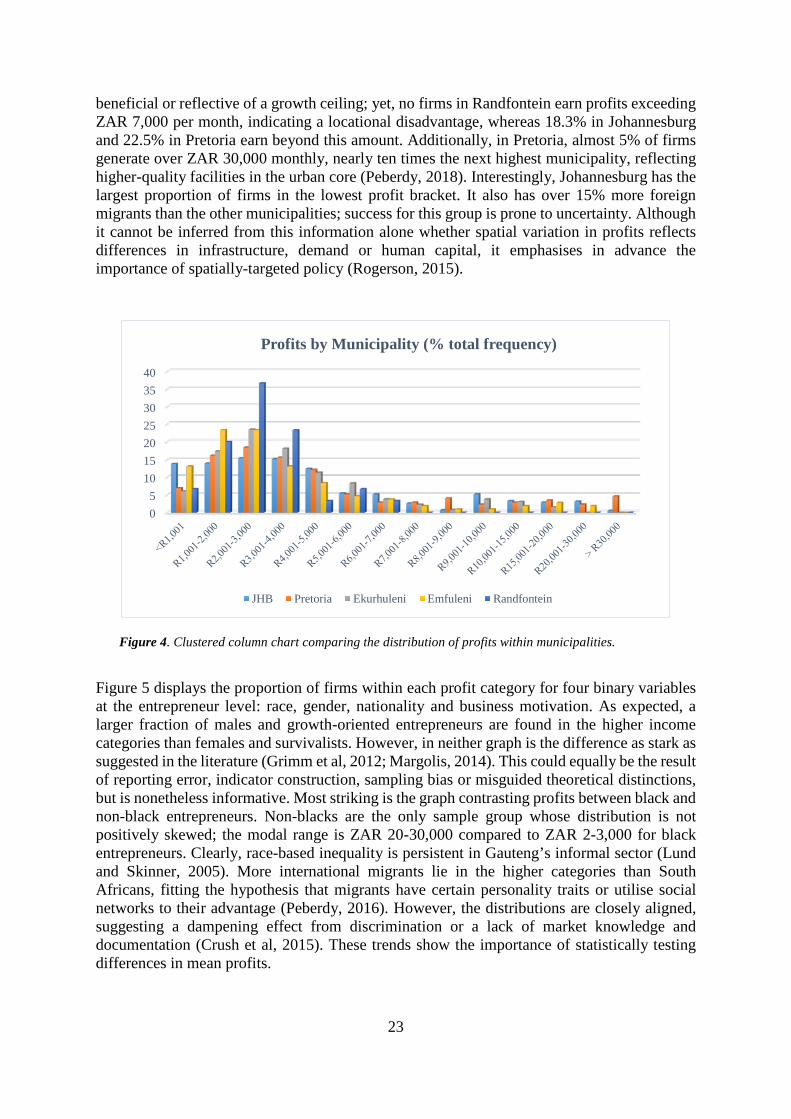
23
beneficial or reflective of a growth ceiling; yet, no firms in Randfontein earn profits exceeding ZAR 7,000 per month, indicating a locational disadvantage, whereas 18.3% in Johannesburg and 22.5% in Pretoria earn beyond this amount. Additionally, in Pretoria, almost 5% of firms generate over ZAR 30,000 monthly, nearly ten times the next highest municipality, reflecting higher-quality facilities in the urban core (Peberdy, 2018). Interestingly, Johannesburg has the largest proportion of firms in the lowest profit bracket. It also has over 15% more foreign migrants than the other municipalities; success for this group is prone to uncertainty. Although it cannot be inferred from this information alone whether spatial variation in profits reflects differences in infrastructure, demand or human capital, it emphasises in advance the importance of spatially-targeted policy (Rogerson, 2015).
Figure 4. Clustered column chart comparing the distribution of profits within municipalities.
Figure 5 displays the proportion of firms within each profit category for four binary variables at the entrepreneur level: race, gender, nationality and business motivation. As expected, a larger fraction of males and growth-oriented entrepreneurs are found in the higher income categories than females and survivalists. However, in neither graph is the difference as stark as suggested in the literature (Grimm et al, 2012; Margolis, 2014). This could equally be the result of reporting error, indicator construction, sampling bias or misguided theoretical distinctions, but is nonetheless informative. Most striking is the graph contrasting profits between black and non-black entrepreneurs. Non-blacks are the only sample group whose distribution is not positively skewed; the modal range is ZAR 20-30,000 compared to ZAR 2-3,000 for black entrepreneurs. Clearly, race-based inequality is persistent in Gauteng’s informal sector (Lund and Skinner, 2005). More international migrants lie in the higher categories than South Africans, fitting the hypothesis that migrants have certain personality traits or utilise social networks to their advantage (Peberdy, 2016). However, the distributions are closely aligned, suggesting a dampening effect from discrimination or a lack of market knowledge and documentation (Crush et al, 2015). These trends show the importance of statistically testing differences in mean profits.
05
10152025303540
Profits by Municipality (% total frequency)
JHB Pretoria Ekurhuleni Emfuleni Randfontein

24
Fig
ure
5. C
lust
ered
col
umn
char
t sh
owin
g th
e di
stri
butio
n of
pro
fits
betw
een
raci
al g
roup
s (to
p-le
ft),
gend
er (
top-
righ
t), n
atio
nalit
y (b
otto
m-le
ft) a
nd
surv
ival
ist v
ersu
s gro
wth
-ori
ente
d fir
ms (
botto
m-r
ight
).
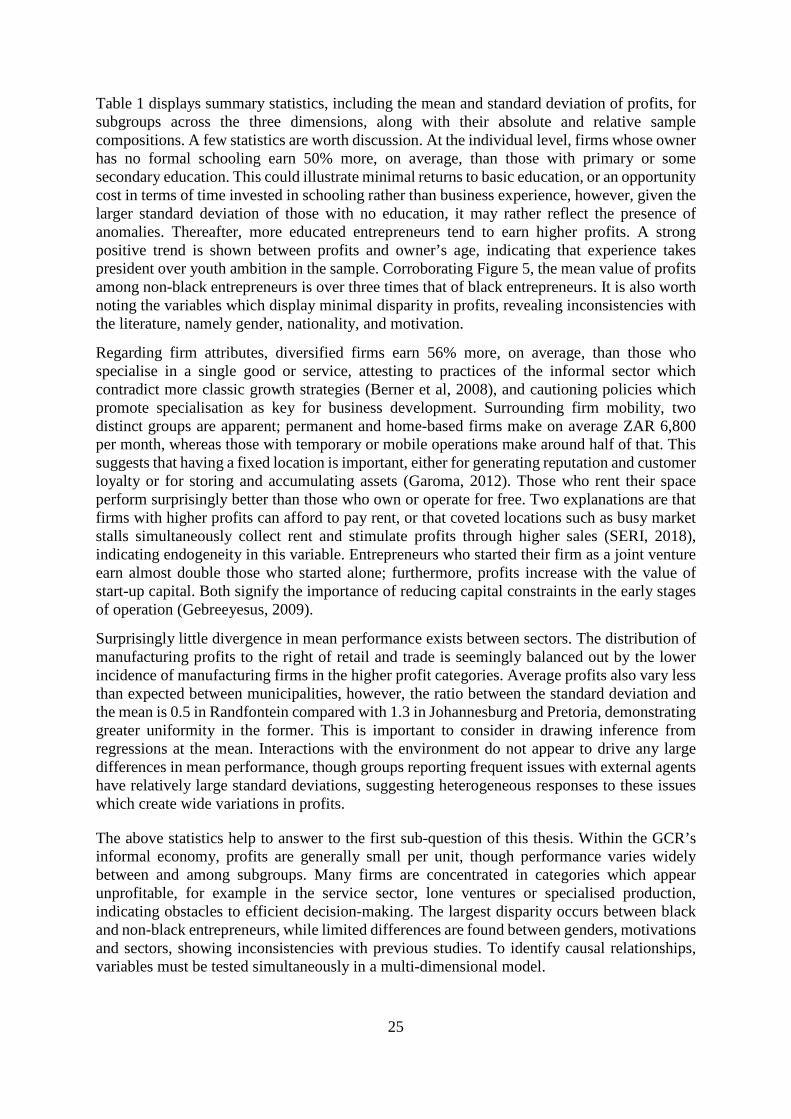
25
Table 1 displays summary statistics, including the mean and standard deviation of profits, for subgroups across the three dimensions, along with their absolute and relative sample compositions. A few statistics are worth discussion. At the individual level, firms whose owner has no formal schooling earn 50% more, on average, than those with primary or some secondary education. This could illustrate minimal returns to basic education, or an opportunity cost in terms of time invested in schooling rather than business experience, however, given the larger standard deviation of those with no education, it may rather reflect the presence of anomalies. Thereafter, more educated entrepreneurs tend to earn higher profits. A strong positive trend is shown between profits and owner’s age, indicating that experience takes president over youth ambition in the sample. Corroborating Figure 5, the mean value of profits among non-black entrepreneurs is over three times that of black entrepreneurs. It is also worth noting the variables which display minimal disparity in profits, revealing inconsistencies with the literature, namely gender, nationality, and motivation.
Regarding firm attributes, diversified firms earn 56% more, on average, than those who specialise in a single good or service, attesting to practices of the informal sector which contradict more classic growth strategies (Berner et al, 2008), and cautioning policies which promote specialisation as key for business development. Surrounding firm mobility, two distinct groups are apparent; permanent and home-based firms make on average ZAR 6,800 per month, whereas those with temporary or mobile operations make around half of that. This suggests that having a fixed location is important, either for generating reputation and customer loyalty or for storing and accumulating assets (Garoma, 2012). Those who rent their space perform surprisingly better than those who own or operate for free. Two explanations are that firms with higher profits can afford to pay rent, or that coveted locations such as busy market stalls simultaneously collect rent and stimulate profits through higher sales (SERI, 2018), indicating endogeneity in this variable. Entrepreneurs who started their firm as a joint venture earn almost double those who started alone; furthermore, profits increase with the value of start-up capital. Both signify the importance of reducing capital constraints in the early stages of operation (Gebreeyesus, 2009).
Surprisingly little divergence in mean performance exists between sectors. The distribution of manufacturing profits to the right of retail and trade is seemingly balanced out by the lower incidence of manufacturing firms in the higher profit categories. Average profits also vary less than expected between municipalities, however, the ratio between the standard deviation and the mean is 0.5 in Randfontein compared with 1.3 in Johannesburg and Pretoria, demonstrating greater uniformity in the former. This is important to consider in drawing inference from regressions at the mean. Interactions with the environment do not appear to drive any large differences in mean performance, though groups reporting frequent issues with external agents have relatively large standard deviations, suggesting heterogeneous responses to these issues which create wide variations in profits.
The above statistics help to answer to the first sub-question of this thesis. Within the GCR’s informal economy, profits are generally small per unit, though performance varies widely between and among subgroups. Many firms are concentrated in categories which appear unprofitable, for example in the service sector, lone ventures or specialised production, indicating obstacles to efficient decision-making. The largest disparity occurs between black and non-black entrepreneurs, while limited differences are found between genders, motivations and sectors, showing inconsistencies with previous studies. To identify causal relationships, variables must be tested simultaneously in a multi-dimensional model.

26
4.1.2 Independent variables
Steering away from profits towards sample characteristics, Table 1 shows that the sample is male dominated, with 90% of respondents being black and 60% foreign migrants. Although it is difficult to comment for certain on proportional representation (Peberdy, 2017), the latter figure is unusually large, even if migrants are more prevalent in informal work than in the general population, reflecting the purpose of the survey. Despite 63% of entrepreneurs self-
Table 1: Descriptive statistics and sample composition.
27
reporting as growth-oriented, approximately two-thirds report not having a business partner, and not bulk purchasing with other informal businesses or diversifying their portfolio, despite higher profits being linked to these choices. The failure of motivation to manifest in strategic decision-making (which may stem from external constraints or a poor evaluation of one’s own drivers and capabilities) could explain the limited divergence in performance between survivalist and growth-oriented individuals. Strategy could therefore be a mediating factor in the relationship between motivation and profits, as found in Baum et al (2001).
Just 29 firm owners have a background of university education, which makes sense, as tertiary education increases options for wage employment in the formal sector (Goedguys and Sleuwaegen, 2010). Conversely, over 80% have at least some secondary education. Contrary to allusions in the literature (Gebreeyesus, 2009), the distribution of schooling is roughly equal between men and women in the sample, and between blacks and non-blacks. However, 12% of respondents in Pretoria have a college certificate, compared to 2% in Randfontein, which may explain a portion of the spatial heterogeneity in performance.
Only 92 of 1,567 firms operate in the manufacturing sector, while trade and services occupy 94% of the sample, selling predominantly consumable goods including food-related products (53%), clothes, shoes and accessories (23%) and household and toiletries (17%). No single product dominates, showcasing the ability of the informal economy to meet the range of basic needs in often unreachable markets (Neurieth, 2011). The lack of durable goods or producer services, which tend to reap higher profit margins, may be a cause of low overall profit levels. In the GCRO’s 2015 Quality of Life Survey (QoL), trade and services represented 79% of informal businesses (Peberdy, 2018). The extreme concentration here may be a result of the sampling strategy used, in that street interviews neglect construction and transport occupations which are major informal employers.
80% of firms are less than 10 years in operation, with a mode of 4 years. In the QoL survey, the mode was less than one year (Peberdy, 2015). The survey also yields three times as many firms with more than five employees than the QoL. Hence, there is a relative scarcity of young firms and a surplus of larger firms in the current sample, which could inhibit the identification of barriers to performance for micro-enterprises in the initial stages of firm development.
Over half of sampled enterprises began by investing less than ZAR 5,000, and almost three quarters less than ZAR 10,000; the vast majority of owners started their venture alone, and 57% remain owner-operated. These seemingly illogical choices are made clearer when the sources of start-up capital are examined, since nearly 70% of entrepreneurs used personal savings to start their business. Where loans were accessed, they were sourced mainly from family or friends (22%) or informal money lenders and financial institutions (8%). Only 0.1% of loans came from government agencies, another 0.1% from micro-finance institutions, and 1.9% from banks. Hence, in the absence or failure of micro-finance programs and joint lone initiatives, it appears that starting and remaining small is, in fact, not a choice. Moreover, a clear racial division in capital constraints is evident. Almost 30% of black entrepreneurs began their business with less than ZAR 2,500, compared to just 3% of non-blacks (interestingly, the same ratio as their respective mean profits).
Other interesting information concerns the source of business supplies. 73% of inputs originated in the formal sector, from wholesalers, factories, supermarkets or small retailers. 16% of goods acquired from farmers or fresh produce markets, while only 8% were produced informally, either by the entrepreneurs themselves or by other firms, confirming a strong interdependence with the formal economy (Peberdy, 2018). Accordingly, it seems mutually beneficial to strengthen supply chains and regulate competition and prices. 3% of supplies were

28
sourced from abroad, suggesting weaker international network linkages than pre-supposed (although perhaps there was a reluctance to admit to trading undeclared goods).
The majority of interviews were conducted in Johannesburg, reflecting its relatively large population but perhaps overlooking the high degree of informality in peripheral townships. External obstacles impact businesses to a different degree in each municipality. The economic environment was reported as a bigger issue in Ekurhuleni and Randfontein than in the three districts along the North-South transport corridor (known as the ‘Corridor of Freedom’ (Seedat, 2015)), reflecting the restricted access of the former to supply and demand markets. A relatively high portion (76%) of entrepreneurs answered “often” or “sometimes” to experiencing supply issues, while the operating, policing and discriminatory environments were seldom stated as problematic for business in any of the five municipalities. This is unexpected, given reports and case studies which highlight conflict (Crush et al, 2015) and service provision (SERI, 2018) as major obstacles for progress, and may insinuate a divide between reputation and reality.
4.2 Inferential Analysis 4.2.1 Baseline Regression Results
Table 2 shows the results of the initial OLS regressions. Columns 1-3 display the coefficients and heteroskedasticity-robust standard errors for owner characteristics, firm attributes and external factors separately, while column 4 captures the full specification. The log-linear model form means that a unit change in an independent variable is associated with a 100*β% change in profits. Dummy reference categories can be seen in the table note or Annex 1.
Regarding owner traits, international migrants earn 11% more than South Africans, blacks 84% less than non-blacks, and a 4% increase in profits is found per year of age (1). Surprisingly, gender has no statistical influence on firm profits, perhaps implying the existence of a variable which mediates or moderates the observed relationship. The results indicate a bel-curve in the returns to schooling, whereby primary education has a negative impact on firm profits compared to no formal schooling, but the completion of secondary school or higher stimulates positive returns, with the highest educated group making nearly twice the profit of the baseline group. Growth-oriented entrepreneurs generate approximately 9% higher profits than survivalists in the sample, however, this is only significant at the 90% level, challenging literature which makes a clear distinction between the two (Margolis, 2014).
At the firm level, manufacturers are found to earn higher profits than trade firms, and service firms less, but unexpectedly only the latter difference is significant (2). As previously stated, estimates at the mean mask contrasting trends of spread, plus street interviews neglect certain high-scale industries which may boost manufacturing profits. Additional information could be extracted by examining different occupations within the three sectors (for instance, separating food and clothing vendors), especially in light of policies selecting key industries for growth in the coming decades (Seedat, 2015), and by increasing the number of manufacturing firms in the sample.

29
Table 2. OLS regression output for individual dimensions (1-3), the multi-dimensional model (4), and sub-sample regressions by sector (5-6) and motivation (7-8). Robust standard errors in parentheses: * p < 0.1 ** p < 0.05 *** p < 0.01
Note: Where dummies are included, the reference firm has a South African, non-black, male entrepreneur with no formal schooling and survivalist motives; the firm is in the retail and trade sector, owner-operated, diversified, and has an owned permanent location. The firm began with less than ZAR 2,500, is located in Johannesburg, and experiences frequent issues with the external environment.
30
Whether the firm was a lone or joint venture makes no difference to performance once start-up capital is controlled for, which is logical, since relaxing capital constraints is the main argument behind joint ventures (Gebreeyesus, 2009). Indeed, start-up capital is strongly positively related to firm profits, with firms in the highest bracket making almost double those in the lowest. Specialised firms earn 16.4% less than their diversified competitors. Admittedly, the two indicators available from the survey which relate to innovation and strategy are fairly poor in terms of validity, thus conclusions based on these cannot be treated as fact.
Contradicting the preliminary statistics, the permanence of business premises is irrelevant for securing higher profits, though home-based enterprises have 14% lower profits, on average, than permanent businesses outside the home, corroborating Berner et al (2008). Those who operate for free earn around 60% higher, all else constant, than those who own their business premise. This has interesting policy implications, since tenure and a fixed location are often deemed crucial for stability and growth (SERI, 2018). Renters’ profits also exceed owners’ by 50%, while the elasticity of profit with respect to rent is 0.37, meaning that a 10% increase in rent yields a 3.7% increase in firm profit. However, concerns of endogeneity in the form of a reverse or spurious relationship mean that causality cannot be established without further testing.
Looking to the external environment (3), informal firms in Emfuleni and Randfontein generate, on average, 24% and 33% less profit respectively than those in Johannesburg, while firms in Pretoria produce 15% more, revealing spatial disparities in the ease of doing business (Seedat, 2015). Those who frequently experience supply issues such as excessive competition or input costs in fact report 21% higher profits than those who rarely face such obstacles. The direction of association contradicts both theory and logic; perhaps entrepreneurs pass costs on to consumers through pricing strategies or make strategic choices to lower input costs. There is a 41% difference in predicted profits between firms who regularly encounter police harassment and firms who rarely do, significant at the 90% level, corroborating reports which cite negative interactions with authorities as a major obstacle to performance (Crush et al, 2015; SERI, 2018). The demand, operating and discrimination environments are found to bear no influence on profit, suggesting that conflict, crime and prejudice affect only the experience of entrepreneurs rather than business performance. The latter two are omitted due to high variance inflation factors indicating multi-collinearity. All subsequent regressions use this reduced specification.
Numerous regressors which initially influence firm profits, specifically owner traits, firm sector and strategy, become insignificant in the multi-dimensional model (4). The most surprising is race, which showed clear disparities in the preceding analysis. Additionally, having a temporary location negatively impacts profits, while the strength of association with both the supply and demand environments increases. These changes are evidence of omitted variable bias in the first three specifications, challenging the conclusions of studies which treat variables in isolation. In the full specification, the key determinants pertain mostly to the firm, particularly start-up capital, employment and rent. This aligns with initial outputs where firm-level variables explained the largest fraction of the variance in profits amongst the individual dimensions. An R-squared of 0.75 implies a more holistic treatment of the research problem using a multi-dimensional model.
Unexpectedly, the sign for the growth-oriented dummy switches to negative. There is a possibility of sample contamination, whereby so-called “gazelles”, who identify themselves as growth-oriented but have not yet reached their potential due to external constraints, reduce average profits for growth-oriented firms (Boston and Boston, 2007; Grimm et al, 2008). This must be considered in evaluating the soundness of indicators.

31
Various non-linear relationships and interaction terms were tested but are not reported due to their negligible impact on profits. Substituting firm size as the outcome variable reveals even fewer factors as significant determinants of performance, namely rent, start-up capital and the demand environment (see appendix for results). Although this provides a useful robustness check, it must be noted from Table 1 that over 80% of firms have 5 or less employees. A lack of variation in the outcome variable, along with a relatively poor model fit, confirms that profits are the most appropriate measure of performance available from the dataset.
Considering this first set of regressions, it appears that the performance of informal firms in Gauteng hinges upon economic and locational variables rather than social or demographic factors. Determinants affect the quantity or cost of inputs to the production function (namely labour, capital and land) or alter revenues through the level of competition or size of the customer base.
4.2.2 Disaggregated Regression Results
The remainder of Table 2 presents results for the overall model using disaggregated samples, examining the retail and trade and service sectors (columns 5-6) plus growth-oriented and survivalist firms (columns 7-8) separately4. Owner attributes do not, on the whole, predict firm performance in the sample. The same regression was run for the different genders, nationalities and racial groups, and a similar general pattern was shown, with start-up capital, rent and the supply environment repeatedly being shown as key determinants of success (output is not included due to limited added information). Consistency implies that certain common obstacles are faced by the majority of informal firms in the GCR.
A few interesting differences are also evident. Owner age positively impacts profits for survivalists and, to a lesser degree, service firms, suggesting that experience and learning-by-doing are more crucial for these subgroups than formal education (Garoma, 2012), although, for survivalists, attending university does increase business prospects. Survivalists who rent their premises or operate for free generate profits which are 67% and 119% higher, respectively, than owners, likely due to budget restrictions. Only the upper categories of start-up capital yield positive returns for this group, while the municipality is found insignificant, perhaps because those in extreme poverty often depend more on social infrastructure than private capital or the external environment (Berner et al, 2008).
Growth-oriented firms who work in manufacturing perform 21% better, on average, than those working in retail and trade. Furthermore, retail and trade firms which are growth-oriented perform 17% worse than survivalists, indicating a lack of complementarity between these two variables. For retail and trade firms, lone ventures are more successful than partnerships, contrasting literature which promotes the sharing of budgets and risks (Garoma, 2012) and suggesting that autonomy is more important for this sector. Relatively few factors are significant for service firms, however, a sub-sample of just 91 firms reduces the certainty of inference drawn from this regression.
The supply environment is more crucial for retail and trade firms and growth-oriented entrepreneurs than for service providers and survivalists. These groups arguably require extra
4Coefficients for the manufacturing sector are not reported, since standard errors are incalculable due to insufficient degrees of freedom. The same issue occurs for municipalities, where three of the five regressions produce no output.
32
stock and investments, which depend on access to credit, affordable supply sources and the degree of competition (SERI, 2018). Furthermore, for retail and trade (plus partially growth-oriented) firms, the policing environment is a key factor, a trend which was masked in the aggregate regression. Street vendors have a large portion of their wealth tied up in goods, such that confiscation in particular presents a larger threat to them than, for instance, home workers or service providers (Crush et al, 2015). As with supply issues, a negative relationship is shown which seems counter-intuitive. This may reflect an anticipation effect, whereby those who face a higher risk of policing problems have reserve plans to prevent loss or even profit from bribery and collusion. An alternative explanation is that firms who earn higher profits are more susceptible to harassment and demands for bribes from officers. It is therefore important to unravel the mechanisms behind observed relationships before definitive conclusions can be drawn.
4.2.3 Quantile Regression Results
Table 3 shows the marginal effects of regressors at each decile of the profit distribution, using variance clustered errors to account for within-group correlation. The median regression (column 5) is outlined for comparison with the overall mean regression from Table 2 (column 4). While Least Squares estimates assume that all firms are equally affected by changes in an independent variable, Quantile Regressions reveal that for many factors, one or other tail is impacted to a greater extent, that is, profit determinants differ between high- and low-income firms. This highlights the information lost through pooled sample analyses, leading to an incomplete capturing of reality and a failure of policy to respond to ongoing trends.
Certain outcomes are consistent with the base regression. Although the magnitude of coefficients peaks in the middle ranges, all businesses benefit immensely from access to capital during start-up, supporting the notion of path dependence found by Gebreeyesus (2009). The relationship between rent and profits is also irrespective of distributional position, though the direction of association remains contentious. Supply issues influence the profits of all deciles comparably except for the highest and lowest groups. Conceivably, those at the bottom produce their own goods or purchase inputs in minimal quantities so that small price fluctuations have a negligible impact on costs, while those at the top have wider, more diverse supply networks or demand greater power in negotiations with suppliers.
Interestingly, various owner traits which were found unimportant in regressions at the mean become significant in the extremes. Gender presents a barrier for the lowest two decile groups, warranting support for women in low-income households (SERI, 2018), as does tertiary education, corroborating literature which cites higher returns to schooling for poorer individuals (Goedhuys and Sleuwaegen, 2010). The negative impact of college and university education on profits reflects an opportunity cost in terms of business experience, or a mismatch in relevant skills for low-profit firms. For those in the upper three deciles, race-based inequality is more pronounced; black entrepreneurs make over 30% less profit, on average, than non-black entrepreneurs, indicative of a profit ceiling for the former. Such information was not extractable from the previous regressions but is highly important given the contextual background of South Africa and drive towards racial equality. The impact of owner age is positive and significant for six of the nine decile groups, suggesting that learning compensates for a lack of modern technical knowledge or youth ambition (Grimm et al, 2012). Motivation loses its predictive power for all but one subgroup, though again, the 90% confidence level and negative coefficient question indicator validity.

33
Other new insights are found at the firm level. Manufacturing firms perform up to 44% better than retail and trade firms in the four highest profit groups, illustrating higher returns to scale in this sector (Ashman and Newman, 2018). In the lower tail of the profit distribution, temporary and home-based businesses perform between 17% and 33% worse than those with a permanent location, opposing the OLS results. This could reflect the added importance of customer loyalty for poorer businesses (Berner et al, 2008), or the fact that poorer households
Table 3. Quantile regression output for every 10th decile of the profit distribution. Variance-clustered standard errors in parentheses. * p < 0.1 ** p < 0.05 *** p < 0.01

34
are located further in the urban periphery and thus attract fewer customers. Accordingly, informal firms above the median profit line would benefit from reallocating resources towards more capital-oriented industries, while those below it would gain from stabilising their activity and accessing fixed operating locations.
Another key observation is that municipality loses significance for all deciles apart from the median. However, very few firms in the peripheral areas are located in the upper quantiles of the profit distribution (Figure 3), hence these estimations are based on limited data and are thus limited in terms of inference. Where the demand environment was insignificant in the majority of OLS regressions, demand issues are shown to impact profits for five decile groups. The policing environment influences profits for the median group and those adjacent to it. As previously speculated, perhaps the richest are better able to afford bribery payments while poorer firms are not conspicuous enough to warrant police attention, though these patterns are hard to justify without further scrutiny.
Together, the results of this model demonstrate that the GCR’s informal economy is ill-suited to a one-size-fits-all set of regulations or provisions. Different sectors, income groups (and arguably locations, though this cannot at this stage be tested) require unique assistance and incentives to optimise their performance and maximise their capacity for employment creation and poverty reduction. Specific variables, namely start-up capital and supply issues, appear universally important. Following the Quantile Regressions, other factors including socioeconomic traits, sector and mobility, bear more influence on profits than initially estimated, but apply to particular groups of entrepreneurs.
35
Chapter 5: Conclusions and Recommendations South Africa faces a number of development challenges including rapid rural-urban migration, unemployment, poverty and inequality (Burdett, 2006; Cheruyoit, 2018). Parallel to these trends, a diverse and innovative informal economy is expanding in urban areas (Peberdy, 2018). Offering employment and income opportunities to marginalised groups, it occupies a key potential role in inclusive growth. However, poor management and support at both national and local level have contributed to the failure of the sector to meet this potential in terms of productivity and poverty reduction (Chen, 2007; Rogerson, 2015). A major setback in creating new policy frameworks is the lack of evidence surrounding the interventions required to facilitate success for informal businesses (Garoma, 2012; Rogerson, 2016).
The purpose of this thesis was to gain a holistic understanding of the factors driving variation in firm profits within Gauteng’s informal economy. The research was underpinned by a theoretical knowledge of the sector as being dynamic, heterogenous and context-specific (Jutting and de Laiglesia, 2009; Heinzt, 2012), as well as how to define and measure success (Garoma, 2012; Kanbur and Keen, 2015). It built upon observational studies of demographic, social and economic trends in informality (Peberdy, 2018; Vom Hofe and Cheruiyot, 2018), along with empirical research into small enterprise success at single levels of analysis or in specific sectors and regions (Baum et al, 2001; Gebreeyesus, 2009; Adriaenssens and Hendrickx, 2015). By taking a multi-dimensional approach and employing various estimation and disaggregation techniques, the contribution to existing literature lies in the scale and detail of quantitative analysis on the research topic.
The first sub-question examined the distribution of profits within the city-region, exploring spatial and sectoral trends as well as socioeconomic divides. Informal firms in the GCR were found to make low average profits, verifying barriers to growth, however, success varied widely both within and among subgroups, illustrating the sector’s potential for value-added and confirming its heterogeneity. Large disparities in performance were identified between racial groups and municipalities, while patterns for gender, nationality and motivation were much closer aligned than expected given studies on inequality. An interesting finding was the differences in concentration. The municipality Randfontein displayed low inequality, with just 7% of businesses generating below ZAR 1,000 and none above ZAR 7,000 in profit per month; in Johannesburg, the respective proportions were 14% and 18%. Similarly, the ratio between the standard deviation and the mean was much higher for retail and trade firms than for other sectors. This is evidence that tailored policy is required to reach groups of entrepreneurs who struggle to succeed in a competitive environment.
For the second sub-question, a model was constructed incorporating 19 variables across three dimensions: the entrepreneur, the firm and the external environment. While certain factors had clear expectations regarding the direction of association with profits, the predicted effect for others was, a priori, ambiguous. It was further hypothesised that firms in different industries and municipalities, plus those with contrasting motivations and at varying points within the profit distribution, would face different constraints due to varying operating requirements, personal profiles and access to inputs or markets. The main findings are discussed below along with recommended solutions and suggestions for future research.
From the OLS regressions, ceteris paribus, relatively few variables were identified as crucial in determining firm profits, rejecting multiple hypotheses and emphasising the importance of holistic analysis. Surprisingly little association was found between owner characteristics and profits. A lack of divergence between survivalist and growth-oriented entrepreneurs contradicts

36
the major conceptual distinction made in the literature (Margolis, 2014), however, plausible sample contamination necessitates a stronger identification of groups before this is ruled out as a factor (Grimm et al, 2012).
The majority of significant variables applied at firm level and were cost-related, including employment and rent. Start-up capital was a consistent determinant of performance, indicating path dependence in the scale of enterprises. The data revealed just 2.1% of initial investments to stem from government agencies, banks or micro-finance institutions, while almost 70% came from personal savings. The high incidence of capital-constrained firms thus appears strongly related to the frequency of low-profit ventures (Gebreeyesus, 2009). Consequently, absorptive capacity would increase by facilitating access to credit through, for example, joint loan initiatives or laxer loan criteria, especially in the early stages of business development. An outstanding question is whether simply enabling credit is sufficient, or whether training is required in accounting or savings and investment to maximise returns. In other words, is the relationship linear?
Geographic location was also a major factor in the OLS regressions, reflecting the spatially fragmented development of the GCR (Cheruiyot, 2018). This outcome supports current municipal strategies for improved corridor development and spatial integration (see Seedat, 2015) by encouraging interventions which connect businesses to markets (through transport and communications technology) and provide basic services (including sanitation facilities, electricity and waste removal) in historically marginalised areas within Ekurhuleni, Emfuleni and Randfontein. There is even opportunity to collaborate with the informal economy and make developments participatory, sustainable and efficient, for instance, by incorporating waste pickers in municipal recycling program. It is vital to secure a timeline and funding for these processes, as well as establishing accountability, in order to avoid becoming rhetoric of political debate (Rogerson, 2015).
Externally, the supply environment, pertaining to the level of competition, input prices and access to capital, had the greatest influence on profits. Furthermore, information on supply sources revealed a strong interdependence between formal and informal businesses which has not previously been shown empirically (Davies and Thurlow, 2009). The practical implications of this are two-fold. First, it reinforces that prioritising or forcing formalisation is counterproductive, since it would eradicate a sector which supports the mainstream economy. Second, it promotes the strengthening of existing links by expanding and deepening supply chains. This is partially achievable through the distance-bridging infrastructural solutions and credit schemes mentioned above, which would help to ensure access to sufficient, affordable and high quality inputs. In addition, it requires the creation of platforms for negotiation to facilitate mutually-beneficial transactions, as well as the regulation of competition and pricing.
The most interesting results were generated by extending the analysis to disaggregated samples. Certain common obstacles, namely start-up capital and the supply environment, were faced by the majority of informal firms, while others applied specifically to certain groups. Profits of survivalists were positively affected by access to free operating premises and owner age, while external factors were relatively unimportant. Responses such as young enterprise programs to increase skills and innovativeness among young survivalists, as well as publicly-provided spaces, could increase self-sufficiency and opportunity for this group.
For street traders, who operate in exposed areas and face more frequent interaction with authorities (Crush et al, 2015; Peberdy, 2017), the policing environment became highly important. This group would be best assisted by protecting their rights and livelihoods through a reform of local by-laws to align with the Constitution and the training of authorities to implement these regulations fairly and effectively (SERI, 2018). This requires a cooperative

37
approach to informal sector management, including increased transparency, participation and compliance on both sides of the law.
Profit determinants differed quite significantly between firms in the upper and lower tails of the outcome distribution. Gender, higher education and home-based enterprise presented barriers for low-profit entrepreneurs, showing evidence of a poverty trap for poorly educated women in domestic work (Gebreeyesus, 2009; Grimm et al, 2012). Race-based differences were starker in groups above the median, indicating the a profit ceiling for black entrepreneurs (Lund and Skinner, 2005). These findings encourage programs which channel resources towards educating and empowering black and female entrepreneurs (Chen, 2012). Inequality can be further reduced through the solutions involving spatial development and access to start-up capital, since a higher proportion of black and female entrepreneurs were capital-constrained and located in peripheral areas.
An unforeseen finding was the negative association between the conduciveness of business environments and firm performance. Estimates are undoubtedly influenced by the construction of indicators, nonetheless, the consistency with which this trend was shown indicates a behavioural pattern of entrepreneurs which is worth exploring further. An anticipation effect is speculated, whereby owners who perceive themselves at risk of fluctuations in supply and demand, or of confiscation and eviction, create a buffer through alternative business strategies which serves to stabilise and increase profits. An imperative of future research is to unravel the mechanisms behind observed relationships so that policy can provide the right incentives for growth.
In conclusion, this thesis argues that not only is a separate framework required to eliminate obstacles to growth which are unique to the informal sector, but that such a framework must be flexible and tailored to suit the varying needs of firms. These conclusions are useful in building new composite theories which better explain the informal economy.
Despite the progress in knowledge made through this analysis, the data-handling process exposed certain restrictions which limit the extent to which the research question can be addressed. Regarding sample composition, certain strata including the manufacturing sector and peripheral municipalities (particularly Randfontein and Emfuleni) were fairly small in comparison to the calculations of previous studies (Peberdy, 2015; Peberdy, 2018), while the number of migrants and growth-oriented entrepreneurs was relatively large. This has two impacts. First, misrepresentation of the target population reduces the external validity of results. It is advised to repeat the analysis using a similar methodology with alternative samples to increase reliability (the upcoming third 2017/18 Quality of Life Survey from the GCRO presents a prime opportunity for this) and in other contexts to allow valid extrapolation. Second, small subsamples inhibit more complex estimation techniques, particularly multilevel modelling (Gelman and Hill, 2006), which are better suited to the hierarchical structure of the data and capture within-group correlations. More developed sampling designs, such as multi-stage stratification, would enable these methods by ensuring the necessary data composition, and permit further spatial and sectoral disaggregated regressions for more thorough conclusions.
The other set of econometric techniques which would improve the validity of conclusions involve the collection of panel data. Estimating changes in firm performance would account for unobservable factors regarding owner personality (Baum et al, 2001), as well as fluctuations in the external environment and time lags in the impact of investments or strategic decisions on profits or of local policy changes on behaviour. Longitudinal data involving follow-up surveys should therefore be a priority of future research.
38
Researchers should also seek to increase the granularity of data. For instance, the breakdown into just three sectors is overly broad given the diversity of the informal sector. In light of regional economic plans which highlight specific industries for development in the coming decade (Seedat, 2015), it would be useful to examine informal activities in more detail to compare these “strategic growth industries” with the skills and resources of informal entrepreneurs. This would identify complementarities to ascertain where production could be shifted or where training is needed. More granular data would also improve the reliability of indicators available to capture concepts from the literature, since the current regressions relied on subjective scores to measure environmental quality as well as proxy variables for firm innovation and strategy.
A final improvement could be made using instrumental variable techniques to overcome endogeneity. Despite showing high significance throughout regressions, rent was excluded from discussion due to the likelihood of a reverse or spurious relationship. Various initiatives have been proposed in policy documents (SERI, 2018) to allow informal traders legal access to affordable operating premises in desirable locations in the GCR. Although results support this proposal, corroborating it based on the current study would be misleading.
In light of these recommendations, a few issues remain. The first regards the allocation of responsibility in terms of initiating and implementing solutions and translating debate into action. The results of this study suggest a multi-faceted role for government in informal sector development. First, as a coordinator of interaction between stakeholders, including informal businesses, formal suppliers, banks and private investors. Various forums have been created to stimulate dialogue and collaboration between local government, NGOs (such as SERI, SALGA and WIEGO) and informal trade unions (SERI, 2018). These require nurturing and coordination on a wider scale. Second, as a regulator of informal markets, for example, by capping the number of firms in a given location, allocating spaces for informal trade, regulating credit markets and enforcing accountability for non-compliance with policies. Third, as a re-distributor of wealth and opportunity, targeting specific groups for service provision and subsidies. Frameworks must explicitly state the responsibilities of local, regional and national government in terms of finance and delivery so that they cannot be passed on or misinterpreted.
The other issue surrounds the identification of subgroups. Given the lack of documentation in the informal sector, it becomes difficult to tailor incentives to meet the needs of individual firms. From an evaluation perspective, better accounting would help to measure the impact of policies on the distribution of profits, as well as changes in the type and location of informal activities and formal sector linkages. Greater overall knowledge of informal activity would help to support the growing number of individuals within the economy and increase the extent to which informality can be steered through planning and policy to meet its potential for regional development.
39
Bibliography Adriaenssens and Hendrickx (2015) Can informal economic activities be explained by social and institutional factors? A comparative analysis. Socio-Economic Review, 13(4), pp. 627-649. Brussels: Oxford.
Ashman, S. and Newman, S. (2018) The Evolution of Manufacturing in the Gauteng City Region: from De-Industrialisation to Re-Industrialisation? In Cheruiyot, K. (2018) The Changing Space Economy of City Regions: the Gauteng city-region, South Africa. Johannesburg: Springer International Publishing. Becker, K. (2004) The Informal Economy: Fact Finding Study. Department for Infrastructure and Economic Co-operation. New York: SIDA. Berner, E., Gomez, G. and Knorringa, P. (2008) Helping a large number of people become a little less poor: The logic of survival entrepreneurs. Working Paper. Helsinki: UNU-WIDER.
Boston, T. and Boston, L. (2007) Secrets of Gazelles: The Differences between High-Growth and Low-Growth Businesses owned by African American Entrpreneurs. The Annals of the American Academy, 613, pp. 108-130.
Buchinsky, M. (1998) Recent Advances in Quantile Regression Models: A Practical Guideline for Empirical Research. The Journal of Human Resources, 33(1), pp. 88-126.
Burdett (2006) Johannesburg: challenges of inclusion? Urban Age. London: LSE.
Charmes, J. (2012) The Informal Economy Worldwide: Trends and Characteristics. The Journal of Applied Economic Research, 6(2), pp. 103-132. Los Angeles: SAGE.
Chen, M. (2007) Rethinking the Informal Economy: Linkages with the Formal Economy and the Formal Regulatory Environment. UN DESA Working Paper No. 46. New York: UN.
Chen, M.A. (2012) The Informal Economy: Definitions, Theories and Policies. WIEGO Working Paper No.1. Cambridge: WIEGO.
Cheruiyot, K. (2018) The Changing Space Economy of City Regions: the Gauteng city-region, South Africa. Johannesburg: Springer International.
Cichello and Rogan (2018) Informal sector employment and poverty in South Africa: identifying the contribution of ‘informal’ sources of income on aggregate poverty measures.
City of Johannesburg (2018) Economic Growth Strategy. Draft Document. Johannesburg: Johannesburg Municipal Government.
Coad, A. and Rao, R. (2008) Innovation and firm growth in high-tech sectors: A quantile regression approach. Research Policy, 37 (4). pp. 633-648.
Crush, J., Chikanda, A. and Skinner, C. (2015) Mean Streets: Migration, Xenophobia and Informality in South Africa. Cape Town: SAMP.
Daniels, L. (2001) A guide to measuring microenterprise profits and net worth. Small Enterprise Development 12(4), pp. 54-66.
40
Davies, R. and Thurlow, J. (2009) Formal–Informal Economy Linkages and Unemployment in South. Washington: HSRC.
De Mel, S., McKenzie, D. and Woodruff, C. (2009) Measuring microenterprise profits: Must we ask how the sausage is made? Journal of Development Economics, 88, pp.19-31. US: Elsevier B.V.
Devey, R., Skinner, C. and Valodia, I. (2006) Second Best? Trends and Linkages in the Informal Economy in South Africa. DPRU Working Paper No. 06/102. Cape Town: DRPU.
Djankov, S., Lieberman, I., Mukherjee, J. and Nenova, T. (2002) Going informal: Benefits and costs. Washington: World Bank.
Ferragut, S. and Gomez, G.M. (2013) ‘From the Stall to the Store’: The Formalization of Street Vendors in Quito, Ecuador. Local and Regional Development. Quito.
Garoma, B. F. (2012) Determinants of Microenterprise Success in the Urban Informal Sector of Addis Ababa: A Multidimensional Analysis. PhD Thesis. Netherlands: Erasmus University.
Gatune, J. (2015) Rethinking the Informal Economy: Promoting Poverty Reduction by Formalising Traditional Informal Activities through ICT Innovation. New York: World Economic Forum.
GCRO (2016) Gauteng City-Region Observatory Annual Report 2015/16. Johannesburg: GCRO.
Gelman, A. and Hill, J. (2006) Data Analysis Using Regression and Multilevel/Hierarchical Models. New York: Cambridge University Press.
Goedhuys, M. and Sleuwaegen, L. (2010) High-Growth Entrepreneurial Firms in Africa: A Quantile Regression Approach. Small Business Economics. Netherlands: Springer.
Grimm, M., Knorringa, P., and Lay, J. (2012) Constrained Gazelles: High Potentials in West Africa’s Informal Economy. World Bank Working Paper 77926. Netharlands: ISS
Hansen, K. and Vaa, M. (2004) Reconsidering Informality: Perspectives from Urban Africa. Stockholm: Nordiska Afrikainstitutet,
Hayter, S. and Lee, C. (2015) Industrial Relations in Emerging Economies: The Quest for Inclusive Development. Cheltenham: Edward Elgar Publishing.
Heintz, J. (2012) Informality, Inclusiveness, and Economic Growth: An Overview of Key Issues. SIG working paper. Massachusetts: Political Economy Research Institute.
Jutting and de Laiglesia (2009) Is Informal Normal? Towards More and Better Jobs in Developing Countries. OECD.
Kanbur, R. and Keen, M. (2015) Reducing Informality. Finance and Development, 52(1).
Kiecolt, and Nathan (1985) Secondary Analysis of Survey Data. California: SAGE.
41
Kraemer-Mbula, E. and Wunsch-Vincent, S. (2016) The Informal Economy in Developing Nations: Hidden Engine of Innovation? Cambridge: Cambridge University Press.
La Mantia, C. (2018) Humanizing Urbanism. On Embracing Informality and the Future of Johannesburg, in: Petrillo, A. and Bellaviti, P. (2018) Sustainable Urban Development and Globalization: New strategies for new challenges. Switzerland: Springer.
Lumpkin, G. and Dess, G. (1996) Clarifying the Entrepreneurial Orientation Construct and Linking it to Performance. The Academy of Management Review, 21(1), pp.135-172.
Lund, F. and Skinner, C. (2005) Creating a Positive Business Environment for the Informal Economy: Reflections from South Africa. Paper prepared for the International Donor Conference ‘Reforming the Business Environment’, Durban.
Margolis, D. (2014) By Choice and by Necessity: Entrepreneurship and Self-Employment in the Developing World. European Journey of Development Research, 26, pp.419-436.
Neuwirth, R. (2011) Stealth of Nations: The Global Rise of the Informal Economy. New York: Anchor Books. Peberdy, S., Crush, J. et al (2015) Calibrating informal cross-border trade in southern Africa in: the growing informal cities report. Southern African Migration Programme (SAMP). Migration Policy series no. 69, International Migration Research Centre. Cape Town: Bronwen Dachs Müller. Peberdy, S. (2015) GCRO Data Brief: No. 6. Informal sector enterprise and employment in Gauteng. Johannesburg: GCRO. Peberdy, S. (2016) International Migrants in Johannesburg’s Informal Economy. SAMP Migration Policy Series No. 71. Cape Town: SAMP. Peberdy, S. (2017) Competition or Co-operation? South African and Migrant Entrepreneurs in Johannesburg. SAMP Migration Policy Series no. 75. Cape Town: SAMP. Peberdy, S. (2018) Locating the Informal Sector in the Gauteng City-Region and Beyond in Cheruiyot, K. et al (2018) The Changing Space Economy of City Regions: the Gauteng city-region, South Africa. Johannesburg: Springer. Piscitelli, P. (2018) Mobile Urbanity in Southern Africa. The Socio-Spatial Practices of Informal Cross-Border Traders Between Johannesburg and Maputo, in Petrillo, A. and Bellaviti, P. (2018) Sustainable Urban Development and Globalization: New strategies for new challenges— with a focus on the Global South. Switzerland: Springer.
Reinecke, G. (2002) Small Enterprises, Big Challenges: A Literature Review on the Impact of the Policy Environment on the Creation and Improvement of Jobs within Small Enterprises. Geneva: International Labour Organisation.
Rogerson, C. (2015) Unpacking National Policy Towards the Urban Informal Economy in Crush, J., Chikanda, A. and Skinner, C. (2015) Mean Streets: Migration, Xenophobia and Informality in South Africa. Cape Town: SAMP.

42
Rogerson, C. (2016) South Africa’s informal economy: Reframing debates in national policy. Local Economy 2016, 31(2), p.172–186. Johannesburg: SAGE.
Seedat, R. (2015) Transformation, Modernisation and the Re-Industrialisation (TMR) of the Gauteng City-Region. Gauteng: Gauteng Provincial Government.
SERI (2018) Towards the Recommendations on the Regulation of Informal Trade at Local Government Level. Johannesburg: SERI.
Sihlongonyane, M. (2018) The Economic Drivers of Urban Change in the Gauteng City-Region: Past, Present and Future in Cheruiyot, K. et al (2018) The Changing Space Economy of City Regions: the Gauteng City-Region, South Africa. Johannesburg: Springer. Simone, A. (2004) People as Infrastructure: Intersecting Fragments in Johannesburg. Public Culture 16(3), pp.407–429. Duke University Press.
Sparks, D. and Barnett, S. (2010) “The Informal Sector In Sub-Saharan Africa: Out Of The Shadows To Foster Sustainable Employment And Equity?” International Business & Economics Research Journal 9(5) pp.1-11.
Thomas, S., and Heck, R. (2001) Analysis of large-scale secondary data in higher education research: Potential perils associated with complex sampling designs. Research in Higher Education, 42, pp. 517-540.
Van Thiel, S. (2014) Research Methods in Public Administration and Public Management, an introduction. London: Routledge.
Vom Hofe, R. and Cheruiyot, K. (2018) Importance of Industrial Cluster and Inter-Industry Linkages for Regional Policy in the Gauteng City-Region. In Cheruiyot, K. (2018) The Changing Space Economy of City Regions: the Gauteng city-region, South Africa. Johannesburg: Springer International Publishing.
Williams, C. (2006) The Hidden Enterprise Culture: Entrepreneurship in the Underground Economy. Cheltenham: Edward Elgar Publishing Limited.
Williams, C. and Horodnic, I. (2016) Cross-country variations in the participation of small businesses in the informal economy: An institutional asymmetry explanation. Journal of Small Business and Enterprise Development, 23(1), pp.3-24.

43
Annex 1: Table of Operationalisation
Concept Variable Indicator Type Label Unit +/-
Success (DV) Profits Av. Monthly Net Profit Continuous profit ZAR
Firm Size (DV) Employment No. employees + 1 Continuous Firm_size
Owner Characteristics
Demographic Gender Female vs. Male Binary Female 0-1 -
Age of owner - Ratio Age_ent years ?
Race Black vs. Non-black Binary Black 0-1 -
Nationality Migrant vs. South African Binary Migrant 0-1 ?
Socioeconomic Education
Highest Level Completed
(baseline: no formal schooling)
Ordinal Educ_ent +
Motivation for starting business
Survivalist (baseline) vs.
Growth-Oriented Binary Growth_oriented 0-1 +
Firm Characteristics
Sector
Trade and retail (baseline),
Manufacturing, Services
Nominal Sector +/?
Strategy Specialised Specialised vs. Diversified Nominal Specialised 0-1 ?
Lone venture Lone (baseline) vs. Joint Venture Binary Lone_venture 0-1 ?
Mobility Premise type
Permanent (baseline), Temporary,
Mobile or Home-based
Nominal premise ?
Ownership Tenure status Own (baseline), Rent or Free Nominal tenure
Rent Rental value of premise Continuous Log_rent ZAR -
Initial value Start-up capital Ordinal Startup_cap ZAR +
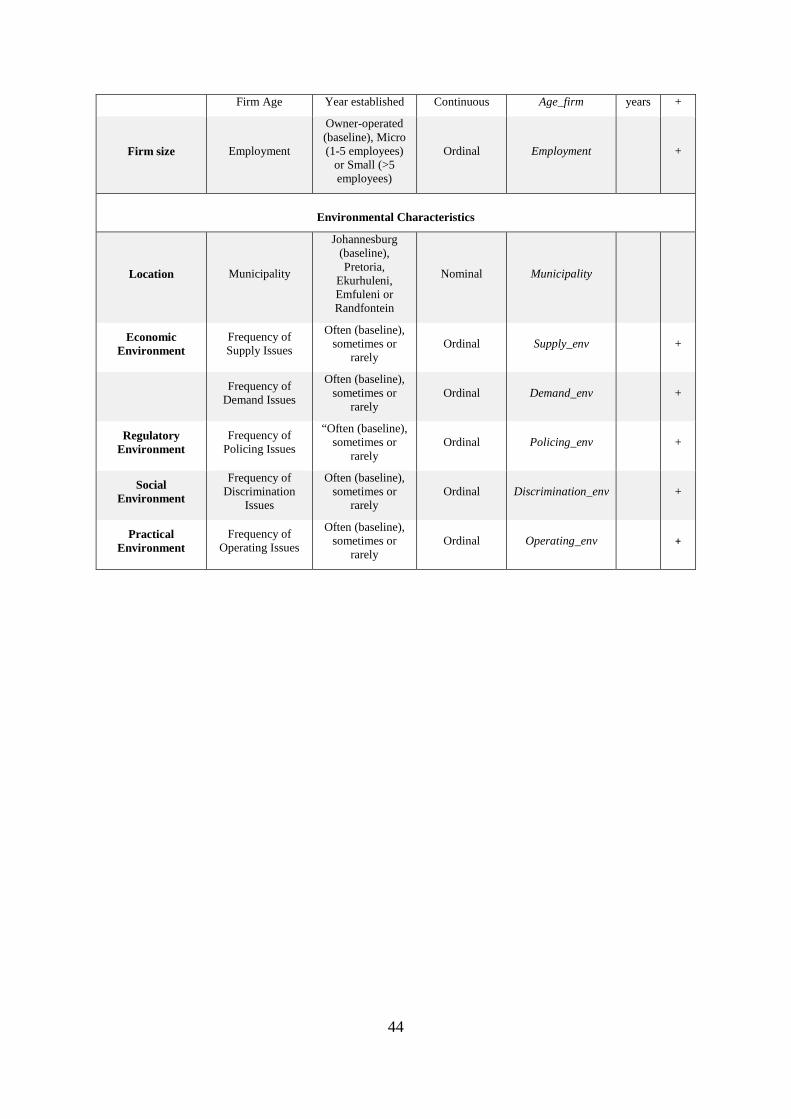
44
Firm Age Year established Continuous Age_firm years +
Firm size Employment
Owner-operated (baseline), Micro (1-5 employees)
or Small (>5 employees)
Ordinal Employment +
Environmental Characteristics
Location Municipality
Johannesburg (baseline), Pretoria,
Ekurhuleni, Emfuleni or Randfontein
Nominal Municipality
Economic Environment
Frequency of Supply Issues
Often (baseline), sometimes or
rarely Ordinal Supply_env +
Frequency of Demand Issues
Often (baseline), sometimes or
rarely Ordinal Demand_env +
Regulatory Environment
Frequency of Policing Issues
“Often (baseline), sometimes or
rarely Ordinal Policing_env +
Social Environment
Frequency of Discrimination
Issues
Often (baseline), sometimes or
rarely Ordinal Discrimination_env +
Practical Environment
Frequency of Operating Issues
Often (baseline), sometimes or
rarely Ordinal Operating_env +
45
Annex 2: Data cleaning and indicator derivation process First, the survey was filtered to select the variables of interest. Non-responses were converted to missing values in order to exclude them from regressions and string data were encoded to numeric values to be read by STATA. Clear data errors, for example, responses outside the specified Likert scale, were treated as missing to prevent their influence on regression coefficients.
Some variables were already in the desired format, for example, binary variables for nationality and gender, and nominal categories for municipality and sector, and therefore did not require manipulation. Others were collapsed into fewer categories, mostly due to a need for sufficient subsample sizes (in the case of non-black, tertiary education and start-up capital), or in line with definitions in the literature (in the case of micro versus small enterprise, premise type and tenure status). This was often more appropriate for interpretation, in that a comparison between micro and small enterprise means more than a comparison between 3 and 4 employees.
The binary variable for specialised versus diversified was created using the information on goods and services sold. If a respondent answered more than one type of product, they were labelled as diversified. This is perhaps a narrow definition because the effect on profits arguably depends on the areas in which firms diversify, for example, in complementary or substitutable industries. However, to prevent overcomplicating analysis, this method was deemed sufficient in capturing the desired concept.
Three variables were winsorised to eliminate bias from outliers in the upper tails without losing the information provided by these firms, that is, they are still large but not the point of distortion. The top ten observations for age of owner and age of firm were capped at the next highest value, reducing the oldest owner from 72 to 58 years and the oldest firm from 35 to 24 years. This effectively removes respondents who are past retirement age and firms who have long-term market dominance. The top ten profit-making firms were also capped, reducing the highest earner from ZAR 100,000 to 45,000 per month. Winsorised profits are of course only used in OLS regressions, while for Quantile Regressions, the full range is incoporated. Log transformations were taken for profit as well as rent (both continuous variables) to normalise their distributions.
For the motivation and environmental variables, composite indicators were created using multiple survey items. Questions reflecting survivalist and growth-oriented reasons for starting the informal business were grouped in line with the table from Peberdy (2017, pp. 21). The mean score for each group was calculated for every respondent; entrepreneurs were then classified as survivalist or growth-oriented depending on the highest mean score. The few observations with equal means were counted as missing. The motivation “had a job but didn’t pay enough” was removed because over 50% of the sample were unemployed prior to this job, so answering “not important” is misleading and reduces survivalist scores. Notably, high average values were often observed for both by the same owner. This blurriness in distinction may explain the insignificance of motivation in regressions. A similar process was undertaken to capture supply, demand, policing, operational and discrimination issues, with three or four items feeding each indicator. The row total was taken instead of the mean, then scores were normalised to mimic the original scale of 1-3 (often, sometimes and rarely).
Lastly, some items were treated which were not included in regressions but were useful for descriptive analysis. For multiple choice questions, such as sources of supplies or start-up capital, the total frequency was calculated for every answer and then normalised to 100%. This effectively treats each second answer as a new observation.

46
Annex 3: Output for alternative dependent variable

47
Annex 3: IHS copyright form In order to allow the IHS Research Committee to select and publish the best UMD theses, participants need to sign and hand in this copy right form to the course bureau together with their final thesis.
Criteria for publishing:
A summary of 300 to 500 words should be included in the thesis.
The number of pages for the thesis is about 60.
The thesis should be edited.
Please be aware of the length restrictions of the thesis. The Research Committee may choose not to publish very long and badly written theses.
By signing this form you are indicating that you are the sole author(s) of the work and that you have the right to transfer copyright to IHS, except for items cited or quoted in your work that are clearly indicated.
I grant IHS, or its successors, all copyrights to the work listed above, so that IHS may publish the work in The IHS thesis series, on the IHS web site, in an electronic publication or in any other medium.
IHS is granted the right to approve reprinting.
The author(s) retain the rights to create derivative works and to distribute the work cited above within the institution that employs the author.
Please note that IHS copyrighted material from The IHS thesis series may be reproduced, up to ten copies for educational (excluding course packs purchased by students), non-commercial purposes, providing full acknowledgements and a copyright notice appear on all reproductions.
Thank you for your contribution to IHS.
Date : ______________________________________
Your Name(s) : ______________________________________
Your Signature(s) : ______________________________________
Please direct this form and all questions regarding this form or IHS copyright policy to:
The Chairman, IHS Research Committee Burg. Oudlaan 50, T-Building 14th floor, 3062 PA Rotterdam, The Netherlands
[email protected] Tel. +31 10 4089851


![MSc. Botany Programme [CSS]](https://static.fdocuments.net/doc/165x107/586cb5051a28ab070b8b521b/msc-botany-programme-css.jpg)

