
MSc Programme in Urban Management and Development · cultural background from Dutch and Non-Dutch...
103
MSc Programme in Urban Management and Development Rotterdam, The Netherlands September 2015 Thesis Title: Happy Amenities: The Influence of Proximity to Urban Amenities on the Happiness Levels of Residents in Rotterdam Name : Nur Sabrina Akmala Putri Supervisor : Dr. Ir.Ronald Wall Co- Supervisor : Dr. Spyridon Stravropoalos Specialization: Urban Competitiveness and Resilience (UCR) UMD 11
Transcript of MSc Programme in Urban Management and Development · cultural background from Dutch and Non-Dutch...

MSc Programme in Urban Management and Development
Rotterdam, The Netherlands
September 2015
Thesis
Title: Happy Amenities: The Influence of Proximity to Urban Amenities on the Happiness Levels of Residents in Rotterdam
Name : Nur Sabrina Akmala Putri
Supervisor : Dr. Ir.Ronald Wall
Co- Supervisor : Dr. Spyridon Stravropoalos
Specialization: Urban Competitiveness and Resilience (UCR)
UMD 11

MASTER’S PROGRAMME IN URBAN MANAGEMENT AND DEVELOPMENT
(October 2014 – September 2015)
Thesis
Happy amenities: The influence of proximity to urban amenities on the happiness levels of residents
in Rotterdam
Nur Sabrina Akmala Putri Indonesia
Supervisor
Dr. Ir. Ronald Wall
Co-Supervisor
Dr. Spyridon Stavropoulos
UMD 11 Report Number: 791
Rotterdam, September 2015
ii

Summary
Happiness studies have become one of the most substantial of well-being studies. It attaches multi dimensional issues of individuals, social life, economics, physical aspects and also quality of life. In particular, certain urban built environmental characteristics have significantlyinfluenced the quality of life and happiness of people. Since most people live in urban environments, it is important to examine the interaction between urban amenities, people, and how it unfluences the attainment of happiness. The importance of urban amenities is largely related to accessibility within neighborhoods, people’s perceptions about the use of amenities, and their behavior in daily activities. A happy place can be achieved by creating accessible amenities nearby to support the ease of mobility and activity among neighborhoods. The aim of this research is to explain the relationship between proximity of urban amenities and happiness levels of residents in Rotterdam. It assigns the happiness levels as the dependent variables and proximity as the main independent variable. Proximity in this context means the physical distance between locations in an individual residential area to several urban amenities. To determine the degree of accessible proximity, this study particularly assigns an aspect of service amenities to each amenity location. Additionally, this research also identified weather any variance exists in the level of happiness among cultural diversity which is influenced by the proximity to urban amenities. It attached strongly socio-cultural background from Dutch and Non-Dutch group of residents in Rotterdam.
This study uses primary data from the “Rotterdam Leisure Survey”, which is conducted in 2009, and secondary data from “Rotterdam Smart City Planner 2012” and “Rotterdam Wijkprofiel 2012”. This type of research is exploratory quantitative in nature. A quantitative approach is introduced in this study and the methods involved analyses existing database by two analytical software Arc GIS and STATA. Arc GIS is used to calculate two kinds of measurement. First, straight forward “crow-flies” proximity using Near tool from one coordinate point of urban amenities to another coordinate postcode of individual living place. This measurement measures proximity from postcode centroid that represent spatial unit of residential area to the nearest location of amenities. Second, number of service amenities using Buffer-Count within spatial scale: 300, 600, 900, 1200 meters. Afterwards, all the measurements results were analyzed by STATA to test whether any significant relationship exists among those variables. To involve spatial dimension, this research attempted overlay models in final part of analysis with neighborhood scores as the ultimate results. In terms of research findings, the research suggests to some extent, proximity does influence happiness levels. However, it involves types of amenities as substantial aspects that determine the resident’s preferences. Service amenities as aspects of local amenities have negative impacts on happiness since their density indeed attracts discomfort, crowds and crime. Basic daily amenities such as Horeca, Daily Supply, and Vehicle Service were indicated as important to be available within local access. Also Recreational amenities appear to be substantially considered by Dutch people to be available in their surroundings. The findings suggest 200 up to 900 meters as a notable proximity to draw amenity designs with approximately 1 unit of Recreational and Vehicle Service amenities within 300 meters; and 60-80 unit Daily Supply and Other Service amenities within 900 meters within residential surroundings. Lastly, this research reveals there are different influences between Dutch and Non-Dutch residents. Non-Dutch do not show any significant relationship between proximity and their happiness levels in Rotterdam. Non-Dutch consider having jobs more important than other predictors.
iii

Keyword: happiness, urban amenities, proximity, service amenities, and cultural diversity.
Acknowledgements Praise to Lord of Majesty and Bounty, Allah SWT, for all the blessings to enable me to complete this Master’s course properly. I had great times with the entire academic process at IHS and finally managed to finish the thesis punctually. With Allah’s love and guidance, I was able to pass the all phases patiently and gratefully. In writing this thesis, it is also my duty to record my gratitude to Dr. Ronald Wall as my supervisor and Dr. Spryidon Straovopaolos as my co-supervisor from whom I got guidance, support, and valuable input in undertaking this thesis. Deep acknowledgment is given to Monserrat Budding-Polo, and MSc for her assistance in managing UCR specialization. Thank you for always giving positive energy to us. The UCR lecturers are great and remarkably qualified. I am very pleased to have been part of the UCR class. It also important to express credit and deep gratitude to Roland van der Heijden and Chris de Vries from Gementee Rotterdam (Rotterdam Municipality) who allowed the access to a quite important Rotterdam data source: the Rotterdam Leisure Survey and Rotterdam Gebiedsprofiel. With these data, I was able to generate valuable findings from this research that I expect would be beneficial to improve Rotterdam’s urban planning in the future. Also, I feel a deep sense of gratitude to my mother, who has lent me her support from a great distance, miles away in Indonesia, with her prayers and wishes every day. Special thanks to my husband , Iqbal Putut Ash Shidiq, who flew from Kuala Lumpur to Rotterdam to give me full support and assistance in doing the thesis, mentally and practically. Thank you so much for being my discussion partner. There has been lots of positive energy given that has encouraged me to work harder to undertake both this Master’s course and the thesis project. I sincerely thank my housemates, the De Greaffstraat family, who have shared with me both wonderful and hard times. To all IHS colleages, IHS staff and the 11 UMD students, it has been a pleasure to study and work with all of you. Special gratitude to Fitri Novitasari, Maulita Dwiasti, Christina Thanner, Kurniawan Priambada, Kjersti Grut, Ricardo Dasa, Ayin Rivera, and all UCR classmates. Thank you for all the great times together.
iv

Table of Contents
Summary ................................................................................................................................. 28
List of Tables .......................................................................................................................... 28
List of Figures ......................................................................................................................... 28
Chapter 1: Introduction .......................................................................................................... 1 1.1 Background ........................................................................................................................ 1 1.2 Problem Statement .............................................................................................................. 3 1.3 Research Objective ............................................................................................................. 4 1.4 Research Questions ............................................................................................................. 4 1.5 Significance of Study .......................................................................................................... 4 1.6 Scoop and Limitation .......................................................................................................... 5
Chapter 2: Literature review .................................................................................................. 6 2.1 Happiness Concepts ......................................................................................................... 6 2.2 Happiness and Quality of Life ............................................................................................. 8 2.3 Urban Amenities ........................................................................................................... 11 2.4 Spatial Accessibility ........................................................................................................ 13 2.5 Urban Diversity ............................................................................................................... 17 2.6 Lesson Learned.............................................................................................................. 18 2.7 Conceptual Framework .................................................................................................... 19
Chapter 3: Research Design and Methods .......................................................................... 22 3.1 Research Strategy and Approach ....................................................................................... 22 3.2 Operationalization ............................................................................................................ 22 3.3 Data Collection Method ................................................................................................ 25 3.4 Sample and Selection ....................................................................................................... 25 3.5 Unit Analysis ................................................................................................................... 26 3.6 Data Analysis .................................................................................................................. 26 3.7 Validity and Realibility .................................................................................................... 28
Chapter 4:Research Findings and Analysis ........................................................................ 31 4.1 Descriptive Analysis ..................................................................................................... 31 4.2 Happiness and Proximity............................................................................................... 39 4.3 Happiness and Service Amenities ................................................................................ 45 4.4 Overlay Happiness and Amenities ................................................................................ 54
Chapter 5: Conclusions and Recomendations .................................................................... 59 5.1 Conclucions ................................................................................................................... 59 5.2 Recomendations ............................................................................................................ 63
Bibliography ........................................................................................................................... 65 Annex 1 Table of Happiness Level per Neighborhood in Rotterdam ..................................... 73 Annex 2 Map of Proximity to the Clothing & Fashion Amenities .......................................... 75 Annex 3 Map of Proximity to the Computer & Electronics Amenities ................................... 76 Annex 4 Map of Proximity to the Horeca Amenities .............................................................. 77 Annex 5 Map of Proximity to the Recreational Amenities...................................................... 78 Annex 6 Map of Recreational Amenities within 300 Meters .................................................. 79 Annex 7 Map of Vehicle Service Amenities within 300 Meters ............................................. 80
v

Annex 8 Map of Financial Amenities within 600 Meters........................................................ 81 Annex 9 Map of Other Amenities within 600 Meters ............................................................. 82 Annex 10 Map of Cultural Amenities within 900 Meters ....................................................... 83 Annex 11 Map of Daily Supply Amenities within 900 Meters ............................................... 84 Annex 12 Map of Other Service Amenities within 900 Meters .............................................. 85 Annex 13 Map of Cultural Amenities within 1200 Meters ..................................................... 86 Annex 14 Map of Daily Supply Amenities within 1200 Meters ............................................. 87 Annex 15 Map of Other Service Amenities within 1200 Meters ............................................ 88 Annex 16 Map of Residents Age Distribution ........................................................................ 89 Annex 17 Map of Residents Gender Distribution ................................................................... 90 Annex 18 Map of Residents Ethnicity Distribution ................................................................. 91 Annex 19 Map of Residents Paid Job Status Distribution ....................................................... 92 Annex 20 Map of Residents Income Distribution ................................................................... 93 Annex 21 Map of Residents Household Composition Distribution ........................................ 94 Annex 22 Map of Crime Rate Distribution.............................................................................. 95 Annex 23 Table of Questionnaire Rotterdam Leisure Survey ................................................. 96
vi

List of Tables
Table 2.1 Four Qualities of Life ................................................................................................ 8 Table 2.2 Example of indicators can be used to investigate Quality of Urban Life ............... 10 Table 3.1 Operationalization .................................................................................................... 23 Table 3.2 Types of Amenities .................................................................................................. 24 Table 4.1 Summary Statistic of Dependent and Control Variables ......................................... 31 Table 4.2 Division and Amount of Amenities ........................................................................ 33 Table 4.3 Sub division and amount of Amenities .................................................................... 34 Table 4.4 Summary Statistic of: Proximity to the nearest point of amenities ........................ 35 Table 4.5 Summary Statistic of: Number of Amenities within spatial scale (Service
Amenities) ............................................................................................................... 38 Table 4.6 Regression model of: Happiness and Proximity to nearest point of amenities ....... 40 Table 4.7 Regression Model Happiness and Number of amenities within spatial scale ........ 48 Table 4.8 Satisfaction Degree of residents with their surroundings (Overlay Result) ............ 55 Table 4.9 Satisfaction Degree by neighborhood (Overlay Result) .......................................... 56
List of Figures
Figure 1.1 Happiness Priority Topic in OECD Countries ......................................................... 2 Figure 1.2 Happiness In Dutch Cities ........................................................................................ 3 Figure 2.1 Model showing Relationship between domain satisfaction and life satisfaction ..... 9 Figure 2.2 Dimension of Spatial Accessbility Studies............................................................. 16 Figure 2.3 Conceptual Framework .......................................................................................... 21 Figure 3.1 Analytical Framework ............................................................................................ 30 Figure 4.1 Map of Happiness Level of Residents in Rotterdam .............................................. 32 Figure 4.2 Diagram Scatter of Happiness and Proximity ........................................................ 36 Figure 4.3 Map of Proximity to the Nearest Amenities ........................................................... 44 Figure 4.4 Map of Number of Amenities within 300 meter .................................................... 50 Figure 4.5 Map of Number of Amenities within 600 meter .................................................... 51 Figure 4.6 Map of Number of Amenities within 900 meter .................................................... 52 Figure 4.7 Map of Number of Amenities within 1200 meter .................................................. 53 Figure 4.8 Map of Overlay Happiness and Amenities ............................................................. 58
vii

CHAPTER 1: INTRODUCTION
The introductory chapter generally introduces the main topic and discussion problem about this research. The background of the study describes the development of the global discussion on the happiness issue. It also defines some findings upon aspects involved in happiness studies. Furthermore, this chapter precisely explains the conditions of urban living in Rotterdam in terms of urban amenities. It elaborates the importance of urban amenities and the aspect of accessible proximity in determining what makes a happy places This chapter states the problem; research questions; and puts forward the research objectives toward urban amenities and happiness. Lastly, the significance of the study addresses the contribution for academic debates and policy recommendations, along with some constraints which considerably limit this study under particular conditions.
1.1 Background
The discussion of happiness issues has come considerably to the fore in recent years. There are various ideas regarding happiness which can be measured in greater number and linked to several aspects of life. Happiness itself is interchangeably well-known as subjective well-being or quality of life or life satisfaction. These phrases have been prolifically discussed from the perspectives of sociology, psychology, and economics as well as applied to public policy.
Happiness is famously introduced by the book “Geography of Bliss” from Eric Weiner (2009), which reveals the condition of happiness across nations. It is not an outrageous surprise that countries in Europe are the happiest countries and how Copenhagen is the happiest city in the world. It logically relates to the facts that most of European countries are well developed in infrastructures, human capital and economic competitiveness. However, surprisingly, Bhutan comes out as one of the happiest countries in the world, regarding the low expectation of the people and strong attachment between humans and nature. Bhutan considers happiness to be one of the most important aspects by including it in their national development plan. Therefore, related to this paradox, some questions ask what precisely makes people happy? And how do the various aspects of life influence happiness in individuals and society?
The study of the happiness issue has come up with several findings in various fields. The most popular studied indicators are personal income and wealth. Other researchers try to find the relationship between individual and national levels (Frey and Stutzer, 2002; Deaton, 2008). Another factor quite often studied is health. The notion explains whether healthy people are happy or whether happy people tend to be healthier, and hence considered more productive. Moreover, employment appears significant in promoting happiness at both personal and community levels. Employment favorably relates to job satisfaction and life satisfaction, which explains that being unemployed decreases chances of satisfaction with life as a whole (Erdogan et al, 2011; Mulligan and Carruthers (2011) and Ballas, 2011). In accordance with these factors, some studies also discuss relationships among other aspects such as democracy, social freedom, good governance (Frey and Stutzer, 2002; Veenhoven, 2000) and the built-up environment, which intentionally influence happiness to some extent (Hoehn, Berger, and Blomquist, 1987; Marrans and Stimson, 2011). Various results depend on where the study took place and how those indicators are translated into analysis.
The relationship between built-up environment and happiness has tended to spark more interesting discussions recently. It involves economics, geography, and social aspects which apply to certain levels of city, neighborhoods, and communites. Therefore, a common
1

question is raised which factors more importantly; happy place or happy people? A happy place is directed to geographical and physical dimensions, whereas happy people are related more to -favourable community, friendly neighborhood and competitive city. It is obvious that the part amenities play in a happy place contributes to the improvement of well-being in some segments of society. These amenities consist of natural amenities, like rivers, lakes, and green areas, and urban amenities defined as man-made amenities (housing, parks, bicycle paths, walking trails, and golf courses), and cultural resources (cinemas, concert halls, museums, galleries, and sport centers). Since most people live in urban environments, and especially in the large urban environments that we call cities or metropolitan areas, interaction between those amenities, the people, and achievement of happiness is interesting to explore.
In the case of Rotterdam, the Netherlands, the city is host to a paradoxical phenomenon regarding its urban living conditions. In Rotterdam, diversity is clearly an important characteristic. Rotterdam is the largest port city in both the Netherlands and Europe which has connected major trades and also human capital for more than a century. Rotterdam also hosts the highest number of different nationalities, over 175 nationalities, with a total population reaching over 610,000. The landscape of diversity is captured by the view of several Kebab food stalls, Asian grocery shops, Surinamese restaurants and other ethnic café and restaurants. This cultural diversity apparently generates new types of product and consumer amenities, which are enjoyed by almost all residents. On the other hand, Rotterdam does not fare so well when it comes to subjective well-being level. Among other cities, Rotterdam is denoted as the least happy city in the Netherlands (Veenhoven, 2012). Rotterdam is at the bottom of the list for the safety and social domain, or in other words, is known as the city with “at the top of the wrong lists”. The levels of income and education are below the national standards, likewise of safety and social life, the crime rate and school school dropouts are above the national level. Such aspects contribute to attaining happiness, but investigating a particular issue related to urban amenities is notably interesting ed. It leads to capturing the real picture of the quality of the urban living environment, which is substantially affected by people’s daily activities in Rotterdam.
Figure 1.1. Happiness Priority Topic in OECD Countries
Source: World Database of Happiness EHERO, 2014
2

1.2 Problem Statement.
Urban amenities are generally accepted as being important to a household’s sense of place. Amenities influence where households and firms choose to locate within and around the city. Amenities have the potential to transform particular areas into more attractive ones and hence shape people’s perception of their quality of life. The importance of urban amenities is related to their accessibility within the neighborhood, people’s perceptions about the use of amenities, and their behavior during daily activities. A happy place can be achieved by creating accessible amenities nearby to support the ease of mobility and activity in and amongst neighborhoods (Montgomery, 2014). Furthermore, urban amenities play an important role in accommodating social interaction among people. Jacobs (1961) urges about how city with mixed use design (combination of housing and office with shops, parks, and civic buildings) together with prosperous active sidewalk life will lead to more positive personal well-being of residents. Therefore, the relationship between urban amenities and happiness in greater amount is quite obviously in need of exploration. To be more precise, issues of accessibility to urban amenities are in need of substantial discussion. It has, moreover, been a central focus in much geographical research. While past studies have varied in context, methodological approach and the amenity of interest, a common task has been to address the spatial accessibility within the urban environment (Knox 1978; Pacione 1989; Truelove 1993; Talen 1997). However, methods to calculate accessibility are varied amongst studies. Talen and Anselin, (1998) show different accessibility measurements create differing spatial accessibility patterns. The most common indicator to measure the accessibility is physical distance or proximity. It relates to direct calculation of how easy an individual reaches the amenities under certain standard conditions. This ease substantially addresses how people perceive their quality of life by considering their proximity to urban amenities (Marrans and Stimson, 2011).
Figure 1.2. Happiness in Dutch Cities (%)
Source: Veenhoven, 2014
3

Investigating the factors which determine happiness involves a considerable number of aspects. However, this study particularly focuses on urban the amenities issue, which obviously impacts the assigning of urban daily activities. Proximity to urban amenities was expected to have substantial influence on residents’ living conditions. It specifically attached the issues of the degree of accessibility and closeness to their living place. Moreover, several kinds of urban amenities were counted important to be located near residential neighborhoods while certain others were considered adequately available on a larger scale. It all depends on populationneeds and community demands, which are affected by the socio-cultural background of residents in Rotterdam. In brief, the variance of happiness was expected to differ on account of the diverse living conditions shaped by the different levels of proximity to urban amenities. 1.3 Research Objective
The aim of this research is to explain the relationship between proximity of urban amenities and happiness levels of residents in Rotterdam. Proximity itself is important for measuring spatial accessibility. However, this study mainly focuses on proximity of amenities to living place, in order to limit other accessibility factors influencing the relationship. Proximity in this context means a physical distance between an individual living place to several urban amenities. To determine degrees of accessible proximity, this study particularly assigns the supposed locations of service amenities. Additionally, this research also identifies weather any variance exists in the levels of happiness amongs the cultural diversity influenced by the proximity to urban amenities. It attaches strong significance to the socio-cultural backgrounds of Dutch and Non-Dutch groups of residents in Rotterdam.
1.4 Research Question
Main Research Question
To what extents does proximity of urban amenities to individual living places influence the happiness of residents in Rotterdam?
Sub Research Question
1. How do the service amenities of amenities affect the happiness of residents in Rotterdam?
2. Does cultural diversity have an effect on influencing relationship of proximity to amenities and the happiness of residents in Rotterdam?
1.5 Significance of Study
The relevance of this study is justified in terms of to an academic debate and policy recommendations on the study of the happiness issue and the city of Rotterdam. For academic purposes, firstly, this research offers new insights into convincing factors influencing the happiness of the people in urban areas. The research tries to capture possible aspects which may impact directly or indirectly on the improvement of subjective well-being, particularly from the perspective of urban amenities. In addition, this study offers a combination of analysis methods. These methods are geographical and statistical analysis specifically using Arc GIS and STATA programs. It is expected to be further applicable to
4

more researchers to conduct other different topics of study. Thirdly, this study substantially contributes to introducing other approaches for urban planning tools by adding happiness as one of the urban development goals. For practical purposes this study is fundamental in its potential contribution to policy for the city of Rotterdam. It is a call for urban policies to focus on what type of urban planning and urban management is able to support the improvement of subjective well being. In the case of Rotterdam, the aspect of proximity to urban amenities is important when considering design policy. Particularly, this study is expected to define the degree of proximity which significantly influences the happiness of residents in Rotterdam. Thus, local government can refer to this finding for an appropriate policy specifically related to the spatial distribution of urban amenities. Furthermore, the variance in happiness levels among resident groups leads to the utility of more specific amenities. Finally, the approach presented in this thesis could be replicated throughout the cities in the Netherlands, the EU, or in other cities which hold eminent cultural diversity in their policy design. It may focus on improving subjective-well being by implementation in designing appropriate happy places with urban amenities within neighborhoods. 1.6 Scope of Limitation
The scope of this study mainly focuses on the city of Rotterdam. The analysis explores the relationship between proximity through a local (neighborhood) and a city scale. In order to avoid distortion and to achieve more reliable and generalized results, a large sample of residents was analysed – 4422 residents from 90 neighborhoods using the Rotterdam Leisure Survey taken in 2009. The proximity measurement revealed a minimum distance from an individual level unit to the closest urban amenities. However due to confidentiality issues, measurement could only be taken from blocks or postcode units of individual addresses to the nearest urban amenities. Other limitations concern the method chosen to measure exact proximity. There is some discussion of what type of measurement methods are appropriate to measure distance while decreasing the chance of aggregation error. This study mainly used the method of straightforward line crow flies measurement to avoid overcomplicated analysis. This method did not involve network street analysis or buffer service amenities, which usually require advanced ability in operating Arc GIS software. A further limitation was time difference. The happiness survey was taken in 2009, which might point to possible changes in the personal life conditions of respondents. This study did not have the wherewithal to carry out new surveys with similar respondents to update the results of over 6 years ago. In addition, there are also possible changes in the number of urban amenities in cities and neighborhoods which lead to bias in spatial analysis. Thus, this study encompasses several assumptions to avoid substantial gaps between happiness and urban amenity conditions within the time difference. It is expected that statistical regression analysis reveals reliable and valid results despite those limitations. Another considerable limitation is the Arc GIS tool, used to measure proximity. This selected method might have caused different results and interpretations or even data error. This could technically be because the proximity measurement excluded some other substantial factors of amenities. For example, the availability of other close and frequently accessible amenities, popular or non popular amenities, variance of opening hours, or variance of price offers. Those factors inevitably influence the use and people’s satisfaction levels of the amenities. Different selected methods are proposed to attempt further research.
5

CHAPTER 2: LITERATURE REVIEW
This chapter seeks to introduce literature review from such studies discussing happiness and urban amenities. It is first necessary to define the concept of happiness and its relationship to various aspects of life. Such examples will be elaborated to enhance understanding through happiness or subjective well-being in terms of quality-of-life. This chapter also discusses aspects that relate to definitions of urban amenities as part of the quality of the urban living environment. Thus, the elaboration shows the relationship between urban amenities and improvement of quality of life. Furthermore, this chapter highlights reviews of measuring spatial accessibility of urban amenities by using proximity as dominant factor. In the last part, the conceptual framework integrates possible concepts and factors deemed to be variables of further analysis of this research. This approach will support the conclusions about the relationship between happiness and quality of urban amenities that may be applicable to the case of Rotterdam. 2.1. Happiness concepts What is happiness? Many people tend to believe that it is ultimately happiness that makes a life worth living. A happy life translates to a good life when the condition of somebody’s life is adequate and satisfying according to an accepted standard. However, not everyone thinks that happiness is the most important value that makes life worth living; there are other final values besides happiness, such as friendship, self-knowledge, human development, or meaningful work that may appear important and become an ultimate life goal. This alternative view has also been discussed in some previous research e.g. Lane (2000) and Varelius (2004). So the question arises: what exactly is the role of happiness in the good life, e.g. is it the only thing that has final value (is good as an end) for people, or are there other final values besides happiness?
Brulde (2007) has formally defined the notion of happiness as a good life (well-being, or quality of life) in terms of what has final value for a person. There are three important aspects of happiness as a final value. First is to claim that a certain life is good, or life has a high quality, and thus can be evaluated in a positive way. In this notion, the good life is a purely evaluative question. Second, the type of value that bears relevancy to certain purposes. In this context happiness is defined as value-for (or ‘‘prudential value’’). A further explanation is when someone has a good life, it does not necessarily mean the life is morally good, aesthetically good or good for others, but closer to prudentially good for him or her. And third, the relevant prudential values are final values rather than instrumental values. Not everything that makes a life good for a person belongs to quality of life as such. It is a notion of relativity. Earning lots of money may have great influence on happiness for some people but others may consider having a good relationship the ultimate factor for happiness. These three notions are more philosophical and attached to various other aspects including social and economic factors.
Happiness is a ‘‘big’’ concept and it has been used in different ways. In recent empirical studies people consistently make reference to some alternative terms such as ‘‘subjective well-being,’’ or quality of life, . Some social scientific studies have used terms such as ‘‘subjective well-being,’’ often claiming this makes what they are focusing on more precise and amenable to empirical measurement (Chekola, 2007). However, they generally indicate that subjective well-being is synonymous with or roughly synonymous with ‘‘happiness.’’
6

Diener (1994) titles his article ‘‘subjective well- being,’’ but often in the article uses ‘‘happiness’’ as a synonym.
Since happiness is a big concept, some research defines the elements of subjective and objective to explain theories of happiness. Brulde (2007) urges the difference between subjective and objective theories of happiness is a difference concerning prudential value rather than what objects have final value for a person. Subjective theories make well-being fully and directly dependent on how people evaluate, desire, likes and dislikes, tastes and interests. Objective theories reject this claim, and hold instead that ‘‘various things are objectively good for a person to have, whether people realize it or have a desire for it. Kagan (1992) said “being well-off is simply a matter of one’s having the various objective goods’’.
Happiness and four qualities of life Veenhoven (1984) defines the concept of overall happiness as the” degree to which an individual judges the overall quality of his/her own life-as-a-whole favorably”. In other words: how much one likes the life one leads. To support this explanation, he developed the concept of qualities of life in four overall segments to explain happiness.
First, livability of environment which is associated with the quality of society as a whole and also with the position one has in society. Ecologists see livability in the natural environment and describe it in terms of pollution, global warming and degradation of nature. Veenhoven urges livability is not what is called happiness here. It is rather a precondition for happiness and not all environmental conditions are equally conducive to happiness.
Second, life-ability of the person. Sen (1992) calls this quality of life variant 'capability' or 'life-ability', which contrasts elegantly with 'livability'. Ability to deal with the problems of life will mostly contribute to happiness as defined here, but is not alone. If one is competent in living one has a good chance at happiness, but this endowment does not guarantee an enjoyable outcome.
Third, utility of life. This notion urges that a good life must be good for something more than itself. When evaluating the external effects of a life, one can consider its functionality for the environment. In this context, doctors stress how essential a patient's life is to its intimates. At a higher level, quality of life is seen in contributions to society.
The last is subjective well being-life satisfaction. Dealing with conscious humans, people usually have their qualities shaped towards subjective enjoyment of life. This is commonly referred to by terms such as 'subjective wellbeing', 'life-satisfaction' and 'happiness' in a limited sense of the word. This is the kind of happiness the utilitarian philosophers had in mind and it is also the kind of happiness addressed here. In evaluating our life people typically summarize this rich experience in overall appraisals. For instance, the idea how people appreciate several domains of life. When asked how people feel about work or marriage they will mostly have an opinion. Likewise, most people form ideas about separate qualities of their life, for instance how challenging their life is and whether there is any meaning in it. Such judgments are made in different timeperspectives, in the past, the present and in the future.
7

Table 2.1. Four Qualities of Life
Outer Qualities Inner Qualities Life-Chances Livability of Environment Life-ability of a person Life-Result Utility of Life Satisfaction
Source: Veenhoven, 1984
Measuring happiness in greater number
Can happiness be measured? By definition, happiness is something we have on our mind and consequently we can measure happiness using questions. That is, simply asking people how much they enjoy their life-as-a-whole. Questions on happiness can be posed in various contexts; clinical interviews, life-review questionnaires and survey interviews. The questions can be posed in different ways; directly or indirectly, and by means of single or multiple items. Two major worldwide happiness data sources come from Gallup World Poll with the question “please imagine a ladder with steps numbered from zero at the bottom to 10 at the top. The top of the ladder represents the best possible life for you and the bottom of the ladder represents the worst possible life for you. On which step of the ladder would you say you personally feel you stand at this time?” Or world value survey “taking all together, how satisfied or dissatisfied are you with your life as a whole these days?” With scale 1-10. In another form, happiness can be addressed by more simple question “ How happy are you” with scale 1-4. (Veenhoven, 2007) Veenhoven (2009) urges since happiness is defined as subjective enjoyment of one’s life as-a-whole and it can be measured using self-reports. Recently happiness is rising on the political agenda and this calls for measures of how well nations perform in creating great happiness for a great number, analogous to measures of success in creating wealth, such as GDP. Questions on happiness are currently used in large scale surveys of the general populations of nations. As a result we have now comparable data on happiness in 95 contemporary nations and a time-series of 25 years and longer on 11 developed nations. These data can be aggregated in different ways: if the aim is simply greater happiness for a greater number of citizens, average happiness (AH) is an appropriate measure. If the focus is on enduring happiness, it is better to combine average happiness with longevity in an index of happy life years (HLY). If the aim is to reduce disparity among citizens a relevant indicator is the inequality of happiness (IH) in the nations as measured with standard deviations. Average and dispersion can also be combined in an index of inequality-adjusted happiness (IAH). 2.2. Happiness and Quality of Life
As mentioned before, Happiness is an interchangeably used term for quality-of-life. In some points, quality-of-life can be measured as the dominant portion degree of happiness. However, another theory shows a substantial distinction of quality-of-life as an independent concept but may have a significant effect on the happiness of the people. Mulligan et al., (2004) interpret quality-of-life as the satisfaction that a person receives from surrounding human and physical conditions, conditions that are scale-dependent and can affect the behavior of individual people, groups such as households and economic units such as firms. Investigating quality-of-life is important not only because it affects how people behave but also their life satisfaction and happiness. And it has broader implications for research and urban policy. Research of quality-of-life has affected broader fields such as underlie the demand for public action (Lu 1999), the liveability of cities for residents and provide a set of
8

metrices which allow policy makers and planners to assess the effectiveness of their efforts (Marans 2002), and implications for patterns of regional migration, regional economic growth, and environmental sustainability (Kemp et al. 1997).
Figure 2.1 Model showing the relationship between domain satisfactions and life satisfaction
(Source: Campbell et al. 1976a in Marrans and Stimson, 2011)
Marans and Rodgers (1975) and Campbell et al. (1976) in Marrans and Stimson (2011) propose a model of satisfaction with residential environments. The model readily incorporates a range of demographic, social, economic and environmental relationships, whiletaking into account satisfaction with different levels of living or domains of life. The model rests on the following four principles:
a) People’s experiences are derived from their interactions with the surrounding environment.
b) Peoples’s subjective experiences are not aligned with the objective environment. c) People respond to their experiences with the environment. d) The level of satisfaction in various life domains contributes to the overall quality of
life experience. In brief, the model specifies a series of linkages between various objectives and attributes of each life domain and satisfaction measures. This measurement could be influenced by a range of individual characteristics and individual standards of comparison in perspective of places or surroundings of the individuals.
9

Indicators and Approach to Investigate Quality-of-Life
In order to understand the quality-of-life in a particular setting, such as a city, it is necessary to measure conditions in that place using sets of indicators.These indicators are set to monitor the changes in certain conditions over time in order to appraise how those conditions have changed. And if they have changed, the need is to determine if they have improved or deteriorated and by how much. This effort might include evaluating the impact of various public or private interventions which sought to improve conditions. Moreover it is important to understand that different people may have different perceptions and therefore make different subjective judgments about the things which impinge on their quality-of-life including specific attributes of their urban environment. To adequately investigate those aspects of quality-of-life, studies need to use model frameworks and collect data to operationalize those frameworks within a particular context (Marrans and Stimson, 2011).
Table 2.2
Example of indicators can be used to investigate Quality of Urban Life in cities and Neighborhood
Objective Indicators Subjective Indicators Behavioral Indicators Employment rates Housing and neighborhood
satisfaction Public transit use
Educational attainment Desire to move Participation in sports Per capita income Perceptions of crime Amount of walking and
bicycling Crime statistics Perceptions of school quality Visits to cultural amenities and
events Domestic violence Perceptions of health care
services Visits to parks
Death rates Feelings about neighbors Visits to health clinics/doctors Incidence of chronic diseases
Feelings about rubbish collection
Amount of neighboring
Housing vacancy rates Feelings about congestion and crowding
Participation in voluntary organizations
Amount of parkland Feelings about government Participation in local decision making organizations
Number of public transit stop
Satisfaction with health Residential mobility
Availability of grocery/food stores
Satisfaction with family, friends, job etc
Vehicle kilometers/miles traveled
Life satisfaction, overall happiness (overall well-being)
Source: Marrans and Stimson, 2011
10

Hereafter, two basic approaches have been used by researchers to examine quality-of-life, particularly in the context of people living in cities and metropolitan areas: Marrans and Stimson (2011) urge that the first approach be to monitor quality-of-life through a set of indicators, usually derived over time from aggregated spatial data using official sources, such as the census, that are said to be related to perceived quality of life. For instance, levels of household income, crime rates, pollution levels, housing costs, et cetera. This approach, usually also defined as the objective approach, is most typically confined to the analysis and reporting of secondary data or aggregate data on different geographic or spatial scales . The second approach is modeling relationships between characteristics of the urban environment and measures of peoples’ subjective assessments of quality-of-life domains, including their satisfaction with specific phenomena and with life as a whole. This approach typically involves data collected through survey research methods and analyzed using techniques such as regression analysis or structural equation models. The modeling approach is supported by the subjective approach, which is specifically designed to collect primary data at the disaggregate or individual level using social survey methods where the focus is on peoples’ behaviors and assessments, or evaluations of aspects of quality-of-life in general.
2.3. Urban Amenities Amenities are site- or region-specific goods and services that make some locations particularly attractive for living and working. Their opposites, disamenities, make places unattractive. Natural amenities are those, like climate, which are (for the most part) not influenced or produced by people, while human amenities are those, like culture, which are. Both types exist and are experienced at various geographic locations.Amenities can be classified using many dimensions, such as geographic scale, degree of permanence, and the extent to which they are physically tangible. For example, one can describe the amenities of a region of the urban metropolitan area or, more narrowly, discuss those for an individual city, neighborhood, or even a single block. Amenities also differ greatly in how rapidly they change. Finally, some amenities are closely related to physically measurable phenomena, while others are quite subjective and difficult to define. For example, the air quality of a location can be objectively measured, while the "charm" of a historic neighborhood cannot. (Bartik & Smith, 1987)
A further conceptual model proposed by Marans and Mohai (1991) suggests types of amenities which may affect the health and satisfaction of a community and individuals in an urban area. There are (a) Environmental amenities including both: Natural recreation resources (for example, rivers, akes, wetlands, forests) ; and the quality of the ambient environment (air, water, noise, solid, and hazardous waste) (b) Urban amenities including both: Man-made recreation resources (swimming pools, bicycle paths, walking trails, golf courses); and Cultural resources (cinemas, concert halls, orchestras, museums, galleries, sports teams).
Moreover, Leyden (2011) in his research compiles some specific variables in predicting happiness from the urban amenities aspect. The following variables are:
1. Convenience of using public transport; 2. Accessibility to plenty of shops, supermarkets, and department stores; 3. Availability of parks and sport facilities; 4. Accessibility to cultural and leisure activities such as movies, theaters, museums,
concerts halls, and 5. Availability of libraries.
11

The importance of Urban Amenities
Meanwhile Amenities are a key to understanding quality of life because they are precisely what make some places attractive for living and working, especially compared to other places that do not have them and/or are burdened with their opposites, disamenities. They influence where households and firms choose to locate within and among regions – plus, in part, determine the costs incurred in doing so amenities and disamenities exert an exceptionally strong organizing force within advanced economies. And, in response to the strength and reach of this force, the corresponding nexus between amenities and public policy has also emerged: Indeed, it is now common for urban and regional planning efforts to actively address quality scales and, in large part, determine relative quality of life or social well-being (Smith, 2002). In other words, by determining relative quality of life, amenities and disamenities directly influence where people choose to live and at what cost. spatial equilibrium model.
The importance of urban amenities is captured by these following spill-overs. Urban amenities influence firms and workers to locate since their heterogeneity in individual and community preferences through urban amenities (Dalmazo and Blasio, 2010). Urban amenities also have a large affect in determining public policy (Bartik and Smith 1987). Another study shows, how Migration is influenced by amenities (Faggian and Ruyoela, 2010). Finally, Theriault and Des Rosies, (2004) present a methodology of how to analyse people’s mobility behaviour to reach their workplace. A series of “subjective” measures of accessibility based on actual trips made by people to access their work places, shops, markets, schools, health care services, leisure centres and restaurants is built for Quebec City. Places and their amenities relate to people’s sensitivity to travel time along with service places locations and thus influence their perceived accessibility.
In addition, Jane Jacobs (1961) planted the seeds of this line of research by arguing that the design of cities can play a profound role in the desirability of city living. Jacobs (1961) associates the physical design of a city as important for determining whether the city is safe, vibrant, interesting, and social. The consistent face-toface contacts (whether between the familiar or the unfamiliar) that occur in mixed-use, pedestrian-oriented city neighborhoods encourage a sense of public trust and social connectedness among city inhabitants (Jacobs 1961). Despite some inconsistencies, this body of literature suggests that the way a neighbourhood is built can have a major impact on the social capital of the people who live there. In particular, walkability, public places, and mixed use are associated with improvements in social capital. (Frumkin, Frank, and Jackson 2004). In brief the relationship between the built environments in this case was both directly related to physical functioning and indirectly related via social suppor. According to Brown et al. (2008), the nature of the built environment enabled residents to remain physically and socially active, thereby improving physical functioning (and to some degree of mental health) and better enabling people in nice places.
Happiness and Urban Amenities
There is a notion about happiness that is linked to whether people feel their cities successfully provide amenities that improve their quality of life. It can be refer to “happy place with happy amenities” or “happy place because of happy of the amenities”. Happiness and its pursuit, therefore, is a subject that should be of concern to scholars of urban places and urban policy. In some cities, public parks “are among a community’s most highly valued assets, not simply for green spaces, but also for the opportunity to maintain or make spontaneous contact with
12

other community members” (Beatley and Manning 1996). Oldenburg (1999) emphasizes the importance of cafes and pubs, and community centers. Local restaurants or corner grocery shops or hair salons may also be important (Jacobs 1961). Similarly, other studies maintain that “third places,” in concert with mixed-use principles, also provide places for people to congregate and interact socially. These “third places” represent a “great variety of public places that host the regular, voluntary, informal, and happily anticipated gatherings of individuals beyond the realm of home and work. Such places are prerequisites for cities and city neighborhoods because they promote social connections and personal well-being (Leyden 2003; Burns 2005; Rogers et al. 2010).
2.4 Spatial Accessibility
The spatial distribution of public amenities within cities and the access to these amenities have been a central focus in much geographical research. According to some past studies, a common task was addressed concerning spatial accessibility within the urban environment. The researches mostly discussed whether the spatial distribution of and access to a particular amenity corresponded with the geographical variation of ‘need’ for that amenity or, more generally, whether socially disadvantaged populations live in spatially disadvantaged areas (Knox, 1978; Talen, 1998; Talen and Anselin, 1998; Hewko and Smoyer-Tomic, 2002). Spatial accessibility to amenities generally refers to the ease with which amenities can be reached, as well as the quality, quantity and the type of activities offered by the amenities (Handy and Niemeier 1997). Spatial accessibility is based on the measurement of distance between populations and an amenity. The concept of accessibility spans a variety of aspects such as the physical, mental, and economic dependence on the nature of the land use and transport. Focusing on the physical aspect, it is generally acknowledged that accessibility consists of two elements: a transport element and an activity element. The transport element comprises the travel distance, time, or cost for one or more modes of transport, while the activity element corresponds to the amount and service amenities of various opportunities (Makri, 1999). Moreover, accessibility involves not just physical distances and time but social, cultural and gender-based constraints as well (Mitchell 1996; Lindsey et al. 2001). Accessibility has social and cultural dimensions, and theorists have observed that the degree to which facilities such as parks truly are public and accessible depends on metaphorical as well as physical boundaries. It attaches issues of certain social backgrounds that should have easy access and prioritize different age groups such as children or elderly people. However, most research mainly focuses on measuring spatial accessibility, which partly covers people’s social and economic backgrounds. Meanwhile, there is a strong relationship drawn between accessibility and quality of life particularly when it involves the topic of public amenities (Doi et al., 2008). Conception of quality of life is acknowledged as multilevel that represents individuals' happiness and well-being. It has been conceptualized both at macro (societal, objective) and at micro (individual, subjective) levels. With a focus on Veenhoven's concept of livability, this appears to be more `social’. Doi,et al., (2008) defines the following five categories as quality of life elements: (1) safety and security, (2) economic opportunity, (3) service and cultural opportunity, (4) spatial amenity, (5) environmental benignity. In addition, Felce and Perry (1995) showed five areas of well-being: physical, material, emotional, social, and development and activity. With regard to those elements, spatial accessibility is multidimensional, constructed particularly from the elements of economic opportunity, service and cultural opportunity, spatial amenity, and also formation of physical, social, development and activity. Furthermore, quality of life recently means not only satisfaction or availability of resources but also easy access and ability to make use of opportunities. And although physical accessibility is one of the key
13

factors of quality of life, individual freedom in terms of multidimensional choice of `economic opportunities' and `service and cultural opportunities' under time constraints has become increasingly important for the evaluation. It attaches issues of choices and closeness to public amenities within a living place. In brief, it can easily distinguished by measuring spatial accessibility.
Lastly, geographical definitions of accessibility follow two general strands, Place (location)-based accessibility targets ‘the proximity of places to other places’, while the second view focuses on individuals’ activities and emphasizes daily activity schedules and constraints (Horner 2004). At the individual level, accessibility may be defined as ‘the ease of reaching needed or desired activities’ (Handy & Clifton 2001). Proximity (or distance) is a component of place based accessibility measures, but is on its own not necessarily a sufficient or universally relevant criterion for accessibility. Travel times, trip-chaining, fixed or flexible daily activity schedules and physical or virtual travel behaviour are but a few issues that may be equally or more important depending on the situation at hand (Weber 2003; Neutens et al. 2008).
Measuring Spatial accessibility The way of measuring spatial accessibility has been discussed much more in literature. The type of accessibility measure used is crucial to the nature of the inquiry. There are two approaches common in the spatial accessibility literature, the minimum-distance and coverage methods (Talen and Anselin 1998). The minimum-distance method is simply the distance that neighbourhood residents have to travel to reach the closest amenity of interest. and is inversely related to accessibility. The coverage method sums up the total number (or amount) of amenities within a specified radius around neighbourhood residents - the more opportunities available within the distance threshold, the greater the accessibility. Coverage methods usually require residents to be covered by a specified maximum distance of certain amenities. This method does have advantages over the computation of ratios of parkland area to population, but several problems arise from its usage. The radius method can provide only an approximate representation of a park’s service area since it assumes ‘as-the-crow-flies’ movement. In reality, instead of traveling in straight lines, potential users move along the possible ways following available streets, and must avoid barriers to travel, such as railway lines and rivers . Thus, the actual travel distance is almost always greater than the direct distance. (Nichols, 2010) Another methodological issue in spatial accessibility research is the choice of the type of distance measurement. Shortest network paths (Ottensmann 1994; Talen 1997; Talen and Anselin 1998; Cervero et al. 1999) and, Euclidean (straight-line) distance (Truelove 1993; Truelove 2000) are the most common distance measures in accessibility research. Measuring distance from a neighbourhood to a facility typically involves locating the neighbourhood’s centroid (i.e., unweighted geometric centre) and, using the distance between the centroid and the facility, to calculate the average travel distance (Talen 1998; Talen and Anselin 1998; Truelove 2000; Lindsey et al. 2001). But the location of individuals within highly aggregated units, such as neighbourhoods, can vary substantially. As a result, the centroid approach can produce considerable aggregation error, leading to error in distance measures and interpretation of the results (Hodgson et al. 1997).
14

Proximity
In connection with the literature explanation, spatial accessibility is predominantly measured using the “distance” or “proximity” level from one point to another. An example from Witten, et al., (2003) in their study of the quality of urban environments: mapping variations in access to community resources uses maximum distance from meshblock centroid for unit of measurement. In the paper, accessibility itself is determined by defining a maximum distance from each meshblock centroid and identifying the number of services, facilities and amenities of specified types within the vicinity of the meshblock. Within the extensive literature on access to resources, various approaches have been taken to defining location ‘accessibility’. The most common approaches define ‘access’ based on travel time, or proximity to/ from a resource, and assume that the population has equal opportunities to make use of transport. Another notion explains the importance of proximity. Proximity and mobility are key components of individuals’ accessibility to everyday life destinations. If the destinations are not located nearby, then the distance is bridged through travel. The importance of proximity to relevant destinations may be considered in terms of its ‘practical’ quality as a facilitator in everyday life, since it reduces the need for travel. Furthermore, people may also want to be in proximity to destinations which represent ‘things’ which are important in the larger picture of life. Moreover, to the extent that proximity from home to relevant destinations is important, it may also affect individuals’ residential quality and satisfaction. (Haugen, 2011)
In addition, Witten, et al., (2003) also define a way of measuring proximity also involving a distance community by which the radius is drawn from home to nearby amenities. The distance community resource provision reflects the regional, suburban and neighborhood nature of various services, facilities and amenities. For example, in an urban area, parks, dairies (corner stores) and primary schools are perceived as ‘local’ or neighborhood amenities; whereas a hospital is perceived as a regional service. In general, people would expect to travel further to a regional than to a local resource. To account for the varying spatial scales of service and amenity provision, community resource accessibility is calculated independently for each sub-domain at distances of 500 metres, 750 metres, 1500 metres, 2000 meters, 3000 meters and 5000 metres from the meshblock centroid. The proximity is arbitrarily selected but consistent with the range of distances used by local government for access to local and regional community resources. Accesible distance is defined as the distance whereby 50 per cent of meshblocks in the combined cities have access to at least one service, amenity or facility within a sub-domain. By using the relative distance from a meshblock centroid to a particular service, the study was able to combine access to services, amenities or facilities provided at different spatial scales, thereby overcoming such obstacles.
Service Amenities Besides proximity or distance, the need of amenities also relies on their availability within a certain distance. Haugen and Vilhemson (2013) define this availability as service number, which is explained as numerical supply, size, and change in and around residential areas. This notion substantially supports the idea that people living in places with an abundance of local amenities – e.g., ‘compact’ urban areas with high population and amenity densities (Handy,
15

1992) – may be expected to have little need to travel further than ‘around the corner. On the other hand, travel over longer distances may be a prerequisite for accessing amenities in places where there are fewer options to choose from in the vicinity. Presumably, the larger the supply of amenities within the local neighbourhood, the greater the likelihood for a local amenity to be chosen (Næss, 2011). Regardless of whether the nearby options are those destinations that are actually chosen, areas with high levels of local accessibility provide residents with opportunities that are unavailable to residents of areas where this is lacking (Handy, 1992). The supply of amenities is often large, complex and varied, and specific and differentiated individual preferences presumably make people selective in their destination choices (Schenk et al., 2007). Furthermore, Haugen and Vilhemson (2013) reveal in their study that a sufficient number of amenities in velocity decreases the travel time and reduces the travel distance. As argued by Reimers and Clulow (2004) ‘rising levels of consumer awareness, affluence and mobility have helped create a more discerning customer’, who is often willing to travel further in order to reach adequate amenities. Yet, given the socioeconomic differentiation of mobility, there are also groups who have relatively little scope for choice due to space–time restrictions such as a lack of mobility resources. For those people, access to a local amenity supply is of key importance (Haugen,2012).
Figure 2.2 Dimension of Spatial Accessibility Studies
Spatial
Accesibility
Physical (Makri, 1999)
Social and Cultural (Mitchel 1996,
Lindsey, et al., 2001)
Population Need Amenity Supply
Geographical (Homer, 2004)
• Transport ( Travel distance, travel cost, and travel time)
• Amount and service supply of amenities
• Place (locations) PROXIMITY measurement
• Daily Activities schedules and constrains
• Public and private purposes
• Age group • Economic
status • Ethnicity group
Source: Writer (2015) based on literature review
16

2.4. Urban Diversity Diversity over several dimensions has been considered valuable both in consumption and production. Jacobs (1969) attributes the prosperity of cities to their industrial diversity. Quigley (1998) and Glaeser et al. (2001) identify the diversity of available consumption goods and services as one of the attractive features of cities. Florida (2002) stresses the importance of the diversity of creative professions employed in research and development or high tech industries. More generally, Fujita et al. (1999) use the ‘love of variety’ in preferences and technology as the building block of their theory of spatial development: the production of a larger variety of goods and services in a particular location increases the productivity and utility of people living in that location.
The importance of diversity in Amenities In urban metropolitan areas, diversity is obviously seen by the presenceof a rich variety of services and consumer goods. There is a notion that points to how diverse amenities encourage urban growth and good public service delivery. Cities with more restaurants and live performance theaters per capita have grown more quickly over the past 20 years, both in the US and France. In cities with more educated populations, the natural interpretation of this fact is that productivity has risen in places with more educated workers and quality of life has risen faster. Absence of schools for adverse communities will lead to less attraction of an educated workforce and hence may increase the level of school drop-outs and crime rates (Gleaser, 2001).
The positive ‘production value’ of diversity has also been stressed in the literature on the organization and management of teams. Here the standard assumption is that higher diversity can lead to more innovation and creativity by increasing the number of ways groups frame problems, thus producing a richer set of alternative solutions and consequently better decisions. Lazear (1999) provides an attempt to model team interactions. He defines the ‘global firm’ as a team whose members come from different cultures or countries. Combining workers whose countries of origin have different cultures, legal systems, and languages imposes costs on the firm that would not be present if all the workers had similar backgrounds. However, complementarity between workers,in terms of skills, can more than offset the costs of cross-cultural interaction.
The importance of diversity has also several mentions in literature. Jacobs (1969) views economic diversity as the key factor of a city’s success. Sassen (1994) studies ‘global cities’ (such as London, Paris, New York, and Tokyo) and their strategic role in the development of activities that are central to world economic growth and innovation. A key feature of these cities is the cultural diversity of their populations. Similarly, Bairoch (1988) sees cities and their diversity as the engines of economic growth. Such diversity, however, has been seen mainly in terms of the diversified provision of consumer goods and services, as well as productive inputs (Quigley, 1998; Glaeser et al., 2001). In his work within the nexus of sociology and economics, Richard Florida (2002) argues that ‘diverse’ and tolerant cities are more likely to be populated by creative people, thus attracting industries such as high tech and research that heavily rely on creativity and innovative ability.
Besides having affecting increasing growth, diversity also impacts on creating a better city profile. One of the first examples is the diversity in a developed cultural cluster, which can be found in the harbour city of Rotterdam. The project was developed during the 1990s, as part of a deliberate attempt by local government to strengthen the urban profile of the city. In those days, Rotterdam was confronted with a steady rise in unemployment figures, an uneven
17
suburbanisation process and a deteriorating investment climate. Those involved saw the creation of the museum quarter as a crucial element in a broader inner-city renewal and re-imaging strategy, aimed at the markets of tourism, shopping and cultural consumption. Cultural clustering is an alternative source of urban cultural development. Mixtures of cultural functions and activities, from production to presentation and consumption, and from theatre and the visual arts to pop music and the new media, are grouped together in a great variety of spatial forms (Mommas, 2014)
Diversity in Community
There is a deeper study focus on variations of happiness among different communities. The relationship between an ethnic community and their quality of life can be captured by assessing life satisfaction among immigrants. Previous research has shown quite convincingly that levels of life satisfaction among specific immigrant groups in Western Europe tend to be significantly lower, compared to the native majority population (Safi 2010). The gap in life satisfaction has been demonstrated across various Western European countries, and across various immigrant population groups originating from the Asian and African continents, Turkey and Eastern Europe (Bǎlţǎtescu 2007; Verkuyten 2008). On the other hand, results from De Vroome and Hooghe (2013) reveal a different issue. The research identifies happiness levels of ethnic minorities do not tend to be lower than those of natives in relation to social, economic and community resources. The analysis refers to financial problems and social support experienced by a community, which lead to more diversity in life satisfaction. Based on those different results, it is necessary to understand aspects and variables which relate to the measure of happiness within diverse communities.
In the final analysis, diversity in community reveals different preferences from different communities. This is readily discernible in the preferences of ethnic communities. Their preferences are affected by their background cultures and the need for surrounding amenities in daily life. Since they live in ethnic neighborhoods, most of them create their own identity-amenities to fulfill the requirements. It is believed that changes in the nature of urban space and of immigration have begun to alter the function of ethnic neighborhoods for some groups or individual group members. Logan (2002) mentions, the preference can be observed through the public places which are widely used, names of shops or restaurant nearby, and community institutions such as social clubs, churches, mosques, and cultural centers which exist within the neighborhood. Those preferences also vary among groups of immigrants, especially across generations and group ages. Logan (2006) urges that the immigrant second generation will be less likely to live in a minority neighborhood because of social-economic status advancement and infiltration of host country cultures. The offspring of immigrant parents interact more often with natives, which leads to similar preferences through activities and amenities. Therefore, understanding these preferences will lead to a different evaluation of quality of life.
2.5. Lesson Learned From literature, it is noted that happiness has multi-dimensional concepts attached to various aspects. However, it is obvious in this research, the context of happiness is a notion representing satisfaction with a good life. This satisfaction is considered as subjective well-being from an overall evaluation degree of personal life. Results from the satisfaction judgment come from both subjective and objective aspects. Furthermore, happiness is also attached to the concept of quality-of-life, which is predominantly a combination of the life-ability and livability concepts of the four qualities of life Veenhoven (1984). With this concept, happiness is obviously measurable using certain approaches with a packet of
18

indicators. Measuring the relationship of these indicators and happiness will lead to a better understanding of the most influential factors (what) and the explanation (why) in happiness levels. Furthermore, it is also noted in the literature that urban amenities are part of the urban living environment quality. Urban amenities are important for city living completeness and hence are a great set of indicators to examine quality-of-life. Types and kinds of urban amenities are variously related to purposes and functions. According to the theories reviewed above, it is quite obvious that the aspect of accessibility is the most studied factor to understanding the amenities concept. Accessibility as a physical aspect is a dominant factor with which to evaluate the quality of urban amenities based on some spatial unit analyses (eg. neighborhood). However, perception and behavior of people with regard to amenities are also important. They are substantially counted as social aspects, which may increase an evaluation degree of quality of urban amenities more comprehensively. Additionally, measuring spatial accessibility varies in some dimensions. It involves physical, social, and cultural aspects. However, most the studied area is physical accessibility, which measures predominantly by distance or proximity. The ways to measure proximity from one point o to other point varies on different levels of complication. Such studies apply techniques like shortest network paths (Ottensmann 1994; Talen 1997; Talen and Anselin 1998; Cervero et al. 1999) and, Euclidean (straight-line) distance (Truelove 1993; Truelove 2000). The application of these techniques depends on the availability of geographical data and the level of aggregation error that researchers want to attempt. Moreover, when addressing urban amenity issues on a neighborhood scale, there is the term ‘distance community’ that needs to be considered. Distance community is close to degree of accessiblity of such amenities on a neighborhood scale. Amenities like daily supplies (bakery, grocery, butchery) carry a high demand for sufficient closeness within the neighborhood, whereas libraries, art galleries and shopping centres can be located further away. This discussion comes together with concepts of equity particularly addressing the social needs and demand of those amenities. Some studies have integrated the measurement of proximity levels with the demand and need of amenities to develop a certain level of accessiblity degree from spatial unit analysis (city, neighborhood and postcode). Eventually, discussion about amenities in the context of the urban living environment will lead to notions of diversity amongst people and amenities. Diversity appears inevitable in urban environment, especially cities with greater attraction. Diversity is translated both from variety of the people and of amenities into the outcome. It was clearly mentioned that the importance of diverse amenities is to address a new variety of production and consumption goods within cities. Moreover, diversity in the community has its own path with distinct preferences for certain groups in utilizing urban amenities. This outcome significantly contributes to urban growth. Availability of diverse amenities itself is an important feature of quality of life, and hence encouraging urban growth, to some extent, will influence the improvement in the happiness levels of people. 2.6. Conceptual Framework In the the happiness concept, the use of the term happiness is to denote both subjective well being and quality of life. Although many discussions have argued there differences within those concepts, this study tries to integrate most common factors applicable to examining the
19

urban living environment. Like Veenhoven (1984) explains, livability is not the single definition of happiness, but these two aspects are important factors in determining happiness as a whole. Livability in this perspective is commonly related to a degree of quality-of-life. They are also part of the objective aspects of investigating quality-of-life from Marrans and Stimson (2011) definition. Therefore, further in this research, analysis is conducted to examine how the livability of urban amenities influences happiness levels of residents as their evaluations of satisfaction of their quality-of-life.
The discussion of the quality-of life of any entity has a subjective dimension, which consists of perceptual entity as well as an objective reality. People live in places or series of places, each of which has particular environmental characteristics. Those places might be viewed at various levels or scales from the dwelling to the local area or neighborhood to the city. It may be argued that where people live will influence their quality of life. As such, a fundamental assumption underlying many approaches to planning is that urban environments (places) may be designed to increase the level of satisfaction with the lives of residents. It can be the area of living and also amenities surrounding their living place. Given that most people in advanced economies live in the large urban environments that we call cities and such areas are expected to grow over the next few decades, it is important to examine the relationships between the characteristics of urban amenities and the perceived quality of the residents.
The two paragraphs above have explained the relationship between urban amenities as part of the urban living environment and how it has an impact on quality of life. This research precisely focuses on one f particular factor which is predicted will have significant influence on determining happiness levels. This factor is urban amenities with focus on measuring proximity from certain amenities to individual living places of residents. The proximity level is measured within certain spatial units, such as postcode block, neighborhood and city, depending on service amenities from each urban amenity. Measuring proximity is one important way of measuring spatial accessibility. As Doi, et al., (2008) mention, the spatial accessibility will represent some categories of economic opportunity, service and cultural opportunity, and spatial amenity. It is acknowledged as a multilevel that represents individuals' happiness and well-being. Therefore, measuring proximity levels will examine a degree of satisfaction of people with their surroundings. Or in other words, to some extent, how close or far people are from the amenities will determine their happiness levels.
The figure of conceptual framework below explains how proximity of urban amenities is linked to determining happiness level. This research clearly attempts to set happiness as the dependent variable, and proximity level as the main independent variable. To support further elaborations, service amenitiers was added into analysis. It involves service amenities within certain distances of residential areas. This research clearly refers the definition of service amenities to Haugen and Vilhemson (2013) study, which urges that service amenities is numerical supply size and change in and around residential areas. Other service factors, such as opening hours, types of goods, and product price are not involved in further analysis. This research merely disentangles the geographical dimension from service amenities. Hereafter, the proximity itself may also be regarded as either important or unimportant, or even undesirable. For various reasons long distance has been avoided for destinations that are negatively valuable. On the other hand, some cases show that people may desire a certain distance between their home and their destination, e.g., their workplace (Lynch 1981; Mokhtarian & Salomon 2001; Sandow & Westin 2010). The thresholds for when proximity becomes ‘too much of a good thing’ presumably vary across destinations as well as individuals. Therefore the results from the influence of proximity to happiness are expected to be varied. This is reinforced by the involvement of cultural diversity, which attaches issues
20

of Dutch and Non-Dutch residents. The characteristic differences among diverse residents should provide additional insights into how their preferences determine the need of amenities. Furthermore, urban amenities themselves are an object of research that has three different scales of spatial unit analysis; postcode, neighborhood and city. It requires each individual living place to be aggregated in meshblock centroid postcode to get a better grip on aggregation error. The measurement simply applies straight-forward or the-crow-flies techniques and obtains some assumptions about buffer areas of the way an individual accesses the amenities. Further explanation of measurement techniques can be seen in chapter 3, Research Design and Methods. Lastly, the conceptual framework tries to integrate discussions in literature about quality of life, urban amenities, and measurement of proximity into one package to examine degrees of happiness. It can be simply explained as the influence of proximity to urban amenities to the happiness level of residents which eventually indicates “happy amenities”. The variation of concepts has been elaborated and some of them conveniently apply to this research framework. This research uses framework as guidance to further analysis that will be conducted in chapter 4, Research Findings and Analysis.
Figure 2.3 Conceptual Framework
Source: Author (2015)
21

CHAPTER 3: RESEARCH DESIGN AND METHODS This chapter focuses on a step-by-step approach undertaken towards the research design, data collection and data analysis methods. The selected research design examines the relationship between urban amenities and happiness in the case of Rotterdam. Furthermore, the chapter develops a framework for data collection and analysis which is logically structured to facilitate the collection of appropriate data, based on variables identified from previous chapters: proximity, service amenities, and some control variables.
3.1. Research Strategy and Approach
This is an explanatory/relational research in which the primary purpose is to explain how events occur in order to build, explain or extend a theory, by discovering relationships between multiple variables (Yin & Campbell 2002). In this context, supported by the theories presented in chapter 2 on happiness, the quality of urban living environment, and urban amenities. This research seeks to discover the relationships between happiness and the quality of urban amenities in order to understand the influence of urban amenities’ variables to the happiness in Rotterdam. This study used a quantitative survey research strategy. The strategy elaborated a structural equation model that incorporates casual paths and identification of the collective strength of multiple variables (Creswell, 2009). Furthermore, this study specifically applied survey as the main strategy which provides quantitative or numeric descriptions of trends, attitudes, or public opinion by studying a sample of that population (Creswell, 2009). The reason for quantitative approach is that it is a large representative sample in form of hard data. This study uses mainly raw data from Rotterdam Leisure survey conducted at 2009, including happiness questioners, perception and behavior through urban amenities, and other objective indicators of urban amenities. Besides conducting the research, this study also attempted a desk research strategy, which elaborates existing data on spatial distribution of urban amenities in Rotterdam. The measurement of proximity level was obtained from this data using Arc GIS software and techniques implementation. At the end, the two main results of prior analysis continuously analyzed through statistical analysis methods (multi regression analysis using STATA program) to obtain final result of significance influence from proximity of urban amenities to happiness level of residents in Rotterdam. 3.2. Operationalization
The indicators selected below were based on the variables defined from the conceptual framework. In the operationalization of the research conceptual framework; variables and indicators have been categorized under dependent (Y-variable) and independent(X-variable). Dependent Variables
On one hand, the dependent variable of the study were the happiness level of residents from 90 neighborhood in Rotterdam. This data was derived from primary data Rotterdam Leisure Survey conducted by Rotterdam Municipality at 2009. Type of this variable was quantitative data as categorical data from the question “How happy are you” with answers in scale of 1 – very happy; 2- happy; 3- not happy, and 4- not at all happy.
22

Independent variables The independent or X-variable for this research was proximity level from an individual living place to urban amenities. The urban amenities themselves were divided into several groups; cultural, recreational, shopping centre, daily supply, horeca, healthcare, and transport hub. This research also attempted spatial service amenities as supportive independent variables, which has been refined into four scales. The scales are 300, 600, 900, and 1200 meters. Each amenity had its own accessible distance to be compared with GIS measurement result. Furthermore, this research applied some control variables; population by age group, nationality and level of income. It gave limitation to individual charactheristics since the happiness issue is much more on personal experience.
Table 3.1 Operationalization
Concepts Variables Indicators Data Collection Method
Happiness Happiness Level
How Happy are you? Scale 1-4
Primary data: Survey - Questioners (Rotterdam Leisure Survey)
Spatial Accessibility
Proximity Minimum distance from amenities to postcode centroid
Secondary Data : Geographical data of amenities distribution from Rotterdam Smart City Plannerr; Rotterdam Wijkprofiel for accessible distance and amenities groups reference and Near measurement by Arc GIS
Service Amenities
Number of amenities within spatial scales (300, 600, 900, 1200 meters)
Secondary Data : Geographical data of amenities distribution from Rotterdam Smart City Plannerr; Rotterdam Wijkprofiel for accessible distance and amenities groups reference and Buffer-count measurement by Arc GIS
Demographic data (control variables)
Ethnicity, Age, Gender, Paid Job Status, Household Composition, and Crime Rate
Primary data: Survey - Questioners (Rotterdam Leisure Survey)
Source: Author (2015)
23

Table 3.2 describes accessible distance of amenities in Rotterdam. The numbers came from an official source Rotterdam Wijkprofiel (neighborhoods profile) within neighborhood physical index profiles. The accessible distance is defined as the average proximity measured by the straight-forward method to the most accessible amenities within the neighborhood. This proximity become the standardized distance for amenities that normaly exist within neighborhoods in Rotterdam. The measurement of accessible distance substantially attempted the crow-flies technique, which quantifies the average proximity between one point to other point without involving network or street path. This principal is important to take into account because in reality people normally access their destinations using streets or paths that exist in their area. Therefore Rotterdam Wijkprofiel rates the accessible distance to at 70 percent of average real distance within neighborhoods. Or in other words, accessible distance 292 meters of grocery store has a real average distance of around 500 meters.
This research prefers this accessible distance to determine spatial scale of service amenities, which is used to analyze in Chapter 4. However, some amenities do not have reference to accessible distance available at this source. For this reason, some adjustments were made to eliminate complication on service amenities measurement. Scale of 300, 600, 900 and 1200 meters were generated based on accessible distance from Rotterdam Wijkprofiel and some adjustments of factual conditions in Rotterdam area.
Furthermore, this research also refers to the types of amenities in the Rotterdam Wijkprofiel for amenities grouping in further analysis. This reference was combined with other references from literature reviews to gain more comprehensive groupings. The grouping itself is one important factor in the analysis since the kind of amenities are a core consideration for prioritizing measurement.
Table 3.1 Types of Amenities
Group of Amenities Type of Amenities Accessible distance (Metres) Recreational Park 1685
Playground 727 Sport Center 1133
Swimming Pool 1042 Gym 392
Daily Supply Butcher 292 Bakery 272
Groceries 292 Drug Store 292
Healthcare Clinic 362
Dental Care 385 Pharmacy 417
Transport Hub Central Station 1184 Metro Station 1747 Tram Halte 277
Source: Author (2015) based on data provided from Rotterdam Wijkprofiel 2014
24

3.3. Data Collection Method This research mainly uses two kind quantitative data; Primary data from Rotterdam Leisure Survey and secondary data from Rotterdam Smart City Planner. This research also used Rotterdam Wijkprofiel (Rotterdam Neigborhood Profile) for accessible distance and amenities groups reference. All the data come from one institution, Rotterdam Gemeente (Rotterdam Municipalityity). Rotterdam Leisure Survey This type of data is primary data with the nature of subjective indicators. The survey itself was conducted in 2009 by the Municipalityity of Rotterdam in order to gain relevant information about residents satisfaction, sport participation, cultural participation, visits to inner city (fun shopping, restaurants) / attractiveness of city, use of green space (parks, nature) and volunteering. The main questions applied for this research are happiness questions; How happy are you” with answers in scale of 1 – very happy; 2- happy; 3- not happy, and 4- not at all happy. Other data obtained from this survey are demands for amenities and characteristic of residents in age, nationality and level of income. Initially a number of Rotterdam received a letter from Mayor of Rotterdam with the request to fill in the questionnaire on the internet survey. After several weeks, the respondents will get a reminder to complete the online survey. However, the Municipality also conducted a face-to-face survey with paper questioners particularly for non-Western immigrants Surinamese and Antilleans / Arubans, Turks, Moroccans and Cape Verdeans). By being sent letter from Mayor and having visit from Municipality surveyors, it was expected that the respondents will be pleased to finish questioners appropriately. To anticipate some disappointing responses, some complementary samples were drawn to fill in same questionnaire, but for this group of samples, no reminder or paper questionnaire were sent to them. Rotterdam Smart City Planner Rotterdam Smart City Planner or in Dutch name “Gebeidsprofiel Durzaam” is a secondary data in the nature of more on objective indicators. The main resource of this data comes from Retail business database, Locatus, Woerden, 2012. This data provides spatial distribution of amenities in Rotterdam in the year 2012 with the locations and types of amenities, e.g daily supply, library, cinema, restaurant, park, hair salon, gas station, and et ce tra. Hereafter, the data was measured in more detail using Arc GIS software to attain proximity level from each amenity to individual living places. This measurement became the main independent variable of this research. Rotterdam Neighborhood Profile (Rotterdam Wijkprofiel) Rotterdam Neighborhood Profile or in Dutch name “Rotterdam Wijkprofiel” is a secondary data in year 2014 with more on objective indicators. The profile consists of three main indexes: physical, social, and safety. This research used data from Rottedam Wijkprofiel (Rotterdam Neigborhood Profile) for accessible distance and amenities group reference. 3.4 Sample and Selection The sampling method attempted in this Rotterdam Leisure Survey is stratified random sampling. The sample was drawn based on Municipality Administration ranged in age from
25

13 to 75 years. In addition, a number of samples were taken at the request for residents over 75 years old. Also, to obtain more response from young residents, the survey took more samples from middle age range from 15-35 years old. The other special group of targeted sample is non-western immigrants who initially being expected to provide more information about what they wish from living in Rotterdam. The final response to the survey was 21 percent or came along with 4422 respondents. It covers over 92 Neighborhoods. This number was prospected gave appropriate representation of whole residents in Rotterdam. 3.5 Unit of Analysis The unit analysis of this study is the city of Rotterdam, as a whole represented by samples from 90 neighborhoods in Rotterdam. However, when attempting proximity measurement, this research uses postcode level for living place unit and single address or coordinates for amenities location unit. The use of lower unit analysis is conducted to attain lower aggregation error of proximity measurement. Afterwards, the analysis involves wider scale from neighborhood to sub area units in order to obtain better understanding about accessible proximity best fitted for residents in Rotterdam. Eventually, a combination of these units of analysis will complement findings and hence support a better understanding of the influence of urban amenities on the happiness of residents in Rotterdam. 3.6 Data Analysis This research is mainly focused in quantitative analysis using primary and secondary data. It conducts spatial analysis using Arc GIS and statistical analysis using STATA program. The purpose is to afford statistical modeling for significant variables influence happiness. The discussion of data analysis is divided into three steps; Dataset Preparation, Proximity Measurement by Arc GIS, and Modeling of Regression Analysis by STATA Dataset Preparation This step is taken to collect all data and gather them into one package of data sets. The main data is happiness survey from Rotterdam Leisure Survey as dependent variable which consists of 840 number of observations. The independent variables must follow the set of dependent variables otherwise they cannot be run in regression models. It also important to prepare all the variables in shape.file which later will be proceed in Arc GIS.. A ‘shape.file’ is the name given within ArcMap to the geographical representation of a theme or layer of spatial information. In order for each separate layer to be superimposed correctly upon the others , each mus t be s tored in the same geogr aphic projection and co-ordinate sys tem. The next task was to locate all urban amenities in the study area and create a new Arc Map shape.file to contain them. Sites were identified by shape.file basemaps provided by Rotterdam Municipality and were then drawn into ArcView. In addition, it was necessary to locate all the points of the nearest amenities from individual postcodes to get a clear range of accessible amenities nearby. Proximity and Service Amenities Measurement by Arc GIS The proximity measurement is carried out using Arc GIS version 10.1 a package produced by the Environmental Systems Research Institute (ESRI). Arc GIS is used to calculate two kinds of measurement This measurement applies simply straight forward “crow-flies” using
26

Near tools techniques to measure from one coordinate point of urban amenities to another coordinate postcode of individual living place. This measurement is simply measuring proximity from postcode centroid that represent spatial unit of residential area to the nearest location of amenities. In reality instead of access amenities in straight line, people do make curvaceous line along with the streets and paths. Therefore, this proximity from crow-flies technique does not represent the actual distance that people usually have when they access this amenities but it merely represent degree of closeness from living place to amenities. Based on Rotterdam Wijkprofiel the measurement of accessible distance attempt 70% or two third of buffer distance as accessible distance, therefore this research also use more or less similar percentage to calculate buffer proximity. The aggregation error is minimized by using postcode level of individual living place of respondent and single address of each amenity. The second measurement is Buffer-Count in Arc GIS 10.1 for measuring number of amenities within spatial scale. The scales that use in this research are 300, 600, 900, 1200 meters based on accessible distance from Rotterdam Wijkpofile data. The measurement of service amenities explains the number of services available within a residential area and determines the degree of satisfaction in people with the amenities in their surroundings As explained in Chapter 2 Literature Review, there are several methods to measure proximity and to use in Arc GIS. This research chose to attempt Near tool which measure proximity from one point of postcode centroid to one point of the nearest amenities. The weakness of this method is it does not involve and calculate average of amenities which may also have frequent access and close distance available within postcode area. However, this research urges that one single point of the nearest amenities have a potential representation of other similar amenities located in velocity. It has the logic that in reality, the close proximity encourages the possibility of respondents to live close to more amenities and vice versa. Furthermore, to avoid bias of proximity measurement, this study also attempted service amenities analysis to attain issues of service amount within spatial scale. It was expectedely complement the weakness of prior measurement hence the whole analysis would work effectively. Since the choice of this method has considerable impact on data errors and different intrepatations, this study realizes the choice method turned out to be a research limitation and recommendation for further research. It will be elaborated more detail in Chapter 5, Conclucion and Recommendation. Regression Modeling by STATA After conducting proximity measurement, this study attempted Multivariate Regression Analysis or Ordinary Least Square (OLS) to build the statistical models. The first model was built to test whether proximity to the nearest point of amenities has significant relationship to happiness levels of residents in Rotterdam. Second model was testing the relations between happiness and service amenties within spatial scales. The multivariate regression is also beneficial to explain more variation in dependent variables, attain more accurate predictions, gain simultaneous consideration of contributing factors, and provide separate understanding of each predictor, in this case proximity and service numbers. Based on the equation of multivariate regression, the amount of Y variable or happiness level depends on the sum of several X variables. Therefore, instead of testing one single independent variable with the dependent, this research combines all variables in one multivariate regression to gain convincing results from interaction of each variable. In reality all those amenities are located close to the other hence make the impact to the dependent variable was genereted by more than one group of amenities. Furthermore, since happiness has multi dimension determinants especially from individual charachteristic factors, this research also attempted control
27

variables to limit the coverage relation between happiness and proximity to the amenities. The control variables are the number of respondents, gender, age, ethnicity, paid job status, household composition and crime rate. Thus, testing all variables together involve these aspects considerably and multivariate regression analysis is more applicable to this model. The equation of the Multivariate Regression Models is:
H = Happiness (Dependent Variable) P = Independent variables 𝛽𝛽 = Intercept or constant term Z = Control variable 𝜀𝜀 = Erro term Overlay Modeling by Arc GIS
The final step of this research is building an overlay model based on regression results. The purpose of this model is to encapsulate areas where people are satisfied with their life and their surroundings represented by the availability of amenities. Overlay model was done by Arc GIS 10.1 using combination of proximity and service amenities descriptions maps and hence building a score of each regression result. The basic princip of this model is to attain combination of the average happiness scores with the amenities measurement analysis for each neigborhood. The model is called “satisfaction degree”. The model merely did overlays happiness with amenities which have significant relationship regression results. The positive relationship gave extra scores whereas the negative reduce the scores. The non significant amenities are considered has no impact in determining satisfaction degree in this analysis. Finally, the result of this model is the total score of overlay and indication of area with high, moderate, or low score. In this level, analysis will be taken through neighborhood and city levels.
3.7 Validity and Reliability McGoey et al., (2010) refers to reliability as a research that is confident, that scores obtained are consistent over time and across different conditions or when different sets of indicators are tested under conditions that vary in some other way. On the other hand, validity is explained as measuring exactly what the research intended to measure and how well the data collection instrument measured the scored acquired with minimal error. First, the representativeness of the sample deserves some extra attention. According to the laws of probability, a random sampie is representative, which is why randomization is usually the recommended approach. In practice, though, certain problems may arise - for example, non-response may lead to distorted results (Van Thiel, 2014). Since the response rate is under 30 percent, it needs to be considered the reason for un response respondent. Also, such a certain group of residents has been a prior target. The prioritized stratified sample may lead to bias results due to different concern of their perspectives. Second, as mentioned in chapter 1 scoop and limitation, there was a time difference constraint while doing this study. The survey was conducted in 2009 whereas the proximity measurement uses data from year 2012. This time difference may lead to a bias effect from
28

individuals in different surroundings over 3 years. However, using some assumptions, the alteration of amenities over 3 years may have little impact since this analysis applies for whole city. The come and go of amenities becomes balanced, hence not affected by the wide gap of feeling of residents about their surroundings. Another considerable limitation of the Arc GIS tool used to measure proximity is the selected method might cause different results and interpretations or even data error. It could happen because technically, the proximity measurement left out some other substantial factors of amenities. For example, availability of other close and frequent accessible amenities, type popular or non popular amenities, variance of opening hours, or variance of price offers. Those factors inevitably influence the use and satisfaction levels of people for the amenities. Different selected methods are proposed to attempt further research. Third, statistical analysis can suffer from so-called statistical artefacts, which are by-products of the calculations that are being carried out (Van Thiel, 2014). It also offer certain amount of unexplained variance will always remain (this is called the estimation eITor). Ideally, there would be no variance left at all after the analysis. On the upside, unexplained variance does provide some food for further thought. The use of fixed effect and Control variables is expected to reduce this issue.
29
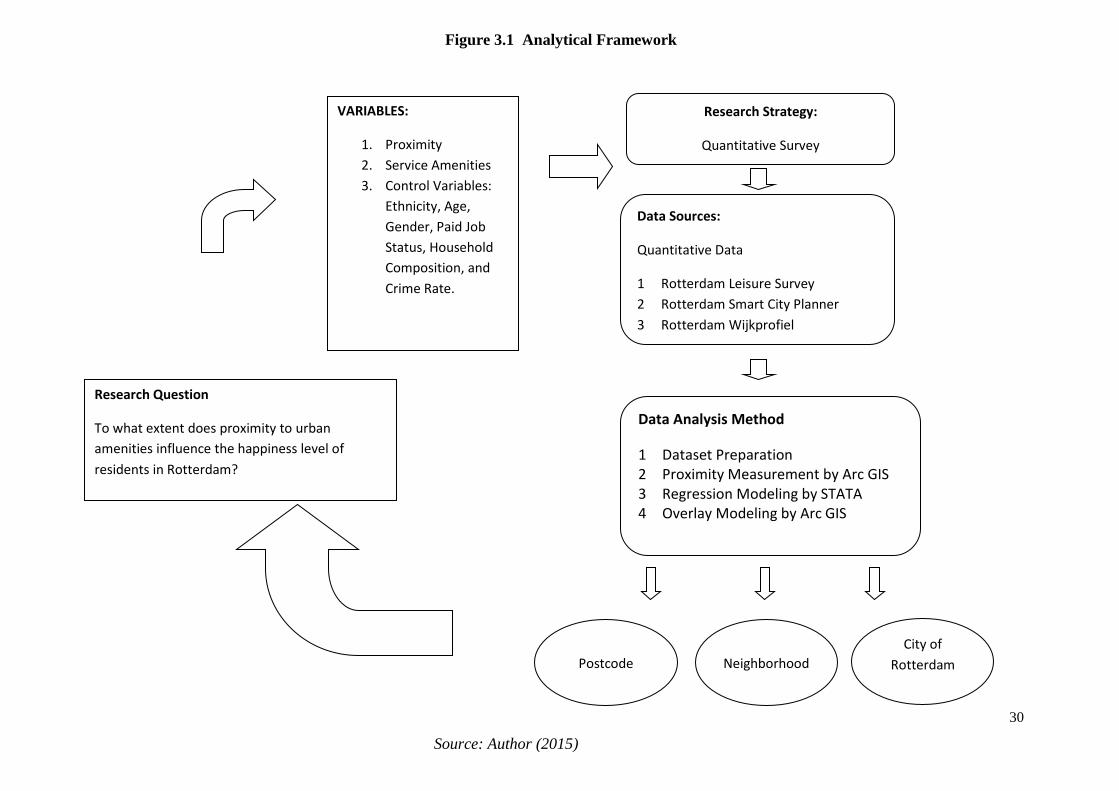
Research Question
To what extent does proximity to urban amenities influence the happiness level of residents in Rotterdam?
VARIABLES:
1. Proximity 2. Service Amenities 3. Control Variables:
Ethnicity, Age, Gender, Paid Job Status, Household Composition, and Crime Rate.
Research Strategy:
Quantitative Survey
Data Analysis Method
1 Dataset Preparation 2 Proximity Measurement by Arc GIS 3 Regression Modeling by STATA 4 Overlay Modeling by Arc GIS
Data Sources:
Quantitative Data
1 Rotterdam Leisure Survey 2 Rotterdam Smart City Planner 3 Rotterdam Wijkprofiel
City of Rotterdam
Neighborhood
Figure 3.1 Analytical Framework
Source: Author (2015)
Postcode
30

Chapter 4: Research Findings and Analysis
This chapter elaborates the findings from regression and overlay models that built to answer the research questions. The discussion of this chapter is divided into four part; (1) Summary statistics which gathers all main data of happiness and amenities before being analyze in regression and overlay models; (2) Happiness and Proximity which analyzes relationship between happiness and proximity to the nearest point of amenities; (3) Happiness and Service Amenities which analyzed relationship between happiness and number of service within spatial scales, and (4) Overlay which analyzes results from prior models to attain a convenient degree of happiness and amenities in neighborhoods and the city of Rotterdam.
4.1 Descriptive Analysis
Happiness and Amenities Data
Summary statistics of dependent variables: Happiness index from Rotterdam Leisure Survey 2009 explain the number of observation, average (mean), standard deviation, minimal and maximal value (see Table 4.1). This research is using aggregation of happiness index from individual levels to postcode level whereas 4422 observations were aggregated into 840 observations based on spatial units. This aggregation alter the type of data from categorical with scale 1 up to 4 become continues data with minimum value 1 and maximum value 4. Afterwards this aggregation is followed by building the centroid of 5 digits postcode to attain coordinate locations. This coordinates locations are attempted to measure proximity to nearest point of amenities and count numbers of amenities within spatial scales.
This research also used several Control variables to bound the regression model more valid deeper. Those variables are Ethnicity which consists of two types: Dutch and Non Dutch; Gender, Age, Paid Job Status, Household Composition and Crime Rate. From 6 type Control variables, only Age and Crime Rate are continuous data, the rests are categorical data.
Table 4.1 Summary Statistic of Dependent and ControlVariables
Dependent Variable Mean Std. Dev. Min Max Happiness 3.08 0.40 1.00 4.00 Control Variable
Number of respondent 5.20 4.82 1.00 76.00 Ethnicity 1.22 0.41 1.00 2.00 Gender 1.65 0.48 1.00 2.00 Age 45.77 7.28 33.28 71.14 Paid Job Status 1.20 0.58 1.00 2.00 Household Composition 2.37 0.76 1.00 6.00 Crime Rate 1227.04 795.51 3.00 4382.00
Source: Author (2015) based on Rotterdam Municipality (2009) *Happiness 1= Least Happy, 4= Most Happy Ethnicity 1= Dutch, 2= Non Dutch Gender 1 = Man, 2= Woman, Paid Job Status, 1= Has Paid Job, 2= Does Not have Paid Job Household Composition 1 = Live alone, 2 =Adults, No Children, 3= Couple with child(ren) living at home, and 4= single parent with child(ren) living at home
31

Figure 4.1 Map of Happiness Level of Residents in Rotterdam
Source: Author (2015) based on data provided by Rotterdam Municipality (2009) 32

Distribution of happiness in Rotterdam (see Figure 4.1) indicates that spatially, residents in Rotterdam are fairly happy. The green areas dominate most of happiness distributions, especially in northern Rotterdam. If turning more detail, central area indicate less happy rather than peripherals. The least happy areas appear only in few numbers. This fair distributions describes there are no wide spatial gap of personal well-being among residents in Rotterdam.
Summary statistics for amenities as independent variables consist of numbers of amenities in group and totals, proximity to nearest point of amenities and number of service within spatial scales. This research use amenities data from Rotterdam Smart City Planner which posses about 9515 location and name of the amenities. To elaborate findings much deeper, this research divides the amenities into 13 groups based on its functions (see Table 4.2). the grouping refers to amenities divison of Rotterdam Wijkprofiel and literature review in Chapter 2 (see explanation for Table 3.1 in Chapter 3 Research Design and Methods) Within the division of groups, the amenities are divided again into sub group or speciality ( see Table 4.3) . But when running the regression and overlay models, division units that used are Group division.
Table 4.2 Division and Amount of Amenities
Amenities Amount Clothing and Fashion 1183 Computers & Electronic 87 Cultural 299 Daily Supplies 1186 Financial 309 Healthcare 113 Home Supplies 606 Horeca 1798 Recreational 217 Transport Hub 1098 Vehicle Service 415 Other Amenities 231 Other Service 1973 Total 9515
Source: Author (2015) based on Rotterdam Municipality (2012)
The highest number of amenities available in Rotterdam is Other Services amenities for about 1973 units which consist of Post Office, Hair Dresser, Pet Supply, Junkyard and Garage Service, Telecom, Brokerage and Agency, Printing Copy, and et cetera (See Table 4.3). The others highest numbers of amenities are Horeca or Hotel, Restaurant, Cafe (1798), Daily Supply (1187), Clothing & Fashion (1183) and Transportation Hub (1098). The least number of amenities are Computers & Electronic (87), Recreational (217), and Other Amenities (231). All of these amenities is located across city and distribute dispersedly among neighborhoods. Some amenities are located more in the centre such as Clothing & Fashion, Computers & Electronic, Financial, and Home Supplies which usually make the shopping centre area. The others are distributed quite prevalently to support resident needs within residential area. For more distribution of each amenity, see Annex 2 until 5.
33

Table 4.3 Sub division and amount of Amenities
Clothing and Fashion 1183 Horeca 1798 Departement Store 18 Cosmetic and Parfume 59 Café 462 Grillroom/Shoarma 138 Clothes &Shoes 800 Optics 85 CoffeeShop & Night Clubs 90 Hotel 69 Sporting goods 70 Jewelery 97 Delivery / Halen 163 Restaurant 647 Clocks/Watch store 5 Fabrics & Textile 49 Fastfood 220 Other Horeca 9
Computers & Electronic 87 Recreational 217 Computers 47
Park 116 Zoo 1
Electronic 32
Indoor playground 2 Amusementhal 3 Software/Games 8 Fitness 54 Amusement Park 13
Cultural 299 Swimming pool 15 Other entertainment 13 Art, Book &Music 122 Museum 32 Cinema 3 Fair / exhibition 2 Party center 17 Transport Hub 1098 Funeral 1 Party Item Shops 42 Metro Station 46 Bus Stop 896 Galerie 39 Theater 21 Tram Halte 156 Library 23 Vehicle Service 415
Daily Supplies 1186 Bike Shops 75 Gas station 84 Bakkery 182 Minimarket 179 Scooters/motorcycle 6 Boats 7 Butchery 125 Supermarket 136 Car Wash, Parts, Dealer & Reparatie 243 Cheese 23 Tobacconist 115 Other services 1973 Drugstore 109 Toko 128 Post office 19 Telecom 166 Flower / Plant 111 Wineshop 78 Hair Dresser & Beauty Salon 667 Brokerage & Agency 345
Financial 309 Dry cleaning / Laundrette 67 Tailor&Shoe Repair 105 Bank 54 Insurance 2 Junkyard & Garage Service 330 Pictures & Radio/TV Reparaties 112 ATM 161 Other Financial Institutions 16 Pet Salon&Supplies 56 Tatto and Piercings 23 Financial Intermediary 76 Printing / Copy 20 Other services 63
Healthcare 113 Other Amenities 231 Paramedical 16 Hearing aid 4 Hobby 44 Toy Stores 6 Pharmacy 11 Personal Care Other 82 Souvenirs 144 Construction 25 Home Supplies 606 Office Supplies 12 Total 9515
Source: Author (2015) based on data provided by Rotterdam Municipality (2012)
34

Measurement of Proximity and Service Amenities
To attempt measurement, this research conducts an analysis using a geographic information system program named Arc GIS 10.1. The tool to measure proximity is Near tool which is part of Proximity tools. This tool attempts measurement from centroid of 5 digit postcode to the nearest point of amenities. Summary statistic for proximity to the nearest point of amenities is shown in table 4.4. Average proximity to measurement for all type of amenities is 115. 16 Meters whereas the closest distance are 1.88 meters and the most far is 1424.51 meters. According to group, the closest amenities to the centroid is consider as Clothing and Fashion and the most far is Transportation Hub. The very close distance between Clothing and Fashion amenities and residential place has several assumptions. First it can be the people who live close to them, are living in the top of those amenities. It quite often happens in Rotterdam, especially in city centre area where most of ground floor areas are used for commercial functions and sometimes shopping centre. Another assumption is the use of centroid as unit of measurement for residential place. This is considered as spatial aggregation for several individual addresses within 5 digit postcode area. Therefore the very small value of proximity appears because the measurement is conducted from centroid and not from and actual location of address. The use of the postcode centroid is permitted for measurement as it considered as lower level aggregation error prone (Hewko, et al., 2002). The postcode centorid has a lower aggregation error than neighborhood centroids therefore the validity of measurement for the postcode centroid is also higher than that of the neighborhood. However, this research can not quantify the level of aggregation error without actual coordinates from residents’ addressess. Due to confidentiality issue, this data was unavailable and thus become the reason for the use of postcode centroid as representative of residential area.
Table 4.4 Summary Statistic of: Proximity to the nearest point of amenities (in Meters )
Variables Mean Std. Dev. Min Max All type of Amenities 115.16 106.48 1.88 1424.51 Clothing and Fashion 362.72 314.37 2.82 3125.24 Computer and Electronics 706.45 638.11 16.68 4791.26 Cultural 438.50 442.22 7.86 3054.85 Daily Supply 258.05 249.50 1.88 2575.61 Financial 388.08 327.96 17.20 3312.55 Healthcare 449.75 420.24 3.42 3453.65 Home Supply 336.19 295.84 5.24 2738.44 Horeca 214.48 204.91 7.32 2742.31 Recreational 592.12 456.51 12.69 3657.70 Transportation Hub 368.90 1211.07 4.26 9510.46 Vehicle Services 341.24 259.82 12.41 1838.76 Other Services 194.96 172.90 5.74 1534.24 Other Amenities 414.14 375.80 6.88 3241.68
Source: Author (2015) based on Rotterdam Municipality (2012)
Among the groups, the closest average proximity is Other Services for about 194.96 meters (see Table 4.4). It means that there are amenities in this group that has distance less than 200 meters to residential area. The close proximity appears because this group has various numbers of amenities which provide more opportunity to be close to where people live, such
35

as barber and hair salon, pet supply, dry cleaning, telecom, brokerage and agency, tailor, and et cetera ( see Table 4.3). These amenities are usually located dispersedly followed the location of residential area, therefore average proximity of them is quite small. Furthermore, other amenities that appear have close distance are horeca and daily supply. There are very in accordance with logic and theory about distribution of amenities (Haugen and Wilhemson, 2013; Hewko, et al., 2002) that suggest these types of amenities quite important for basic need, therefore their locations should be close to where people live to increase high accessibility for people. It is also means that, on average Rotterdam has adequate distributions of basic need amenities; daily supply and horeca which support adequate and sustainable urban form. People do not need to travel a lot and save more energy by easy access to these amenities.
On the other hand, the furthest average proximity is Computer & Eletronics which has distance around 706.45 meters. In fact, in Rotterdam most of Computer & Eletronics stores are big store which usually take place in shopping area or more in commercial area. This cosnderably create “far” distance between residential area and these amenities. However, the other furthest amenities are Recreational (592.12 m), Healthcare (449.75 m) and Cultural (438.50 m) amenities. Most of those amenities are available in fewer amount rather than other amenities which may become the reason for average far distance of them. Furthermore, when observing average proximity of all amenities it can be seen that Rotterdam attain quite close distance among amenities and the residential area. There is mostly less than 1000 meter away. For basic supply amenities the average proximity indeed reaches less than 500 meters. Since the city is supported with good public transport and considerable bike system, the fine distribution of those amenities promote close accessibility and compact urban form of Rotterdam
Figure 4.2 Diagram Scatter of Happiness and Proximity
Source: Author (2015) based on Rotterdam Municipality (2012)
12
34
HAP
0 500 1000 1500DIST_ALL
36

Figure 4.2 describes scatter plot distribution of happiness and proximity. As can be seen, most of residents are living in close proximity to amenities, approximately less than 500 meters from their residential area. These residents also have quite prominent happiness level as it shown in the diagram that only few of residents are in level 2 and less than 2. According to diagram above, description of happiness level in Rotterdam is quite high. The reason is limited number of respondents drawn in this research and aggregation to postcode level that reduce number of respondents. The results from the sample indicated few people that have low level of happiness while happier residents was captured as the majority result. For happiness distribution, see Annex 1. Happiness Level per Neighborhoods
Table 4.3 describes summary statistics of service amenities measurements. In 300 meters average numbers of amenities is 168 amenities, which some postcodes considered has no units and the others attain until 1033 units in surrounding. Among the groups, the highest number of amenities is Clothing and Fashion (262), followed by Recreational (263), Financial (103) and Other Services (157). In 600 meters, average numbers of amenities is 312.6 units, which some postcodes considered has no amenities and the others attain until 1503 amenities in surround. Among the groups, the highest number of amenities is Clothing and Fashion (425), then followed by Horeca(389), Other Services (264), and Daily Supply (150).
In 900 meters, average numbers of amenities is 557 units, which some postcodes considered has no amenities and the others attain until 2184 units in surround. Among the groups, the highest number of amenities is Horeca (542), followed by Clothing and Fashion (508), and Other Services (445) and Daily Supply (229). Lastly, in 300 meters, average numbers of amenities is 45.91 or 46 amenities, which some postcodes considered has no amenities and the others attain until 418 amenities in surround. Among the groups, the highest number of amenities is Clothing and Fashion (168), followed by Horeca (84) and Other Services (66).
This summary indicates some amenities always appear as the highest amount in every spatial scale. They are Clothing and Fashion, Horeca, and Other Services. Daily supply also appears pretty often but not that much than the previous ones. It can be explained these amenities are the most available within local access in Rotterdam. Most of residents live close with them and have easy accessibility by walking or bike. Eventhough there some postcode areas without amenities available in their surroundings, these amenities remain quite accessible because of sufficient public transports and walkable pedestrian system.
37

Table 4.5 Summary Statistic of: Number of Amenities within spatial scale (Service Amenities)
Variable 300 Meters 600 Meters 900 Meters 1200 Meters
Mean Std. Dev. Min Max Mean Std. Dev. Min Max Mean Std. Dev. Min Max Mean Std. Dev. Min Max
All type of Amenities 45.91 54.16 0 418 168.0 164.3 0 1033 344.92 312.60 0 1503 557.53 490.29 0 2184 Clothing and Fashion 5.86 16.81 0 197 21.1 41.5 0 262 46.26 72.92 0 425 77.30 108.25 0 508 Computer & Electronics 0.50 1.06 0 9 1.8 2.7 0 15 3.76 4.52 0 22 5.93 6.57 0 31 Cultural 1.50 2.46 0 16 5.9 7.6 0 15 11.94 13.68 0 65 19.44 21.21 0 90 Daily Supply 6.79 7.94 0 41 23.8 21.2 0 40 46.55 37.96 0 150 72.50 56.84 0 229 Financial 1.40 2.05 0 18 5.4 5.4 0 103 10.97 9.60 0 49 17.68 14.78 0 65 Healthcare 0.58 0.79 0 5 2.0 1.6 0 38 3.92 2.54 0 11 6.11 3.67 0 15 Home Supply 3.15 4.58 0 28 11.4 12.6 0 8 23.18 22.36 0 89 36.63 32.37 0 126 Horeca 9.08 12.46 0 84 33.6 40.7 0 56 69.38 79.26 0 389 114.19 125.63 0 542 Recreational 0.63 2.73 0 48 2.3 5.0 0 263 4.83 7.42 0 57 7.81 9.60 0 58 Transport Hub 3.57 2.89 0 19 13.5 7.2 0 39 27.92 13.57 0 69 46.01 21.17 0 101 Vehicle Services 1.27 1.87 0 14 5.1 4.6 0 25 10.87 7.76 0 33 17.98 10.98 0 40 Other Services 10.45 12.37 0 66 38.0 37.2 0 157 76.64 69.30 0 264 121.98 105.97 0 445 Other Amenities 1.13 1.69 0 16 4.2 4.6 0 30 8.71 8.50 0 44 13.99 13.27 0 58
Source: Author (2015) based on Rotterdam Municipality (2012)
38

4.2. Happiness and Proximity
Regression Model: Happiness and Proximity to the nearest point of Amenities
As it mentioned in Chapter 3 Research Design and Method, this research used Multivariate Regression Analysis or Ordinary Least Square (OLS) to build the models. The first model was build to test whether proximity to the nearest point of amenities has significant relationship to happiness level of residents in Rotterdam. Based on the equation of multivariate regression, the amount of Yvariable or happiness level depends on the sum of several X variables. Therefore, instead of testing one single independent variable with the dependent, this research combines all variables in one multivariate regression to gain convincing results from interaction of each variable. Furthermore, since in reality all those amenities are located close to the other, the impact to the dependent variable is caused by more than one group of amenities. Thus, testing all variables together involve this aspects considerably.
For the first models, this research develops three types of different sub-models in order to discover variance among cultural diversity. In the first sub model, the regression is testing the dependent variables: happiness from all respondents, which has 840 number observations. For the second and third, the models were separated by Dutch with 659 observations and Non-Dutch residents with 181 observations to indicate variance results among them. When checking the R-Square, the models show quite small value, approximately less than 10 percent. It is understandable because the purpose of this model is testing happiness with one single aspect that is proximity. In reality happiness itself have wide variety of determining factors rather than only proximity as physical aspect of urban quality of life. Although the proximity itself was elaborated into several groups or variables, the basic principal of this model is still proximity.
The models used 20 variables which are 6 of them are control variables (See Table 4.6). This control variables are important to be considered because they give control to each characteristic of the individual that may differ the findings significantly. The control variables are number of respondents, ethnicity, age, gender, paid job status, and household composition. The main reason of using paid job status instead of income level was simply because of practical issue. When testing only control variables and the happiness, both income and paid job status shown very signicant relationship result. However, when testing for both control and independent variables, income precisely lead into not appropriate statistical model. It might because of data errors from income status itself or the fact that income data was arranged in categorical type from survey result (Rotterdam Leisure Survey) which has immense possibility not represent real income status. Whereas paid job status has lighter scoop than income in describing welfare condition thus generate more appropriate model for this research. Therefore, Paid Job Status was considered more applicable to be used in this model.
The independent variables are proximity 14 group of amenities (see table 4.2), whereas one group; All type of amenities is proximity that measured from postcode centroid to the nearest point of all type of amenities. Thus, there are no distinctions of what type of amenities that located near residential area. This measurement aims to understanding the closeness of people with their amenities. However, it does not indicate real necessity from people to their amenities because some amenities should not considered need to be located nearby for some people, but some amenities do. Therefore this measurement merely aims to test the influence of proximity itself to resident’s satisfaction.
39

On the other hand, proximity to other group of amenities emphasizes deeper analysis between closeness and kind of amenities that might be assumed more important than the others. The aim of this test is to derive better understanding of the relationship among various amenities and resident’s well being. Each type of amenities has different effect to people’s consideration based on their necessity and preferences.
Table 4.6 Regression model of: Happiness and: Proximity to nearest point of amenities
Variable Result
All Residents
Dutch
Non-Dutch
Ethncity (CV) -0.12781 *** -
-
(-0.03203)
Number of Respondents (CV) 0.00220
0.0024
0.00042
(0.00210)
(0.0021)
(0.00796)
Gender (CV) -0.04222
-0.06876 ** 0.04695
(0.02862)
(0.03175)
(0.07085)
Age (CV) -0.00219
-0.00189
-0.00812
(0.00224)
(0.00237)
(0.00735)
Paid Job (CV) -0.08198 *** -0.05803 ** -0.14888 **
(0.02366)
(0.02674)
(0.05255)
Household Composition (CV) 0.04129 ** 0.05302
-0.00482
(0.01841)
(0.02079)
(0.04095)
All type of Amenities 0.00002
0.00004
0.00055
(0.00023)
(0.00023)
(0.00112)
Clothing and Fashion 0.00012 * 0.00014 * -0.00009
(0.00007)
(0.00007)
(0.00020)
Computer and Electronics 0.00007
0.00007 ** 0.00010
(0.00003)
(0.00004)
(0.00015)
Cultural 0.00003
0.00003
0.00005
(0.00005)
(0.00006)
(0.00021)
Daily Supply 0.00012
0.00011
0.00041
(0.00010)
(0.00011)
(0.00051)
Financial -0.00004
-0.00007
-0.00012
(0.00007)
(0.00008)
(0.00026)
Healthcare -0.00001
0.00000
0.00014
(0.00006)
(0.00006)
(0.00023)
Home Supply -0.00001
0.00000
-0.00018
(0.00009)
(0.00010)
(0.00036)
Horeca -0.00030 ** -0.00026 ** -0.00086
(0.00013)
(0.00013)
(0.00062)
Recreational -0.00006
-0.00009 * 0.00004
(0.00005)
(0.00005)
(0.00015)
Transportation Hub 0.00001
0.00000
-0.00023
(0.00001)
(0.00001)
(0.00045)
Vehicle Services -0.00008
-0.00005
-0.00004
(0.00007)
(0.00008)
(0.00025)
Other Services 0.00015
0.00016
-0.00058
(0.00015)
(0.00015)
(0.00066)
Other Amenities 0.00004
0.00002
0.00043
(0.00006)
(0.00007)
(0.00026)
R2= 0.0633 R2 =0.0556 R2 = 0.1429
n = 840
n = 659
n = 181
* p<.01, ** p<.05, *** p<.001
Source: Author (2015) model analysis
40

Findings
Results from the first model shows that for all residents ethnicity, paid job status and household composition appear as significant control variables to happiness (See table 4.6). The results show that for ethnicity, the relationship is negative with coefficient value is -0.127. It means being Non-Dutch will decrease the opportunities to be happier. It is also applied for paid job status, which has negative significant relationship with coefficients value -0.082. It means having non paid job status makes people unhappy. This result is in line with previous findings that discover wages has a prominent significant level to happiness. Having higher income, to some extents, has considerable impact in increasing chances to be happier. The significant level of those two variables is in upper level with P values less than 0.001. In contrast with ethnicity and paid job status, household composition has negative significant relationship with happiness. The categories of household composition are 1 – live alone; 2- adults without children; 3- couple with children living at home; 4-single parent with children living at home. The coefficient value is 0.004 with P value less than 0.05. It means that being not living alone and having children increase opportunity to be happier. Besides depicting household condition, this composition also controls resident’s needs and preference to amenities that available in their living are.
These control variables indeed influence the interaction of happiness and proximity. Most of significant control variables determine kinds of daily activities which may have existed, hence raise the important of proximity to the residents. Having paid job determines mobilization and neither for household composition. People with children and office hour job tend to live more in residential area and decrease the chances to live close to abundant of amenities. Moreover, refer to ethnicity factors, being non-Dutch have less ability to choose residences due to some cultural and socio-economic boundaries. They usually reside close to daily supply and horeca amenities which sufficiently support their daily basics, for example Halal supermarket, Asian groceries, Indian party shops, or Surninamse Indisch restaurant.
Hereafter, results for independent variables shows that proximity to all amenities has no significant relationship. It means that people do not consider a lot to proximity from their place to amenities their need. However, the significant result may exist due to a measurement for all amenities. It can be explained when checking the other proximity to different groups of amenities. Clothing and Fashions amenities have a negative significant relationship that means people with closer distance to these amenities are less happy. The coefficient value is quite small and neither with the significant level. In line with Clothing and Fashion, Computer and Electronics also has a positive relationship that means people with closer distance to these amenities are less happy. The explanations for positive relationship for Clothing& Fashion, and Computers and Electronics is those amenities are usually appears in shopping centre area which means living close to shopping centre is more crowd and less convenience, therefore people tend to be less happy. For residents who live near these amenities but not within the central area may consider fun shopping in central rather than the ones within their surroundings. They prefer to have other amenities such as Horeca which shows a negative significant relationship to happiness. In other words, residents in Rotterdam prefer to have Horeca rather than Clothing& Fashion, and Computers and Electronics amenities and those apperarntly increases the chances to be happier. Apart from that, these results may happen due to data eror or limitation on using the methods which become one of important limitation issue in this research.
When testing sub models for cultural diversity, the result show amenities that have significant relationship in previous sub-models also appear in this sub-model. Moreover, one more group
41

of amenities appears significant. Recreational amenities have negative relationship for Dutch residents. The coefficient value is -00009 and significant level is less than 0.1. It means the in raising of 0.009 percent of proximity to Recreational amenities, it decrease 1 percent of residents level. Or on the other words, the Dutch consider living close to Recreational and thus make them happier. However, for the Non-Dutch Residents only paid job status show significant relationship while all groups of amenities shows insignificant relationship. It means proximity to amenities does not influence happiness of non-Dutch residents. It also reveals that having a job become more important than any other factors in determining Non-Dutch happiness. It is logically simultant to the main reason of non-Dutch arrivals to this country, which usually attach issue of job or getting better welfare.
While developing the models, this research had combined and omitted variables that show insignificant relationship. However, those insignificant variables helped created models with appropriates results. It might happen since all predictors in these models develop interactions among each other. This interaction describes real condition how amenities exist among people and their living area. To avoid multicolineality, this model has attempted vif check. The result indicates no overlap predictors among all variables. Therefore, instead of omitting some insignificant variables, this model choose to keep them for the regression and thus generate appropriate result as can be seen in Table 4.6
Spatial Distribution
According to Figure 4.3, distribution map of proximity to nearest point of amenities, the area with less proximity are around city central. It is obvious that most of amenities in Rotterdam is located centrally, but still well distributed. Most of the areas are having proximity to amenities less than 300 meters. It is mean that most of the areas are quite accessible for people to catch their amenities nearby. The area which has proximity more than 1200 is Noord Kethel that located in the edge of the city. Usually in peripheral area, residential density is lower with more agricultural land use and less number of people that need close access to amenity. The spatial distribution of each variable can be seen at Annex 2 until Annex 5 (Maps of proximity to group of amenities).
Discussion
As explained in findings part, these models indicate that proximity not always matter for predicting happiness of residents in Rotterdam. This empirical result is concordant with other findings from previous research. Haugen (2011) in her research topic “the advantage of near” explain that the importance of proximity to relevant destinations may be considered in terms of its ‘practical’ quality as a facilitator in everyday life, since it reduces the need for travel. Furthermore, people may also want to be in proximity to destinations which represent ‘things’ which are important in the larger picture of life. Moreover, to the extent that proximity from home to relevant destinations is important, it may also affect individuals’ residential quality and satisfaction. However Haugen (2011) also defines that it is possible that proximity may also be regarded as unimportant or even undesirable, concerning destinations that are irrelevant or negatively valued or to which (too much) proximity is not necessarily desirable. Furthermore, in some cases, people may want to have a certain distance between their home and their destination, e.g., their workplace (Mokhtarian & Salomon 2001; Sandow & Westin 2010). This far distance perhaps is chosen to maintain mobility and activity. Living at just the ‘right’ distance – whether near or far – to relevant destinations perhaps represents an optimal residential location. Since reality often does not cater to attaining such ideal conditions, residential location becomes a compromise by which some
42

preferences are traded off and others are prioritized. Therefore, living close to amenities is not always satisfying people. In Rotterdam case, it indicates those empirical results.
Hereafter, when examining proximity to certain group of amenities, the models show variance results. It is clear that proximity to Horeca and Recreational amenities influence that happiness level of residents in Rotterdam. Recreational amenities in this case consist of parks and other sport activities amenities (see Table 4.3), seem considerably important to people preferences. These amenities are the representative of public spaces which important to encourage social interaction among people (Montgomery, 2014). Park itself has physical and psychological benefits for its users. It decrease stress level and become one of favorite place to visit in spare time (Tinsley, et al., 2002). Thus, having a park near the house increase the chances of people to be happier. In line with Recreational amenities, Horeca also has significant relationship to resident’s well-being. Jacobs (1961) urges that bars, restaurant, and café encourage the city more alive. They bring more people and attract local economic development. In other case, Horeca also support the fulfillment of daily basic need for people around. It indicates wide variety of consumer goods thus become one of the most important amenities for people to have nearby (Quiley, 2001). These two happiness predictors are significant and encourage people to live near them or having them close to living area indeed makes people happy.
On the other hand, proximity to Clothing & Fashion, and Computers & Electronics group apparently has a positive relationship to happiness level or negative ways on assigning happiness. It emphasizes significant conseideration from residents to the availability of these amenities. Or in other words, people slightly have a “negative feeling” to these amenities. These amenities usually located within shopping area which caused more “crowded” area. According to some previous research, psychologically people tend to not like being crowded area (Stokols, 2007). Moreover, in Rotterdam case, in some area especially in central shopping area, there are mixed used building uses where ground floors are used as commercials and upper floors as residential area. Some logical think may assume that living close to those amenities provide people with variety choices and makes life much easier. In fact, most of Dutch people choose to live in more quite area, with less noise and density. This may become ultimate reason to support negative relationship between Clothing & Fashion, and Computers & Electronics and happiness level of residents in Rotterdam. Apart from that, the “strange” findings of this model may relates to a possibility of data eror or a limitation on using the methods which become one of important limitation issue in this research.
43

Figure 4.3 Map of Proximity to the Nearest Amenities
Source : Author (2015) based on model analysis 44

4.3 Happiness and Service Amenities
Regression Model of Happiness and Number of amenities within spatial scale
The second model of this research tests the relationship between happiness and service amenities. As mentioned before, service amenities is defined as the number of amenities within certain proximity. The test aims to discover whether numbers of amenities influence happiness level of residents in Rotterdam. Moreover, the results from these models were expected to support explanations from prior findings.
Similar to the first model, this model also attempted multivariate regression analysis by building eight sub models based on spatial scale determined for spatial accessibility (see Table 4.7). Every spatial scale has two sub models which contains different numbers of predictors. One sub-model consists of control variables and one independent variable: numbers of all type amenities within certain proximity while the other sub-model consists of control variables and 13 variables of groups of amenities. The aim of building two different sub models for each spatial scale is to avoid multiconliality when running the regression.
Control variables used in these models are a bit different from the first one. Number of respondents was omitted while crime rate as new variable was added. The reason to add this new variable is to control factors that may influence people preference in having amenities around their living place. Besides, crime rate also associated strongly with density issues that may also have an impact on predicting happiness. There are no different numbers of observations among those eight sub models. The R-Squares of these models remains less than 10 percent. This may caused by the models that test only two major factors. Since the happiness predictors are diverse, testing one factor clarify only small parts of the relationship. Therefore, a small value of R-Square in this research is quite understandable.
Findings
Similar to findings in prior models, Ethnicity, Paid Job Status and Household Composition appear as significant variables to happiness. The signs are also equals but coefficient value of each variable is getting higher (see table 4.7). However, additional variable crime rate shows no significant relationship. It may does not have significant influence but put down this variable in the models help the regression execute more logical results. Furthermore, for independent variables, numbers of all type of amenities in spatial scales shows negative significant relationship. This means that more amenities in people’s surroundings make them less happy. For 300 meters the coefficient value is -0.0005, 600 meters is -0.0002, 900 meters is -0.0001 and 1200 meters is 0.0001. These numbers describe how the increasing number of amenities in those amount will decrease 1 percent opportunity of people to be happier.
Results for groups of amenities explain different findings. Each spatial scale indicates different significant predictors. For 300 meters, groups of Recreational and Vehicle Service amenities show positive relationship to happiness. While the other groups indicate no significant results. The coefficient value for Recreational is 0.010 and Vehicle Amenities is 0.017. Although the coefficient value of Recreational is lower than Vehicle Service, significant level of those predictors is reverse. Recreational has higher significant level which is less than 0.005, whereas the Vehicle Service has less than 0.1. Those numbers explain that people are tend to be happier when having more number of recreational and vehicle amenities within their 300 meters surroundings. For 600 meters spatial scale, regression results indicate different significant type of amenities. Financial shows negative signs while Other Amenities shows positive. The coefficient value is -0.010 for Financial and 0.0015 for Other Amenities.
45

Their significant level are similar which has value less than 0.1. These findings explain that within 600 meters of their surroundings, people are happier when having more Other Amenities and but less Financial amenities. For 900 and 1200 meters, the amenities that have significant relationship are Cultural, Daily Supply and Other Service which appear in both sub models. The sign of Cultural is negative whereas, Daily Supply and Other service are positive. The significant level for each variable is getting stronger in scale 1200 meters, means that within this spatial scale the relationship of these predictors is also getting stronger. For Cultural amenities, people seem to be less happy when having more these amenities within 600 and 1200 meters. In contrast, having more Daily Supply and Other Amenities encourages people to be happier. Interesting findings for these two spatial scales generates similar significant predictors. It emphasizes these spatial scales as more substantial distance for consideration when analyzing the accessibility of amenities.
Spatial Distribution
Spatial distribution for each spatial scales indicates almost similar pattern (see Figure 4.4; 4,5; 4.6; 47) City central area show more dense amenities and decreasing for further area. The neighborhoods that have more dense amenities are Stadsdriehoek and Cool. These spatial patterns are in accordant with happiness distributions, where happier neighborhoods are located further than city central. Moreover, the spatial patterns also depict Rotterdam’s urban structure especially for the distribution of urban amenities. Rotterdam apparently shape more centralized amenities to provide more population in city central area. Spatial distribution of service amenities for each amenity can be seen in Annex 6 until 15 (Maps of groups of amenities within spatial scales).
Discussion
As mentioned in the findings, numbers of all amenities within all spatial scales show a negative relationship to happiness. It means, people tend to less happy when they have more amenities in their surroundings. These finding is contrast with some arguments about amenity supply. Handy (1992) urges that some People chose to live in places where the land use patterns are characterised by an abundance of local amenities – e.g., ‘compact’ urban areas with high population and amenity densities may be expected to have little need to travel further than ‘around the corner’, while travel over longer distances may be a prerequisite for accessing amenities in places where there are fewer options to choose nearby. For some area, the supply of amenities is often large, complex and varied, and specific and differentiated individual preferences presumably make people selective in their destination choices (Schenk et al., 2007). However, as argued by Reimers and Clulow (2004, p. 207) ‘rising levels of consumer awareness, affluence and mobility have helped create a more discerning customer’, who is often willing to travel further in order to reach adequate amenities. This means, people who have more resources are willing access further distance for their amenities rather than enjoy what already available in their surroundings. This might happen according to socio-economic differentiation. However, there also some people with lack of mobility prefer to access amenities in vicinity although there are limited choices available (Haugen, 2012). Therefore, having various and rigorous numbers of amenities near the living place does not always have a positive impact.
Furthermore, an argument that may support findings above is, in some cases dense amenities represent crowd and business which attract more crime. Results from the models indicate that although it does not appear to be significant but the existence itself within models gave considerable impact to generate better results. This can be explained by the arguments that
46

streets and sidewalks could be effective deterrents to criminal behavior (Jane Jacobs (1961). Other research also found that hypothesized that structural density, the degree to which an area is crowded with buildings, would be positively related to crime due to its ability to impede those same social controls (Sampson, 1983). Besides the inconvenience situation caused by dense amenities, higher numbers of amenities generate more crowded conditions and hence provide more opportunities from crime to be happened. This might be the reason why people tend to be unhappy when living with more amenities.
Nevertheless, when turned into specific groups of amenities, the results show a variance of relationship. Most of them indeed have positive relationship. For example, in 300 meters scale having more Recreational and Vehicle Service amenities increase chances of being happier. It is in concordant with findings in prior models which indicate Dutch people in Rotterdam consider to live close to park rather than other amenities. This is in accordance with the opinion from Beatley and Manning (1996), that in some cities, public parks “are among a community’s most highly valued assets, not simply for their greenery, but also for the opportunity they afford for organized or spontaneous contact with other community members”.
Another interesting finding is significant predictors in 900 and 1200 meters scale. The predictors appear twice with similar sign but stronger significant level for the last scale. It can be assumed that in 1200 meters scale, people consider to give a positive regard and utilize the amenities quite well. Furthermore, these specific Daily Supply and Other services are amenities that very common located around neighborhood and evidently give positive effect on people’s satisfaction in Rotterdam. As like Oldenburg (1999) emphasizes the importance of cafes and pubs, and community centers. Local restaurants or corner grocery shops or even barbershops or hair salons may also be important (Jacobs 1961). These “third places” represent a “great variety of public places that host the regular, voluntary, informal, and happily anticipated gatherings of individuals beyond the realm of home and work” (Oldenburg, 1999). Such places are prerequisites for cities and city neighborhoods because they promote social connections and personal well-being (Oldenburg 1989, also see Taylor, Kuo, and Sullivan 1998; Leyden 2003; Burns 2005; Rogers et al. 2010). Therefore, according to the results, daily supply and other amenities should be considered as important part of urban design specifically when assigning amenities for residential service. The spatial scale of 900 and 1200 meters also need to be substantially highlighted as adequate accessible distances for people to access their amenities without decreasing their happiness with the surroundings.
The result that may clash with the theory proposed before is Cultural amenities, which surprisingly have a negative effect on happiness in Rotterdam. As Leyden (2011) mentioned, one of happiness predictors from urban amenities aspects are accessibility to culture and leisure activity and also libraries. It was expected to increase personal well-being in term of increasing awareness in educational and cultural aspects. However, negative relationship in Rotterdam case can have double meanings. First, it can be assumed that living with variety cultural amenities in the surroundings decrease the chance to be happier. It is may predicted by the condition that cultural amenities in Rotterdam is located within commercial and business area which turn into not favorite living place. It may cause unfriendly neighborhood situation. The other possible reason involves the sense of the existence of these amenities through city level. When realizing that enough cultural amenities exist within the city, the positive feelings appear to be dominant, whereas without enough libraies or museums the city seems to have a negative sense for these amenities. Or in other words, it is appearantly enough by only “seeing” without having these amenities around the residents.
47

Table 4.7 Regression Model for Independent variable: Number of amenities within spatial scale
Variables
Result
300 Meters 600 Meters 900 Meters 1200 Meters
Ethncity (CV) -0.1303 *** -0.1384 *** -0.1294 *** -0.1315 ** -0.1320 *** -0.1369 *** -0.1359 *** -0.1522 ***
(0.0375)
(0.0393)
(0.0374)
(0.0386)
(0.0372)
(0.0384)
(0.0372)
(0.0384)
Gender (CV) -0.0396
-0.0467
-0.0378
-0.0402
-0.0366
-0.0406
-0.0363
-0.0384
(0.0283)
(0.0293)
(0.0282)
(0.0289)
(0.0282)
(0.0280)
(0.0282)
(0.0284)
Age (CV) -0.0017
-0.0008
-0.0027
-0.0025
-0.0036
-0.0037
-0.0032
-0.0036
(0.0022)
(0.0029)
(0.0024)
(0.0034)
(0.0024)
(0.0034)
(0.0024)
(0.0036)
Paid Job (CV) -0.1048 *** -0.0968 ** -0.1038 *** -0.0995 ** -0.1057 *** -0.1080 ** -0.1075 *** -0.1225 ***
(0.0301)
(0.0322)
(0.0300)
(0.0320)
(0.0300)
(0.0316)
(0.0300)
(0.0316)
Household Composition (CV) 0.0464 ** 0.0463 ** 0.0463 ** 0.0431 ** 0.0460 ** 0.0434 * 0.0465 ** 0.0371 *
(0.0204)
(0.0222)
(0.0203)
(0.0222)
(0.0203)
(0.0226)
(0.0203)
(0.0225)
Crime (CV) 0.0000
0.0000
0.0000
0.0000
0.0000
0.0000
0.0000
0.0000
(0.0000)
(0.0000)
(0.0000)
(0.0000)
(0.0000)
(0.0000)
(0.0000)
(0.0000)
All Amenities -0.0005 *
-0.0002 **
-0.0001 **
-0.0001 **
(0.0003)
(0.0001)
(0.0001)
(0.0000)
Clothing and Fashion
-0.0016
0.0000
-0.0005
-0.0005
(0.0012)
(0.0008)
(0.0007)
(0.0005)
Computer and Electronics
0.0087
-0.0104
0.0069
0.0100
(0.0217)
(0.0110)
(0.0085)
(0.0081)
Cultural
0.0068
-0.0068
-0.0064 *
-0.0075 **
(0.0085)
(0.0046)
(0.0039)
(0.0035)
Daily Supply
-0.0020
-0.0002
0.0044 *
0.0048 **
(0.0034)
(0.0024)
(0.0018)
(0.0016)
Financial
-0.0095
-0.0103 *
-0.0025
-0.0005
(0.0087)
(0.0056)
(0.0038)
(0.0034)
Healthcare
-0.0141
-0.0035
0.0078
0.0095
(0.0196)
(0.0110)
(0.0038)
(0.0084)
Home Supply
0.0005
0.0052
-0.0013
0.0010
(0.0058)
(0.0032)
(0.0029)
(0.0023)
Horeca
0.0020
0.0001
0.0015
0.0023 **
(0.0022)
(0.0012)
(0.0010)
(0.0009)
Recreational
0.0100 **
0.0030
0.0009
-0.0002
(0.0043)
(0.0032)
(0.0020)
(0.0016)
48

Variables Result
300 Meters 600 Meters 900 Meters 1200 Meters
Transportation Hub
-0.0056
-0.0018
-0.0025
-0.0011
(0.0044)
(0.0024)
(0.0016)
(0.0012)
Vehicle Services
0.0170 *
-0.0033
0.0011
-0.0025
(0.0088)
(0.0055)
(0.0036)
(0.0031)
Other Services
-0.0031
-0.0004
-0.0037 **
-0.0044 **
(0.0032)
(0.0017)
(0.0015)
(0.0014)
Other Amenities
0.0068
0.0115 *
0.0089 *
0.0007
(0.0121)
(0.0068)
(0.0050)
(0.0047)
R2 = 0.0347
R2 = 0.0610
R2 = 0.0366
R2 = 0.0610
R2 = 0.0393
R2 = 0.0677
R2 = 0.0393
R2 = 0.0772
No of Observation : 840 * p<.01, ** p<.05, *** p<.001
Source: Author (2015) model analysis
49

Figure 4.4 Map of Number of Amenities within 300 meter
Source: Author (2015), based on model analysis 50

Source: Author (2015), based on model analysis
Figure 4.5 Map of Number of Amenities within 600 meter
51

Figure 4.6 Map of Number of Amenities within 900 meter
Source: Author (2015), based on model analysis 52

Figure 4.7 Map of Number of Amenities within 1200 meter
Source: Author (2015), based on model analysis 53

4.4 Overlay Happiness and Amenities
The overlay model is the last model that were developed to answers questions of this research. The model basically combines all variables which have significant relationship with happiness, both positive and negative. It is basically a combination of average value between happiness and amenities scores. The overlay is intended to catch sense of residents about their surrounding without leaving out the happiness level as the ultimate aspect. The Overlay itself was attempted by Arc GIS with weighing / scooring technique. The process started with creating score of each variable according to the sign. The positive sign has increasing the score while the negatives are opposite. The last step is calculating all the score from each variable and generating total score. This total score becomes new degree that called satisfaction degree of residents with their surroundings.. Afterwards, the degree is elaborated into three levels: low, moderate, and high. Each level has summary of average for each significant variable to attain enhance better understanding of each area. Furthermore, this overlay also becomes a summary of two prior models related to discovering a relation between proximity and happiness within the Rotterdam case.
Findings
Overlay results indicate several interesting findings (see Table 4.8). Average condition for control variables appears similar to all degree. Most people living in those areas are Dutch, with having paid job status. Household composition of those residents is mostly adult with no children. The lowest average crime rate events is in high degree with 796 events, followed by moderate degree with 943 events, low degree with 2721 crime events in a year. This condition explains the association with a higher crime rate and less happiness.
Furthermore, average proximity to groups of amenities indicates variance findings (see Table 4.8). Proximity to Horeca appears to be the lowest proximity compare to other groups. In high satisfaction degree the proximity is around 266 meters in getting further in moderate level with 322 meters. However, in low satisfaction degree, the proximity is even lower than other two degrees. It also applies for other groups of amenities; Recreational, Clothing &Fashion, and Computer & Electronics. It has quite close distance to recreational amenities compare to other degree level, for about 492 meters. It should encourage the area not to be the lowest satisfaction degree if it follows the findings from prior models. However, when turning to high and moderate degree, the average proximity tend to in accordance with prior findings, especially for Clothing & Fashion, and Computer & Electronics that indicates further distance as better influence. For the low satisfaction degree, proximity seemingly has weak association on influencing happiness. Further exploration is needed to unearth realistic aspects that bolster effects on happiness and satisfaction with their surroundings.
More elaborations to other predictors are that some predictors have followed findings in prior models. It is obvious that greater numbers of amenities decreases happiness levels. Increasing number of amenities in all spatial scale is followed by decreasing satisfaction degree. In high satisfaction degree, the average number of amenities within 300 meter is 7, within 600 meters is 97, within 900 meters is 229, and within 1200 meters is 399. These numbers depict satisfying conditions of people with numbers of amenities within their surroundings.
Lastly, defining within groups of amenities, aspects of amounts seemingly does not fully follow the relationship to happiness. For example, all three satisfaction degree has only one recreational and vehicle service within 300 meters. Moreover, amount of daily supply and other service are higher in low satisfaction degree where it should be higher for high
54

satisfaction degree. Amount of cultural amenities apparently exceed its coverage service hence determine the area to be in lower satisfaction degree. This model should discover more attention for low satisfaction degree regarding to stronger happiness predictors. However, concerning conditions that emphasize high and moderate degrees might also be useful to catch standard degrees for neighborhoods that hold a higher satisfaction degree
Table 4.8 Satisfaction Degree of residents with their surroundings (Overlay Result)
Variables Unit Average Value
High Moderate Low
Happiness 3-4 1-3 1-2 Control Variables
Ethnicity - Dutch Dutch Dutch Paid Job Status - Have Paid Job Have Paid Job Have Non- Paid Job
Household Composition - Adults, No Children
Adults, No Children Adults, No Children
Crime Rate Number of Event 796 943 2721
Proximtiy to Group of Amenities
Proximity to Horeca Meters 266 322 139 Proximity to Recreational Meters 575 807 492 Proximity to Comp&Elect Meters 689 960 733 Proximity to Cloth&Fashion Meters 880 498 182 Number of services for All Amenities
Amenities within 300m Units 7 37 123 Amenities within 600m Units 97 146 376 Amenities within 900m Units 229 312 748 Amenities within 1200m Units 399 522 1210 Number of service for Group Amenities
Vehicle Service within 300m Units 1 1 1 Recreational within 300m Units 1 1 1 Financial within 600m Units 3 5 11 Other Amenities within 600m Units 3 3 9 Cultural within 900m Units 13 11 32 Daily Supply within 900m Units 79 61 77 Other Service within 900 m Units 54 68 136 Cultural within 1200 m Units 13 19 51 Daily Supply within 1200 m Units 55 66 111 Other Service within 1200 m Units 92 112 223
Source: Author (2015) model analysis
Spatial Distribution
Spatial distribution of the overlay result shows that most of the high degree neighborhoods are located not in the city central area (see Picture 4.8). They are apparently spread out to peripheral area that indicates locations for more residential rather than commercial or business area. Furthermore, Table 4.9 shows list of neighborhood with the satisfaction degree that highlights 9 neighborhoods in each satisfaction degree. Blijdorp appear as the neighborhood with the highest satisfaction degree, followed by Bergpolder , Oude Charlois, and Molenlaankwartier. Most of high degree neighborhoods are located in northern are.
55

Blijdorp seems to be neighborhood with close enough distance to city central but having quite and more residential functions. Kralingse Oost and Kralingse West which are known as a fancy neighborhood with a nice used park and natural lake look dominate the high satisfaction degree areas. They are apparently are getting positive influences by the the amenities and the surroundings. In contrast, the low satisfaction degree neighborhood mostly is located in central area. For example, they are Stadsdriehoek, Cool, Oude Westen. The location is adjacent to the river area which has high traffic and more high rise buildings. Highlight for the best neighborhood, Blijdorp is located in north area and not too far from central. The neighborhood is typical Dutch residential area with less crowd traffics and low crime rate. The accessibility to the nearest amenities is quite sufficient and provided by adequate transportation hub. This area has Rotterdam central station as main transport hub and bus stop as supportive hub. In sum, according to the overlay result, high satisfaction degree areas incline to residential function that equates with quiet and peaceful locations with sufficient amenities in their surroundings. While the low satisfaction degree areas tend to represent more crowded areas with commercial and business functions.
Table 4.9 Satisfaction Degree by neighborhood (Overlay Result)
No High Moderate Low 1 Blijdorp Groot IJsselmonde Stadsdriehoek 2 Bergpolder Hillesluis Cool 3 Oud Charlois Nieuwe Westen Oude Westen 4 Molenlaankwartier Oude Noorden Schiebroek 5 Kralingen Oost Vreewijk Ommoord 6 Hillegersberg Zuid Hoogvliet Zuid Cs Kwartier 7 Hoogvliet Noord Tarwewijk Dijkzigt 8 Kralingen West Ommoord Middelland 9 Liskwartier Middelland Nieuwe Werk
Source: Author (2015) model analysis
Discussion
The satisfaction degree represents how people perceive their surroundings with regard to their happiness. It attach quite well with a personal preference. To be more precsise, it is obvious that accessibility to amenities in individual level needs and/or wishes should be understood as subjective and relative, implying that individual preferences must be accounted for their choice (Haugen and Vilhemson, 2013). The residential preference becomes important issue to understand this empirical result. Some notion had clearly define that the place of living not only fulfils the purpose of dwelling but also provides, e.g., social context and access to services and facilities, and is therefore of great importance in life (Vera-Toscano & Ateca-Amestoy 2008; Fleury-Bahi et al. 2008). The other mentioned that people seek residential locations that aid them in fulfilling values or goals in the different stages of their lives (Fransson et al. 2001), and the relative importance of residential qualities/amenities vary across the life course. For instance, individuals with children tend to value greenspace and recreational opportunities, while individuals without children prefer residential locations that offer convenience, e.g., in terms of access to services (Kim et al. 2005b).
It can be seen from the overlay model that high satisfaction degree areas are found in more neighborhoods with residential functions. The choice of this function is preferably subjective but represents their happiness level although not fully. This empirical result from this
56

research shows that some happiness predictors can be either increasing or decreasing happiness level. However, reading the sign can be mistaken when turning to spatial distribution. Some area with high satisfaction degree could be already having the residents with adequate socio-economic status. They might have good income and job with stable household condition that provide opportunities to choose where they live and what kind of amenities they need in the surroundings. Since, individual characteristic has stronger influence to happiness, the association between amenities and happiness become slightly bias. It may apply reverse version for low satisfaction degree. Poor life condition may influence less happiness without consider where people resides and what they have in surrounds. On the other hand, having unfriendly neighborhood proved to have physiological impact in decreasing resident’s happiness (Blaire &Wheaton, 2013). The link between physical surround and personal well being is quite obvious in this stage. Therefore, it should be understood that considering what kind of amenities exist in surround indeed has impact in influencing life satisfaction. But deeper concern should be taken to discover how far it attach the happiness issues compare to other predictors. Other substantial notion that clarifies these results is rerefering to appropriate closeness and amount of service amenities within residential area. It can not partially understand that having more and close amenities decrease happiness. Indeed, it reveals the situation of “close but not too close or far but not too far” which generates more convenience living conditions. Amenities should be available and easily accessible without causing any chaoutic situation which usually appears in crowd area. Therefore, considering social-economic aspects is important to avoid miss allocation of requirements for amenities, especially throughout different areas or neighborhoods.
57

Figure 4.8 Map of Overlay Happiness and Amenities
Source: Author (2015), based on model analysis 58

CHAPTER 5
The final chapter presents a summary of the research findings and provides answers to the research questions posed for the study. The study results and its implications are stated in relation to the research objectives and theories. Additionally, the scope for further study is also proposed in this chapter.
5.1 Conclusions
Proximity and Service Amenities Dimension
The major finding of this research indicates that to some extent, the proximity to urban amenities indeed influences the happiness of residents in Rotterdam. The influence can be observed from the results of the first and second regression model. Apparently, proximity does influence happiness, depending on the type and amount of amenities available in the surroundings. As it is mentioned in Chapter 4, some of the proximity to amenities show positive and negative significant relationship and some others do not. Daily basic amenities such as Daily Supply, Horeca and Other Service amenities (Hair Salon, Pet Supply, Dry Cleaning, Telecom, et cetera) have a substantially positive impact to determine happiness. These amenities are available in large amounts and have a close average distance from living place to the nearest amenities which is less than 300 meters. Moreover, the proximity of these amenities particularly affects happiness when they are available within certain spatial scales. The model has shown that the service numbers of Daily Supply, Horeca, and Other Services are significant and positively related to happiness, when they are located within 900 and 1200 meters.
Besides the positive significant relations, the testing model also reveals that there are several amenities with negative impact to happiness. The proximity to Clothing & Fashion, Computer& Electronic, and Cultural amenities appears to give a negative impact to the happiness of residents. Their availability also shows the same relation, especially within 900 meters. The negative impacts are getting stronger within the findings of service amenities variables. The test reveals that more amounts of all types of amenities obviously have negative influence to happiness of the residents. It means that living close to these amenities and having more number of amenities in the surrounding encourage people to be less happy. All these positive and negative findings are in accordance to the prior notions from Naess (2011), Witten, et al., (2011); and Handy (1992) which particularly discusses about proximity. Proximity and mobility are the key components of individuals’ accessibility to everyday life destinations. It may be considered in terms of its ‘practical’ quality as a facilitator in everyday life, since it reduces the need for travel. In contrast, the far distance is perhaps chosen to maintain mobility or to avoid a crowded situation which is usually reflected by the residential choice.
One other interesting finding is related to the importance of recreational amenities for Dutch group residents. The recreational amenities are strongly related to parks and green areas as the main functions. This research suggests that the availability of parks considerably gives positive influence to happiness, when they are located within close distance. Or in other words, Dutch group residents are seemingly happier by having parks in a close distance to their living place. This finding emphasizes the importance of green public space in determining a happy place (Tinsley, et al., 2002; Montgomery, 2014). The discussion on the provision of parks and playgrounds shifts from only about the availability to the availability within the appropriate distance. It also pushes the ideas of accessible parks and playgrounds within local distance. The amount of parks and playgrounds should be sufficient, as well as their location should be
59

appropriately near to the residential area. However, in case of Rotterdam, Non-Dutch residents apparently do not consider any influence of the recreational amenities for their happiness. They perhaps do not utilize parks and playgrounds as much as the Dutch do. Therefore, it is important to improve the quality of these amenities in order to be more beneficial to both Dutch and non –Dutch group residents.
However, this research also reveals that particularly either proximity or service amenities does not influence the happiness of people in Rotterdam. It can be obviously seen from the findings that the proximity to all type of amenities together has no significant relationship to happiness. It also applies to other variables such as Financial, Healthcare, Home Supply, Transportation Hub and other amenities. The insignificant relationship can be interpreted as an unconsciousness of the people regarding the existence of these amenities. They perhaps do not consider a lot about the availability of these amenities within their surroundings. Also, some amenities are sufficiently distributed throughout the city, hence the proximity is not becoming a major issue. It is explained by the notion that proximity and service amenities can be regarded as unimportant or even undesirable, concerning destinations that are irrelevant or negatively valued or to which (too much) proximity is not necessarily desirable (Haugen and Vilhemson, 2013; (Mokhtarian & Salomon 2001; Sandow & Westin 2010). Therefore, the insignificant results can be accepted as a possible matter in real daily life.
Spatial Dimension
Spatial dimension of happiness and amenities from overlay models urges interesting inputs. The results can be a reference for describing the “best” areas condition with their amenities which encourage the creation of a happy place. The overlay model particularly indicates the satisfaction degree of the residents with their surrounding in the neighborhood level based on the scoring of happiness and amenities statistical models. The high and moderate satisfaction degree neighborhoods apparently follow the previous statistical findings. Based on the results for high satisfaction degree areas, the proximity to Horeca and Recreational amenities are on average from 200-600 meters. These amenities substantially give positive impact to happiness, thus the close distance would encourage people to be happier (Jacobs 1961, Oldenburg, 1999). Meanwhile, the average distance for Clothing&Fashion, and Computer& Electronics is around 600-900 meters. Since the close distance of these amenities decrease happiness, people in these areas choose to maintain a certain “far” proximity to keep a positive influence to happiness. Moreover, this research also observes a certain number of service amenities that are available in these high satisfaction degree neighborhoods. At least, there are 1 unit of recreational and vehicle service amenities within 300 meters; and 60-80 units of daily supply and other service amenities within 900 meters. In a bigger spatial scoop, it can be obviously seen that the pattern of happier places is getting weaker throughout the city central areas. Residents who live close to the busy and dense areas seem to be less happy than those who live within the further neighborhoods. Blijdorp, Kralingse Oost, and Kranglise West appear to be the neighborhoods with the highest satisfaction degree with their surroundings. These areas are recognized as dominantly residential rather than commercial or business neighborhoods.
It can be concluded that, initially most of the residents in Rotterdam prefer to have “close but not too close” or “far but not too far” amenities within their surroundings. The neighborhoods provide sufficient amenities within local access without leaving the convenient and non disturbing condition. Or in other words, the design of the amenities shall promote local community distance which eventually maintain certain “close” proximity and availability for basic daily amenities to shape a happy friendly neighborhoods (Reimers and Clulow, 2004; (Quiley, 2001) ). The sufficient transport system of Rotterdam plays considerable roles to
60

decrease travel time and provide easy access especially for non close desirable amenities, -e.g clothing & fashion and computer & electronic amenities. It also helps cultural amenities to give a positive encouragement to the people of Rotterdam even though they are not located really close to the residential areas. (Leyden, 2011). Finally, the suggested approximate proximity and number of service amenities within neighborhoods are not fixed. But understanding this description of “happy amenities” may provides a useful estimation for city planners to generate an appropriate design of neighborhood surroundings in Rotterdam.
Subjective preference and Socio-economic dimensions
Hereafter, it is critical to be understood that happiness itself involves multi dimension aspects. This research merely tests one major aspect that is expectedly influences happiness. However, the factors that are actually influential are complex, along with distinct backgrounds and perspectives. As it is explained in chapter 2, urban amenities are part of an urban living environment which determines the degree of quality of life and also happiness (Brulde, 2007; Marrans and Stimson, 2011). Some prior researches urge that subjective preference and socio-economic status are much stronger in influencing happiness. It is respectively observed within findings from this research. The control variables: Ethnicity, paid job status, and household composition show more significant level than the proximity and service amenities. These variables reflect subjective preference which determined the daily activities and the need for amenities in the surroundings (Mitchel 1996, Lindsey, et al., 2001).The preference continually influences happiness in a subjective angle. Moreover, the control variables suggest that the socio-economic conditions critically reflect a stable or unstable household condition. People with better welfare tend to be happier and have more opportunities to choose a better living situation. It is in accordance with previous several studies that suggest wage and better employment as considerable happiness predictors.
Cultural diversity also shows a substantial effect within this research. It answers the research question and proves that cultural diversity indeed affects the variation of happiness level which is influenced by proximity to amenities. The findings show that for non Dutch residents, only paid job status significantly influences happiness. There are no variables from amenities aspects that show significant relation to happiness. The interpretation comes along for these groups that they put wage and employment as the main concerns above other factors (Ballas, 2006; Logan, 2002; Logan, 2006). Proximity and service amenities are apparently not prioritized, since usually they already live close to their preference amenities. For example, groups of Turkish and Moroccans usually live close to halal supermarket and Asian residents often go shopping to Asian grocery stores. Furthermore, some of those non-Dutch residents have cultural constraints in accessing general amenities, thus they only consider the availability of amenities that are intended for them. Therefore, these findings should be highlighted especially to understand that compared to Dutch residents, non-Dutch residents have different needs and demands for their happiness.
The dominance of subjective and socio-economic dimension through happiness predictors is reinforced by the overlay result of this research. According to the satisfaction degree models, surprisingly, The amenities conditions in the high degree areas are so different from the lower degree areas.. The low degree areas indeed have less amenities which caused positive impact to happiness and have more of the ones with negative impact. It can be assumed that low degree areas perhaps have other more dominant factors that determine happiness rather than the amenities. It is attached to the issue of subjective desire and demands (Veenhoven, 1984; Kagan, 1992). It could be related to the household composition, ethnicity, or paid job status
61

which particularly related to the socio-economic status of residents. The similar sequence allows the notion that people with fewer resources and less stable welfare have limited possibilities to choose convenient residential places along with the amenities needed (Logan, 2006; De Vroome and Hooghe, 2013). Some people may have the surroundings being provided with sufficient amenities but cannot easily use them due to limited resources. To some extent, this research realizes that these variables may influence happiness much stronger than the amenities aspects. It can affect either the subjective preference for individual or community demands of amenities as well as the happiness level of residents. However, since the testing models have significantly proven the relations, this research clearly urges that the relationship between amenities and happiness is (not) independent from the involvement of some other aspects. Therefore, instead of only looking at the amenities aspects, this research consciously realizes the involvement of subjective preference and socio-economic background in determining the daily activities and thus also the happiness.
Limitations
This research holds some limitations which consciously affect the results and interpretations. As mentioned in chapter 1 and 3, this research mainly uses different year data source of amenities and happiness. The happiness data is based on a survey in 2009 whereas the amenities data is available in the year of 2012. The three years gap may cause an inacurate measurement between the state of happiness and the amenities which may have disappeared or newly existed during the period. However, since the analysis of this research is conducted for the whole city, the error gap can be neglected as it is assumed that the come-and-go amenities and the change in the level of happiness remain the same. Other important limitation is related to the method used to measure proximity in Arc GIS. There are some options on the tools that can be chosen regarding this measurement. Every tool has different consideration and variance of outcome based on the actual purpose of the users. This research attempt to use Near tool to measure proximity and Buffer-Count tool to calculate the number of service amenities. The use of other tools may generate different results and interpretations and is recommended to be examined in future researches. Other technical measurement issue is related to the use of postcode level aggregation rather than the actual address of residential places. Due to confidentiality issues, this research is unable to obtain the actual address of each respondent which causes the need to aggregate the spatial point into postcode level. Besides reducing the number of observation from 4422 individual respondents into 840 aggregate postcode level, this research is also applying postcode centroid as the representative of residential area to conduct the measurements to the nearest amenities. This centroid is calculated by default techniques using Arc GIS and represents the center points of coverage postcode area. Lastly, the other substantial limitation is in the use of control variables which are expected to affect the independent variables. As it is understood that happiness issue involves multi dimensional aspects, all those factors are supposedly included within the analysis. This research indeed has attempted to include some factors as a control within the analysis but there may be some interstices remain for other factors which may also have great influence in determining happiness. All those limitations should be considered as recommendations for further research.
In brief, this research answers the research question and proves that the proximity to amenities does influence happiness of the residents in Rotterdam. However, the level of influence depends on the type and number of service amenities within the surroundings. The kind and amount of amenities give either a positive or negative influence to happiness. These can be assumed as determinants of “happy amenities”. The findings suggest that local access as well as community distance should be promoted, specifically for basic daily amenities. However, some amenities such as “happy shopping” and cultural amenities need to be located in a certain
62

distance to maintain positive encouragement to happiness. Meanwhile, recreational amenities are apparently considered as giving great influence to happiness when they are located within a close distance, especially for Dutch residents. Related to the spatial dimensions, people who live in the city central area tend to be less happy than the residents of the edges of the city. People are apparently happier when they live in a residential area with sufficient amount of amenities rather than living close to a commercial area which usually has excessive number of amenities. The main notion promotes the “close but not too close and far but not too far” proximity to amenities within the surroundings. Beyond the physical and spatial dimension, this research also discovers the important role of other aspects in determining happiness. The interpretation cannot merely be understood as a direct influence of amenities to happiness. The subject is considerably complex with the involvement of subjective preference and socio-economic background. It is shown by the influence of cultural diversity through different significant variable in determining happiness. Non-Dutch residents do not consider any other factors besides paid job as the significant happiness predictors. Having appropriate wage and employment is more important than being close to the amenities. Furthermore, household composition and paid job status play considerable roles in determining daily activities and thus influence the need for amenities. Apart from the amenities itself, the kind of daily activities also substantially affect how proximity and service amenities influence happiness of residents in Rotterdam.
5.2 Recommendation
Recommendations from this research consist of two main parts. The first part is related to the suggestion to improve amenities design to encourage happiness within neighborhood surroundings. As explained in the conclusion, this research reveals the importance of local access for basic daily amenities. Close distance between 200-900 meters should be highlighted when designing further residential surroundings as well as maintaining appropriate distance to busy amenities e.g: shopping shops and business offices. The surrounding should support easy access by walking and cycling in convenient circumstances. Based on the findings of this research, residents in Rotterdam prefer to live in residential circumstances rather than close to commercial or business areas within the city central. Therefore, the design of living environment should emphasize the sense of actual living place even though they live above or inside the busy areas. Putting a park or playground could perhaps become a potential solution to reduce the crowded sense and encourage the creation of a happy friendly neighborhood. The availability of park and playground as recreational amenities is playing a considerably important role, since this research reveals its positive significant influence to the happiness of residents in Rotterdam. Furthermore, the local government should pay attention for the amount of amenities available in the surroundings. Instead of providing the residents with abundant amenities which potentially exceed the needs, the local government should provide the appropriate amount of basic daily amenities as needed. The diversity of the amenities should also be noted while identifying the amenities that the residents need most.
Moreover, the findings also indicate that some important amenities have negative influence to happiness when they have overly close proximity to the living environment. The best example is the cultural amenities which mainly consist of museums, libraries, and art galleries. This research suggests that they are positively perceived by just being there. Or in other words, the amenities should be available within the city but people prefer to live not too close to them. Particularly, local government should support the accessibility of these amenities by providing sufficient public transport. It helps to reduce the travel time and prevent the far distance to become a main issue. This suggestion also applies for other amenities with negative influence to happiness such as Clothing&Fashion and Computer&Electronics. Since these amenities
63

closely represent shopping areas, it is recommended to assign a cluster design within few numbers of locations rather than to put them scattered within city. These kinds of amenities have opposite effect from the basic daily amenities which are supposedly located in a close distance. Maintaining a far distance is more appropriate to encourage a positive influence to happiness, as long as the city is particularly supported with a sufficient transport system. Therefore, the idea of “close but not too close and far but not too far” can be comprehensively implemented throughout the city.
Beyond the amenities and spatial dimensions, this research also suggests the involvement of subjective preference and socio-economic background. As discussed before, according to the finding, ethnicity background, paid job status, and household composition determine the level of influence on the relationship between proximity to amenities and happiness. They shape the daily activities as well as the amenities needed. Therefore, the Rotterdam Municipality should understand the residents’ backgrounds comprehensively. The understanding should include what are already available within the residents’ surroundings and the prioritized demands of different target groups. Non-Dutch residents apparently do not consider any influence from amenities dimension to their happiness besides from paid job status. For this group of residents, the local government should highlight the provision of good access for employment and better income to substantially affect their happiness. Particularly, the local government should involve the residents and (consider) their real conditions that determine their needs and demands in order to attain proper planning target through the amenities. This understanding will provide valuable inputs and generate beneficial output and outcome for all residents of Rotterdam.
The second part is related to the recommendations for further research. Due to some limitations, this research recommends the use of different methods and data source in order to attain better findings and interpretations. The first suggestion is involving the use of similar year and multi years data source for either happiness and amenities data. More than three years span of panel data is expected in order to allow the analysis to capture substantial alteration of happiness condition and amenities availability. It is believed to generate better and real understanding of interaction in this issue as well as to reduce the error level. This research also suggests the use of individual level data for happiness, instead of postcode aggregation level. It will generate more precise measurement of proximity from the living place to the amenities. The aggregation error can also be clearly quantified if further research remains to use the centroid as a representation of residential area. Furthermore, since there are several options of measurement methods in Arc GIS, further research can attempt the use of those different tools which expectedly may provide more precise and comprehensive measurement results. Lastly, this research suggests future research to put more control variables from social and economic aspects which determine the needs of amenities and also happiness itself. The social and economic aspects can be put as control variables in order to attain various interpretations such as more detailed residents target groups, population needs, and educational and employment backgrounds. Further research should also consider other physical objects and factors in the surroundings such as water, noise, building density, and energy consumption to attain a better understanding of the physical surroundings condition of the residents of Rotterdam.
64

Bibliography
Aslam, Aqib & Corrado, Luisa. (2012) The Geography of Well being Journal of Economic Geography. Oxford University Press: pp. 627–649
Ballas, D., 2013. What makes a ‘happy city’? Science Direct, 32 (Cities), pp. S39-S50.
Baltatescu, S. M. (2005). Subjective Well-being of Immigrants in Europe and their Evaluation of Societal Conditions. An Exploratory Study. In Pop, L. and Matiuta, C. (Eds.), European Identity and Free Movement of Persons in Europe. Oradea: University of Oradea Publishing House.
Bairoch, P. (1988) Cities and Economic Development: from the Dawn of History to the Present.Oxford: Oxford University Press.
Banister, D., 2011. The trilogy of distance, speed and time. Journal of Transport Geography 19
(4), 950–959. Bartik, T. J., & Smith, V. K. (1987). Urban amenities and public policy. In E. Mills (Ed.),
Handbook of regional and urban economics: Vol. 2. Urban economics (pp. 1207–1254). Amsterdam: North-Holland.
Beatley, T., and K. Manning. 1996. The ecology of place: Planning for environment, economy, and community. Washington, DC: Island Press. Bentham, J.: 1967, ‘The principles of morals and legislation’, in A.I. Melden (ed.), Ethical
Theories (Prentice-Hall, Englewood Cliffs), pp. 367–390. Blomquist, G. C., Berger, M. C., & Hoehn, J. P. (1988). New estimates of quality of life in urban
areas. The American Economic Review, 78, 89–107. Brown, S. C., C. A. Mason, T. Perrino, J. L. Lombard, F. Martinez, E. Plater-Zyberk, A. R. Spokane, and J. Szapocznik. 2008. Built environment and physical functioning in Hispanic elders: The role of “eyes on the street.” Environmental Health Perspectives116 (10): 1300-1307.
Brulde, B., 2007. HAPPINESS THEORIES OF THE GOOD LIFE. Springer, 8 (Journal of Happiness Studies), pp. 15-49.
Burns, G. W. (2005). Naturally happy, naturally healthy: The role of natural environment in well-being. In The science of well-being, edited by F. A. Huppert, N. Baylis, and B. Keverne, 404-31. New York: Oxford Univ. Press.
Cahoone, L. E. 2002. Civil society: The conservative meaning of liberal politics. Oxford:
Blackwell.
Chapple, K., Jackson, S. and Martin, J., Anne 2010. Concentrating creativity: The planning of formal and informal arts districts. Elsevier, 1 (City, Culture and Society), pp. 225-234.
Chekola, M., 2007. HAPPINESS, RATIONALITY, AUTONOMY AND THE GOOD LIFE. Springer, 8 (Journal of Happiness Studies), pp. 51-78.
65

Creswell, John W. 2009. Research Design: Qualitative, Quantitative and Mixed Methods Approaches. Londres: Sage.
Dalmazzo, A. and Blasio, G. 2010. Amenities and skill-biased agglomeration effects: Some results on Italian cities. Blackwell Publishing, 90 (3) (Papers in Regional Science), .
Deaton, A., 2008. Income, Health, and Well-Being around the World: Evidence from the Gallup World Poll. Journal of Economic Perspectives, 22 pp. 53-72.
De Vroome, T. and Hooghe, M. 2013. Life Satisfaction among Ethnic Minorities in the Netherlands: Immigration Experience or Adverse Living Conditions? SHERPA, (Journal of Happiness Studies), .
Diener, E.: 1994, _Assessing subjective well-being: Progress and opportunities_, Social Indicators Research 31, pp. 103–157.
Doi, K., Kii, M. and Nakanishi, H. 2008. An integrated evaluation method of accessibility, quality of life, and social interaction. Environment and Planning B, 35 (Planning and Design), pp. 1098-1116.
Erdogan, B., Bauer, N., Tayla, Truxillo, M., Donald and Mansfield, R., Layla 2011. Whistle While You Work: A Review of the Life Satisfaction Literature. SAGE, XX (Journal of Management), pp. 1-46.
Faggiana, A., Olfertc, M., Rose and Patridgea, D., Mark 2012. Inferring regional well-being from individual revealed preferences: the ‘voting with your feet’ approach. Cambridge Journal of Regions, 5 (Economy and Society), pp. 163-180.
Faggian, A. and Royuela, V. 2010. Migration Flows and Quality of Life in a Metropolitan Area: the Case of Barcelona-Spain. Springer, 5 (Applied Research Quality Life), pp. 241-259.
Fleury-Bahi, G., Félonneau, M.-L. and Marchand, D. (2008). Processes of place identification and residential satisfaction, Environment and Behavior, Vol. 40, No. 5, pp. 669-682.
Fransson, U., Rosenqvist, G. and Turner, B. (2001). Hushållens värdering av egenskaper i bostäder ochbostadsområden. Research Report 2002:1, Institute for Housing and Urban Research, Uppsala University, Gävle (In Swedish).
Frey, S. and Stutzer, A. 2002. What Can Economists Learn from Happiness Research? STOR, 40 (2) (Journal of Economic Literature), pp. 402-435.
Frumkin, H., L. Frank, and R. Jackson. 2004. Urban sprawl and public health: Designing, planning, and building for healthy communities. Washington, DC: Island Press
Fujita, M., Krugman, P., Venables, A. (1999) The Spatial Economy. Cities, regions and
international trade. Cambridge MA: MIT Press. Geertman S C M, Ritsema Van Eck J R, 1995 “GIS and models of accessibility potential: an
application in planning'' International Journal of Geographical Information Systems 9 67- 80
66

Glaeser, E., Kolko, J., Saiz, A. (2001) Consumer city. Journal of Economic Geography, 1: 27–50.
Gereffi, G., Rissing, B., Saxenian, A. and Wadhwa, V., 2007. America’s New Immigrant Entrepreneurs. Barkeley: Master of Engineering Management Program, Duke University; School of Information, U.C. Berkeley.
Griffin, J.: 1986, Well-Being: Its Meaning, Measurement and Moral Importance (Clarendon Press, Oxford).
Handy, S.L., 1992. Regional versus local accessibility: neo-traditional development and its implications for non-work travel. Built Environment
Handy, S.L., 1996. Understanding the link between urban form and nonwork travel behaviour.
Journal of Planning Education and Research 15 (3), 183–198 Handy, S. and Clifton, K.J. (2001). Evaluating neighborhood accessibility: Possibilities and practicalities, Journal of Transportation and Statistics, Vol. 4, no. 2/3, pp. 67-78. Haugen, K., 2011. The advantage of ‘near’ – which accessibilities matter to whom? European Journal of Transport and Infrastructure Research (EJTIR) 11 (4), 368–388. Haugen, K., Holm, E., Strömgren, M., Vilhelmson, B., Westin, K., 2011. Accessibility, proximity and choice – a matter of taste of condition? Papers in Regional Haugen, K., 2012. The Accessibility Paradox – Everyday Geographies of Proximity, Distance and Mobility. GERUM 2012:1. Department of Geography and Economic History, Umeå University, Umeå. Haugen, K. and Vilhemson, B., 2013. The divergent role of spatial access: The changing supply
and location of service amenities and service travel distance in Sweden. Transportation Research Part A Vol 49 pp 10-20
Helliwell, J. F., and R. D. Putnam. 2005. The social context of well-being. In The science of well-
being, edited by F. A. Huppert, N. Baylis, and B. Keverne, 434-59. New York:Oxford Univ. Press.
Hewko, J., Smoyer-Tomic, E., Karen and Hodgson, J. 2002. Meauring neighborhood spatial
accesibility to urban amenities: does agregation error matter? Environment and Planning A, 34 pp. 1185-1206.
Hoehn, J. P., Berger, M. C., & Blomquist, G. C. (1987). A hedonuc model of interregional
washes,rents, and amenity values. Journal of Regional Science, 27, 341–349. Holder, M. D., and B. Coleman. 2007. The contributions of social relationships to children’s
happiness. Journal of Happiness Studies 9 (2): 279-302. Horner, M.W. (2004). Spatial dimensions of urban commuting: A review of major issues and their implications for further geographic research. The Professional Geographer, Vol. 56, No. 2, pp. 160- 173.
Jacobs, J., 1961. The Death and Life of Great American Cities. New York: Random House.
67

Jacobs, J., 1969. The Economy of Cities. Vintage Book Edition. New York: Random House, Inc.
Kemp, D., Manicaros, M., Mullins, P., Simpson, R., Stimson, R., & Western, J. (1997). Urban metabolism: A framework for evaluating the viability, livability and sustainability of South East Queensland. Brisbane: The Australian Housing and Urban Research Institute.
Kim, T.-K., Horner, M.W. and Marans, R.W.(2005b). Life cycle and environmental factors in selecting residential and job locations, Housing Studies, Vol. 20, No. 3, pp. 457 — 473.
Kingsley, J. ‘. and Townsend, M. 2007. ‘Dig In’ to Social Capital: Community Gardens as Mechanisms for Growing Urban Social Connectedness. Routledge, 24 (4) (Urban Policy and Research), pp. 525-537.
Knox P L, 1980, ``Measures of accessibility as social indicators: a note'' Social Indicators Research 7 367-377
Kwan, M.-P. and Weber, J. (2003). Individual accessibility revisited: Implications for geographical analysis in the twenty-first century, Geographical Analysis Vol. 35, No. 4, pp. 341-353.
Lane, R.E.: 2000, _Diminishing returns to income, companionship – and happiness_, Journal of Happiness Studies 1, pp. 103–119.
Lazear, E. (1999) Globalization and the market for team-mates. Economic Journal, 109: C15–C40. LINDSEY, G., MARAJ, M. and KUAN, S.C. 2001 ‘Access, equity, and urban greenways: an
exploratory investigation’ Professional Geographer 53(5), 332–346
Leyden, M., Kevin, Goldberg, A. and Michelbach, P. 2011. Understanding the Pursuit of Happiness in Ten Major Cities. SAGE, 47 (6) (Urban Affairs Review), pp. 861-888. Available at: http://uar.sagepub.com
Leyden, K. M. 2003. Social capital and the built environment: The importance of walkable neighborhoods. American Journal of Public Health 93 (9): 1546- 51.
Logan, R.,John, 2006. Variations in Immigrant Incorporation in the Neighborhoods of Amsterdam. Joint Editors and Blackwell Publishing, 30.3 (International Journal of Urban and Regional Research), pp. 485-509.
Logan, R.,John, 2012. Making a Place for Space: Spatial Thinking in Social Science. NIH Public Access, 38 (Annu Rev Sociol), .
Logan, R.,John, Zhang, W. and Alba, D. 2002. Immigrant Enclaves and Ethnic Communities in New York and Los Angeles. American Sociological Association, 67 (American Sociological Review), .
Lu, M. (1999). Determinants of residential satisfaction: Ordered logit vs. regression models. Growth and Change, 30(spring), 264–287.
Lund, H., 2003. Testing the claims of new urbanism: local access, pedestrian travel, and neighboring behaviors. Journal of the American Planning Association 69 (4), 414–429.
68

Lynch, K. (1981). A theory of good city form, The Massachusetts Institute of Technology, USA.
Massey, D., S. and Denton, N., A. 1987. Trends in the Residential Segregation of Blacks, Hispanics, and Asians: 1970-1980. American Sociological Association, 52 (6) (American Sociological Review,), pp. 802-825.
Marcuse, P., 1997. The Enclave, The Citadel, and The Ghetto What was changed in the post furdist US City. SAGE, 33.2 (Urban Affair Review), pp. 228-264.
Musterd, S. and Smakman, S. 2000. Integration of Caribbean Immigrants in a Welfare State City: Surinamese and Antilleans in Amsterdam. John Wiley & Sons, 6 (International Journal of Populationphy), pp. 303-320.
Marans, R. W., & Mohai, P. (1991). Leisure resources, recreation activity, and the quality of life. In B. L. Driver, P. Brown, & G. L. Peterson (Eds.), The benefits of leisure (pp. 351–363). State College, PA.: Venture Publishing.
Marans, R. W., & Rodgers, W. (1975). Towards an understanding of community satisfaction. In
A. Hawley & V. Rock (Eds.), Metropolitan America in contemporary perspective (pp. 299–352). New York: Halsted Press.
Marans, R. W. (2002). Understanding environmental quality through quality of life studies: The
2001 DAS and its use of subjective and objective indicators. Landscape and Urban Planning, 991, 1–11.
MITCHELL, D. 1996 ‘Introduction: public space and the city’ Urban Geography 17(2), 127–131 Mokhtarian, P. L. and I. Salomon (2001). How derived is the demand for travel? Some conceptual and measurement considerations. Transportation Research Part A Vol. 35, No. 8, pp. 695-719.
Mommaas, H., 2004. Cultural Clusters and the Post-industrial City: Towards the Remapping of Urban Cultural Policy. Carfax Publishing, 41 (3) (Urban Studies,), pp. 507-532.
Montgomery, C., 2013. Happy City: Transforming our lives through urban design. First Edition.
New York: Farrar, Straus and Giroux. Næss, P., 2011. ‘New urbanism’ or metropolitan-level centralization? The Journal of Transport and Land Use 4 (1), 25–44.
Nicholls, S., 2001. Measuring the accessibility and equity of public parks: a case study using GIS. Routledge, 6:4 (Managing Leisure), pp. 201-219.
Oldenburg, R. 1999. The great good place: Cafes, coffee shops, community centers, beauty parlors, general stores, bars, hangouts, and how they get you through the day. New York: Marlowe.
Ottaviano, G. and Perri, G. 2005. The economic value of cultural diversity:evidence from US cities. Oxford Journals, 6 (Journal of Economic Geography), pp. 9-44.
69

Pacione M, 1989, ``Access to urban servicesöthe case of secondary schools in Glasgow'' Scottish Geographical Magazine 105 12- 18
Putnam, R. D. (2000) Bowling Alone: The Collapse and Revival of American Community (New
York: Simon & Schuster). Putnam, R. D. (2004) Education, Diversity, Social Cohesion and ‘Social Capital’: Meeting of
OECD Education Quigley, M., John, 1998. Urban Diversity and Economic Growth. American Economic
Association, 12 (Journal of Economic Perspectives), pp. 127-138. Reimers, V., Clulow, V., 2004. Retail concentration: a comparison of spatial convenience in
shopping strips and shopping centres. Journal of Retailing and Consumer Services 11, 207–22 Richard, L., L. Gauvin, C. Gosselin, and S. Laforest. 2009. Staying connected: Neighbourhood
correlates of social participation among older adults living in an urban environment in Montréal, Quebec. Health Promotion International 24 (1): 46-57. Epub 2008 Dec 20.
Rogers, S. H., J. M. Halstead, K. H. Gardner, and C. H. Carlson. 2010. Examining walkability
and social capital as indicators of quality of life at the Municipality and neighborhood scales. Applied Research in Quality of Life
Safi, M., 2009. Immigrants’ Life Satisfaction in Europe: Between Assimilation and Discrimination. Oxford Journals, 26 (2) (European Sociological Review), .
Sassen, S. (1994) Cities in a World Economy. Thousand Oaks: Pine Forge Press.
Sandow, E. and Westin, K (2010). Peoples preferences for commuting in sparsely populated areas: the case of Sweden, Journal of Transport and Land Use, Vol. 2, No. 3, pp. 87-107.
Scanlon, T.: 1993, _Value, desire, and quality of life_, in M. Nussbaum and A. Sen (eds), The Quality of Life (Clarendon Press, Oxford).
Schenk, T.A., Löffler, G., Rauh, J., 2007. Agent-based simulation of consumer behavior in grocery shopping on a regional level. Journal of Business Research 60 (8), 894–903. Smith, K., Poulos, C., & Kim, H. (2002). Treating open space as an urban amenity. Resource and
Energy Economics, 24, 109–119.
Smoyer-Tomic, K., Hewko, J. and Hodgson, J. 2004. Spatial accessibility and equity of playgrounds in Edmonton, Canada. Canadian Association of Geographers, 48 (3) (The Canadian Geographer), pp. 287-302.
Stokols, D., 2007. A Social-Psychological Model of Human Crowding Phenomena. Journal of the American Institute of Planners Vol 38 No.2 pp 71-83
Thériault, M. and Des Rosiers, F., eds., 2004. Modelling Perceived Accessibility to Urban Amenities Using Fuzzy Logic, Transportation GIS and Origin-Destination Surveys, [Urban Modelling II]. Greece, 29 April-1May 2004. Greece: 7th AGILE Conference on Geographic Information Science.
70

Tinsley,H.E.A., Diane,H.E.A., and Croskeys,C.E., 2002. Park Usage, Social Milieu, and Psychosocial Bene. ts
of Park Use Reported by Older Urban Park Users from Four Ethnic Groups. Leisure Sciences, Vol 24 pp.199–218,
Van Thiel, S., 2014. Research Methods in Public Administration and Public Management An introduction. New York: Routldege.
Veenhoven, R., 2009. How do we assess how happy we are? Tenets, implications and tenability of three theories. Amsterdam: Amsterdam Institute for Social Science Research (AISSR). [Accessed http://hdl.handle.net/11245/2.77387].
Veenhoven, R., 2012. HAPPINESS: Also known as ‘life-satisfaction’ and ‘subjective well-being’. In: C. Land Kenneth, C. Michalos Alex and J. Sirgy M. eds., 2012. Handbook of Social Indicators and Quality of Life Research. Dodrecth: Springer. pp. 63-77.
Veenhoven, R., 2007. Does happiness matter? On the value of great happiness for a great number. In: Stam, Joop, Veenhoven, Ruut (Eds.), Quality of Life and Happiness of People in Japan and The Netherlands, vol. I. KIT Publishers, Amsterdam in cooperation with NIOD Encounters Series, pp. 156–163.
Veenhoven, R., 2000b. Freedom and happiness: a comparative study in 44 nations in the early 1990s published. In: Diener, E., Suh, E.M. (Eds.), Culture and Subjective Wellbeing. MIT Press, Cambridge, (Jacobs, 1961)MA, USA, pp. 257–288
Veenhoven, R.: 1984, Conditions of Happiness (D. Reidel, Dordrecht). Veenhoven, R.: 2000, _The four qualities of life: Ordering concepts and measures of the good life_, Journal of Happiness Studies 1, pp. 1–39.
Vera-Toscano, E. and Ateca-Amestoy, V. (2008). The relevance of social interactions on housing satisfaction, Social Indicators Research, Vol. 86, No. 2, pp. 257-274.
Varelius, J.: 2004, _Objective explanations of individual well-being_, Journal of Happiness Studies 5, pp. 73–91.
Waters, M. and Jiménez, R.,Tomás 2005. Assessing Immigrant Assimilation: New Empirical and Theoretical Challenges. Annual Review, 31 (Sociology), pp. 105-125.
Weber, J. (2003). Individual accessibility and distance from major employment centers: An examination using space-time measures, Journal of Geographical Systems, Vol. 5, No.1, pp. 51-70.
Weiner, E., 2008. The Geography of Bliss. 1st Edition Hardcover. United States: Hachette.
Werkuyten, M. and Nekuee, S. (1999). Subjective Wellbeing, Discrimination and Cultural Conflict: Iranians Living in The Netherlands. Social Indicators Research, 47, 281–306.
Witten, K., Exeter, D. and Field, A. 2003. The Quality of Urban Environments:
Mapping Variation in Access to Community Resources. SAGE, 40 (1) (Urban Studies),
71

Weber, J. (2003). Individual accessibility and distance from major employment centers: An examination using space-time measures, Journal of Geographical Systems, Vol. 5, No.1, pp. 51-70.
Weiner, E., 2008. The Geography of Bliss. 1st Edition Hardcover. United States: Hachette.
Yin, R. & Campbell, D. T. 2002, Case Study Research: Design and Methods Applications of Case Study, Thousand Oaks, CA, Sage.
Young, M., Wheaton, B., 2013. The Impact of Neighborhood Composition on Work-Family Conflict and Distress. Journal of Health and Social Behavior Vol. 54 No 4 pp 481-497
Zukin, S., 1998. Urban Lifestyle: Diversity and Standaritation in Spaces Consumption. Carfax Publishing, 35 (5) (Urban Studies), pp. 825-839.
72

Annex 1. Table of Happiness Level per Neighborhood in Rotterdam
Neighborhood Happiness Number of Respondent Noord Kethel 4.00 1 Kralingse Bos 3.67 1 Kralingseveer 3.50 2 Kop van Zuid 3.47 3 Nesselande 3.45 5 's-Gravenland 3.45 7 Oosterflank 3.35 13 Terbregge 3.31 4 Blijdorp 3.28 17 Kralingen-oost 3.28 18 Oude Noorden 3.26 23 Bergpolder 3.24 13 Zestienhoven 3.22 3 Molenlaankwartier 3.22 17 Pernis 3.21 9 Zevenkamp 3.20 12 Overschie 3.19 16 Dorp 3.18 14 Groot IJsselmonde 3.18 38 Struisenburg 3.17 5 Liskwartier 3.17 10 Nieuwe Werk 3.17 3 Strand en Duin 3.17 3 De Esch 3.17 10 Katendrecht 3.13 3 Schiemond 3.13 1 Hillesluis 3.13 16 Oud IJsselmonde 3.13 9 Nieuwe Westen 3.13 23 Middelland 3.12 19 Hillegersberg-noord 3.11 11 Hoogvliet-noord 3.10 13 Het Lage Land 3.10 4 Afrikaanderwijk 3.09 13 Grand Total 3.08 840 Oud Crooswijk 3.07 7 Lombardijen 3.07 19 Kralingen-west 3.07 20 Schiebroek 3.06 26 Cool 3.06 9 Beverwaard 3.06 11 Oud-Mathenesse 3.06 13 Pendrecht 3.05 18 Stadsdriehoek 3.05 18 Hillegersberg-zuid 3.05 13 Ommoord 3.04 23 Hoogvliet-zuid 3.03 38
73

Neighborhood Happiness Number of Respondent Feijenoord 3.02 9 Vreewijk 3.02 21 Delfshaven 3.01 9 Bloemhof 3.01 17 Rubroek 3.01 13 Zuidwijk 3.01 19 C.S. Kwartier 3.00 2 Dijkzigt 3.00 4 Zuiderpark 3.00 1 Zuidplein 3.00 1 Noordereiland 2.99 6 Oude Westen 2.96 14 Carnisse 2.95 17 Oud-Charlois 2.94 22 Tarwewijk 2.93 15 Heijplaat 2.93 4 Kop van Zuid-Entrepot 2.93 3 Tussendijken 2.90 11 Prinsenland 2.90 10 Nieuw Crooswijk 2.90 10 Kleinpolder 2.89 16 Bospolder 2.86 12 Agniesebuurt 2.85 10 Provenierswijk 2.83 6 Spangen 2.81 13 Schieveen 2.67 1
Source: Author (2015) based on data provided by Rotterdam Municipality (2009)
74

Annex 2 . Map of Proximity to the Clothing & Fashion Amenities
Source : Author (2015) based on model analysis
75

Annex 3 . Map of Proximity to the Computer & Electronics Amenities
Source : Author (2015) based on model analysis
76

Annex 4 . Map of Proximity to the Horeca Amenities
Source : Author (2015) based on model analysis
77

Annex 5 . Map of Proximity to the Recreational Amenities
Source : Author (2015) based on model analysis
78

Annex 6 . Map of Recreational Amenities within 300 Meters
Source : Author (2015) based on model analysis 79

Annex 7 . Map of Vehicle Service Amenities within 300 Meters
Source : Author (2015) based on model analysis 80

Annex 8 . Map of Financial Amenities within 600 Meters
Source : Author (2015) based on model analysis 81

Annex 9 . Map of Other Amenities within 600 Meters
Source : Author (2015) based on model analysis 82

Annex 10 . Map of Cultural Amenities within 900 Meters
Source : Author (2015) based on model analysis 83

Annex 11 . Map of Daily Supply Amenities within 900 Meters
Source : Author (2015) based on model analysis 84

Annex 12 . Map of Other Service Amenities within 900 Meters
Source : Author (2015) based on model analysis 85

Source : Author (2015) based on model analysis
Annex 13 . Map of Cultural Amenities within 1200 Meters
86

Source : Author (2015) based on model analysis
Annex 14 . Map of Daily Supply Amenities within 1200 Meters
87

Annex 15 . Map of Other Service Amenities within 1200 Meters
Source : Author (2015) based on model analysis
88

Annex 17 . Map of Residents Age Distribution
Source : Author (2015) based on data provided by Rotterdam Municipality (2009) 89

Annex 17 . Map of Residents Gender Distribution
Source : Author (2015) based on data provided by Rotterdam Municipality (2009) 90

Source : Author (2015) based on data provided by Rotterdam Municipality (2009)
Annex 17 . Map of Residents Ethnicity Distribution
91

Annex 19 . Map of Residents Paid Job Status Distribution
Source : Author (2015) based on data provided by Rotterdam Municipality (2009) 92

Annex 20 . Map of Residents Income Distribution
Source : Author (2015) based on data provided by Rotterdam Municipality (2009) 93

•
Source : Author (2015) based on data provided by Rotterdam Municipality (2009)
Annex 21 . Map of Household Composition Distribution
94

Annex 22 . Map of Crime Rate Distribution
Source : Author (2015) based on data provided by Rotterdam Municipality (2009) 95

Nb: This research does not use all data from Rotterdam Leisure Survey. This table consists of the questions that are related only to objective of studies and data needed.
No Dutch English
Vraag Antwoord Questions Answers
1 Bent u een man of een vrouw? 1 - man, Are you a man or a woman? 1 - man,
2 - vraw 2 - woman
2
Hoe is uw huishouden samengesteld?
1 - Ik woon alleen What is the composition of your household
1 - I live alone 2 - 2 volwassenen, geen kinderen 2 - 2 adults, no children 3 - koppel met kind (eren) thuis wonen 3 - couple with child(ren) living at
home 4 - alleenstaande ouder met kind (eren) woon thuis
4 - single parent with child(ren) living at home
5 - anders, namelijk: 5 - other, namely:
3
Bent u alles bij elkaar gelukkig?
1 - zeer tevreden All in all, are you happy? 1 - very happy 2 - happy 2 - happy 3 - niet zo gelukkig 3 - not so happy 4 - helemaal niet tevreden 4 - not at all happy
4 In welk jaar bent u geboren? jaar van Born In which year were you born? year of born
5
wat is uw etniciteit 1 - Nederland What is your ethnicity? 1 - Netherlands 2 - Nederlandse Antillen / Aruba 2 - Netherlands Antilles/Aruba 3 - Suriname 3 - Suriname 4 - Turkije 4 - Turkey 5 - Marokko 5 - Marocco 6 - Kaapverdië 6 - Cape Verde
6 Heeft u betaald werk? 1 - ja Do you have a paid job? 1 - yes
2 - geen 2 - no
7
In welke klasse valt het gezamenlijke netto inkomen van het gehele huishouden?
minder dan € 1000 per maand In which class does your netto household income fall?
less than € 1000 per month tussen de € 1.000 en € 1.350 per maand between € 1000 and € 1350 per month tussen de € 1350 en € 1750per maand between € 1350 and € 1750per month tussen de € 1.750 en € 3.050 per maand between € 1750 and € 3050 per month € 3050 of meer per maand € 3050 or more per month
Annex 23. Table of Questionnaires “Rotterdam Leisure Survey”
Source : Author (2015) based on data provided by Rotterdam Municipality (2009)
96


