
MSc MARKETING ERASMUS UNIVERSITY ROTTERDAM … fileIndomaret Gula Pasir Sugar (Foods), as for the...
54
CONSUMER EVALUATIONS OF STORE BRANDS IN INDONESIA MSc MARKETING ERASMUS UNIVERSITY ROTTERDAM RAYMOND C.I SAMOSIR 477181
Transcript of MSc MARKETING ERASMUS UNIVERSITY ROTTERDAM … fileIndomaret Gula Pasir Sugar (Foods), as for the...
CONSUMER EVALUATIONS OF STORE BRANDS IN INDONESIA
MSc MARKETING
ERASMUS UNIVERSITY ROTTERDAM
RAYMOND C.I SAMOSIR
477181

ii
Acknowledgement
The present study is part of the requirements for a Master’s Degree in Marketing of Erasmus University
Rotterdam. In completing the study, I would express my appreciation to all stakeholders and everybody
that helped me throughout the process. First of all, I would like to give my highest gratitude to my
almighty God for his blessings, my parents and family for all the prayers and continuously supported me
morally and financially. I would also give my highest appreciation for my thesis supervisor Dr. Vardan
Avagyan for the coaching, guidance, reviews, and comments throughout the completion process of this
study. Lastly, I would also thank to all my friends in the Netherlands, and Indonesia, who have been very
helpful and supportive to me along the process.
Rotterdam, September 2018.
Raymond Samosir

iii
Executive Summary
The competition between retailers and manufacturer is growing globally. Business strategy in optimizing
the sales of the product is becoming more crucial. Decision makers and stakeholders are aiming to
execute their business plan accordingly, in that way constructing the right direction and robust business
plan are the key focus. Private labels, or more generally known as store brands, are the product of
retailers. It’s set to compete and match the move of National Brands in the same market. Annual targets
of the two type companies are formulated and set to achieve the sales growth. Consideration factors such
as market segmentation and product evaluation are some of the important factors that need to focus on
to be able to execute the business plan and achieve their expected sales performance accordingly.
Monitoring the market condition, moreover learning the consumer profile and needs are essentials. In
this study, consumers are evaluated based on their attitudes toward the store brand in Indonesia.
From the perspective of retailers, their key competitor is the presence of national brands. To match the
growing and expansion of the national brands over store brands, profiling the consumers’ evaluation
toward the store brands is the key to keep the retailers in the competition and expanding their business
through product expansion. Previous literature compiled more than 50 consumer traits that represent and
drive consumer evaluation towards brands. To limit the scope of the study, six consumer traits such as
Price Consciousness, Quality Consciousness, Innovativeness, Storage Constraint, Financial Constraint,
and the addition of Anxiety, as the representative of money attitude, are proposed and hypothetically
tested. Interaction of Price Consciousness and the presence of national brand is also added to capture the
effect of national brand in consumer evaluation set.
The research design of the study is conducted through an online experiment with 2x2 (Presence of
national brands: National brand absence, National brand presence) x 2 (Product type selection: Foods,
Home Care) factorial design. To acquire the sample responses, an online survey with two type of
questionnaire is shown for different subjects, the first questionnaire represents the state when national
brand is absent and the second represented with the presence of national brand. Store brands that are
being used in this study are represented with Indomaret Pink Passion Softener (Home Care) and
Indomaret Gula Pasir Sugar (Foods), as for the national brand the representative brands are Downy
Passion (Home Care) and Gulaku Gula Tebu Sugar (Foods). The acquired total samples is 311.
The regression model constructed with Store Brand Evaluation as the dependent variables and the Price
Consciousness, Quality Consciousness, Innovativeness, Storage Constraint, Financial Constraint,

iv
Anxiety, and the interaction variables of Price Consciousness with the presence of National Brands,
represented with dummy variables, as the independent variables. Based on the study, the reliability
analysis, correlation, and multicollinearity are checked and met the proposed hypothesis.
Overall, the result shows that consumers’ Innovativeness, Storage Constraint, Financial Constraint, and
Anxiety traits are significant towards the evaluation of store brand. The Innovativeness, Financial
Constraint, and Anxiety traits have a positively significant effect on the evaluation of store brands, it
indicates a linear effect where the more the consumers to be Innovative, tight financial budget, and have
high level of anxiety lead to a better store brand evaluation, which is in line with the proposed hypotheses.
The consumers with storage space issues negatively evaluate the store brands, which is also in line with
the proposed hypotheses. Moreover, consumers who are price sensitive is positively evaluated the store
brands when the national brand is present, meaning that they more in favor on store brands, therefore the
hypothesis in this interaction variables is accepted.
To conclude, this study is relevant and useful for the manager or decision-makers in the retail and
manufacture industries to be the foundation of insights of the managerial decision set, particularly in the
case of Indonesia as one of the emerging markets in Asia. Further studies need also need to be
implemented to complement this study as the limitation of the present study occurred in the case of
product, sample, and traits representativeness.
v
Table of Contents
Acknowledgement .................................................................................................................................... ii
Executive Summary ................................................................................................................................. iii
Table of Contents ...................................................................................................................................... v
1. Introduction ........................................................................................................................................... 1
1.1 Problem Orientation ........................................................................................................................ 1
1.2 Problem Statement .......................................................................................................................... 2
1.3 Academic Relevance ....................................................................................................................... 3
1.4 Managerial Relevance ..................................................................................................................... 3
2. Literature Review .................................................................................................................................. 5
2.1 Introduction ..................................................................................................................................... 5
2.2 Classification of retailer brands ....................................................................................................... 5
2.2.1 Store Brands .............................................................................................................................. 5
2.2.2 National brands ......................................................................................................................... 7
2.3 Store Brand Shopper characteristics................................................................................................ 8
2.4 Consumer decision-making styles approach ................................................................................. 10
2.5 Hypothesis Development .............................................................................................................. 11
2.6 Conceptual Framework ................................................................................................................. 16
3. Research Data and Methodology ........................................................................................................ 16
3.1 Research method ........................................................................................................................... 16
3.2 Research design ............................................................................................................................. 17
3.3 Manipulations ................................................................................................................................ 18
3.4 Measurement variables .................................................................................................................. 19
3.5 Data analysis.................................................................................................................................. 21
4. Results ................................................................................................................................................. 22
4.1 Data Collection Methodology ....................................................................................................... 22
4.2.1 Research Sample ..................................................................................................................... 23
4.2 Descriptive Statistics ..................................................................................................................... 24
4.2.2 Cronbach’s Alpha ................................................................................................................... 24
4.3 Correlations ................................................................................................................................... 26
4.4 Regression Analysis ...................................................................................................................... 29
4.4.1 Regression Model: Store Brand Evaluation ........................................................................... 29
4.4.2 Robustness Check ................................................................................................................... 32
vi
5. Discussion ........................................................................................................................................ 34
5.1 Managerial Implications ................................................................................................................ 35
5.2 Limitations and Further Research ................................................................................................. 38
References ............................................................................................................................................... 39
Appendix 1 – Questionnaire 1 and 2 ....................................................................................................... 43
Appendix 2 – Regression Results Store Brand Evaluation with Dummy and Demographic Variables . 47
Appendix 3 – Regression Results Store Brand Evaluation without Dummy ......................................... 48

1
1. Introduction
1.1 Problem Orientation
The world is growing dynamically. People tend to have more limitations, more workloads and more
needs. Level of consumption has been increasing significantly, the industrial competitions are growing
tightly. Private labels (PLs) are growing significantly, therefore create challenges to National Brands
(NBs) globally (Steenkamp, Heerde, and Geyskens, 2010). Moreover, in the case of Consumer-Packaged
Goods (CPG), private labels and national brands are competing head to head on targeting the same
consumer.
To optimize their brands’ performance, retailer is often linked with its intervention through their internal
business strategy. They are considered to have power in bargaining with manufacturers and controlling
the store shelf space (Steenkamp & DeKimpe, 1997). Store Brands growth and expansion have been a
challenge for manufacturers of consumer goods to develop national brands in order to maintain market
share within the competition, based on M+M Planet Retail (2004), store brands accounted approximately
more than 20% of global grocery sales and predicted to grow to 30% by 2020.
Although sales promotion common motivation is to deliver value to the consumer, manufacturers also
have organized strategies to encounter the competition challenges, such as reconsidering communication
budget from advertising to strengthening sales promotions, where it’s considered as an effective way to
combat the growth of store brands. National brands promotions might cause an effect on the store brands
sales, whether the promotions effectively attract the consumers to buy national brands or not. Store brand
average sales of approximately 30% less than national brands, where national brands typically give 20-
30% discounts (Sethuraman, 1992). It raises questions, whether the promotions activity attracts the same
consumers or not, because if they do, then there will be a tight competition war between retailers and
manufacturers.
The present study investigates factors that influence consumers evaluation of store brands.To identify
factors that affect the consumer in evaluating store brands, several consumer traits are evaluated in this
research. By investigating the consumer traits, it would provide an essential comparison basis on judging
this issue. The focus of the study considers consumers traits as the influence factors, controlling the
consumer demographic variables. The objective of this study is to provide the deeper understanding of
factors that drive consumers consideration on choosing store brands, identify the consumer segmentation
2
and guide to target the specific consumer segment. Therefore, the main research question of the present
study is:
What factors influence consumers towards the evaluation of Store Brands?
Previous research such as Sinha & Batra (1999), Aidawadi, Neslin and Gedenk (2001) Liu & Wang
(2008), have investigated factors that influenced consumers on using either Store Brands or Promoted
National Brands. Aidawadi et al. (2001) identify psychographic or demographic traits that potentially
drive usage of store brands and national brand promotions, in this study money attitudes variables are
included, such as Savings, Distrust, and Anxiety, which expected to capture the compulsive buying
behavior of national brands or store brands.
On this research, integration of factors is applied between consumer traits as psychographic factors with
adding the money attitudes factor. Some of the factors that have been investigated in the present study
are based on the foundation of consumer characteristic factors according to Consumer Styles Inventory
developed by Sproles and Kendall (1986) and Ailawadi et. al, (2001), which are Price Consciousness,
Quality Consciousness, Innovativeness, Storage Constraints, Financial Constraints, Anxiety and
demographic factors such as education, income, age. Interaction of the presence of National Brands is
also added, to analyze whether the presence of national brands affected the consumer evaluation on Store
Brands.
1.2 Problem Statement
The main research question of this present study:
What factors influence Consumer towards the evaluation of Store brands?
Sub-questions of Problem Statement:
1. Which consumer characteristics can be identified as the decision-making factors on Store Brands?
2. How does the influence of consumer characteristics differ on Store Brands with the presence of
National Brands?
3. How do consumer characteristics influence the evaluation of Store Brands?
4. What managerial insights and recommendations can be given to the Retailers regarding the consumer
profile?

3
1.3 Academic Relevance
Study on factors that influence consumers usage on Store and National Brands is essential for academics.
The knowledge in defining consumers buying behavior is expected to capture important insights that are
useful for brand development and product positioning. Findings of this study also expected to point out
consumer behavior on seeking the best value in the market. Previous research such as Urbany, Dickson,
and Kalapurakal (1996), Chandon, Wansink, and Laurent (2000), Voss, Spangenberg, Grohmand (2003),
derives the deal and store brand buying behavior from the economic/utilitarian returns, hedonic returns,
and costs. Moreover, Whelan & Davies (2006), Baltas & Argouslidis, (2007) examine consumer
segmentations in national brands and store brands buyers.
Previous research primarily focused on one or the other behavior, some of the research investigated the
character of deal-prone consumer in terms of demographics and psychographics (Blattberg & Neslin,
1990, Ch.3), others investigate the store brand-prone consumers (Richardson, Jain, and Dick, 1996;
Baltas and Doyle, 1998; Cunningham, Hardy and Imperia, 1982), Several previous studies have observed
each of the promoted national brands proneness or store brands proneness such as Laroche, Pons, Zgolli,
Cervellon and Kim (2003), Pechtl (2004), Batra and Sinha (2000). Moreover, few studies have
researched both deal proneness and private label proneness behaviors. Other studies such as Cotterill,
Putsis, and Dhar (2000) have constructed the Demand Equations for the share of both National and Store
Brands share, but the research doesn’t include the psychographic variables. The finding on Livesey and
Lennon (1978) analysis is whether price differentials could vary on consumers who purchased higher
price brand (National Brands) will switch to a lower price brand (Store Brands), or vice versa, however,
this research only consider price as its influenced factor.
The new area of the present research is the extension of consumer psychographic characteristics, where
money attitudes variables is included. Consumer demographic is also added to be able to capture the
relationship and effects of education, age, and income to the decision of store brands evaluation over
consumer characteristics.
1.4 Managerial Relevance
The competition between retailers and national brand owners have been growing tightly. Retailers and
national brands owner could set a different approach to marketing strategy focusing on those critical
factors. Retailers produce store brands that have several set various generating procedures to be able to
match and compete for national brands. While national brand owners are forced to match the aggressive

4
movement of retailers by applying different set of strategies in order to gain more market share than
retailers do. Therefore, defining the factors that influence consumer buying decision for store brands or
national brands is crucial and important. This study provides an analysis that could help both parties
design their programs according to each targeted segment.
Manufacturers could target segment that is appealing based on the analysis and create a marketing
strategy accordingly. For example, manufacturers could target the deal-focus consumer segment that is
appealing because of their quality-conscious and stock up their preferred brands. It means that strong
advertising message should be included in the promotion to trigger quality-consciousness consumer.
Moreover, manufacturers could also encourage stockpiling by suggesting a large purchase of quantities.
The promotion could be tailor-made according to specific targeted consumer segment needs.
On the other hand, retailers could also target their consumer segment and deploy several marketing
strategies. For example, retailers have a group of loyal store brand users, which are price-conscious
consumer and not quality conscious. The identified segments give retailers profile information on how
they behave towards the store brand products. Retailers could touch those group segments through their
shopper programs. Furthermore, the program could emphasize the everyday low-price products, which
is beneficial for consumers, where they do not need to worry about their stocks. Delivering into those
segments should be clear and simple because the segment might not be a shopping expert, so that the
programs could run effectively.
It is important to know which factors influence their buying behavior. Based on the information that
acquired by the study, manufacturers and retailers could have set of strategies that might reduce the
competition war between them, or, it is always possible that one of them could outperform each other if
they decided to go on the same segment. Therefore, this study is expected to provide several strategies
for both parties and answer questions on whether the manufacturer could combat store brands growth
through several marketing strategies.

5
2. Literature Review
This chapter shows the proposed factors that influence the evaluation of store brands. The major
discussion starts from the introduction part, this part provides the background development of store and
national brands, some important definitions and their classifications. The second part is the elaboration
from existing literatures regarding store brand evaluation. List of proposed hypotheses, and conceptual
framework is provided at the end of this chapter.
2.1 Introduction
Store Brands or Private Labels are created, owned, sold, and controlled by retailers. Major characteristic
of store brand is on their price, which is lower than national brands, where it’s also one of their
competitive advantage. Store Brands price is considered 25% lower in comparison to National Brands
(KPMG, 2004). Store Brands growth often linked with the economic conditions, its growth commonly
increased when the economics is in downturns and vice versa (Quelch & Harding, 1996, p.99). Store
brands also successfully maintain its growth throughout their development stage, where it can be a
potential threat for national brands. According to AC Nielsen (2005) global study, the growth of store
brands market share exceeds national brands in Consumer Packaged Goods (CPG) category.
2.2 Classification of retailer brands
Product in the retail industry is classified by two different categories: Store Brands and National Brands.
These two categories are described in this section.
2.2.1 Store Brands
The term of Store brands often expressed in various name such as private labels (Cotterill, Pusis and
Dhar, 2000), own labels (Veloutsou et al., 2004) or retailer’s products (Binninger, 2008). These
expressions mainly refer to the same definition as Store Brands.
Retailers labeled their product as their store brands, where it stands as their product identity and as the
owner of the products (Jonas & Roosen, 2005). The retailers as product owner, have the right to create
their own market strategies to be able to compete with other brands and therefore generates profits. The
decisions that they make are vary, with the main objective is to survive and winning the market
competition. Retailers could decide the strategy of their product by designing the look of the product, or
even the placement of the product in the store shelf depends on the planogram (Morton & Zettelmeyer,
6
2004), the shelf layout is where competing Stock Keeping Units (SKUs) are positioned to side by side
across different kind of brands (Steenkamp, Heerde, and Geyskens, 2010).
To be competing in the market, product packaging is an important factor for retailers to focus on.
Distinctive product packaging is considered as crucial in deploying consumer perceptions of the brand.
It influences the consumer perceived quality of the product. Many retailers generally copy the product
packaging of the national brands, this strategy of retailers is important for the product competition. It’s
objective generally is trying to create the same perceived quality of national brand product in the
consumer mind, and this copycatting often become area of conflict between national brand and store
brand (Kapferer, 1995).
The position of store brand in pricing is generally lower than national brand. On the other hands store
brand is considered as slightly more expensive than generic brand, brand that has no name on it and
usually the products are packaged with white label and little information of the manufacturer (Dick, Jain,
Richardson, 1995). In the supermarket, store brand average price is 10-30% lower than national brands
(Baltas, 1997), but it’s not also considered as the cheapest because generic brands are cheaper than store
brands. Moreover, making sense from the price and quality relationship, the generic brands don’t have
better quality product than store brands, overall based on the price and quality criteria the position of
store brand is between the generic brands and national brand.
The development of private labels is different in the global scale. Switzerland, the country that has the
most private label, has 38% of their total market, where Great Britain has 31% of their total market, and
moreover in Taiwan, private labels accounted for approximately 10% of sales overall in the supermarket
chains in 2003 (Liu & Wang, 2008). These developments are constructed from the PL life cycle that has
been growing in those countries and globally. The Private Labels life cycle could be distinguished
between two stages: Development and Maturity (Steenkamp, Heerde, and Geyskens, 2010).
The introduction of Private Labels in mature economics country North America and Western Europe
were much earlier than in developing countries, such as in Asia-Pacific and Eastern Europe regions.
Emerging countries have different economic and marketing conditions toward the development of
Private Labels. It is different with the other countries with mature economics condition (Burgess and
Steenkamp 2006). In their development, growing private labels takes time, because the process involved
consumer perception and perceived quality of the product, where it takes time to process such results
(Mitra and Golder 2006). The quality gap between Private Labels and National Labels is smaller in
mature economics countries rather than the developing countries.

7
2.2.2 National brands
National brands often linked with other definitions such as leader-, manufacturer-, or original brands are
owned by manufacturers and their brand managers, it is generally known as the brand leader of a product
category (Kapferer, 1995). The product availability of National Brands can also be bought at almost
every store channel (Richardson et al., 1996), this makes National Brand has more advantage rather than
Store Brands regarding the product distribution.
National brands marketed their product through national market and usually involved and promoted by
large manufacturers. In the past period of retail development, national brands have high negotiation
power over other kind of brands. Store brands and other brands were still in the development stage
process so there was low competition to match the National Brands. This resulted in high negotiation
power and shelf allocation in stores and markets. Throughout the development of other brands, the power
of national brand has changed on recent years.
Important concern that national brand should aware to is the growing quality and market of private labels.
The private labels are improving in almost every factor, such as lower price, similar quality, and have
the power to dominate the shelf, since retailers could deploy the strategy on their own stores. National
brands generally known for its quality. Where national brands have better quality than store brands but
with higher price. In the mature store brands development, some of them even have the similar quality,
which makes the competition even tighter. This development has been a threat for national brands
existence if national brands don’t innovate and expands their products. Overall, the market share of
manufacturer brands could decrease if the products are going to be perceived as similar in the customer
perception.
Although Store Brands in the product development are improving and could become threat to National
Brands, there are some strategies that National Brands would implement to cater the competition between
them, according to Quelch and Harding (1996) National Brands could implement the price promotion
strategy to respond Store Brands. Many manufacturers have to accept the reality of losing sales volume
because of the competition, to respond this challenge change in price is also one of the alternatives that
manufacturers could do (Hauser and Shugan, 1983) to combat the growing of Store Brands, companies
such as Kellogg, General Mills and Heinz had implemented price increase to retain their growth or profits
despite the loss of sales volume caused by the Store Brands performance (Facenda, 2008).

8
2.3 Store Brand Shopper characteristics
There have been several researches investigating the elaboration between consumer decision making
styles and Store Brands evaluation. Prior researches used different approaches defining the consumer
decision making styles such as consumer characteristic approach, consumer psychographic approach and
the consumer typology approach, generally these approaches aim to generate profile regarding different
types of shopper. There are also different types of consumer motivational traits that has been used in the
prior literatures such as price consciousness, quality consciousness, brand loyalty, brand sensitivity,
enjoyment, innovativeness. These motivational traits are the most frequently used in the prior literatures.
Prior literature by Dick et al., 1995, investigate the characteristics of store brands prone consumer by
identifying the store brands heavy buyer’s profile and compare them with the light consumers profile,
variables such as demographics, socio-economic and attitudinal variables are included in this research.
The attitudinal variables are perceived quality, perceived risk, perceived value for money and familiarity
with store brands, on the socio demographics the variables are marital status, age, household size, and
family income. The total number of samples that participated in this survey is 1.353 respondents, where
they are shoppers that were randomly intercepted at several shopping malls representing 46% response
rate. The respondents were asked questions about their demographic profile and frequency of store brand
purchase of 28 store products, the attitudinal variables information was collected using Likert-scales. The
results show that younger, unmarried and smaller sized households tend to avoid buying store brands.
Moreover, the comparison of heavy and light store buyers shows that light store brands buyers are
perceived store brands as less familiar and also perceived them to have lower quality, less value for
money and a risky choice.
Other literature is from Ailawadi, Neslin and Gedenk (2001), the research objective is to determine
whether national brand promotions and store brands attract the same value-conscious consumers, where
retailers and manufacturers are the stakeholders that involved in the competition. This research used
demographic and consumer characteristics to identify the characteristics of consumers who buy either
store brands or national brands on promotions (in store and out of store). The data were collected in the
U.S through intercept survey in a mall, the total sample is 319 respondents. The traits that used in this
research are price consciousness, financial constraints, quality consciousness, shopping enjoyment,
innovativeness, variety-seeking, impulsiveness, mavenism, motivation to conform, brand loyalty, store
loyalty, planning, time pressure, need for recognition, and storage space. A five-point Likert-scale is used
to construct the measurement. They also add demographic variables such as gender, age, educational

9
level, employment, income, children and house versus apartment as living place. Results from this
research show that there is a difference in the effect of psychographic traits on store and promotion brands
usage, where store brands consumers are captured as price conscious, less quality conscious and loyal to
stores.
In 2005, Jin & Suh investigated the effect of consumer perception factors in predicting the purchase of
private brand in Korean discount store. They propose a model that integrates four consumer characteristic
variables such as price consciousness, value consciousness, perceived price variation and consumer
innovation, toward private brand attitude and purchase intention. The model is tested on two product
categories, grocery and home appliances in South Korean discount store. A measurement of five-point
Likert-scale was used to measure the variables. Demographic characteristics variables such as age,
monthly average income, and size of the household were also added. The research result is that the effect
of consumer factors differs depends on the product category. From the four consumer characteristics,
only three in each category has direct and indirect effect on the purchase intention of private brand. There
is no relationship between the perceived quality variable in food category, price consciousness in home
appliance category, toward private brand purchase intention or private brand attitude. In both categories,
the value consciousness and consumer innovativeness variables predict the private brand attitude.
Consumer innovativeness was the strongest factor that predicts the Korean shoppers of private labels.
In 2008, Martinez and Montaner examined and updated profile of the store brand consumer in Spain.
This paper investigates both socio-demographic and psychographic variables, where the psychographic
variables are based on the previous research done by Ailawadi, Neslin, and Gedenk in the U.S. They
identified 13 consumer traits as the independent variables, the consumer traits are price consciousness,
financial constraints, quality consciousness, shopping enjoyment, innovativeness, variety seeking,
impulsiveness, market mavenism, brand loyalty, store loyalty, shopping planning, time pressure and
storage constraints. The socio demographic factors are studies, children, employment, age and income.
They collected the data from 425 grocery shoppers in Spain using survey with quota sampling method.
Respondents asked to rate their opinion on the consumer factors with the measurement of five-point
Likert Scale. The model constructs the proneness as the dependent variables and the 13 consumer traits
as the independent variables, another regression also performed with the addition of the socio-
demographic factors effect on private label proneness. The results show that consumer profile model
explain better than the socio-demographic model on the effect of store brand proneness. Martinez and
Montaner identified that Spanish private label consumers are buyers with low quality consciousness,
10
price conscious, high store loyalty, variety seekers, market mavens, and don’t have much time and space
for stockpiling products.
Steenkamp, Heerde, and Geyskens, (2010) literature examined what makes consumer willing to pay for
national brands over private labels. They specify effects of marketing and manufacturing factors on
consumers’ willingness to pay, taken into account that the effect is mediated by consumer perceptions
on the quality of national Brands related to private labels. Second, they specify the effects of the factors
on willingness to pay depends on the development stage of the country, whether it is still developing or
mature. The data in the research consists of survey with 22.623 respondents from 23 countries in four
continents, the data collected through web survey and mall intercepts. Respondents were people who
primarily in charge of grocery purchases in their households. Results show that in country where private
label is still in development stage, distinctive packaging and brand advertising still plays an important
part for the growing of national brands, it is considered more effective in increasing the perceived quality
of national brands over private labels. On the manufacturing side, the belief that private labels are
produced by national brands manufacturers exerts a stronger influence on the perceived quality gap in
the private labels mature stage country rather than in the developing stage country.
2.4 Consumer decision-making styles approach
According to Sproles (1985) consumer decision making styles refers to a patterned, mental, cognitive,
orientation towards shopping and purchasing, it is constantly ruling the consumers’ choice patterns which
generate the relative consumer personality. Walsh et. al (2001) describe that the Consumer Styles
Inventory (CSI), which developed by Sproles and Kendall at 1986, as a more comprehensive instrument
to measure the consumer decision-making traits other than other previous literatures that have been
identified some of the traits such as brand/store loyalty (Moschis, 1976), quality consciousness (Darden
and Ashton, 1974), or value consciousness (McDonald, 1993).
In 1986 Sproles and Kendall developed and designed CSI where it measures eight characteristics of
consumer decision-making, measured by five-point Likert Scale, through a sample data of 501 U.S High
School home economics students. The factor analysis then suggested eight characteristics of decision
making traits, perfectionism or high-quality consciousness, brand consciousness, novelty-fashion
consciousness, recreational/hedonistic shopping consciousness, price and value for money
consciousness, impulsive and careless tendencies, confused by overchoice and brand loyalty.

11
The CSI become a foundation of traits for other literatures as a useful tool to characterize consumer
decision-making styles to capture the consumer shopping behavior, according to Walsh et. al (2001) it’s
also represents the most-tested instrument to assist marketers in examining cross-cultural decision-
making styles, a single instrument is believed as a desirable tool to identify and compare similarities and
differences in consumer decision making-styles between different countries. Moreover, it provides
profiles of segmented consumers which can be useful for brand and consumer targeting strategies.
2.5 Hypothesis Development
The consumer characteristic approach is being used in the present research. It represents the consumer
mental orientations of cognitive and affective characteristics involved in the decision-making, it also
combines variables that represent Economic and Hedonic characters. Motivational traits used in this
research are Quality Consciousness, Price Consciousness, Innovativeness and Storage Constraints. The
variables Quality and Price Consciousness are selected because these variables represent the economic
benefits attitudes consumers which drives the consumer decision-making on evaluating store brands.
Innovativeness is selected to represent the hedonic benefits of consumers behavior, the selection of
economic and hedonic attributes applied in this research are used to represent the consumer decision-
making traits as the drivers of store brand evaluations (Ailawadi et. al, 2001), it is also the most frequently
used variables in previous literatures and match the CSI model which developed by Kendall & Sproles
(1986). The money attitude characters such as Price Consciousness, Financial Constraints, and Anxiety
are also included in this research to capture the compulsive buying which influenced purchase attitudes
(Robert and Jones, 2001; Yamaguchi, 2003).
Price Consciousness
Price consciousness consumers are sensitive to price and having a distrust factor toward monetary
situations (Robert and Jones, 2001). It represents the money attitude of consumers, people who
considered as distrust usually have a high doubtful regarding situations that involved money, they also
considered as suspicious and hesitant (Yamauchi & Templer, 1982). While making the purchase
decisions, people who is price concscious show low confidence to decide whether buying a product at
certain times or not.
According to Hansen et al. (2006), previous research indicates that private label consumers are more
price sensitive than national brand consumers. The macro-economic condition also has an influence on
the consumption and distrust level of consumers, for example according to Lamey (2007), store brands

12
consumption increases when the economy is in downturn and decreases when the economy condition is
getting better. Private labels offer lower price than national brands in the grocery industry, therefore price
consciousness should be an important factor for store brands consumers (Batra & Sinha, 2000).
National brand promotions are classified based on lowering the price directly, such as sale discount,
coupons, etc., and with no price incentive promotions, such as free gifts or buy 1 get 1 free (Blattberg &
Neslin, 1990), therefore consumers would be less favorable on the promoted products, because consumer
who is considered as price conscious is more concerned with the price margin resulted instead of no price
incentives promotion. I suggest that when consumers are more price sensitive they positively evaluate
store brands. Hence, the following hypothesis is suggested:
H1a: The more Price conscious the consumers, the better they evaluate the store brands.
H1b: Price conscious consumers evaluate store brands more positively with the presence of national
brand than when national brand is absent.
In present research the presence of National brand is the moderator between the price conscious variable
and the evaluation of store brands. I suggest the moderating variable of national brand presence to support
the relationship, because price conscious consumers evaluate the store brand positively when the national
brand is present. The presence of national brand is expected to be a comparison between the two different
products, where the price plays an important factor. Store brands have the lower price advantage compare
to national brands, therefore it is expected that price conscious consumers evaluate store brands more
positively than the national brands.
Quality Consciousness
National brand product is often described to have higher quality than store brand products. Throughout
the development of store brands, it has been growing to match the quality of national brands. Quality
conscious customer generally distinguish the quality of store and national brands. Some of store brands
product were also made from other big manufacturers so that they have similar quality than national
brands, according to Consumer Reports (2009, p. 16) stated that "many big-name companies make their
usual types of products for the stores.", this report states that manufacture companies such as Alcoa,
Bausch & Lomb, Del Monte, McCormick, and Heinz, involve in manufacturing the store brands (Kumar
and Steenkamp 2007),

13
Even though some manufacturers engage in store brands production, the quality of store brands are
perceived to be inferior than national brands (Cunningham, Hardy, and Imperia 1982; Richardson, Dick,
and Jain 1994). Moreover, the existence of national brands even when it’s promoted, would not affected
and influenced the consumer because the quality-conscious consumer can distinguish the quality that the
two brands deliver. Therefore, the following hypothesis is suggested:
H2: Higher Quality Consciousness leads to less evaluation of store brands.
Innovativeness
Exploration suggests characteristics such as innovation, impulsiveness and variety seeking.
Innovativeness represents Hedonic behavior of consumers (Ailawadi et. al, 2001). Innovation encourage
consumers to seek other variance of products, instead of buying the same routine products. Promotions
on national brands positively associated the usage of national brands because deals encourage consumers
to product trial (Montgomery, 1971). While for store brands, it remains unclear to predict whether the
relationship with store brand usage would be, because it depends on the way of viewing the consumers.
The relationship between store brand usage and innovative is positive if store brands are viewed as new
and untried by the innovative consumers (Granzin 1981) or negative if the consumer view them as an
ordinary product. In Asian grocery market, private labels are relatively still in development stage and
might induce impulsiveness and generates Innovativeness of consumers where they might perceive the
store brands products as a different variance of products. Innovators consumers might be attracted by
store brands, because they are open and willing to try and experience new products or one with higher
risk associated, therefore the Innovators consumers buy the store brands product and it is expected
innovativeness to be positively associated with store brand proneness (Granzin, 1981; Jin and Suh, 2005;
Whelan and Davies, 2006).
Therefore, the following hypothesis is suggested:
H3: The higher the consumer innovativeness, the better the evaluation of store brands.
Storage Constraints
Inventory holding costs depends on the availability of the consumer storage space. The purchase of store
brands is related with the inventory storage space. Consumers tend to stock piling some products where
there was a special product offering. To be able to stockpile, it’s essential to have sufficient storage space
so that it makes the consumers feel safe about the product stock and at the same time it cuts down future

14
potential time to do grocery shopping again. Stocking up product is favorable when there are deals or
promotion on the national brands (Blattberg et al., 1978). It’s expected that if there is a promotion on
national brands it triggers consumers to purchase and increase their stocks.
In private labels, the products are always available with lower price than national brands. It’s reasonably
accepted that consumers feel less favorable to stock up the store brands product. There is no pressure for
consumers to take the store brands product right away, it’s different with national brands where it creates
pressure to consumers with their limited time of promotions. Household with little storage or in other
words having storage constraints can consider store brands as an opportunity and efficient products, since
they offer good prices with no time constraints and consumer would not worry to purchase big quantities
of promoted national brands for stock keeping (Ailawadi et. al, 2001; Martinez and Montaner. 2008).
Therefore, the following hypothesis is suggested:
H4: The higher the storage constraints, the less the evaluation of store brands.
Financial Constraints
Price savings are related to consumers that are considered as price conscious and usually having a
background of financial constraints. People who do savings considered as high retention time consumer
where they do plann for their future financial expectations and monitor their financial situation with high
disciplined (Yamauchi and Templer 1982). These consumers are people that highly concerned to save
their money, they tend to be much wiser and controlling their financial conditions regarding the unknown
future economic conditions.
Price consciousness is important for both manufacturers and retailers. To be able to have a better price
positioning, monitoring the price gap between store brands and national brands is important (Hansen et
al., 2006) and retailers should create strategies in closing the price gap. Moreover, manufacturers have
constraint in maintaining the price, where they can’t easily change the price because it could lead to
several issues related to financial performance and the reduced margins might create a chance of profit
loss (Sethuraman & Cole, 1999)
Private labels or store brands have lower prices than National Brand, the average store brand price is
approximately sells 30% lower than national brands (Information Resources Inc., 1998), consequently
consumers with financial constraints tend to have higher intention to save, who is considered to have
strong money attitude, would prefer private labels than national brands, because by using private labels

15
they might have better price margin and enables them to save more (Liu & Wang, 2008). Customers who
pursue the transaction utility are more in favor of private labels rather than national brands (Burton et al.,
1998).
Because store brands have lower prices than national brand, therefore it offers more savings, the
following hypothesis is suggested:
H5: The higher the financial constraints, the better the evaluation of store brands.
Anxiety
People with high anxiety tends to see money as their protection. High anxiety consumers considered as
easily worried and demonstrate high level of nervousness, especially on conditions that they are limited
with the financial budget. Moreover, anxious consumers tend to become compulsive buyer. Decision
making on consumption choice becomes crucial especially for consumers with high psychological risk.
Psychological risk may affect consumer self-esteem and might also negatively affected their decision
making. Anxiety also plays part in determining consumer’s psychological risk, where it can be defined
as anticipations to the condition such as worrying and regrets (Mitchell and Harris, 2005). Store brands
generally display a basic store image on quality and price (Goldsmith et al., 2010), where it generates an
image of alternatives to the national brands and help consumer doubts and psychological risk when it
comes to buying decision.
According to Liu & Wang (2008) they anxiety level is increasing when the consumers feel insecure of
their low financial conditions, they also suggested that anxious consumer might be more in favor of store
brands, because store brands are always available at lower price than national brands.
Therefore, the following hypothesis is suggested:
H6: The higher the Anxiety level, the better the evaluation of store brands.

16
2.6 Conceptual Framework
Figure 1 Conceptual Framework
*The presence of national brands only moderates the price consciousness
Figure 1 shows the conceptual framework of six consumer traits directions toward the store brand
evaluation. The independent variables of Price Consciousness, Quality Consciousness, Innovativeness,
Financial Constraints, and Anxiety (represented by hypotheses H1a, H2, H3, H5, and H6) are positively
affect the store brand evaluation, while the Storage Constraint (H4) is negatively influence the store brand
evaluation. The variable of presence of national brands is created (H1b) to capture the moderating effect
on Price Consciousness consumer towards the evaluation of store brands.
3. Research Data and Methodology
3.1 Research method
A quantitative research design through online experiment was used in order to measure the effect of
consumer characteristics on the evaluation of the store brands. Specific hypotheses were tested and
identified according to the proposed relationships. In the present research, the single cross-sectional
survey method, where the data collections are done at one specific point in time. To optimize time
constraint, the data collection is conducted through an online experiment. The experiment was conducted

17
through online survey to measure the consumers psychographic traits and their evaluation toward private
labels.
Although it has been predicted that research method with survey has its advantages, there are some
disadvantages that need to be controlled (Malhotra and Birks, 2007). High speed data collection is one
of the main important advantage by doing online survey, it is expected that it reached wide samples
without concerning the consumers’ location and time. There are some disadvantages using online
experiment that might occur such as the unwillingness of the respondent to participate in the survey and
low validity responses from the respondents, therefore incentive is being offered. It is also important to
formulate the questionnaire correctly according to each variables measurement to avoid data bias.
3.2 Research design
To test the hypotheses, this present research is conducted using online experiment (Qualtrics). The 2
(Presence of national brands: National brand absence, National brand presence) x 2 (Product type
selection: Foods, Home Care) factorial design was used in the experiment, where the presence of national
brands is between subject design and the product type selection is the within subject design. The survey
asked consumers to evaluate the store brands with two product types selection, Foods (sugar) and Home
Care (softener) with additional condition where national brand is present or absent. The design of the
survey that is conducted contains a short introduction at the beginning of the survey, the total time to
finish the questions are provided. The respondents were asked to evaluate two product categories of store
brand, which are beverages and softener.
In the present research a single cross-sectional design is used, where the sample of respondents were
collected from a targeted population, the respondents are Indonesian males and females above 18 years
old who is responsible for grocery shopping in Indonesia. Total samples data set in this study is expected
to be contacted more than 200 consumers, where it would reach the same minimum sample size of a
marketing study that had done by Malhotra and Birks (2007). The samples were contacted differently,
where half of the total samples were assigned the first condition survey where the national brand is
present, and the other half were assigned the second condition where the national brand is absent, the
objective of separating the two conditions is to generate different kinds of response and used as
comparison between the two results.

18
3.3 Manipulations
Brands that are being used in the present research are real life situation brand in Indonesia grocery store,
Indomaret, a chain store that is rapidly growing in Indonesia (Accenture, 2009). Table 1 shows the
product category of the store brands and national brands.
Table 1
Product Category Store Brand National Brand
Home care Indomaret Softener Pink Passion 900ml Downy Softener Passion 1.5L
Foods Indomaret Sugar 1kg Gulaku Sugar 1kg
The main reason by choosing the two products above as the representation of the two brands is because
of the they are available in the two product categories and it is perceived as a product that is being used
to fulfill the basic needs of the consumers in Indonesia, or in other words it is the product that constantly
purchased on a daily base in the store. Moreover, the two products serve the daily needs of Indonesian
consumer, whether it is females or males and it is also not expensive, therefore it is expected that
respondents would not have constraints while participating in the survey. Although this current study
does not identify the effect of product category to the consumers’ store brand evaluation, the purpose
analyzing the two different products is considered useful for constructing the foundation and gaining
wider insights on the consumers’ evaluation of store brands.
Based on the Euromonitor report (2016), Indomaret as convenience store growth has been explosive
more than tripling in size since 2006 and accounted 39% of total sales around US$ 4.1 billion in 2011.
Indomaret store brand has been chosen because they have variety of store brands with lower prices
compare to the national brands, collaborations with local manufacturers also have been done to secure
the quality of the products. For the national brands, Downy and Gulaku are choosed because those two
products share the similarity with the two store brands, moreover these two national brands are also the
well-known brands in the category of home care and foods.
The presence of national brands is conducted in the second manipulation survey. The respondents with
the condition where the national brand present were assigned to the questionnaire both with store brand,
Indomaret’s sugar and softener, and national brand pictures, Downy softener and Gulaku sugar. Besides,
respondents which assigned with the absence condition of national brands, were only graphically
displayed with picture of store brand products. It was expected that respondents would be able to evaluate

19
the survey more clearly regarding the two conditions in the manipulation (see Appendix 1 for the
questionnaire).
3.4 Measurement variables
The measurement of the variables in this present study is conducted and implemented using previous
literatures measurement conducted by Ailawadi et. al, (2001) and Robert and Jones (2001) measurement
on the effect of money attitude variables. The respondents were asked to answer three part of questions,
the first part of the questions is to rate regarding the consumer characteristics variables (Price
Consciousness, Quality Consciousness, Innovativeness, Financial Constraints, Storage Constraints, and
Anxiety) using five-point Likert-scales (1= “strongly disagree”, 5= “strongly agree”). The second part
covers the consumer evaluation towards store brand, in the last part provides questions regarding the
consumer demographic.
Price Consciousness
In this study, questions regarding the price consciousness were asked to measure the relationship between
price consciousness consumer and their evaluation towards store brands. Questions were given to the
respondents to capture the consumer characteristic variable of price consciousness. Respondents were
given questions: “I always compare prices between different brands before I choose one”, “I compare
prices to take advantage of special offers”, “I find myself checking the prices even for small items”.
Respondents were asked to give their preferences based on 5-point of Likert-scale, where 1 indicate
strongly disagree and 5 indicate strongly agree.
Quality Consciousness
According to Martinez and Montaner (2008), quality conscious consumers will evaluate store brands
negatively in spite of their low quality compared to the national brands. The survey provides questions
to define the quality conscious consumers. The measurement in the questions is 5-point Likert scale (1=
Strongly disagree, 5=Strongly agree) and there are three questions regarding the attitude of respondents
toward product quality provided to characterize the respondents’ preference. The questions that are
provided in the survey are “I will not give up high-quality product for a lower price”, “I always buy the
best product”, “It is important to me to buy high quality products”.
20
Innovativeness
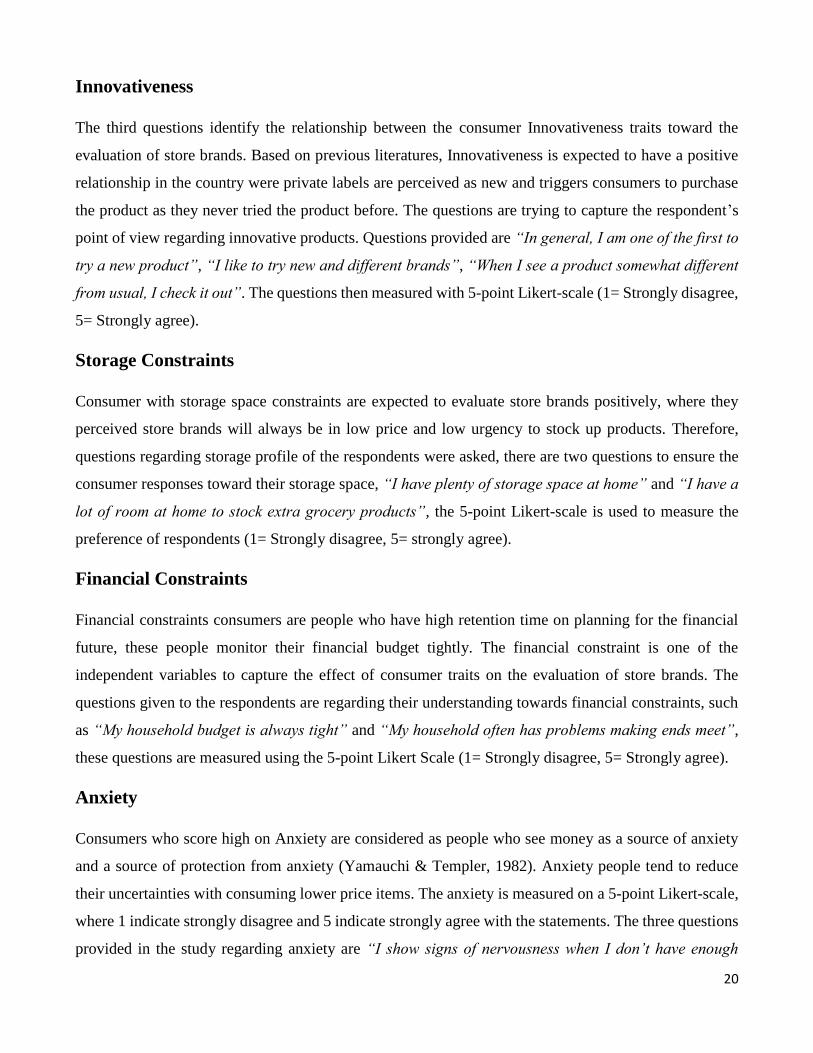
The third questions identify the relationship between the consumer Innovativeness traits toward the
evaluation of store brands. Based on previous literatures, Innovativeness is expected to have a positive
relationship in the country were private labels are perceived as new and triggers consumers to purchase
the product as they never tried the product before. The questions are trying to capture the respondent’s
point of view regarding innovative products. Questions provided are “In general, I am one of the first to
try a new product”, “I like to try new and different brands”, “When I see a product somewhat different
from usual, I check it out”. The questions then measured with 5-point Likert-scale (1= Strongly disagree,
5= Strongly agree).
Storage Constraints
Consumer with storage space constraints are expected to evaluate store brands positively, where they
perceived store brands will always be in low price and low urgency to stock up products. Therefore,
questions regarding storage profile of the respondents were asked, there are two questions to ensure the
consumer responses toward their storage space, “I have plenty of storage space at home” and “I have a
lot of room at home to stock extra grocery products”, the 5-point Likert-scale is used to measure the
preference of respondents (1= Strongly disagree, 5= strongly agree).
Financial Constraints
Financial constraints consumers are people who have high retention time on planning for the financial
future, these people monitor their financial budget tightly. The financial constraint is one of the
independent variables to capture the effect of consumer traits on the evaluation of store brands. The
questions given to the respondents are regarding their understanding towards financial constraints, such
as “My household budget is always tight” and “My household often has problems making ends meet”,
these questions are measured using the 5-point Likert Scale (1= Strongly disagree, 5= Strongly agree).
Anxiety
Consumers who score high on Anxiety are considered as people who see money as a source of anxiety
and a source of protection from anxiety (Yamauchi & Templer, 1982). Anxiety people tend to reduce
their uncertainties with consuming lower price items. The anxiety is measured on a 5-point Likert-scale,
where 1 indicate strongly disagree and 5 indicate strongly agree with the statements. The three questions
provided in the study regarding anxiety are “I show signs of nervousness when I don’t have enough

21
money”, “I spend money to make myself feel better”, “I automatically say, “I can’t afford it” whether I
can or not”. These questions are expected to capture the relationship between anxiety and store brand
evaluation.
Brand evaluation
In the second part of the survey, questions regarding the consumers’ brand evaluation are measured with
three evaluations based on study conducted by d’Astous and Gargouri (2001). The evaluations are
perceived quality, overall liking and buying intention. The store brands profile such as price, brand
names, volume and visuals are provided. Respondents are shown picture of the two store brands, which
are Indomaret Sugar and Indomaret softener Pink Passion. They give their evaluation regarding those
store brands, where a 5-point Likert-scale is used to measure the product evaluation.
The 5-point Likert-scale is used as the measurement of store brands evaluation. For the perceived quality
measurement, 1 indicate very poor quality and 5 indicate very good quality, the overall liking is measured
with 1 as “I don’t like the product at all” and 5 as “I like the product very much”. Lastly, for the buying
intention variable, the measurement is 1= “I would never buy this product” and 5= “I would certainly
buy this product”.
The conditions are also applied for the presence of national brand in the within subject design survey.
Visuals and product profile for both store and national brand is displayed in the questionnaire. Therefore,
respondents were asked to give evaluations based on the perceived quality, overall liking and buying
intention. The measurement that is being applied is 5-point Likert-scale, with each evaluation shares the
same indications.
The demographic variables are displayed at the last section of the survey, questions regarding the
consumer demographic variables of education, income and age are provided. The Age variable is an open
question, where respondents fill the number according to their age. While for Income variable, it is
measured as an ordinal variable, in the survey it describes four income levels. Lastly, the education
variable is measured as “High school or less”, “Bachelor’s degree”, and “Master degree”.
3.5 Data analysis
There might also be a great deal of proof that the method gets bias because of the validity of the items,
the reliability of the items, and covariation between the constructs. According to MacKenzie and
Podsakoff (2012), the probability of method bias can be detected through some important mechanisms,

22
such as adjusting the capabilities of respondents, it’s important to avoid respondents’ less motivation to
respond accurately, creating the task to be not too difficult so that it can be the foundation of analyzing
which factors produce the biased effect, that can be known from the desire of respondents on providing
the answers either based on their optimal or just satisfactory answer. Several remedies can also be applied
to the effects, for example respondents’ accuracy can be increased through setting the right task difficulty,
moreover enhancing their motivations to answer the questions accurately is also important and can be
done through providing explanation of the importance of the questions, avoid vague concepts, and the
language needs to be crystal clear and concise. These mechanisms and remedies are applied in this
research to generate high validity and non-biased results.
Statistical analysis is used to identify the data than has been collected through the survey. Using SPSS
software, the representativeness of the final sample data is identified and examined, moreover the
Cronbach’s alpha is performed to check the independent and dependent variables internal consistency.
Then, the model would be constructed to compute the correlation coefficients of all variables
relationships. Lastly, a multiple regression model analysis is performed and tested to measure the effect
of consumer decision-making traits on the evaluation of store brands.
4. Results
In this chapter the result of this research is discussed. All the research hypotheses and the model are
tested through regression analysis. Before the regression analysis and correlations test, this chapter
provides data collection method, research sample, descriptive analysis, preparing the data sets
consecutively.
4.1 Data Collection Methodology
The data collection was done through an online survey. The data was distributed to 311 Indonesian
consumer samples, which is responsible to do the grocery shopping. The number of samples exceed the
target that has been set before, which was 200. They were given different set of questions, 182 of the
samples was assigned to the questionnaire without the presence of national brands, 129 of them are given
the questionnaire with the presence of national brands. The targeted population is Indonesian consumer
who is older than 18 years old and has been done a grocery shopping.

23
4.2.1 Research Sample
In this part the demographic data of the research is discussed. The data sets are available in the Table 2
(see below). The demographic data are consisted of Gender, Age, Income, and Education. From the table
below the overview of the total respondents are separated between the questionnaire with the presence
of national brands and the one without the presence of national brands. The gender representations are
relatively equal in the model with the presence of national brands (52% for male and 48% for female),
while on the other model the male sample is slightly bigger (62%) than the female (38%). Most og the
sample age is from 25-34 with 77% in the model without the presence of national brands and 50% in the
model with the presence of national brands. In the income variables most of the sample (55% and 64%)
have monthly income below Rp 9.999.999,00 and only few samples (2% and 6%) have income more
than Rp 30.000.000,00. Moreover, on the education variable 81% of total samples in the model without
the presence of national brands and 71% in the model with the presence of national brands are bachelor
graduates.
Table 2. Demographic data sets
The descriptive statistics of the dependent and independent variables can be seen based on the table 3
below. The table shows that the samples in both model are highly price conscious and quality conscious,
where in the model with the presence of national brand the mean of price consciousness and quality
Gender
Male 113 (62%) 67 (52%)
Female 69 (38%) 62 (48%)
Age
18-24 38 (21%) 39 (30%)
25-34 140 (77%) 65 (50%)
35-44 4 (2%) 25 (19%)
Income
<9.999 101 (55%) 82 (64%)
10-19.999 68 (37%) 34 (26%)
20-29.999 9 (5%) 5 (4%)
>30.000 4 (2%) 8 (6%)
Education
High School 14 (8%) 15 (12%)
Bachelor 147 (81%) 92 (71%)
Master 21 (12%) 22 (17%)
Sample Size 182 129
Without NB With NBDescriptive

24
consciousness are the highest (4.04 and 4.07), it’s also similar in the model without the presence of
national brands, in this model the sample is more price conscious (4.07) comparing to the quality
consciousness (4.01). In comparison to the model without the presence of national brand, the sample in
the model with presence of national brand is moderately more Innovative and Anxious, where the sample
in the other model is more prone to storage issue and considered to be more financially constrained.
Moreover, in the model with the presence of national brands, the sample would evaluate the store brand
Indomaret Pink Passion better than without the presence of national brands (3.23 over 3.05). For the
brand Indomaret Gula Tebu, the sample that filled the questionnaire with the presence of national brands
would favor less than the sample without the presence of national brands (3.36 over 3.51). Overall, the
standard deviation is considered normal, ranging from 0.60 to 0.89, which implies that both model data
sets are moderately dispersed.
Table 3 Descriptive Statistics
4.2 Descriptive Statistics
4.2.2 Cronbach’s Alpha
Cronbach’s alpha is an index to validate the reliability of the scale being used in the research, it measures
the internal consistency. The threshold that is being used in the Cronbach is α ≥ 0.7, which refers as
acceptable in the measurement scale (Nunnally, 1978).
Cronbach’s Alpha Dependent Variables
The dependent variables in this research is the Store Brand Evaluation. Set of variables that are being
used for the Store Brand Evaluation are Quality, Likeliness, and Purchase Intention. The Cronbach’s
With NBWithout
NBWith NB
Without
NBWith NB
Without
NBWith NB
Without
NB
Dependent
StorePinkIndo 1 1 5 5 3.23 3.05 0.82 0.86
StoreGulaIndo 1 1.33 5 5 3.36 3.51 0.81 0.78
Independent
Price Consciousness 2.33 1 5 5 4.04 4.07 0.60 0.71
Quality Consciousness 1 2 5 5 4.07 4.01 0.65 0.65
Innovativeness 1.67 1.67 5 5 3.53 3.50 0.65 0.70
Storage Constraint 1.5 1.5 4.5 5 2.97 3.09 0.84 0.89
Financial Constraint 1.5 1 5 5 3.07 3.52 0.75 0.82
Anxiety 1 1 5 5 3.51 3.21 0.88 0.83
Mean Std. Deviation
Descriptive
Minimum Maximum

25
alpha of the Store Brand Evaluation for the product of Indomaret Pink Passion without the presence of
national brand is α = 0.847, it exceeds the Cronbach’s threshold which means the data is reliable. The
Store Brand Evaluation of Indomaret Pink Passion with the presence of national brand, the Cronbach’s
alpha shows α = 0.794. The other Store Brand product is the Indomaret Gula Tebu, the Cronbach’s alpha
with, and without the presence of national brand are α = 0.854 and α = 0.885 respectively, both surpass
the threshold, which means the reliability is sufficiently high.
Cronbach’s Alpha Independent Variables
In this part I discuss the Cronbach’s alpha for independent variables with and without the presence of
national brands. The variables in the model without the presence of national brands is discussed first, and
the model with the national brands follows. In the model without the presence of national brands, the
Cronbach’s alpha for variables Price Consciousness and Quality Consciousness are α = 0.603 and α =
0.597. Both variables are measured with 3 items, deleting item Q3 “I find myself checking the prices
even for small items” in the Price Consciousness variable increased the Cronbach’s alpha to α = 0.725,
moreover deleting item Q1 “I will not give up high-quality for a lower price” in Quality Consciousness
variable increased the Cronbach’s alpha to α = 0.701. Both variables Cronbach’s alpha surpassed the
threshold of α ≥ 0.7, therefore items Q3 and Q1 are removed and both variables are constructed using 2
items.
To support the variable of Innovativeness, it’s supported with 3 items. The Cronbach’s alpha is α = 0.728.
Deleting any of the items will not increase the Cronbach’s alpha. On the variable of Storage Constraint,
the variable is constructed with 2 items, and the Cronbach’s alpha is α = 0.842, where it’s classified as
sufficiently high, removing any of the items will not increase the Cronbach’s alpha for this variable. The
latter two variables which are Financial Constraint and Anxiety. The Financial Constraint variable is
supported with 2 items, while the variable of Anxiety is supported with 3 items. The Cronbach’s alpha
for both variables are α = 0.673 and α = 0.638, removing any of the items will not improve the Cronbach’s
alpha, both Cronbach’s alpha is considered questionable, but according to Clark and Watson (1995) to
assess the internal consistency of a research is complicated because there are no clear standards
concerning the acceptable level of Cronbach’s alpha, therefore threshold criteria would range from α =
0.6 to α = 0.7, both Financial Constraint and Anxiety are considered reliable.
In the model with the presence of National Brands, the Price Consciousness variable is constructed with
3 items, the Cronbach’s alpha is α = 0.561, where it’s considered as unreliable, however removing the
item Q3 will improve to Cronbach’s alpha to α = 0.792, therefore the item “I find myself checking the

26
prices even for small items” would also be removed, and the variable of Price Consciousness is supported
using 2 items. The next variable is Quality Consciousness, the Cronbach’s alpha for this variable is α =
0.716, it’s considered as sufficiently reliable. On the variable of Innovativeness, the Cronbach’s alpha is
α = 0.599, dropping the item of Q3 “When I see a product somewhat different from usual, I check it out”
will increase the Cronbach’s alpha to α = 0.706, therefore item Q3 was excluded and Innovativeness is
constructed using 2 items.
For the Storage Constraint and Financial Constraint variables, both Cronbach’s alpha is α = 0.806 and α
= 0.704 sequentially. Both variables are sufficiently reliable. The variable of Storage Constraint and
Financial Constraint are supported with 2 items. Removing any of the items will not improve the
Cronbach’s alpha of the variables. Lastly, the Cronbach’s alpha for the variable of Anxiety is α = 0.704.
The variable is supported with 3 items. Therefore, it’s considered as sufficiently reliable and none of the
items will be removed in the variable as it will not generate any improvement to the Cronbach’s alpha.
4.3 Correlations
In this section I discuss the overview of the correlation matrix of the variables. The first section provides
the correlation matrix without the presence of national brands, and the later section provides the
correlation matrix with the presence of national brands. To analyze the correlation matrix Spearman
correlation is used to test the correlation between two continuous variables with linear regression model.
The table below (Table 4 and Table 5) shows the overall strength of the correlation, direction of the
correlation, and whether if there’s a significant or not significant correlation between the variables.
Table 4 shows the correlation matrix between the dependent variable, the evaluation for the store brands
Indomaret Pink Passion is code as “StorePinkIndo” and Indomaret Gula Tebu “StoreGulaIndo”, and the
independent variables which are Price Consciousness, Quality Consciousness, Innovativeness, Storage
Constraint, Financial Constraint, and Anxiety. Firstly, Quality Consciousness (r = 0.162), Innovativeness
(r = 0.353), Financial Constraint (r = 0.217) and Anxiety (r = 0.317) variables has a significantly positive
correlation with the dependent variables of the store brand “Indomaret Pink Passion”.
The similar result follows for the store brand “Indomaret Gula Tebu” where Quality Consciousness (r =
0.216), Innovativeness (r = 0.278), Financial Constraint (r = 0.274) and Anxiety (r = 0.326). It implies
that people who are quality consciousness, high innovativeness, more financially constrained, and have
high anxiety level are in favor to evaluate the store brands more. The independent variables of Price

27
Consciousness and Storage Constraint are insignificant, implying that there is no correlation between the
people who is price sensitive and have storage issue to the evaluation of the store brands.
Correlation matrix with the presence of national brands isvshowed in Table 5. The independent variables
are the store brands “Indomaret Pink Passion” and “Indomaret Gula Tebu”. In this model it accounts the
presence of national brands, the national brands of “Downy Passion” and “Gulaku Gula Tebu Putih”.
Correlation matrix for the moderating variable of Price*National Brands Downy (PriceNBDowny) and
Price*National Brands Gulaku (PriceNBGulaku) are presented in the table 5.
Table 4 Correlation Matrix
** Correlation is significant at the 0.01 level (2-tailed). * Correlation is significant at the 0.05 level (2-tailed).
In the table 5, the correlation matrix for the independent variables of Price Consciousness (r = 0.218),
Innovativenes (r = 0.263), Anxiety (r = 0.563) are positively corelate with the dependent variables of
Indomaret Pink Passion store brand, implying that when the national brand “Downy Passion” is present
consumer who is price sensitive, innovative, and have more anxiety level evaluate store brand “Indomaret
Pink Passion” positively. The variable Storage Constraint (r = -0.264) has a negative and significant
1 2 3 4 5 6 7 8
1. StorePinkIndo Correlation Coefficient 1 .618** 0.028 .162* .353** -0.069 .217** .317**
Sig. (2-tailed) . 0 0.704 0.029 0 0.351 0.003 0
N 182 182 182 182 182 182 182 182
2. StoreGulaIndo Correlation Coefficient .618** 1 0.042 .216** .278** -0.039 .274** .326**
Sig. (2-tailed) 0 . 0.574 0.003 0 0.598 0 0
N 182 182 182 182 182 182 182 182
3. Price Cons Correlation Coefficient 0.028 0.042 1 .184* .191** 0.031 .162* 0.079
Sig. (2-tailed) 0.704 0.574 . 0.013 0.01 0.677 0.029 0.289
N 182 182 182 182 182 182 182 182
4. Quality Cons Correlation Coefficient .162* .216** .184* 1 .213** 0.077 .265** 0.116
Sig. (2-tailed) 0.029 0.003 0.013 . 0.004 0.301 0 0.117
N 182 182 182 182 182 182 182 182
5. Innovativeness Correlation Coefficient .353** .278** .191** .213** 1 0.01 .213** .302**
Sig. (2-tailed) 0 0 0.01 0.004 . 0.895 0.004 0
N 182 182 182 182 182 182 182 182
6.Storage Cons Correlation Coefficient -0.069 -0.039 0.031 0.077 0.01 1 0.136 -0.011
Sig. (2-tailed) 0.351 0.598 0.677 0.301 0.895 . 0.068 0.886
N 182 182 182 182 182 182 182 182
7. Financial Cons Correlation Coefficient .217** .274** .162* .265** .213** 0.136 1 .266**
Sig. (2-tailed) 0.003 0 0.029 0 0.004 0.068 . 0
N 182 182 182 182 182 182 182 182
8. Anxiety Correlation Coefficient .317** .326** 0.079 0.116 .302** -0.011 .266** 1
Sig. (2-tailed) 0 0 0.289 0.117 0 0.886 0 .
N 182 182 182 182 182 182 182 182
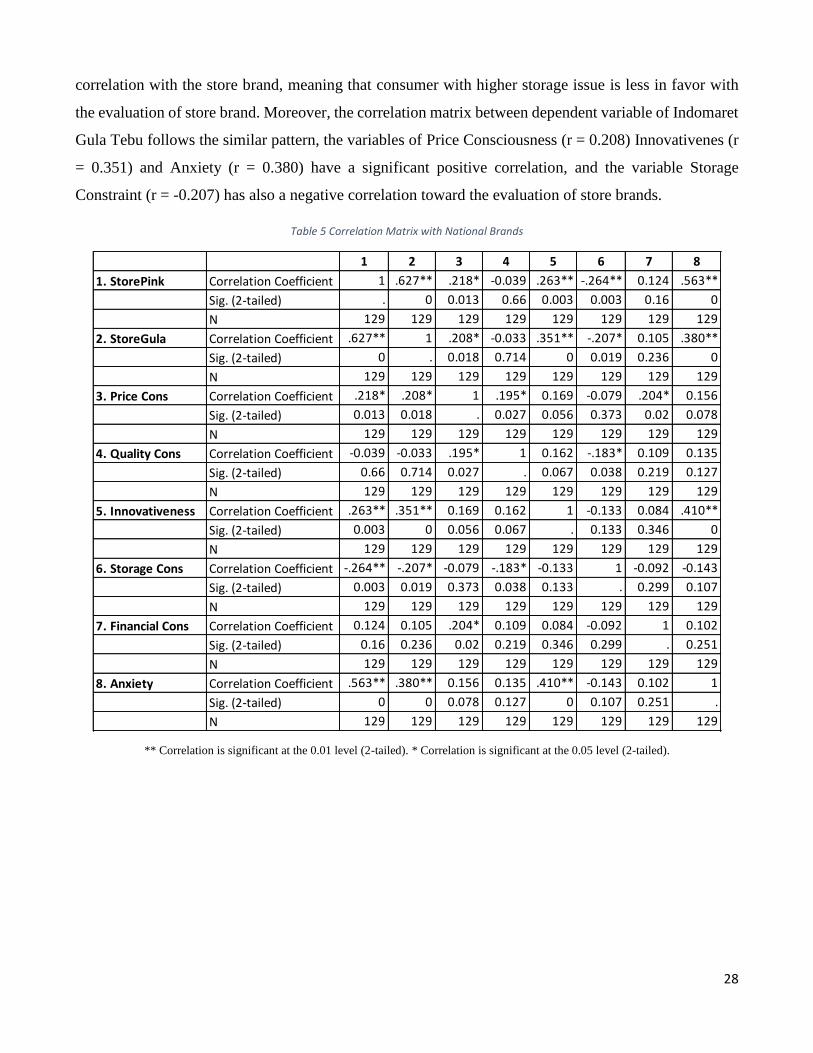
28
correlation with the store brand, meaning that consumer with higher storage issue is less in favor with
the evaluation of store brand. Moreover, the correlation matrix between dependent variable of Indomaret
Gula Tebu follows the similar pattern, the variables of Price Consciousness (r = 0.208) Innovativenes (r
= 0.351) and Anxiety (r = 0.380) have a significant positive correlation, and the variable Storage
Constraint (r = -0.207) has also a negative correlation toward the evaluation of store brands.
Table 5 Correlation Matrix with National Brands
** Correlation is significant at the 0.01 level (2-tailed). * Correlation is significant at the 0.05 level (2-tailed).
1 2 3 4 5 6 7 8
1. StorePink Correlation Coefficient 1 .627** .218* -0.039 .263** -.264** 0.124 .563**
Sig. (2-tailed) . 0 0.013 0.66 0.003 0.003 0.16 0
N 129 129 129 129 129 129 129 129
2. StoreGula Correlation Coefficient .627** 1 .208* -0.033 .351** -.207* 0.105 .380**
Sig. (2-tailed) 0 . 0.018 0.714 0 0.019 0.236 0
N 129 129 129 129 129 129 129 129
3. Price Cons Correlation Coefficient .218* .208* 1 .195* 0.169 -0.079 .204* 0.156
Sig. (2-tailed) 0.013 0.018 . 0.027 0.056 0.373 0.02 0.078
N 129 129 129 129 129 129 129 129
4. Quality Cons Correlation Coefficient -0.039 -0.033 .195* 1 0.162 -.183* 0.109 0.135
Sig. (2-tailed) 0.66 0.714 0.027 . 0.067 0.038 0.219 0.127
N 129 129 129 129 129 129 129 129
5. Innovativeness Correlation Coefficient .263** .351** 0.169 0.162 1 -0.133 0.084 .410**
Sig. (2-tailed) 0.003 0 0.056 0.067 . 0.133 0.346 0
N 129 129 129 129 129 129 129 129
6. Storage Cons Correlation Coefficient -.264** -.207* -0.079 -.183* -0.133 1 -0.092 -0.143
Sig. (2-tailed) 0.003 0.019 0.373 0.038 0.133 . 0.299 0.107
N 129 129 129 129 129 129 129 129
7. Financial Cons Correlation Coefficient 0.124 0.105 .204* 0.109 0.084 -0.092 1 0.102
Sig. (2-tailed) 0.16 0.236 0.02 0.219 0.346 0.299 . 0.251
N 129 129 129 129 129 129 129 129
8. Anxiety Correlation Coefficient .563** .380** 0.156 0.135 .410** -0.143 0.102 1
Sig. (2-tailed) 0 0 0.078 0.127 0 0.107 0.251 .
N 129 129 129 129 129 129 129 129

29
4.4 Regression Analysis
In this part, the regression analysis is provided with overviews of the analysis. The sections are divided
into three parts, the first part discuss the regression model constructs with a brief review of the
homoscedasticity and multicollinearity check. In this part, the model is separated into two models, the
first model is provided without the presence of national brands, and the second model is presented with
the presence of national brands as the moderator. Followed by the second part, this section discusses the
hypothesis testing of the model, the regression result is provided to see the significance and results with
and without the moderating variable.
To meet the assumption in linear regression, the data should not indicate multicollinearity.
Multicollinearity is a condition where inter-correlation among data is sufficiently high. The reason to
avoid multicollinearity in the data sets is because it’s difficult to see on which independent variables have
the real effect to the dependent variable. To detect multicollinearity, it can be tested by the Variance
Inflation Factor (VIF) value (Gujarati, 2003). If the VIF value of independent variables is above 10, then
the data may contain multicollinearity (Gujarati, 2003). In the present study, all the independent variables
are checked and met the VIF value criteria of non-multicollinearity, therefore there is no multicollinearity
indicated in the data sets. The VIF can be found in the Table 8 below.
4.4.1 Regression Model: Store Brand Evaluation
This section provides the construct of the first regression model. This model is derived from the
questionnaire conducted without the presence of national brands. The dependent variable is Store Brand
evaluation and used for testing the two store brands: Indomaret Pink Passion and Indomaret Gula Tebu.
The moderating variables of national brand presence is excluded. The regression model for the two store
brands is constructed as follows:
Store Brand Evaluation = β0 + β1 Price Consciousness + β2 Quality Consciousness + β3 Innovativeness
+ β4 Storage Constraint + β5 Financial Constraint + β6 Anxiety + β7 Price Consciousness *
Dummy_Product Type + β8 Price Consciousness * Dummy_National Brand Presence + β9 Dummy
National Brand Presence + β10 Dummy Product Type + ε
To analyze the store brand evaluation, the addition of dummy variable is created to complete the
regression. In prior hypothesis, the moderating variable of national brand presence with price
consciousness consumer is represent as the interaction between the price consciousness and the dummy
variable of national brand presence, where 0 = absent and 1 = present. It’s also applied on the scope of

30
product type. To clearly identify the effect of national brand present per type, dummy product type is
created, where 0 = Home Care and 1 = Foods.
Table 6 Model Summary
a. Predictors: (Constant), Education, PriceCons_DumGula, Anxiety, Age, StorageCons, QualityCons, Gender, PriceCons, FinancialCons,
Income, Innovativeness, PriceCons_DumNBP
Table 6 shows the adjusted R square for the model above is 0.228, meaning the independent variables in
the model can describe 23% of the store brand evaluation. That’s relatively reasonable because the
independent variables of consumer traits that’s been covered in this research is limited. Overall, on table
7, it shows that the ANOVA table reports a significant result on the F statistics of the model with
significance level 0.000 (p<0.05).
Table 7 ANOVA
The complete regression results for the store brand evaluation of Indomaret Pink Passion and Gula Pasir
can be found on Table 8. The independent variables Price Consciousness (p = 0.914, p>0.1) and Quality
Consciousness (p = 0.476, p>0.1) are insignificant. There is no significant effect of consumers’ price
sensitiveness toward the evaluation of store brand. The interpretation also applied for the Quality
Consciousness variables, which means that consumer who highly concern for better quality product has
no significant effect on the evaluation of the store brand. Therefore, both hypothesis of H1a and H2 are
no longer accepted.
The other independent variables such as Innovativeness (p = 0.000, p<0.05), Storage Constraint (p =
0.007, p<0.05), Financial Constraint (p = 0.007, p<0.05) and Anxiety (p = 0.000, p<0.05) are significant,
which means the independent variables have a significant effect on the store brand evaluation, moreover
we can’t reject the null hypothesis. The significant result of these variables supports the hypothesis of
H3, H4, H5, and H6, where each of these hypotheses generally explains the linear effect from the
independent variables. The more Innovative the consumer, the more they are willing to try new and
R Square
ChangeF Change df1 df2
Sig. F
Change
1 .491a 0.241 0.228 0.73433 0.241 19.377 10 611 0.000
Model R R SquareAdjusted R
Square
Std. Error of
the Estimate
Change Statistics
Sum of
Squaresdf
Mean
SquareF Sig.
Regression 104.488 10 10.449 19.377 .000b
Residual 329.477 611 0.539
Total 433.965 621
Model
1
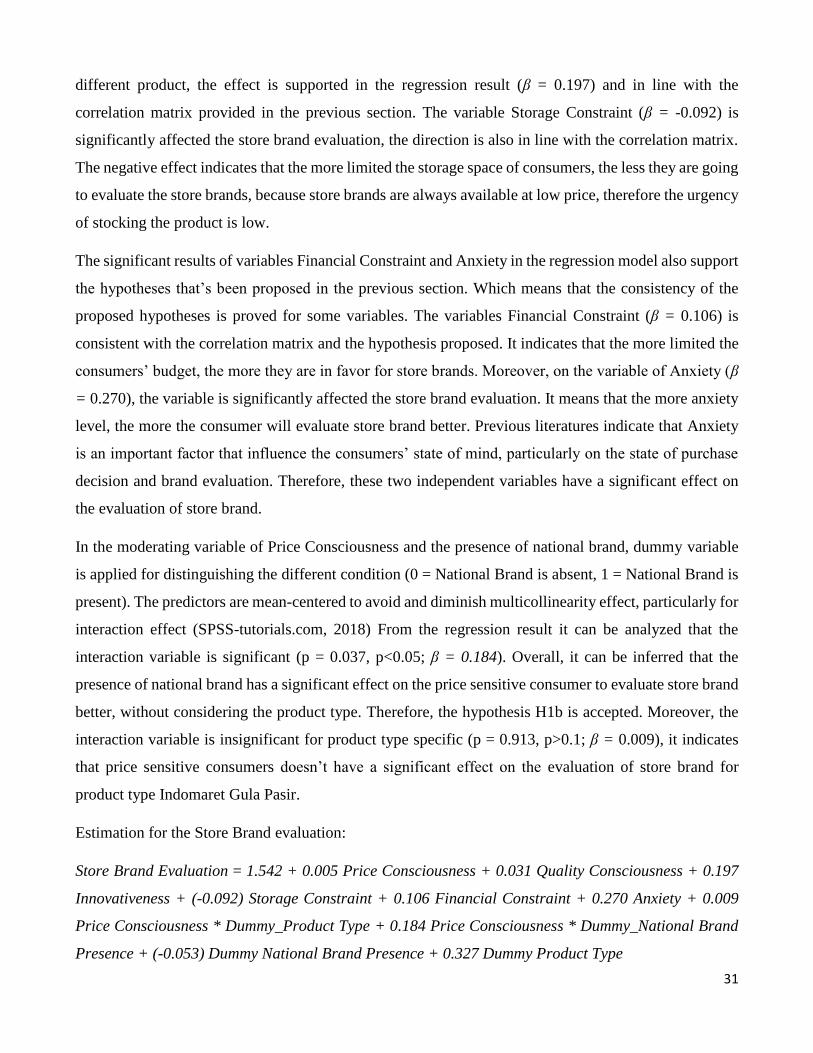
31
different product, the effect is supported in the regression result (β = 0.197) and in line with the
correlation matrix provided in the previous section. The variable Storage Constraint (β = -0.092) is
significantly affected the store brand evaluation, the direction is also in line with the correlation matrix.
The negative effect indicates that the more limited the storage space of consumers, the less they are going
to evaluate the store brands, because store brands are always available at low price, therefore the urgency
of stocking the product is low.
The significant results of variables Financial Constraint and Anxiety in the regression model also support
the hypotheses that’s been proposed in the previous section. Which means that the consistency of the
proposed hypotheses is proved for some variables. The variables Financial Constraint (β = 0.106) is
consistent with the correlation matrix and the hypothesis proposed. It indicates that the more limited the
consumers’ budget, the more they are in favor for store brands. Moreover, on the variable of Anxiety (β
= 0.270), the variable is significantly affected the store brand evaluation. It means that the more anxiety
level, the more the consumer will evaluate store brand better. Previous literatures indicate that Anxiety
is an important factor that influence the consumers’ state of mind, particularly on the state of purchase
decision and brand evaluation. Therefore, these two independent variables have a significant effect on
the evaluation of store brand.
In the moderating variable of Price Consciousness and the presence of national brand, dummy variable
is applied for distinguishing the different condition (0 = National Brand is absent, 1 = National Brand is
present). The predictors are mean-centered to avoid and diminish multicollinearity effect, particularly for
interaction effect (SPSS-tutorials.com, 2018) From the regression result it can be analyzed that the
interaction variable is significant (p = 0.037, p<0.05; β = 0.184). Overall, it can be inferred that the
presence of national brand has a significant effect on the price sensitive consumer to evaluate store brand
better, without considering the product type. Therefore, the hypothesis H1b is accepted. Moreover, the
interaction variable is insignificant for product type specific (p = 0.913, p>0.1; β = 0.009), it indicates
that price sensitive consumers doesn’t have a significant effect on the evaluation of store brand for
product type Indomaret Gula Pasir.
Estimation for the Store Brand evaluation:
Store Brand Evaluation = 1.542 + 0.005 Price Consciousness + 0.031 Quality Consciousness + 0.197
Innovativeness + (-0.092) Storage Constraint + 0.106 Financial Constraint + 0.270 Anxiety + 0.009
Price Consciousness * Dummy_Product Type + 0.184 Price Consciousness * Dummy_National Brand
Presence + (-0.053) Dummy National Brand Presence + 0.327 Dummy Product Type

32
Table 8 Coefficient
4.4.2 Robustness Check
In the Table 9 below provides the overview of overall coefficient in different models. The objective
comparing the different kind of models is to find the robustness of the model regression in the main
interaction. In the first model consists of the main independent variables of Price Consciousness, Quality
Consciousness, Innovativeness, Storage Constraint, Financial Constraint, and Anxiety. In the second
model, the interaction variables of Price Consciousness with dummy is added. Lastly, in the third model,
keeping the interaction variables, the control demographic variables of Gender, Age, Income and
Education is added. The Adjusted R square and F-test significance level can also be compared between
the different models provided in table below.
Table 9
p<0.01 = ***; p<0.05 = **; p<0.1 = *
Standardized
Coefficients
B Std. Error BetaLower
Bound
Upper
BoundTolerance VIF
(Constant) 1.542 0.252 6.125 0.000 1.047 2.036
PriceConsciousness 0.005 0.043 0.004 0.108 0.914 -0.081 0.090 0.953 1.049
QualityConsciousness 0.031 0.043 0.026 0.713 0.476 -0.054 0.116 0.956 1.046
Innovativeness 0.197 0.038 0.199 5.126 0.000 0.121 0.272 0.823 1.214
StorageConstraint -0.092 0.034 -0.096 -2.692 0.007 -0.159 -0.025 0.982 1.019
FinancialConstraint 0.106 0.039 0.104 2.709 0.007 0.029 0.183 0.846 1.182
Anxiety 0.270 0.038 0.280 7.152 0.000 0.196 0.345 0.810 1.235
Dummy_Gula 0.327 0.059 0.196 5.550 0.000 0.211 0.442 1.000 1.000
Dummy_NBP -0.053 0.064 -0.031 -0.820 0.412 -0.179 0.073 0.866 1.155
Dummy_Gula_PriceCons 0.009 0.085 0.004 0.109 0.913 -0.158 0.176 1.000 1.000
Dummy_NBP_PriceCons 0.184 0.088 0.074 2.086 0.037 0.011 0.357 0.977 1.024
t Sig.
95.0% Confidence
Interval for BCollinearity Statistics
1
Model
Unstandardized
Coefficients
Model 1 Model 2 Model 3
Adjusted R Square 0.189 0.228 0.235
F-test 25.042*** 19.377*** 14.635***
PriceConsciousness -0.003 0.005 -0.002
QualityConsciousness 0.026 0.031 0.021
Innovativeness 0.188*** 0.197*** 0.192***
StorageConstraint -0.090** -0.092** -0.107**
FinancialConstraint 0.116** 0.106** 0.118**
Anxiety 0.266*** 0.270*** 0.265***
DummyNBP -0.053 -0.046
DummyGula 0.327*** 0.327***
PriceCons_DumNBP 0.184** 0.169*
PriceCons_DumGula 0.009 0.009
Gender 0.005
Age -0.003
Income 0.007
Education 0.171**

33
The Adjusted R square in Model 1 is 0.189, it indicates that given the independent variables of Price
Consciousness, Quality Consciousness, Innovativeness, Storage Constraint, Financial Constraint, and
Anxiety, the model can explain 18.9% of the store brand evaluation, it’s the lowest among the other
models. Moreover, all the models show similar coefficient results, where the independent variables of
Price Consciousness and Quality Consciousness is not significant towards the evaluation of store brand.
The model 3 performs slightly better than all the other models on the case of Adjusted R square, where
the Adjusted R square (0.240). The control demographic variable of Eduaction is significant, however
the other variables of Gender, Age, and Income are not significant toward the evaluation of store brand.
The complete review of the regression result above can be found in the Appendix 2, and 3.

34
5. Discussion
This part provides the overall summary of the results interpretations and comparisons with the literature
to see how the result would fit in. The second part provides the implications of this research from
managerial and academical perspectives. Lastly, the third section discuss the research limitations and
further research suggestions.
The main independent variables that being used in this research to assess the Store brand evaluation as
the dependent variable are Price Consciousness, Quality Consciousness, Innovativeness, Storage
Constraint, Financial Constraint, and Anxiety. The store brands are Indomaret Pink Passion and
Indomaret Gula Pasir. This research separates two conditions, where the first condition consists of main
independent variables effect on the evaluation of store brand, and the second condition is the evaluation
of store brand with the presence of national brands. In the next section, it provides the first condition
hypothesis summary.
Independent variables that show a significant effect in the evaluation store brands are Innovativeness,
Storage Constraint, Financial Constraint, and Anxiety. These variables significantly generate a positive
effect, except for the Storage Constraint, in the store brand evaluation. It implies that the more innovative
the consumer, the better the evaluation of the store brand. It is because consumers who are willing to
explore and try different and new things will find store brand as a new and untried item, therefore
consumers will evaluate the store brand positively and have higher favor to obtain and consume the
product. It is in line with the findings in Ailawadi et. al, 2001; Granzin 1981; and Whelan and Davies,
2006. Innovativeness has a positive effect into the evaluation of store brands, the more innovative the
consumer the better they will evaluate the store brand. Therefore, it supports the hypothesis H3.
The second significant variable is Financial Constraint. The regression result of this variable is in line
with the previous literature Yamauchi and Templer 1982; Burton et al., 1998. It’s explained that the
higher the financial constraint of the consumer, which they general focus is to save the money and spend
it with a tight control, the higher they evaluate the store brands. It’s supported the hypothesis H5. The
explanation behind this is because store brands are available with lower prices than national brands. The
presence of store brands and its lower price advantage over national brands triggers the consumers who
is saving-oriented and have a strict financial because their priority is to control their finance.
Storage constraint variable is one of the significant variables that negatively affected the store brand
evaluation. The regression result is in line with the proposed hypothesis in the previous literatures such
as Blattberg et al., 1978, Ailawadi et. al, 2001, Martinez and Montaner. 2008. Previous studies discussed

35
that national brand is more in favor when it comes to the case of stocking the products. National brand
becomes more in demand particularly when it comes to promotion or special offers in the market.
Consumer feels the urgency to purchase the product because it’s on a special offer with limited time. In
that case, consumer becoming more selective on buying the products given the limited storage space and
limited offer in the market.
The last significant variable is Anxiety, which supports the hypothesis of H6. This variable is positively
affected the evaluation of store brand. Given the condition where national brand is absent, consumer with
high anxiety will more in favor to evaluate the store brand. Psychological risk can be resulted by the
appearance of Anxiety, where low self-esteem of the uncertain future conditions might trigger the
decision making on consumer items. It’s in line with prior research Goldsmith et al., 2010 and Liu &
Wang (2008). The prior literatures support the result generated from the current model regression of the
store brand evaluation.
The other independent variable such as Price Consciousness and Quality Consciousness are insignificant,
all the proposed hypothesis for these variables are rejected (H1a and H2). Based on the model regression
in previous chapter, Price Consciousness and Quality Consciousness are not significantly affected the
store brand evaluation. It’s contradictive with the prior literatures that stated that price sensitive
consumers are more prone to store brand, which has lower price than national brand. Moreover, the
hypothesis of more quality conscious consumers evaluates store brand less is also not proved in current
research.
In this part the evaluation of store brands with the interaction of Price Consciousness and dummy
presence of national brands are discussed. Excluding the dummy variable for product type, the interaction
between Price Consciousness * Dummy National Brand presence and store brand evaluation is
significant. However, the interaction dummy of product type with the presence of national brand is
insignificant. Meaning that, the effect between store brand evaluation and interaction variables of Price
Consciousness * Dummy National Brand presence, 1 = Present; 0 = Absent, without considering the
product type is positively significant. It indicates that price sensitive consumers evaluate store brand
better when the national brand is present, without considering the product type.
5.1 Managerial Implications
Indonesia as one of the largest and emerging retail markets in Asia (Accenture, 2009) shows how
competitive the market is. Information regarding the consumer traits in specific country is very important,
36
as it will affect the company’s strategic decision. In this part the managerial implications of the research
are separated for two market players, the retailers and the manufacturers, therefore both markets can have
the opportunity to target and execute their business plan according to the market.
First, based on this study, the effect of quality consciousness towards store brand evaluation is not
significant. In other developed countries, specifically countries with mature store brands development,
the store brand has a tight gap with national brands in term of its quality, it’s because some of them are
produced by the manufacturers, hence the quality gap is reduced (Steenkamp, Heerde, and Geyskens,
2010). Therefore, to be able to compete with the national brands, retailers can launch new product
development through manufacturer. The retailers must choose and collaborate with the most appropriate
manufacturer that can produce quality products, put the manufacturer brand on the product to create trust
in consumer’s perception, and distribute the product in their stores.
Higher quality means higher cost of production, the store brands’ price advantage over national brands
becomes lower. According to Baltas (2003), lower price advantage increases the unattractiveness of the
store brand product. In this case, the significant result from the variable Innovativeness towards store
brand evaluation can be used as validation. The result shows that consumers with high innovativeness
evaluate the store brand more positively, meaning that innovative consumers seek for new and untried
products. Retailers can create diversity in product portfolio, the objective is to provide wider product
options for consumers and reach the segment of innovative consumers. For example, retailers can
differentiate the products into two types, the first type emphasize on the low-price characteristic, through
retailers’ own brands and productions, the second type of product emphasize more on the quality of the
product, which production is handled by manufacturer, keeping the price slightly lower comparing to
national brands. Therefore, more variety in retailers’ product portfolio could provide more options that
can satisfy consumers’ needs.
Third, consumer who evaluate store brand better is consumer with financial constraint and have high
level of anxiety. Given these insights, brand managers or store manager could develop a business strategy
to optimize advertising, product pricing and promotion. For example, store advertising and price
promotion that generally indicates lower price advantages, such as everyday low-price offer, through
flyer, wobbler, and other mediums, might triggers consumer with high level of anxiety and financially
limited to continuously purchase the store brands. Creating a profit perception and advantages through
store advertising in consumers’ mind is crucial for the consumer with these profiles.

37
On the other hand, implication for manufacturer can also be made from this study. Based on the
regression results, consumers with high storage constraint evaluate store brands negatively. The finding
suggests that manufacturer can target the consumers with limited storage space. First, manufacturer can
implement national brand promotion to reach consumers with storage constraint. According to Ailawadi
et. al, (2001), given the limited storage space that consumers have, they are more prone on national
brands when it is on promotion or special offer because they can stock the product. In general, there are
two type of promotions that manufacturer can do, first is in-store and the second is out-of-store national
brand promotions. Timing and choosing the right product to promote are important to efficiently increase
the purchase intention of the segmented consumers.
Moreover, the promotion of national brand can also attract another type of consumers. For example,
consumers who are price sensitive and quality conscious might prefer national brand when it’s on
promotion because they can get more quality with lower price. It’s important for manufacturer to know
that the frequency of promotion should be planned and implemented wisely. The present study also
implies that price sensitive consumers evaluate store brand better when national brand is present, in terms
of shelf presentation. Manufacturer could implement the price promotion to attract price sensitive
consumers over store brand product. However, high frequency of promotion may lead to the degradation
of the brand image. In that case, alternative deals such as banded product or small gifts, instead of price
promotion, might attract other type of consumers as well such as the Innovators. Therefore, to keep the
dynamic of the competition manufacturer can use this move to match the retailers.
Second, manufacturer can also reach quality conscious consumers. National brands are commonly known
with their quality and production, most of them are considered to have better quality than store brands.
Based on this study, the finding suggests that quality conscious consumers are not significantly affected
the evaluation of store brand. Therefore, manufacturer must retain their product quality and distribution
through effective supply chain strategy. The objective is to ensure all the product is in the right place and
the right time, monitoring the availability and quality of the product in the store is important to maintain
consumers’ satisfaction level. Improving the consumers’ call center service can also be an option for
manufacturer, in that way manufacturer can receive direct feedbacks from consumers and continuously
improve the quality of the product.
Overall, identifying the consumer traits of a representative store brands will give opportunity to retailers
and manufacturers to customize the business strategy and penetrate the market. Different set of strategies
from both sides such as, every-day low price for retailers and HI-LO pricing options for manufacturer,

38
can keep the competition between the two products. A healthy competition is important for the two
brands because in the long term it will generate growth for manufacturer and retailer. From these insights
it provides manager or decision maker in both manufacturer and retailer to set and customize the right
focus for the business strategy and direction in short and long term.
5.2 Limitations and Further Research
There are several limitations considered in this research. It’s expected that in the further research these
limitations can be improved. Firstly, the sample of the study is limited due to the time limit and writer
limited access to collect the sample data. The total sample in this study is 311 (N=182 for the
questionnaire without the presence of national brand and N= 129 for the questionnaire with the presence
of national brands). However, overall data sample is considered to sufficiently enough, but the
representativeness of the data should be extended in the further research. Moreover, it’s important to also
collect and analyze the data of the lower income consumers outside the capital city of Jakarta, because
the market competition is not only centralized in the capital but also spreading in other regions in
Indonesia.
Second, the representativeness of the store and national brand need to get considered carefully. In this
study, home care product and food are being used because it’s included in the top daily items in terms of
consumption in Indonesia. The reason I put Indomaret store brands is because Indomaret is one of the
top growing supermarkets in Indonesia, together with their competitor Alfamart, they accounted around
30% of total retail market in Indonesia. The availability of the stores makes it easily reached by the
consumers. In the next study, the choice of store brands and national brands should reconsider the type
of the goods that should be used in the study. There are plenty of product variety in the market, so the
product choice for the study is crucial. Consumer traits response on different combination of product is
also interested to analyze.
Lastly, the reliability of the data is important. In the study there are some variables that has questionable
reliability level. Defining the reliability level is important, there are many different arguments on defining
the ideal reliability analysis, where some might say the ideal reliability analysis should be > 0.7, but other
might even say that the Cronbach’s alpha is relatively not mandatory to define the reliability analysis.
Strict mechanism and remedies are important to be adjusted in future research, according to the sample
characteristics in different countries, to minimize the risk of getting low Cronbach’s alpha and method
bias.

39
References
ACNielsen (2005), The Power of Private Label 2005: A Review of Growth Trends Around the World.
New York: ACNielsen.
Ailawadi, Kusum L., Neslin, Scott A., and Gedenk, Karen (2001), “Pursuing the Value-Conscious
Consumer: Store Brands Versus National Brand Promotions”, Journal of Marketing, Vol. 65, No. 1
(January), pp. 71-89.
d’Astous, A. and Gargouri, E. (2001). Consumer evaluations of Brand imitations. European Journal of
Marketing, Vol. 35. No.1/2, pp. 153-167.
Baltas, George and Peter Doyle (1998), "Exploring Private Brand Buying," in Proceedings of the 27th
EMAC Conference, Track 5: Marketing Research, Per Andersson, ed. Stockholm: European Marketing
Association, 183.
Baltas, G., & Argouslidis, P.C., (2007). Consumer characteristics and demand for Store brands.
International Journal of Retail & Distribution Management, Vol. 35, No. 5, pp. 328-341.
Batra, Rajeev and Sinha, Indrajit (2000), “Consumer-Level Factors Moderating the Success of Private
Label Brands”, Journal of Retailing, Vol. 76, pp. 175-191.
Bawa, K., Shoemaker, R.W., 1987. The effects of a direct mail coupon on brand choice behavior. Journal
of Marketing Research 24, 370–376.
Binninger, A., (2008). Exploring the relationships between retail brands and consumer store
loyalty. International Journal of Retail & Distribution Management, Vol. 36 No. 2, pp. 94-110.
Blattberg, Robert C., Scott A. Neslin (1990), Sales Promotion: Concepts, Methods, and Strategies.
Englewood Cliffs, NJ: Prentice Hall.
Burton, Scot, Lichtenstein, Donald R., Netemeyer, Richard G. and Garretson, Judith A. (1998),
“A Scale for Measuring Attitude Toward Private Label Products and an Examination of Its Psychological
Behavioral Correlates”, Academy of Marketing Science Journal, Vol. 26, pp.
293-306.
Clark, L. A., & Watson, D. (1995). Constructing validity: Basic issues in objective scale development.
Psychological Assessment, 7, 309-319.
Cotterill Jr., Ronald W., Putsis, William P. and Dhar, Ravi (2000), “Assessing the Competitive
Interaction between Private labels and National Brands”, Journal of Business, Vol. 73, No. 1, pp. 120-
134.
Consumer Reports (2009), "It Pays to Buy Store Brands," (Octo ber), 16-20.
Cunningham, Isabelle C.M., Andrew P. Hardy, and Giovanna Imperia (1982), "Generic Brands Versus
National Brands and Store Brands," Journal of Advertising Research, 22 (October/November), 25-32.
Chandon, Pierre, Brian Wansink, and Gilles Laurent (2000), "A Benefit Congruency Framework of Sales
Promotion Effective- ness," Journal of Marketing, 64 (October), 65-81.

40
Darden, William R. and Dub Ashton. 1974. Psychographic Profiles of Patronage Preference Groups, The
Journal of Retailing, 50 (winter): 99-112.
Dick, A., Jain, A. and Richardson, P., (1995). Correlates of Store brand proneness: some
emperical observations. Journal of Product & Brand management, Vol. 4 No. 4, pp. 15-22.
Facenda, Vanessa (2008), "Why Commodity Inflation Helps CPGs”, Brandweek, (February 25), 4.
Goldsmith, R., Flynn, L., Goldsmith, E. and Stacey, E.C. (2010), “Consumer attitudes and loyalty
towards private brands”, International Journal of Consumer Studies, Vol. 34 No. 3, pp. 339-348.
Granzin, Kent L. (1981), "An Investigation of the Market for Generic Products," Journal of Retailing, 57
(Winter), 39.
Gujarati, D. N. (2004). Basic Econometrics 4th edition, Tata McGraw-Hill, New Delhi.
Hansen, K., Singh, V., Chintagunta, P., (2006). Understanding Store-Brand Purchase Behavior
Across Categories. Marketing Science, Vol. 25, No.1, pp 75-90.
Hauser, John R. and Shugan, Steven M. (1983), “Defensive Marketing Strategies”, Marketing Science,
Vol. 2, No. 4, pp. 319-360.
Kapferer, J. N. (1995), “Brand confusion: Empirical study of a legal concept”, Psychology & Marketing,
Vol. 12 No. 6, pp. 551-69
KPMG (2004), “Consumer loyalty and private labels products”, KPMG research series, available at:
www.kpmg.ca/en/industries/cib/consumer/documents/CustomerLoyalty.pdf
Kumar, Nirmalya and Jan-Benedict E.M. Steenkamp (2007), Private Label Strategy. Cambridge, MA:
Harvard Business School Press.
Kolodinsky, J., 1990. Time as a direct source of utility: the case of price information search for groceries.
The Journal of Consumer Affairs, 24 (1), 89–109.
Liu, T.-C., & Wang, C.-Y. (2008). Factors affecting attitudes toward private labels and promoted brands.
Journal of Marketing Management, 24(3–4), 283–298. doi:10.1362/ 026725708X306103.
Laerd Statistics (2015). Binomial logistic regression using SPSS Statistics. Statistical tutorials and
software guides. Retrieved from https://statistics.laerd.com/
Lamey, Lien, Barbara Deleersnyder, Marnik G. Dekimpe, and Jan Benedict E.M. Steenkamp (2007),
"How Business Cycles Con tribute to Private Label Success: Evidence from the United States and
Europe," Journal of Marketing, 71 (January), 1-15.
Laroche, Michel, Pons, Frank, Zgolli, Nadia, Cervellon, Marie-Cecile and Kim, Chankon (2003), “A
Model of Consumer Response to Two Retail Sales Promotion Techniques”, Journal of Business
Research, Vol. 56, pp. 513-522.
Livesey, F. and Lennon, P. (1978), “Factors Affecting Consumers’ Choice Between Manufacturer
Brands and Retailer Own Brands”, European Journal of Marketing, Vol. 12, No. 2, pp. 158- 170.

41
M+M Planet Retail (2004), "Private Label Trends Worldwide, 2004," (accessed November 11, 2004),
[available at http:// www.planetretail.net.
MacKenzie, S. B. and P. M. Podsakoff. 2012. “Common Method Bias in Marketing: Causes,
Mechanisms, and Procedural Remedies.” Journal of Retailing 88: 542-555.
McDonald, W. L. 1993. The Roles of Demographics, Purchases Histories and Shopper Decision-Making
Styles in Predicting Consumer Catalog Loyalty. The Journal of Direct Marketing, 7, 3, (summer): 55-65.
Mitchell, V.W. and Harris, G. (2005), “The importance of consumers’ perceived risk in retail strategy”,
European Journal of Marketing, Vol. 39 Nos 7/8, pp. 821-837
Mitra, Debanjan and Peter N. Golder (2006), "How Does Objec tive Quality Affect Perceived Quality?
Short-Term Effects, Long-Term Effects, and Asymmetries," Marketing Science, 25 (3), 230-47.
Moschis, George P. 1976. Shopping Orientations and Consumer Uses of Information. Journal of
Retailing, 52 (summer): 61-70, 93.
Myers, J.G. (1967). Determinants of Store brand attitude. Journal of Marketing Research, Vol. 4 No. 1,
pp. 73-81.
Nunnally JC. Psychometric theory. New York: McGraw-Hill; 1978
Pechtl, Hans (2004), “Profiling Intrinsic Deal Proneness for HILO and EDLP Price Promotion
Strategies”, Journal of Retailing and Consumer Services, Vol. 11, pp. 223-233.
Quelch, John A. and David Harding (1996), "Brands Versus Private Labels: Fighting to Win," Harvard
Business Review, 37 (Winter), 99-109.
Richardson, P.S., A.S. Dick, and A.K. Jain (1994), "Extrinsic and Intrinsic Cue Effects on Perceptions
of Store Brand Quality," Journal of Marketing, 58 (October).
Richardson, P.S., Jain, A.K. and Dick, A. (1996). Household Store brand proneness: A Framework.
Journal of Retailing, Vol. 72 (2), pp. 159-185.
Sayman, S., Hoch, S.J., Raju, J, (2002). ‘Store brands Positioning Strategies’. Marketing Science, 21 (4),
pp. 378-397.
Shimp, T.A., Kavas, A., 1984. The theory of reasoned action applied to coupon usage. Journal of
Consumer Research 11, 795-809.
Sinha, I. & Batra, R., (1999). The effect of price consciousness on private label purchase. International
Journal of Research in Marketing, 16, pp. 237-251.
Sethuraman, Raj (1992), "Understanding Cross-Category Differences in Private Label Shares of Grocery
Products," Marketing Science Institute Working Paper No. 92-128. Cambridge, MA: Marketing Science
Institute
Sproles, G.B., (1985), ‘From Perfectionism to Fadism: Measuring Consumers‟ Decision-Making styles‟,
Proceedings, American Council on Consumer Interests, Karen P. Schnittgrund (ed.), Columbia, MO:
ACCI: 79-85.

42
Spss-tutorials.com. (2018). SPSS - How to Mean Center Predictors for Regression. [online] Available at
https://www.spss-tutorials.com/spss-mean-center-predictors-for-regression-with-moderation-
interaction/ [Accessed 12 Sep. 2018].
Steenkamp, J.E.M. & Dekimpe, M.G., (1997). The Increasing Power of Store brands: Building
Loyalty and Market Share. Long Range Planning, Vol. 30, No.6, pp.917-930.
Steenkamp, Jan-Benedict E.M, Harald J. van Heerde, and Inge Geyskens (2010), “What Makes
Consumers Willing to Pay a Price Premium for National Brands over Private Labels?” Journal of
Marketing Research, 47 (December), 1011–24.
Tsung-Chi Liu & Chung-Yu Wang (2008) Factors affecting attitudes toward private labels and promoted
brands, Journal of Marketing Management, 24:3-4, 283-298, DOI: 10.1362/026725708X306103
Urbany, Joel E., Peter R. Dickson, and Rosemary Kalapurakal (1996), "Price Search in the Retail Grocery
Market," Journal Marketing, 60 (April), 91-104.
Veloutsou, C., Gioulistanis, E. and Moutinho,L. (2004). Own labels choice criteria and perceived
characteristics in Greece and Scotland. Journal of Product and Brand Management, 13, pp.228 -241.
Voss, Kevin E., Eric R. Spangenberg, and Bianca Grohman (2003), "Measuring the Hedonic and
Utilitarian Dimensions of Consumer Attitude," Journal of Marketing Research, 40 (August), 310-20.
Whelan, S. and Davies, G. (2006). Profiling consumers of own brands and national brands using
human personality. Journal of Retailing and Consumer services, Vol. 13, pp. 393-402.
https://www.accenture.com/t20180308T070646Z__w__/us-en/_acnmedia/PDF-73/Accenture-new-era-
of-trade-for-consumer-goods-industry.pdf
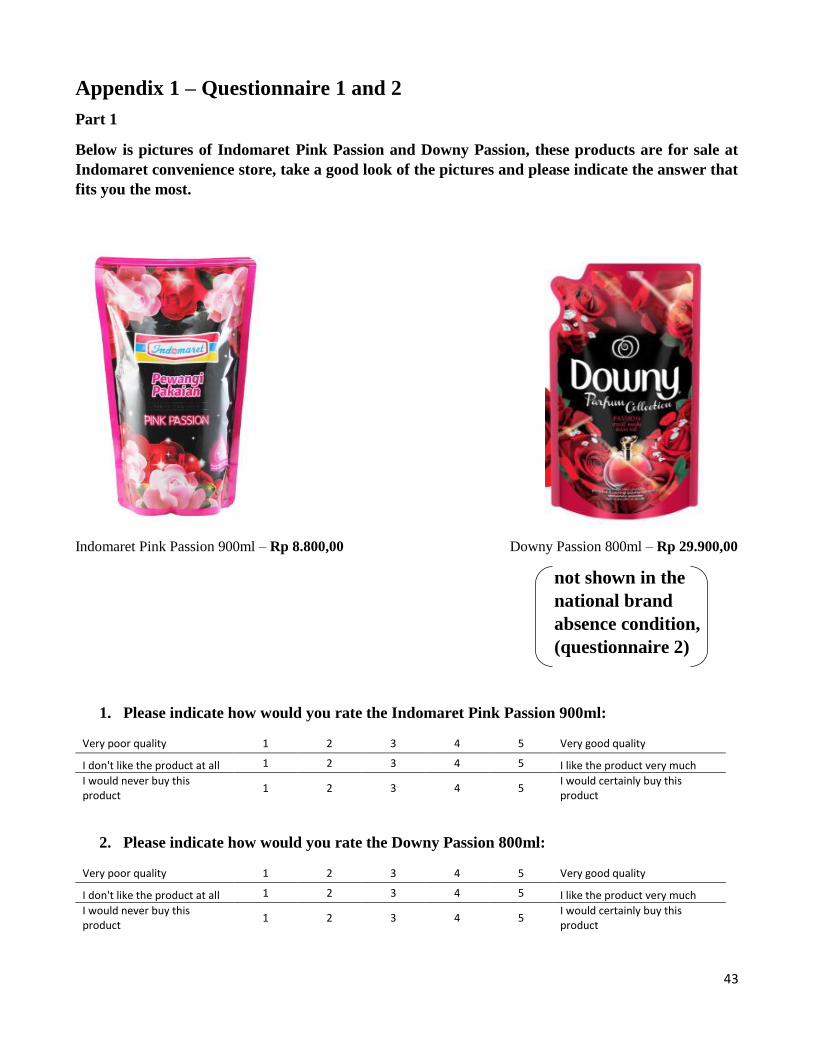
43
Appendix 1 – Questionnaire 1 and 2
Part 1
Below is pictures of Indomaret Pink Passion and Downy Passion, these products are for sale at
Indomaret convenience store, take a good look of the pictures and please indicate the answer that
fits you the most.
Indomaret Pink Passion 900ml – Rp 8.800,00 Downy Passion 800ml – Rp 29.900,00
not shown in the
national brand
absence condition,
(questionnaire 2)
1. Please indicate how would you rate the Indomaret Pink Passion 900ml:
Very poor quality 1 2 3 4 5 Very good quality
I don't like the product at all 1 2 3 4 5 I like the product very much
I would never buy this product
1 2 3 4 5 I would certainly buy this product
2. Please indicate how would you rate the Downy Passion 800ml:
Very poor quality 1 2 3 4 5 Very good quality
I don't like the product at all 1 2 3 4 5 I like the product very much
I would never buy this product
1 2 3 4 5 I would certainly buy this product

44
Below is pictures of Indomaret Gula Pasir Premium Sugar and Gulaku Sugar, these products are
for sale at Indomaret convenience store, take a good look of the picture and please indicate the
answer that fits you the most.
not shown in the national
brand absence condition,
(questionnaire 2)
3. Please indicate how would you rate the Indomaret Gula Pasir 1kg:
Very poor quality 1 2 3 4 5 Very good quality
I don't like the product at all 1 2 3 4 5 I like the product very much
I would never buy this product
1 2 3 4 5 I would certainly buy this product
4. Please indicate how would you rate the Gulaku Gula Tebu Putih 1kg:
Very poor quality 1 2 3 4 5 Very good quality
I don't like the product at all 1 2 3 4 5 I like the product very much
I would never buy this product
1 2 3 4 5 I would certainly buy this product
Indomaret Gula Pasir Putih
Premium 1kg – Rp 12.500,00
Gulaku Gula Tebu Putih
Premium 1kg – Rp 12.500,00
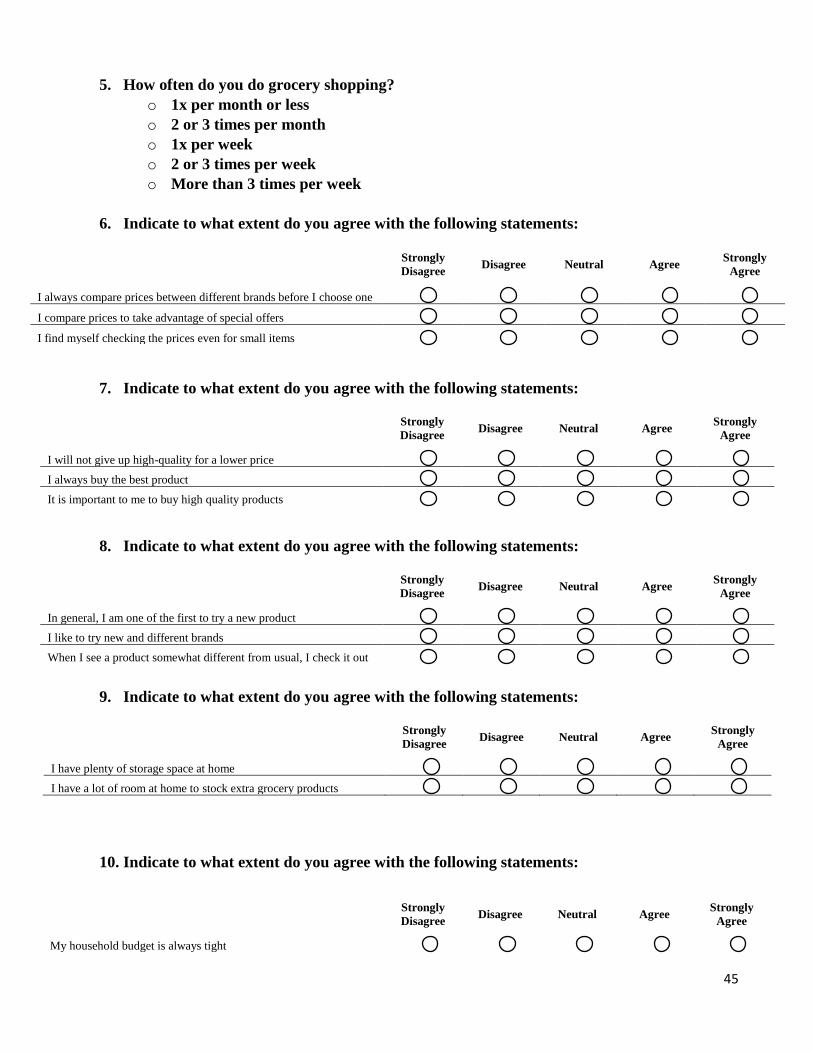
45
5. How often do you do grocery shopping?
o 1x per month or less
o 2 or 3 times per month
o 1x per week
o 2 or 3 times per week
o More than 3 times per week
6. Indicate to what extent do you agree with the following statements:
Strongly
Disagree Disagree Neutral Agree
Strongly
Agree
I always compare prices between different brands before I choose one
I compare prices to take advantage of special offers
I find myself checking the prices even for small items
7. Indicate to what extent do you agree with the following statements:
Strongly
Disagree Disagree Neutral Agree
Strongly
Agree
I will not give up high-quality for a lower price
I always buy the best product
It is important to me to buy high quality products
8. Indicate to what extent do you agree with the following statements:
Strongly
Disagree Disagree Neutral Agree
Strongly
Agree
In general, I am one of the first to try a new product
I like to try new and different brands
When I see a product somewhat different from usual, I check it out
9. Indicate to what extent do you agree with the following statements:
Strongly
Disagree Disagree Neutral Agree
Strongly
Agree
I have plenty of storage space at home
I have a lot of room at home to stock extra grocery products
10. Indicate to what extent do you agree with the following statements:
Strongly
Disagree Disagree Neutral Agree
Strongly
Agree
My household budget is always tight

46
11. Indicate to what extent do you agree with the following statements:
Strongly
Disagree Disagree Neutral Agree
Strongly
Agree
I show sign of nervousness when I don't have enough money
I spend money to make myself feel better
I automatically say "I can't afford it" whether I can or not
Part 3
12. What is your gender
o Male
o Female
13. Please indicate your age
____ years old
14. Please indicate your gross income per month?
o Less than Rp 9.999.999,00
o Rp 10.000.000,00 – Rp 19.999.999,00
o Rp 20.000.000,00 – Rp 29.999.999,00
o More than Rp 30.000.000,00
15. Please indicate your latest education?
o High school or less
o Bachelor’s degree
o Master’s degree
My household often has problems making ends meet
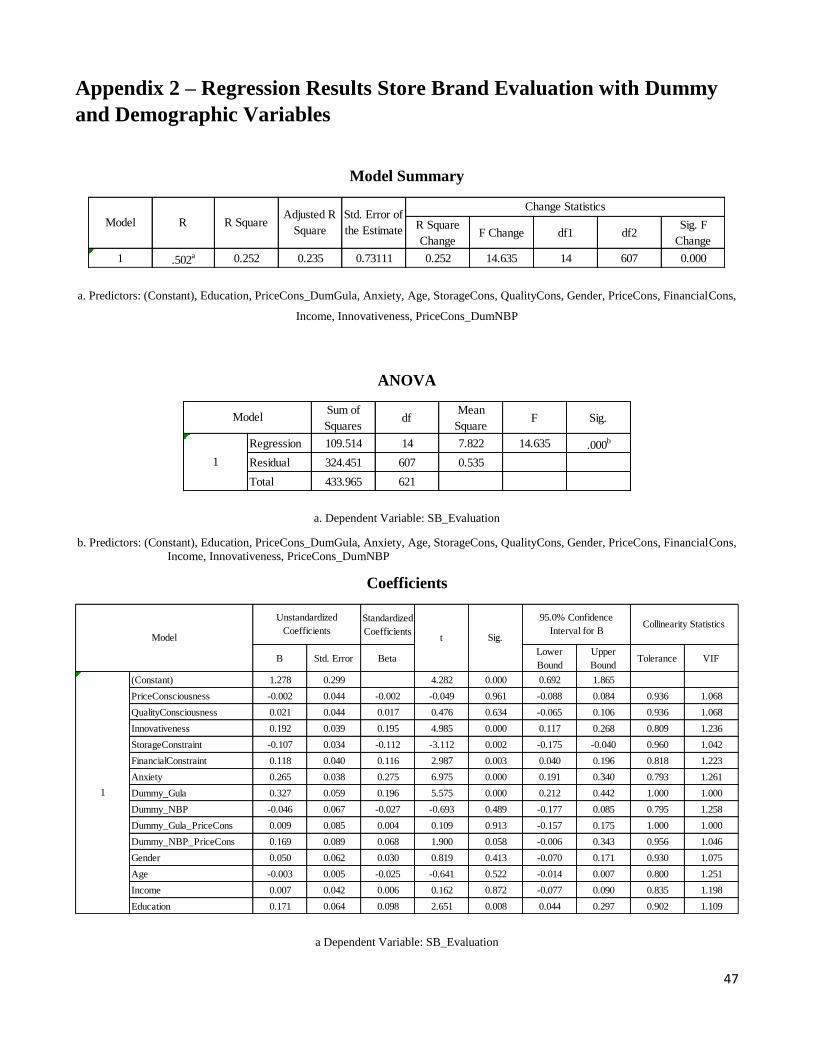
47
Appendix 2 – Regression Results Store Brand Evaluation with Dummy
and Demographic Variables
Model Summary
a. Predictors: (Constant), Education, PriceCons_DumGula, Anxiety, Age, StorageCons, QualityCons, Gender, PriceCons, FinancialCons,
Income, Innovativeness, PriceCons_DumNBP
ANOVA
a. Dependent Variable: SB_Evaluation
b. Predictors: (Constant), Education, PriceCons_DumGula, Anxiety, Age, StorageCons, QualityCons, Gender, PriceCons, FinancialCons,
Income, Innovativeness, PriceCons_DumNBP
Coefficients
a Dependent Variable: SB_Evaluation
R Square
ChangeF Change df1 df2
Sig. F
Change
1 .502a 0.252 0.235 0.73111 0.252 14.635 14 607 0.000
Model R R SquareAdjusted R
Square
Std. Error of
the Estimate
Change Statistics
Sum of
Squaresdf
Mean
SquareF Sig.
Regression 109.514 14 7.822 14.635 .000b
Residual 324.451 607 0.535
Total 433.965 621
Model
1
Standardized
Coefficients
B Std. Error BetaLower
Bound
Upper
BoundTolerance VIF
(Constant) 1.278 0.299 4.282 0.000 0.692 1.865
PriceConsciousness -0.002 0.044 -0.002 -0.049 0.961 -0.088 0.084 0.936 1.068
QualityConsciousness 0.021 0.044 0.017 0.476 0.634 -0.065 0.106 0.936 1.068
Innovativeness 0.192 0.039 0.195 4.985 0.000 0.117 0.268 0.809 1.236
StorageConstraint -0.107 0.034 -0.112 -3.112 0.002 -0.175 -0.040 0.960 1.042
FinancialConstraint 0.118 0.040 0.116 2.987 0.003 0.040 0.196 0.818 1.223
Anxiety 0.265 0.038 0.275 6.975 0.000 0.191 0.340 0.793 1.261
Dummy_Gula 0.327 0.059 0.196 5.575 0.000 0.212 0.442 1.000 1.000
Dummy_NBP -0.046 0.067 -0.027 -0.693 0.489 -0.177 0.085 0.795 1.258
Dummy_Gula_PriceCons 0.009 0.085 0.004 0.109 0.913 -0.157 0.175 1.000 1.000
Dummy_NBP_PriceCons 0.169 0.089 0.068 1.900 0.058 -0.006 0.343 0.956 1.046
Gender 0.050 0.062 0.030 0.819 0.413 -0.070 0.171 0.930 1.075
Age -0.003 0.005 -0.025 -0.641 0.522 -0.014 0.007 0.800 1.251
Income 0.007 0.042 0.006 0.162 0.872 -0.077 0.090 0.835 1.198
Education 0.171 0.064 0.098 2.651 0.008 0.044 0.297 0.902 1.109
1
Model
Unstandardized
Coefficientst Sig.
95.0% Confidence
Interval for BCollinearity Statistics

48
Appendix 3 – Regression Results Store Brand Evaluation without
Dummy
Model Summary
a. Predictors: (Constant), PriceCons, Anxiety, StorageCons, QualityCons, PriceCons, FinancialCons, Innovativeness
ANOVA
a. Dependent Variable: SB_Evaluation
b. Predictors: (Constant), PriceCons, Anxiety, StorageCons, QualityCons, PriceCons, FinancialCons, Innovativeness
Coefficients
a Dependent Variable: SB_Evaluation
R Square
ChangeF Change df1 df2
Sig. F
Change
1 .443a 0.196 0.189 0.75305 0.196 25.042 6 615 0.000
Model R R SquareAdjusted R
Square
Std. Error of
the Estimate
Change Statistics
Sum of
Squaresdf
Mean
SquareF Sig.
Regression 85.206 6 14.201 25.042 .000b
Residual 348.759 615 0.567
Total 433.965 621
Model
1
Standardized
Coefficients
B Std. Error BetaLower
Bound
Upper
BoundTolerance VIF
(Constant) 1.583 0.295 5.361 0.000 1.003 2.163
PriceCons -0.003 0.044 -0.003 -0.073 0.942 -0.090 0.084 0.967 1.034
QualityCons 0.026 0.044 0.022 0.589 0.556 -0.061 0.113 0.960 1.041
Innovativeness 0.188 0.039 0.190 4.802 0.000 0.111 0.265 0.833 1.200
StorageCons -0.090 0.035 -0.093 -2.553 0.011 -0.158 -0.021 0.984 1.017
FinancialCons 0.116 0.038 0.113 3.028 0.003 0.041 0.190 0.934 1.071
Anxiety 0.266 0.038 0.275 7.010 0.000 0.191 0.340 0.848 1.180
1
Model
Unstandardized
Coefficientst Sig.
95.0% Confidence
Interval for BCollinearity Statistics