MSC INDUSTRIAL SUPPLY CO.
32
MSC INDUSTRIAL SUPPLY CO. General Investor Presentation Fiscal 2021
Transcript of MSC INDUSTRIAL SUPPLY CO.

MSC INDUSTRIAL SUPPLY CO.
General Investor Presentation
Fiscal 2021

Cautionary Note Regarding Forward-Looking Statements
2
Statements in this presentation may constitute "forward-looking statements" under the Private Securities Litigation Reform Act of 1995. All statements, other than statements of historical fact, that address activities, events or developments that we expect, believe or anticipate will or may occur in the future, including statements about the future impact of COVID-19 on our business operations, results of operations and financial condition, expected future results, expected benefits from our investment and strategic plans and other initiatives, and expected future growth, profitability and return on invested capital, are forward-looking statements. The words “will,”, “may,” “believes,” “anticipates,” “thinks,” “expects,” “estimates,” “plans,” “intends,” and similar expressions are intended to identify forward-looking statements. Forward-looking statements involve risks and uncertainties that could cause actual results to differ materially from those anticipated by these forward-looking statements. Readers are cautioned not to place undue reliance on these forward-looking statements, which speak only as of the date hereof. The inclusion of any statement in this presentation does not constitute an admission by MSC Industrial or any other person that the events or circumstances described in such statement are material. Factors that could cause actual results to differ materially from those in forward-looking statements include the following, many of which are and will be amplified by the COVID-19 pandemic: the impact of the COVID-19 pandemic on our sales, operations and supply chain; general economic conditions in the markets in which we operate, including conditions resulting from the COVID-19 pandemic; changing customer and product mixes; competition, including the adoption by competitors of aggressive pricing strategies and sales methods; industry consolidation and other changes in the industrial distribution sector; our ability to realize the expected benefits from our investment and strategic plans, including our transition from being a spot-buy supplier to a mission-critical partner to our customers; our ability to realize the expected cost savings and benefits from our restructuring activities and structural cost reductions; the retention of key personnel; volatility in commodity and energy prices; the credit risk of our customers, including changes in credit risk as a result of the COVID-19 pandemic; the risk of customer cancellation or rescheduling of orders; difficulties in calibrating customer demand for our products, in particular personal protective equipment or “PPE” products, which could cause an inability to sell excess products ordered from manufacturers resulting in inventory write-downs or could conversely cause inventory shortages of such products; work stoppages, labor shortages or other business interruptions (including those due to extreme weather conditions or as a result of the COVID-19 pandemic) at transportation centers, shipping ports, our headquarters or our customer fulfillment centers; disruptions or breaches of our information systems, or violations of data privacy laws; the retention of qualified sales and customer service personnel and metalworking specialists; the risk of loss of key suppliers or key brands or supply chain disruptions, including due to import restrictions resulting from the COVID-19 pandemic; changes to governmental trade policies, including the impact from significant import restrictions or tariffs; risks related to opening or expanding our customer fulfillment centers; our ability to estimate the cost of healthcare claims incurred under our self-insurance plan; litigation risk due to the nature of our business; risks associated with the integration of acquired businesses or other strategic transactions; financial restrictions on outstanding borrowings; our ability to maintain our credit facilities; the interest rate uncertainty due to the London Interbank Offered Rate (“LIBOR”) reform; the failure to comply with applicable environmental, health and safety laws and regulations, including government action in response to the COVID-19 pandemic, and other laws applicable to our business; the outcome of government or regulatory proceedings or future litigation; goodwill and intangible assets recorded resulting from our acquisitions could be impaired; our common stock price may be volatile due to factors outside of our control; and our principal shareholders exercise significant control over us, which may result in our taking actions or failing to take actions that are in the best interests of other shareholders. Additional information concerning these and other risks is described under "Risk Factors" and "Management's Discussion and Analysis of Financial Condition and Results of Operations" in our Annual and Quarterly Reports on Forms 10-K and 10-Q, respectively, and in the other reports and documents that we file with the U.S. Securities and Exchange Commission. We expressly disclaim any obligation to update any of these forward-looking statements, except to the extent required by applicable law.

MSC Industrial Direct: Company Overview
MSC is a leading value-add industrial distributor offering products, services and solutions that enable its customers to achieve higher levels of growth, productivity, and profitability
1Year Ended August 29, 2020220-Year CAGR calculated through August 29, 20203Over the last three fiscal years ended August 29, 2020 3
1 2
2 31
Value-add solutions: metalworking expertise, supply chain management, e-commerce, productivity improvement and training
Leader in highly fragmented industrial distribution market
6,300 associates
17 branches and 5 primary distribution centers
Broad offering: 1.9 million+ SKUs from 3,000+ suppliers
Founded in 1941 and listed on NYSE (MSM) since 1995
11.0%Operating
Margin
10%20-Year EPS
CAGR
(over the last 3 years)
$3.2BTotal
Revenues
7%20-Yr Sales
CAGR
$1.1BOperating Cash
Flows
$886MReturned to
Shareholders(over the last 3 years)

Key MSC Investment Highlights
4
Leader in the highly fragmented North American industrial distribution market with significant opportunities for organic and acquisitive growth
Value-added solutions approach focuses on addressing customer total cost of ownership with highly technical expertise and a broad portfolio of products and services
Industry-leading customer satisfaction ratings driven by customer-centric culture and obsession with delivering solutions that enable customer success
Implementing Mission Critical, a major program to return to above market growth and improve profitability
Capital allocation strategy based on an owner mindset and focused on long-term value creation for shareholders

The top 50 distributors represent less than 30% of the market
5
Highly Fragmented Industrial Distribution Market
The North American industrial distribution market is very large and highly fragmented both across the addressable market and the customer landscape
Customer Count
1%
2%
11%
86%
Revenue Potential
39%
26%
20%
16%Simple
Transactions
Complex Solutions
Company Size(# employees)
Medium (50-249)
Small (10-49)
Very Small (1-9)
Large(>250)
Industrial Distribution Customer Landscape
MSC
Highly fragmented with ~145K distributors in the US1
1MDM Analytics (figures are approximate)2Calculation performed by MSC (figures are approximate)
Total Addressable Market(~$200 Billion in Sales)
~$200B of the MRO market in N. America directly addressable by MSC2

6
MSC’s Position in the Market
MSC’s target manufacturing market makes up about 50% of total addressable marketplace spend, making brand awareness and equity critical to attract and maintain customers
Total Addressable Market(~$200 Billion in Sales1,2)
MSC Fiscal Year 2020 Sales($3.2 Billion)
MRO
Metalworking
VMI
Within the approximately ~19M total potential customers, MSC can serve the ~700k metalworking customers2
MSC
~$200B of the MRO market in N. America directly addressable by MSC1,2
Addressable market is comprised of approximately ~19M total potential customers2
The top 50 distributors represent less than 30% of the market
1MDM Analytics (figures are approximate)2Calculation performed by MSC (figures are approximate for N. America)
These ~700k customers make up a large amount of the overall spend in manufacturing2
~200K are larger customers, while ~500K are smaller customers2

MSC’s Differentiator in the Market:Built to Make You Better
7
MSC’s value-added solutions approach focuses on addressing customer total cost of ownership with highly technical expertise with a broad portfolio of products and services
Industry Model MSC Solutions Approach
Inventory and Operational Costs
ProcurementCosts
Inventory and Operational Costs
ProcurementCosts Product
Price
Product Price
(Total Cost of Ownership Focused)(Product Price Driven)
Customer Value Drivers
Growth
Profitability
Productivity

MSC Customer Care Ensuring Customer Satisfaction
Obsession with delivering personalized and effortless customer experiences thatenable success, measured directly from our customers
8
Customer Care Delivery
1 ForeSee– Web Browse Measurement Feb. 28, 2021
High-Touch Customer Care
Technical and Sourcing Experts
Consistent Customer Service
Focus on Customer Satisfaction
Build Trust and Loyalty
Creative Problem SolvingCSAT Scale (1-5)
Excellent 5Very Good 4Good 3Fair 2Poor 1
Customer Care Center Satisfaction Levels
MSC Other Contact Center Average
1
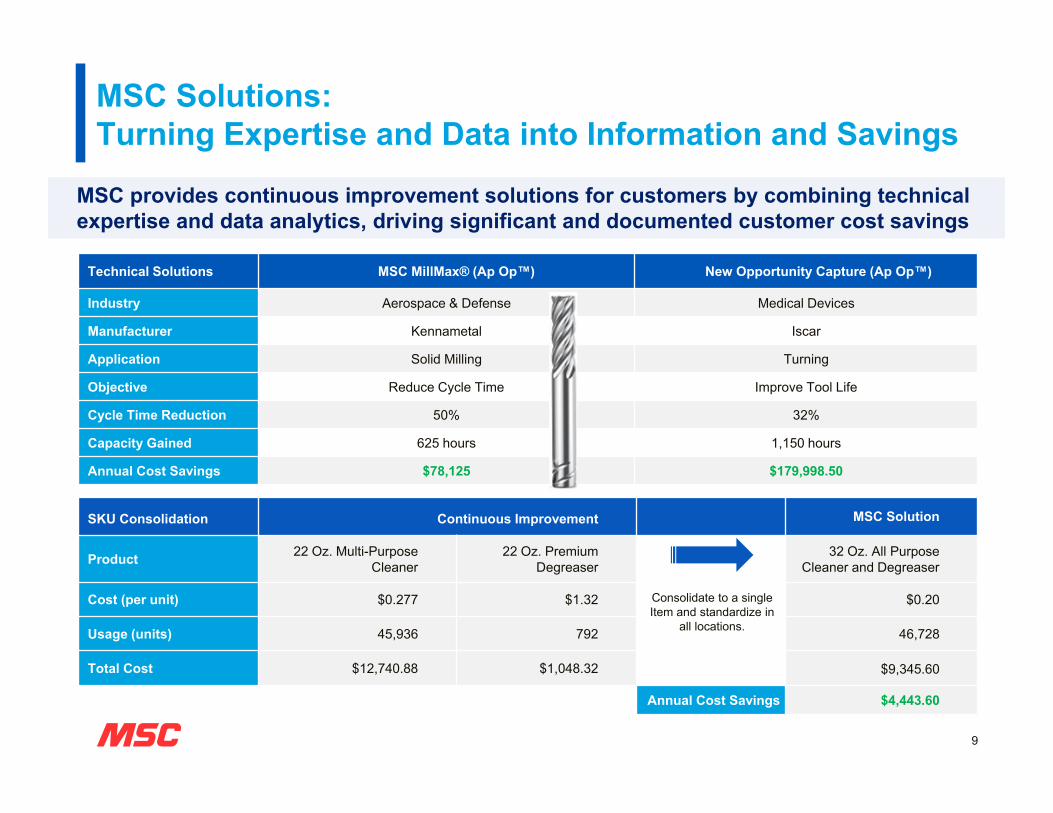
SKU Consolidation Continuous Improvement MSC Solution
Product 22 Oz. Multi-PurposeCleaner
22 Oz. PremiumDegreaser
32 Oz. All PurposeCleaner and Degreaser
Cost (per unit) $0.277 $1.32 $0.20
Usage (units) 45,936 792 46,728
Total Cost $12,740.88 $1,048.32 $9,345.60
Annual Cost Savings $4,443.60
MSC Solutions:Turning Expertise and Data into Information and Savings
MSC provides continuous improvement solutions for customers by combining technical expertise and data analytics, driving significant and documented customer cost savings
Consolidate to a single Item and standardize in
all locations.
Technical Solutions MSC MillMax® (Ap Op™) New Opportunity Capture (Ap Op™)
Industry Aerospace & Defense Medical Devices
Manufacturer Kennametal Iscar
Application Solid Milling Turning
Objective Reduce Cycle Time Improve Tool Life
Cycle Time Reduction 50% 32%
Capacity Gained 625 hours 1,150 hours
Annual Cost Savings $78,125 $179,998.50
9

$2.3 millionProductivity SavingsGlobal Truck Manufacturer One of North America’s largest producers of heavy duty Class 8trucks, engines and transmissions
$43,000Profit ImprovementEnergy Sector National AccountA simple, 15-minute MSC MillMax® impact test in a milling operation improved profits while reducing cycle time from 132 seconds to 34 seconds.
$1.5 million Savings in Tooling CostsMoellerAircraft division specializes in machined parts for the gas turbine aircraft engine and power generation industries, including airfoils
430 hoursAnnual Capacity GainedContract Machine ShopImproving cycle time on a 6061T6 AluminumChassis created time on existing machines,Allowing the customer to add even more work.
$1.6 millionTotal Cost SavingsAerospace Defense ContractorOne of the US’s largest manufacturers savings resulting from supply chain and operational improvements.
10
Customer Value:True Stories. True Results.
Documentation program delivered
>$350 million in cost savings for MSC customers in 2020

SolidifyMetalworking
LeveragePortfolioStrength
ExpandSolutions
GrowE-commerce
DiversifyCustomers &End Markets
Sales & Services
SupplyChain
General & Administrative
Overview of Mission Critical
OBJECTIVE: Reaccelerate market
share capture
GOAL: Outgrow market by
at least 400 bps over cycle
11
KEY PRIORITIES
OBJECTIVE: Grow profits faster
than sales
KEY AREAS
GOAL: Achieve high-teens
ROIC by end of 2023
• The Mission Critical growth initiative was established to recapture market share while delivering cost savings on the path to accelerating profitability
• Solid program execution and tracking to high end of targeted total gross savings of $90M-$100M by FY23 vs. FY19
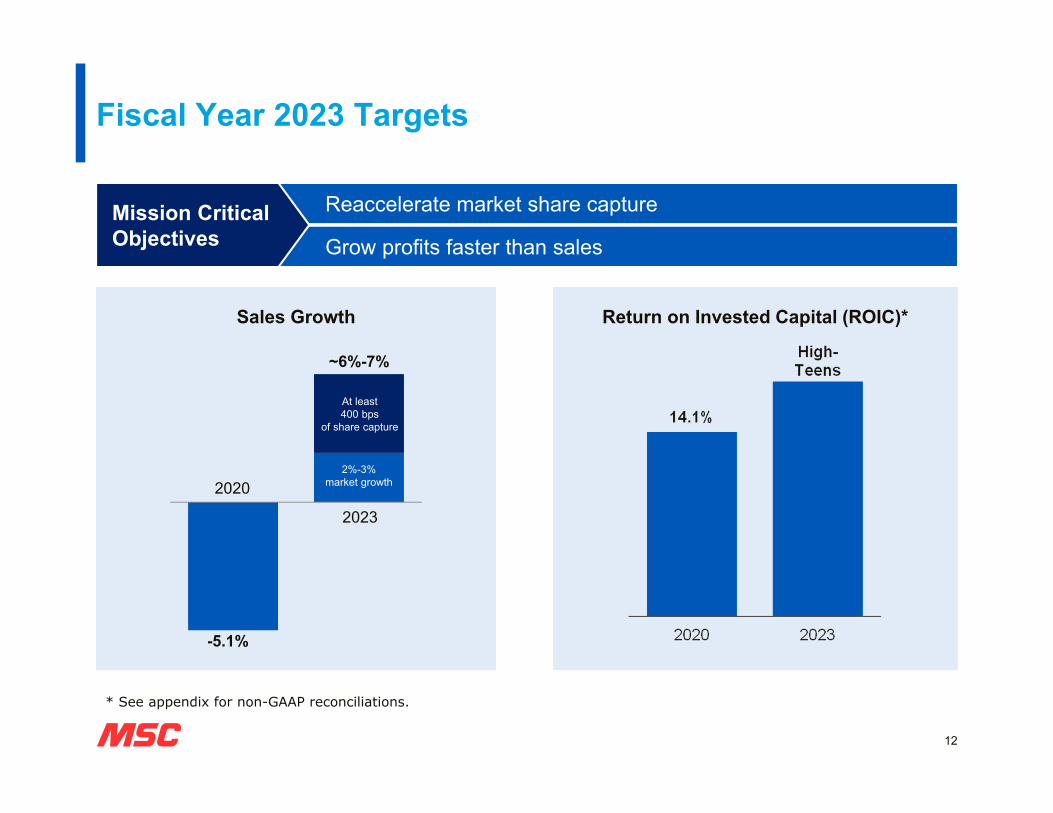
Reaccelerate market share capture
Grow profits faster than sales
Fiscal Year 2023 Targets
Mission Critical Objectives
-5.1%
~6%-7%
Sales Growth Return on Invested Capital (ROIC)*
12
* See appendix for non-GAAP reconciliations.
2%-3%market growth
At least400 bps
of share capture
2023
2020

Mission Critical: Strong Progress on Cost Savings
Total Gross Savings Target:$90M – $100M
by end of FY23 versus FY19
Sales and service Supply chain General & Administrative
KEY AREAS
• Raised FY21 target to ~$40M gross cost savings• FY21 growth investments ~$25M • Net savings of ~$15M FY21• Continue to target $90M to $100M in total cost savings
by end of FY23 versus FY19; trending to high end of range
• Projected improvement in OpEx to Sales ratio of roughly 200 bps by end of FY23
$40Mexpected in
FY2021
13
$0
$20
$40
$60
$80
$100
FY2020: $20M
Q1 FY2021: $8M
Q2 FY2021: $9M
Q3 FY2021: $12M

14
Track Record of Growth and ResilienceBi
llions
0%
10%
20%
30%
40%
50%
$0.0
$0.5
$1.0
$1.5
$2.0
$2.5
$3.0
$3.5
2000 2002 2004 2006 2008 2010 2012 2014 2016 2018 2020
Revenue Operating IncomeOpex % of Revenue Operating MarginGross Margin
$0
$50
$100
$150
$200
$250
$300
$350
$400
$450
2009 2010 2011 2012 2013 2014 2015 2016 2017 2018 2019 2020
Operating Cash Flow CapEx
Milli
ons
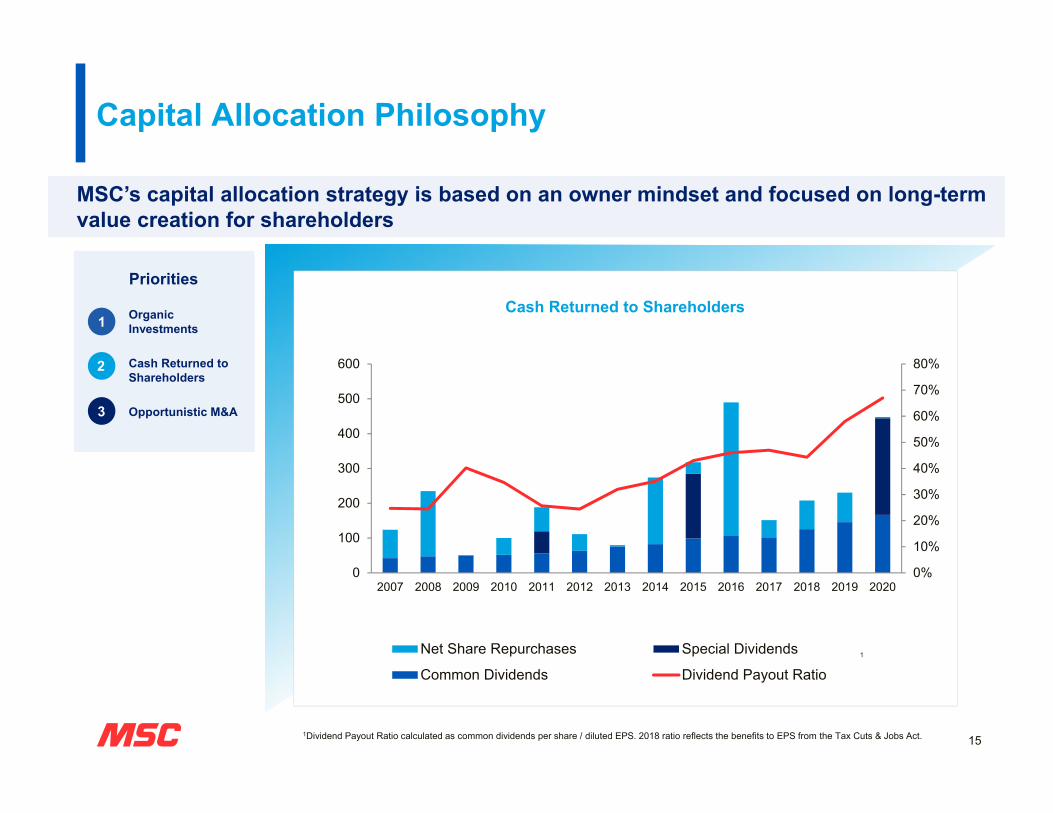
Cash Returned to Shareholders
0%
10%
20%
30%
40%
50%
60%
70%
80%
0
100
200
300
400
500
600
2007 2008 2009 2010 2011 2012 2013 2014 2015 2016 2017 2018 2019 2020
Net Share Repurchases Special Dividends
Common Dividends Dividend Payout Ratio1
Capital Allocation Philosophy
MSC’s capital allocation strategy is based on an owner mindset and focused on long-term value creation for shareholders
151Dividend Payout Ratio calculated as common dividends per share / diluted EPS. 2018 ratio reflects the benefits to EPS from the Tax Cuts & Jobs Act.
Priorities
Organic Investments
Cash Returned to Shareholders
Opportunistic M&A
1
2
3

Key MSC Investment Highlights
16
Leader in the highly fragmented North American industrial distribution market with significant opportunities for organic and acquisitive growth
Value-added solutions approach focuses on addressing customer total cost of ownership with highly technical expertise and a broad portfolio of products and services
Industry-leading customer satisfaction ratings driven by customer-centric culture and obsession with delivering solutions that enable customer success
Implementing Mission Critical, a major program to return to above market growth and improve profitability
Capital allocation strategy based on an owner mindset and focused on long-term value creation for shareholders

APPENDIX
17
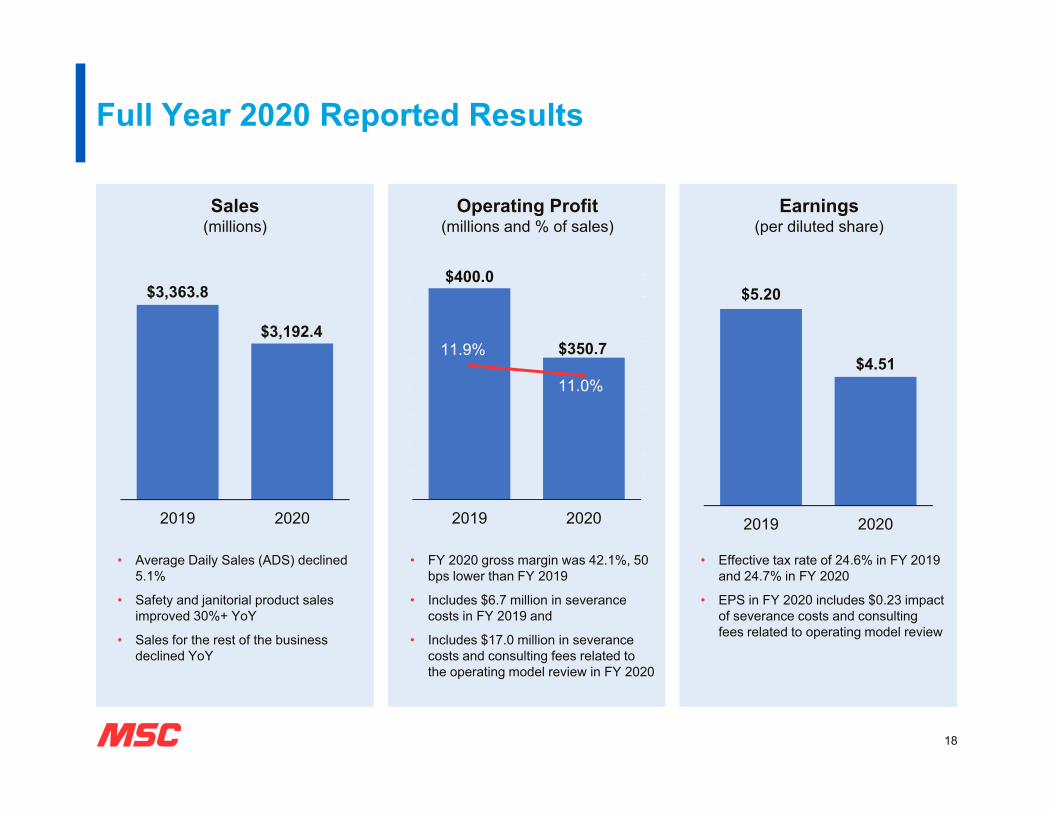
Full Year 2020 Reported Results
$3,363.8
$3,192.4
2019 2020
$400.0
$350.711.9%
11.0%
0.00%
2.00%
4.00%
6.00%
8.00%
10.00%
12.00%
14.00%
16.00%
18.00%
20.00%
$250.00
$270.00
$290.00
$310.00
$330.00
$350.00
$370.00
$390.00
$410.00
2019 2020
$5.20
$4.51
2019 2020
18
Sales(millions)
Operating Profit(millions and % of sales)
Earnings(per diluted share)
• Average Daily Sales (ADS) declined 5.1%
• Safety and janitorial product sales improved 30%+ YoY
• Sales for the rest of the business declined YoY
• FY 2020 gross margin was 42.1%, 50 bps lower than FY 2019
• Includes $6.7 million in severance costs in FY 2019 and
• Includes $17.0 million in severance costs and consulting fees related to the operating model review in FY 2020
• Effective tax rate of 24.6% in FY 2019 and 24.7% in FY 2020
• EPS in FY 2020 includes $0.23 impact of severance costs and consulting fees related to operating model review

Fiscal 2020 Adjusted Results*
$3,363.8
$3,192.4
2019 2020
Sales(millions)
$406.7
$367.812.1%
11.5%
0.00%
2.00%
4.00%
6.00%
8.00%
10.00%
12.00%
14.00%
16.00%
18.00%
20.00%
$250.00
$270.00
$290.00
$310.00
$330.00
$350.00
$370.00
$390.00
$410.00
$430.00
2019 2020
Adjusted Operating Profit(millions and % of sales)
$5.29
$4.74
2019 2020
Adjusted Earnings(per diluted share)
19
• Average Daily Sales (ADS) declined 5.1%
• Safety and janitorial product sales improved 30%+ YoY
• Sales for the rest of the business declined YoY
• Solid underlying gross margins offset by PPE-related mix headwinds
• Excludes $6.7 million in severance costs in FY 2019
• Excludes $17.0 million in severance costs and consulting fees related to the operating model review in FY 2020
• Effective tax rate of 24.6% in FY 2019 and 24.7% in FY 2020
• Excludes $0.09 impact of severance costs in FY 2019
• Excludes $0.23 impact of severance costs and consulting fees related to operating model review in FY 2020
• See appendix for non-GAAP reconciliations.• Individual amounts may not agree to the total due to rounding
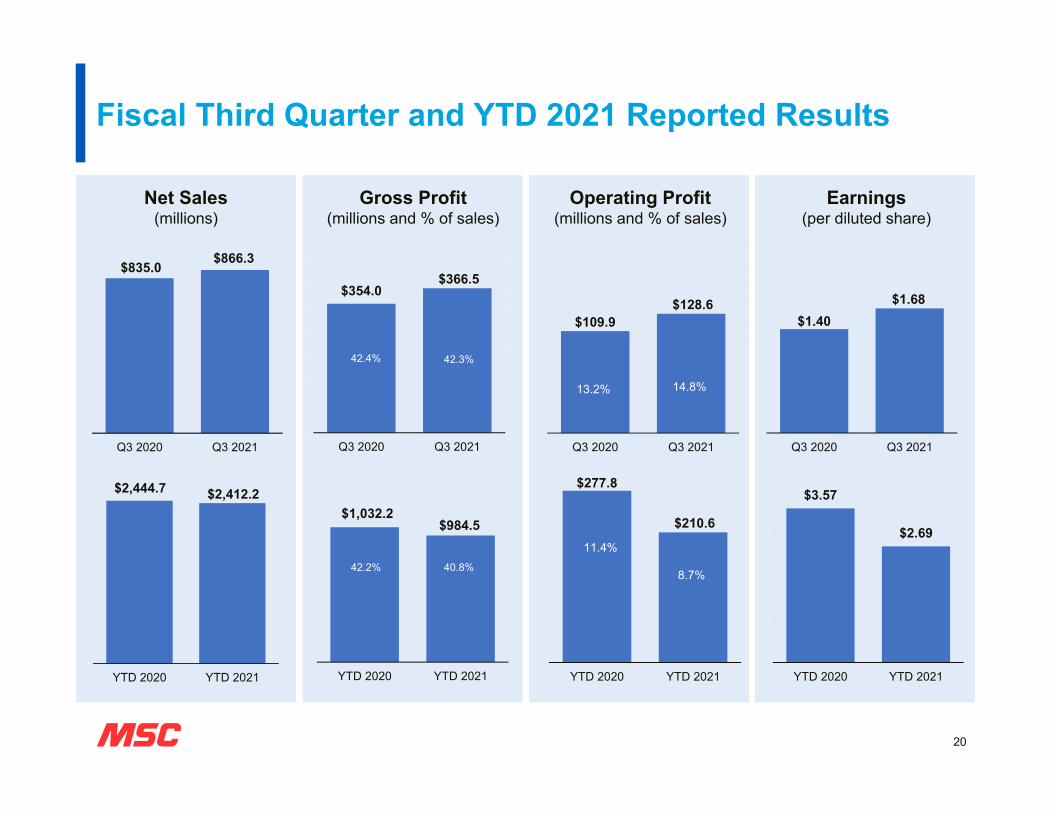
Fiscal Third Quarter and YTD 2021 Reported Results
Net Sales(millions)
Gross Profit(millions and % of sales)
Operating Profit(millions and % of sales)
Earnings(per diluted share)
$835.0 $866.3
$250.00
$350.00
$450.00
$550.00
$650.00
$750.00
$850.00
$950.00
Q3 2020 Q3 2021
$2,444.7 $2,412.2
$250.00
$750.00
$1,250.00
$1,750.00
$2,250.00
$2,750.00
YTD 2020 YTD 2021
$354.0$366.5
0.00%
2.00%
4.00%
6.00%
8.00%
10.00%
12.00%
14.00%
16.00%
18.00%
20.00%
$250.00
$270.00
$290.00
$310.00
$330.00
$350.00
$370.00
$390.00
Q3 2020 Q3 2021
42.3%42.4%
$1,032.2$984.5
0.00%
2.00%
4.00%
6.00%
8.00%
10.00%
12.00%
14.00%
16.00%
18.00%
20.00%
$250.00
$350.00
$450.00
$550.00
$650.00
$750.00
$850.00
$950.00
$1,050.00
$1,150.00
YTD 2020 YTD 2021
40.8%42.2%
$109.9$128.6
13.2% 14.8%
0.00%
2.00%
4.00%
6.00%
8.00%
10.00%
12.00%
14.00%
16.00%
18.00%
20.00%
$0.00
$20.00
$40.00
$60.00
$80.00
$100.00
$120.00
$140.00
$160.00
$180.00
$200.00
Q3 2020 Q3 2021
$1.40$1.68
$0.00
$0.50
$1.00
$1.50
$2.00
$2.50
Q3 2020 Q3 2021
$277.8
$210.6
11.4%
8.7%
0.00%
2.00%
4.00%
6.00%
8.00%
10.00%
12.00%
14.00%
16.00%
18.00%
20.00%
YTD 2020 YTD 2021
$3.57
$2.69
$0.00
$0.50
$1.00
$1.50
$2.00
$2.50
$3.00
$3.50
$4.00
YTD 2020 YTD 2021
20
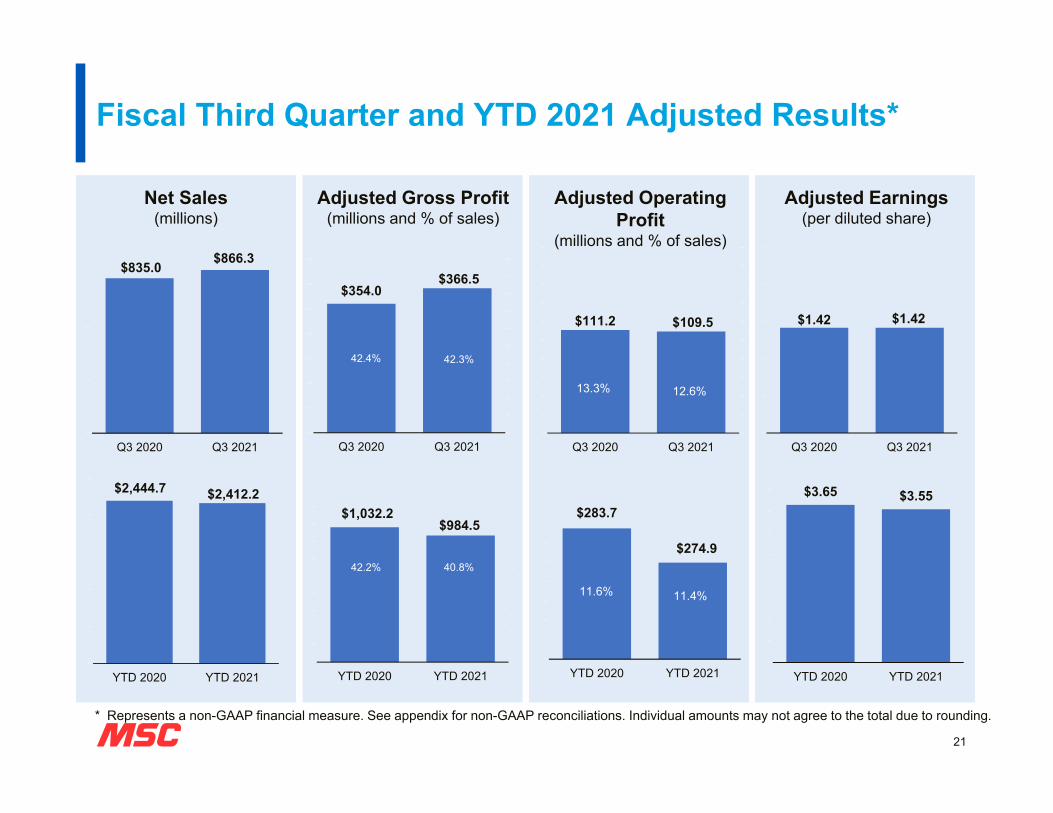
Fiscal Third Quarter and YTD 2021 Adjusted Results*
Net Sales(millions)
Adjusted Gross Profit(millions and % of sales)
Adjusted Operating Profit
(millions and % of sales)
Adjusted Earnings(per diluted share)
$835.0 $866.3
$250.00
$350.00
$450.00
$550.00
$650.00
$750.00
$850.00
$950.00
Q3 2020 Q3 2021
$2,444.7 $2,412.2
$250.00
$750.00
$1,250.00
$1,750.00
$2,250.00
$2,750.00
YTD 2020 YTD 2021
$354.0$366.5
0.00%
2.00%
4.00%
6.00%
8.00%
10.00%
12.00%
14.00%
16.00%
18.00%
20.00%
$250.00
$270.00
$290.00
$310.00
$330.00
$350.00
$370.00
$390.00
Q3 2020 Q3 2021
42.3%42.4%
$1,032.2$984.5
0.00%
2.00%
4.00%
6.00%
8.00%
10.00%
12.00%
14.00%
16.00%
18.00%
20.00%
$250.00
$350.00
$450.00
$550.00
$650.00
$750.00
$850.00
$950.00
$1,050.00
$1,150.00
YTD 2020 YTD 2021
40.8%42.2%
$111.2 $109.5
13.3% 12.6%
0.00%
2.00%
4.00%
6.00%
8.00%
10.00%
12.00%
14.00%
16.00%
18.00%
20.00%
$0.00
$20.00
$40.00
$60.00
$80.00
$100.00
$120.00
$140.00
$160.00
$180.00
$200.00
Q3 2020 Q3 2021
$1.42 $1.42
$0.00
$0.50
$1.00
$1.50
$2.00
$2.50
Q3 2020 Q3 2021
$3.65 $3.55
$0.00
$0.50
$1.00
$1.50
$2.00
$2.50
$3.00
$3.50
$4.00
YTD 2020 YTD 2021
21
* Represents a non-GAAP financial measure. See appendix for non-GAAP reconciliations. Individual amounts may not agree to the total due to rounding.
$283.7
$274.9
$250.00
$255.00
$260.00
$265.00
$270.00
$275.00
$280.00
$285.00
$290.00
YTD 2020 YTD 2021
11.6% 11.4%

Industrial Production Index (IP)
22
‐20.0%
‐15.0%
‐10.0%
‐5.0%
0.0%
5.0%
10.0%
15.0%
20.0%
2011 2012 2013 2014 2015 2016 2017 2018 2019 2020 2021
Change (Year‐Over‐Year)
MSC Total Organic Growth 3‐Month Average
MSC Total Organic Growth (3 Mo Avg) IP Growth (3 Mo Avg)

Fiscal 2021 Framework*
Revenue Growth (YoY) Operating Margin Range (%)
Low single digits 10.2%- 10.6%
Flat 9.9%- 10.3%
Low single digits 9.6%- 10.0%
23* Includes $26.7 million in an asset impairment.
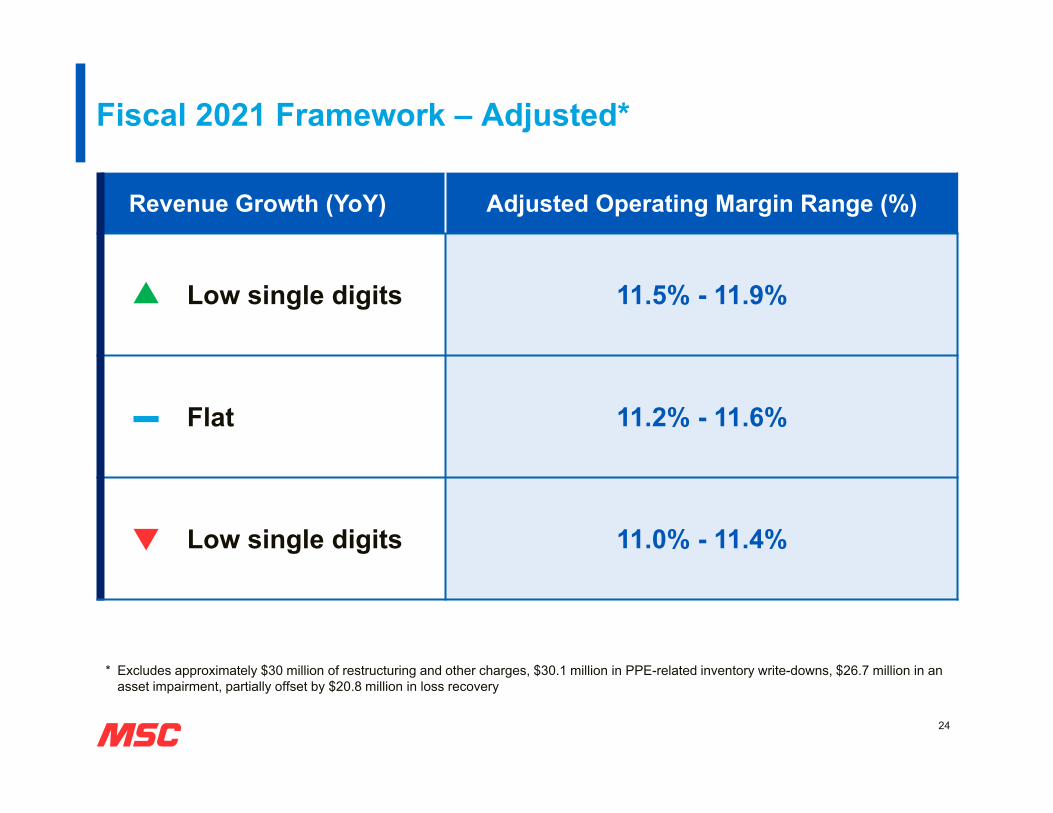
Fiscal 2021 Framework – Adjusted*
Revenue Growth (YoY) Adjusted Operating Margin Range (%)
Low single digits 11.5% - 11.9%
Flat 11.2% - 11.6%
Low single digits 11.0% - 11.4%
* Excludes approximately $30 million of restructuring and other charges, $30.1 million in PPE-related inventory write-downs, $26.7 million in an asset impairment, partially offset by $20.8 million in loss recovery
24

Reconciliations Non-GAAP Financial Measures
Free Cash Flow (“FCF”)
FCF is a non-GAAP financial measure. FCF is used in addition to and in conjunction with results presented in accordance with accounting principles generally accepted in the United States (“GAAP”), and FCF should not be relied upon to the exclusion of GAAP financial measures. Management strongly encourages investors to review our financial statements and publicly-filed reports in their entirety and to not rely on any single financial measure. FCF, which we reconcile to “Net cash provided by operating activities,” is cash flow from operations reduced by “Expenditures for property, plant and equipment”. We believe that FCF, although similar to cash flow from operations, is a useful additional measure since capital expenditures are a necessary component of ongoing operations. Management also views FCF, as a measure of the Company’s ability to reduce debt, add to cash balances, pay dividends, and repurchase stock. FCF has limitations due to the fact that it does not represent the residual cash flow available for discretionary expenditures. For example, FCF does not incorporate payments made on finance lease obligations or required debt service payments. In addition, different companies define FCF differently. Therefore, we believe it is important to view FCF as a complement to our entire consolidated statements of cash flows. A reconciliation of cash provided by operating activities to FCF for the thirteen and thirty-nine-week periods ended May 29, 2021 and May 30, 2020, respectively is shown below.
Return on Invested Capital (“ROIC”)
ROIC is calculated using a non-GAAP financial measure. We calculate ROIC by dividing non-GAAP net operating profit after tax (“NOPAT”) by average invested capital, a GAAP measure. NOPAT is defined as tax effected income from operations. Average invested capital is defined as net debt plus shareholder’s equity using a trailing 13-month average. We believe that ROIC is useful to investors as a measure of performance and of the effectiveness of the use of capital in our operations. We use ROIC as one measure to monitor and evaluate operating performance. This method of determining non-GAAP ROIC may differ from other companies' methods and therefore may not be comparable to those used by other companies. ROIC should be considered in addition to, rather than as a substitute for, other information provided in accordance with GAAP. The financial measure calculated under GAAP which is most directly comparable to ROIC is considered to be the ratio of Net income to Average invested capital. See below for the calculation of ROIC and the reconciliation to the comparable GAAP measure.
25

Reconciliations Results Excluding Impairment Loss (Loss Recovery), Restructuring Costs, Inventory Write-downs, and Other Charges
To supplement MSC Industrial’s unaudited selected financial data presented consistent with accounting principles generally accepted in the United States (“GAAP”), the Company discloses certain non-GAAP financial measures, including non-GAAP gross profit, non-GAAP operating expenses, non-GAAP income from operations, non-GAAP operating margin, non-GAAP provision for income taxes, non-GAAP net income and non-GAAP diluted earnings per share, that exclude impairment losses (loss recovery), restructuring costs, inventory write-downs related to certain PPE inventory, and other related costs and tax effects.
These non-GAAP financial measures are not presented in accordance with GAAP or an alternative for GAAP financial measures and may be different from similar non-GAAP financial measures used by other companies. The presentation of this additional information is not meant to be considered in isolation or as a substitute for the most directly comparable GAAP financial measures and should only be used to evaluate MSC Industrial’s results of operations in conjunction with the corresponding GAAP financial measures.
In calculating non-GAAP financial measures, we exclude impairment losses (loss recovery), restructuring costs, inventory write-downs related to certain PPE inventory, and other related costs and tax effects. Management makes these adjustments to facilitate a review of the Company’s operating performance on a comparable basis between periods, for comparison with forecasts and strategic plans, for identifying and analyzing trends in the Company’s underlying business and for benchmarking performance externally against competitors. We believe that investors benefit from seeing results from the perspective of management in addition to seeing results presented in accordance with GAAP for the same reasons and purposes for which management uses such non-GAAP financial measures.
26

Reconciliations MSC INDUSTRIAL DIRECT CO., INC.
Reconciliation of GAAP and Non-GAAP InformationThirteen and Thirty-Nine Weeks Ended May 29, 2021 and May 30, 2020
(dollars in thousands)
GAAP Measure Items Affecting Comparability Non-GAAP Measure
Net cash provided by operating activities Expenditures for property, plant and equipment Free cash flowThirteen Weeks Ended Thirteen Weeks Ended Thirteen Weeks Ended
May 29, 2021 May 30, 2020 May 29, 2021 May 30, 2020 May 29, 2021 May 30, 2020$ 20,426 $ 59,126 $ (17,644) $ (10,183) $ 2,782 $ 48,943
GAAP Measure Items Affecting Comparability Non-GAAP Measure
Net cash provided by operating activities Expenditures for property, plant and equipment Free cash flowThirty-Nine Weeks Ended Thirty-Nine Weeks Ended Thirty-Nine Weeks Ended
May 29, 2021 May 30, 2020 May 29, 2021 May 30, 2020 May 29, 2021 May 30, 2020$ 139,360 $ 214,941 $ (37,598) $ (35,920) $ 101,762 $ 179,021
27

Reconciliations
MSC INDUSTRIAL DIRECT CO., INC.Reconciliation of GAAP and Non-GAAP Financial Information
Thirteen Weeks Ended May 29, 2021(dollars in thousands, except percentages and per share data)
GAAP Financial Measure Items Affecting ComparabilityNon-GAAP Financial
Measure
Total MSC IndustrialImpairment Loss (Loss
Recovery) Restructuring Costs
Legal Costs-impairment of prepaid for PPE
Adjusted Total MSC Industrial
Net Sales $ 866,294 $ - $ - $ - $ 866,294
Cost of Goods Sold 499,823 - - - 499,823
Gross Profit 366,471 - - - 366,471Gross Margin 42.3% - - - 42.3%
Operating Expenses 257,336 - - 401 256,935
Operating Exp as % of Sales 29.7% - 0.0% 29.7%
Impairment Loss (Loss Recovery) (20,840) (20,840) - - -
Restructuring Costs 1,349 - 1,349 - -
Income from Operations 128,626 20,840 (1,349) (401) 109,536Operating Margin 14.8% 2.4% -0.2% 0.0% 12.6%
Total Other Expense (2,550) - - - (2,550)
Income before provision for income taxes 126,076 20,840 (1,349) (401) 106,986
Provision for income taxes 31,141 5,263 (341) (100) 26,319Net income 94,935 15,577 (1,008) (301) 80,667
Net income attributable to noncontrolling interest 501 - - - 501Net income attributable to MSC Industrial $ 94,434 $ 15,577 $ (1,008) $ (301) $ 80,166
Net income per common share:Diluted $ 1.68 $ 0.28 $ (0.02) $ (0.01) $ 1.42
28

Reconciliations MSC INDUSTRIAL DIRECT CO., INC.
Reconciliation of GAAP and Non-GAAP Financial InformationThirty-Nine Weeks Ended May 29, 2021
(dollars in thousands, except percentages and per share data)
GAAP Financial Measure Items Affecting Comparability
Non-GAAP Financial Measure
Total MSC Industrial
Inventory Write-down
Restructuring Costs Impairment Loss Legal Costs -
impairment of prepaid for PPE
Adjusted Total MSC Industrial
Net Sales $ 2,412,193 $ - $ - $ - $ - $ 2,412,193
Cost of Goods Sold 1,427,653 30,091 - - - 1,397,562
Gross Profit 984,540 (30,091) - - - 1,014,631Gross Margin 40.8% -1.2% - - - 42.1%
Operating Expenses 741,156 - - - 1,421 739,735Operating Exp as % of Sales 30.7% - - - 0.1% 30.7%
Impairment Loss 5,886 - - 5,886 - -
Restructuring Costs 26,943 - 26,943 - - -
Income from Operations 210,555 (30,091) (26,943) (5,886) (1,421) 274,896Operating Margin 8.7% -1.2% -1.1% -0.2% -0.1% 11.4%
Total Other Expense (8,856) - - - - (8,856)
Income before provision for income taxes 201,699 (30,091) (26,943) (5,886) (1,421) 266,040
Provision for income taxes 49,639 (7,392) (6,620) (1,446) (349) 65,446Net income 152,060 (22,699) (20,323) (4,440) (1,072) 200,594Net income attributable to noncontrolling interest 1,087 - - - - 1,087Net income attributable to MSC Industrial $ 150,973 $ (22,699) $ (20,323) $ (4,440) $ (1,072) $ 199,507
Net income per common share:Diluted $ 2.69 $ (0.40) $ (0.36) $ (0.08) $ (0.02) $ 3.55
29

Reconciliations MSC INDUSTRIAL DIRECT CO., INC.
Reconciliation of GAAP and Non-GAAP Financial InformationThirteen and Thirty-Nine Weeks Ended May 30, 2020
(dollars in thousands, except percentages and per share data)
GAAP Financial Measure Items Affecting Comparability 1 Non-GAAP Financial Measure
Total MSC Industrial Restructuring Costs MSC Industrial excluding Restructuring CostsThirteen
Weeks EndedThirty-Nine
Weeks EndedThirteen
Weeks EndedThirty-Nine
Weeks EndedThirteen
Weeks EndedThirty-Nine
Weeks EndedMay 30, 2020 May 30, 2020 May 30, 2020
Net Sales $ 834,972 $ 2,444,667 $ - $ - $ 834,972 $ 2,444,667
Cost of Goods Sold 481,010 1,412,457 - - 481,010 1,412,457
Gross Profit 353,962 1,032,210 - - 353,962 1,032,210Gross Margin 42.4% 42.2% - - 42.4% 42.2%
Operating Expenses 242,751 748,519 242,751 748,519Operating Exp as % of Sales 29.1% 30.6% - - 29.1% 30.6%
Restructuring Costs 1,359 5,871 1,359 5,871 - -
Income from Operations 109,852 277,820 (1,359) (5,871) 111,211 283,691Operating Margin 13.2% 11.4% -0.2% -0.2% 13.3% 11.6%
Total Other Expense (5,838) (12,375) - - (5,838) (12,375)
Income before provision for income taxes 104,014 265,445 (1,359) (5,871) 105,373 271,316
Provision for income taxes 25,900 66,323 (338) (1,468) 26,238 67,791Net income 78,114 199,122 (1,021) (4,403) 79,135 203,525
Net income attributable to noncontrolling interest 411 501 - - 411 501Net income attributable to MSC Industrial $ 77,703 $ 198,621 $ (1,021) $ (4,403) $ 78,724 $ 203,024
Net income per common share:Diluted $ 1.40 $ 3.57 $ (0.02) $ (0.08) $ 1.42 $ 3.65
1The thirteen and thirty-nine weeks ended May 30, 2020 include only restructuring costs. Items of note excluded from the current period results, including inventory write-downs, an impairment loss (loss recovery) and associated legal costs, did not occur in the prior year periods.
30
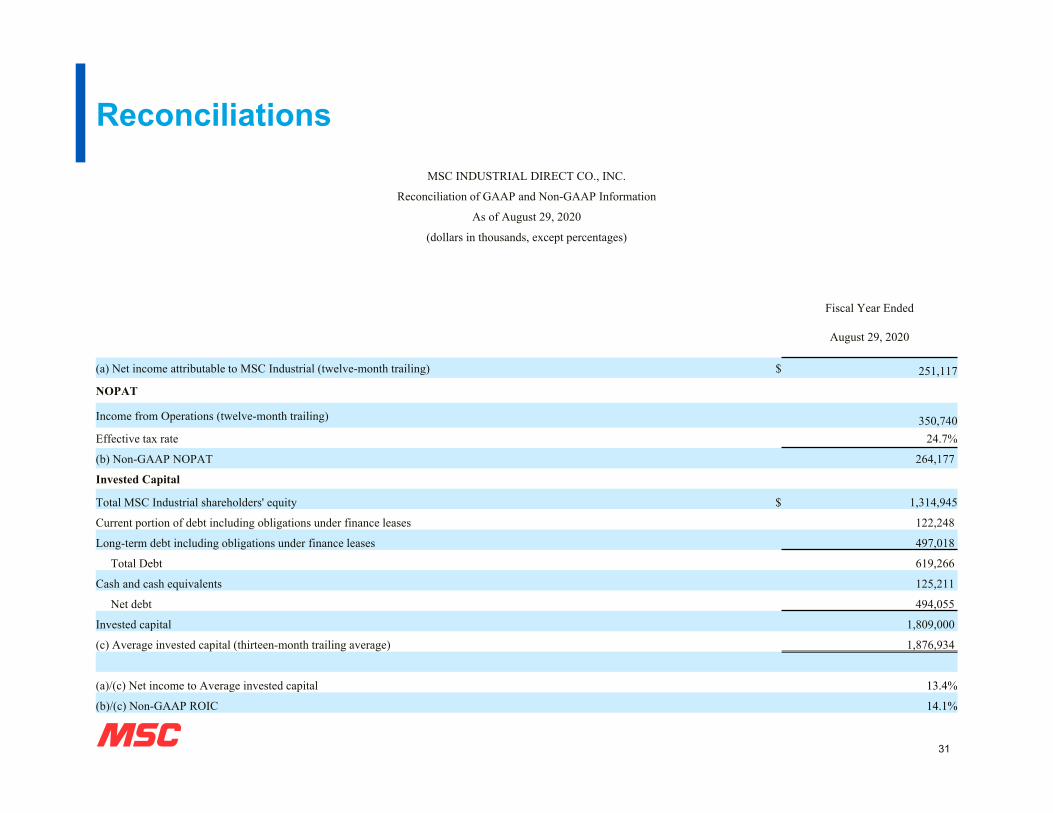
Reconciliations MSC INDUSTRIAL DIRECT CO., INC.
Reconciliation of GAAP and Non-GAAP Information
As of August 29, 2020
(dollars in thousands, except percentages)
Fiscal Year Ended
August 29, 2020
(a) Net income attributable to MSC Industrial (twelve-month trailing) $ 251,117
NOPAT
Income from Operations (twelve-month trailing) 350,740Effective tax rate 24.7%
(b) Non-GAAP NOPAT 264,177
Invested Capital
Total MSC Industrial shareholders' equity $ 1,314,945
Current portion of debt including obligations under finance leases 122,248
Long-term debt including obligations under finance leases 497,018
Total Debt 619,266
Cash and cash equivalents 125,211
Net debt 494,055
Invested capital 1,809,000
(c) Average invested capital (thirteen-month trailing average) 1,876,934
(a)/(c) Net income to Average invested capital 13.4%
(b)/(c) Non-GAAP ROIC 14.1%
31