
MS Word template for A4 size paperhanoch/Papers/Armon_Levy_CSDS... · Web viewThus, using the...
37
Cache Satellite Distribution Systems: Modeling, Analysis and Efficient Operation Aner Armon Hanoch Levy School of Computer Science Tel Aviv University Tel Aviv, Israel Abstract—Web caches have become an integral component contributing to the improvement of the performance observed by Web clients. Cache Satellite Distribution Systems (CSDS) have emerged as a technology for feeding the caches with the information clients are expected to request, ahead of time. In such a system the participating proxies periodically report to a central station about requests received from their clients. The central station selects a collection of Web documents, which are "pushed" via a satellite broadcast to the participating proxies, so that upon a future local request for the documents, they will already reside in the local cache, and will not need to be fetched from the terrestrial network. In this paper * we aim at addressing the issues of how to operate the CSDS, how to design it, and how to estimate its effect. Questions of interest are 1) What Web documents should be transmitted by the central station, and 2) What is the benefit of adding a particular proxy into a CSDS. We offer a model for CSDS that accounts for the request streams addressed to the proxies and which captures the intricate interaction between the proxy caches. Unlike models that are based only on the access frequency of the various documents, this model captures both their frequency and their locality of reference. We provide an analysis that is based on the stochastic properties of the traffic streams that can be derived from HTTP logs, examine it on real traffic, and demonstrate its applicability in selecting a set of proxies into a CSDS. Keywords—Communication system planning; Communication system performance; Internet; Modeling; Queuing analysis; Satellite applications; Satellite broadcasting; System analysis and design. I. INTRODUCTION Web caches have become an integral component contributing to the improvement of the performance observed by Web clients. Cache Distribution Satellite Systems (CSDS) and Content Distribution Networks (CDN) have emerged as technologies for feeding the caches with the information clients are expected to request, ahead of time. A typical Cache Satellite Distribution System (CSDS), of which a schematic drawing is given in Fig. 1, * This research was supported in part by MAGNET, Chief Scientist Office, Ministry of Trade and Commerce, Israel. Partial results of this paper were presented in the IEEE INFOCOM’03 conference. Real data logs were taken from www.ircache.net (in reference to the National Science Foundation (grants NCR-9616602 and NCR-9521745), and the National Laboratory for Applied Network Research). 1
Transcript of MS Word template for A4 size paperhanoch/Papers/Armon_Levy_CSDS... · Web viewThus, using the...
Cache Satellite Distribution Systems:Modeling, Analysis and Efficient Operation
Aner Armon Hanoch LevySchool of Computer Science
Tel Aviv UniversityTel Aviv, Israel
Abstract—Web caches have become an integral component contributing to the improvement of the performance observed by Web clients. Cache Satellite Distribution Systems (CSDS) have emerged as a technology for feeding the caches with the information clients are expected to request, ahead of time. In such a system the participating proxies periodically report to a central station about requests received from their clients. The central station selects a collection of Web documents, which are "pushed" via a satellite broadcast to the participating proxies, so that upon a future local request for the documents, they will already reside in the local cache, and will not need to be fetched from the terrestrial network.
In this paper* we aim at addressing the issues of how to operate the CSDS, how to design it, and how to estimate its effect. Questions of interest are 1) What Web documents should be transmitted by the central station, and 2) What is the benefit of adding a particular proxy into a CSDS. We offer a model for CSDS that accounts for the request streams addressed to the proxies and which captures the intricate interaction between the proxy caches. Unlike models that are based only on the access frequency of the various documents, this model captures both their frequency and their locality of reference. We provide an analysis that is based on the stochastic properties of the traffic streams that can be derived from HTTP logs, examine it on real traffic, and demonstrate its applicability in selecting a set of proxies into a CSDS.
Keywords—Communication system planning; Communication system performance; Internet; Modeling; Queuing analysis; Satellite applications; Satellite broadcasting; System analysis and design.
I. INTRODUCTION
Web caches have become an integral component contributing to the improvement of the
performance observed by Web clients. Cache Distribution Satellite Systems (CSDS) and Content
Distribution Networks (CDN) have emerged as technologies for feeding the caches with the
information clients are expected to request, ahead of time. A typical Cache Satellite Distribution
System (CSDS), of which a schematic drawing is given in Fig. 1, consists of a set P of proxy
caches, and one central station. The proxies participating in the CSDS periodically report to the
central station about the requests they are receiving from their local clients. The central station
processes this information and uses it to predict what documents will be desired by other proxy
caches in the system in the near future. The central station then selects a collection of Web
documents, which it retrieves, usually from the terrestrial network1, and then "pushes" these
documents via a satellite broadcast link to all, or some, of the participating proxies. The result is
* This research was supported in part by MAGNET, Chief Scientist Office, Ministry of Trade and Commerce, Israel. Partial results of this paper were presented in the IEEE INFOCOM’03 conference. Real data logs were taken from www.ircache.net (in reference to the National Science Foundation (grants NCR-9616602 and NCR-9521745), and the National Laboratory for Applied Network Research).
1 Although satellite retrieval does not affect the analysis.1

that upon such request, the documents will reside in the local cache, and will not need to be
fetched using the local terrestrial network.
The advantage of broadcasting a document over CSDS is that once the document is requested
at any participating proxy, the document is available in all caches. Thus, the user delay is
reduced and the bandwidth cost is saved (assuming that the cost of broadcasting a document to K
destinations is cheaper than to retrieve it on the terrestrial network K times). Nonetheless, such
benefits do depend on whether the document will indeed be needed at the receiving proxy. In the
case that the document is not needed, no benefit is gained. In fact, some damage may be caused,
since the unwanted document "contaminates" the cache by pushing all documents residing in the
cache, and potentially causing another document (that may be needed by the proxy) to be
removed from the cache. Thus, broadcasting a document over CSDS is not always beneficial.
In a similar manner, the benefit for a proxy from participating in a CSDS may vary,
depending on the mutual properties of the participating proxies. To demonstrate this, consider
two proxies, A and B, which consider sharing a CSDS. If the proxies have interest in similar
documents then it is likely that they will mutually benefit from a CSDS. For example, such
mutual benefit is expected from two proxies of commercial ISP's in the same country. On the
other hand, consider proxies A and B located in two different countries whose audience is
interested mainly in their native language documents. In this case the documents requested by
the proxies are highly disjoint, and the use of a CSDS will only cause the two proxies to
"contaminate " each other.
The aim of this paper is to devise an analytic tool that can be used in the design decisions
involved in the operations of a CSDS. These include issues such as the selection of classes of
Web documents for broadcast in the system and the selection of proxies to participate in the
system. To this end, one must take into consideration the properties of the various proxies and
the properties of the traffic streams2 they are exposed to and to use this data to analyze the
system. Two properties are inherent to streams directed at Web caches (as to other caches as
well). These are the relative request frequencies of the various documents (some documents are
2 Where a stream is a set of web document requests sharing some commonality.2

accessed more frequently and some are less) and the locality of reference (a document that was
requested recently is more likely to be requested again). Unfortunately, accounting for both
properties is difficult and most common models do not account for both.
We propose a stochastic model that accounts for both properties of the request streams
directed to a proxy. The statistics of these properties can be derived from the HTTP log of the
proxy. The model uses these properties to predict the hit ratio, which is the fraction of the
requests made to the cache and which result with the requested document found at the cache.
Thus, using the analysis one can evaluate system performance under various conditions.
The model accounts for the intricate interaction of the different streams at the different caches
and makes use of two document request distributions, associated with each stream: The stack
depth distribution, and the request count distribution. The stack depth distribution has been used
successfully to model the behavior of cache systems (see, e.g., [7]), and in [11] and [12] it was
used to model and analyze the interaction of database caches. The request count distribution
helps us to estimate the potential gain of sharing the first miss of every document, among all
participating proxies.
Our analysis yields a set of recursive equations whose computation complexity is ,
where K is the cache size, and is a modeling parameter that can be chosen to be quite small
as to make the computation very efficient. The results of the analysis provide expressions for the
improvement in the cache hit-ratio in each of the participating proxies, as function of the
document classes (or streams) broadcast to participating proxies. Thus, the analysis can be used
for selecting the more effective streams to be broadcast, as well as for assessing the value of
joining a proxy into a CSDS.
The analysis is supported by numerical results in which we examine the predictions of the
analysis by comparing it to simulation. We observe good agreement between the simulation and
the analysis especially in predicting the relative effect of different streams or different proxies on
the performance. As such, the analysis fits well in operational rules and system design assistance.
3

We further demonstrate how the model can be used in designing a CSDS. In this context we
use the model to predict which proxies it is mostly beneficial (in terms of maximizing the hit rate
gain) to add into a CSDS. We use simulation results conducted on real data to examine the
quality of this prediction and find the prediction to be very good.
The structure of the rest of this paper is as follows: In Section II we provide the model and the
analysis approach. In Section III we provide the analysis of the system. In Section IV we discuss
how the results can be used for devising operation rules and designing the system. Numerical
results are provided in Section V. Section VI provides experimental results, based on real data,
for the proxy assignment problem. Finally, Section VII summarizes the paper and its results.
A. Related work
Cache modeling and analysis received attention in the past in the context of operating systems
and databases. For example, see Coffman and Denning [7]. In the context of databases, Levy and
Morris [11][12] proposed a model and analysis for evaluating the interaction of various traffic
streams in a cache system. A similar cache modeling is addressed in Brehob and Enbody [4].
Recently, cache modeling on the World Wide Web received attention as well. For example,
Breslau et al. [5] tested the sufficiency of using Zipf distribution to describe behavior of web
proxies. They provided a comparison to experimental observations, and proposed some cache
replacement algorithms. Some attention was also given to properties of different request types on
the web, e.g. Almeida et al. [2], that provided classification and interpretation of specific proxy
logs, based on geographical characterization.
The work on the modeling and analysis of Cache Satellite Distribution Systems has been quite
limited. Rodriguez and Biersack [13] provided an analysis of the performance of Cache Satellite
Distribution Systems, but without accounting for modeling aspects of the cache capacity, the
inter-relation between the document requests and their inter-reference, and the effects of the
different streams on the cache performance. Hu et al. [9], provided an analytic model based on
Poisson distributed request rate, and a suggestion of client filtering policy in a cache satellite
distribution system based on web servers visited in previous days. Chang [6] formalized the
Cache Satellite Distribution problem as an optimization problem, based on the assumption that 4

documents are distributed according to the Zipf distribution; that paper does not account for the
inter-reference of document requests as well.
Several references focused on the problem of the selection of documents to be broadcast,
based on very detailed information dynamically sent to the central station from the proxies
regarding their needs of specifically identified documents. Such scheduling problems apply for
satellite broadcast (e.g. Cohen et al. [8], Askoy et al. [3]) and for other applications (e.g. Acharya
and Muthukrishnan [1], Sharaf and Chrysanthis [14]). These may require a significant amount of
data sent from the proxies to the central server, and just like all other studies mentioned above,
they do not deal with the system design issues that are being handled in this paper.
II. GENERAL MODEL AND ANALYSIS APPROACH
A. System modeling and analysis approach
A Cache Satellite Distribution System can be modeled as follows: Each cache is subject to a
stream of local document requests, originated by the end users of the proxy. Upon receiving a
local request, the proxy will examine whether the requested document is in the cache, in which
case it will return the requested document to the user. If the requested document is not in the
cache, the proxy will retrieve it from the terrestrial network, and will announce the central station
that the document was requested and was not found. The central station then will decide
(typically by identifying the document as a part of some stream, defined herein) whether to
retrieve the document from the terrestrial network and to broadcast it to all the participating
proxies via the satellite link. Upon receiving a document from the satellite link, a proxy may
select to either save it in its cache or to discard it.
Remark 1: The notion that not all participating proxies must accept all broadcast documents
and put them in their cache, can actually split the set of recipient proxies of the satellite broadcast
to several subsets, by common proxy interests. We will model this behavior by defining subsets
of proxies, each sharing interest in similar document classes, i.e. only a portion of each document
class, originating at each subset, is being broadcast. Most of our analysis focuses on a single
subset, but is constructed in a way that can handle multiple proxy subsets.
5

Our aim in the analysis is to examine how the broadcast of a document or a class of documents
(e.g. all the documents of xyz.com) will affect the performance of the individual caches. This
analysis is to be carried as function of the parameters of the document class, as to assist us in the
decision of which documents (or classes of documents) should be broadcast and which not. We
assume that the system designer is equipped with the HTTP logs of the proxies (these are
commonly available), and that the statistical data available in the logs can be used by the analysis
to predict the relative benefit (or damage) of broadcasting a class. This benefit will be used to
decide which classes of documents to broadcast, and which proxies to join to the system.
Two models that were used to analyze cache systems are the Inter-reference model (IRM) and
the Stack Reference Model (SRM). Their advantage is in capturing both the locality of reference
of the requests, and their relative frequencies, which are both important properties for cache
modeling. In contrast, other models, such as the common used Zipf model (see, e.g. [5]), capture
only one of these properties. SRM has been used successfully in [11] and [12] to model the
interaction between various caches. More specifically, it was used to examine the performance
resulting from merging several disjoint streams into one cache. Due to the interaction between
the caches in CSDS, it is appealing to attempt modeling CSDS by the SRM model. That
approach however, seems to be hard to apply since the interaction between the streams in CSDS
is much more complicated than in the problem addressed in [11] and [12]. This is true since this
problem includes interaction of streams that are not mutually exclusive, and it also includes
cross-cache effects.
To overcome the complexity of the problem, we decompose the problem and its analysis to
two parts, in each of which using suitable modeling tools to focus on capturing the major factors.
The approach is as follows: Consider a document R that is broadcast by the central station to
cache-proxy , which stores it in the cache. The storing of R in affects the performance of
in two aspects: a) It affects the hit ratio of future requests to R. This effect is non-negative
(that is the hit ratio of these requests may only go up due to the storage of R). b) It affects the hit
ratio of future requests to documents other than R. This effect is non-positive since the presence
of R in may push the other documents out of the cache and decrease their hit-ratio.
6
We will focus on the change in performance of due to the broadcast, that is, how the hit
ratio changes due to the broadcast operation. As was previously hinted, we decompose our
analysis to two cases:
1. In the first case we deal with the situation at which there is at least one request to R by .
This is either the request that triggered the broadcast of R, or a later request. Let denote
the broadcast-triggering event, and let denote the event of the first request to R by (
and may coincide). At this case the change in performance due to the broadcast of R
(and its storage by ) is two-fold:
a. A non-negative effect on the hit ratio of requests to R (these are the requests to R
happening after ).
b. A non-positive effect on requests to documents other than R. A more precise
examination shows that this effect is limited to the period between the events and .
This limitation applies, since after the epoch at which occurs, R is present in
regardless of the broadcast operation , and thus the change in performance, due to
, past the epoch of , is zero.
2. In the second case we deal with the situation at which there is no request to R by . In this
case, the broadcast does not affect the hit ratio for requests to R. However, the broadcast
does affect (non-positively) the hit ratio of documents other than R, since R now
"contaminates" .
In our analysis, we will neglect the effects on performance of Case b above, due to its limited
scope (which makes it negligible compared to the other effects). Our analysis will therefore
focus on the above Case a (Section below) and Case 2 (Section below). The reason the effect of
Case b is so minor, is because we assume that the probability of R to be accessed locally is much
higher than the probability the document it replaced in the cache will be requested. The reason
for this assumption to hold, is because of the inherent property of every stream (that a model
such as SRM captures so naturally), that a page that was just requested has a much higher
probability to be requested again, than a page that was not requested for a long time (so it is
7

thrown out of the cache). The assumption of negligibility of Case b tends to be less accurate, of
course, if the cache of is very small compared to its local stack depth distribution, or the rate
of R’s class is much smaller than the rate of the class of the page that was thrown out.
B. Document Request Modeling and Model Notation
We consider a set P of proxy caches .. . Considering the entire incoming requests set for
all proxies, we assume that we can classify this request set as a set S of disjoint streams, whereas
each stream represents all requests for a class of documents, i.e. a collection of documents
that share some commonality. For example, a stream may represent all requests to all web pages
of xyz.com, or alternatively, only to the home page of abc.com. Intuitively speaking, one would
tend to break large web sites (e.g. Yahoo.com) into multiple streams (e.g. based on the site’s
directory structure), and join very small sites into a single stream.
We further assume that each stream s is associated with a random variable denoting the
request count, which is the number of requests that are made for a specific document , from
the whole set P, until document R expires. Such expiration may represent document refresh,
document removal from its hosting Web server or expiration of the document at all proxy caches.
In all cases the implication is that after the document is requested times it may never be
requested again or will be considered new and will have to be read again by at least one of the
proxy caches. Let the request count distribution, which is the distribution of , be denoted as
. We further assume that the association of a request with a specific proxy
is given by a Bernoulli process, that is the probability that an arbitrary request of stream s
originates at proxy is given by , where . To clarify the last definition, note
that determines only the distribution among different streams and proxies, while the actual
document within the stream is selected according to the stream’s distribution.
Since we want to construct our model in a way that can handle multiple proxy groups (see
Remark 1 above), we will assume only a subset of proxies needs to participate in the
CSDS. Let denote the probability that a request of stream s originates at P’.
8
We assume that the association of a request with a specific stream , is also given by a
Bernoulli process. For the clarity of presentation, we can define the combined ratio , which is
the probability that an arbitrary request originates at stream s and at proxy . We can further
widen the definition to stand for any subset of streams, and/or for any subset of proxies,
yielding , , and .
Remark 2: Note that we will never use any as a stand alone value, but only as ratios of ’s
– so that can be represented in any units – requests per time unit, requests per log length, etc.
To demonstrate, we can use for an alternative definition of , as , and we can
immediately see that the previous summation, , still holds.
Remark 3: More detailed modeling of the
Stack Reference Model, which is specific to Section below, is given within that section.
III.ANALYSIS
A. The effect of broadcasting document R on the performance of requests to R
In this section, we aim at evaluating the potential performance improvement resulting from
broadcasting stream s to a subset of proxies . We will consider a tagged document ,
whose number of requests is given by the random variable , as noted in Section B. In addition
to the modeling assumptions given in Section II, we further assume that all proxies has large
enough caches to hold the document from the first request until the last local request to the proxy
is made. This assumption is reasonable for capturing the behavior of document R.
Consider first a system without CSDS. Under this system, for every document under every
proxy, the first request for the document will result with a cache miss (since the document is not
in the cache yet). All later requests from that proxy to that document will result with a hit since
the document will be present in the cache. Focusing on cache and conditioning on , the
probability that will experience a (single) miss on the tagged document R is given by the
probability that out of the n requests made to R, it will be requested at least once at :
(1)
9

where .
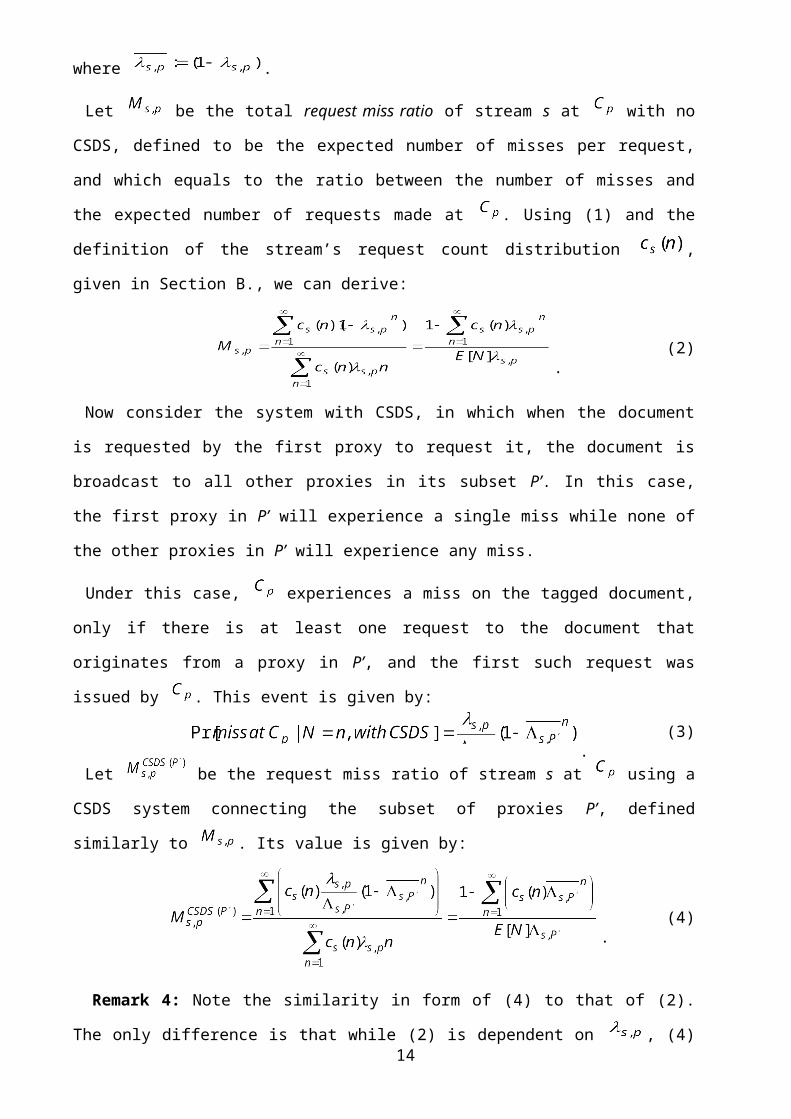
Let be the total request miss ratio of stream s at with no CSDS, defined to be the
expected number of misses per request, and which equals to the ratio between the number of
misses and the expected number of requests made at . Using (1) and the definition of the
stream’s request count distribution , given in Section B, we can derive:
.(2)
Now consider the system with CSDS, in which when the document is requested by the first
proxy to request it, the document is broadcast to all other proxies in its subset P’. In this case, the
first proxy in P’ will experience a single miss while none of the other proxies in P’ will
experience any miss.
Under this case, experiences a miss on the tagged document, only if there is at least one
request to the document that originates from a proxy in P’, and the first such request was issued
by . This event is given by:
.(3)
Let be the request miss ratio of stream s at using a CSDS system connecting the
subset of proxies P’, defined similarly to . Its value is given by:
.(4)
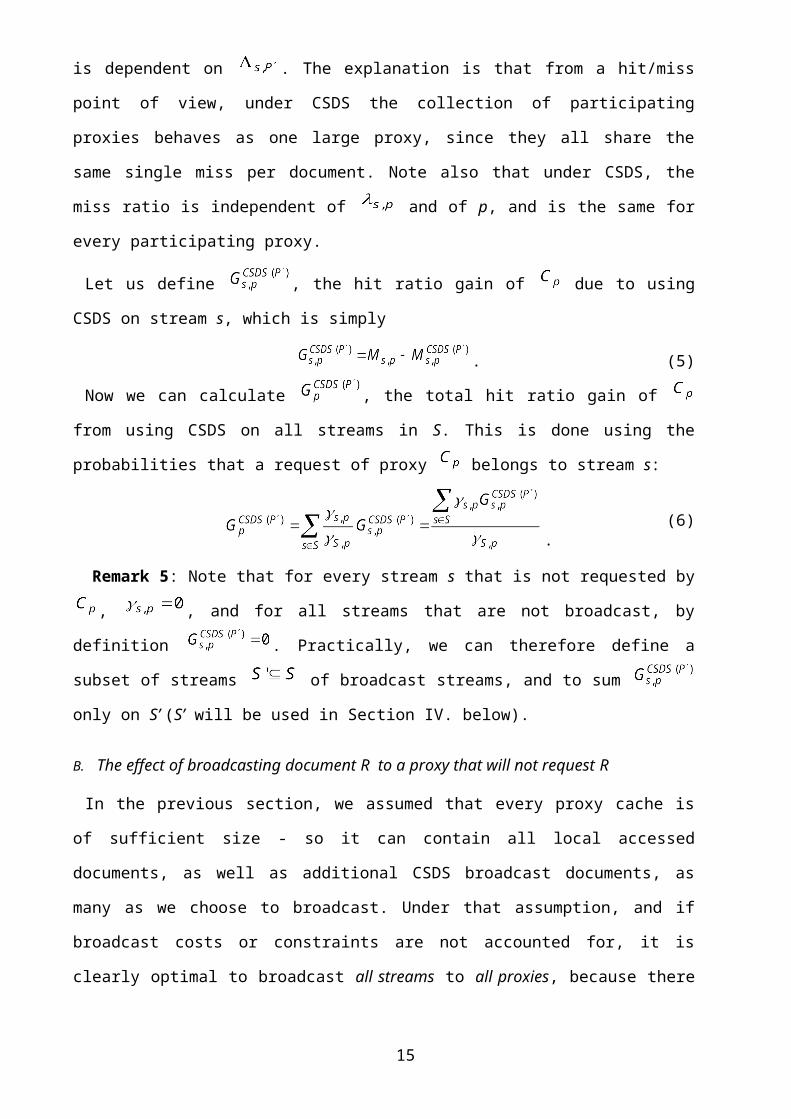
Remark 4: Note the similarity in form of (4) to that of (2). The only difference is that while
(2) is dependent on , (4) is dependent on . The explanation is that from a hit/miss point
of view, under CSDS the collection of participating proxies behaves as one large proxy, since
they all share the same single miss per document. Note also that under CSDS, the miss ratio is
independent of and of p, and is the same for every participating proxy.
Let us define , the hit ratio gain of due to using CSDS on stream s, which is
simply
10
. (5)
Now we can calculate , the total hit ratio gain of from using CSDS on all streams
in S. This is done using the probabilities that a request of proxy belongs to stream s:
.(6)
Remark 5: Note that for every stream s that is not requested by , , and for all
streams that are not broadcast, by definition . Practically, we can therefore define a
subset of streams of broadcast streams, and to sum only on S’ (S’ will be used in
Section IV below).
B. The effect of broadcasting document R to a proxy that will not request R
In the previous section, we assumed that every proxy cache is of sufficient size - so it can
contain all local accessed documents, as well as additional CSDS broadcast documents, as many
as we choose to broadcast. Under that assumption, and if broadcast costs or constraints are not
accounted for, it is clearly optimal to broadcast all streams to all proxies, because there is no
constraint on the proxy cache capacity, nor on the broadcast capacity.
To properly model the negative effects of document R on other documents, one needs to model
a limited capacity proxy cache. In this more realistic situation the broadcast of an un-needed
document may have adverse effects, since it may occupy space in the cache and preclude more
needed documents from the cache. Thus, the modeling of a finite size cache should allow one to
account for the negative effects of a broadcast document. These effects can be termed as "cache
contamination", namely a document that is kept in the cache while it is not needed can be
considered to contaminate the cache. Wrong broadcast policy (e.g., one that broadcasts
"everything") may contaminate the cache to a high degree, thus preventing it from serving the
locally wanted documents.
Using the same definitions of Stream s and Proxy cache as in Section B, a broadcast
document from stream s is called a waste document in cache , if it will not have any request
directed to it at . For a given proxy , and a document whose number of requests is N,
11

the document is a waste at if it has at least one request by P’ and no request by . The
probability of this event is given by:
.(7)
Now, using the same definition of Distribution as in Section B, we can calculate the
fraction of documents in s, which end up being a waste at :
.(8)
In a similar manner to what we did in (1)-(2), let be the total request waste ratio of
stream s at proxy , defined to be the ratio between the expected number of waste documents
and the expected number of requests for document of stream s. Using . (8), we can derive:
.(9)
Since the different broadcast streams are disjoint, and each broadcast document is different, we
can simply total the waste for all incoming streams, after normalizing it by the relative stream
rate . Thus, we get
.(10)
To end our definitions, we will further define the proxy's total request ratio .
To model the interaction of the waste streams with the other streams on the cache assume that
the streams are having stack depth distributions. When a stream is said to have a stack depth
distribution it means that when the stream is applied to a LRU-managed cache, the probability
that the current reference finds the element that it references at depth n (n=1 is the most recently
used element in the cache) is d(n). Given the above distribution we can define the corresponding
cumulative distribution , which is actually the stream hit ratio for cache size k,
i.e. the probability that the element will be found at depth smaller or equal to k. Note that d(n) is
a ``defective'' distribution in that it may not sum to unity: elements that have never previously
been accessed will be assumed to be found at an infinite stack depth.
12

We will assume that each of the streams (the waste stream and the stream consisting of the
other requests) obey the Stack Reference Model (SRM), that is, they are stochastic processes
which choose their next reference according to independent samplings of the stack depth
distribution. Such processes are called stack depth processes, and their hit ratio curves as a
function of cache size coincide with their cumulative stack depth distributions. This is one of
several simple models for reference streams (used, e.g., in [4]), and it has been reported, for
example in [7], [11], and [12], that this model tends to be quite successful in capturing temporal
locality of references within a trace, and is superior to the so called Independent Reference
Model (IRM).
Given the stack depth distribution of proxy , , and the corresponding cumulative
distribution , we will calculate the effect of the waste stream on the stack depth
distribution. To this end, we will use a methodology similar to the one developed in [11], [12]
and we will track an arbitrary tagged locally requested document R through its journey through
the local cache at which both the local documents and the waste documents accumulate. This
will allow us to derive the distribution of total depth (consisting of local and waste pages) at
which R is requested, which will form the depth distribution of the combined cache. To clarify,
note that under SRM the identities of individual documents within a stream are not modeled. R
serves as an anonymous document that we track only along its journey over the cache.
Let denote the number of local documents (non-waste documents) residing "above" (that is,
at a lower depth) R in the cache, and let denote the number of waste documents residing
above R in the cache. Then, at any time in the journey, the position of R in the cache is described
by the state . To track the behavior of this cache we will focus only on the events where
there is access to this cache, either by the waste documents or by the local requests. The
probabilities that an event is a waste document arrival or a local access are given by
and , respectively.
Since these probabilities are fixed and do not depend on the other events, the state is
sufficient to predict the future of R. To track the behavior of R in the cache, recall that the cache
operates under the LRU policy. This means that when any document R’ is requested, the
13
document is placed at the top position (whose depth is 1) of the cache. This causes all the
documents which have been prior to the operation above R’ to be pushed one position downward
(deeper). In the event that R’ was not in the cache prior to the request, this should cause the
deepest document in the cache to be pushed out.
Now, to track the journey of the tagged document R along the cache, assume that R is in state
just after the i-th request (“time i”) and examine the transition of R due to the i+1st
request. R will encounter one of the following events:
1. R remains at . This occurs if a request is made for a local document of depth smaller
than or equal to . Thus, the probability of this event is given by .
2. R moves to . This occurs if a request is made for a local document of depth
greater than . Thus, the probability of this event is given by .
3. R moves to . This occurs if a request is made for any waste document. Thus, the
probability of this event is given by .
4. R finishes its journey. This occurs if a request is made for a local document of depth .
Thus, the probability of this event is given by .
The list of the states to which R moves given that it leaves , and the corresponding
transition probabilities, are (Note that the probabilities below are independent of ):
1. R moves to . The probability of this event is .
2. R moves to . The probability of this event is .
3. R finishes its journey. The probability of this event is .
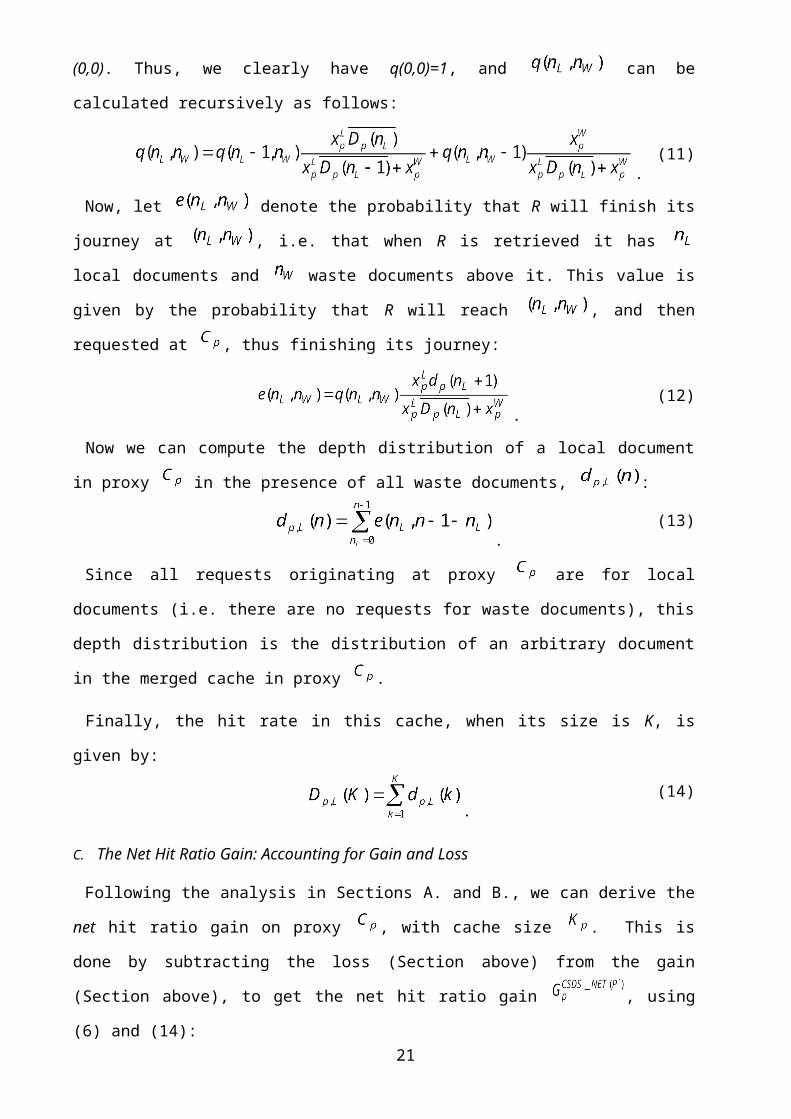
Now let denote the probability that R will eventually reach the state in its
journey, assuming that the journey starts at the top of the stack, that is defined as state (0,0).
Thus, we clearly have q(0,0)=1, and can be calculated recursively as follows:
.(11)
14
Now, let denote the probability that R will finish its journey at , i.e. that
when R is retrieved it has local documents and waste documents above it. This value is
given by the probability that R will reach , and then requested at , thus finishing its
journey:
.(12)
Now we can compute the depth distribution of a local document in proxy in the presence of
all waste documents, :
.(13)
Since all requests originating at proxy are for local documents (i.e. there are no requests for
waste documents), this depth distribution is the distribution of an arbitrary document in the
merged cache in proxy .
Finally, the hit rate in this cache, when its size is K, is given by:
.(14)
C. The Net Hit Ratio Gain: Accounting for Gain and Loss
Following the analysis in Sections A and B, we can derive the net hit ratio gain on proxy ,
with cache size . This is done by subtracting the loss (Section above) from the gain (Section
above), to get the net hit ratio gain , using (6) and (14):
. (15)
Finally, let us define , as the total hit ratio gain over all proxies . Just like in
deriving (6), we need to take caution in selecting the normalizing factor, which is now , i.e.
the probability that an arbitrary request originated at proxy , given it originated at
one of the proxies participating in CSDS. Thus, we get:
.(16)
15

D. Computational complexity
Equations (11)-(14) can be computed in a recursive manner (starting from the low indices and
going upwards). Thus, the computation complexity per proxy is where J is the number of
entries in the stack depth distribution. In a straightforward approach, one would take J to be the
cache size (K), in which case the complexity is . However, if one is interested in reducing
the complexity, one can represent the distribution by values, where . In this case the
complexity is . Proper selection of (small value) can lead to a drastic reduction in the
complexity without significantly affecting the accuracy.
IV.OPERATIONAL RULES AND EFFICIENT DESIGN
The model and analysis provided in this paper form a tool that can be used in the design and
operations of a CSDS. An important question that needs to be addressed by the operator of the
CSDS is the stream assignment problem, i.e. which classes (or streams) of documents should be
broadcast in the system. Intuitively, it is expected that the operator should decide to broadcast
classes of documents of “common interest” to the various proxies. The results provided in this
analysis, namely in (15), represent the net hit gain on due to broadcasting a set S’ of streams
(as introduced in Remark 5 above). Thus, to answer the question of which streams to broadcast
the operator can compute (15) for various sets of streams, and derive the relative benefits to the
systems as the result of broadcasting alternative sets of streams. For example, suppose that set S’
is broadcast, and the operator would like to extend the set to where s could be any of J
alternative streams . The operator can then evaluate (15) for , and use
it to rank the streams ,i=1,…,J, and to decide which of them will be broadcast. Having selected
the stream , a new set is now formed, . The process may now repeat on how to extend
.
Another important design question is the proxy assignment problem, i.e. which proxies should
participate in a system. A simpler question can be whether to add a proxy to an existing
system where the participating proxies are the set P’. The value of adding to the system can
again be evaluated by applying (15) to the set P’ and to the set .
16

These questions and other relevant questions, and a more detailed analysis of them, are a topic
of current ongoing research. A greedy algorithm for the solution of the proxy assignment
problem is presented and tested in Section VI below.
V. NUMERICAL RESULTS
In this section we aim to examine the quality of the model and analysis. We will first describe
the system we generated, and then test our analytic models against simulations.
We consider a system composed of four proxy caches, receiving requests on five Zipf
distributed SRM streams. Any other distribution might be used3, but the Zipf distribution might
emulate real life the best. The relative request rate for each proxy and stream, used to generate
the matrix, is given in Table 1. Stream 1 is requested mainly (90%) by Proxy 1, and the rest
of the requests are divided uniformly across the rest of the proxies. Stream 2 is requested mainly
(80%) by Proxy 2, and the rest of the requests are divided uniformly across the rest of the
proxies. Streams 3 and 4 are divided uniformly across all proxies. Stream 5 is divided uniformly
across all proxies except Proxy 4. All streams have the same total request share, except for
Stream 4, whose request volume is 5 times lower than the volume of each of the other streams.
The results are generated as follows: We start by generating a simulative request log,
composed of 5,000,000 (five million) requests, based on the relative request rate matrix and the
global streams’ SRM stack depth distributions, classifying each request to arrive from a stream
and a proxy. Then we can simulate any broadcast scenario. In addition, we generate from the log
the request count distribution for every global stream, and the local stack depth
distribution for every proxy. The generated cumulative local stack depth distribution
(across all streams) for each proxy, which is equal to the local hit ratio of every proxy without
using CSDS, is given in Fig. 2. Now, for every broadcast scenario we need to run the analysis of
Section above and the simulation, and compare the total net gain for the given scenario.
First, we examine the effect of broadcasting each of the various streams on every proxy. We
consider a cache size of 4,000 documents4, which is on the order of the saturation point of our
3 We tested the system on various distributions, including handpicked distributions and geometric distributions, and received similar accuracy.4 We repeated the numerical tests for cache sizes of 400 and 40,000 (with proper caches and distributions) as well, and received similar accuracy.
17

distribution (the point at which increasing the cache size does not increase the local hit rate), and
run separate CSDS, each broadcasting one stream. The results are reported in Fig. 3. First, we
notice the good correlation between the analytic results and the simulation results, for the entire
test scenario. We observe that the most beneficial stream to broadcast is, as expected, the high-
volume, evenly distributed stream 3 (Fig. 3.3). We see a difference of its contribution for
different proxies, since its relative presence in proxy 3, is the highest. Observe (Fig. 3.5) that
stream 5 actually reduces the hit rate of proxy 4, because broadcasting it only contaminates
proxy 4’s cache, but does not contribute any hits. For the other proxies it contributes quite a lot,
because, again, it is distributed evenly across those proxies. Stream 1 is not distributed uniformly
(Fig. 3.1): Proxy 1 receives most requests, and thus it will broadcast a high amount of documents
to the other proxies. Now, if the receiving proxy has a low amount of other requests (like proxy
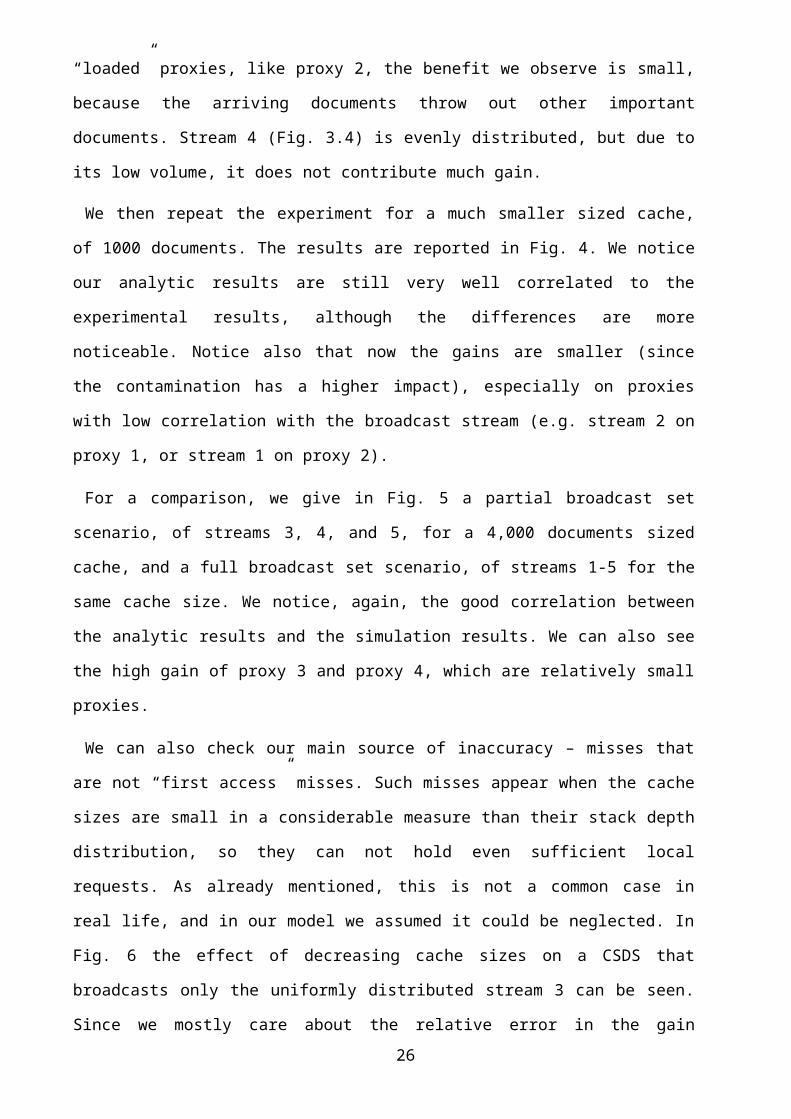
4), receiving stream 1 will not degrade the local hit rate by a substantial amount. For “loaded”
proxies, like proxy 2, the benefit we observe is small, because the arriving documents throw out
other important documents. Stream 4 (Fig. 3.4) is evenly distributed, but due to its low volume, it
does not contribute much gain.
We then repeat the experiment for a much smaller sized cache, of 1000 documents. The results
are reported in Fig. 4. We notice our analytic results are still very well correlated to the
experimental results, although the differences are more noticeable. Notice also that now the gains
are smaller (since the contamination has a higher impact), especially on proxies with low
correlation with the broadcast stream (e.g. stream 2 on proxy 1, or stream 1 on proxy 2).
For a comparison, we give in Fig. 5 a partial broadcast set scenario, of streams 3, 4, and 5, for a
4,000 documents sized cache, and a full broadcast set scenario, of streams 1-5 for the same cache
size. We notice, again, the good correlation between the analytic results and the simulation
results. We can also see the high gain of proxy 3 and proxy 4, which are relatively small proxies.
We can also check our main source of inaccuracy – misses that are not “first access” misses.
Such misses appear when the cache sizes are small in a considerable measure than their stack
depth distribution, so they can not hold even sufficient local requests. As already mentioned, this
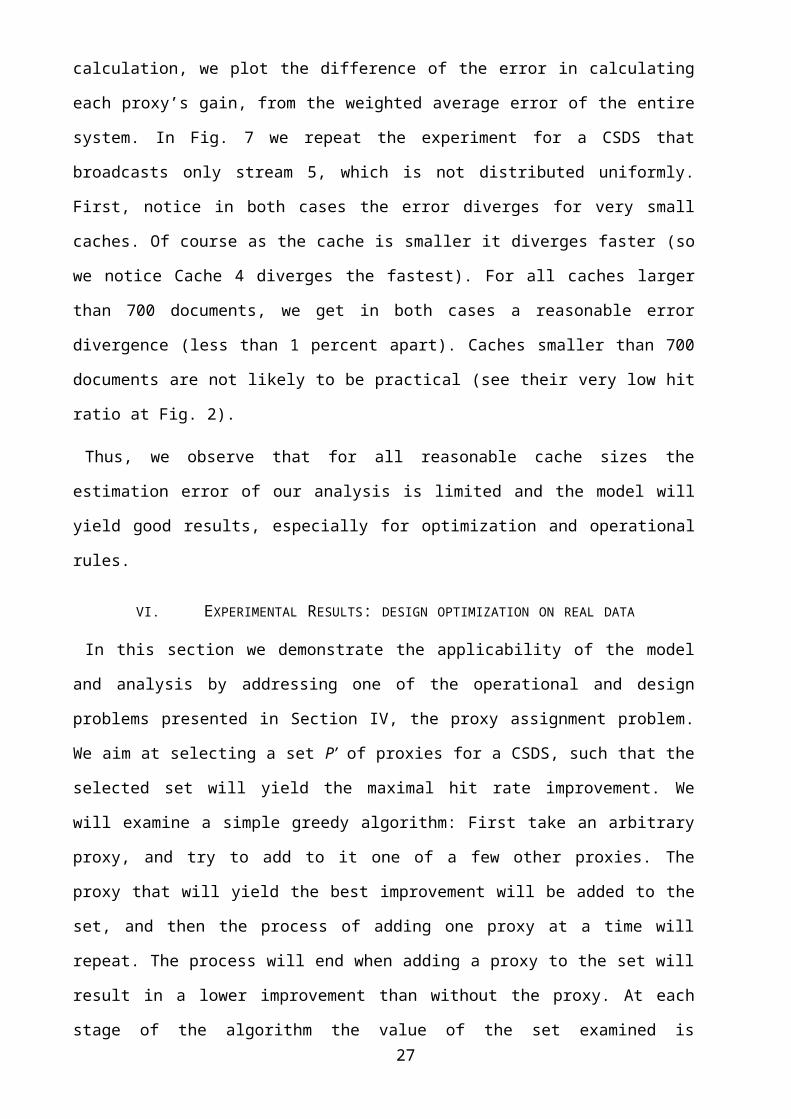
is not a common case in real life, and in our model we assumed it could be neglected. In Fig. 6
18

the effect of decreasing cache sizes on a CSDS that broadcasts only the uniformly distributed
stream 3 can be seen. Since we mostly care about the relative error in the gain calculation, we
plot the difference of the error in calculating each proxy’s gain, from the weighted average error
of the entire system. In Fig. 7 we repeat the experiment for a CSDS that broadcasts only stream
5, which is not distributed uniformly. First, notice in both cases the error diverges for very small
caches. Of course as the cache is smaller it diverges faster (so we notice Cache 4 diverges the
fastest). For all caches larger than 700 documents, we get in both cases a reasonable error
divergence (less than 1 percent apart). Caches smaller than 700 documents are not likely to be
practical (see their very low hit ratio at Fig. 2).
Thus, we observe that for all reasonable cache sizes the estimation error of our analysis is
limited and the model will yield good results, especially for optimization and operational rules.
VI.EXPERIMENTAL RESULTS: DESIGN OPTIMIZATION ON REAL DATA
In this section we demonstrate the applicability of the model and analysis by addressing one of
the operational and design problems presented in Section IV, the proxy assignment problem. We
aim at selecting a set P’ of proxies for a CSDS, such that the selected set will yield the maximal
hit rate improvement. We will examine a simple greedy algorithm: First take an arbitrary proxy,
and try to add to it one of a few other proxies. The proxy that will yield the best improvement
will be added to the set, and then the process of adding one proxy at a time will repeat. The
process will end when adding a proxy to the set will result in a lower improvement than without
the proxy. At each stage of the algorithm the value of the set examined is evaluated via the
analytic model and is used as the criterion that guides the algorithm. Once the wining set is
selected, we evaluate the quality of our analysis by comparing it to emulation results. We
emulate the performance of the various proxy sets on real data, taken from HTTP logs.
To conduct this analysis we use logs taken from ircache.net [10], which included over
2,700,000 requests. We use a simplistic stream selection heuristics, where we associate a stream
with each Website. Using the same method as for the synthetic log in Section V, we calculate the
19

local SRM for each of the proxies and the request count distribution for each of the streams, and
used it in our analytic model to predict the hit rate to be experienced by the various proxy sets.
Fig. 8 depicts the proxy sets examined by the algorithm, ordered from left to right, and their
corresponding hit rate gain. The greedy algorithm selects the broadcast group {1,2,7,6}. The
analytic model (driving the algorithm) indicates that either adding or removing proxies from this
set only degrade the gain.
Fig. 9 examines the quality of the algorithm by depicting the gain of the broadcast set {1,2,7,6}
and other alternative sets as derived via emulation on the actual logs. The gain is normalized to
the volume of requests of the chosen broadcast set to make the comparison meaningful. The
figure demonstrates that any modification to the selected set by either a single proxy addition, a
single proxy removal or a single proxy replacement end-up with lower gains. Thus the set
selected by the analytic model is indeed superior to other alternative sets.
The design of a generic efficient algorithm for proxy and stream selection into a CSDS is a
topic of an ongoing research.
VII. SUMMARY
In this work we dealt with the Cache Satellite Distribution System and aimed at providing a
framework for the analysis and efficient operation of this system. We proposed a model that
accounts for the intrinsic behavior of caches and request streams and which captures both the
locality of reference experienced in these streams and their relative frequencies. Using the model
we provided an analysis that predicts the hit ratio gain for each stream and each proxy as
function of the stream properties. We presented how these predictions, whose computational
complexity is relatively low, can be used directly in solving the operational and design questions.
Numerical examination versus simulation indicates that the analysis indeed captures the relative
effect of various streams on various proxies and thus will predict well the relative merits of
alternative operational rules.
REFERENCES[1] S. Acharya and S. Muthukrishnan, “Scheduling On-demand Broadcasts: New Metrics and Algorithms”, Proc. of the 4th Annual ACM/IEEE
International Conference on Mobile Computing and Networking (MobiCom'98), pp. 43-54, October 1998.
20
[2] V.F. Almeida, M.G. Cesario, R.C. Fonseca, W. Meira Jr., and C.D. Murta, "Analyzing the Behavior of a Proxy Server in Light of Regional and Cultural Issues", 3rd International WWW Caching Workshop, http://hermes.wwwcache.ja.net/events/workshop/21, June 1998.
[3] D. Askoy, M. Franklin, and S. Zodnik, “Data Staging for On-demand Broadcast”, Proc. of the 27’th VLDB Conference, pp. 571-580, September 2001.
[4] M. Brehob and R.J. Enbody, “An Analytic Model of Locality and Caching”, Technical Report MSU-CSE-99-31, Department of Computer Science, Michigan State University, http://www.cse.msu.edu/publications/tech/TR/MSU-CSE-99-31.pdf, August 1999.
[5] L. Breslau, P. Cao, L. Fan, G. Phillips, and S. Shenkar, "On the Implications of Zipf's Law for Web Caching", Proc. of IEEE Infocom’99, pp. 126-134, June 1998.
[6] S.-G. Chang, "Caching Strategy and Service Policy Optimization in a Cache-Satellite Distribution Service", Fifth INFORMS Telecommunications Conference, http://www.digital.re.kr/changsg/_private/changsg06.pdf, March 2000.
[7] E.G. Coffman and P.J. Denning, "Operating System Theory," Prentice-Hall, 1973.[8] R. Cohen, L. Kazir, and D. Raz, "Scheduling Algorithms for a Cache Pre-Filling Content Distribution Network", Infocom’02,
http://www.ieee-infocom.org/2002/papers/442.pdf, June 2002.
21

[9] X.-Y. Hu, P. Rodriguez, and E.W. Biersack, "Performance Study of Satellite-linked Web Caches and Filtering Policies", Networking 2000, pp. 580-595, May 2000.
[10] www.ircache.net, September 15th 2002.[11] H. Levy and R.J.T. Morris, "Exact Analysis of Bernoulli Superposition of Streams into a Least Recently Used Cache", IEEE
Trans. On Software Eng. 21:8, pp. 682-688, August 1995.[12] H. Levy and R.J.T. Morris, "Should Caches be Split or Combined? Analysis Using the Superposition of Bursty Stack Depth
Processes," Performance Evaluation, 27 & 28, pp. 175-188, 1996.[13] P. Rodriguez and E.W. Biersack, "Bringing the Web to the Network Edge: Large Caches and Satellite Distribution", Mobile
Networks and Applications, 7(1), pp. 67-78, January 2002.[14] M.A. Sharaf and P.K. Chrysanthis, “On-Demand Broadcast: New Challenges and Algorithms”, Proc. of the First Hellenic Data
Management Symposium, http://www.dbnet.ece.ntua.gr/HDMS02-proceedings/HDMS02_files/chrysanthis.pdf, July 2002.
22

LIST OF FIGURE CAPTIONS Figure 1: A schematic diagram of the system.
Figure 2: Calculated local stack depth distribution.
Figure 3: Simulative and analytic gain for a single stream broadcast, for cache size = 4,000 documents.
Figure 4: Simulative and analytic gain for a single stream broadcast, for cache size = 1,000 documents.
Figure 5: Simulative and analytic gain for multiple streams broadcast, for cache size = 4,000 documents.
Figure 6: Difference of Stream 3 per-proxy error ratio from the total error expected value.
Figure 7: Difference of Stream 5 per-proxy error ratio from the total error expected value.
Figure 8: Proxy allocation via the analytic model and the corresponding hit rate gains (real data).
Figure 9: Emulation results: Normalized hit rate gain of the selected set of Figure 8 and of its neighboring sets.
LIST OF TABLE CAPTIONS Table 1: The matrix of relative proxy & stream ratios.
23
AUTHOR BIOGRAPHIES AND PHOTOGRAPHS
BIOGRAPHY OF HANOCH LEVY
Hanoch Levy received the B.A degree in Computer Science with distinctions from the
Technion, Israel Institute of Technology in 1980 and the M.Sc and the Ph.D degrees in Computer
Science from University of California at Los Angeles, in 1982 and 1984, respectively.
From 1984 to 1987 he was a member of technical staff in the Department of Teletraffic
Theory at AT&T Bell Laboratories.
From 1987 he has been with the School of Computer Science, Tel-Aviv University, Tel-Aviv,
Israel. During the years 1992-1996 he has been at the School of Business and RUTCOR, Rutgers
University, New-Brunswick, NJ, on leave from Tel-Aviv University.
His interests include Computer Communications Networks, Wireless networks, Quality of
service in high-speed networks, Performance Evaluation of Computer Systems and Queueing
Theory.
BIOGRAPHY OF ANER ARMON
Aner Armon received his B.Sc. degree in Mathematics, Physics, and Computer Science from
the Hebrew University, Jerusalem in 1993, and is currently working toward his M.Sc. degree in
Computer Science in Tel-Aviv University.
Until 2001 he worked as a V.P. Derivatives Technology in the Laboratory for Computerized
Trading (LCT), Knight Financial Products (formerly Arbitrade), a subsidiary of Knight Trading
Group, New York.
From 2001 he is working in Cloverleaf Communications, a storage networking start-up.
24

25
Figure 1: A schematic diagram of the system
Figure 2: Calculated local stack depth distribution
00.050.10.150.2
0.250.30.350.4
0 2000 4000 6000
Depth (n)
Cum
ulat
ive
Dis
trib
utio
n (D
p(n)
) P roxy1P roxy2P roxy3P roxy4
26
Figure 4: Simulative and analytic gain for a single stream broadcast, for cache size = 1,000 documents
Figure 3: Simulative and analytic gain for a single stream broadcast, for cache size = 4,000 documents
Fig. 3.1:Stream1
0
5
10
15
20
25
1 2 3 4Proxy
Gai
n(Pe
rcen
t)
eval
simul
Fig. 3.2:Stream2
0
5
10
15
20
25
1 2 3 4Proxy
Gai
n(Pe
rcen
t)
eval
simul
Fig. 3.3:Stream3
0
5
10
15
20
25
1 2 3 4Proxy
Gai
n(Pe
rcen
t)
eval
simul
Fig. 3.4:stream4
0
5
10
15
20
25
1 2 3 4Proxy
Gai
n(Pe
rcen
t)
eval
simul
Fig. 3.5:Stream5
-5
0
5
10
15
20
25
1 2 3 4Proxy
Gai
n(Pe
rcen
t)
eval
simul
Fig. 4.1:Stream1
-5
0
5
10
15
20
25
1 2 3 4Proxy
Gai
n(Pe
rcen
t)
eval
simul
Fig. 4.2:Stream2
-5
0
5
10
15
20
25
1 2 3 4Proxy
Gai
n(Pe
rcen
t)
eval
simul
Fig. 4.3:Stream3
0
5
10
15
20
25
1 2 3 4Proxy
Gai
n(Pe
rcen
t)
eval
simul
Fig. 4.4:Stream4
0
5
10
15
20
25
1 2 3 4Proxy
Gai
n(Pe
rcen
t)
eval
simul
Fig. 4.5:Stream5
-5
0
5
10
15
20
25
1 2 3 4Proxy
Gai
n(Pe
rcen
t)
eval
simul
Proxy1 Proxy2 Proxy3 Proxy4 Total/St.
Stream1 900 33 33 34 1000
Stream2 66 800 67 67 1000
Stream3 250 250 250 250 1000
Stream4 50 50 50 50 200
Stream5 333 333 333 1 1000
Total/Pr 1599 1466 733 402 4200
27
3.87
1.080.440.99
2.221.84
2.66
1.39
2.36
4.264.59
3.08
1.66
2.6
4.68
3.74
2.62
3.51
0
1
2
3
4
5
12 13 14 15 16 17 123
124
125
126
127
127 3
127 4
127 5
127 6
127 63
127 64
127 65
Proxy Subset
Subs
et H
it Ra
te G
ain
(Per
cent
)
Figure 8: Proxy allocation via the analytic model and the corresponding hit rate gains (real data).
Figure 6: Difference of Stream 3 per-proxy error ratio from the total error expected value.
Figure 9: Emulation results: Normalized hit rate gain of the selected set of Figure 8 and of its neighboring sets.
Table 1: The matrix of relative proxy & stream ratios2.669
1.1421.42
0.941.209
2.714
1.041.116
2.44
1.953
-0.134
1.138
2.407 2.412
-0.5
0
0.5
1
1.5
2
2.5
3
12763
12764
12765
2376
1764
1263
1273
1274
1275
1276 176
276
126
127
Proxy Subset
Subs
et H
it Ra
te G
ain
(Per
cent
)
Figure 7: Difference of Stream 5 per-proxy error ratio from the total error expected value.
Streams345
0
5
10
1520
25
30
35
1 2 3 4Proxy
Gai
n(Pe
rcen
t)
eval
simul
Streams12345
0
5
10
1520
25
30
35
1 2 3 4Proxy
Gai
n(Pe
rcen
t)
eval
simul
Figure 5: Simulative and analytic gain for multiple streams broadcast, for cache size = 4,000 documents.
Stream 5
-2.5
-2
-1.5
-1
-0.5
0
0.5
1
1.5
2
0 2000 4000 6000 8000
Cache Size
Erro
r Div
erge
nce
(Per
cent
)Proxy1
Proxy2
Proxy3
Proxy4
Stream 3
-1
-0.5
0
0.5
1
1.5
2
2.5
3
3.5
0 2000 4000 6000 8000
Cache Size
Erro
r Div
erge
nce
(Per
cent
)
Proxy1
Proxy2
Proxy3
Proxy4