![MS Hiremath Ppt[1]](https://static.fdocuments.net/doc/165x107/54762ce1b4af9ffd628b458e/ms-hiremath-ppt1.jpg)
MS II UNIT MATERIAL MANAGEMENT PPT
21
-
Upload
chaitanya-prasad -
Category
Education
-
view
241 -
download
7
Transcript of MS II UNIT MATERIAL MANAGEMENT PPT

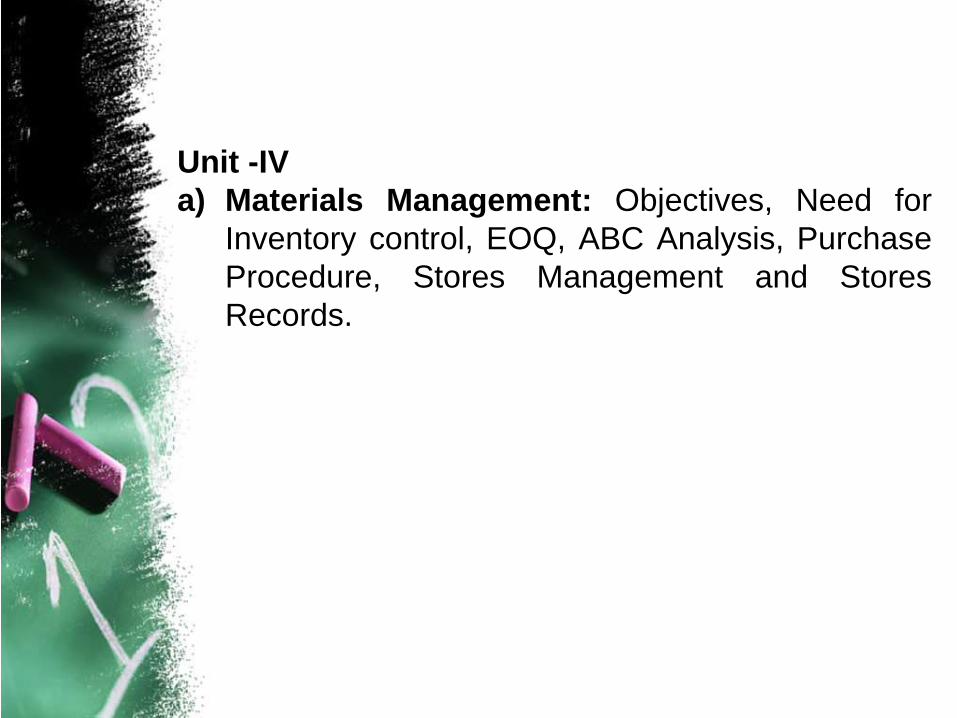
Unit -IV
a) Materials Management: Objectives, Need for
Inventory control, EOQ, ABC Analysis, Purchase
Procedure, Stores Management and Stores
Records.
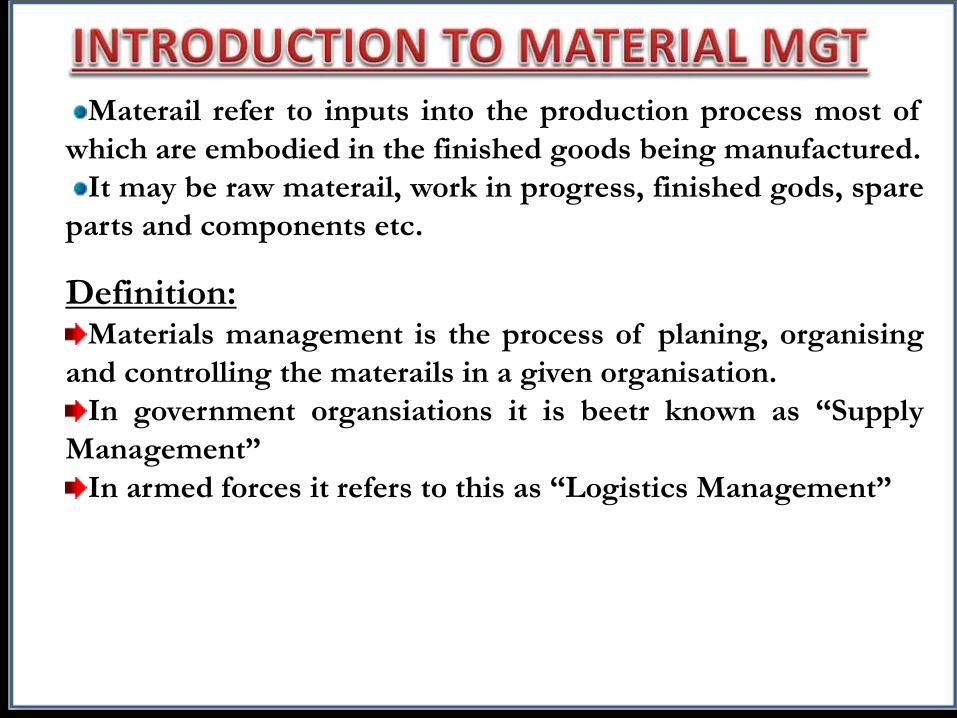
Materail refer to inputs into the production process most of
which are embodied in the finished goods being manufactured.
It may be raw materail, work in progress, finished gods, spare
parts and components etc.
Definition:Materials management is the process of planing, organising
and controlling the materails in a given organisation.
In government organsiations it is beetr known as “Supply
Management”
In armed forces it refers to this as “Logistics Management”
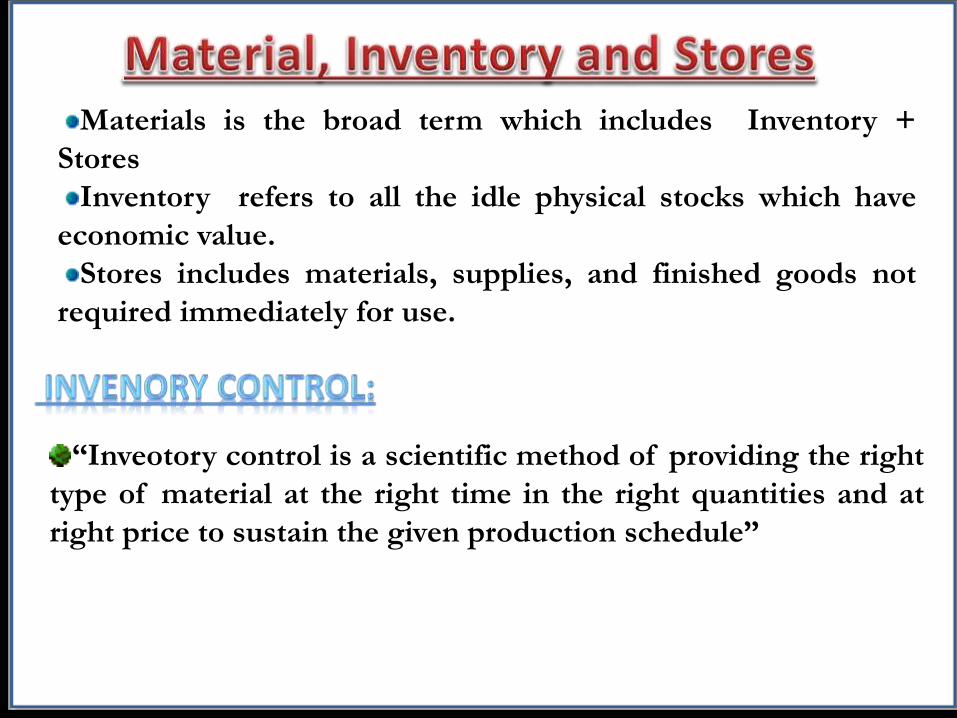
Materials is the broad term which includes Inventory +
Stores
Inventory refers to all the idle physical stocks which have
economic value.
Stores includes materials, supplies, and finished goods not
required immediately for use.
“Inveotory control is a scientific method of providing the right
type of material at the right time in the right quantities and at
right price to sustain the given production schedule”
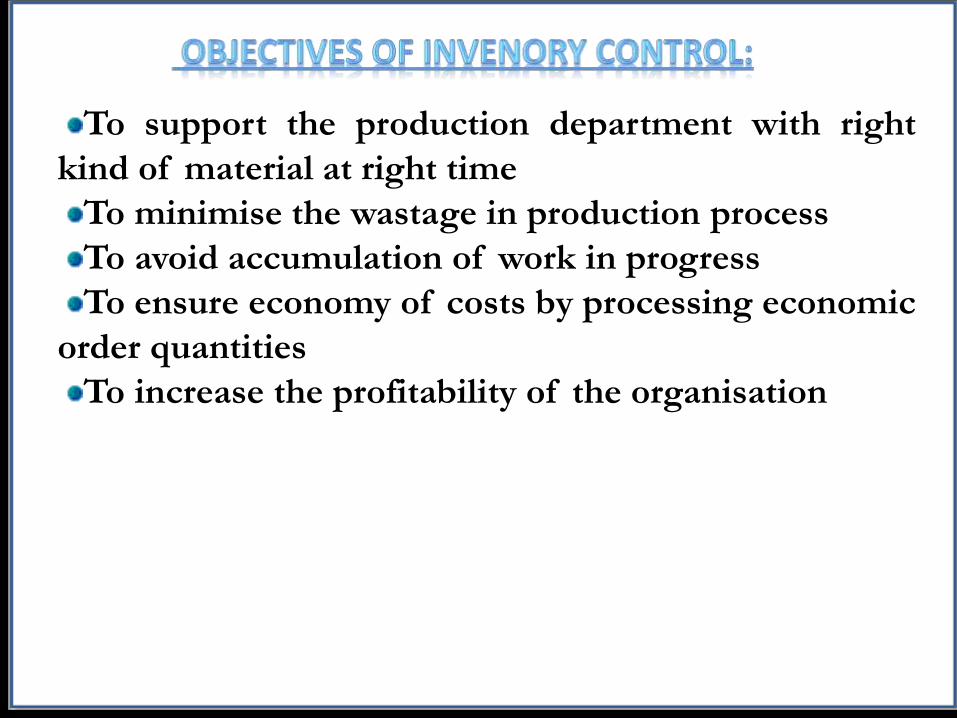
To support the production department with right
kind of material at right time
To minimise the wastage in production process
To avoid accumulation of work in progress
To ensure economy of costs by processing economic
order quantities
To increase the profitability of the organisation

Maintain stores record to ensure continuos stock taking
Classify, in a comprehensive manner, the items of invntory and codify the same
Formulate a clear cut purhcase procedures
Set stock levels for different levels
Monitor each category of the stocks through ABC anlysis
Minise the cost of each order by determining EOQ
Replenish the stock as and when required
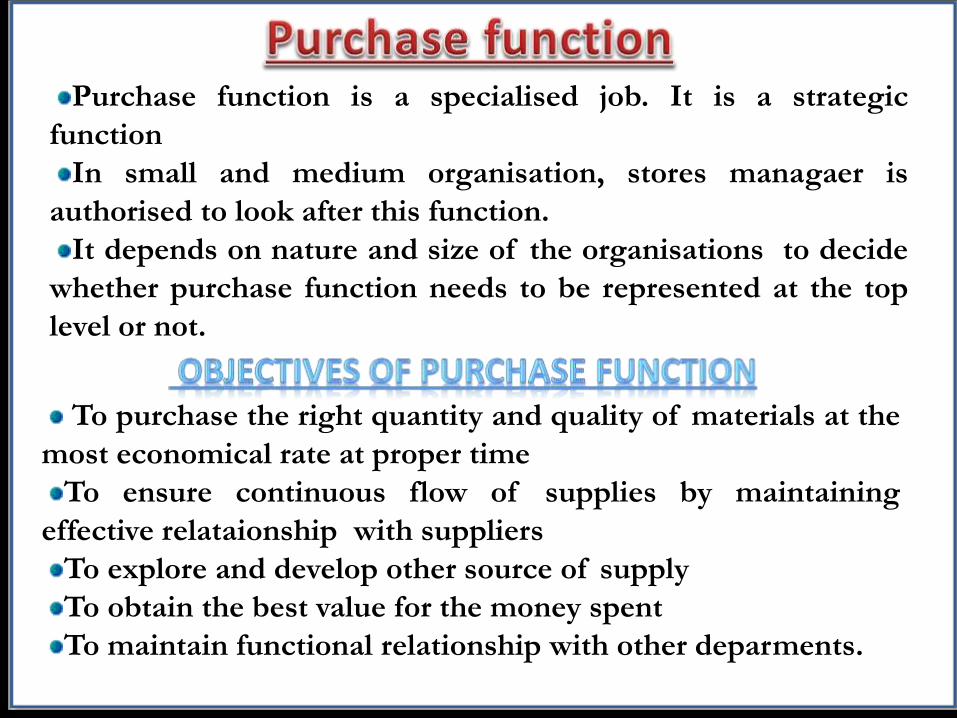
Purchase function is a specialised job. It is a strategic
function
In small and medium organisation, stores managaer is
authorised to look after this function.
It depends on nature and size of the organisations to decide
whether purchase function needs to be represented at the top
level or not.
To purchase the right quantity and quality of materials at the
most economical rate at proper time
To ensure continuous flow of supplies by maintaining
effective relataionship with suppliers
To explore and develop other source of supply
To obtain the best value for the money spent
To maintain functional relationship with other deparments.

CHECKING INWARD INVOICE
RECEIVING OF MATERIALS ALONG WITH THE INVOICE
PLACING PURCHASE ORDER
NEGOTIATING OVER THE PURCHASE PRICE AND TERMS OF SUPPLY
OPENING OF TENDERS AND PREPATION OF STATEMENT
ISSUING OF TENDERS AND OBTAINING QUOTATION
EXPLORING THE SOURCE OF SUPPLY
REQUISITIONING FOR PURCHASING
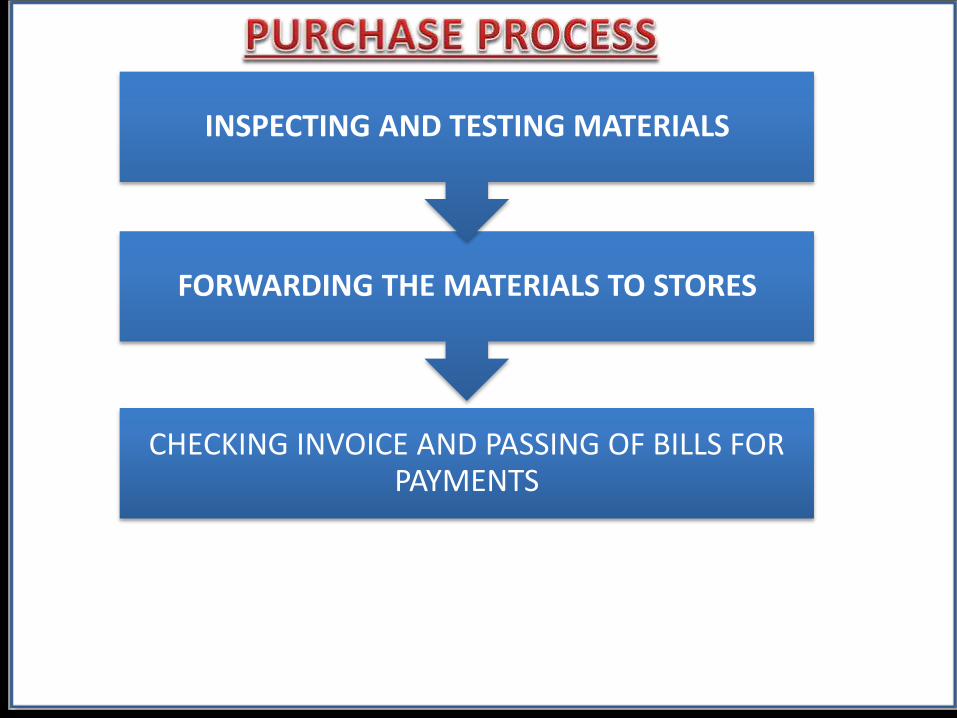
CHECKING INVOICE AND PASSING OF BILLS FOR PAYMENTS
FORWARDING THE MATERIALS TO STORES
INSPECTING AND TESTING MATERIALS
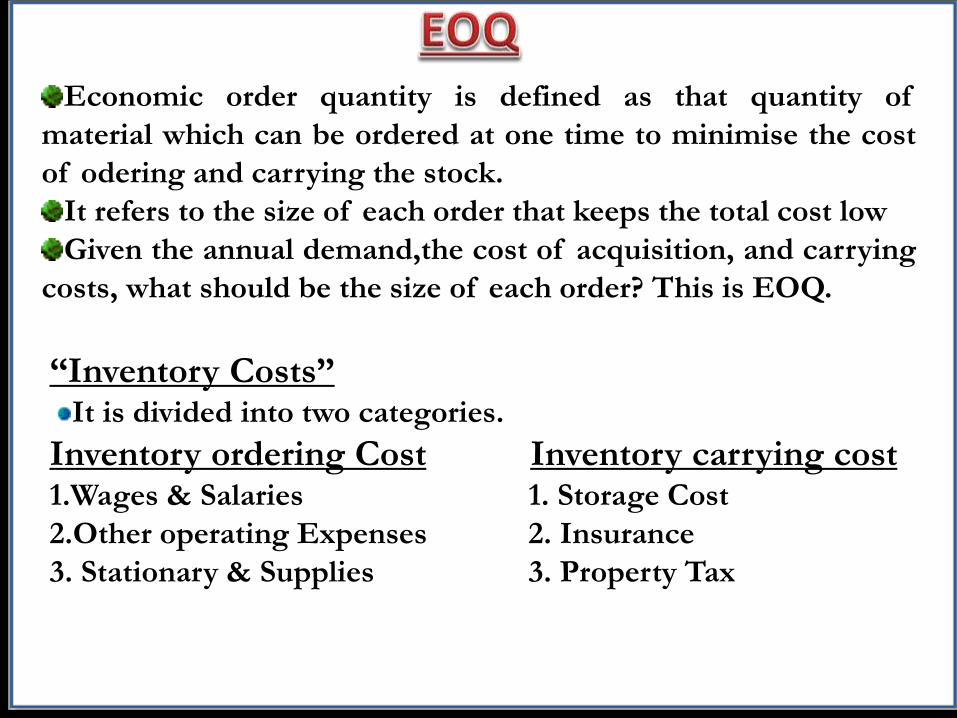
Economic order quantity is defined as that quantity of
material which can be ordered at one time to minimise the cost
of odering and carrying the stock.
It refers to the size of each order that keeps the total cost low
Given the annual demand,the cost of acquisition, and carrying
costs, what should be the size of each order? This is EOQ.
“Inventory Costs”It is divided into two categories.
Inventory ordering Cost Inventory carrying cost1.Wages & Salaries 1. Storage Cost
2.Other operating Expenses 2. Insurance
3. Stationary & Supplies 3. Property Tax

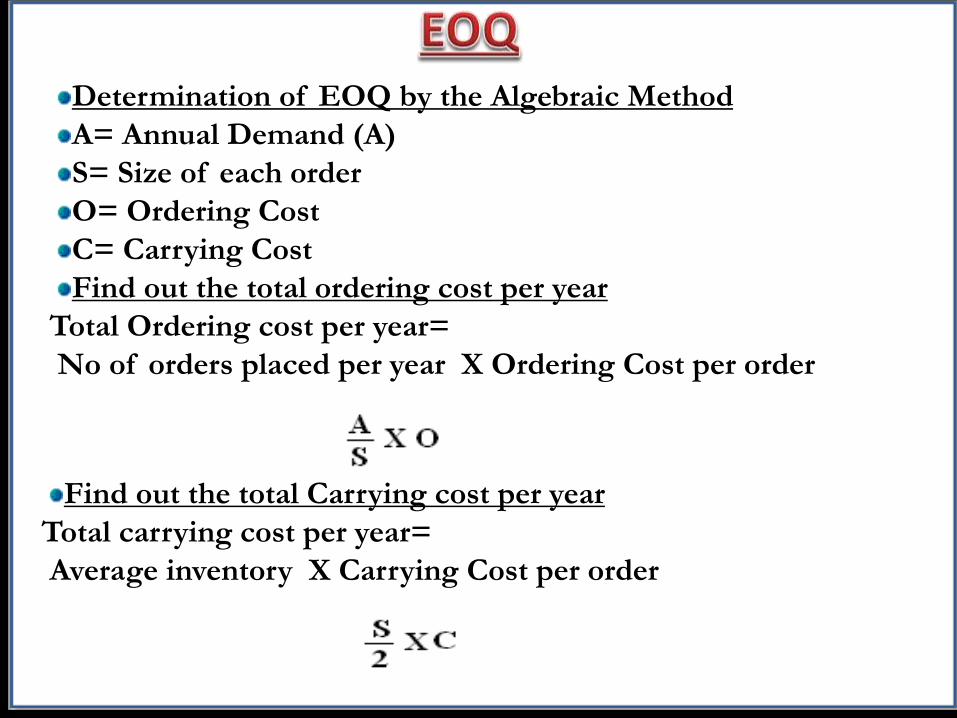
Determination of EOQ by the Algebraic Method
A= Annual Demand (A)
S= Size of each order
O= Ordering Cost
C= Carrying Cost
Find out the total ordering cost per year
Total Ordering cost per year=
No of orders placed per year X Ordering Cost per order
Find out the total Carrying cost per year
Total carrying cost per year=
Average inventory X Carrying Cost per order
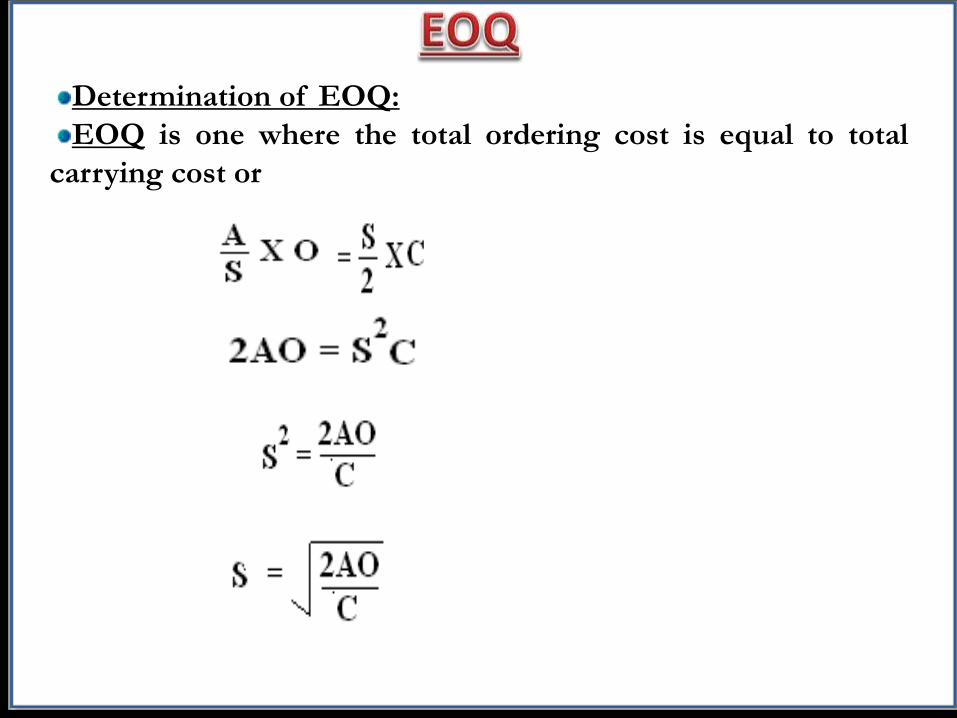
Determination of EOQ:
EOQ is one where the total ordering cost is equal to total
carrying cost or
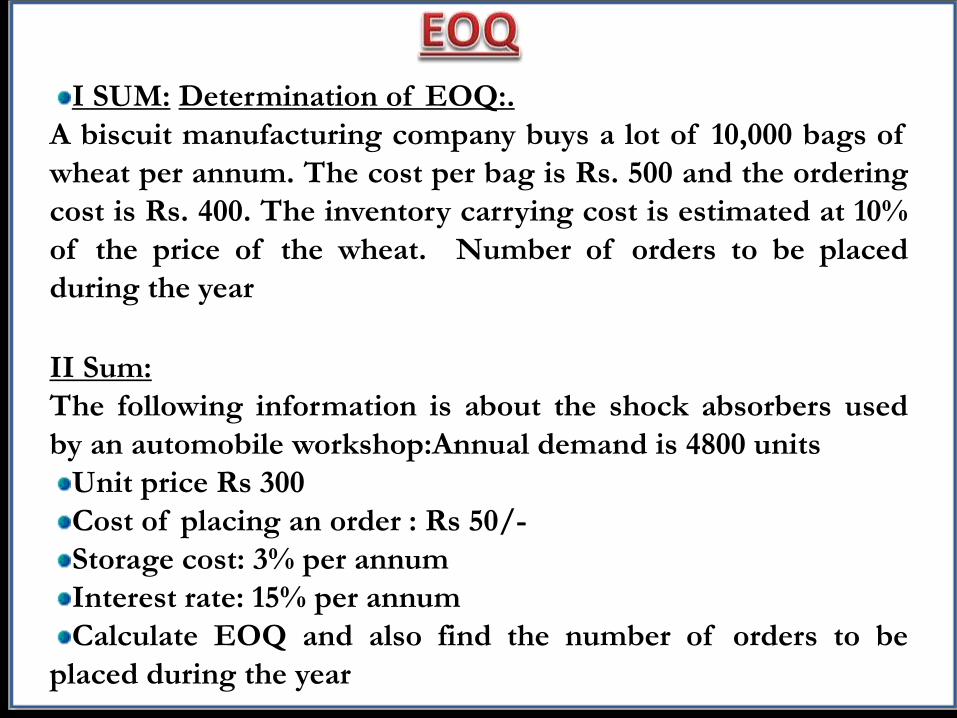
I SUM: Determination of EOQ:.
A biscuit manufacturing company buys a lot of 10,000 bags of
wheat per annum. The cost per bag is Rs. 500 and the ordering
cost is Rs. 400. The inventory carrying cost is estimated at 10%
of the price of the wheat. Number of orders to be placed
during the year
II Sum:
The following information is about the shock absorbers used
by an automobile workshop:Annual demand is 4800 units
Unit price Rs 300
Cost of placing an order : Rs 50/-
Storage cost: 3% per annum
Interest rate: 15% per annum
Calculate EOQ and also find the number of orders to be
placed during the year
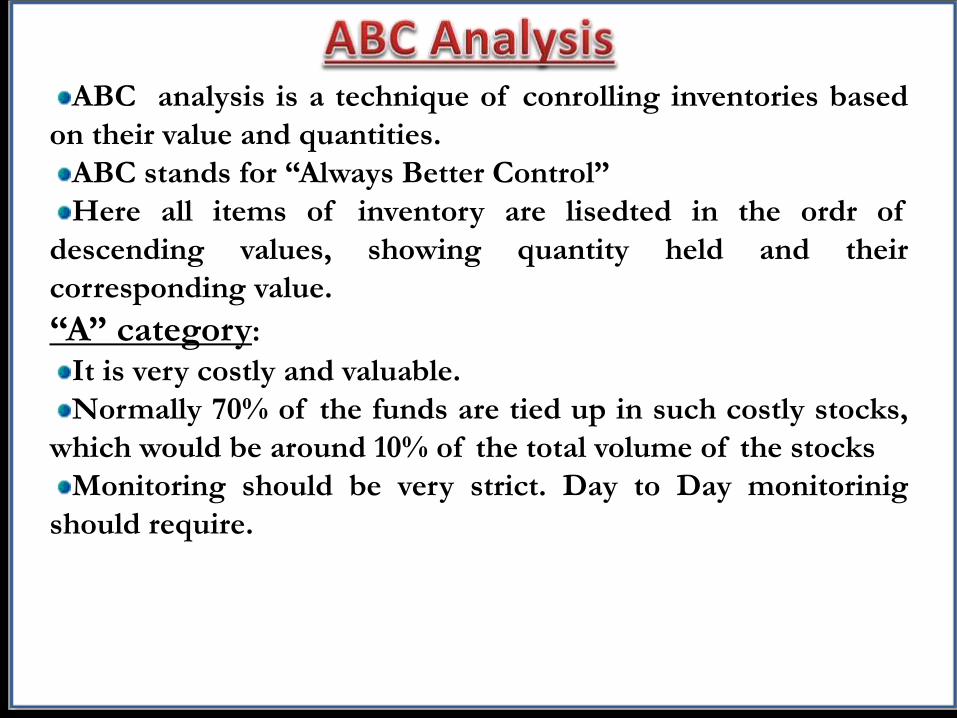
ABC analysis is a technique of conrolling inventories based
on their value and quantities.
ABC stands for “Always Better Control”
Here all items of inventory are lisedted in the ordr of
descending values, showing quantity held and their
corresponding value.
“A” category:It is very costly and valuable.
Normally 70% of the funds are tied up in such costly stocks,
which would be around 10% of the total volume of the stocks
Monitoring should be very strict. Day to Day monitorinig
should require.

“B” category:It is Less costly.
Normally 20% of the funds are tied up in such stocks, which
would be around 20% of the total volume of the stocks
Monitoring should be strict. Weekly monitorinig should
require.
“C” category:It is Least costly.
Volume wise they form 70% of the total stock but value wise
they do not cost more than 10% investment in the stock.
This category can be monitored on a monthly or bi-monthly
basis

Category Value(%) Volume(%) Degrees of Control
A 70 10 Strict
B 20 20 Moderate
C 10 70 Low
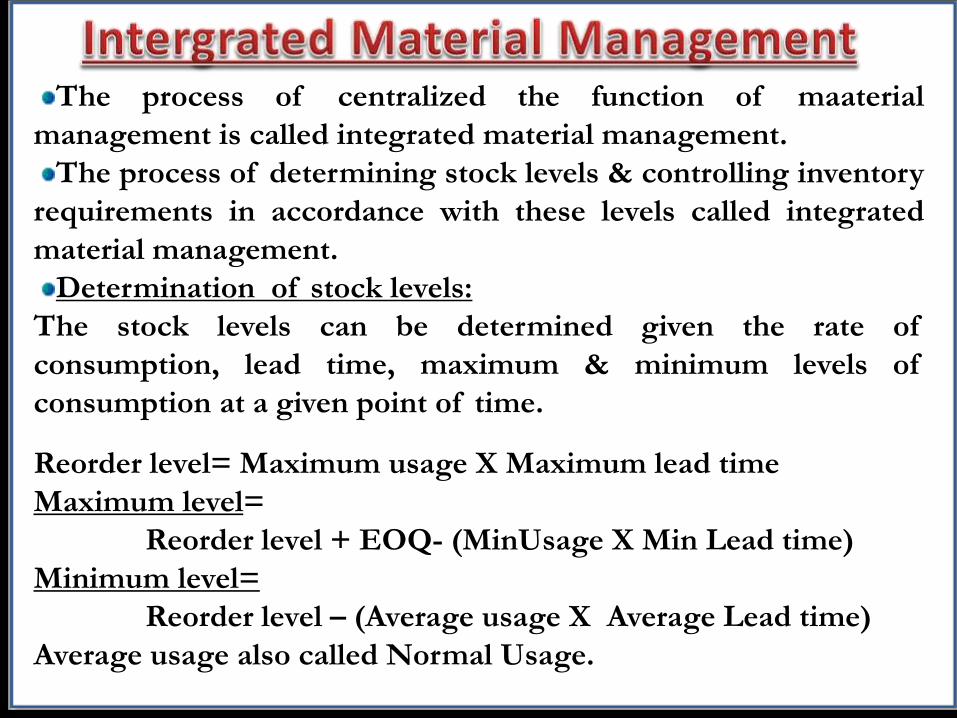
The process of centralized the function of maaterial
management is called integrated material management.
The process of determining stock levels & controlling inventory
requirements in accordance with these levels called integrated
material management.
Determination of stock levels:
The stock levels can be determined given the rate of
consumption, lead time, maximum & minimum levels of
consumption at a given point of time.
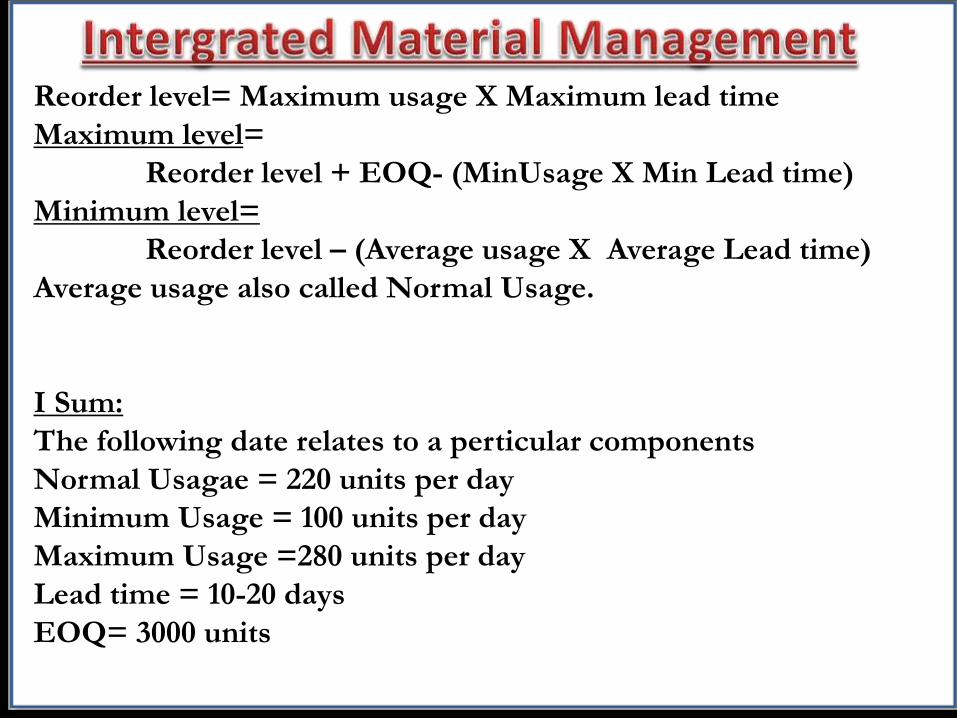
Reorder level= Maximum usage X Maximum lead time
Maximum level=
Reorder level + EOQ- (MinUsage X Min Lead time)
Minimum level=
Reorder level – (Average usage X Average Lead time)
Average usage also called Normal Usage.
Reorder level= Maximum usage X Maximum lead time
Maximum level=
Reorder level + EOQ- (MinUsage X Min Lead time)
Minimum level=
Reorder level – (Average usage X Average Lead time)
Average usage also called Normal Usage.
I Sum:
The following date relates to a perticular components
Normal Usagae = 220 units per day
Minimum Usage = 100 units per day
Maximum Usage =280 units per day
Lead time = 10-20 days
EOQ= 3000 units
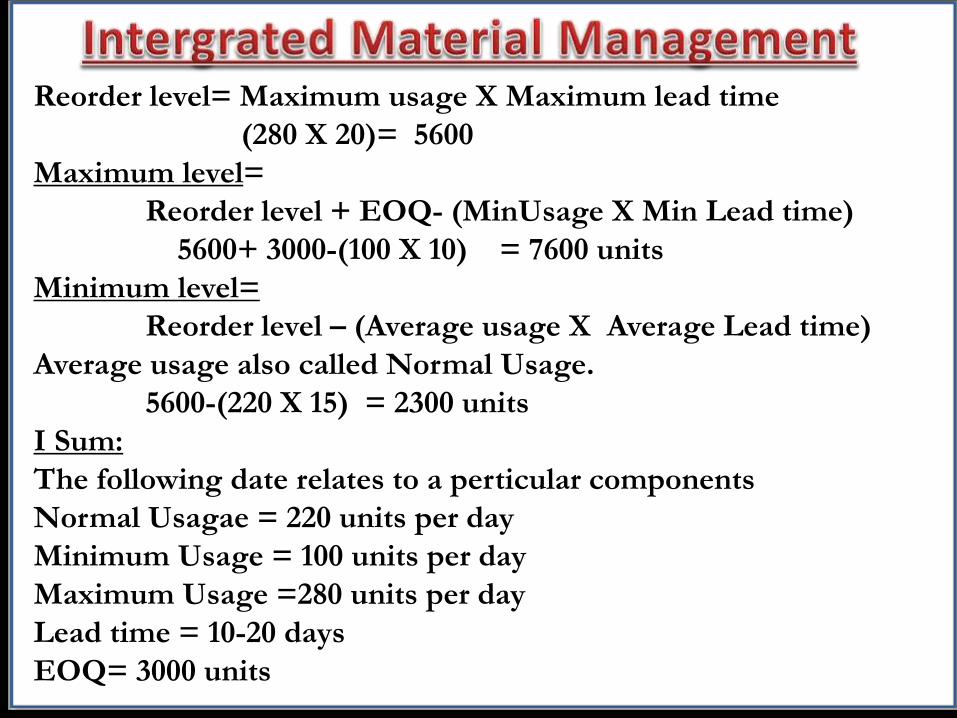
Reorder level= Maximum usage X Maximum lead time
(280 X 20)= 5600
Maximum level=
Reorder level + EOQ- (MinUsage X Min Lead time)
5600+ 3000-(100 X 10) = 7600 units
Minimum level=
Reorder level – (Average usage X Average Lead time)
Average usage also called Normal Usage.
5600-(220 X 15) = 2300 units
I Sum:
The following date relates to a perticular components
Normal Usagae = 220 units per day
Minimum Usage = 100 units per day
Maximum Usage =280 units per day
Lead time = 10-20 days
EOQ= 3000 units

HML: High, Medium, Low
SDE: Scares, Difficult, Easy to Obtain
FSN: Fast moving, Slow moving, Non moving
VED: Vital, Essential, Desirable
XYZ: High, Medium, Low
SOS: Seasonal & Off Seasonal