Mrs Palesa Tyobeka Deputy Director-General: General Education 26 August 2009
14
Mrs Palesa Tyobeka Deputy Director-General: General Education 26 August 2009
-
Upload
lesley-crawford -
Category
Documents
-
view
28 -
download
0
description
Meeting the Literacy Challenge Briefing to the Select Committee on Education and Recreation on literacy in schools. Mrs Palesa Tyobeka Deputy Director-General: General Education 26 August 2009. Presentation Outline. A. Current state of performance in literacy - PowerPoint PPT Presentation
Transcript of Mrs Palesa Tyobeka Deputy Director-General: General Education 26 August 2009

Mrs Palesa TyobekaDeputy Director-General: General Education
26 August 2009

Presentation OutlineA. Current state of performance in
literacyEvidence from public schoolsMajor predictors of performance
B. Strategy to address the literacy challenge
Priorities and measurement
The Department is increasingly strengthening measurement to provide credible evidence to inform necessary interventions and support and improve performance in literacy as a an important foundational skill.
Achievement of high quality learning outcomes is periodically measured against contextual factors of access, equity and quality that might impact on learning and teaching.
National priority at the basic education level is on literacy/language and numeracy/mathematics and these are monitored through periodic systemic evaluations and annual national assessments.

Available Evidence
3036 38
0
5
10
15
20
25
30
35
40
Perc
ent
Grade 3 (2001) Grade 3 (2007) Grade 6 (2004)
Observed Levels of Achievement
Literacy

Proportion of grade 3 learners at different levels
37
24
25
15
0 5 10 15 20 25 30 35 40
Level 1
Level 2
Level 3
Level 4
Proportion of learners (%)
Literacy
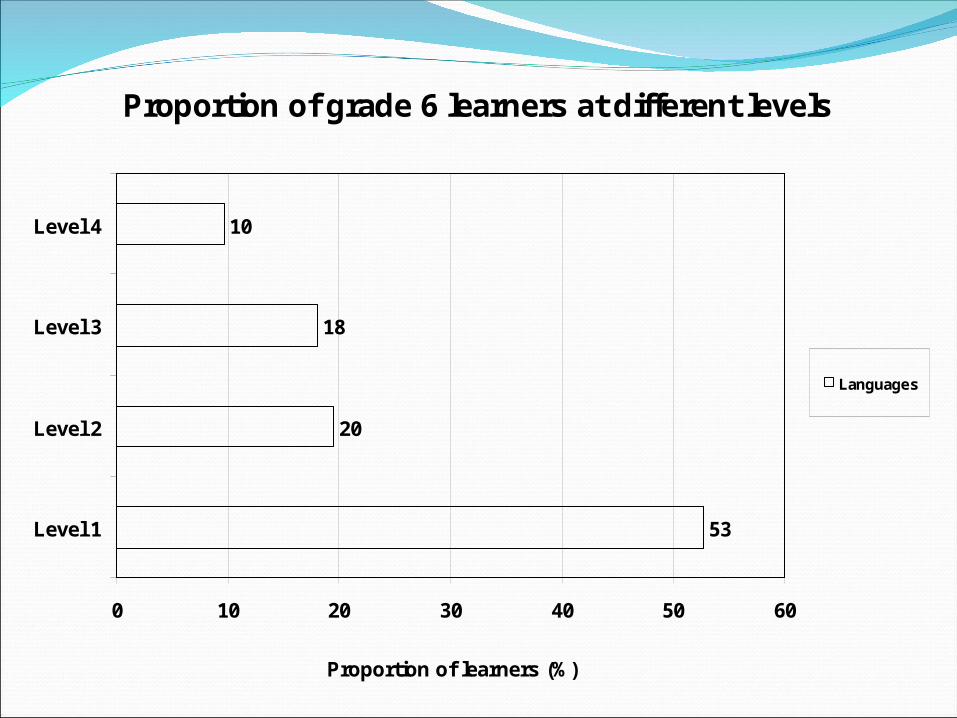
Proportion of grade 6 learners at different levels
53
20
18
10
0 10 20 30 40 50 60
Level 1
Level 2
Level 3
Level 4
Proportion of learners (%)
Languages

Observed Levels of Achievement
Baseline studies showed average scores of 30% in literacy at grade 3 level (2001) and 38% in language at grade 6 level (2004).
Annual national assessments show that 2 out of every 5 grade 3 learners achieved average scores of 50% and above (Levels 3 to 4) in literacy. Corresponding proportion at grade 6 level was approximately 1 out of every 5.
Localised tracer studies (QIDS UP) indicate appreciable increases in performance where there has been focused interventions (e.g. provision of basic learning-&-teaching resources) and regular measurement.

Distribution of Achievement
Provincia l M ean Scores (% )
0
1 0
2 0
3 0
4 0
5 0
6 0
7 0
8 0
E/C
ap
e
F/S
tate
Ga
u
KZ
N
Lim
p
Mp
u
N/W
est
N/C
ap
e
W/C
ap
e
L a ng ua g e
M a ths
N .S c ie nc e s

Distribution of Achievement
Lowest performance is in the largest (previously disadvantaged) provinces of Eastern Cape and Limpopo
However, individual rural schools in these provinces have been identified that tend to over-perform their socio-economic circumstances.

Major Predictors of Performance
Key predictors and the “percentage difference (diff.) they account for ” in learner achievement:-
Teaching practices (diff. = 59%)Language of learning and teaching (diff. =
49%)School resources (diff. = 49%)Access to learning materials (diff. = 28%)Time-on-task (diff. = 20%)

Strengthening of Measurement
Department is strengthening assessments at grades 3, 6 and 9
Schools are directed to set improvement targets and monitor performance towards the 50% target of 2011 (FFL)
Deserving schools will be assisted to administer the tests to ensure evenness of measurement.

Addressing key predictors of performanceFoundations for Learning Campaign was launched in March
2008 to energise system around the teaching of literacy and numeracy – starting with Grades R – 6 – specifically to do the following:Provide structure around properly sequenced and paced content for
teachers in these key learning areas;Assistance with assessment activities covering the entire curriculum and
assessing different skills envisaged by the curriculum;Ensure maximum time on task;Provide critical resources for effective teaching;Provide support for under prepared teachers in all grades.
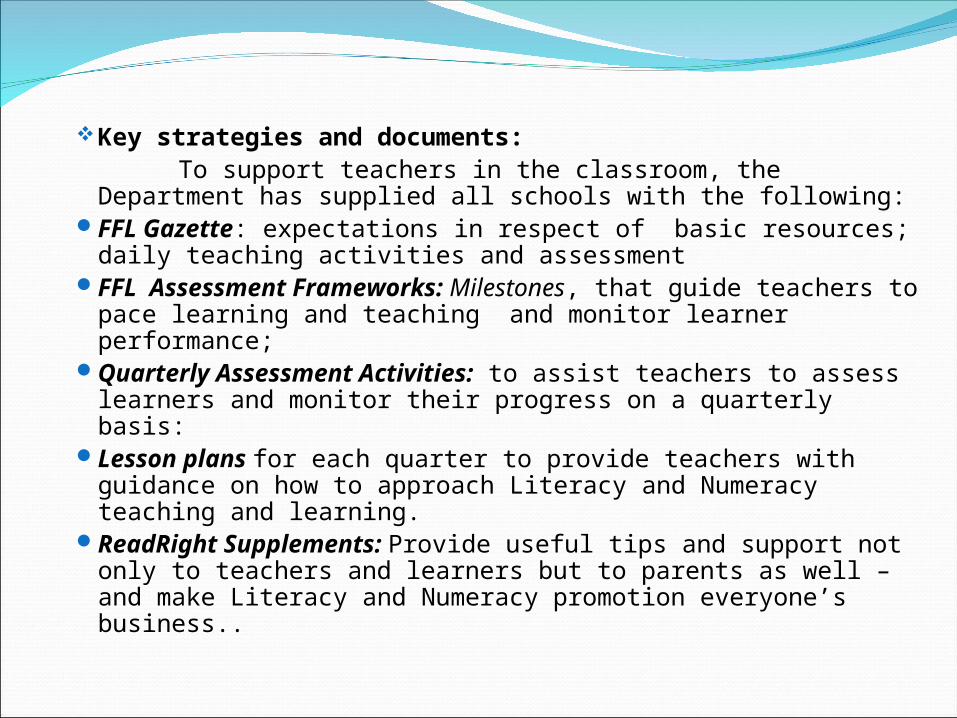
Key strategies and documents: To support teachers in the classroom, the Department has supplied all
schools with the following:FFL Gazette: expectations in respect of basic resources; daily
teaching activities and assessmentFFL Assessment Frameworks: Milestones, that guide teachers to
pace learning and teaching and monitor learner performance;Quarterly Assessment Activities: to assist teachers to assess learners
and monitor their progress on a quarterly basis:Lesson plans for each quarter to provide teachers with guidance on
how to approach Literacy and Numeracy teaching and learning.ReadRight Supplements: Provide useful tips and support not only to
teachers and learners but to parents as well – and make Literacy and Numeracy promotion everyone’s business..

2009 and beyondThe Foundations for Learning Grade R Toolkit will be sent to
all schools with Grade R by November 2009. This comprises all the basic resources a Grade R teacher needs in a year for effective teaching;
Lesson plans for all terms for Grades 1 – 6 will be sent to all schools for the start of the 2010 academic year (scheduled for distribution by November 2009);
National assessments for all Grades 1 – 9 to be conducted again at the end of 2009, and schools assisted to use results in SIPs;
A programme of support by districts to be developed with district advisors for a qualitative focus on improving outcomes.