MRPI®-EPD+ STICHTING MRPI
8
MRPI®-EPD+ STICHTING MRPI 1 COMPANY INFORMATION AkzoNobel International Paint Ltd. Stoneygate Lane, Felling Gateshead, Tyne & Wear NE10 0JY, United Kingdom www.akzonobel.com PRODUCT International Interchar 212 (Part A + Part B) MRPI®-REGISTRATION 1.1.00025.2018 EPD-REGISTRATION 00000750 DATE OF ISSUE 14-9-2018 DATE OF EXPIRY 14-9-2023 DECLARED UNIT/FUNCTIONAL UNIT All impacts are calculated using the declared unit “coating of 1 m 2 of surface”. PROGRAMME OPERATOR Stichting MRPI® Zuid-Hollandlaan 7 2596AL Den Haag DESCRIPTION OF PRODUCT A high performance, high build, solvent free, two pack modified epoxy intumescent fireproofing coating designed to be used on steelwork requiring protection from cellulosic fires. MORE INFORMATION: https://www.international-pc.com/product/interchar- 212 VISUAL PRODUCT SCOPE OF DECLARATION This MRPI®-EPD+ certificate is verified by NIBE. The LCA study has been done by Ecomatters. The certificate is based on an LCA-dossier according to ISO14025 and NEN-EN15804+A1. It is verified according to the EPD-MRPI® verification protocol May 2017. EPD of construction products may not be comparable if they do not comply with NEN-EN15804+A1. Declaration of SVHC that are listed on the "Candidate List of Substances of Very High Concern for authorization" when content exceeds the limits for registration with ECHA. DEMONSTRATION OF VERIFICATION CEN standard EN15804 serves as the core PCR a independent verification of the declaration and data, according to EN ISO 14025:2010 ☐internal þexternal (where appropriate b ) Third party verifier: Kamiel Jansen, NIBE a Product Category Rules b Optional for B-to-B communication; mandatory for B-to-C communication (see EN ISO 14025:2010,9.4).
Transcript of MRPI®-EPD+ STICHTING MRPI

MRPI®-EPD+ STICHTING MRPI
1
COMPANY INFORMATION
AkzoNobel International Paint Ltd. Stoneygate Lane, Felling Gateshead, Tyne & Wear NE10 0JY, United Kingdom www.akzonobel.com
PRODUCT International Interchar 212 (Part A + Part B)
MRPI®-REGISTRATION 1.1.00025.2018
EPD-REGISTRATION 00000750
DATE OF ISSUE 14-9-2018
DATE OF EXPIRY 14-9-2023
DECLARED UNIT/FUNCTIONAL UNIT All impacts are calculated using the declared unit “coating of 1 m2 of surface”.
PROGRAMME OPERATOR Stichting MRPI® Zuid-Hollandlaan 7 2596AL Den Haag
DESCRIPTION OF PRODUCT A high performance, high build, solvent free, two pack modified epoxy intumescent fireproofing coating designed to be used on steelwork requiring protection from cellulosic fires. MORE INFORMATION: https://www.international-pc.com/product/interchar-212
VISUAL PRODUCT
SCOPE OF DECLARATION This MRPI®-EPD+ certificate is verified by NIBE. The LCA study has been done by Ecomatters. The certificate is based on an LCA-dossier according to ISO14025 and NEN-EN15804+A1. It is verified according to the EPD-MRPI® verification protocol May 2017. EPD of construction products may not be comparable if they do not comply with NEN-EN15804+A1. Declaration of SVHC that are listed on the "Candidate List of Substances of Very High Concern for authorization" when content exceeds the limits for registration with ECHA.
DEMONSTRATION OF VERIFICATION CENstandardEN15804servesasthecorePCRa
independentverificationofthedeclarationanddata,accordingtoENISO14025:2010
☐internalþexternal
(whereappropriateb)Thirdpartyverifier:
KamielJansen,NIBE
aProductCategoryRulesbOptionalforB-to-Bcommunication;mandatoryforB-to-Ccommunication(seeENISO14025:2010,9.4).

2
SCOPE AND TYPE The type of this EPD is Cradle-to-Gate with options. All major steps from the extraction of natural resources to the final disposal of the product are included in the environmental performance of the manufacturing phase, except those that are not relevant to the environmental performance of the product. This declaration does not imply an indicator result of zero. The coating is produced in the Netherlands, United States, China, Korea and Saudi Arabia and the application market is for customers around the world. Likewise, for the end-of-life, the fate of the coating product is described within a global context. The software GaBi 8.7 Professional is used to perform the LCA. The latest version of the AkzoNobel database for protective coatings (2017) was used, this includes the background datasets: • Ecoinvent (2008). • GaBi Professional Database • Plastics Europe
COMPONENT* [KG] Epoxy Resin Confidential Plasticiser Confidential Additive Confidential *> 1% TOTAL MASS
DETAILED PRODUCT DESCRIPTION International Interchar 212 is a high performance, high build, solvent free, two pack modified epoxy intumescent fireproofing coating designed to be used on steelwork requiring protection from cellulosic fires.
International Interchar 212 Life Time (years) 20
Density (kg/l) 1 Coverage (kg/m2) 6.5 Number of Layers 1
Total product used (kg/m2) 6.5 Production process and conditions of delivery During paint production, the raw materials are pre-weighed according to the percentage of each in the formulation. The pigment is then dispersed in a mixture of binder using a variety of machines. Finally, the paint is undergoing QC (quality control), filtered and filled into the appropriate packaging container. All paint containers are transported from the production sites to a distribution center and finally to the customers. Typical Use To assist in preserving the structural integrity of steelwork in a cellulosic fire. Typical structures requiring this protection include a number of public access buildings e.g Airport Terminals, Leisure Facilities,Convention Centres, Educational Facilities, Shopping Malls, Industrial Complexes, and Hotels. Pack size The products are packed in a packaging with a capacity of 20 liters. Drums/IBC's (Intermediate bulk containers) on request. Application Method Hot twin feed airless spray (Plural Component) or modified single feed machine.
3
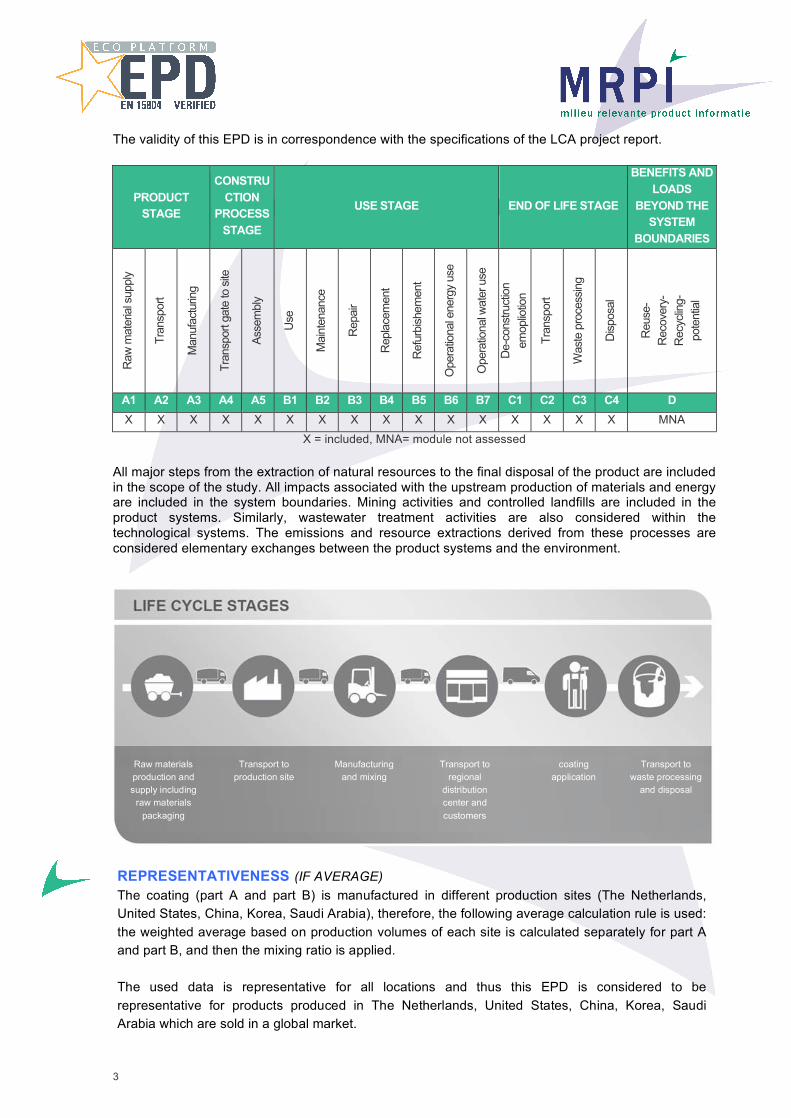
REPRESENTATIVENESS (IF AVERAGE) The coating (part A and part B) is manufactured in different production sites (The Netherlands, United States, China, Korea, Saudi Arabia), therefore, the following average calculation rule is used: the weighted average based on production volumes of each site is calculated separately for part A and part B, and then the mixing ratio is applied. The used data is representative for all locations and thus this EPD is considered to be representative for products produced in The Netherlands, United States, China, Korea, Saudi Arabia which are sold in a global market.
The validity of this EPD is in correspondence with the specifications of the LCA project report.
PRODUCT STAGE
CONSTRUCTION
PROCESS STAGE
USE STAGE END OF LIFE STAGE
BENEFITS AND LOADS
BEYOND THE SYSTEM
BOUNDARIES
Raw
mat
eria
l sup
ply
Tran
spor
t
Man
ufac
turin
g
Tran
spor
t gat
e to
site
Asse
mbl
y
Use
Mai
nten
ance
Rep
air
Rep
lace
men
t
Ref
urbi
shem
ent
Ope
ratio
nal e
nerg
y us
e
Ope
ratio
nal w
ater
use
De-
cons
truct
ion
emop
liotio
n
Tran
spor
t
Was
te p
roce
ssin
g
Disp
osal
Reu
se-
Rec
over
y-
Rec
yclin
g-
pote
ntia
l
A1 A2 A3 A4 A5 B1 B2 B3 B4 B5 B6 B7 C1 C2 C3 C4 D X X X X X X X X X X X X X X X X MNA
X = included, MNA= module not assessed All major steps from the extraction of natural resources to the final disposal of the product are included in the scope of the study. All impacts associated with the upstream production of materials and energy are included in the system boundaries. Mining activities and controlled landfills are included in the product systems. Similarly, wastewater treatment activities are also considered within the technological systems. The emissions and resource extractions derived from these processes are considered elementary exchanges between the product systems and the environment.
Raw materials production and supply including
raw materials packaging
Transport to production site
Manufacturing and mixing
Transport to
regional distribution center and customers
coating application
Transport to waste processing
and disposal

4
UNIT A1 A2 A3 TOTAL A1-A3 A4 A5 B1 B2 B3 B4 B5 B6 B7 C1 C2 C3 C4 D
PERE [MJ] 1.80E+01
6.48E-02
1.20E+00
1.93E+01 9.44E-01
2.21E-01
0 0 0 0 0 0 0 0 3.01E-02
0 1.76E-05
INA
PERM [MJ] 9.46E-01
1.78E-04
3.31E-01
1.28E+00 2.56E-04
1.27E-02
0 0 0 0 0 0 0 0 1.64E-10
0 3.25E-02
INA
PERT [MJ] 1.90E+01
6.50E-02
1.53E+00
2.06E+01 9.44E-01
2.34E-01
0 0 0 0 0 0 0 0 3.01E-02
0 3.25E-02
INA
PENRE [MJ] 9.46E+02
2.99E+00
4.52E+01
9.94E+02 1.97E+01
1.06E+01
0 0 0 0 0 0 0 0 5.45E-01
0 1.58E+01
INA
PENRM [MJ] 7.88E-05
8.95E-08
1.94E-04
2.73E-04 1.28E-07
2.94E-05
0 0 0 0 0 0 0 0 0.00E+00
0 1.09E-04
INA
PENRT [MJ] 9.46E+02
2.99E+00
4.52E+01
9.94E+02 1.97E+01
1.06E+01
0 0 0 0 0 0 0 0 5.45E-01
0 1.58E+01
INA
SM [kg] 0 0 0 0 0 0 0 0 0 0 0 0 0 0 0 0 0 INA
RSF [MJ] 0 0 0 0 0 0 0 0 0 0 0 0 0 0 0 0 0 INA
NSRF [MJ] 0 0 0 0 0 0 0 0 0 0 0 0 0 0 0 0 0 INA
FW [m3 ] 4.81E+01
3.02E-02
8.95E-01
4.91E+01 1.08E-01
1.03E-01
0 0 0 0 0 0 0 0 2.30E-03
0 7.50E-02
INA
PERE = Use of renewable primary energy excluding renewable primary energy resources used as raw materials; PERM = Use of renewable primary energy resources used as raw materials; PERT = Total use of renewable primary energy resources; PENRE = Use of non-renewable primary energy excluding non-renewable primary energy resources used as raw materials; PENRM = Use of non-renewable primary energy resources used as raw materials; PENRT = Total use of non-renewable primary energy resources; SM = Use of secondary material; RSF = Use of renewable secondary fuels; NRSF = Use of non-renewable secondary fuels; FW = Use of net fresh water
UNIT A1 A2 A3 TOTAL A1-A3
A4 A5 B1 B2 B3 B4 B5 B6 B7 C1 C2 C3 C4 D
ADPE [kg Sb-Eq.] 2.08E-03
1.77E-08
7.76E-07
2.08E-03 1.19E-07
2.74E-06
0 0 0 0 0 0 0 0 3.31E-09
0 1.08E-05
INA
ADPF [MJ] 8.43E+02
2.96E+00
4.20E+01
8.88E+02 1.96E+01
8.53E+00
0 0 0 0 0 0 0 0 5.43E-01
0 1.09E+01
INA
GWP [kg CO2-Eq.] 5.14E+01
2.16E-01
2.95E+00
5.46E+01 1.43E+00
3.65E+00
0 0 0 0 0 0 0 0 3.96E-02
0 1.09E+01
INA
ODP [kg CFC11-Eq.] 6.49E-06
1.63E-08
1.19E-07
2.34E-08 2.34E-08
3.65E-08
0 0 0 0 0 0 0 0 1.09E-15
0 7.84E-08
INA
POCP [kg ethene-Eq.] 1.71E-02
2.57E-04
2.32E-03
8.24E-04 8.24E-04
3.64E-03
0 0 0 0 0 0 0 0 1.61E-05
0 4.71E-04
INA
AP [kg SO2-Eq.] 2.29E-01
4.59E-03
7.26E-03
2.41E-01 1.16E-02
2.27E-03
0 0 0 0 0 0 0 0 1.75E-04
0 5.23E-03
INA
EP [kg (PO4 )3--Eq.] 2.72E-02
6.06E-04
3.74E-03
3.16E-02 2.12E-03
2.14E-03
0 0 0 0 0 0 0 0 4.43E-05
0 5.06E-03
INA
ADPE = Abiotic depletion potential for non-fossil resources; ADPF = Abiotic depletion potential for fossil resources GWP = Global warming potential; ODP = Depletion potential of the stratospheric ozone layer; POCP = Formation potential of tropospheric ozone photochemical oxidants; AP = Acidification potential of land and water; EP = Eutrophication potential
ENVIRONMENTAL IMPACT per functional or declared unit
RESOURCE USE per functional or declared unit
5
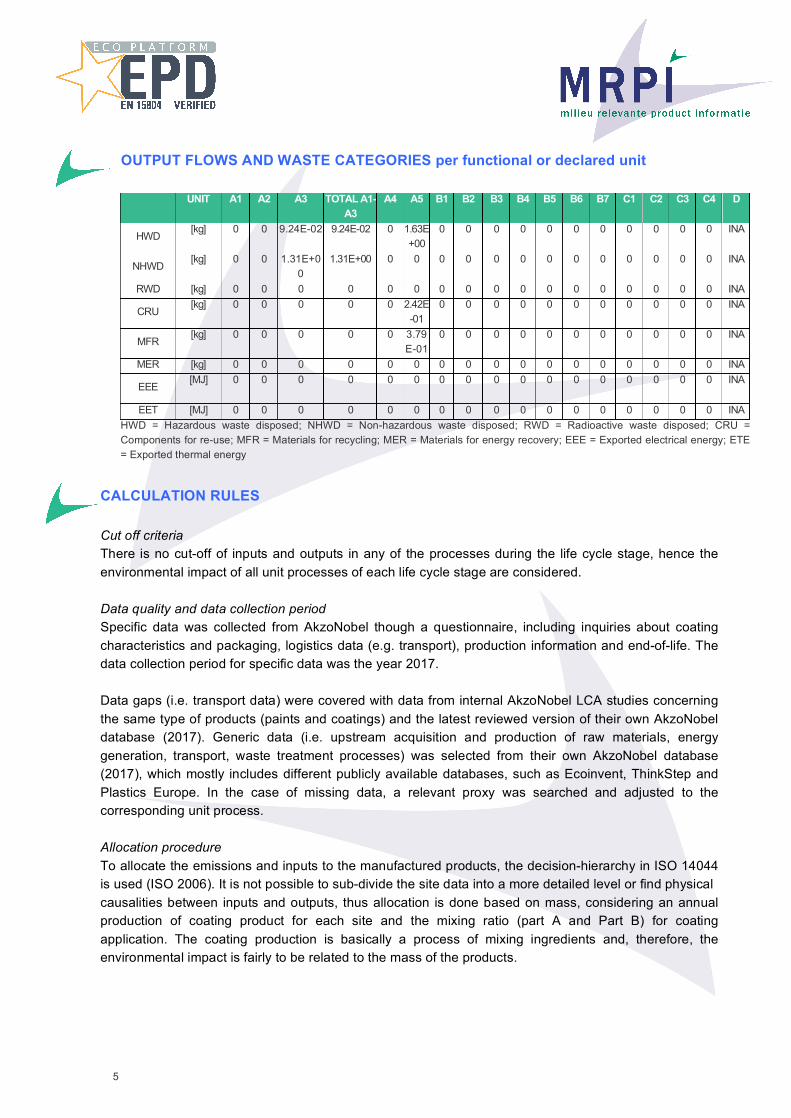
CALCULATION RULES Cut off criteria There is no cut-off of inputs and outputs in any of the processes during the life cycle stage, hence the environmental impact of all unit processes of each life cycle stage are considered. Data quality and data collection period Specific data was collected from AkzoNobel though a questionnaire, including inquiries about coating characteristics and packaging, logistics data (e.g. transport), production information and end-of-life. The data collection period for specific data was the year 2017. Data gaps (i.e. transport data) were covered with data from internal AkzoNobel LCA studies concerning the same type of products (paints and coatings) and the latest reviewed version of their own AkzoNobel database (2017). Generic data (i.e. upstream acquisition and production of raw materials, energy generation, transport, waste treatment processes) was selected from their own AkzoNobel database (2017), which mostly includes different publicly available databases, such as Ecoinvent, ThinkStep and Plastics Europe. In the case of missing data, a relevant proxy was searched and adjusted to the corresponding unit process. Allocation procedure To allocate the emissions and inputs to the manufactured products, the decision-hierarchy in ISO 14044 is used (ISO 2006). It is not possible to sub-divide the site data into a more detailed level or find physical causalities between inputs and outputs, thus allocation is done based on mass, considering an annual production of coating product for each site and the mixing ratio (part A and Part B) for coating application. The coating production is basically a process of mixing ingredients and, therefore, the environmental impact is fairly to be related to the mass of the products.
OUTPUT FLOWS AND WASTE CATEGORIES per functional or declared unit
UNIT A1 A2 A3 TOTAL A1-A3
A4 A5 B1 B2 B3 B4 B5 B6 B7 C1 C2 C3 C4 D
HWD [kg] 0 0 9.24E-02 9.24E-02 0 1.63E
+00 0 0 0 0 0 0 0 0 0 0 0 INA
NHWD [kg] 0 0 1.31E+0
0 1.31E+00 0 0 0 0 0 0 0 0 0 0 0 0 0 INA
RWD [kg] 0 0 0 0 0 0 0 0 0 0 0 0 0 0 0 0 0 INA
CRU [kg] 0 0 0 0 0 2.42E
-01 0 0 0 0 0 0 0 0 0 0 0 INA
MFR [kg] 0 0 0 0 0 3.79
E-01 0 0 0 0 0 0 0 0 0 0 0 INA
MER [kg] 0 0 0 0 0 0 0 0 0 0 0 0 0 0 0 0 0 INA
EEE [MJ] 0 0 0 0 0 0 0 0 0 0 0 0 0 0 0 0 0 INA
EET [MJ] 0 0 0 0 0 0 0 0 0 0 0 0 0 0 0 0 0 INA
HWD = Hazardous waste disposed; NHWD = Non-hazardous waste disposed; RWD = Radioactive waste disposed; CRU = Components for re-use; MFR = Materials for recycling; MER = Materials for energy recovery; EEE = Exported electrical energy; ETE = Exported thermal energy

6
SCENARIOS AND ADDITIONAL TECHNICAL INFORMATION
A1. Raw materials supply
This module considers the extraction and processing of all raw materials and energy which occur upstream to the International Interchar 212 manufacturing process, as well as waste processing up to the end-of waste state.
A2. Transport of raw materials to manufacturer
This includes the transport distance of the raw materials to the manufacturing facility via road, boat and/or train. On average, the transport characteristics for this life cycle stage are the following: International Interchar 212 Transport type Truck 1 Truck 2 Container ship coast Distance 94.58 125.19 1408.12 Capacity 34-40 t ,60%
payload 40-60 t, 60% payload
70% utilization factor
Bulk density of transported products 1000 kg/m3 1000 kg/m3 1000 kg/m3
A3. Manufacturing
This module covers the manufacturing of the International Interchar 212 coating and includes all processes linked to production such as storing, mixing, packing and internal transportation. Use of electricity and fuels in coating production are considered as well. Data regarding coating production was provided for the manufacturing sites where International Interchar 212 coating is produced: The Netherlands, United States, China, Korea, Saudi Arabia. The manufacturing process does not differ from production site. Furthermore, the specific transportation distances and transportation modes for raw materials, coating packaging and transportation to customer were collected from the AkzoNobel logistics department. Primary data and site-specific data were retrieved. For electricity used the AkzoNobel electricity country models for 2017 were used for each of the countries where the production site is located. For upstream (raw material processes) and downstream processes (application, use, and waste processing) generic data is used when no specific data is obtained. The construction site data includes lighting, heating, offices, etc. The manufacture of production equipment and infrastructure is not included in the system boundary. Packaging-related flows in the production process and all up-stream packaging are included in the manufacturing module. For the end-of-life packing of the coatings a landfill scenario is assumed.
A4. Transport to Regional Distribution Centre and customer
All coating containers are transported from the manufacturing facilities into a distribution centre and then finally to the customer. On average, the transport characteristics for this life cycle stage are the following:
PARAMETER
MANUFACTURING SITE TO REGIONAL
DISTRIBUTION CENTER (RDC)
RDC TO CUSTOMER
Type Truck 40t-60t payload average fleet
Lorry 34t-40 payload average fleet
Ship: Small Container Ship (coastal boat)
Distance (km) 925.47 1,676.26 951.01 Capacity utilisation 60% 60% 70% Bulk density of transported products
1000 kg/m3 1000 kg/m3 1000 kg/m3

7
ADDITIONAL INFORMATION ON ENVIRONMENTAL IMPACTS
The CML-IA methods do not have characterization factors for the “unspecified VOC” emission flow in the Global Warming Potential environmental impact category. However, VOCs are known to have influence in this category. In order to include the impacts of the VOCs and align with current practice of AkzoNobel, it was decided to calculate the VOC impact on Global Warming Potential separately. The Global Warming Potential impact category has been modified, adding a generic factor of 8 KgCO2-eq/kg VOC, which is in line with AkzoNobel characterisation factors for carbon reporting.
UNIT A1 A2 A3 A4 A5 C2 C4
Global Warming potential (GWP 100 years)
[kg CO2-Eq.]
5.14E+01
2.16E-01
2.95E+00
1.43E+00
3.65E+00
3.96E-02
1.09E+01
Global Warming potential (GWP 100 years) including VOC characterization factor
[kg CO2-Eq.]
5.14E+01
2.16E-01
2.99E+00
1.43E+00
3.75E+00
3.96E-02
1.09E+01
A5. Application and use
This module includes the environmental aspects and impacts associated with the application and of the coating. The use of energy from air spray for coating application purposes is included.
PARAMETER (KWh/ declared unit) Energy for application 0.1
There are some raw materials added in the coating formulations which contain small amounts of solvents. The VOC emissions during application per coating are included in this module.
C2. Transport to incineration or landfill
This module includes one-way transportation distance of the demolition or sorting site to the dump site.
PARAMETER TRANSPORT TO WASTE PROCESSING
Vehicle type Truck 34t-40t payload average fleet
Distance 100 km Capacity utilisation 60% Bulk density of transported products 1000 kg/m3
C3. Waste processing and C4. Disposal The end of life stage is encompassed in these modules. It is assumed that part of the coating is lost during application and the rest is applied. After its lifetime, it is assumed that the coatings end up in incineration. These assumptions are based on best knowledge of the end of life of coating from direct contact with AkzoNobel.
DECLARATION OF SVHC None of the substances contained in the product are listed in the “Candidate List of Substances of Very High Concern for authorisation”, or they do not exceed the threshold with the European Chemicals Agency.

8
REFERENCES • EN 15804:2012+A1:2013 Sustainability of construction works. Environmental product
declarations. Core rules for the product category of construction products, of 11/2013. • ISO 14040/14044 on Life Cycle Assessments • Duncan, Carola., 2018. Personal communication with Carola Duncan, AkzoNobel Protective
Coatings. • Hesselink, S.J. Bas, 2018. Personal communication with Bas Hesselink, AkzoNobel Protective
Coatings. • Akzonobel own latest reviewed database version 2017. • Thinkstep GaBi Software-System and Database for Life Cycle Engineering. Copyright 1992-
2017 thinkstep AG.
REMARKS None