MRO Survey 2014 - Oliver Wyman · MRO SURVEY 2014 SIGNS OF NEW LIFE NEW ... strategic partnering...
16
Aviation, Aerospace & Defense MRO SURVEY 2014 SIGNS OF NEW LIFE NEW PARTNERSHIPS, FRESH HIRING, 3-D PRINTING AUTHORS Chris Spafford, Partner Darryl Rose, Principal
Transcript of MRO Survey 2014 - Oliver Wyman · MRO SURVEY 2014 SIGNS OF NEW LIFE NEW ... strategic partnering...
Aviation, Aerospace & Defense
MRO SURVEY 2014
SIGNS OF NEW LIFENEW PARTNERSHIPS, FRESH HIRING, 3-D PRINTING
AUTHORS
Chris Spafford, Partner
Darryl Rose, Principal
85%of survey respondents said M&A activity or speculation is steady or rising.
EXECUTIVE SUMMARY
Original equipment manufacturers won the
market for high-value, aftermarket aviation
services, leaving independent maintenance,
repair, and overhaul providers scouting for
paths to evolve and grow.
Despite the newfound prominence of
OEMs in their traditional markets, engine
and component MROs are preparing to
fortify their remaining footholds through
strategic partnering and by accelerating
development of unique services. Airframe
MROs, meanwhile, seek to capitalize
on shifts caused by rising labor costs in
emerging economies, long a favored
maintenance destination for US and
Western European fleets.
In our annual survey of airlines, MROs,
and OEMs, we confirmed the disparity in
engine and component maintenance for
new, modern fleets. MROs have all but
ceded this territory to manufacturers, and
independent maintenance providers are
now redefining their search for growth
within this new paradigm. Many, for
example, appear to have either completed or
abandoned pursuits of OEM licenses during
the past year. They are turning to new forms
of collaboration with OEMs and lessors,
while considering mergers and acquisitions
to consolidate high-value capabilities,
increase efficiency, and broaden reach. MROs
continue to deploy serviceable material,
inventory reduction, and other strategies
designed to help customers cut costs.
A shrinking gap in labor rates, combined
with sustained sentiment in favor of
repatriating base maintenance, has slowed
the multi-year pattern of sending aircraft
overseas from developed markets. In the US,
mounting investment in domestic hangar
capacity may in fact herald a long-term
reversal of this trend, suggesting fervent
future demand for technical labor. Hiring is
gaining momentum, and our survey doesn’t
support conventional wisdom that the supply
of skilled labor in the US has weakened. Still,
MROs face the challenge of not only hiring
to handle this growth, but also to replace a
graying workforce.
Looking further out, survey respondents
are divided on how one headline-grabbing
technology, additive manufacturing, or 3-D
printing, will affect the aviation maintenance
market. Our respondents expect expendable
parts will be the most likely use for 3-D
printing in the short term. However, they
have lower expectations for the likelihood of
proprietary materials being manufactured
this way. That suggests industry participants
expect OEMs to protect their technology
from adaptive manufacturing by others.
As always, by responding to the needs of
operators to continually combat rising costs,
creative and proactive MROs can solidify
their grasp on airline customers. Airlines
are anxious to maintain choice in the after-
market, despite the events of the recent
past. By developing value-added services
in niches left unprotected by smaller
manufacturers, employing cost-reduction
options ignored by larger OEMs, and
partnering smartly to alleviate operators’
new pain points, independent providers
can continue to fill a critical role in the ever-
evolving MRO landscape.
Copyright © 2014 Oliver Wyman 2
OPERATOR ENVIRONMENTOEMs Dominate as Airlines Continue to Seek Alternatives
The theme of emerging OEM dominance
in the maintenance aftermarket has been
established in previous versions of this
survey and elsewhere. Clouded by this
multi-year narrative, however, is the still-
strong desire of operators to preserve
material and service alternatives for
maintenance of their fleets. For airlines
seeking to compete and place engine and
component maintenance on next-generation
aircraft, OEMs have largely emerged as
the only choice. Engine and large systems
manufacturers have designed and deployed
effective strategies to restrict alternative
material and repair development by third
party MROs.
Based on our survey, there is limited
expectation among airlines that the current
state of maintenance placement will change
in the near future. When asked where they
expect to place maintenance of new aircraft
engines, 69 percent of operator respondents
say the OEM. MROs fare better on
component maintenance, with 63 percent
of airline respondents selecting them as
likely service providers. However, OEMs
also appear as likely providers of component
services on 44 percent of responses,
suggesting this category is destined to be
served by a mix of MROs and OEMs for most
operators. Momentum here appears to be
very much with the OEMs (Exhibit 1).
Airline responses to our survey, however,
show that operators intend to sustain
maintenance cost reduction efforts
throughout the aircraft life cycle, suggesting
operators will continue to seek OEM
alternatives where still possible. And many
of the ways airlines expect to manage costs
are particularly aligned to the traditional
advantages of MROs. When asked about
reducing costs of engine and component
maintenance (two high-investment,
material-intensive categories that are most
impacted by OEM dominance), airline
respondents highlight strategies MROs
are best positioned to address: reducing
inventory levels (38 percent), developing
serviceable material programs (31 percent)
and developing alternative repairs to reduce
part replacement costs (31 percent). In each
of these, OEMs are fundamentally motivated
to oppose these options, as each reduces
demand for new parts, which carry robust
margins for manufacturers. If MROs continue
to hone and expand these capabilities,
perhaps in deeper partnership with airlines
to gain access to necessary operational and
technical data, they may yet successfully
stem OEM momentum and defend their
remaining market.
69%of operator respondents expect to place maintenance of new engines with OEMs.
Copyright © 2014 Oliver Wyman 3
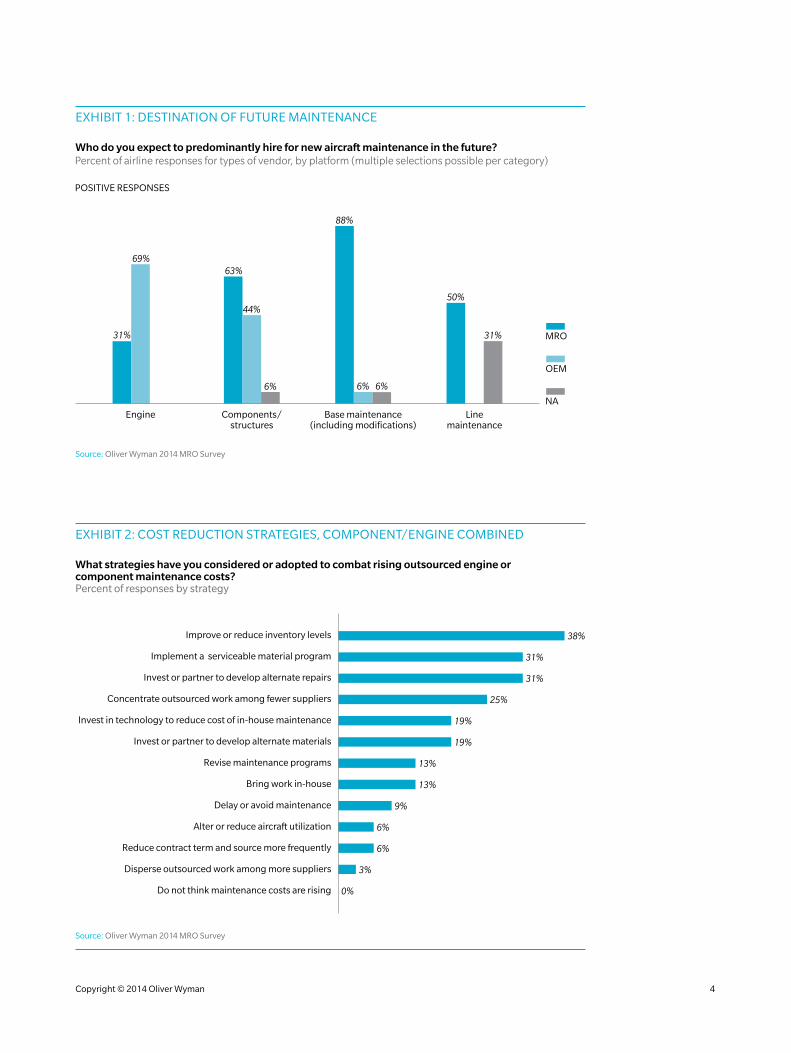
EXHIBIT 1: DESTINATION OF FUTURE MAINTENANCE
Engine Components/structures
Base maintenance(including modifications)
Linemaintenance
POSITIVE RESPONSES
MRO
OEM
NA
31%
69%63%
44%
88%
50%
31%
6% 6% 6%
Who do you expect to predominantly hire for new aircraft maintenance in the future?Percent of airline responses for types of vendor, by platform (multiple selections possible per category)
Source: Oliver Wyman 2014 MRO Survey
EXHIBIT 2: COST REDUCTION STRATEGIES, COMPONENT/ENGINE COMBINED
Improve or reduce inventory levels
Implement a serviceable material program
Invest or partner to develop alternate repairs
Concentrate outsourced work among fewer suppliers
Invest in technology to reduce cost of in-house maintenance
Invest or partner to develop alternate materials
Revise maintenance programs
Bring work in-house
Delay or avoid maintenance
Alter or reduce aircraft utilization
Reduce contract term and source more frequently
Disperse outsourced work among more suppliers
Do not think maintenance costs are rising
38%
31%
31%
25%
19%
19%
13%
13%
9%
6%
6%
3%
0%
What strategies have you considered or adopted to combat rising outsourced engine orcomponent maintenance costs?Percent of responses by strategy
Source: Oliver Wyman 2014 MRO Survey
Copyright © 2014 Oliver Wyman 4
PARTNERING STRATEGIES
56%of MRO respondents said they signed license agreements with OEMs during the last three years, down from 82% last year.
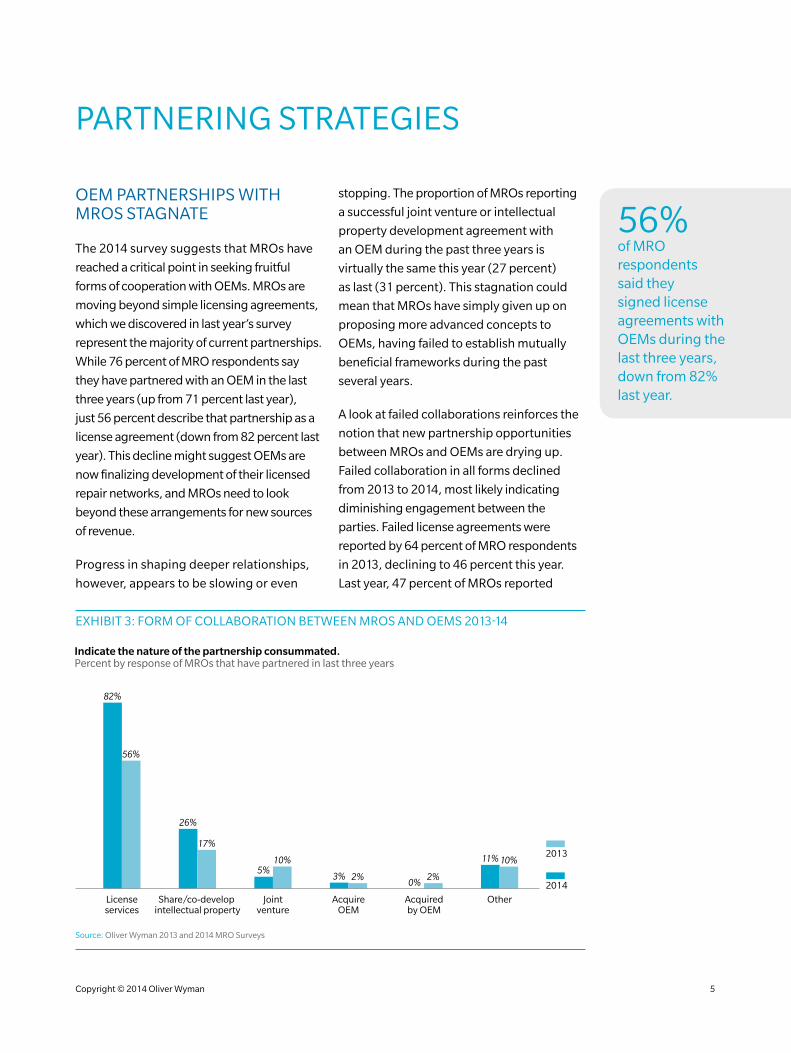
EXHIBIT 3: FORM OF COLLABORATION BETWEEN MROS AND OEMS 2013-14
Licenseservices
Share/co-develop intellectual property
Jointventure
AcquireOEM
Acquiredby OEM
Other
82%
56%
26%
17%
5%10%
3% 2% 2%
11% 10%
0% 2014
2013
Indicate the nature of the partnership consummated.Percent by response of MROs that have partnered in last three years
Source: Oliver Wyman 2013 and 2014 MRO Surveys
OEM PARTNERSHIPS WITH MROS STAGNATE
The 2014 survey suggests that MROs have
reached a critical point in seeking fruitful
forms of cooperation with OEMs. MROs are
moving beyond simple licensing agreements,
which we discovered in last year’s survey
represent the majority of current partnerships.
While 76 percent of MRO respondents say
they have partnered with an OEM in the last
three years (up from 71 percent last year),
just 56 percent describe that partnership as a
license agreement (down from 82 percent last
year). This decline might suggest OEMs are
now finalizing development of their licensed
repair networks, and MROs need to look
beyond these arrangements for new sources
of revenue.
Progress in shaping deeper relationships,
however, appears to be slowing or even
stopping. The proportion of MROs reporting
a successful joint venture or intellectual
property development agreement with
an OEM during the past three years is
virtually the same this year (27 percent)
as last (31 percent). This stagnation could
mean that MROs have simply given up on
proposing more advanced concepts to
OEMs, having failed to establish mutually
beneficial frameworks during the past
several years.
A look at failed collaborations reinforces the
notion that new partnership opportunities
between MROs and OEMs are drying up.
Failed collaboration in all forms declined
from 2013 to 2014, most likely indicating
diminishing engagement between the
parties. Failed license agreements were
reported by 64 percent of MRO respondents
in 2013, declining to 46 percent this year.
Last year, 47 percent of MROs reported
Copyright © 2014 Oliver Wyman 5
discussing, but failing to finalize, a joint
venture in the last three years. This year:
32 percent. Similarly, in 2013, more than
half of MROs indicated trying and failing to
reach intellectual property development
agreements in the last three years, with that
proportion falling to 17 percent this year.
Now that this form of partnering appears
to have reached its peak, many MROs that
failed to secure significant licensing or other
arrangements with OEMs may be looking
for new partnering alternatives. Without
the steady influx of licensed work from OEM
partners, generating new sources of revenue
is imperative for MROs.
LESSORS WANT PARTNERSHIPS, BUT FORM IS UNCLEAR
In last year’s survey we suggested MROs
partner more actively with aircraft lessors
to develop joint aircraft-plus-service value
propositions for airline customers at the
point of aircraft selection. We consider this a
critical juncture in the maintenance selection
process. As OEMs have overwhelmingly
limited the aftermarket alternatives on
new aircraft types, airlines now exploit new
equipment selection as their primary source
of leverage (i.e., pitting manufacturer against
manufacturer). This chain reaction has, by
and large, frozen MROs out of competition for
services on new aircraft. By partnering with
lessors, MROs offering comprehensive labor,
technical, program, and logistics services may
be better able to penetrate these transactions
and gain a foothold in the massive market for
new aircraft maintenance, rather than ceding
further ground to OEMs.
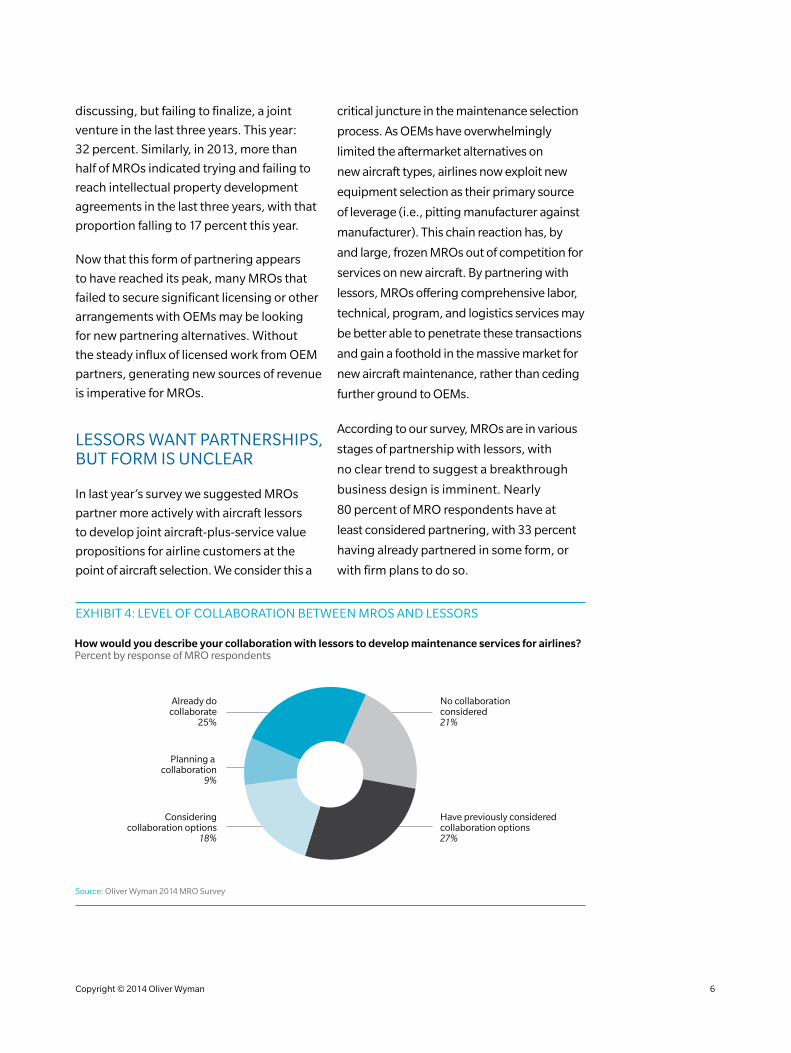
According to our survey, MROs are in various
stages of partnership with lessors, with
no clear trend to suggest a breakthrough
business design is imminent. Nearly
80 percent of MRO respondents have at
least considered partnering, with 33 percent
having already partnered in some form, or
with firm plans to do so.
EXHIBIT 4: LEVEL OF COLLABORATION BETWEEN MROS AND LESSORS
How would you describe your collaboration with lessors to develop maintenance services for airlines?Percent by response of MRO respondents
Already docollaborate
25%
Planning a collaboration
9%
Consideringcollaboration options
18%
Have previously consideredcollaboration options27%
No collaborationconsidered21%
Source: Oliver Wyman 2014 MRO Survey
Copyright © 2014 Oliver Wyman 6
The form of potential future partnerships
between these two constituents, if any, is
unclear. The most common form of current
or contemplated collaboration, per our
MRO respondents, is maintenance of
aircraft at or approaching lease return (61
percent). That’s a simple customer-provider
relationship that does not allow MROs the
broader, earlier access to operators needed
to regain ground in the market. Less than half
of respondents indicate considering lessor
partnerships delivering maintenance to
active fleets (45 percent). Even fewer say
they’ve pondered bundling value-added
niche services that might differentiate
MROs from OEM counterparts, and lessors
from direct competitors. Just 24 percent
report discussing serviceable material
support to active fleets through lessor
channels, and less than 20 percent indicate
discussing provision of program or technical
management services that lessor customers,
particularly smaller operators, often value.
Although a progressive form of collaboration
between these entities remains to be
established, 67 percent of MRO respondents
expect an increasing level of partnership with
lessors during the next five years. This ratio is
consistent with findings in a separate survey of
lessors that Oliver Wyman conducted in 2013,
which found 60 percent of lessor respondents
expected increased collaboration with MROs
during the same period. This is a theme to
watch as MROs search for new avenues to
stability and growth.
67%of MRO respondents expect an increasing level of partnership with lessors during the next five years.
SERVICEABLE MATERIAL STRATEGIESMROs Might See Opportunity to Expand this Strategy
We found a vast majority of airlines have
adopted an active serviceable materials
strategy since OEM emergence, with
84 percent of airline respondents classifying
their approach to serviceable material as
“active” or “comprehensive” (compared with
71 percent last year). A majority of airline
respondents report their use of this material
has grown during the last three years,
though our findings (57 percent this year
and 66 percent in 2013) suggest this strategy
may be reaching a saturation point.
MROs have responded effectively to this
growth in demand, with 79 percent of our
MRO respondents reporting an “active” or
“comprehensive” program and 60 percent
reporting a rise in usage during the past
three years, both figures tightly aligned
with airline findings. The ability of MROs
to identify, source, and harvest serviceable
material provides an edge against OEM
counterparts seeking to serve mature
aircraft. Few OEM respondents (25 percent
in 2014 and 10 percent in 2013) characterize
their own serviceable materials strategy
as “active” or “comprehensive.” This is, of
course, consistent with an OEM’s natural
incentive to sell high-margin new material
and it is unlikely, in our estimation, that
OEMs will soon develop competitive
programs. Anecdotal evidence suggests
some OEMs, however, are active in
constraining serviceable material supply
through aggressive open market buying.
A myriad factors are driving demand for this
material. Prime among these is increasing
availability of feedstock for teardown, buoyed
by retirements of popular modern aircraft
Copyright © 2014 Oliver Wyman 7
types and increasing cost-effectiveness
of part harvesting processes. This factor
is cited by 41 percent of respondents as
a growth driver. Persistently high cost
of new material, particularly in engine
applications, is another common factor,
also cited by 41 percent of respondents.
Additional tailwinds include: availability of
surplus parts (34 percent), which is driven
by global supply chain efficiencies and
component reliability improvements, and
the increasing acceptance among operators
(29 percent), who are historically deterred
by documentation and quality concerns
that are being more effectively addressed as
the industry’s capability improves.
MROs might have a greater opportunity
to expand serviceable material programs.
According to our results, maintenance
providers overstate the importance of certain
obstacles to the broader acceptance of this
strategy. Specifically, while half (51 percent)
of MRO and OEM respondents select
lease return conditions as a hindrance to
broader adoption, only 31 percent of airline
respondents suggest likewise. In separate
research we conducted on this subject,
industry veterans echo this sentiment,
suggesting that, though lessors strictly
monitor power plant content, they are far
more lenient with other systems. This belief is
consistent with our finding that few operators
consider serviceable materials to be a
significant drag on aircraft values. Whereas
32 percent of MRO and OEM respondents
cite this as a hindrance to serviceable
material adoption, only 6 percent of airlines
agree. Naturally, as airlines increasingly
accept serviceable material as operators, it
stands to reason they will equally accept it as
future aircraft buyers.
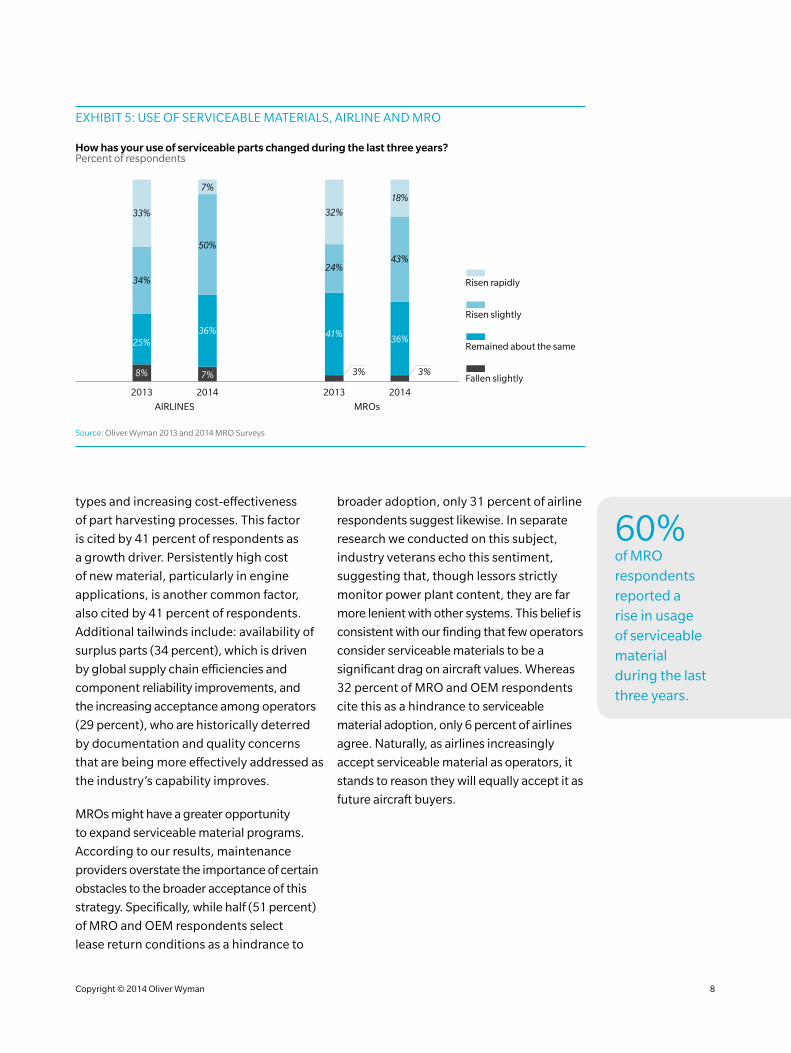
EXHIBIT 5: USE OF SERVICEABLE MATERIALS, AIRLINE AND MRO
2013 2014 2013 2014
Fallen slightly
Remained about the same
Risen slightly
Risen rapidly
AIRLINES MROs
8% 7%
25%
34%
36%
50%
7%
32%
24%
41%
3%
36%
43%
18%
33%
3%
How has your use of serviceable parts changed during the last three years?Percent of respondents
Source: Oliver Wyman 2013 and 2014 MRO Surveys
60%of MRO respondents reported a rise in usage of serviceable material during the last three years.
Copyright © 2014 Oliver Wyman 8
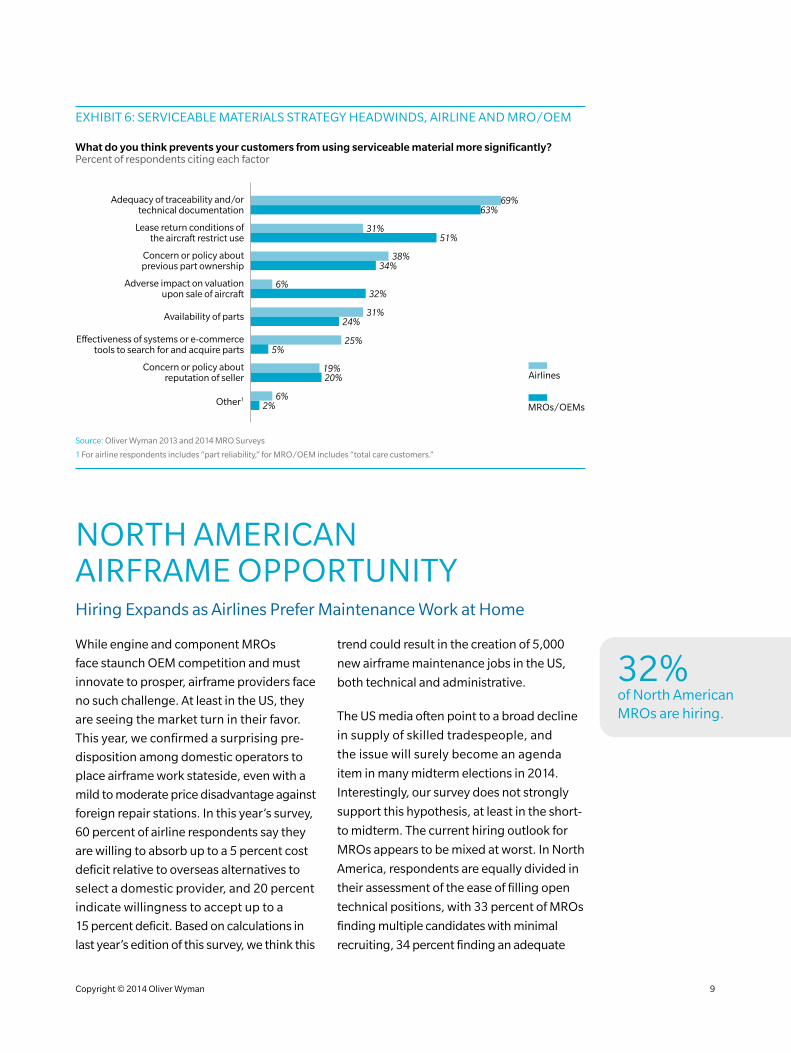
EXHIBIT 6: SERVICEABLE MATERIALS STRATEGY HEADWINDS, AIRLINE AND MRO/OEM
Adequacy of traceability and/or technical documentation
Lease return conditions ofthe aircraft restrict use
Concern or policy aboutprevious part ownership
Adverse impact on valuationupon sale of aircraft
Availability of parts
Effectiveness of systems or e-commerce tools to search for and acquire parts
Concern or policy aboutreputation of seller
Other1
69% 63%
PERCENT OF RESPONDENTS CITING EACH FACTOR
MROs/OEMs
Airlines
31% 51%
38% 34%
32%
31% 24%
25%
19% 20%
5%
6% 2%
6%
What do you think prevents your customers from using serviceable material more significantly?Percent of respondents citing each factor
Source: Oliver Wyman 2013 and 2014 MRO Surveys
1 For airline respondents includes “part reliability,” for MRO/OEM includes “total care customers.”
NORTH AMERICAN AIRFRAME OPPORTUNITYHiring Expands as Airlines Prefer Maintenance Work at Home
While engine and component MROs
face staunch OEM competition and must
innovate to prosper, airframe providers face
no such challenge. At least in the US, they
are seeing the market turn in their favor.
This year, we confirmed a surprising pre-
disposition among domestic operators to
place airframe work stateside, even with a
mild to moderate price disadvantage against
foreign repair stations. In this year’s survey,
60 percent of airline respondents say they
are willing to absorb up to a 5 percent cost
deficit relative to overseas alternatives to
select a domestic provider, and 20 percent
indicate willingness to accept up to a
15 percent deficit. Based on calculations in
last year’s edition of this survey, we think this
trend could result in the creation of 5,000
new airframe maintenance jobs in the US,
both technical and administrative.
The US media often point to a broad decline
in supply of skilled tradespeople, and
the issue will surely become an agenda
item in many midterm elections in 2014.
Interestingly, our survey does not strongly
support this hypothesis, at least in the short-
to midterm. The current hiring outlook for
MROs appears to be mixed at worst. In North
America, respondents are equally divided in
their assessment of the ease of filling open
technical positions, with 33 percent of MROs
finding multiple candidates with minimal
recruiting, 34 percent finding an adequate
32%of North American MROs are hiring.
Copyright © 2014 Oliver Wyman 9
supply of candidates with intense recruiting,
and 33 percent reporting a shortage
of candidates with intense recruiting.
Western European respondents, despite
less workforce expansion, actually report
a more challenging hiring environment,
with 46 percent of respondents indicating
an “adequate” supply of candidates and 39
percent finding “few” candidates, even with
intense recruiting efforts.
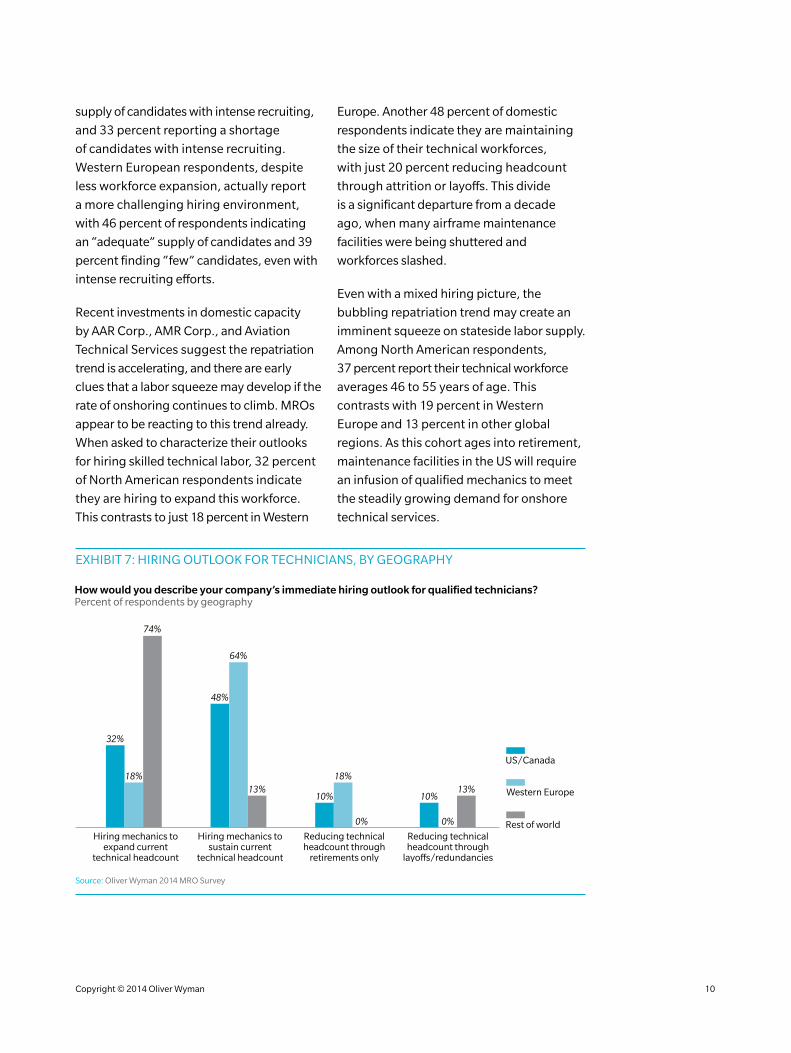
Recent investments in domestic capacity
by AAR Corp., AMR Corp., and Aviation
Technical Services suggest the repatriation
trend is accelerating, and there are early
clues that a labor squeeze may develop if the
rate of onshoring continues to climb. MROs
appear to be reacting to this trend already.
When asked to characterize their outlooks
for hiring skilled technical labor, 32 percent
of North American respondents indicate
they are hiring to expand this workforce.
This contrasts to just 18 percent in Western
Europe. Another 48 percent of domestic
respondents indicate they are maintaining
the size of their technical workforces,
with just 20 percent reducing headcount
through attrition or layoffs. This divide
is a significant departure from a decade
ago, when many airframe maintenance
facilities were being shuttered and
workforces slashed.
Even with a mixed hiring picture, the
bubbling repatriation trend may create an
imminent squeeze on stateside labor supply.
Among North American respondents,
37 percent report their technical workforce
averages 46 to 55 years of age. This
contrasts with 19 percent in Western
Europe and 13 percent in other global
regions. As this cohort ages into retirement,
maintenance facilities in the US will require
an infusion of qualified mechanics to meet
the steadily growing demand for onshore
technical services.
EXHIBIT 7: HIRING OUTLOOK FOR TECHNICIANS, BY GEOGRAPHY
32%
18%
74%
48%
64%
13%10%
18%
0% 0%
10%13%
US/Canada
Western Europe
Rest of worldHiring mechanics to
expand current technical headcount
Hiring mechanics to sustain current
technical headcount
Reducing technical headcount through
retirements only
Reducing technical headcount through
layoffs/redundancies
HIRING OUTLOOK
How would you describe your company’s immediate hiring outlook for qualified technicians?Percent of respondents by geography
Source: Oliver Wyman 2014 MRO Survey
Copyright © 2014 Oliver Wyman 10
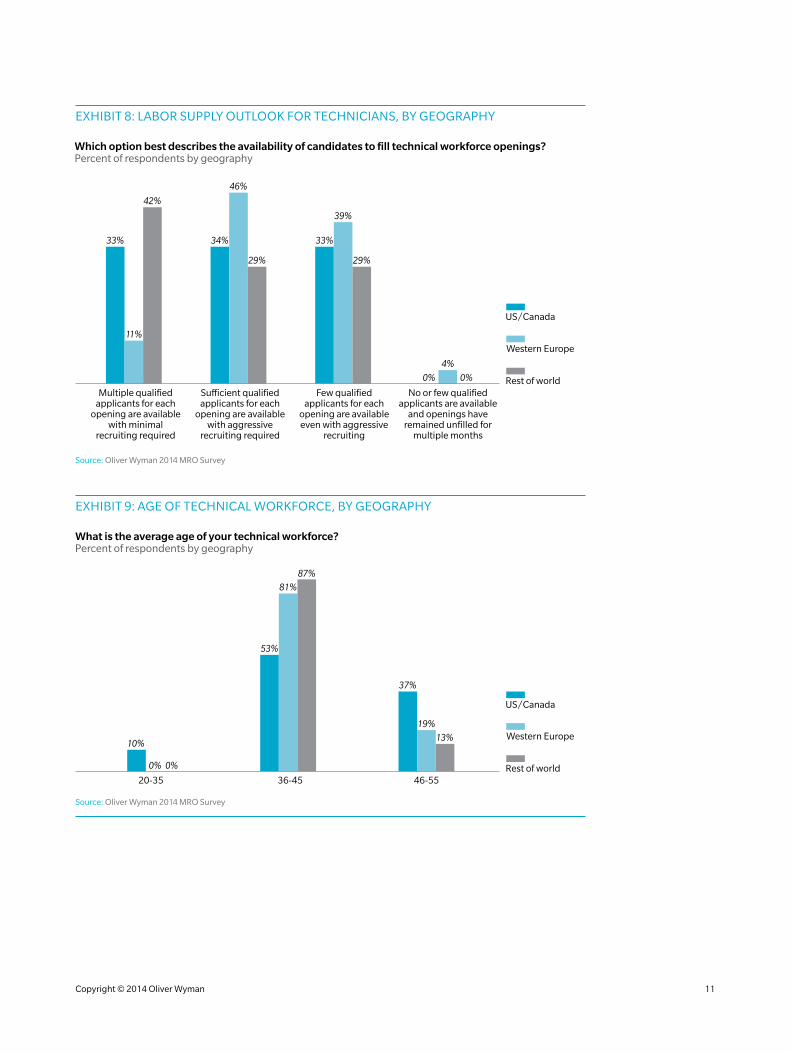
EXHIBIT 8: LABOR SUPPLY OUTLOOK FOR TECHNICIANS, BY GEOGRAPHY
33%
11%
42%
34%
46%
29%
33%
39%
29%
4%
0% 0%
US/Canada
Western Europe
Rest of worldMultiple qualified
applicants for each opening are available
with minimal recruiting required
Sufficient qualified applicants for each
opening are available with aggressive
recruiting required
Few qualified applicants for each
opening are available even with aggressive
recruiting
No or few qualified applicants are available
and openings have remained unfilled for
multiple months
HIRING OUTLOOK
Which option best describes the availability of candidates to fill technical workforce openings?Percent of respondents by geography
Source: Oliver Wyman 2014 MRO Survey
EXHIBIT 9: AGE OF TECHNICAL WORKFORCE, BY GEOGRAPHY
87%
81%
53%
37%
19%13%
10%
US/Canada
Western Europe
Rest of world20-35 36-45 46-55
AGE OF WORKFORCE
0% 0%
What is the average age of your technical workforce?Percent of respondents by geography
Source: Oliver Wyman 2014 MRO Survey
Copyright © 2014 Oliver Wyman 11
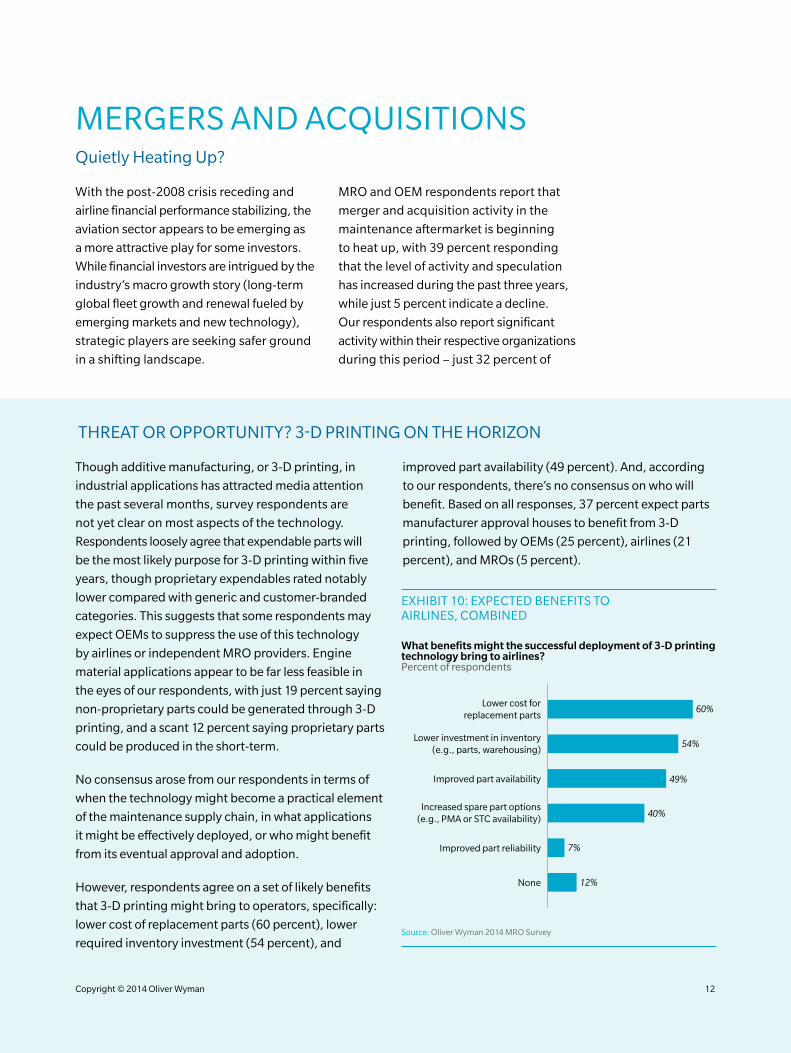
Though additive manufacturing, or 3-D printing, in
industrial applications has attracted media attention
the past several months, survey respondents are
not yet clear on most aspects of the technology.
Respondents loosely agree that expendable parts will
be the most likely purpose for 3-D printing within five
years, though proprietary expendables rated notably
lower compared with generic and customer-branded
categories. This suggests that some respondents may
expect OEMs to suppress the use of this technology
by airlines or independent MRO providers. Engine
material applications appear to be far less feasible in
the eyes of our respondents, with just 19 percent saying
non-proprietary parts could be generated through 3-D
printing, and a scant 12 percent saying proprietary parts
could be produced in the short-term.
No consensus arose from our respondents in terms of
when the technology might become a practical element
of the maintenance supply chain, in what applications
it might be effectively deployed, or who might benefit
from its eventual approval and adoption.
However, respondents agree on a set of likely benefits
that 3-D printing might bring to operators, specifically:
lower cost of replacement parts (60 percent), lower
required inventory investment (54 percent), and
improved part availability (49 percent). And, according
to our respondents, there’s no consensus on who will
benefit. Based on all responses, 37 percent expect parts
manufacturer approval houses to benefit from 3-D
printing, followed by OEMs (25 percent), airlines (21
percent), and MROs (5 percent).
THREAT OR OPPORTUNITY? 3-D PRINTING ON THE HORIZON
EXHIBIT 10: EXPECTED BENEFITS TO AIRLINES, COMBINED
Lower cost for replacement parts
Lower investment in inventory(e.g., parts, warehousing)
Improved part availability
Increased spare part options(e.g., PMA or STC availability)
Improved part reliability
None
60%
54%
40%
7%
12%
49%
What benefits might the successful deployment of 3-D printing technology bring to airlines?Percent of respondents
Source: Oliver Wyman 2014 MRO Survey
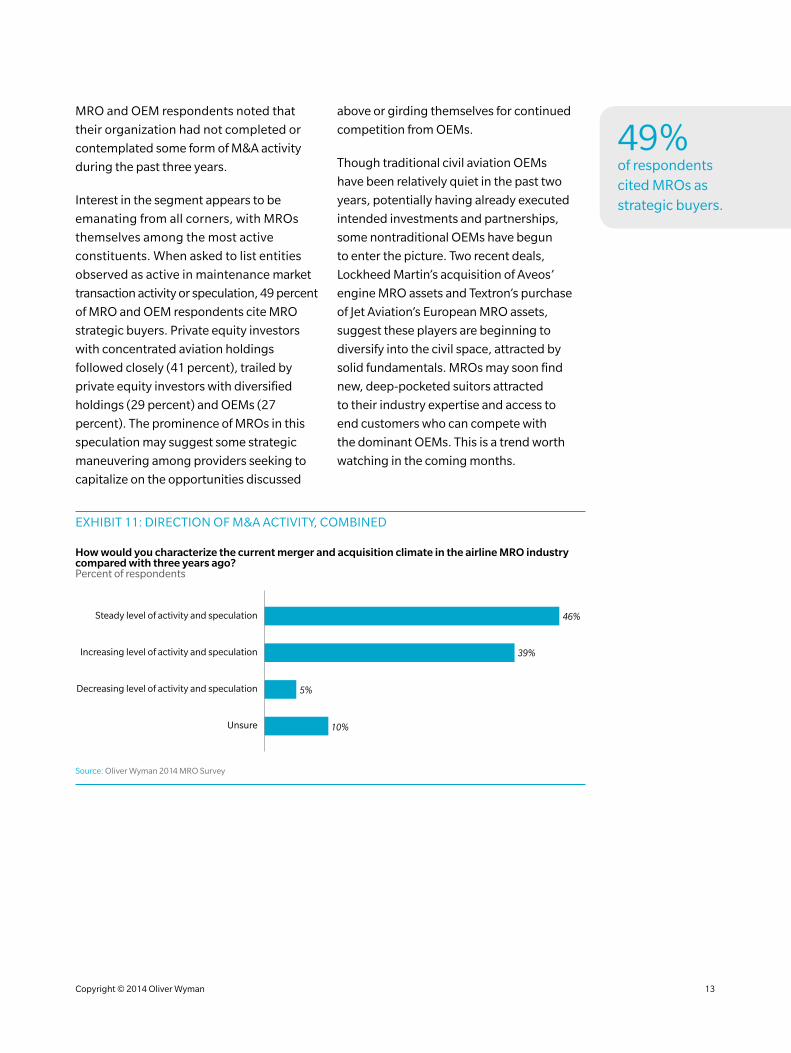
MERGERS AND ACQUISITIONSQuietly Heating Up?
With the post-2008 crisis receding and
airline financial performance stabilizing, the
aviation sector appears to be emerging as
a more attractive play for some investors.
While financial investors are intrigued by the
industry’s macro growth story (long-term
global fleet growth and renewal fueled by
emerging markets and new technology),
strategic players are seeking safer ground
in a shifting landscape.
MRO and OEM respondents report that
merger and acquisition activity in the
maintenance aftermarket is beginning
to heat up, with 39 percent responding
that the level of activity and speculation
has increased during the past three years,
while just 5 percent indicate a decline.
Our respondents also report significant
activity within their respective organizations
during this period – just 32 percent of
Copyright © 2014 Oliver Wyman 12
MRO and OEM respondents noted that
their organization had not completed or
contemplated some form of M&A activity
during the past three years.
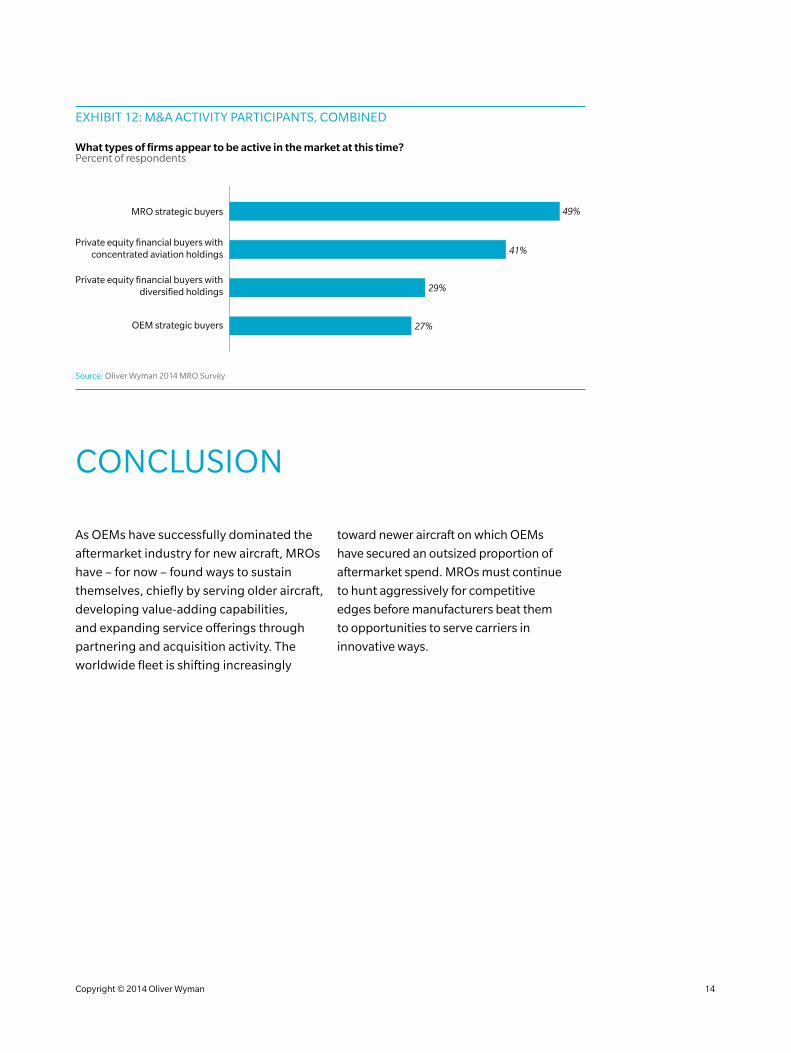
Interest in the segment appears to be
emanating from all corners, with MROs
themselves among the most active
constituents. When asked to list entities
observed as active in maintenance market
transaction activity or speculation, 49 percent
of MRO and OEM respondents cite MRO
strategic buyers. Private equity investors
with concentrated aviation holdings
followed closely (41 percent), trailed by
private equity investors with diversified
holdings (29 percent) and OEMs (27
percent). The prominence of MROs in this
speculation may suggest some strategic
maneuvering among providers seeking to
capitalize on the opportunities discussed
above or girding themselves for continued
competition from OEMs.
Though traditional civil aviation OEMs
have been relatively quiet in the past two
years, potentially having already executed
intended investments and partnerships,
some nontraditional OEMs have begun
to enter the picture. Two recent deals,
Lockheed Martin’s acquisition of Aveos’
engine MRO assets and Textron’s purchase
of Jet Aviation’s European MRO assets,
suggest these players are beginning to
diversify into the civil space, attracted by
solid fundamentals. MROs may soon find
new, deep-pocketed suitors attracted
to their industry expertise and access to
end customers who can compete with
the dominant OEMs. This is a trend worth
watching in the coming months.
EXHIBIT 11: DIRECTION OF M&A ACTIVITY, COMBINED
Steady level of activity and speculation
Increasing level of activity and speculation
Decreasing level of activity and speculation
Unsure
46%
39%
10%
5%
How would you characterize the current merger and acquisition climate in the airline MRO industrycompared with three years ago?Percent of respondents
Source: Oliver Wyman 2014 MRO Survey
49%of respondents cited MROs as strategic buyers.
Copyright © 2014 Oliver Wyman 13
CONCLUSION
As OEMs have successfully dominated the
aftermarket industry for new aircraft, MROs
have – for now – found ways to sustain
themselves, chiefly by serving older aircraft,
developing value-adding capabilities,
and expanding service offerings through
partnering and acquisition activity. The
worldwide fleet is shifting increasingly
toward newer aircraft on which OEMs
have secured an outsized proportion of
aftermarket spend. MROs must continue
to hunt aggressively for competitive
edges before manufacturers beat them
to opportunities to serve carriers in
innovative ways.
EXHIBIT 12: M&A ACTIVITY PARTICIPANTS, COMBINED
MRO strategic buyers
Private equity financial buyers with concentrated aviation holdings
Private equity financial buyers with diversified holdings
OEM strategic buyers
49%
41%
27%
29%
What types of firms appear to be active in the market at this time?Percent of respondents
Source: Oliver Wyman 2014 MRO Survey
Copyright © 2014 Oliver Wyman 14
ABOUT THE SURVEY
Going on its second decade, the annual MRO survey produced by Oliver Wyman is an industry standard for information about
changing trends in the MRO sector. The survey queries leaders across the MRO industry, including top executives from airline operations,
procurement and engineering departments, captive and independent maintenance providers, OEM aftermarket divisions, and
financing and leasing professionals.
This year, more than 80 percent of respondents hold positions of director or higher. Roughly half of the respondents work for entities in
North America, while 34 percent are in Europe, 7 percent in Asia and 2 percent in the Middle East and Latin America. Interestingly, this year,
the airline population was particularly balanced across self-reported carrier types, with traditional network and low-cost representing one
quarter of respondents, blended network, regional, and cargo carriers at almost 20 percent each, and regional-only carriers representing
13 percent of respondents.
If you are interested in participating in next year’s survey please contact Birgit Andersen at [email protected].
RECENT PUBLICATIONS FROM OLIVER WYMAN
For these publications and other inquiries, please visit www.oliverwyman.com.
TEN IDEAS FROM OLIVER WYMANAt Oliver Wyman, we love ideas. In this collection of articles, we showcase 10 ideas from across our firm for how business leaders can improve and grow their businesses without taking on excessive risk.
THE OLIVER WYMAN TRANSPORT & LOGISTICS JOURNALA publication that discusses issues facing global transportation and logistics industries.
PERSPECTIVES ON MANUFACTURING INDUSTRIESA collection of viewpoints on challenges for industrial companies, as well as opportunities and potential courses of action.
THE OLIVER WYMAN RISK JOURNAL VOL. 3A collection of perspectives on the complex risks that are determining many companies’ futures.
AUTOMOTIVE MANAGERA magazine for automotive industry leaders that provides insights on trends, prospects, and improvements for manufacturers, suppliers, and dealers.
WORLD ENERGY TRILEMMAThis report, prepared by the World Energy Council with Oliver Wyman’s Global Risk Center, argues that policymakers and energy industry executives must work together to make sustainable energy systems a reality.
Copyright © 2014 Oliver Wyman 15
ABOUT OLIVER WYMAN
Oliver Wyman is a global leader in management consulting. With offices in 50+ cities across 25 countries, Oliver Wyman combines deep industry knowledge with specialized expertise in strategy, operations, risk management, and organization transformation. The firm’s 3,000 professionals help clients improve their operations and risk profiles and accelerate their organizational performance to seize the most attractive opportunities. Oliver Wyman is a wholly owned subsidiary of Marsh & McLennan Companies [NYSE: MMC]. For more information, visit www.oliverwyman.com. Follow Oliver Wyman on Twitter @OliverWyman.
ABOUT OUR AVIATION, AEROSPACE & DEFENSE PRACTICE
Oliver Wyman’s global Aviation, Aerospace & Defense practice helps passenger and cargo carriers, OEM and parts manufacturers, aerospace/defense companies, airports, MROs, and other service providers develop growth strategies, improve operations, and maximize organizational effectiveness. Our deep industry expertise and our specialized capabilities make us a leader in serving the needs of the industry. Also, Oliver Wyman offers a powerful suite of industry data and analytical tools to drive key business insights through www.planestats.com.
For more information on this report, please contact:
CHRIS [email protected]
GREG COLGANGeneral Manager, [email protected]
ROGER LEHMANPractice [email protected]
David Washburn, Matthew Rabson, Robyn Larson, and Robert Rein also contributed to this research report.
Copyright © 2014 Oliver Wyman
All rights reserved. This report may not be reproduced or redistributed, in whole or in part, without the written permission of Oliver Wyman and Oliver Wyman accepts no liability whatsoever for the actions of third parties in this respect.
The information and opinions in this report were prepared by Oliver Wyman. This report is not investment advice and should not be relied on for such advice or as a substitute for consultation with professional accountants, tax, legal or financial advisors. Oliver Wyman has made every effort to use reliable, up-to-date and comprehensive information and analysis, but all information is provided without warranty of any kind, express or implied. Oliver Wyman disclaims any responsibility to update the information or conclusions in this report. Oliver Wyman accepts no liability for any loss arising from any action taken or refrained from as a result of information contained in this report or any reports or sources of information referred to herein, or for any consequential, special or similar damages even if advised of the possibility of such damages. The report is not an offer to buy or sell securities or a solicitation of an offer to buy or sell securities. This report may not be sold without the written consent of Oliver Wyman.
www.oliverwyman.com