MRI-based radiomics nomogram to predict intraoperative ...
23
MRI-based radiomics nomogram to predict intraoperative hemorrhage of placenta previa Shunyu Hou The Aィliated Suzhou Hospital of Nanjing Medical University Ye Song The Aィliated Suzhou Hospital of Nanjing Medical University Yongmei Li The Aィliated Suzhou Hospital of Nanjing Medical University Dali Chen The Aィliated Suzhou Hospital of Nanjing Medical University Qi Xi The Aィliated Suzhou Hospital of Nanjing Medical University Yun Wang The Aィliated Suzhou Hospital of Nanjing Medical University Liping Zhou The Aィliated Suzhou Hospital of Nanjing Medical University Yidong Gu The Aィliated Suzhou Hospital of Nanjing Medical University Yun Qu The Aィliated Suzhou Hospital of Nanjing Medical University Yongfei Yue ( [email protected] ) The Aィliated Suzhou Hospital of Nanjing Medical University Research Article Keywords: Placenta previa, Magnetic resonance imaging, Nomogram Posted Date: May 5th, 2021 DOI: https://doi.org/10.21203/rs.3.rs-457028/v1 License: This work is licensed under a Creative Commons Attribution 4.0 International License. Read Full License
Transcript of MRI-based radiomics nomogram to predict intraoperative ...

MRI-based radiomics nomogram to predictintraoperative hemorrhage of placenta previaShunyu Hou
The A�liated Suzhou Hospital of Nanjing Medical UniversityYe Song
The A�liated Suzhou Hospital of Nanjing Medical UniversityYongmei Li
The A�liated Suzhou Hospital of Nanjing Medical UniversityDali Chen
The A�liated Suzhou Hospital of Nanjing Medical UniversityQi Xi
The A�liated Suzhou Hospital of Nanjing Medical UniversityYun Wang
The A�liated Suzhou Hospital of Nanjing Medical UniversityLiping Zhou
The A�liated Suzhou Hospital of Nanjing Medical UniversityYidong Gu
The A�liated Suzhou Hospital of Nanjing Medical UniversityYun Qu
The A�liated Suzhou Hospital of Nanjing Medical UniversityYongfei Yue ( [email protected] )
The A�liated Suzhou Hospital of Nanjing Medical University
Research Article
Keywords: Placenta previa, Magnetic resonance imaging, Nomogram
Posted Date: May 5th, 2021
DOI: https://doi.org/10.21203/rs.3.rs-457028/v1
License: This work is licensed under a Creative Commons Attribution 4.0 International License. Read Full License

MRI-based radiomics nomogram to predict intraoperative hemorrhage of
placenta previa
Shunyu Hou1#, Ye Song1#, Yongmei Li1, Dali Chen1, Qi Xi1, Yun Wang1, Liping Zhou1,
Yidong Gu2, Yun Qu1,Yongfei Yue 1* 1Department of Obstetrics and Gynecology, The Affiliated Suzhou Hospital of
Nanjing Medical University, Suzhou Municipal Hospital, Suzhou, Jiangsu, China 2Department of Medical Ultrasound, The Affiliated Suzhou Hospital of Nanjing
Medical University, Suzhou Municipal Hospital, Suzhou, Jiangsu, China *Corresponding author at: Department of Obstetrics and Gynecology, The Affiliated
Suzhou Hospital of Nanjing Medical University, Suzhou Municipal Hospital, No. 26
Daoqian Street, Gusu District, Suzhou, Jiangsu, 215002, China.
E-mail address: [email protected]
# Shunyu Hou and Ye Song contributed equally to this work

MRI-based radiomics nomogram to predict intraoperative hemorrhage of
placenta previa
Abstract
Purpose: Placenta previa is associated with higher percentage of intraoperative and
postpartum hemorrhage, increased obstetric hysterectomy, significant maternal
morbidity and mortality. We aimed to develop and validate a magnetic resonance
imaging (MRI)-based nomogram to preoperative prediction of intraoperative
hemorrhage (IPH) for placenta previa, which might contribute to adequate assessment
and preoperative preparation for the obstetricians.
Methods: Between May 2015 and December 2019, a total of 125 placenta previa
pregnant women were divided into a training set (n = 80) and a validation set (n = 45).
Radiomics features were extracted from MRI images of each patient. A MRI-based
model comprising seven features was built for the classification of patients into IPH
and non-IPH groups in a training set and validation set. Multivariate nomograms
based on logistic regression analyses were built according to radiomics features.
Receiver operating characteristic (ROC) curve was used to assess the model.
Predictive accuracy of nomogram were assessed by calibration plots and decision
curve analysis.
Results: In multivariate analysis, placenta position, placenta thickness, cervical blood
sinus and placental signals in the cervix were signifcantly independent predictors for
IPH (all p < 0.05). The MRI-based nomogram showed favorable discrimination
between IPH and non-IPH groups. The calibration curve showed good agreement
between the estimated and the actual probability of IPH. Decision curve analysis also
showed a high clinical benefit across a wide range of probability thresholds. The AUC
was 0.918 ( 95% CI, 0.857-0.979 ) in the training set and 0.866( 95% CI, 0.748-0.985 )
in the validation set by the combination of four MRI features.
Conclusions: The MRI-based nomograms might be a useful tool for the preoperative
prediction of IPH outcomes for placenta previa. Our study enables obstetricians to
perform adequate preoperative evaluation to minimize blood loss and reduce the rate

of caesarean hysterectomy.
Key words: Placenta previa, Magnetic resonance imaging, Nomogram
Introduction
Placenta previa (PP) is characterized by the abnormal placenta overlying the
lower uterine segment, and it is known as one of the most serious obstetric
complication[1].The incidence of PP is about 3.5 to 4.6 per 1000 pregnancies[2]. About
10 percent of patients have placenta accrete in PP pregnancies. The exact
pathophysiology of PP is not exactly known. The incidence of PP and placenta accreta
is increasing due to abortion, cesarean section and other uterine surgical history. Over
the past 40 years, the incidence of placenta accreta increased year by year with the
concomitant increasing rate of caesarean section[3]. When the placenta attaches to the
damaged endometrium, the chorionic villi easily invades the myometrium and
placenta implantation occurs.
PP is divided into four types according to the distance between the placenta and
the cervix: low-lying placenta, marginal placenta, partial placenta and complete
placenta previa[4]. PP is commonly diagnosed by ultrasound sonography or magnetic
resonance imaging (MRI) in the third trimester[5]. Ultrasound is the preferred
procedure for evaluting placental position and placenta accreta, but is limited in some
cases, such as patients with abdominal fat hypertrophy and posterior placenta. MRI
was used widely in recent years[6], which can clearly define the position of placenta
and the situation of adjacent organs of uterus, and give doctors more detailed
preoperative evaluation[7]. A large number of studies have shown that MRI has high
sensitivity and specificity in the diagnosis of placenta accreta (sensitivity,82.2–100%;
specificity, 84.0–100%)[8,9]. Due to the thinning uterine segment, PP is often
combined with placenta accreta or increta. Placenta accreta is associated with high
incidence of life threatening intrapartum and postpartum haemorrhage, need for blood
transfusion and hysterectomy, which is considered a severe complication of pregnancy,
and even death[10,11,12]. In addition, women with PP has a serious threat on fetal health,
such as delivery premature, fetal distress, neonatal intensive care (NICU) admission,

stillbirth and neonatal death[13].
Our hospital is a treatment center for high-risk pregnant women, and most of the
pregnant women with PP around our hospital were referred to our hospital for delivery.
Through the treatment of a large number of pregnant women with PP, we have
accumulated some experience in treatment. A well planned multidisciplinary team
approach could reduce intraoperative hemorrhage and minimize the potential risks of
maternal mortality. Thus, an accurate prenatal diagnosis and evaluation of PP is
imperative. Hence, in this study, we sought to develop a MRI signature nomogram to
predict IPH in patients with PP.
Methods
Patients selection
This retrospective study was approved by the Ethics Review Board of the
affiliated Suzhou hospital of Nanjing medical university, all methods were carried out
in accordance with relevant guidelines and regulations. The Ethics Review Board of
the affiliated Suzhou hospital of Nanjing medical university waived the need for
informed consent. Given the retrospective study and anonymous patient data, the
requirement for informed content was waived. A total of 125 consecutive patients
with PP who were treated from May 2015 to December 2019 were enrolled in our
study, according to the following inclusion criteria: (i) All pregnant women received
regular prenatal examinations and deliveried in our hospital; (ii) Pelvic MRI was
performed before caesarean section; (iii) availability of clinical characteristics.
Patients excluded are those unable to undergo MRI (n=51), marginal placenta previa
(n=92) and delivery in other hospitals (n=67). Finally, a total of 125 patients were
enrolled in the study. Archived clinical data, such as age at the time of delivery, BMI,
gestational age by MRI, amount of blood transfusion, operative time and caesarean
hysterectomy were extracted from reviewing the medical records (Figure 1).

Figure 1. Flow chart of patients with placenta previa included in the study.
Standard of reference
Severe postpartum hemorrhage may occur in PP patients after removal of the
placenta in cesarean section. Intraoperative blood loss is an important indicator of the
severity of PP. Normal parturient can tolerate 1000 milliliters (ml) of blood loss, when
the volume of blood loss is more than 2000 ml, the parturient may be in a state of
shock, which will seriously threaten the life of parturient. We need a multidisciplinary
approach to maternal rescue, so the cutoff value of IPH was set at 2000 ml in our
study. The IPH group was defned as cesarean section with massive intraoperative
bleeding ( ≥ 2000 ml). The non-IPH group was defned as cesarean section with minor
intraoperative bleeding ( < 2000 ml).
MRI data acquisition
Before cesarean delivery, all patients were performed pelvic MRI using a 3.0 T
MRI system (Siemens Medical Solutions, Erlangen, Germany). The informed consent
was signed before the MRI examination. The imaging protocol included three plane
(sagittal, coronal and axial ) T1-weighted and T2-weighted images of the pelvis. MRI
Patients with placenta previa who were diagnosed in our hospital
from May 2015 to December 2019 (n=335)
Exclusion: - Marginal placenta previa (n=92) - Did not undergo MRI examination (n=51) - Did not delivery in our hospital (n=67)
A total of 125 MRIs of 335 patients
Training chort (n=80)
Validation chort (n=45)
Inclusion: -Patients confirmed by MRI (n=125)

images were retrospectively interpreted by three experienced radiologists on reading
PP MRI. The signs of PP were analyzed by MRI, an MRI model was constructed by
using only the typical features extracted from the MRI. We established a high risk
table for MRI features of IPH, and radiologists evaluated MRI image according to the
figure (Figure 2). Any disagreement in the process of interpretation was resolved by
the senior radiologist. For convenience of clinical application, a MRI based
nomogram was constructed from the logistic regression model to predict the risk of
IPH.
Figure 2. Different imaging characteristics of MRI in placenta previa patients. A. Placenta thickness: The thickness of placenta is 10.31cm (Sagittal T2-weighted).
B. Bladder line: The bladder line is blurred and unclear (red arrow), invasion signs of bladder (Coronal
T2-weighted).
C. Placenta pit: Dark band in placenta (red arrow), intraplacental abnormal vascularity signs (Sagittal
T2-weighted).
D. Cervical blood sinus: Dark band in cervix (red arrow), enlarged and tortuous vessels signs (Sagittal
T2-weighted).
E. Cervical form: The cervix is regular and complete (red arrow) (Sagittal T2-weighted).

F. Placental signals in the cervix: The signal of the cervix is consistent with that of the placenta(red arrow), sings
of placenta implanted in cervix (Sagittal T2-weighted).
Data analysis and statistics
The multivariate binary logistic regression, nomogram construction and
calibration plots were done with R software ( https://www.r-project.org/ ). Other
statistical analysis was performed using SPSS 23.0 and a two sided p-value < 0.05
was considered significant. The differences in continuous variables were analyzed by
Kruskal-Wallis test, whereas the differences in the categorical variables were assessed
by Pearson χ2 test or Fisher exact test. Univariate and multivariate logistic regression
analysis was performed to identify independent factors associated with IPH > 2000 ml.
Multivariate logistic regression model was used to construct the nomograms. Feature
selection and model construction were only performed on the training cohort, and the
validation cohort only for evaluating the model performance.
Results
Clinical characteristics of the patients
Among the 125 patients, we analyzed 30 patients with IPH > 2000 ml and 95
patients without. The clinical characteristics of patients in the training set, validation
set, IPH and non-IPH group were listed in Table 1 and Table 2. The training and
validation sets were similar in terms of the baseline clinical characteristics (p > 0.05).
Statistical differences were found between IPH and non-IPH group in gravidity, parity,
GA at Delivery, amount of blood transfusion, operative time, IPH, caesarean
hysterectomy and NICU admission (p < 0.05). Table 1. Clinical characteristics of pregnant women with placenta previa.
Training set(n=80) Validation set(n=45)
IPH Non-IPH p-value IPH Non-IPH p-value
Parameter (n=19) (n=61) (n=11) (n=34)
Age at delivery(years) 32.95±2.95 31.26±4.35 0.119 32.64±4.48 32.00±3.91 0.653
BMI before delivery (kg/m2) 27.71±4.20 25.94±2.91 0.099 26.46±4.75 25.91±4.07 0.713
Gravidity 4.00±1.60 3.13±1.20 0.013 5.45±4.32 3.29±1.71 0.020
Parity 2.32±0.58 1.85±0.57 0.003 2.27±0.65 1.71±0.46 0.003
GA at Delivery (week) 34.91±1.07 35.60±1.20 0.001 35.68±0.70 36.67±0.83 0.001
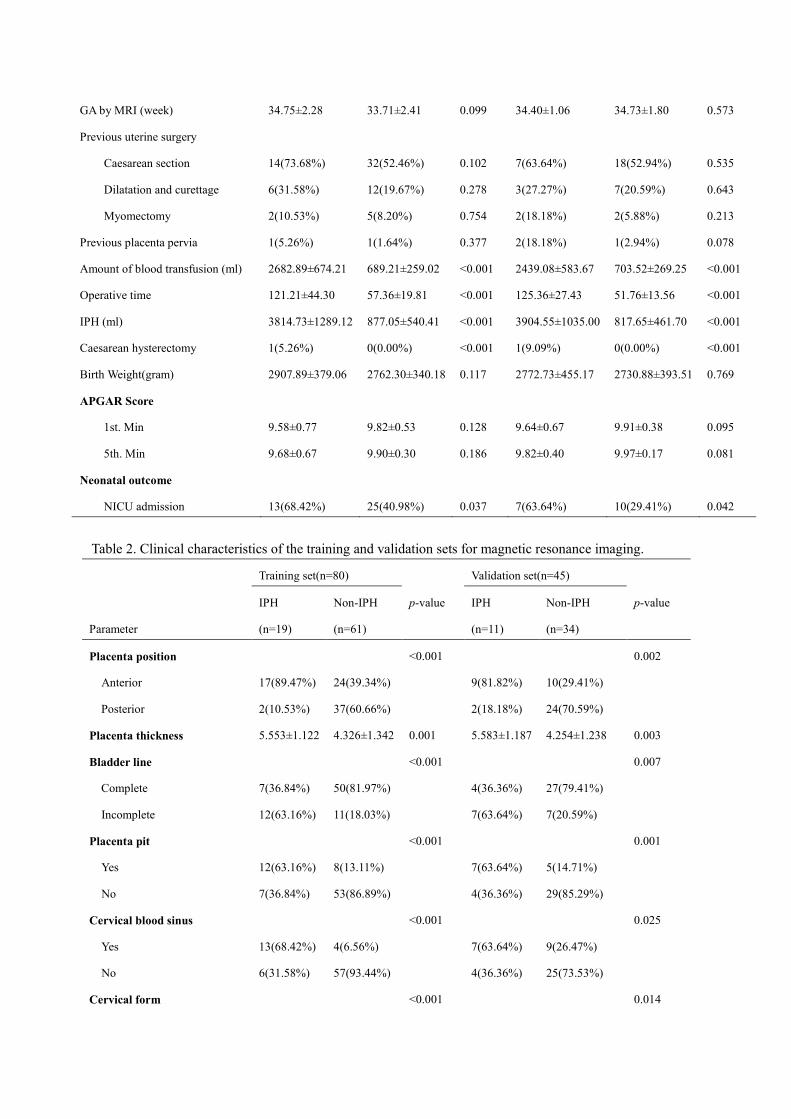
GA by MRI (week) 34.75±2.28 33.71±2.41 0.099 34.40±1.06 34.73±1.80 0.573
Previous uterine surgery
Caesarean section 14(73.68%) 32(52.46%) 0.102 7(63.64%) 18(52.94%) 0.535
Dilatation and curettage 6(31.58%) 12(19.67%) 0.278 3(27.27%) 7(20.59%) 0.643
Myomectomy 2(10.53%) 5(8.20%) 0.754 2(18.18%) 2(5.88%) 0.213
Previous placenta pervia 1(5.26%) 1(1.64%) 0.377 2(18.18%) 1(2.94%) 0.078
Amount of blood transfusion (ml) 2682.89±674.21 689.21±259.02 <0.001 2439.08±583.67 703.52±269.25 <0.001
Operative time 121.21±44.30 57.36±19.81 <0.001 125.36±27.43 51.76±13.56 <0.001
IPH (ml) 3814.73±1289.12 877.05±540.41 <0.001 3904.55±1035.00 817.65±461.70 <0.001
Caesarean hysterectomy 1(5.26%) 0(0.00%) <0.001 1(9.09%) 0(0.00%) <0.001
Birth Weight(gram) 2907.89±379.06 2762.30±340.18 0.117 2772.73±455.17 2730.88±393.51 0.769
APGAR Score
1st. Min 9.58±0.77 9.82±0.53 0.128 9.64±0.67 9.91±0.38 0.095
5th. Min 9.68±0.67 9.90±0.30 0.186 9.82±0.40 9.97±0.17 0.081
Neonatal outcome
NICU admission 13(68.42%) 25(40.98%) 0.037 7(63.64%) 10(29.41%) 0.042
Table 2. Clinical characteristics of the training and validation sets for magnetic resonance imaging.
Training set(n=80) Validation set(n=45)
IPH Non-IPH p-value IPH Non-IPH p-value
Parameter (n=19) (n=61) (n=11) (n=34)
Placenta position <0.001 0.002
Anterior 17(89.47%) 24(39.34%) 9(81.82%) 10(29.41%)
Posterior 2(10.53%) 37(60.66%) 2(18.18%) 24(70.59%)
Placenta thickness 5.553±1.122 4.326±1.342 0.001 5.583±1.187 4.254±1.238 0.003
Bladder line <0.001 0.007
Complete 7(36.84%) 50(81.97%) 4(36.36%) 27(79.41%)
Incomplete 12(63.16%) 11(18.03%) 7(63.64%) 7(20.59%)
Placenta pit <0.001 0.001
Yes 12(63.16%) 8(13.11%) 7(63.64%) 5(14.71%)
No 7(36.84%) 53(86.89%) 4(36.36%) 29(85.29%)
Cervical blood sinus <0.001 0.025
Yes 13(68.42%) 4(6.56%) 7(63.64%) 9(26.47%)
No 6(31.58%) 57(93.44%) 4(36.36%) 25(73.53%)
Cervical form <0.001 0.014

Complete 7(36.84%) 54(88.52%) 4(36.36%) 26(76.47%)
Incomplete 12(63.16%) 7(11.48%) 7(63.64%) 8(23.53%)
Placental signals in the cervix <0.001 <0.001
Yes 13(68.42%) 5(8.20%) 7(63.64%) 3(8.82%)
No 6(31.58%) 56(91.80%) 4(36.36%) 31(91.18%)
Performance of the radiomics signature
There was a significant difference in radiomics signatures between IPH and
non-IPH patients in the training set (p < 0.05) and validation set (p < 0.05), which
indicates the radiomics signatures were related to the IPH (Table 2). The univariate
and multivariate model was constructed using the radiomics signature in the training
cohort. On univariable analyses, placenta position, placenta thickness, bladder line,
placental pit, cervical blood sinus, cervical form and placental signals in the cervix on
MRI emerged as predictors of IPH (all p < 0.05). All of these covariates were
included in a multivariable logistic regression model. Placenta position, placenta
thickness, cervical blood sinus and placental signals in the cervix on MRI emerged as
predictors for the outcome of IPH on multivariable analysis( p < 0.05) (Table 3).
Table 3. Univariate and multivariate regression analyses of the indicators for intraoperative hemorrhage in the training cohort
Univariate Multivariate
Indicatiors OR 95%CI p-value OR 95%CI p-value
Placenta position 5.181 2.038-13.857 0.003 3.026 1.001-7.447 0.012
Placenta thickness 2.238 1.300-3.850 0.004 3.546 1.437-8.749 0.016
Bladder line 3.012 0.953-7.823 0.021 2.776 0.405-7.010 0.298
Placental pit 4.818 1.487-15.612 0.009 0.705 0.082-6.090 0.751
Cervical blood sinus 5.169 1.365-19.572 0.016 7.519 1.654-15.626 0.019
Cervical form 3.560 1.023-12.393 0.046 0.580 0.053-3.341 0.656
Placental signals in the cervix 7.361 2.29-23.664 0.001 10.913 1.934-19.935 0.001
Performance of the nomogram
Based on the above multivariate analysis results, the nomogram was constructed.
In Figure 3, the nomogram shows the impact on the probability of IPH contributed by
placenta position, placenta thickness, cervical blood sinus and placental signals in the

cervix. By determining the score from all variables on a total point scale, probabilities
of IPH(IPH > 2000 ml) could be determined by drawing a vertical line to the total
score (Figure 3).
Figure 3. Nomogram for the prediction of IPH in patients with placenta previa. For example, a patient with complete
placenta previa, MRI showed that the placenta was mainly located in the anterior wall of the uterus, placenta thickness was
7 cm, blood sinus and placental signals were visible in the cervix. The corresponding points for the four MRI features
(placenta position, anterior = 26 points [ black line ]; placenta thickness, 7 cm =30 points [ yellow line ]; cervical blood
sinus, Yes = 18 points [ green line ]; placental signals in the cervix, Yes = 22 points [ blue line ] ) yielding a total of 96
points, which indicates the probability of IPH (IPH ≥ 2000 ml) is 0.67 [red line].
Receiver operating characteristic curve analysis and internal validation
The discriminatory ability of the nomogram for predicting IPH was investigated
by ROC curves (Figure 4 A, B). The combination of four MRI features model yielded
an AUC of 0.918 ( 95% CI, 0.857-0.979 ) in the training set, with an accuracy of
87.9%, and an AUC of 0.866( 95% CI, 0.748-0.985 ) in the validation set, with an
accuracy of 85.3%. The specificity and sensitivity were 80.3% and 89.5% in the
training set and 77.8% and 86.1% in the validation set (Table 4).
Two calibration plots were constructed in order to measure the fit between the
predicted rate and the actual outcome. The calibration curve of the nomogram showed
good calibration in the training and validation sets (Figure 5 A, B). The decision curve
analysis for evaluating the clinical utility of the predictive model were plotted, which

showed favorable performance of the radiomics nomogram in the training and
validation sets. This reflected greater benefit for the PP patients by MRI-based
nomogram in the prediction of IPH (IPH > 2000 ml) if the threshold probability was
greater than 0. 3 (Figure 6).
Figure 4. Receiver operating characteristics (ROC) curve for prediction of risk of IPH by different MRI features.
A. MRI model reached AUC of 0.918, with a sensitivity of 0.803 and a specificity of 0.895 by the combination of four MRI
features (red line) in training set.
B. MRI model reached AUC of 0.866 , with a sensitivity of 0.778 and a specificity of 0.861 by the combination of four MRI
features (red line) in validation set.
Table 4. Performance of models for IPH prediction. Set Model AUC Sensitivity(%) Specificity(%) Accuracy(%)
Training Set Placenta position 0.693(0.551-0.835) 76.3(63.6-86.1) 62.0(37.2-82.4) 67.5(61.2-74.1)
Placenta thickness 0.713(0.573-0.852) 75.4(62.7-85.5) 63.2(38.4-83.6) 64.5(59.4-70.2)
Cervical blood sinus 0.696(0.544-0.847) 91.8(81.9-97.3) 47.4(24.5-71.1) 70.5(58.6-83.9)
Placental signals in
the cervix
0.750(0.610-0.890) 86.9(75.8-94.1) 63.2(38.4-83.6) 76.8(69.8-84.8)
Four MRI features 0.918(0.857-0.979) 80.3(68.2-89.4) 89.5(66.8-98.4) 87.9(78.5-95.6)
Validation Set Placenta position 0.733(0.566-0.899) 64.7(46.5-80.2) 81.8(48.2-97.2) 65.8(51.6-78.0)
Placenta thickness 0.787(0.640-0.934) 82.4(65.5-93.2) 63.6(30.9-88.8) 70.3(61.5-83.7)
Cervical blood sinus 0.686(0.498-0.874) 73.5(55.6-87.1) 63.6(30.9-88.8) 64.8(58.6-71.5)
Placental signals in
the cervix
0.715(0.529-0.902) 79.4(62.1-91.3) 62.1(29.8-87.7) 78.7(66.5-89.6)
Four MRI features 0.866(0.748-0.985) 77.8(65.5-88.6) 86.1(78.7-96.5) 85.3(73.6-96.5)

Figure 5. Calibration plots of the probability of IPH in the (A) training and (B) validation sets. The Y-axis represents the actual
probability and the X-axis represents the predicted probability. The diagonal dotted line represents an ideal evaluation,
while the solid line represent the performance of the nomogram. Closer fit to the diagonal dotted line indicates a
better evaluation.
Figure 6. Decision curve analysis for our newly developed magnetic resonance imaging (MRI)-based model for the
prediction of IPH in patients with placenta previa. On the Y-axis is the net benefit and the threshold probability is
on the X-axis. The red line represents the MRI-based nomogram. The yellow line represents the assumption that
all patients have IPH. The black line represents the assumption that no patients have IPH.
Discussion
Multiple abortions and intrauterine procedures may damage the endometrium,
and placental villi can penetrate the myometrium, leading to placental implantation.
Previous cesarean section is an independent risk factor for PP and placenta

implantation[14]. The normal placenta is attached to the decidua basalis of the uterus,
and the placenta can be removed smoothly after delivery. PP is often accompanied by
placental percreta, in which villi penetrate through the entire myometrial thickness or
surrounding organs[15]. When the placenta inserted into the myometrium is removed,
the local myometrium is missing and leading to massive bleeding. The damage of
myometrial by the placental increta is responsible for maternal bleeding and potential
fetal compromise[16].PP often leads to uncontrolled bleeding during childbirth or
postpartum, which can cause serious consequences, even life-threatening. About
40-60% of the peripartum hysterectomies are due to placenta increta[17]. Therefore,
prenatal diagnosis of placental implantation and prediction of intraoperative blood
loss can help clinicians make adequate preoperative preparation, develop appropriate
surgical procedures and avoid serious complications.
Although ultrasound is an important method for the diagnosis of PP, MRI has
been used more and more in the diagnosis and treatment of PP in recent years[18,19],
which fully demonstrates its value in the evaluation of intraoperative blood loss of PP.
The aim of our study was to investigate the role of MRI for the PP diagnosis and the
clinical prediction in IPH. Our current study included 125 cases of PP at high risk of
co-existing placental accreta. When the patient underwent MRI examination, it was
better to have about 400 ml of urine in the bladder, which was beneficial to predict
whether the placental tissue was implanted into the bladder. In this study, blood loss
was measured by using weighed swabs, which is more precise than methods using
visual estimation. Patients with PP have more intraoperative bleeding due to the
intense bleeding of the uterus during delivery of the placenta, especially those with
the placenta located entirely in the lower uterine segment. Placental implantation can
cause the placenta and uterine wall contact closely, postpartum placenta is not easy to
peel and affect the uterine contraction, resulting in uterine blood sinus can not be
closed and postpartum hemorrhage.
In MRI images, the typical shadowing characteristics of placenta implantation
include thinning of the myometrium, placental penetration into the cervix, and uneven
placental signals. Interruption of myometrium signal and placental invasion into
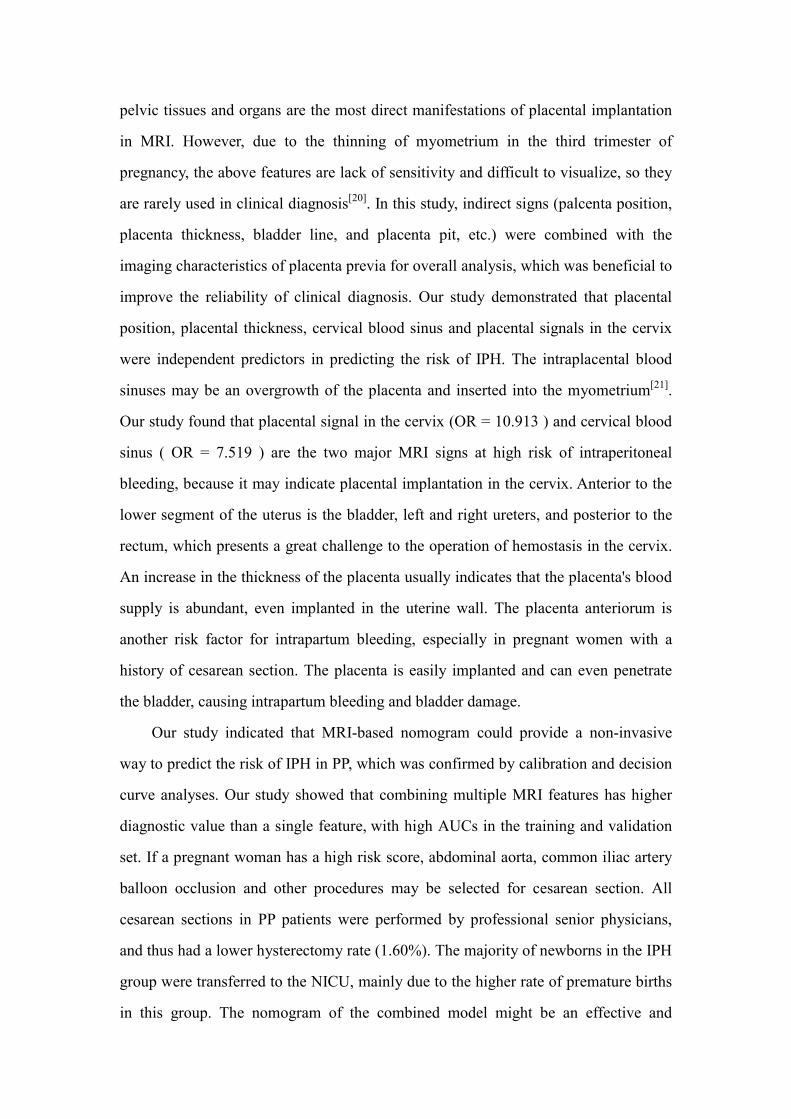
pelvic tissues and organs are the most direct manifestations of placental implantation
in MRI. However, due to the thinning of myometrium in the third trimester of
pregnancy, the above features are lack of sensitivity and difficult to visualize, so they
are rarely used in clinical diagnosis[20]. In this study, indirect signs (palcenta position,
placenta thickness, bladder line, and placenta pit, etc.) were combined with the
imaging characteristics of placenta previa for overall analysis, which was beneficial to
improve the reliability of clinical diagnosis. Our study demonstrated that placental
position, placental thickness, cervical blood sinus and placental signals in the cervix
were independent predictors in predicting the risk of IPH. The intraplacental blood
sinuses may be an overgrowth of the placenta and inserted into the myometrium[21].
Our study found that placental signal in the cervix (OR = 10.913 ) and cervical blood
sinus ( OR = 7.519 ) are the two major MRI signs at high risk of intraperitoneal
bleeding, because it may indicate placental implantation in the cervix. Anterior to the
lower segment of the uterus is the bladder, left and right ureters, and posterior to the
rectum, which presents a great challenge to the operation of hemostasis in the cervix.
An increase in the thickness of the placenta usually indicates that the placenta's blood
supply is abundant, even implanted in the uterine wall. The placenta anteriorum is
another risk factor for intrapartum bleeding, especially in pregnant women with a
history of cesarean section. The placenta is easily implanted and can even penetrate
the bladder, causing intrapartum bleeding and bladder damage.
Our study indicated that MRI-based nomogram could provide a non-invasive
way to predict the risk of IPH in PP, which was confirmed by calibration and decision
curve analyses. Our study showed that combining multiple MRI features has higher
diagnostic value than a single feature, with high AUCs in the training and validation
set. If a pregnant woman has a high risk score, abdominal aorta, common iliac artery
balloon occlusion and other procedures may be selected for cesarean section. All
cesarean sections in PP patients were performed by professional senior physicians,
and thus had a lower hysterectomy rate (1.60%). The majority of newborns in the IPH
group were transferred to the NICU, mainly due to the higher rate of premature births
in this group. The nomogram of the combined model might be an effective and

easy-to-use tool to estimate the danger level of PP before surgery, and patients might
be given adequate preoperative evaluation and preoperative communication.
Despite the promising results, our study also had several limitations. Firstly, Our
retrospective data were collected from a single unit for training and validating the
predictive model. Secondly, our sample size is small, so we still need to increase the
sample size for verification.
Conclusion
Based on these preliminary data of this study, we conclude that the MRI-based
nomogram can assess the risk of intraoperative bleeding of placenta previa, enabling
obstetricians to make adequate preoperative preparations, minimize intraoperative
bleeding and ensure the health of mother and child. However, retrospective and
prospective studies are still needed to confirm and optimize its predictive properties in
the future.
Compliance with ethical standards
The authors declare that they have no conflicts of interest concerning this article.
References [1] Silver RM. Abnormal Placentation: Placenta Previa, Vasa Previa, and Placenta
Accreta[J]. Obstet Gynecol, 2015, 126(3):654-668.
[2] Faiz AS, Ananth CV. Etiology and risk factors for placenta previa: an overview
and meta-analysis of observational studies[J]. J Matern. Fetal Neonatal Med,
2003,13(3):175-190.
[3] Belfort MA. Placenta accreta[J]. Am J Obstet Gynecol, 2010, 203(5):430-439.
[4] Oyelese Y, Smulian JC. Placenta previa, placenta accreta, and vasa previa[J].
Obstet Gynecol, 2006,107(4):927-941.
[5] Ghourab S. Third-trimester transvaginal ultrasonography in placenta previa: does
the shape of the lower placental edge predict clinical outcome? [J]. Ultrasound
Obstet Gynecol, 2001;18(2):103-108.

[6] Fadl S , Moshiri M , Fligner CL, et al. Placental Imaging Normal Appearance
with Review of Pathologic Findings [J]. Radiographics, 2017, 37(3):979-998.
[7] Lax A, Prince MR, Mennitt KW, et al. The value of specific MRI features in the
evaluation of suspected placental invasion [J]. Magn Reson Imag,
2007,25(1):87-93.
[8] Antonio FD, Iacovella C, Palacios-Jaraquemada J, et al. Prenatal identification of
invasive placentation using magnetic resonance imaging: systematic review and
meta-analysis[J]. Ultrasound Obstet Gynecol, 2014, 44(1):8-16.
[9] Meng X, Xie L, Song W. Comparing the Diagnostic Value of Ultrasound and
Magnetic Resonance Imaging for Placenta Accreta: A Systematic Review and
Meta-analysis[J]. Ultrasound in Med Biol, 2013, 39(11):1958-1965.
[10] Kollmann M, Gaulhofer J, Lang U, et al. Placenta praevia: incidence, risk factors
and outcome [J]. J Matern Fetal Neonatal Med, 2013, 29(9):1395-1398.
[11] Faranesh R, Romanov S, Shalev E, et al. Suggested approach for management of
placenta percreta invading the urinary bladder [J]. Obstet Gynecol, 2007,
110(2):512-515.
[12] Onwere C, Gurol-Urganci I, Cromwell DA, et al. Maternal morbidity associated
with placenta praevia among women who had elective caesarean section [J]. Eur J
Obstet Gynecol Reprod Biol, 2011, 159(1):62–66.
[13] Schneiderman M, Balayla J. A comparative study of neonatal outcomes in
placenta previa versus cesarean for other indication at term [J]. J Matern Fetal
Neonatal Med, 2013,26(11):1121-1127.
[14] Miller DA, Chollet JA, Goodwin TM. Clinical risk factors for placenta previa
placenta accrete[J]. Am J Obstet Gynecol, 1997,177(1):210-214.
[15] Bauer ST, Bonanno C. Abnormal Placentation [J]. Semin Perinatol,
2009,33(2):88-96.
[16] Jauniaux E, Collins S, Burton GJ. Placenta accreta spectrum: pathophysiology
and evidence-based anatomy for prenatal ultrasound imaging[J]. Am J Obstet
Gynecol, 2018, 218(1): 75-87.

[17] Arpe, SD, Franceschetti S, Corosu R, et al. Emergency peripartum hysterectomy
in a tertiary teaching hospital: a 14-year review. Arch Gynecol Obstet, 2015,
291(4): 841-847.
[18] Fadl S, Moshiri M, Fligner CL, et al. Placental Imaging: Normal Appearance
with Review of Pathologic Findings[J]. Radiographics, 2017,37(3): 979-998.
[19] Rahaim NS, Whitby EH. The MRI features of placental adhesion disorder and
their diagnostic signifcance: systematic review[J]. Clin Radiol, 2015, 70(9):
917-925.
[20] Baughman WC, Corteville JE, Shah RR. Placenta Accreta: Spectrum of US and
MR Imaging Findings[J]. Radiographics, 2008, 28(7):1905-1916.
[21] UenoY, Kitajima K, Kawakami F, et al. Novel MRI fnding for diagnosis of
invasive placenta praevia: evaluation of findings for 65 patients using clinical and
histopathological correlations[J]. Eur Radiol, 2014, 24(4): 881-888.
Acknowledgments
This study was supported by Suzhou municipal hospital gynecological clinical trial
and improvement Project (grant number SLT201955), Clinical Medical Expert Team
Project of Suzhou (grant number SZYJTD201709), Suzhou Science and Technology
Plan Research Project (grant number SYSD2020133), and Suzhou Science and
Technology Project for Youth ( KJXW2017026 ). We thank the women who kindly
donated their placentas for this study. Author Contributions
YFY designed the study, and drafting/revision of the manuscript. SYH and YS made
contributions to the acquisition of clinical study data. YML, DLC and QX analysed
the imaging data. YW, LPZ, YDG and YQ made substantial contributions to the
analysis and interpretation of data.
Additional Information Competing Interests The authors declare no competing interests.
Publisher’s note Springer Nature remains neutral with regard to jurisdictional claims
in published maps and institutional affiliations.

Figures
Figure 1
Flow chart of patients with placenta previa included in the study.

Figure 2
Different imaging characteristics of MRI in placenta previa patients. A. Placenta thickness: The thicknessof placenta is 10.31cm (Sagittal T2-weighted). B. Bladder line: The bladder line is blurred and unclear (redarrow), invasion signs of bladder (Coronal T2-weighted). C. Placenta pit: Dark band in placenta (redarrow), intraplacental abnormal vascularity signs (Sagittal T2-weighted). D. Cervical blood sinus: Darkband in cervix (red arrow), enlarged and tortuous vessels signs (Sagittal T2-weighted). E. Cervical form:The cervix is regular and complete (red arrow) (Sagittal T2-weighted). F. Placental signals in the cervix:The signal of the cervix is consistent with that of the placenta(red arrow), sings of placenta implanted incervix (Sagittal T2-weighted).

Figure 3
Nomogram for the prediction of IPH in patients with placenta previa. For example, a patient withcomplete placenta previa, MRI showed that the placenta was mainly located in the anterior wall of theuterus, placenta thickness was 7 cm, blood sinus and placental signals were visible in the cervix. Thecorresponding points for the four MRI features (placenta position, anterior = 26 points [ black line ];placenta thickness, 7 cm =30 points [ yellow line ]; cervical blood sinus, Yes = 18 points [ green line ];placental signals in the cervix, Yes = 22 points [ blue line ] ) yielding a total of 96 points, which indicatesthe probability of IPH (IPH ≥ 2000 ml) is 0.67 [red line].

Figure 4
Receiver operating characteristics (ROC) curve for prediction of risk of IPH by different MRI features. A.MRI model reached AUC of 0.918, with a sensitivity of 0.803 and a speci�city of 0.895 by thecombination of four MRI features (red line) in training set. B. MRI model reached AUC of 0.866 , with asensitivity of 0.778 and a speci�city of 0.861 by the combination of four MRI features (red line) invalidation set.
Figure 5
Calibration plots of the probability of IPH in the (A) training and (B) validation sets. The Y-axis representsthe actual probability and the X-axis represents the predicted probability. The diagonal dotted linerepresents an ideal evaluation, while the solid line represent the performance of the nomogram. Closer �tto the diagonal dotted line indicates a better evaluation.
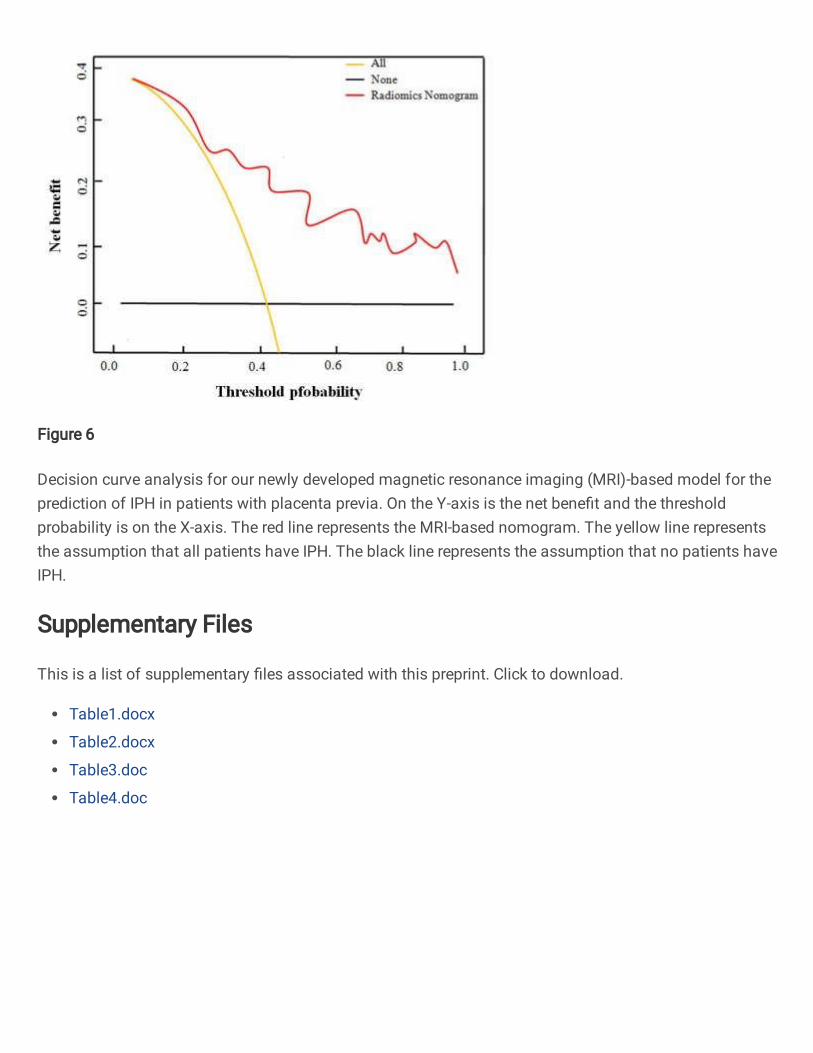
Figure 6
Decision curve analysis for our newly developed magnetic resonance imaging (MRI)-based model for theprediction of IPH in patients with placenta previa. On the Y-axis is the net bene�t and the thresholdprobability is on the X-axis. The red line represents the MRI-based nomogram. The yellow line representsthe assumption that all patients have IPH. The black line represents the assumption that no patients haveIPH.
Supplementary Files
This is a list of supplementary �les associated with this preprint. Click to download.
Table1.docx
Table2.docx
Table3.doc
Table4.doc