Mr. Sarawut Meesri - cuir.car.chula.ac.th
191
DIAGNOSIS OF HEART DISEASE USING MIXED CLASSIFIER Mr. Sarawut Meesri A Thesis Submitted in Partial Fulfillment of the Requirements for the Degree of Master of Science Program in Computer Science and Information Technology Department of Mathematics and Computer Science Faculty of Science Chulalongkorn University Academic Year 2017 Copyright of Chulalongkorn University
Transcript of Mr. Sarawut Meesri - cuir.car.chula.ac.th

DIAGNOSIS OF HEART DISEASE USING MIXED CLASSIFIER
Mr. Sarawut Meesri
A Thesis Submitted in Partial Fulfillment of the Requirements for the Degree of Master of Science Program in Computer Science and Information
Technology Department of Mathematics and Computer Science
Faculty of Science Chulalongkorn University
Academic Year 2017 Copyright of Chulalongkorn University

การวินิจฉัยโรคหัวใจโดยใช้ตัวจ าแนกผสม
นายสราวุธ มีศรี
วิทยานิพนธ์นี้เป็นส่วนหนึ่งของการศึกษาตามหลักสูตรปริญญาวิทยาศาสตรมหาบัณฑิต สาขาวิชาวิทยาการคอมพิวเตอร์และเทคโนโลยีสารสนเทศ ภาควิชาคณิตศาสตร์และวิทยาการ
คอมพิวเตอร์ คณะวิทยาศาสตร์ จุฬาลงกรณ์มหาวิทยาลัย
ปีการศึกษา 2560 ลิขสิทธิ์ของจุฬาลงกรณ์มหาวิทยาลัย

Thesis Title DIAGNOSIS OF HEART DISEASE USING MIXED CLASSIFIER
By Mr. Sarawut Meesri Field of Study Computer Science and Information Technology Thesis Advisor Assistant Professor Suphakant Phimoltares, Ph.D. Thesis Co-Advisor Atchara Mahaweerawat, Ph.D.
Accepted by the Faculty of Science, Chulalongkorn University in Partial Fulfillment of the Requirements for the Master's Degree
Dean of the Faculty of Science
(Associate Professor Polkit Sangvanich, Ph.D.)
THESIS COMMITTEE
Chairman
(Professor Chidchanok Lursinsap, Ph.D.)
Thesis Advisor
(Assistant Professor Suphakant Phimoltares, Ph.D.)
Thesis Co-Advisor
(Atchara Mahaweerawat, Ph.D.)
External Examiner
(Assistant Professor Ureerat Suksawatchon, Ph.D.)

iv
THAI ABSTRACT
สราวุธ มีศรี : การวินิจฉัยโรคหัวใจโดยใช้ตัวจ าแนกผสม (DIAGNOSIS OF HEART DISEASE USING MIXED CLASSIFIER) อ.ที่ปรึกษาวิทยานิพนธ์หลัก: ผศ. ดร. ศุภกานต์ พิมลธเรศ, อ.ที่ปรึกษาวิทยานิพนธ์ร่วม: อ. ดร. อัจฉรา มหาวีรวัฒน์ {, 182 หน้า.
ปัจจุบันมีการศึกษาที่เกี่ยวข้องกับการใช้ข้อมูลทางด้านการแพทย์จ านวนมากเพ่ือช่วยในการวิเคราะห์และวินิจฉัยผู้ป่วย ในด้านวิทยาการคอมพิวเตอร์ มีวิธีที่ช่วยในการวิเคราะห์และวินิจฉัยโรคต่างๆ โดยใช้เทคนิคการท าเหมืองข้อมูล การท าเหมืองข้อมูลเป็นเทคนิคที่นิยมใช้ในการวิเคราะห์ข้อมูลที่มีอยู่จ านวนมากเพ่ือหาความสัมพันธ์ของสารสนเทศที่ซ่อนอยู่ในข้อมูลเหล่านั้นและประยุกต์เพ่ือสร้างผลประโยชน์ขององค์กร เทคนิคการจ าแนกข้อมูลบนพ้ืนฐานของการเรียนรู้แบบมีผู้สอนเป็นหนึ่งในเทคนิคการท าเหมืองข้อมูลซึ่งแบ่งข้อมูลออกเป็นสองชุดย่อยได้แก่ชุดข้อมูลฝึกฝนและชุดข้อมูลทดสอบ ชุดข้อมูลฝึกฝนถูกใช้เพ่ือสร้างแบบจ าลองการจ าแนกและแบบจ าลองการจ าแนกนี้จะถูกประเมินประสิทธิภาพด้วยชุดข้อมูลทดสอบ ในวิทยานิพนธ์เล่มนี้ตัวจ าแนกเดี่ยวสามตัวได้แก่ วิธีเบย์อย่างง่าย ซัพพอร์ตเวกเตอร์แมชชีนและวิธีเพ่ือนบ้านใกล้ที่สุดเคตัวถูกน ามารวมกันโดยใช้โครงข่ายประสาทเทียมด้วยการเรียนรู้แบบแพร่กระจายย้อนกลับเพ่ือเพ่ิมสมรรถนะของการจ าแนก วิธีการนี้เรียกว่าตัวจ าแนกผสม กระบวนการของตัวจ าแนกผสมแบ่งการจ าแนกออกเป็นสองขั้นตอนหลัก ในขั้นตอนแรกชุดข้อมูลโรคหัวใจที่ได้รับจากคลังเก็บการเรียนรู้ของเครื่องยูซีไอถูกจ าแนกด้วยวิธีเบย์อย่างง่าย ซัพพอร์ตเวกเตอร์แมชชีนและวิธีเพ่ือนบ้านใกล้ที่สุดเคตัว จากนั้นในขั้นตอนที่สองผลลัพธ์จากตัวจ าแนกเดี่ยวจะเป็นข้อมูลน าเข้าส าหรับการจ าแนกด้วยโครงข่ายประสาทเทียม สมรรถนะของตัวจ าแนกผสมวัดด้วยตัววัดที่แตกต่างกันสามตัว ได้แก่ความแม่น อัตราบวกเท็จและอัตราลบเท็จ จากผลการทดลองตัวจ าแนกผสมให้ความถูกต้องมากกว่าและอัตราบวกเท็จดีกว่าตัวจ าแนกอ่ืน
ภาควิชา คณิตศาสตร์และวิทยาการคอมพิวเตอร์
สาขาวิชา วิทยาการคอมพิวเตอร์และเทคโนโลยีสารสนเทศ
ปีการศึกษา 2560
ลายมือชื่อนิสิต
ลายมือชื่อ อ.ที่ปรึกษาหลัก ลายมือชื่อ อ.ที่ปรึกษาร่วม

v
ENGLISH ABSTRACT
# # 5872624623 : MAJOR COMPUTER SCIENCE AND INFORMATION TECHNOLOGY KEYWORDS: DATA MINING / HEART DISEASE / SUPPORT VECTOR MACHINE / K-NEAREST NEIGHBOR METHOD / MULTI-LAYER PERCEPTRON / BACK-PROPAGATION LEARNING / NAïVE BAYES APPROACH
SARAWUT MEESRI: DIAGNOSIS OF HEART DISEASE USING MIXED CLASSIFIER. ADVISOR: ASST. PROF. SUPHAKANT PHIMOLTARES, Ph.D., CO-ADVISOR: DR. ATCHARA MAHAWEERAWAT, Ph.D. {, 182 pp.
At present, there are many studies related to the use of medical information, in order to assist in the analysis and diagnosis of the patients. In the field of computer science, there are methods to assist in analysis and diagnosis of the various diseases using the data mining techniques. Data mining is a popular technique used for analyzing a large number of data, to find the relationship of the hidden information in those data and applied for the benefits of the organization. Classification technique based on the supervised learning is one of the data mining techniques, which divides the dataset into two subsets: training set and testing set. The training set is used to create a classification model and this classification model will be evaluated the performance by the testing set. In this thesis, three individual classifies, namely, Naïve Bayes approach, Support Vector Machine and K-Nearest Neighbor method are combined using an artificial neural network with backpropagation learning to enhance the performance of classification. This method is called a mixed classifier. The process of the mixed classifier divides the classification into two major phases. In the first phase, the heart disease dataset obtained from the UCI Machine Learning Repository is classified by Naïve Bayes approach, Support Vector Machine and K-Nearest Neighbor method. Then in the second phase, the results of individual classifiers become the input for classifying with the artificial neural network. The performance of the mixed classifier is measured by three heterogeneous measures: accuracy, False Positive Rate (FPR) and False Negative Rate (FNR). From the experimental results, the mixed classifier is more accurate and yields better FPR than the other classifiers.
Department: Mathematics and Computer
Science Field of Study: Computer Science and
Information Technology Academic Year: 2017
Student's Signature
Advisor's Signature
Co-Advisor's Signature

vi
ACKNOWLEDGE MENTS
ACKNOWLEDGEMENTS
I would like to thank all of those who made it possible for me to complete this thesis.
First, I am very much obliged and grateful to my research advisor, Assistant Professor Dr. Suphakant Phimoltares and my research co-advisor, Dr. Atchara Mahaweerawat for suggesting and helping me understand the process of research and checking and correcting the thesis.
Also, I would like to thank program chair, Professor Chidchanok Lursinsap and external examiner, Assistant Professor Ureerat Suksawatchon for their valuable suggestions and comments for my thesis.
Finally, I'm most grateful to my parents who have always supported and encouraged me in everything I do.

CONTENTS Page
THAI ABSTRACT ............................................................................................................................. iv
ENGLISH ABSTRACT .......................................................................................................................v
ACKNOWLEDGEMENTS ................................................................................................................. vi
CONTENTS ..................................................................................................................................... vii
Content of Tables ......................................................................................................................... 1
Content of Figures ...................................................................................................................... 11
Chapter 1. Introduction ............................................................................................................. 12
1.1. Objective ........................................................................................................................... 13
1.2. Scope of thesis and constraints ................................................................................... 13
1.3. Expected outcome ......................................................................................................... 14
Chapter 2. Theoretical backgrounds ....................................................................................... 15
2.1. Diagnosis of the heart disease...................................................................................... 15
2.2. Data mining ...................................................................................................................... 16
2.2.1. Naïve Bayes approach ......................................................................................... 17
2.2.2. Support Vector Machine ..................................................................................... 23
2.2.3. K-Nearest Neighbor method ............................................................................... 25
2.2.4. Decision tree .......................................................................................................... 30
2.2.5. Artificial Neural Network ..................................................................................... 36
2.2.6. K-fold cross validation ......................................................................................... 39
2.2.7. Performance measurement................................................................................ 41
Chapter 3. Related Works ......................................................................................................... 43
Chapter 4. Proposed Method ................................................................................................... 49

viii
Page
4.1. Data Preparation ............................................................................................................. 50
4.2. 10-Fold Cross-Validation ................................................................................................ 51
4.3. Three different classifiers .............................................................................................. 52
4.4. Mixed Classifier Using ANN ............................................................................................ 52
4.4.1. Data Preparation ................................................................................................... 53
4.4.2. Artificial neural network (ANN) ........................................................................... 55
4.5. Evaluation and Performance Analysis ........................................................................ 56
Chapter 5. Experiments and Results ....................................................................................... 57
5.1. Experimental Setup ........................................................................................................ 57
5.2. 10-fold cross validation ................................................................................................. 58
5.3. Evaluation and Performance analysis ......................................................................... 58
5.3.1. Cleveland clinic foundation heart disease dataset ....................................... 59
5.3.2. All four heart disease datasets .......................................................................... 62
5.4. Discussion ......................................................................................................................... 64
Chapter 6. Conclusion ............................................................................................................... 65
REFERENCES ................................................................................................................................. 66
APPENDIX ...................................................................................................................................... 68
VITA .............................................................................................................................................. 182

Content of Tables
Table 1. The number and rate of death per 100,000 population of all age groups caused by non-communicable diseases between 2007-2014 in Thailand. ................... 12
Table 2. The heart disease dataset. ....................................................................................... 18
Table 3. The conditional probability of slope attribute. .................................................... 19
Table 4. The conditional probability of restecg attribute. ................................................. 19
Table 5. The conditional probability of sex attribute. ........................................................ 19
Table 6. The conditional probability of fbs attribute. ........................................................ 19
Table 7. The testing instance. .................................................................................................. 20
Table 8. The probability estimation of slope attribute. ..................................................... 21
Table 9. Three instances used for calculating two similarities. ........................................ 28
Table 10. A partial heart disease dataset. ............................................................................. 32
Table 11. The number of slope attribute values in each class. ....................................... 33
Table 12. The number of restecg attribute values in each class. .................................... 33
Table 13. The number of sex attribute values in each class. ........................................... 34
Table 14. The number of fbs attribute values in each class............................................. 34
Table 15. The confusion matrix. .............................................................................................. 41
Table 16. The previous research on medical classification. .............................................. 43
Table 17. The performance comparison of three techniques from [3]. ......................... 44
Table 18. The performance comparison of data mining classification algorithms for breast cancer prediction from [8]. .................................................................................... 44
Table 19. The performance of prediction system from [4]. .............................................. 45
Table 20. The accuracies in various number of dimensions from [9]. ............................ 46
Table 21. The recognition rate of each method from [5]. ................................................. 47

2
Table 22. The accuracy of average K-Nearest Neighbor algorithm compared with Naïve Bayes approach and Decision tree from [6]............................................................... 47
Table 23. The performance of SVM and ANN from [7]. ...................................................... 48
Table 24. Attribute Information of the heart disease dataset from Cleveland clinic foundation. ................................................................................................................................... 50
Table 25. The advantages and disadvantages of individual classifiers. ........................... 52
Table 26. The eight possible patterns in each training set. ............................................... 54
Table 27. Example of actual class selection of each pattern. .......................................... 55
Table 28. Parameter setting of individual classifiers. .......................................................... 57
Table 29. The confusion matrix of Naïve Bayes approach. ............................................... 59
Table 30. The confusion matrix of SVM. ................................................................................ 59
Table 31. The confusion matrix of KNN method. ................................................................ 59
Table 32. The confusion matrix of J48 Decision tree.......................................................... 60
Table 33. The confusion matrix of the mixed classifier based on Naïve Bayes approach, SVM and J48 Decision tree using majority vote ................................................ 60
Table 34. The confusion matrix of the mixed classifier based on Naïve Bayes approach, SVM and KNN method using majority vote ....................................................... 60
Table 35. The confusion matrix of the proposed method ................................................ 60
Table 36. The performance measures ................................................................................... 61
Table 37. Details of the missing values of all four heart disease datasets from UCI repository. .................................................................................................................................... 62
Table 38. The confusion matrix of Naïve Bayes approach of all four heart disease datasets from UCI repository.................................................................................................... 63
Table 39. The confusion matrix of SVM of all four heart disease datasets from UCI repository. .................................................................................................................................... 63

3
Table 40. The confusion matrix of KNN method of all four heart disease datasets from UCI repository. ................................................................................................................... 63
Table 41. The confusion matrix of the proposed method of all four heart disease datasets from UCI repository.................................................................................................... 63
Table 42. The performance measures of proposed method of all four heart disease datasets from UCI repository. .................................................................................... 64
Table 43. The predicted results of Naïve Bayes approach of fold 1. .............................. 69
Table 44. The predicted results of Naïve Bayes approach of fold 2. .............................. 70
Table 45. The predicted results of Naïve Bayes approach of fold 3. .............................. 71
Table 46. The predicted results of Naïve Bayes approach of fold 4. .............................. 72
Table 47. The predicted results of Naïve Bayes approach of fold 5. .............................. 73
Table 48. The predicted results of Naïve Bayes approach of fold 6. .............................. 74
Table 49. The predicted results of Naïve Bayes approach of fold 7. .............................. 75
Table 50. The predicted results of Naïve Bayes approach of fold 8. .............................. 76
Table 51. The predicted results of Naïve Bayes approach of fold 9. .............................. 77
Table 52. The predicted results of Naïve Bayes approach of fold 10. ............................ 78
Table 53. The predicted results of SVM of fold 1. .............................................................. 79
Table 54. The predicted results of SVM of fold 2. .............................................................. 80
Table 55. The predicted results of SVM of fold 3. .............................................................. 81
Table 56. The predicted results of SVM of fold 4. .............................................................. 82
Table 57. The predicted results of SVM of fold 5. .............................................................. 83
Table 58. The predicted results of SVM of fold 6. .............................................................. 84
Table 59. The predicted results of SVM of fold 7. .............................................................. 85
Table 60. The predicted results of SVM of fold 8. .............................................................. 86
Table 61. The predicted results of SVM of fold 9. .............................................................. 87

4
Table 62. The predicted results of SVM of fold 10. ............................................................ 88
Table 63. The predicted results of KNN method of fold 1. .............................................. 89
Table 64. The predicted results of KNN method of fold 2. .............................................. 90
Table 65. The predicted results of KNN method of fold 3. .............................................. 91
Table 66. The predicted results of KNN method of fold 4. .............................................. 92
Table 67. The predicted results of KNN method of fold 5. .............................................. 93
Table 68. The predicted results of KNN method of fold 6. .............................................. 94
Table 69. The predicted results of KNN method of fold 7. .............................................. 95
Table 70. The predicted results of KNN method of fold 8. .............................................. 96
Table 71. The predicted results of KNN method of fold 9. .............................................. 97
Table 72. The predicted results of KNN method of fold 10. ............................................ 98
Table 73. The predicted results of J48 Decision tree of fold 1. ....................................... 99
Table 74. The predicted results of J48 Decision tree of fold 2. ..................................... 100
Table 75. The predicted results of J48 Decision tree of fold 3. ..................................... 101
Table 76. The predicted results of J48 Decision tree of fold 4. ..................................... 102
Table 77. The predicted results of J48 Decision tree of fold 5. ..................................... 103
Table 78. The predicted results of J48 Decision tree of fold 6. ..................................... 104
Table 79. The predicted results of J48 Decision tree of fold 7. ..................................... 105
Table 80. The predicted results of J48 Decision tree of fold 8. ..................................... 106
Table 81. The predicted results of J48 Decision tree of fold 9. ..................................... 107
Table 82. The predicted results of J48 Decision tree of fold 10. ................................... 108
Table 83. The predicted results of the mixed classifier based on Naïve Bayes approach, SVM and J48 Decision tree using majority vote of fold 1. ............................ 109

5
Table 84. The predicted results of the mixed classifier based on Naïve Bayes approach, SVM and J48 Decision tree using majority vote of fold 2. ............................ 111
Table 85. The predicted results of the mixed classifier based on Naïve Bayes approach, SVM and J48 Decision tree using majority vote of fold 3. ............................ 113
Table 86. The predicted results of the mixed classifier based on Naïve Bayes approach, SVM and J48 Decision tree using majority vote of fold 4. ............................ 115
Table 87. The predicted results of the mixed classifier based on Naïve Bayes approach, SVM and J48 Decision tree using majority vote of fold 5. ............................ 117
Table 88. The predicted results of the mixed classifier based on Naïve Bayes approach, SVM and J48 Decision tree using majority vote of fold 6. ............................ 119
Table 89. The predicted results of the mixed classifier based on Naïve Bayes approach, SVM and J48 Decision tree using majority vote of fold 7. ............................ 121
Table 90. The predicted results of the mixed classifier based on Naïve Bayes approach, SVM and J48 Decision tree using majority vote of fold 8. ............................ 123
Table 91. The predicted results of the mixed classifier based on Naïve Bayes approach, SVM and J48 Decision tree using majority vote of fold 9. ............................ 125
Table 92. The predicted results of the mixed classifier based on Naïve Bayes approach, SVM and J48 Decision tree using majority vote of fold 10. .......................... 127
Table 93. The predicted results of the mixed classifier based on Naïve Bayes approach, SVM and KNN method using majority vote of fold 1. ................................... 129
Table 94. The predicted results of the mixed classifier based on Naïve Bayes approach, SVM and KNN method using majority vote of fold 2. ................................... 131
Table 95. The predicted results of the mixed classifier based on Naïve Bayes approach, SVM and KNN method using majority vote of fold 3. ................................... 133
Table 96. The predicted results of the mixed classifier based on Naïve Bayes approach, SVM and KNN method using majority vote of fold 4. ................................... 135

6
Table 97. The predicted results of the mixed classifier based on Naïve Bayes approach, SVM and KNN method using majority vote of fold 5. ................................... 137
Table 98. The predicted results of the mixed classifier based on Naïve Bayes approach, SVM and KNN method using majority vote of fold 6. ................................... 139
Table 99. The predicted results of the mixed classifier based on Naïve Bayes approach, SVM and KNN method using majority vote of fold 7. ................................... 141
Table 100. The predicted results of the mixed classifier based on Naïve Bayes approach, SVM and KNN method using majority vote of fold 8. ................................... 143
Table 101. The predicted results of the mixed classifier based on Naïve Bayes approach, SVM and KNN method using majority vote of fold 9. ................................... 145
Table 102. The predicted results of the mixed classifier based on Naïve Bayes approach, SVM and KNN method using majority vote of fold 10. ................................. 147
Table 103. The predicted results of the proposed method of fold 1. ......................... 149
Table 104. The predicted results of the proposed method of fold 2. ......................... 150
Table 105. The predicted results of the proposed method of fold 3. ......................... 151
Table 106. The predicted results of the proposed method of fold 4. ......................... 152
Table 107. The predicted results of the proposed method of fold 5. ......................... 153
Table 108. The predicted results of the proposed method of fold 6. ......................... 154
Table 109. The predicted results of the proposed method of fold 7. ......................... 155
Table 110. The predicted results of the proposed method of fold 8. ......................... 156
Table 111. The predicted results of the proposed method of fold 9. ......................... 157
Table 112. The predicted results of the proposed method of fold 10. ....................... 158
Table 113. The confusion matrix of Naïve Bayes approach of fold 1. .......................... 159
Table 114. The confusion matrix of Naïve Bayes approach of fold 2. .......................... 159
Table 115. The confusion matrix of Naïve Bayes approach of fold 3. .......................... 159

7
Table 116. The confusion matrix of Naïve Bayes approach of fold 4. .......................... 159
Table 117. The confusion matrix of Naïve Bayes approach of fold 5. .......................... 160
Table 118. The confusion matrix of Naïve Bayes approach of fold 6. .......................... 160
Table 119. The confusion matrix of Naïve Bayes approach of fold 7. .......................... 160
Table 120. The confusion matrix of Naïve Bayes approach of fold 8. .......................... 160
Table 121. The confusion matrix of Naïve Bayes approach of fold 9. .......................... 161
Table 122. The confusion matrix of Naïve Bayes approach of fold 10. ........................ 161
Table 123. The confusion matrix of SVM of fold 1. .......................................................... 161
Table 124. The confusion matrix of SVM of fold 2. .......................................................... 161
Table 125. The confusion matrix of SVM of fold 3. .......................................................... 162
Table 126. The confusion matrix of SVM of fold 4. .......................................................... 162
Table 127. The confusion matrix of SVM of fold 5. .......................................................... 162
Table 128. The confusion matrix of SVM of fold 6. .......................................................... 162
Table 129. The confusion matrix of SVM of fold 7. .......................................................... 163
Table 130. The confusion matrix of SVM of fold 8. .......................................................... 163
Table 131. The confusion matrix of SVM of fold 9. .......................................................... 163
Table 132. The confusion matrix of SVM of fold 10. ........................................................ 163
Table 133. The confusion matrix of KNN method of fold 1. ........................................... 164
Table 134. The confusion matrix of KNN method of fold 2. ........................................... 164
Table 135. The confusion matrix of KNN method of fold 3. ........................................... 164
Table 136. The confusion matrix of KNN method of fold 4. ........................................... 164
Table 137. The confusion matrix of KNN method of fold 5. ........................................... 165
Table 138. The confusion matrix of KNN method of fold 6. ........................................... 165
Table 139. The confusion matrix of KNN method of fold 7. ........................................... 165

8
Table 140. The confusion matrix of KNN method of fold 8. ........................................... 165
Table 141. The confusion matrix of KNN method of fold 9. ........................................... 166
Table 142. The confusion matrix of KNN method of fold 10.......................................... 166
Table 143. The confusion matrix of J48 Decision tree of fold 1. ................................... 166
Table 144. The confusion matrix of J48 Decision tree of fold 2. ................................... 166
Table 145. The confusion matrix of J48 Decision tree of fold 3. ................................... 167
Table 146. The confusion matrix of J48 Decision tree of fold 4. ................................... 167
Table 147. The confusion matrix of J48 Decision tree of fold 5. ................................... 167
Table 148. The confusion matrix of J48 Decision tree of fold 6. ................................... 167
Table 149. The confusion matrix of J48 Decision tree of fold 7. ................................... 168
Table 150. The confusion matrix of J48 Decision tree of fold 8. ................................... 168
Table 151. The confusion matrix of J48 Decision tree of fold 9. ................................... 168
Table 152. The confusion matrix of J48 Decision tree of fold 10. ................................. 168
Table 153. The confusion matrix of the mixed classifier based on Naïve Bayes approach, SVM and J48 Decision tree using majority vote of fold 1. ............................ 169
Table 154. The confusion matrix of the mixed classifier based on Naïve Bayes approach, SVM and J48 Decision tree using majority vote of fold 2. ............................ 169
Table 155. The confusion matrix of the mixed classifier based on Naïve Bayes approach, SVM and J48 Decision tree using majority vote of fold 3. ............................ 169
Table 156. The confusion matrix of the mixed classifier based on Naïve Bayes approach, SVM and J48 Decision tree using majority vote of fold 4. ............................ 169
Table 157. The confusion matrix of the mixed classifier based on Naïve Bayes approach, SVM and J48 Decision tree using majority vote of fold 5. ............................ 170
Table 158. The confusion matrix of the mixed classifier based on Naïve Bayes approach, SVM and J48 Decision tree using majority vote of fold 6. ............................ 170

9
Table 159. The confusion matrix of the mixed classifier based on Naïve Bayes approach, SVM and J48 Decision tree using majority vote of fold 7. ............................ 170
Table 160. The confusion matrix of the mixed classifier based on Naïve Bayes approach, SVM and J48 Decision tree using majority vote of fold 8. ............................ 170
Table 161. The confusion matrix of the mixed classifier based on Naïve Bayes approach, SVM and J48 Decision tree using majority vote of fold 9. ............................ 171
Table 162. The confusion matrix of the mixed classifier based on Naïve Bayes approach, SVM and J48 Decision tree using majority vote of fold 10. .......................... 171
Table 163. The confusion matrix of the mixed classifier based on Naïve Bayes approach, SVM and KNN method using majority vote of fold 1. ................................... 171
Table 164. The confusion matrix of the mixed classifier based on Naïve Bayes approach, SVM and KNN method using majority vote of fold 2. ................................... 171
Table 165. The confusion matrix of the mixed classifier based on Naïve Bayes approach, SVM and KNN method using majority vote of fold 3. ................................... 172
Table 166. The confusion matrix of the mixed classifier based on Naïve Bayes approach SVM and KNN method using majority vote of fold 4. .................................... 172
Table 167. The confusion matrix of the mixed classifier based on Naïve Bayes approach SVM and KNN method using majority vote of fold 5. .................................... 172
Table 168. The confusion matrix of the mixed classifier based on Naïve Bayes approach SVM and KNN method using majority vote of fold 6. .................................... 172
Table 169. The confusion matrix of the mixed classifier based on Naïve Bayes approach SVM and KNN method using majority vote of fold 7. .................................... 173
Table 170. The confusion matrix of the mixed classifier based on Naïve Bayes approach SVM and KNN method using majority vote of fold 8. .................................... 173
Table 171. The confusion matrix of the mixed classifier based on Naïve Bayes approach SVM and KNN method using majority vote of fold 9. .................................... 173

10
Table 172. The confusion matrix of the mixed classifier based on Naïve Bayes approach SVM and KNN method using majority vote of fold 10. .................................. 173
Table 173. The confusion matrix of the proposed method of fold 1. .......................... 174
Table 174. The confusion matrix of the proposed method of fold 2. .......................... 174
Table 175. The confusion matrix of the proposed method of fold 3. .......................... 174
Table 176. The confusion matrix of the proposed method of fold 4. .......................... 174
Table 177. The confusion matrix of the proposed method of fold 5. .......................... 175
Table 178. The confusion matrix of the proposed method of fold 6. .......................... 175
Table 179. The confusion matrix of the proposed method of fold 7. .......................... 175
Table 180. The confusion matrix of the proposed method of fold 8. .......................... 175
Table 181. The confusion matrix of the proposed method of fold 9. .......................... 176
Table 182. The confusion matrix of the proposed method of fold 10. ....................... 176
Table 183. Actual class selection of eight patterns in training set 1. ............................ 176
Table 184. Actual class selection of eight patterns in training set 2. ............................ 177
Table 185. Actual class selection of eight patterns in training set 3. ............................ 177
Table 186. Actual class selection of eight patterns in training set 4. ............................ 178
Table 187. Actual class selection of eight patterns in training set 5. ............................ 178
Table 188. Actual class selection of eight patterns in training set 6. ............................ 179
Table 189. Actual class selection of eight patterns in training set 7. ............................ 179
Table 190. Actual class selection of eight patterns in training set 8. ............................ 180
Table 191. Actual class selection of eight patterns in training set 9. ............................ 180
Table 192. Actual class selection of eight patterns in training set 10. .......................... 181

11
Content of Figures
Figure 1. The data mining process. ......................................................................................... 16
Figure 2. Example of linear separating dataset in SVM. ...................................................... 23
Figure 3. Example of linear separable case in SVM. ............................................................ 23
Figure 4. Example of non-linear separating dataset in SVM. ............................................. 24
Figure 5. Transformation of the original training data into a higher dimension by the kernel function..................................................................................................................... 24
Figure 6. The classification framework of KNN method. ..................................................... 25
Figure 7. Example of KNN process. ......................................................................................... 27
Figure 8. The tree structure. ..................................................................................................... 30
Figure 9. The Decision tree example. ..................................................................................... 35
Figure 10. A simple neuron network structure. .................................................................... 36
Figure 11. A single-node neural network. .............................................................................. 37
Figure 12. A single-node neural network with multiple inputs. ........................................ 37
Figure 13. A single-layer perceptron neural network. ......................................................... 37
Figure 14. A multilayer perceptron neural network. ........................................................... 38
Figure 15. The sigmoid function curve. .................................................................................. 38
Figure 16. 10-fold cross validation. ......................................................................................... 40
Figure 17. Process of the mixed classifier. ............................................................................. 49
Figure 18. The sub-steps of the mixed classifier. ................................................................. 53
Figure 19. Architecture of neural network in this study. .................................................... 55
Figure 20. 10-fold cross validation in this experiment. ....................................................... 58

12
Chapter 1. Introduction
In the recent decade, data are very important and valuable in several fields such as business, financial, marketing, trading and stock etc. Due to data size, some of these data are beneficial and can be used subsequently. Researchers are interested in extracting the knowledge from these data. The medical information is one of the datasets that many researchers are interested in studying, in order to assist the physician to diagnose and classify the heart patients.
According to the 2015 annual report of ThaiNCD (Bureau of Non-Communicable Disease) [1], heart disease is one of the non-communicable diseases which is the leading cause of death in Thailand. As shown in Table 1, there are 58,681 deaths from heart disease in the year 2014. The death rate of heart disease in Thailand is becoming incessant and progressive every year. In the same way, in the United States of America, the leading cause of death is heart disease. The 2017 Heart Disease and Stroke Statistics from AHA (American Heart Association) shows that 790,000 people have heart attacks each year in the USA and 114,000 people will die because of it. For all the mentioned above, it is imperative that an awareness of this disease should be considered.
Table 1. The number and rate of death per 100,000 population of all age groups caused by non-communicable diseases between 2007-2014 in Thailand.
Diseases 2007 2008 2009 2010 2011 2012 2013 2014
Cardiovascular disease
34,742 (55.20%)
35,391 (56.00%)
39,459 (61.94%)
39,453 (61.94%)
46,349 (72.12%)
54,530 (84.38%)
58,681 (90.34%)
58,681 (90.34%)
Ischemic heart disease
13,742 (20.25%)
13,395 (21.19%)
13,124 (20.68%)
13,037 (20.47%)
14,422 (22.47%)
15,070 (23.45%)
17,388 (26.91%)
18,079 (27.83%)
Stroke 12,995 (20.65%)
13,133 (20.78%)
13,353 (21.04%)
17,540 (27.53%)
19,283 (30.04%)
20,368 (31.69%)
23,350 (36.13%)
25,114 (38.66%)
Hypertension 2,291 (3.64%)
2,463 (3.90%)
2,295 (3.62%)
2,478 (3.89%)
3,664 (5.71%)
3,684 (5.73%)
5,165 (7.99%)
7,115 (10.95%)
Diabetes mellitus
7,686 (12.21%)
7,725 (12.22%)
7,019 (11.06%)
6,855 (10.76%)
7,625 (11.88%)
7,749 (12.06%)
9,647 (14.93%)
11,389 (17.53%)

13
At present, there are several computer science studies that use the heart disease data to assist in the classification of the heart patients’ symptoms. In classifying the heart disease patients, the data mining technique is used to discover some relationships among the heart disease data. Data mining is a powerful tool which has several techniques such as classification, association, clustering techniques etc.
Due to the mentioned benefits of data mining techniques, there are many types of research that proposed the heart disease classification using data mining techniques. In order to improve the performance of the heart disease classification and yield better results than previous research, this thesis proposes a mixed classification based on supervised learning. The mixed classifier is created by using three different techniques; that is, Support Vector Machine (SVM), K-Nearest Neighbor (KNN) method and Naïve Bayes approach based on multi-layer perceptron with backpropagation learning algorithm.
1.1. Objective
In order to improve the performance of the heart disease patients classification, there are two goals as follows.
1. To diagnose heart disease with high accuracy. 2. To evaluate the performance of the proposed model comparing with the
previous research.
1.2. Scope of thesis and constraints
There are two issues in this research as follows. 1. The heart disease dataset was gathered from UCI repository. This dataset
contains 303 instances and 14 attributes including class attribute. Some missing attribute values are denoted by "?".
2. The proposed classifier technique is created by three different basic classification approaches: Naïve Bayes approach, SVM and KNN method to classify patients on heart disease.

14
1.3. Expected outcome
This research aims to propose a classification model for classifying patients into two classes: risk and non-risk. Moreover, our method can be used to support a doctor to diagnose the heart disease, which helps save a patient’s life. Additionally, it can reduce time for diagnosis.

15
Chapter 2. Theoretical backgrounds
2.1. Diagnosis of the heart disease
There are two steps in general diagnosis of the heart disease, in the heart patients. First, preliminary physical examination such as sex, age, weight, height, heart rate and measuring blood pressure etc. is conducted. Next, there is the use of medical instruments to analyze the heart patient and other diagnostics as follows.
1. Electrocardiography (ECG).
This approach is an electrical signal record process of the heart activity, in order to help the physicians detect abnormalities of cardiac arrhythmias and cardiac structures. ECG examines the patients both while they are exercising and not exercising. The use of electrocardiograms while exercising is called “Exercise Stress Test”.
2. Holter Monitoring.
Although this approach is similar to ECG approach, Holter Monitoring can be carried out with the heart patient everywhere, in cases that the ECG is unable to detect abnormalities of cardiac arrhythmias. It takes 24-72 hours to examine.
3. Echocardiography (ECHO). Echocardiography or “ECHO” creates the graphical image, using reflected high-frequency sound wave. It is called ultrasound scanning. The contraction of the heart, conditions of heart valves and detection of the presence of narrowing can be assessed by this approach.
4. Magnetic Resonance Imaging (MRI) MRI is the medical equipment that uses radio wave and a magnetic field to take an image of the tissues, organs and other structures within the body. This approach can support the diagnosis, the treatment plan and follow up on patient's treatment.
5. Computerized Tomography Scan (CT Scan) CT Scan is using computed tomography to conduct diagnosis of the patient. The physician will use radiation to examine the area. This approach provides images with higher resolutions than normal x-rays.

16
2.2. Data mining
Data mining is the process of extraction the large data to find the model or useful knowledge which is hidden in that large data. At present, many fields employ data mining techniques to assist in their data analysis. For example, in business, to launch a product that suits consumer behavior, data mining techniques are used to analyze customer data, sales, marketing, etc. Figure 1 shows the data mining process that consists of four major steps; raw data, data preprocessing, data mining and evaluation.
Figure 1. The data mining process.
In this thesis, classification technique is chosen to classify the heart dataset. Classification is one of the most popular data mining techniques based on supervised learning. This approach divides the original dataset into training and testing set. The training set is used to create the model and this model is evaluated by the testing set. There are several classification techniques, namely Naïve Bayes approach, K-Nearest Neighbor (KNN) method, Support Vector Machine (SVM), Decision tree random forests and artificial neural networks.

17
2.2.1. Naïve Bayes approach Naïve Bayes approach is a classifier technique based on Bayes’ Theorem by using
the conditional probability. The conditional probability is the probability of event A when considering that event B occurs first (The probability of event A given event B). It can be calculated by using equation (2.1). On the other hand, if event B occurs before event A occurs, it can be calculated by using the equation (2.2).
𝑃(𝐵|𝐴) =𝑃(𝐴 ∩ 𝐵)
𝑃(𝐴) (2.1)
where 𝑃(𝐵|𝐴) is the conditional probability of B given A.
𝑃(𝐴 ∩ 𝐵) is the joint probability of A and B.
𝑃(𝐴) is the probability of A.
𝑃(𝐴|𝐵) =𝑃(𝐴 ∩ 𝐵)
𝑃(𝐵) (2.2)
where 𝑃(𝐴|𝐵) is the conditional probability of A given B.
𝑃(𝐴 ∩ 𝐵) is the joint probability of A and B.
𝑃(𝐵) is the probability of B.
The equation (2.1) and (2.2) show that 𝑃(𝐴 ∩ 𝐵) are equivalent. So, the new
equation can be formed as follows.
𝑃(𝐴 ∩ 𝐵) = 𝑃(𝐵│𝐴) × 𝑃(𝐴) from (2.1), 𝑃(𝐴 ∩ 𝐵) = 𝑃(𝐴│𝐵) × 𝑃(𝐵) from (2.2)
Then,
𝑃(𝐵│𝐴) × 𝑃(𝐴) = 𝑃(𝐴|𝐵) × 𝑃(𝐵)
𝑃(𝐵|𝐴) =𝑃(𝐴|𝐵) × 𝑃(𝐵)
𝑃(𝐴) (2.3)
Subsequently, change B to class C.
𝑃(𝐶|𝐴) =𝑃(𝐴|𝐶) × 𝑃(𝐶)
𝑃(𝐴) (2.4)

18
where 𝑃(𝐶|𝐴) is the posterior probability of the class (C) given a set of attributes
(A).
𝑃(𝐶) is the prior probability of the class.
𝑃(𝐴|𝐶) is the probability of a set of attributes (A) given the class (C).
𝑃(𝐴) is the prior probability of a set of attributes.
Suppose there are two class: 𝐶1 and 𝐶2 . After 𝑃(𝐶1|𝐴) and 𝑃(𝐶2|𝐴) are
calculated by using equation (2.4). The set of attributes is assigned to the class with
higher posterior probability.
Example of Naïve Bayes approach
For example, a part of “The heart disease dataset” is obtained from the UCI Machine Learning Repository as shown in Table 2. It contains 14 instances, 4 attributes and 2 classes, risk and non-risk.
Table 2. The heart disease dataset.
slope restecg sex fbs Class (Risk, Non-Risk)
up sloping 0 male false Risk up sloping 0 male true Risk
flat 0 male false Non-Risk
down sloping 1 male false Non-Risk down sloping 2 female false Risk
down sloping 2 female true Risk
flat 2 female true Non-Risk up sloping 1 male false Risk
up sloping 2 female false Non-Risk down sloping 1 female false Risk
up sloping 1 female true Non-Risk
flat 1 male true Non-Risk flat 0 female false Non-Risk
down sloping 1 male true Risk

19
Calculating the conditional probability of all attributes in data training
Table 3. The conditional probability of slope attribute.
slope attribute
class Probability of attribute given the class Risk Non-Risk 𝑃(𝑠𝑙𝑜𝑝𝑒|𝑅𝑖𝑠𝑘) 𝑃(𝑠𝑙𝑜𝑝𝑒|𝑁𝑜𝑛 − 𝑅𝑖𝑠𝑘)
up sloping 3 2 3/7 = 0.43 2/7 = 0.29 flat 0 4 0/7 = 0.00 4/7 = 0.57 down sloping 4 1 4/7 = 0.57 1/7 = 0.14
Table 4. The conditional probability of restecg attribute.
restecg attribute
class Probability of attribute given the class Risk Non-Risk 𝑃(𝑟𝑒𝑠𝑡𝑒𝑐𝑔|𝑅𝑖𝑠𝑘) 𝑃(𝑟𝑒𝑠𝑡𝑒𝑐𝑔|𝑁𝑜𝑛 − 𝑅𝑖𝑠𝑘)
0 2 2 2/7 = 0.29 2/7 = 0.29
1 3 3 3/7 = 0.43 3/7 = 0.43
2 2 2 2/7 = 0.29 2/7 = 0.29
Table 5. The conditional probability of sex attribute.
sex attribute class Probability of attribute given the class
Risk Non-Risk 𝑃(𝑠𝑒𝑥|𝑅𝑖𝑠𝑘) 𝑃(𝑠𝑒𝑥|𝑁𝑜𝑛 − 𝑅𝑖𝑠𝑘) male 4 3 4/7 = 0.57 3/7 = 0.43
female 3 4 3/7 = 0.43 4/7 = 0.57
Table 6. The conditional probability of fbs attribute.
fbs attribute class Probability of attribute given the class
Risk Non-Risk 𝑃(𝑓𝑏𝑠|𝑅𝑖𝑠𝑘) 𝑃(𝑓𝑏𝑠|𝑁𝑜𝑛 − 𝑅𝑖𝑠𝑘) true 3 3 3/7 = 0.43 3/7 = 0.43
false 4 4 4/7 = 0.57 4/7 = 0.57

20
Table 7. The testing instance.
No. slope restecg sex fbs Actual class (Risk, Non-
Risk)
The predicted class of Naïve
Bayes approach
1. up sloping 0 male false Risk Risk 2. flat 2 female true Non-Risk Non-Risk
3. down sloping 1 male true Risk Risk
In this example, the numbers of instances of risk and non-risk classes are equal. Both classes include seven instances. So the probability of each class, 𝑃(𝐶), is 0.5. In the same way, the value of the probability of a set of attributes 𝑃(𝐴) is calculated once and never changed. So 𝑃(𝐶) and 𝑃(𝐴) can be ignored in equation (2.4). Consequently, the equation of Bayes’ Theorem for this example can be modified to the equation below.
𝐺𝑖𝑛𝑖𝑠𝑝𝑙𝑖𝑡(𝑇) = ∑𝑁𝑖
𝑁𝐺𝑖𝑛𝑖(𝑇 = 𝑡𝑖)
𝑛
𝑖=1
(2.5)
where 𝑃(𝐴|𝐶) = 𝑃(𝐴1|𝐶) × 𝑃(𝐴2|𝐶) × 𝑃(𝐴3|𝐶) × … × 𝑃(𝐴𝑖|𝐶)
Calculating the posterior probability of instance no.1
𝑃(𝑅𝑖𝑠𝑘|𝑠𝑙𝑜𝑝𝑒 = 𝑢𝑝 𝑠𝑙𝑜𝑝𝑖𝑛𝑔, 𝑟𝑒𝑠𝑡𝑒𝑐𝑔 = 0, 𝑠𝑒𝑥 = 𝑚𝑎𝑙𝑒, 𝑓𝑏𝑠 = 𝑓𝑎𝑙𝑠𝑒 )
= 𝑃(𝑠𝑙𝑜𝑝𝑒 = 𝑢𝑝 𝑠𝑙𝑜𝑝𝑖𝑛𝑔|𝑅𝑖𝑠𝑘) × 𝑃(𝑟𝑒𝑠𝑡𝑒𝑐𝑔 = 0, |𝑅𝑖𝑠𝑘) × 𝑃( 𝑠𝑒𝑥 = 𝑚𝑎𝑙𝑒|𝑅𝑖𝑠𝑘)
× 𝑃(𝑓𝑏𝑠 = 𝑓𝑎𝑙𝑠𝑒|𝑅𝑖𝑠𝑘)
= 0.43 × 0.29 × 0.57 × 0.57 = 0.0405
𝑃(𝑁𝑜𝑛 − 𝑅𝑖𝑠𝑘|𝑠𝑙𝑜𝑝𝑒 = 𝑢𝑝 𝑠𝑙𝑜𝑝𝑖𝑛𝑔 , 𝑟𝑒𝑠𝑡𝑒𝑐𝑔 = 0, 𝑠𝑒𝑥 = 𝑚𝑎𝑙𝑒, 𝑓𝑏𝑠 = 𝑓𝑎𝑙𝑠𝑒)
= 𝑃(𝑠𝑙𝑜𝑝𝑒 = 𝑢𝑝 𝑠𝑙𝑜𝑝𝑖𝑛𝑔|𝑁𝑜𝑛 − 𝑅𝑖𝑠𝑘) × 𝑃(𝑟𝑒𝑠𝑡𝑒𝑐𝑔 = 0|𝑁𝑜𝑛 − 𝑅𝑖𝑠𝑘)
× 𝑃(𝑠𝑒𝑥 = 𝑚𝑎𝑙𝑒|𝑁𝑜𝑛 − 𝑅𝑖𝑠𝑘) × 𝑃(𝑓𝑏𝑠 = 𝑓𝑎𝑙𝑠𝑒|𝑁𝑜𝑛 − 𝑅𝑖𝑠𝑘)
= 0.29 × 0.29 × 0.43 × 0.57 = 0.0206
As the value of 𝑃(𝑅𝑖𝑠𝑘 |𝐴𝑡𝑡𝑟𝑖𝑏𝑢𝑡𝑒) is greater than 𝑃(𝑁𝑜𝑛 − 𝑅𝑖𝑠𝑘 |𝐴𝑡𝑡𝑟𝑖𝑏𝑢𝑡𝑒) ,
this instance should belong to risk class with higher probability. So, Risk class is the
answer of this instance.
21
Calculating the posterior probability of instance no.2
𝑃(𝑅𝑖𝑠𝑘|𝑠𝑙𝑜𝑝𝑒 = 𝑓𝑙𝑎𝑡, 𝑟𝑒𝑠𝑡𝑒𝑐𝑔 = 2, 𝑠𝑒𝑥 = 𝑓𝑒𝑚𝑎𝑙𝑒, 𝑓𝑏𝑠 = 𝑡𝑟𝑢𝑒 )
= 𝑃(𝑠𝑙𝑜𝑝𝑒 = 𝑓𝑙𝑎𝑡|𝑅𝑖𝑠𝑘) × 𝑃(𝑟𝑒𝑠𝑡𝑒𝑐𝑔 = 2 |𝑅𝑖𝑠𝑘) × 𝑃(𝑠𝑒𝑥 = 𝑓𝑒𝑚𝑎𝑙𝑒 |𝑅𝑖𝑠𝑘)
× 𝑃(𝑓𝑏𝑠 = 𝑡𝑟𝑢𝑒 |𝑅𝑖𝑠𝑘)
= 0 × 0.29 × 0.43 × 0.43 = 0
In this case, 𝑃(𝑠𝑙𝑜𝑝𝑒 = 𝑓𝑙𝑎𝑡|𝑅𝑖𝑠𝑘) is zero that means none of this pattern occurs in this training set. So the total value of 𝑃(𝑅𝑖𝑠𝑘|𝑠𝑙𝑜𝑝𝑒 = 𝑓𝑙𝑎𝑡, 𝑟𝑒𝑠𝑡𝑒𝑐𝑔 = 2, 𝑠𝑒𝑥 =
𝑓𝑒𝑚𝑎𝑙𝑒, 𝑓𝑏𝑠 = 𝑡𝑟𝑢𝑒) is zero. The probability estimation is required to handle this situation.
Laplace is probability estimation that deals with conditional probability which is zero. It can be calculated by using equation below:
𝑃(𝐴𝑖|𝐶 )𝑛𝑒𝑤 =𝑃(𝐴𝑖|𝐶 )𝑜𝑙𝑑 + 1
𝑛 + 𝑐 (2.6)
where 𝑛 is the number of instances which has class as 𝐶 𝑐 is the number of classes in dataset.
For example.
𝑃(𝑠𝑙𝑜𝑝𝑒 = 𝑓𝑙𝑎𝑡|𝑅𝑖𝑠𝑘)𝑛𝑒𝑤 =𝑃(𝑠𝑙𝑜𝑝𝑒 = 𝑓𝑙𝑎𝑡|𝑅𝑖𝑠𝑘)𝑜𝑙𝑑 + 1
𝑛 + 𝑐
=0 + 1
7 + 2
= 0.11
Thus, The probability estimations of 𝑃(𝑠𝑙𝑜𝑝𝑒 = 𝑓𝑙𝑎𝑡|𝑅𝑖𝑠𝑘) and 𝑃(𝑠𝑙𝑜𝑝𝑒 = 𝑓𝑙𝑎𝑡|𝑁𝑜𝑛 − 𝑅𝑖𝑠𝑘) are shown in Table 8.
Table 8. The probability estimation of slope attribute.
slope attribute
class The probability estimation Risk Non-Risk 𝑃(𝑠𝑙𝑜𝑝𝑒 = 𝑓𝑙𝑎𝑡|𝑅𝑖𝑠𝑘) 𝑃(𝑠𝑙𝑜𝑝𝑒 = 𝑓𝑙𝑎𝑡|𝑁𝑜𝑛 − 𝑅𝑖𝑠𝑘)
flat 0 4 0 + 1
7 + 2= 0.11
4 + 1
7 + 2= 0.56

22
Then, the posterior probability of the instance no.2 is described as below.
𝑃(𝑠𝑙𝑜𝑝𝑒 = 𝑓𝑙𝑎𝑡|𝑅𝑖𝑠𝑘) × 𝑃(𝑟𝑒𝑠𝑡𝑒𝑐𝑔 = 2 |𝑅𝑖𝑠𝑘) × 𝑃(𝑠𝑒𝑥 = 𝑓𝑒𝑚𝑎𝑙𝑒 |𝑅𝑖𝑠𝑘)
× 𝑃(𝑓𝑏𝑠 = 𝑡𝑟𝑢𝑒 |𝑅𝑖𝑠𝑘)
= 0.11 × 0.29 × 0.43 × 0.43 = 0.0059
Also, 𝑃(𝑁𝑜𝑛 − 𝑅𝑖𝑠𝑘|𝑠𝑙𝑜𝑝𝑒 = 𝑓𝑙𝑎𝑡, 𝑟𝑒𝑠𝑡𝑒𝑐𝑔 = 2, 𝑠𝑒𝑥 = 𝑓𝑒𝑚𝑎𝑙𝑒, 𝑓𝑏𝑠 = 𝑡𝑟𝑢𝑒)
= 𝑃(𝑠𝑙𝑜𝑝𝑒 = 𝑓𝑙𝑎𝑡|𝑁𝑜𝑛 − 𝑅𝑖𝑠𝑘) × 𝑃(𝑟𝑒𝑠𝑡𝑒𝑐𝑔 = 2|𝑁𝑜𝑛 − 𝑅𝑖𝑠𝑘)
× 𝑃(𝑠𝑒𝑥 = 𝑓𝑒𝑚𝑎𝑙𝑒|𝑁𝑜𝑛 − 𝑅𝑖𝑠𝑘) × 𝑃(𝑓𝑏𝑠 = 𝑡𝑟𝑢𝑒|𝑁𝑜𝑛 − 𝑅𝑖𝑠𝑘) = 0.56 × 0.29 × 0.57 × 0.43 = 0.0398
As the value of 𝑃(𝑁𝑜𝑛 − 𝑅𝑖𝑠𝑘 |𝐴𝑡𝑡𝑟𝑖𝑏𝑢𝑡𝑒) is greater than 𝑃(𝑅𝑖𝑠𝑘 |𝐴𝑡𝑡𝑟𝑖𝑏𝑢𝑡𝑒), this instance should belong to non-risk class with higher probability. So, Non-Risk class is the answer of this instance.
Calculating the posterior probability of instance no.3
𝑃(𝑅𝑖𝑠𝑘|𝑠𝑙𝑜𝑝𝑒 = 𝑑𝑜𝑤𝑛 𝑠𝑙𝑜𝑝𝑖𝑛𝑔, 𝑟𝑒𝑠𝑡𝑒𝑐𝑔 = 1, 𝑠𝑒𝑥 = 𝑚𝑎𝑙𝑒, 𝑓𝑏𝑠 = 𝑡𝑟𝑢𝑒)
= 𝑃(𝑠𝑙𝑜𝑝𝑒 = 𝑑𝑜𝑤𝑛 𝑠𝑙𝑜𝑝𝑖𝑛𝑔 |𝑅𝑖𝑠𝑘) × 𝑃(𝑟𝑒𝑠𝑡𝑒𝑐𝑔 = 1 |𝑅𝑖𝑠𝑘)
× 𝑃(𝑠𝑒𝑥 = 𝑚𝑎𝑙𝑒|𝑅𝑖𝑠𝑘) × 𝑃(𝑓𝑏𝑠 = 𝑡𝑟𝑢𝑒|𝑅𝑖𝑠𝑘)
= 0.57 × 0.43 × 0.57 × 0.43
= 0.06007
𝑃(𝑁𝑜𝑛 − 𝑅𝑖𝑠𝑘|𝑠𝑙𝑜𝑝𝑒 = 𝑑𝑜𝑤𝑛 𝑠𝑙𝑜𝑝𝑖𝑛𝑔, 𝑟𝑒𝑠𝑡𝑒𝑐𝑔 = 1, 𝑠𝑒𝑥 = 𝑚𝑎𝑙𝑒, 𝑓𝑏𝑠 = 𝑡𝑟𝑢𝑒 )
= 𝑃(𝑠𝑙𝑜𝑝𝑒 = 𝑑𝑜𝑤𝑛 𝑠𝑙𝑜𝑝𝑖𝑛𝑔 |𝑁𝑜𝑛 − 𝑅𝑖𝑠𝑘) × 𝑃(𝑟𝑒𝑠𝑡𝑒𝑐𝑔 = 1 |𝑁𝑜𝑛 − 𝑅𝑖𝑠𝑘)
× 𝑃(𝑠𝑒𝑥 = 𝑚𝑎𝑙𝑒|𝑁𝑜𝑛 − 𝑅𝑖𝑠𝑘) × 𝑃(𝑓𝑏𝑠 = 𝑡𝑟𝑢𝑒|𝑁𝑜𝑛 − 𝑅𝑖𝑠𝑘)
= 0.14 × 0.43 × 0.43 × 0.43
= 0.01113
As the value of 𝑃(𝑅𝑖𝑠𝑘|𝐴𝑡𝑡𝑟𝑖𝑏𝑢𝑡𝑒) is greater than 𝑃(𝑁𝑜𝑛 − 𝑅𝑖𝑠𝑘|𝐴𝑡𝑡𝑟𝑖𝑏𝑢𝑡𝑒), this instance should belong to risk class with higher probability. So, Risk class is the answer of this instance.

23
2.2.2. Support Vector Machine Support Vector Machine is a classification technique that separates the data by
hyperplane. Hyperplane can be a linear line or a plane used to classify the instance into two classes. The SVM concept is divided into two cases, depending upon a function used to classify data.
The first case is linear separable. The dataset can be shown in Figure 2. The details of this case are as follows:
1. Plot the dataset in feature space (dimensional space) as shown in Figure 3 (a).
2. Find the linear hyperplane that separates the instances into two classes with a large margin between the hyperplane and each support vector. So there is one linear hyperplane as shown in Figure 3 (b).
Figure 2. Example of linear separating dataset in SVM.
Figure 3. Example of linear separable case in SVM.

24
The second case is not linear separable. The dataset can be shown in Figure 4. In this case, kernel function for non-linear mapping is used. The details of this case are as follows:
1. Use the kernel function for non-linear mapping to transform the original training data into a higher dimension. The result depends on a suitable kernel function. Figure 5 shows the use of the kernel function.
2. Search for the linear optimal separating hyperplane within new dimension. There is one hyperplane to separate data into two classes which have the large margin.
Figure 4. Example of non-linear separating dataset in SVM.
Figure 5. Transformation of the original training data into a higher dimension by the kernel function.

25
2.2.3. K-Nearest Neighbor method K-Nearest Neighbor method is one of the supervised learning methods that
divides the original data set into the training set and testing set, then generates the classification model from the training set and uses the testing set to evaluate the performance of that model. This method measures similarity to compare an unknown instance with every instance in the training set so that it can assign an unknown instance to the class based on majority class that is nearest to the unknown instance. Figure 6 presents the classification framework of KNN method.
Figure 6. The classification framework of KNN method.

26
For example, in Figure 7, there are 2 classes in datasets, class 0 and class 1 which
are represented by orange circles and blue squares respectively. The two dimensional
spaces in this example consist of A1 and A2. The steps of KNN method are as follows.
Step 1. Determine the number of nearest neighbor. This example sets k as 5. Step 2. Transform the original training data into n-dimensional space, (n is a
number of features or attributes). In Figure 6 (a), the original training data are transformed into two-dimensional space.
Step 3. Measure the similarity of the unknown instance with each training instance in the dimensional space. According to Figure 6 (b) and (c), when the unknown instance appears in the dimensional space, the similarity of the unknown instance and each training instance in the dimensional space is measured. In this work, the Euclidean distance is used to measure the similarity.
Step 4. Sort the similarity values and select k instances of nearest neighbor which have the highest similarity. In Figure 6 (d), k is 5, so the top 5 instances with the highest similarity consist of class 0 four instances and class 1 one instance. These instances are nearest neighbors.
Step 5. Assign an unknown instance to the class based on majority class in step 4 to the unknown instance. In this example, Figure 6 (e) shows that the unknown instance is assigned to class 0.

27
.
Figure 7. Example of KNN process.

28
There are different similarity measures, but the most popular similarity measures are Euclidean distance, Manhattan distance, Minkowski distance, Cosine similarity and Jaccard similarity. This work uses the Euclidean distance to measure the similarity of each instance which can be calculated by the equation below.
𝐷𝐸𝑢 = √∑(𝑥𝑖 − 𝑦𝑖)2
𝑚
𝑖=1
(2.7)
where 𝑥𝑖, 𝑦𝑖 are attribute 𝑖 of two instances in data set m is the number of attributes in each instance of the dataset.
An example of calculating two similarities from one instance compared with two other instances are provided. In Table 9, three instances contain three attributes. In order to measure two similarities, one between instance1 and instance2 and another between instance1 and instance3, the Euclidean distances are calculated as follows.
Table 9. Three instances used for calculating two similarities.
𝐷𝐸𝑢 = √∑(𝐼𝑛𝑠𝑡𝑎𝑛𝑐𝑒1 𝑖 − 𝐼𝑛𝑠𝑡𝑎𝑛𝑐𝑒2 𝑖)2
3
𝑖=1
𝐷𝐸𝑢 = √(2 − 3)2 + (5 − 6)2 + (4 − 5)2
𝐷𝐸𝑢 = √(−1)2 + (−1)2 + (−1)2
= √3 = 1.73205080757
𝐷𝐸𝑢 = √∑(𝐼𝑛𝑠𝑡𝑎𝑛𝑐𝑒1 𝑖 − 𝐼𝑛𝑠𝑡𝑎𝑛𝑐𝑒3 𝑖)2
3
𝑖=1
𝐷𝐸𝑢 = √(2 − 4)2 + (5 − 3)2 + (4 − 2)2
𝐷𝐸𝑢 = √(2)2 + (2)2 + (2)2
= √12 = 3.46410161514
Instance Attributes
A1 A3 A4 Instance1 2 5 4
Instance2 3 6 5
Instance3 4 3 2

29
The Euclidean distance between instance1 and instance2 is 1.73205080757 while the distance between instance1 and instance3 is 3.46410161514. Therefore, instance1 is more similar to instance2 than to instance3.

30
2.2.4. Decision tree Decision tree is a classification technique based on a tree structure. This
technique is a widely used classification technique. The tree structure is shown in Figure 8.
Figure 8. The tree structure. The tree structure consists of a root node, internal nodes, leaf nodes and branch
which are described as follows. - The root node is an attribute or feature of the dataset that can be clearly split.
There are one or more outgoing branches and no incoming branches of the root node.
- Internal nodes are attributes or features like a root node but there are one incoming branch and one or more outgoing branches of the internal node.
- Leaf nodes are class labels of the data (The output from classification). There are one incoming branch and no outgoing branches of the leaf node.
- Branch is an attribute value that is split from the internal node (attribute). So, if there are two attribute values, there will be two branches from this attribute (internal node).

31
Decision tree Construction Selecting the attribute as the root node.
In order to select an attribute which has purity as a root node. (Root nodes can split the data clearly.) Three main measures are frequently used for selecting attributes: Gini Index, Entropy and Misclassification error. In this work, Gini index is used as a measure for selecting attributes. There are two equations for selecting attributes as shown below.
𝐺𝑖𝑛𝑖(𝑇 = 𝑡𝑖) = 1 − ∑[𝑝(𝑇 = 𝑡𝑖)]2
𝑛
𝑖=1
(2.8)
where 𝑛 is a number of classes, 𝑇 is a node of tree (or an attribute in dataset), 𝑡𝑖 is the value of attribute 𝑇,
𝑝(𝑇 = 𝑡𝑖) is probability of 𝑇 that is equal to 𝑡𝑖 .
and
𝐺𝑖𝑛𝑖𝑠𝑝𝑙𝑖𝑡(𝑇) = ∑𝑁𝑖
𝑁𝐺𝑖𝑛𝑖(𝑇 = 𝑡𝑖)
𝑛
𝑖=1
(2.9)
where 𝑁 is a number of instances, 𝑇 is a node of tree (or an attributes in dataset),
𝑁𝑖 is a number of instances providing each attribute value 𝑡𝑖 of attribute 𝑇.

32
For example, a partial heart disease dataset is retrieved from the original heart
disease dataset in UCI Machine Learning Repository as shown in Table 10. It contains
14 instances, 4 attributes and 2 class, risk and non-risk.
Table 10. A partial heart disease dataset.
slope restecg sex fbs Class (Risk, Non-Risk) up sloping 0 male false Risk
up sloping 0 male true Risk
flat 0 male false Non-Risk down sloping 1 male false Non-Risk
down sloping 2 female false Risk
down sloping 2 female true Risk flat 2 female true Non-Risk
up sloping 1 male false Risk
up sloping 2 female false Non-Risk down sloping 1 female false Risk
up sloping 1 female true Non-Risk flat 1 male true Non-Risk
flat 0 female false Non-Risk
down sloping 1 male true Risk
From this dataset, the values of slope attribute contains up sloping, down sloping and flat. Next, there are three different values in the restecg, that is, 0, 1 and 2. Moreover, there are two possible values in the sex attribute. Finally, fbs contains true and false. All of these values are presented in Tables 11, 12, 13 and 14 respectively.

33
Table 11. The number of slope attribute values in each class.
slope attribute Class
Risk Non-Risk
up sloping 3 2
flat 0 4 down sloping 4 1
With this table, the calculation can be given as follows.
𝐺𝑖𝑛𝑖(𝑠𝑙𝑜𝑝𝑒 = 𝑢𝑝 𝑠𝑙𝑜𝑝𝑖𝑛𝑔) = 1 − (3
5)
2
− (2
5)
2
= 0.48
𝐺𝑖𝑛𝑖(𝑠𝑙𝑜𝑝𝑒 = 𝑓𝑙𝑎𝑡) = 1 − (0
4)
2
− (4
4)
2
= 0
𝐺𝑖𝑛𝑖(𝑠𝑙𝑜𝑝𝑒 = 𝑑𝑜𝑤𝑛 𝑠𝑙𝑜𝑝𝑖𝑛𝑔) = 1 − (4
5)
2
− (1
5)
2
= 0.32
𝐺𝑖𝑛𝑖𝑠𝑝𝑙𝑖𝑡(𝑠𝑙𝑜𝑝𝑒) = (5
14) (0.48) + (
4
14) (0) + (
5
14) (0.32) = 0.286
Table 12. The number of restecg attribute values in each class.
restecg attribute Class
Risk Non-Risk
0 2 2
1 3 3 2 2 2
With this table, the calculation can be given as follows.
𝐺𝑖𝑛𝑖(𝑟𝑒𝑠𝑡𝑒𝑐𝑔 = 0) = 1 − (2
4)
2
− (2
4)
2
= 0.5
𝐺𝑖𝑛𝑖(𝑟𝑒𝑠𝑡𝑒𝑐𝑔 = 1) = 1 − (3
6)
2
− (3
6)
2
= 0.5
𝐺𝑖𝑛𝑖(𝑟𝑒𝑠𝑡𝑒𝑐𝑔 = 2) = 1 − (2
4)
2
− (2
4)
2
= 0.5
𝐺𝑖𝑛𝑖𝑠𝑝𝑙𝑖𝑡(𝑟𝑒𝑠𝑡𝑒𝑐𝑔) = (4
14) (0.5) + (
6
14) (0.5) + (
4
14) (0.5) = 0.500

34
Table 13. The number of sex attribute values in each class.
sex attribute Class
Risk Non-Risk
male 4 3
female 3 4
With this table, the calculation can be given as follows.
𝐺𝑖𝑛𝑖(𝑠𝑒𝑥 = 𝑚𝑎𝑙𝑒) = 1 − (4
7)
2
− (3
7)
2
= 0.49
𝐺𝑖𝑛𝑖(𝑠𝑒𝑥 = 𝑓𝑒𝑚𝑎𝑙𝑒) = 1 − (3
7)
2
− (4
7)
2
= 0.49
𝐺𝑖𝑛𝑖𝑠𝑝𝑙𝑖𝑡(𝑠𝑒𝑥 ) = (7
14) (0.49) + (
7
14)(0.49) = 0.490
Table 14. The number of fbs attribute values in each class.
fbs attribute Class
Risk Non-Risk true 3 3
false 4 4
With this table, the calculation can be given as follows.
𝐺𝑖𝑛𝑖(𝑓𝑏𝑠 = 𝑡𝑟𝑢𝑒) = 1 − (3
6)
2
− (3
6)
2
= 0.5
𝐺𝑖𝑛𝑖(𝑓𝑏𝑠 = 𝑓𝑎𝑙𝑠𝑒) = 1 − (4
8)
2
− (4
8)
2
= 0.5
𝐺𝑖𝑛𝑖𝑠𝑝𝑙𝑖𝑡(𝑓𝑏𝑠 ) = (6
14) (0.5) + (
8
14)(0.5) = 0.500
After the calculation of 𝐺𝑖𝑛𝑖𝑠𝑝𝑙𝑖𝑡(𝑇) is finished, the 𝐺𝑖𝑛𝑖𝑠𝑝𝑙𝑖𝑡(𝑇) results of these attributes are compared. The lowest 𝐺𝑖𝑛𝑖𝑠𝑝𝑙𝑖𝑡(𝑇) value of attributes will be selected as a root node. The above example shows that the 𝐺𝑖𝑛𝑖𝑠𝑝𝑙𝑖𝑡(𝑠𝑙𝑜𝑝𝑒 ) result has the lowest value. Therefore, the slope attribute is selected as the root node. This step is recursively repeated until the tree is complete.
35
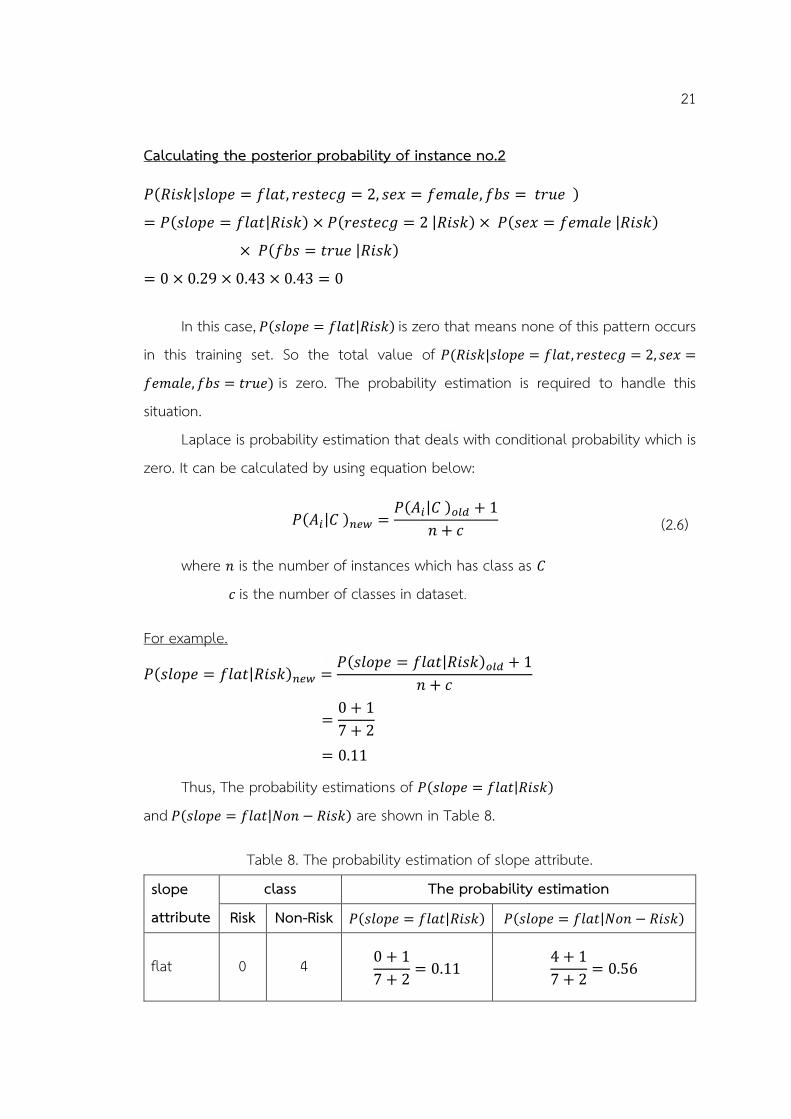
As shown in Figure 9, the Decision tree can generate rules that are used to classify the heart disease dataset into risk or non-risk. The rules from this example are explained as follow.
Figure 9. The Decision tree example.
1. If slope=up sloping and sex=male then class=Risk 2. If slope=up sloping and sex=female then class=Non-Risk
3. If slope=flat then class=Non-Risk
4. If slope=down sloping then class=Risk
There are four rules from Figure 9. Each rule is generated from a path of root node to leaf nodes.
In this work, J48 Decision tree [12] using information gain is selected to compare any other classifiers including the proposed method.

36
2.2.5. Artificial Neural Network Artificial Neural Network is a branch of artificial intelligence, a simulation of the
human brain function, which consists of a large number of neurons (nodes). A node is the processor unit in the human brain. Each node can have many inputs. But there is only one output from node. The output of a node becomes the input for other nodes. Every output is connected to all nodes in the previous layer. Each connection of nodes has a weight. Weight is the value that represents the significance of each node to another node in the next layer. A simple structure of neuron network can be adjusted, as shown in Figure 10. Also, Figures 11, 12, 13 and 14 present the neural networks from simplest to most complex structure.
Figure 10. A simple neuron network structure.
In Figure 11, a simple neural network with single node, one input and one weight called a single-node neural network is illustrated. 𝑥 is an input, 𝑤 is a weight and 𝑂 is the output from the activation function 𝑓(𝑚). The bias and weight are parameters that can be optimized for a neural network.

37
Figure 11. A single-node neural network.
Figure 12 shows a single node neural network with multiple inputs. It consists of a single node, n inputs and weights.
Figure 12. A single-node neural network with multiple inputs.
Figure 13 shows a single-layer perceptron neural network. It consists of one layer, many nodes and inputs.
Figure 13. A single-layer perceptron neural network.

38
Figure 14 shows a multi-layer perceptron neural network. It is the most popular artificial neural network. It consists of multi-layer, many nodes and inputs. Moreover, it can be applied to many pattern recognition problems.
Figure 14. A multilayer perceptron neural network.
Generally, there are well-known activation functions, such as linear function, a sigmoid function, Tanh or Hyperbolic Tangent and ReLU or Rectified Linear Unit. In this work, sigmoid function is selected as the activation function. The function is similar to the S curve as shown in Figure 15. The sigmoid function can be calculated by using the equation below.
𝑓(𝑥) =1
1 + 𝑒−𝑥 (2.10)
Figure 15. The sigmoid function curve.
39
2.2.6. K-fold cross validation To evaluate the performance of the classification model, the original dataset
must be divided into training and testing data. The training data is used to create the classification model. Then, this model is evaluated by using the testing data. There are three main techniques to divide the data, self-consistency test, split test and cross-validation test. In this work, K-fold cross validation is selected to divide the heart disease dataset.
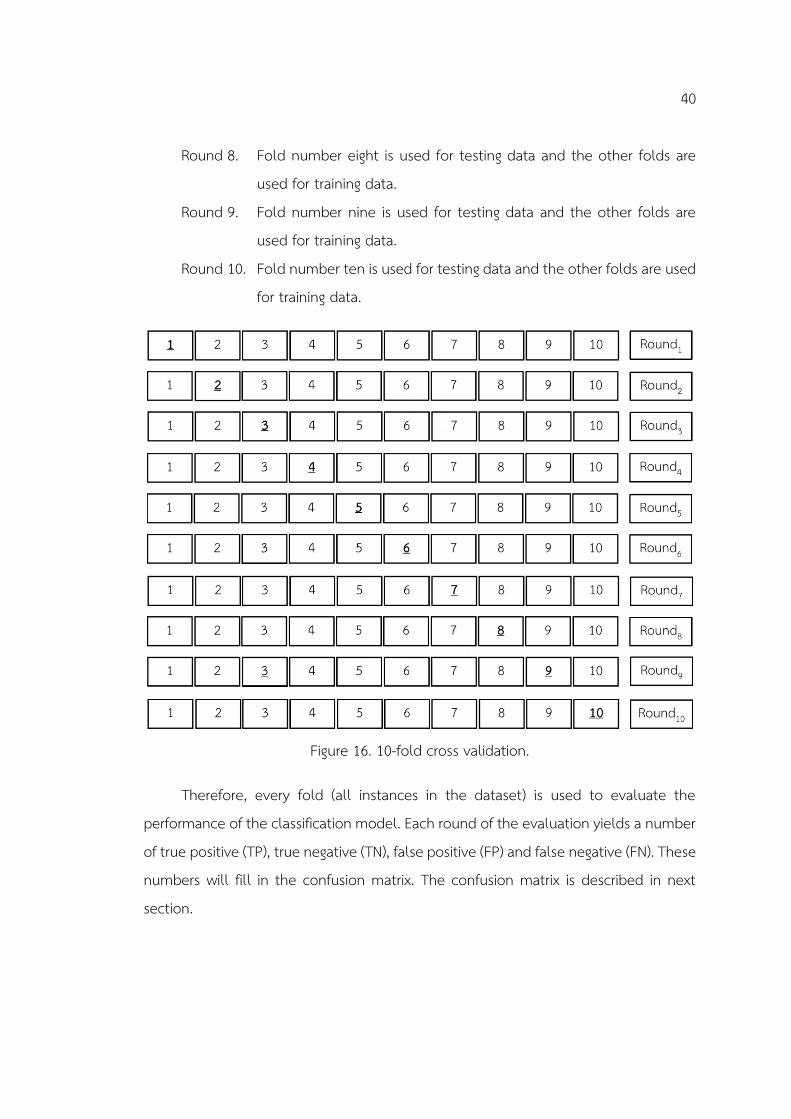
K-fold cross validation is a widely used technique for dividing dataset to evaluate the performance of a classification model. This technique will divide the dataset into many subsets or folds, in which number of subsets depends on number of K. For example, for 10-fold cross validation, the dataset is divided into 10 folds. Each fold has an equivalent number of instances. Then each fold is used to evaluate the classification model while the other folds are used for training process.
According to Figure 16, the process of 10-fold cross validation is described as follows.
Round 1. Fold number one is used for testing data and the other folds are used for training data. The training data is used to create the classification model and testing data is used to evaluate that model.
Round 2. Fold number two is used for testing data and the other folds are used for training data.
Round 3. Fold number three is used for testing data and the other folds are used for training data.
Round 4. Fold number four is used for testing data and the other folds are used for training data.
Round 5. Fold number five is used for testing data and the other folds are used for training data.
Round 6. Fold number six is used for testing data and the other folds are used for training data.
Round 7. Fold number seven is used for testing data and the other folds are used for training data.
40
Round 8. Fold number eight is used for testing data and the other folds are used for training data.
Round 9. Fold number nine is used for testing data and the other folds are used for training data.
Round 10. Fold number ten is used for testing data and the other folds are used for training data.
Figure 16. 10-fold cross validation.
Therefore, every fold (all instances in the dataset) is used to evaluate the performance of the classification model. Each round of the evaluation yields a number of true positive (TP), true negative (TN), false positive (FP) and false negative (FN). These numbers will fill in the confusion matrix. The confusion matrix is described in next section.
41
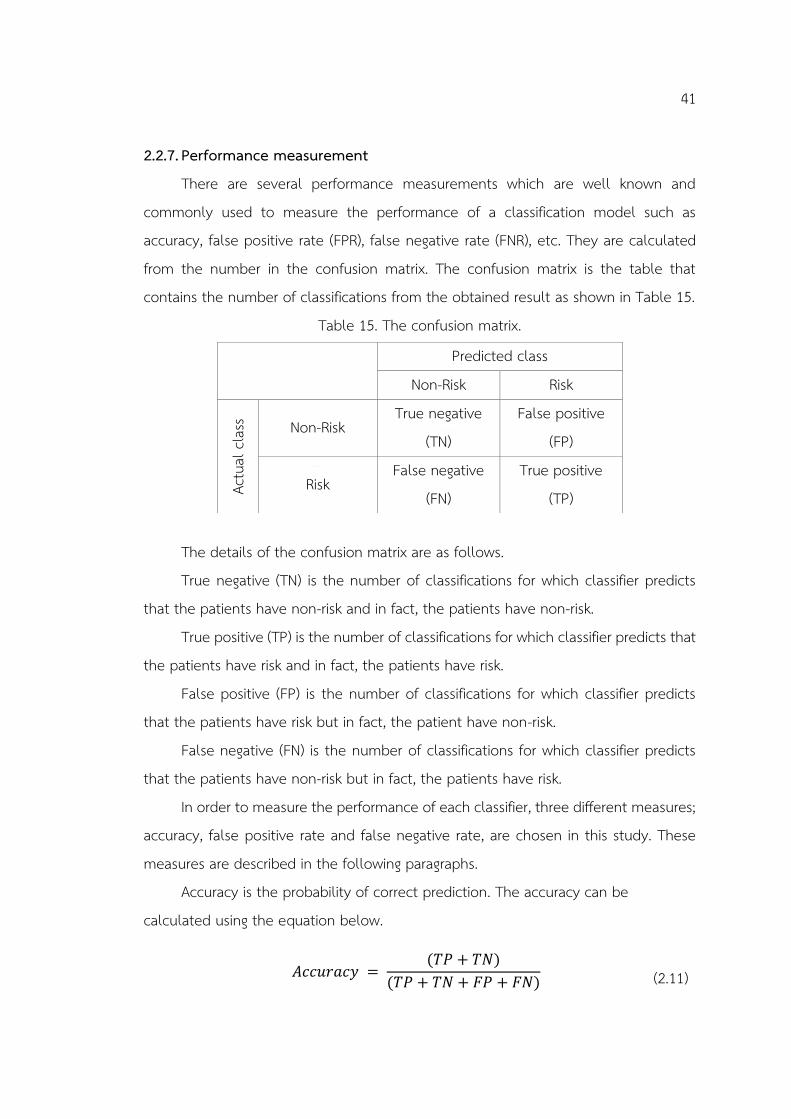
2.2.7. Performance measurement There are several performance measurements which are well known and
commonly used to measure the performance of a classification model such as accuracy, false positive rate (FPR), false negative rate (FNR), etc. They are calculated from the number in the confusion matrix. The confusion matrix is the table that contains the number of classifications from the obtained result as shown in Table 15.
Table 15. The confusion matrix.
The details of the confusion matrix are as follows. True negative (TN) is the number of classifications for which classifier predicts
that the patients have non-risk and in fact, the patients have non-risk. True positive (TP) is the number of classifications for which classifier predicts that
the patients have risk and in fact, the patients have risk. False positive (FP) is the number of classifications for which classifier predicts
that the patients have risk but in fact, the patient have non-risk. False negative (FN) is the number of classifications for which classifier predicts
that the patients have non-risk but in fact, the patients have risk. In order to measure the performance of each classifier, three different measures;
accuracy, false positive rate and false negative rate, are chosen in this study. These measures are described in the following paragraphs.
Accuracy is the probability of correct prediction. The accuracy can be calculated using the equation below.
𝐴𝑐𝑐𝑢𝑟𝑎𝑐𝑦 = (𝑇𝑃 + 𝑇𝑁)
(𝑇𝑃 + 𝑇𝑁 + 𝐹𝑃 + 𝐹𝑁) (2.11)
Predicted class
Non-Risk Risk
Actu
al c
lass
Non-Risk True negative
(TN) False positive
(FP)
Risk False negative
(FN) True positive
(TP)

42
False positive rate is the ratio of the number of incorrectly predicted non-risk patients to the total number of actual non-risk patients.
𝐹𝑎𝑙𝑠𝑒 𝑝𝑜𝑠𝑖𝑡𝑖𝑣𝑒 𝑟𝑎𝑡𝑒 = 𝐹𝑃
(𝑇𝑁 + 𝐹𝑃) (2.12)
False negative rate is the ratio of the number of incorrectly predicted risk patients and to the total number of actual risk patients.
𝐹𝑎𝑙𝑠𝑒 𝑛𝑒𝑔𝑎𝑡𝑖𝑣𝑒 𝑟𝑎𝑡𝑒 = 𝐹𝑁
(𝑇𝑃 + 𝐹𝑁) (2.13)

43
Chapter 3. Related Works
In the recent decades, there have been many studies presenting several data mining techniques with medical data such as Naïve Bayes approach, Support Vector Machine (SVM), K-Nearest Neighbor (KNN) method, Decision tree, Artificial Neural Network (ANN) to help medical diagnosis and classification of patients. This Chapter reviews previously relevant research on the classification of medical information. Table 16 presents eight research works related to heart disease classification and data mining techniques.
Table 16. The previous research on medical classification.
Years Research name Author (s)
2010 Diagnosis of Heart Disease using Data Mining Algorithm [3]
A. Rajkumar and G. S. Reena
2013 Comparison of Data Mining Classification Algorithms for Breast Cancer Prediction [8]
C. Shah and A. G. Jivani
2014
An Ensemble Based Decision Support Framework for Intelligent Heart Disease Diagnosis [4]
S. Bashir, U. Qamar, and M. Y. Javed
A Comparative Study of Breast Cancer Detection based on SVM and MLP BPN Classifier [9]
S. Ghosh
Prediction of Diseases by Cascading Clustering and Classification [10]
B. V. Sumana and T. Santhanam
2015 Neural Network Diagnosis of Heart Disease [5] E. O. Olaniyi, O. K. Oyedotun, and A. Helwan
2016
Diagnosing of Heart Diseases Using Average K-Nearest Neighbor Algorithm of data mining [6]
C. Kalaiselvi
Classification and Prediction of Heart Disease Risk Using Data Mining Techniques of Support Vector Machine and Artificial Neural Network [7]
S. Radhimeenakshi
The details of these previous studies are described as follows.

44
In 2010, “Diagnosis of Heart Disease Using Datamining Algorithm” was proposed by A. Rajkumar and G. S. Reena [3]. They selected three different data mining techniques namely Naïve Bayes approach, KNN method, and Decision List algorithm to classify the heart disease dataset with 10-fold cross validation. This dataset consists of 3000 instances and 14 attributes. The Tanagra tool was used for this experiment to compare the results of three techniques. The accuracy and time taken to build the models were used for the performance comparison of these three techniques. As shown in Table 17, Naïve Bayes approach provides higher accuracy than KNN method and Decision List.
Table 17. The performance comparison of three techniques from [3].
Algorithm Used Accuracy Time Taken Naïve Bayes approach 52.33% 609ms
Decision List 52% 719ms
KNN method 45.67% 1000ms
In 2013, C. Shah and A. G. Jivani presented “Comparison of Data Mining Classification Algorithms for Breast Cancer Prediction [8]”. Their research used the WEKA software to analyze three algorithms, Decision tree, Bayesian Network and K-Nearest Neighbor (KNN) method. The performance of these algorithms was compared with several performance measures such as time taken, percentage of correctly classified instances and percentage of incorrectly classified instances as shown in Table 18. The Bayesian Network outperforms other algorithms in terms of accuracy and time taken to build the models.
Table 18. The performance comparison of data mining classification algorithms for breast cancer prediction from [8].
Classifiers Time taken
(Sec)
Percentage of correctly
classified instance
Percentage of incorrectly
classified instances
Decision tree 0.11 95.9943% 4.0057% Bayesian Network 0.02 95.9943% 4.0057%
KNN method 0.02 94.9928% 5.0072%

45
In 2014, "An Ensemble based Decision Support Framework for Intelligent Heart Disease Diagnosis” was published by S. Bashir, U. Qamar and M. Y. Javed [4]. Their research gathered the heart disease datasets from Cleveland database of UCI repository to develop an intelligent heart disease diagnosis and prediction system. The prediction system is the combination of three different classification techniques: Naïve Bayes approach, Decision trees Gini Index (DT-GI) and SVM, using majority vote. The performance measurement of their prediction system was evaluated with the accuracy, sensitivity and specificity. Accuracy of prediction system is 81.82% as shown in Table 19.
Table 19. The performance of prediction system from [4].
Classifiers Accuracy Sensitivity Specificity Naïve Bayes approach 78.79% 68.42% 92.86%
SVM 75.76% 73.68% 78.57%
Decision tree 72.73% 63.16% 85.71% Their proposed method 81.82% 73.68% 92.86%
In the same year, S. Ghosh presented “A Comparative Study of Breast Cancer Detection Based on SVM and MLP BPN Classifier” [9]. The researcher used the breast cancer dataset from UCI repository to analyze breast cancer with two different classifiers: Multi-Layer Perceptron with Backpropagation (MLP-BPN) and SVM. In the data preprocessing, the principle component analysis was used to reduce the number of attributes (dimensions) of the breast cancer dataset. The missing value was replaced by the mean value of an attribute. Then, the 10-fold cross-validation technique was used to divide the breast cancer dataset to the training set and testing set. Finally, MLP-BPN and SVM classifiers were implemented by MATLAB software. Different performance measurements were used in the research, such as accuracy, precision, recall, F-measure, Kappa statistic, etc. Table 20 shows only the accuracies in various number of dimensions.

46
Table 20. The accuracies in various number of dimensions from [9].
Classifiers Number of dimensions
5 6 7 8 9
Accuracy of SVM 95.56% 96.28% 96.71% 96.71% 96.85%
Accuracy of MLP-BPN 95.27% 95.71% 95.71% 94.71% 94.99%
Additionally, “Prediction of diseases by Cascading Clustering and Classification” was proposed by B. V. Sumana and T. Santhanam [10]. They collected five different medical datasets; Wisconsin Breast cancer, Breast cancer-L, Heart Cleveland, Diabetes, and Liver Disorder from UCI repository. Their proposed method used the Weka software to classify these medical datasets with 10-fold cross validation. The method consists of four steps. First, data preprocessing deals with missing value, outliers, noisy data and irrelevant attributes. Next, the correlation based feature selection with best-first search algorithm is used to select the attributes (features). Then, k-mean algorithm is used to group the dataset into two clusters: incorrect and correct clusters. The incorrect cluster is eliminated. Finally, 12 different classifiers are analyzed with the Weka software. The performance of the classifiers is based on the Accuracy, Kappa, Mean Absolute Error and Time.
In the following year, E. O. Olaniyi, O. K. Oyedotun and A. Helwan used the artificial neural network to conduct diagnosis of heart diseases. Their research title is “Neural Network Diagnosis of Heart Disease” [5]. In data preprocessing, the heart disease dataset collected from UCI repository consists of 13 attributes and 270 instances. Before using this dataset in training with neural networks, the dataset was divided into 60% for training set and 40% for testing set. Also, the normalization was used to transform the dataset to the suitable input for neural network. In an artificial neural network, there are three layers: input layer, hidden layer and output layer. The hidden layer consists of six nodes, the output layer consists of two nodes and number of epochs is set to 2000. The backpropagation algorithm with feedforward neural network was used to train for a neural network. Also, the sigmoid function was employed as activation function. As shown in the Table 21, the recognition rate of an artificial neural network with backpropagation algorithm is higher than other algorithms.

47
Table 21. The recognition rate of each method from [5].
Method Recognition rate KNN method 45.67%
Decision tree 84.35%
Naïve Bayes approach 82.31% WAC (Weighted Associative Classifier). 84%
BPNN 85%
“Diagnosing of heart diseases using average K-Nearest Neighbor algorithm of data mining” [6] was conducted by C. Kalaiselvi in 2016. Their research gathered all four heart disease datasets from UCI repository; Cleveland clinic foundation, Hungarian institute of cardiology, university hospital of Switzerland and V.A. medical center. To get the KNN method faster, average KNN method was proposed. The new approach creates a super instance using the average of all training instances in each class. The new approach can reduce the number of instances in the training set. Therefore, it is faster to search the nearest neighbor. As shown in Table 22, the accuracy of the new approach is higher than that of Naïve Bayes approach and Decision tree.
Table 22. The accuracy of average K-Nearest Neighbor algorithm compared with Naïve Bayes approach and Decision tree from [6].
Classification techniques Accuracy with
13 Attributes 14 Attributes
Naïve Bayes approach 94.43% 90.72%
Decision tree 96.1% 96.62% Average KNN method 96.5% 97%
Finally, “Classification and Prediction of Heart Disease Risk Using Data Mining Techniques of Support Vector Machine and Artificial Neural Network” was published in 2016 [7] by S. Radhimeenakshi. In order to classify the heart disease dataset taken from UCI repository, the researcher used the Matlab R2010 to implement SVM and ANN. Before the heart disease dataset was trained with SVM and ANN, it was divided into a training set, validation set and testing set. The performance of SVM and ANN was

48
based on Accuracy, Precision and Sensitivity, Table 23 shows the performance of SVM and ANN.
Table 23. The performance of SVM and ANN from [7].
Method Accuracy Precision Sensitivity SVM 84.7% 85.6% 84.12%
ANN 81.8% 83.3% 68.7%
This Chapter presents the several studies that aim to propose the new approaches for medical classification. In order to gain more reliable results of the heart disease classification, the mixed classifier using three heterogeneous approaches based on multi-layer perceptron with backpropagation learning algorithm is proposed in this thesis. The proposed mixed classifier is presented in Chapter 4.
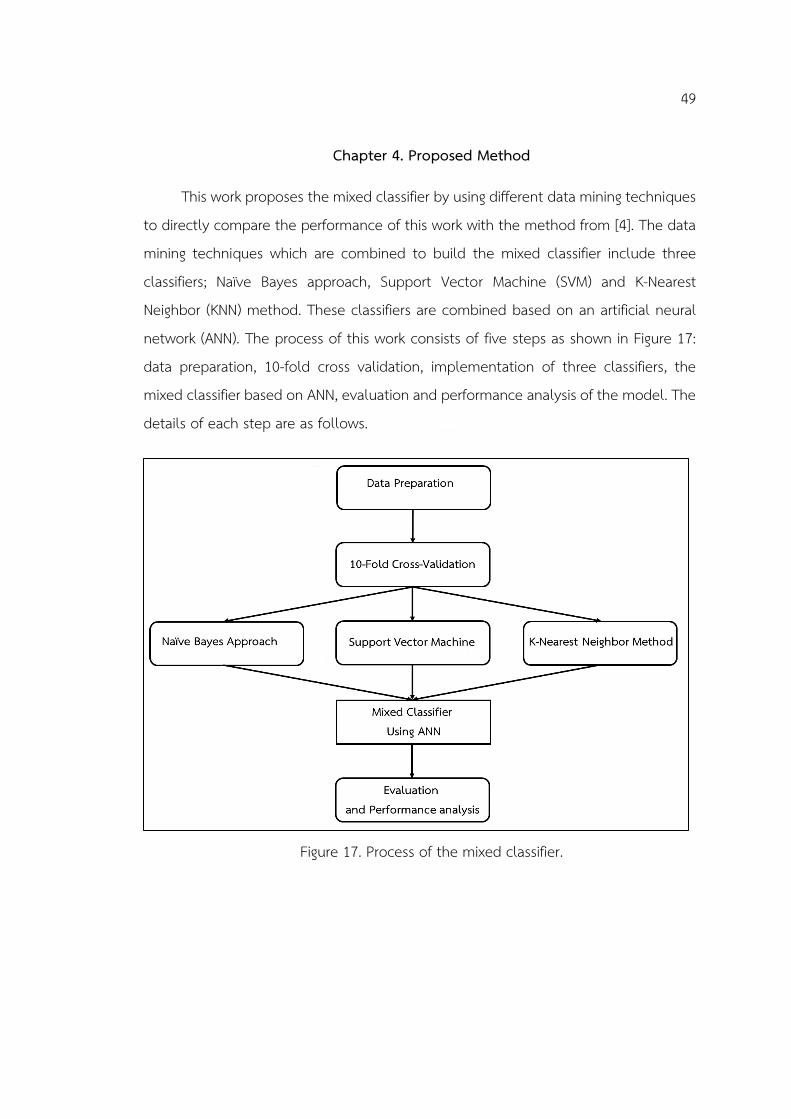
49
Chapter 4. Proposed Method
This work proposes the mixed classifier by using different data mining techniques to directly compare the performance of this work with the method from [4]. The data mining techniques which are combined to build the mixed classifier include three classifiers; Naïve Bayes approach, Support Vector Machine (SVM) and K-Nearest Neighbor (KNN) method. These classifiers are combined based on an artificial neural network (ANN). The process of this work consists of five steps as shown in Figure 17: data preparation, 10-fold cross validation, implementation of three classifiers, the mixed classifier based on ANN, evaluation and performance analysis of the model. The details of each step are as follows.
Figure 17. Process of the mixed classifier.

50
4.1. Data Preparation
The heart disease datasets from UCI repository. It consists of four different datasets which are taken from different medical center: Cleveland clinic foundation, Hungarian institute of cardiology, university hospital of Switzerland, and V.A. medical center. This work uses the dataset from Cleveland clinic foundation. In this dataset, there are 303 instances, 14 input attributes including class attribute, 6 missing values in ca and thal defect attributes and two classes: risk and non-risk. The details of attributes information are shown in Table 24. In this work, the original dataset is used without applying normalization to create the mixed classifier. The missing value is handled by using mode of each attribute, so the values of ca and thal attributes are replaced by 0 and 3 respectively.
Table 24. Attribute Information of the heart disease dataset from Cleveland clinic foundation.
No. Attribute
Name Description Value
1. age Age in years Numeric 2. sex Sex of subject 1 = male; 0 = female 3. cp Chest pain types 1: typical angina
2: atypical angina 3: non-anginal pain 4: asymptomatic
4. trestbps Resting blood pressure (in mm Hg on admission to the hospital)
Numeric
5. chol Serum cholesterol in mg/dl Numeric 6. fbs Fasting blood sugar > 120 mg/dl 1 = true; 0 = false 7. restecg Resting electrocardiographic
result 0: normal 1: having ST-T wave abnormality

51
No. Attribute
Name Description Value
2: showing probable or definite left ventricular hypertrophy
8. thalach Maximum heart rate achieved Numeric 9. exang Exercise induced angina 1 = yes; 0 = no 10. oldpeak ST depression induced by
exercise relative to rest Numeric
11. slope Slope of peak exercise ST segment
1: upsloping 2: flat 3: downsloping
12. ca Number of major vessels colored by fluoroscopy
0-3
13. thal Defect type 3 = normal; 6 = fixed defect; 7 = reversable defect
14. num Diagnosis of heart disease (angiographic diseasestatus)
Risk (1): 139 instances Non-Risk (0): 164 instances
4.2. 10-Fold Cross-Validation
10-fold cross validation is used to separate the heart disease datasets to measure the performance of the model. In this dataset, there are 303 instances which are made up of 164 non-risk classes and 149 risk classes. So, after generating 10-fold cross validation, each fold has approximately 30 instances which consist of 16 non-risk classes and 14 risk classes. The details of k-fold cross validation have already been described in Chapter 2.

52
4.3. Three different classifiers
This work chooses three heterogeneous classifiers, Naïve Bayes approach, SVM and KNN method, to build the mixed classifier based on ANN. From 10-Fold Cross-Validation, the training and testing datasets are implemented with these classifiers then the output from these classifiers is prepared for using as input of the mixed classifier in next step.
The advantages and disadvantages of individual classifiers are concluded in Table 25 while the details of these classifiers are described in Chapter 2.
Table 25. The advantages and disadvantages of individual classifiers. Classifier Advantage Disadvantage
Naïve Bayes approach It is easy to apply, because it uses simple calculation.
It only applies to an independent attribute.
SVM Accuracy is higher than other classifiers.
It takes a lot of time to construct a model.
KNN method Because it is a lazy learner, the model is not built.
It takes a lot of computing time.
4.4. Mixed Classifier Using ANN
This step is a combination of the three classifiers from step 3. After the three different classifiers, Naïve Bayes approach, SVM and KNN method, are trained and tested with 10-fold cross validation, ANN with backpropagation learning algorithm is used to mix the results from these classifiers. The details of this step are shown in Figure 18. There are two sub-steps, data preparation and ANN. The details of sub-steps are explained as follows:

53
Figure 18. The sub-steps of the mixed classifier.
4.4.1. Data Preparation
In order to prepare the dataset to use with the neural network, 10-fold cross validation and data reduction are applied in this sub-step.
10-Fold Cross-Validation The prediction results of Naïve Bayes approach, SVM and KNN method becomes
the input for the neural network. In order to generate the training and testing set, these results are used to create ten folds of data. Each instance contains three attributes and yields either one of two possible class values: 0 (Non-Risk) and 1 (Risk). The details of 10-fold cross validation have already been described in Chapter 2.
Data reduction After the 10-fold Cross-Validation dataset is generated, there are 9 folds to be
the training dataset in each round. This training dataset contains eight possible patterns from three classifiers as shown in Table 26. This means that in the training set there will be duplicate patterns with either risk or non-risk class. The number of duplicate patterns in each class will be counted. If the pattern consists of the number of repetitions in risk class that is greater than the number of repetitions in non-risk class,

54
then the risk class is defined as the actual class in this pattern. On the other hand, if the pattern consists of the number of repetitions in non-risk class is greater than the number of repetitions in risk class, then the non-risk class is defined as the actual class in this pattern. However, if the pattern consists of the same number of repetitions in both risk and non-risk classes, the majority vote will be used in this pattern instead. The example is shown in Table 27. The pattern 1 1 1 consists of 93 repetitions in risk class and 8 repetitions in non-risk class. The repetitions in risk class are greater than the repetitions in non-risk class. Therefore, the risk class is defined as the actual class in this pattern. In pattern 0 1 0, the numbers of risk and non-risk class are equal, the majority vote will be used in this pattern. Therefore, the non-risk class is defined as the actual class in this pattern. Actual class selection of eight patterns for every training set shown in the appendix.
Table 26. The eight possible patterns in each training set.
No.
Pattern
Naïve Bayes approach
SVM KNN
method
1 1 1 1
2 1 1 0 3 1 0 1
4 1 0 0
5 0 1 1 6 0 1 0
7 0 0 1 8 0 0 0

55
Table 27. Example of actual class selection of each pattern.
No. Pattern Number of risk
(1) class
Number of non-risk (0)
class
Actual class
Naïve Bayes approach
SVM KNN
method
1 1 1 1 93 8 Risk (1)
2 0 1 0 1 1 Non-risk (0)
4.4.2. Artificial neural network (ANN)
After the dataset has been prepared in the data preparation sub-step, the network is trained by backpropagation learning algorithm. Finally, the testing set is used to evaluate the trained network. In this work, ANN is based on multi-layer perceptron architecture. The weights are adjusted from right to left of the network by backpropagation learning algorithm. Figure 19 shows the architecture of the neural network. There are three layers. Firstly, in the input layer, there are three inputs: 𝑥1, 𝑥2 and 𝑥3 obtained from Naïve Bayes approach, SVM and KNN method, respectively. Next, in the hidden layer, there are two hidden nodes. Finally, the output layer contains one node. The sigmoid function is used as an activation function, which transfers the data in the hidden and the output layers. Also, the relationship between the input layer and the hidden layer is fully connected.
Figure 19. Architecture of neural network in this study.

56
4.5. Evaluation and Performance Analysis
In order to measure the performance of the mixed classifier, the proposed method used three different measurements including accuracy, false positive rate and false negative rate. The results of these measurements will be described in Chapter 5.

57
Chapter 5. Experiments and Results
5.1. Experimental Setup
In this work, Cleveland clinic foundation heart disease dataset is gathered from UCI repository. This dataset contains 303 instances and 14 attributes including class attribute: risk and non-risk classes. The missing attribute values are replaced by the mode of each attribute. Then, 10-fold cross-validation technique is used to divide dataset to training and testing sets. The implementation of this experiment is run on the windows operating system with CPU Intel Core i7-4790 at 3.60GHz and 16.0GB of RAM. Weka 3.8 is a software used to implement all classifiers and parameter setting of individual classifiers is shown in Table 28.
Table 28. Parameter setting of individual classifiers.
Classifier Parameter setting
Naïve Bayes approach numDecimalPlaces: 2
Support Vector Machine (SVM)
Kernel function: linear function epsilon: 1.0E-12 toleranceParameter: 0.001 numDecimalPlaces: 2
K-Nearest Neighbor (KNN) method
Number of neighbor : 5 nearestNeighbourSearchAlgorithm: Euclidean distance numDecimalPlaces: 2
Decision tree confidenceFactor: 0.25 minNumObj: 2 numDecimalPlaces: 2
Artificial neural network (ANN)
Activation function: sigmoid function Number of node in hidden layers: 2 Number of epochs: 1000 Learning rate: 0.3 Momentum: 0.2 numDecimalPlaces: 2

58
5.2. 10-fold cross validation
After the data preparation is finished, 10-fold cross validation is generated by separating Cleveland clinic foundation heart disease dataset into 10 subsets equally for training and testing set. In Figure 20, the Cleveland clinic foundation heart disease dataset contains 303 instances that are made up of 164 non-risk and 139 risk classes. Therefore, each subset has approximately 30 instances that contain 16 non-risk and 14 risk class instances.
Figure 20. 10-fold cross validation in this experiment.
5.3. Evaluation and Performance analysis
From UCI repository, there are four heart different datasets which are taken from Cleveland clinic foundation, Hungarian institute of cardiology, university hospital of Switzerland and V.A. medical center. The dataset from Cleveland clinic foundation is mainly used in this study. However, all four datasets are still used to show the performance of the proposed method as well.

59
5.3.1. Cleveland clinic foundation heart disease dataset For evaluation the proposed method, the accuracy, false positive rate (FPR) and
false negative rate (FNR) are used to measure the performance of each classifier. These measures are calculated from the confusion matrix which has been explained in Chapter 2. The confusion matrices of individual classifiers are presented in Tables 29-32. The confusion matrices of the mixed classifier using majority vote are presented in Tables 33 and 34. The confusion matrices of proposed method is presented in Table 35. The performance measures of all classifiers in this work are shown in Table 36. Moreover, all confusion matrices from 10-fold cross validation and the predicted results of all classifiers are shown in the appendix.
Table 29. The confusion matrix of Naïve Bayes approach.
Table 30. The confusion matrix of SVM.
Table 31. The confusion matrix of KNN method.
Predicted class
Non-Risk Risk
Actu
al cl
ass
Non-Risk 143 21
Risk 26 113
Predicted class
Non-Risk Risk
Actu
al cl
ass
Non-Risk 146 18
Risk 28 111
Predicted class
Non-Risk Risk
Actu
al cl
ass
Non-Risk 142 22
Risk 23 116

60
Table 32. The confusion matrix of J48 Decision tree.
Table 33. The confusion matrix of the mixed classifier based on Naïve Bayes
approach, SVM and J48 Decision tree using majority vote
Table 34. The confusion matrix of the mixed classifier based on Naïve Bayes
approach, SVM and KNN method using majority vote
Table 35. The confusion matrix of the proposed method
Predicted class
Non-Risk Risk Ac
tual
cla
ss
Non-Risk 135 29
Risk 39 100
Predicted class
Non-Risk Risk
Actu
al cl
ass
Non-Risk 144 20
Risk 29 110
Predicted class
Non-Risk Risk
Actu
al cl
ass
Non-Risk 144 20
Risk 24 115
Predicted class
Non-Risk Risk
Actu
al cl
ass
Non-Risk 148 16
Risk 26 113

61
Table 36. The performance measures
Method Accuracy False Positive
Rate (FPR) False negative
rate (FNR)
Naïve Bayes approach 84.49% 12.80% 18.71% SVM 84.82% 10.98% 20.14%
KNN method 85.15% 13.41% 16.55%
J48 Decision tree 77.56% 17.68% 28.06%
Mixed classifier based on Naïve Bayes approach, SVM and J48 Decision tree using majority vote from [4]
83.83% 12.20% 20.86%
Mixed classifier based on Naïve Bayes approach, SVM and KNN method using majority vote
85.48% 12.20% 17.27%
Proposed method 86.16% 9.76% 18.71%
According to Table 36, the accuracy, FPR and FNR of the proposed method are 86.16%, 9.76% and 18.71% respectively. The proposed method provides better performance than any other methods in terms of the accuracy and FPR. Also, the method gives 18.71% FNR that is a bit higher than the lowest FNR belonging to KNN method.

62
5.3.2. All four heart disease datasets All four heart disease datasets from UCI repository consists of 920 instances, 14
input attributes including class attribute, 1759 missing values and two classes: risk and non-risk. The missing values are handled by using mode or mean of each attribute as shown in Table 37. Then, all four heart disease datasets are separated into training and testing set by using 10-fold cross validation technique.
Table 37. Details of the missing values of all four heart disease datasets from UCI repository.
Attribute Name Number of missing
values
Mode or mean which is replaced to each missing
value
trestbps 59 132
chol 30 199
fbs 90 0
restecg 2 0
thalach 55 138
exang 55 0
oldpeak 62 0.9
slope 309 2
ca 611 0
thal 486 3
The confusion matrices of individual classifiers of four heart disease datasets from UCI repository are presented in Tables 38-40 while the confusion matrix of proposed method is presented in Table 41. The performance measures of all classifiers with four heart disease datasets are shown in Table 42.

63
Table 38. The confusion matrix of Naïve Bayes approach of all four heart disease datasets from UCI repository.
Table 39. The confusion matrix of SVM of all four heart disease datasets from UCI
repository.
Table 40. The confusion matrix of KNN method of all four heart disease datasets from UCI repository.
Table 41. The confusion matrix of the proposed method of all four heart disease datasets from UCI repository.
Predicted class
Non-Risk Risk Ac
tual
cla
ss
Non-Risk 329 82
Risk 86 423
Predicted class
Non-Risk Risk
Actu
al cl
ass
Non-Risk 317 94
Risk 86 423
Predicted class
Non-Risk Risk
Actu
al cl
ass
Non-Risk 320 91
Risk 89 420
Predicted class
Non-Risk Risk
Actu
al cl
ass
Non-Risk 302 109
Risk 50 459

64
From Table 42, the accuracy, FPR and FNR of the proposed method with four
heart disease datasets are 82.72%, 26.52% and 9.82% respectively. The proposed
method outperforms other methods in terms of the accuracy and FNR. The research
from [6] use all four heart disease datasets from UCI repository to diagnose the heart
disease with average KNN method in the same direction as shown in this part. However,
the how to handle missing values and separate dataset are not described in details. If
the missing values are slightly absent and missing values are further analyzed, the
performance of the proposed method with all four heart disease datasets will be
expected to be better.
Table 42. The performance measures of proposed method of all four heart disease datasets from UCI repository.
Method Accuracy False Positive
Rate (FPR) False negative
rate (FNR)
Naïve Bayes Approach 81.74% 19.95% 16.90% SVM 80.43% 22.87% 16.90%
KNN method 80.43% 22.14% 17.49% Proposed method 82.72% 26.52% 9.82%
5.4. Discussion
In this study, the mixed classifier based on the artificial neural network, which consists of three different classifiers; Naïve Bayes approach, SVM and KNN method, is proposed. For the architecture of neural network, the weight of each classifier is defined and adjusted with backpropagation learning algorithm until the error is satisfied. With this reason, the performance from the neural networks is greater than that of majority vote. Additionally, the data reduction is used to reduce the number of patterns under the assumption that each pattern should belong to one class. This process can lead to some failure cases. The less number of patterns for training the neural network cannot discriminate some ambiguous patterns. However, with the dataset from Cleveland clinic foundation, the proposed method still outperforms the other classifiers in terms of the accuracy and FPR.

65
Chapter 6. Conclusion
In this study, four individual classifiers techniques: Naïve Bayes approach, Support Vector Machine (SVM), K-Nearest Neighbor (KNN) method and J48 Decision tree are implemented for classification of the heart disease datasets. There are three mixed classifier techniques to combine the individual classifier techniques. For the method from [4], the first mixed classifier is constructed by combining Naïve Bayes approach, SVM and Decision tree based on the majority vote. Second, the mixed classifier is generated by combining Naïve Bayes approach, SVM and KNN method using majority vote. Finally, the mixed classifier of the proposed method is constructed using the Naïve Bayes approach, SVM and KNN method, based on the artificial neural network. The performance of each classifier is measured with three different measures: the accuracy, false positive rate (FPR) and false negative rate (FNR). In summary, the accuracy and FPR of the proposed method are 86.16% and 9.76% which provides better performance than any other methods in the heart disease dataset from Cleveland clinic foundation. Moreover, the mixed classifier can be applied to other disease data, such as breast cancer and diabetes.

REFERENCES
[1] Bureau of Non Communicable Disease, “Annual report 2015 bureau of non communicable disease,” Jan. 2016.
[2] American Heart Association, “Heart disease and dtroke dtatistics 2017,” Jan. 2017.
[3] A. Rajkumar and G. Sophia Reena, “Diagnosis Of Heart Disease Using Data mining Algorithm,” Global Journal of Computer Science and Technology (GJCST), vol. 10, no. 10, pp. 38-43, 2010.
[4] S. Bashir, U. Qamar, and M. Y. Javed, “An ensemble based decision support framework for intelligent heart disease diagnosis,” in Proceedings of the International Conference on Information Society (i-Society 2014), London, England, 2014, pp. 259 - 264.
[5] E. O. Olaniyi, O. K. Oyedotun, and A. Helwan, “Neural network diagnosis of heart disease,” in Proceedings of the International Conference on Advances in Biomedical Engineering (ICABME), Beirut, Lebanon, 2015, pp. 21 - 24.
[6] C. Kalaiselvi, “Diagnosing of heart diseases using average k-nearest neighbor algorithm of data mining,” in Proceedings of the 3rd International Conference on Computing for Sustainable Global Development (INDIACom), New Delhi, India, 2016, pp. 3099 - 3103.
[7] S. Radhimeenakshi, “Classification and prediction of heart disease risk using data mining techniques of Support Vector Machine and Artificial Neural Network,” in Proceedings of the 3rd International Conference on Computing for Sustainable Global Development (INDIACom), New Delhi, India, 2016, pp. 3107 - 3111.
[8] C. Shah and A. G. Jivani, “Comparison of data mining classification algorithms for breast cancer prediction,” in Proceedings of the Fourth International Conference on Computing, Communications and Networking Technologies (ICCCNT), Tiruchengode, India, 2013, pp. 1 - 4.

67
[9] S. Ghosh, S. Mondal, and B. Ghosh, “A comparative study of breast cancer detection based on SVM and MLP BPN classifier,” in Proceedings of the First International Conference on Automation, Control, Energy and Systems (ACES), West Bengal, India, 2014, pp. 1 - 4.
[10] B. V. Sumana and T. Santhanam, “Prediction of diseases by cascading clustering and classification,” in Proceedings of the International Conference on Advances in Electronics Computers and Communications (ICAECC), Bangalore, India, 2014, pp. 1 - 8.
[11] “UCI machine learning repository: heart disease data set,” Aug. 21, 2017. [Online]. Available: https://archive.ics.uci.edu/ml/machine-learning-databases/heart-disease/processed.cleveland.data
[12] “WEKA Manual for Version 3-8-1,” Aug. 21, 2017. [Online]. Available: https://www.cs.waikato.ac.nz/ml/weka/documentation.html

APPENDIX

69
Table 43. The predicted results of Naïve Bayes approach of fold 1. Instance No. Actual class Predicted class Error
1 1 1
2 1 1
3 1 1
4 1 1
5 1 1
6 1 1
7 1 0 +
8 1 0 +
9 1 1
10 1 1
11 1 1
12 1 1
13 1 0 + 14 1 1
15 0 1 + 16 0 0
17 0 0
18 0 0
19 0 0
20 0 1 +
21 0 0
22 0 0
23 0 0
24 0 0
25 0 0
26 0 0
27 0 0
28 0 1 + 29 0 0
30 0 0

70
Table 44. The predicted results of Naïve Bayes approach of fold 2. Instance No. Actual class Predicted class Error
1 1 1
2 1 1
3 1 1
4 1 0 + 5 1 1
6 1 1
7 1 0 +
8 1 1
9 1 1
10 1 0 +
11 1 0 + 12 1 1
13 1 1
14 1 1
15 0 0
16 0 1 +
17 0 0
18 0 0
19 0 1 + 20 0 0
21 0 0
22 0 1 + 23 0 0
24 0 0
25 0 0
26 0 0
27 0 0
28 0 0
29 0 0
30 0 0

71
Table 45. The predicted results of Naïve Bayes approach of fold 3. Instance No. Actual class Predicted class Error
1 1 1
2 1 1
3 1 1
4 1 1
5 1 1
6 1 1
7 1 1
8 1 0 +
9 1 1
10 1 1
11 1 1
12 1 1
13 1 1
14 1 1
15 0 0
16 0 0
17 0 1 + 18 0 0
19 0 0
20 0 0
21 0 0
22 0 0
23 0 0
24 0 0
25 0 1 +
26 0 0
27 0 0
28 0 0
29 0 0
30 0 0

72
Table 46. The predicted results of Naïve Bayes approach of fold 4. Instance No. Actual class Predicted class Error
1 1 1
2 1 1
3 1 1
4 1 1
5 1 1
6 1 0 + 7 1 1
8 1 1
9 1 1
10 1 1
11 1 1
12 1 1
13 1 1
14 1 1
15 0 0
16 0 0
17 0 0
18 0 0
19 0 1 + 20 0 0
21 0 0
22 0 0
23 0 0
24 0 0
25 0 0
26 0 0
27 0 0
28 0 0
29 0 0
30 0 0

73
Table 47. The predicted results of Naïve Bayes approach of fold 5. Instance No. Actual class Predicted class Error
1 1 1
2 1 0 + 3 1 1
4 1 1
5 1 1
6 1 1
7 1 1
8 1 1
9 1 1
10 1 0 +
11 1 1
12 1 1
13 1 1
14 1 1
15 0 0
16 0 0
17 0 0
18 0 0
19 0 0
20 0 0
21 0 0
22 0 0
23 0 0
24 0 0
25 0 0
26 0 0
27 0 0
28 0 0
29 0 0
30 0 1 +

74
Table 48. The predicted results of Naïve Bayes approach of fold 6. Instance No. Actual class Predicted class Error
1 1 1
2 1 1
3 1 1
4 1 1
5 1 0 +
6 1 1
7 1 1
8 1 1
9 1 1
10 1 1
11 1 1
12 1 1
13 1 0 + 14 1 1
15 0 0
16 0 0
17 0 0
18 0 0
19 0 0
20 0 1 +
21 0 0
22 0 0
23 0 0
24 0 0
25 0 0
26 0 0
27 0 0
28 0 0
29 0 0
30 0 1 +

75
Table 49. The predicted results of Naïve Bayes approach of fold 7. Instance No. Actual class Predicted class Error
1 1 1
2 1 1
3 1 1
4 1 1
5 1 1
6 1 1
7 1 0 +
8 1 1
9 1 1
10 1 1
11 1 1
12 1 1
13 1 1
14 1 0 + 15 0 0
16 0 1 +
17 0 0
18 0 0
19 0 0
20 0 1 +
21 0 0
22 0 0
23 0 0
24 0 0
25 0 1 + 26 0 0
27 0 0
28 0 0
29 0 0
30 0 0
31 0 0
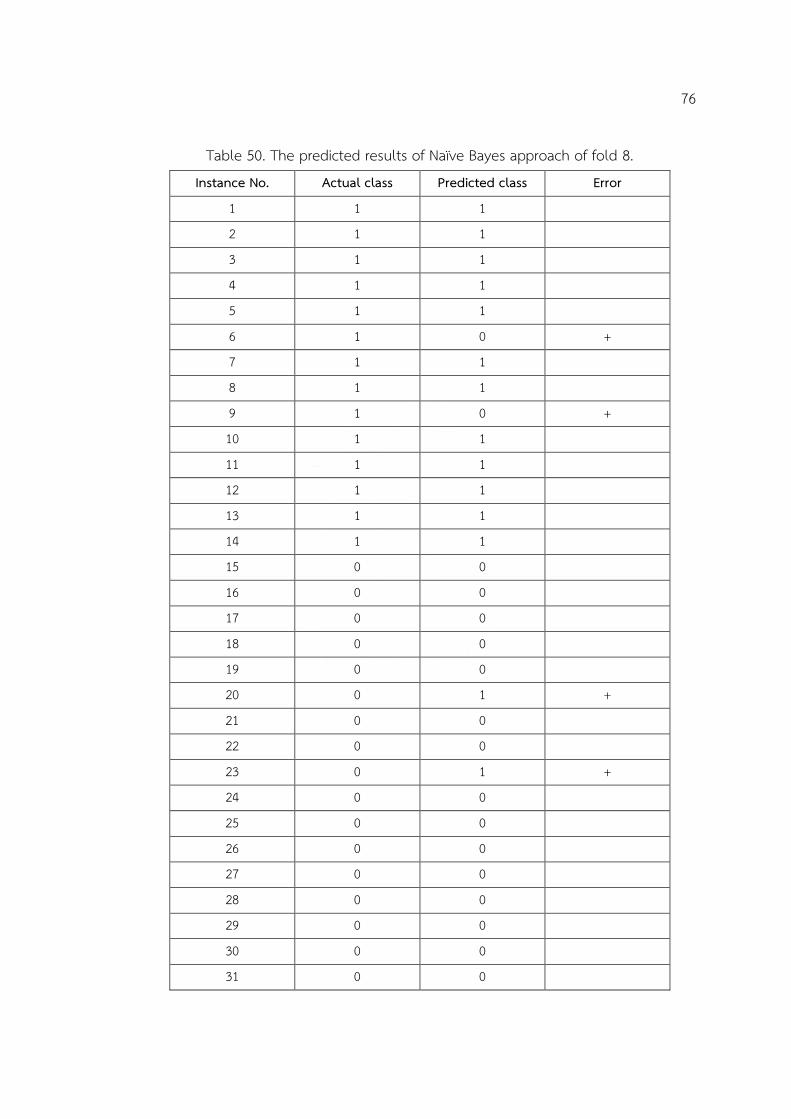
76
Table 50. The predicted results of Naïve Bayes approach of fold 8. Instance No. Actual class Predicted class Error
1 1 1
2 1 1
3 1 1
4 1 1
5 1 1
6 1 0 + 7 1 1
8 1 1
9 1 0 +
10 1 1
11 1 1
12 1 1
13 1 1
14 1 1
15 0 0
16 0 0
17 0 0
18 0 0
19 0 0
20 0 1 +
21 0 0
22 0 0
23 0 1 +
24 0 0
25 0 0
26 0 0
27 0 0
28 0 0
29 0 0
30 0 0
31 0 0

77
Table 51. The predicted results of Naïve Bayes approach of fold 9. Instance No. Actual class Predicted class Error
1 1 1
2 1 0 +
3 1 0 +
4 1 1
5 1 1
6 1 0 + 7 1 1
8 1 0 +
9 1 1
10 1 1
11 1 0 + 12 1 0 +
13 1 1
14 1 1
15 0 0
16 0 0
17 0 0
18 0 0
19 0 0
20 0 0
21 0 0
22 0 0
23 0 0
24 0 0
25 0 1 + 26 0 1 +
27 0 0
28 0 0
29 0 0
30 0 0
31 0 0

78
Table 52. The predicted results of Naïve Bayes approach of fold 10. Instance No. Actual class Predicted class Error
1 1 1
2 1 1
3 1 1
4 1 1
5 1 1
6 1 1
7 1 0 +
8 1 1
9 1 1
10 1 0 +
11 1 1
12 1 1
13 1 0 + 14 0 0
15 0 0
16 0 0
17 0 0
18 0 0
19 0 0
20 0 1 +
21 0 0
22 0 1 + 23 0 0
24 0 0
25 0 0
26 0 0
27 0 0
28 0 0
29 0 0
30 0 0

79
Table 53. The predicted results of SVM of fold 1. Instance No. Actual class Predicted class Error
1 1 1
2 1 1
3 1 1
4 1 1
5 1 1
6 1 1
7 1 0 +
8 1 0 +
9 1 1
10 1 1
11 1 1
12 1 1
13 1 0 + 14 1 1
15 0 0
16 0 0
17 0 0
18 0 0
19 0 0
20 0 1 +
21 0 0
22 0 0
23 0 0
24 0 0
25 0 0
26 0 0
27 0 0
28 0 0
29 0 0
30 0 0

80
Table 54. The predicted results of SVM of fold 2. Instance No. Actual class Predicted class Error
1 1 1
2 1 1
3 1 1
4 1 0 + 5 1 1
6 1 1
7 1 0 +
8 1 1
9 1 1
10 1 1
11 1 0 + 12 1 1
13 1 1
14 1 1
15 0 0
16 0 0
17 0 0
18 0 0
19 0 1 + 20 0 0
21 0 0
22 0 0
23 0 0
24 0 0
25 0 0
26 0 0
27 0 0
28 0 0
29 0 0
30 0 0

81
Table 55. The predicted results of SVM of fold 3. Instance No. Actual class Predicted class Error
1 1 1
2 1 0 + 3 1 1
4 1 0 + 5 1 1
6 1 1
7 1 1
8 1 1
9 1 1
10 1 1
11 1 1
12 1 1
13 1 1
14 1 1
15 0 0
16 0 1 +
17 0 0
18 0 0
19 0 0
20 0 0
21 0 0
22 0 0
23 0 0
24 0 0
25 0 1 +
26 0 0
27 0 0
28 0 0
29 0 0
30 0 0

82
Table 56. The predicted results of SVM of fold 4. Instance No. Actual class Predicted class Error
1 1 1
2 1 1
3 1 1
4 1 1
5 1 1
6 1 1
7 1 1
8 1 1
9 1 1
10 1 1
11 1 1
12 1 1
13 1 1
14 1 1
15 0 0
16 0 0
17 0 0
18 0 0
19 0 1 + 20 0 0
21 0 0
22 0 0
23 0 0
24 0 0
25 0 0
26 0 0
27 0 0
28 0 0
29 0 0
30 0 0

83
Table 57. The predicted results of SVM of fold 5. Instance No. Actual class Predicted class Error
1 1 1
2 1 0 + 3 1 1
4 1 1
5 1 1
6 1 1
7 1 1
8 1 0 +
9 1 1
10 1 0 +
11 1 1
12 1 1
13 1 1
14 1 1
15 0 0
16 0 0
17 0 0
18 0 0
19 0 0
20 0 0
21 0 0
22 0 1 + 23 0 0
24 0 0
25 0 0
26 0 0
27 0 0
28 0 0
29 0 0
30 0 1 +

84
Table 58. The predicted results of SVM of fold 6. Instance No. Actual class Predicted class Error
1 1 1
2 1 1
3 1 1
4 1 1
5 1 1
6 1 1
7 1 0 +
8 1 1
9 1 1
10 1 1
11 1 1
12 1 1
13 1 0 + 14 1 1
15 0 0
16 0 0
17 0 0
18 0 0
19 0 0
20 0 0
21 0 1 +
22 0 0
23 0 0
24 0 0
25 0 0
26 0 1 + 27 0 0
28 0 0
29 0 0
30 0 1 +

85
Table 59. The predicted results of SVM of fold 7. Instance No. Actual class Predicted class Error
1 1 1
2 1 1
3 1 1
4 1 1
5 1 1
6 1 1
7 1 0 +
8 1 1
9 1 1
10 1 1
11 1 0 + 12 1 1
13 1 1
14 1 1
15 0 0
16 0 1 +
17 0 0
18 0 0
19 0 0
20 0 1 +
21 0 0
22 0 0
23 0 0
24 0 0
25 0 1 + 26 0 0
27 0 0
28 0 0
29 0 0
30 0 1 +
31 0 0

86
Table 60. The predicted results of SVM of fold 8. Instance No. Actual class Predicted class Error
1 1 1
2 1 1
3 1 1
4 1 1
5 1 1
6 1 0 + 7 1 1
8 1 1
9 1 0 +
10 1 0 +
11 1 0 + 12 1 1
13 1 1
14 1 1
15 0 0
16 0 0
17 0 0
18 0 0
19 0 0
20 0 0
21 0 0
22 0 0
23 0 1 +
24 0 0
25 0 0
26 0 0
27 0 0
28 0 0
29 0 0
30 0 0
31 0 0

87
Table 61. The predicted results of SVM of fold 9. Instance No. Actual class Predicted class Error
1 1 1
2 1 0 +
3 1 0 +
4 1 1
5 1 1
6 1 1
7 1 1
8 1 0 +
9 1 1
10 1 1
11 1 0 + 12 1 0 +
13 1 1
14 1 1
15 0 0
16 0 0
17 0 0
18 0 0
19 0 0
20 0 0
21 0 0
22 0 0
23 0 0
24 0 0
25 0 1 + 26 0 1 +
27 0 0
28 0 0
29 0 0
30 0 0
31 0 0

88
Table 62. The predicted results of SVM of fold 10. Instance No. Actual class Predicted class Error
1 1 1
2 1 1
3 1 1
4 1 0 + 5 1 1
6 1 1
7 1 0 +
8 1 1
9 1 1
10 1 0 +
11 1 1
12 1 1
13 1 0 + 14 0 0
15 0 0
16 0 0
17 0 0
18 0 0
19 0 0
20 0 1 +
21 0 0
22 0 0
23 0 0
24 0 0
25 0 0
26 0 0
27 0 0
28 0 0
29 0 0
30 0 0
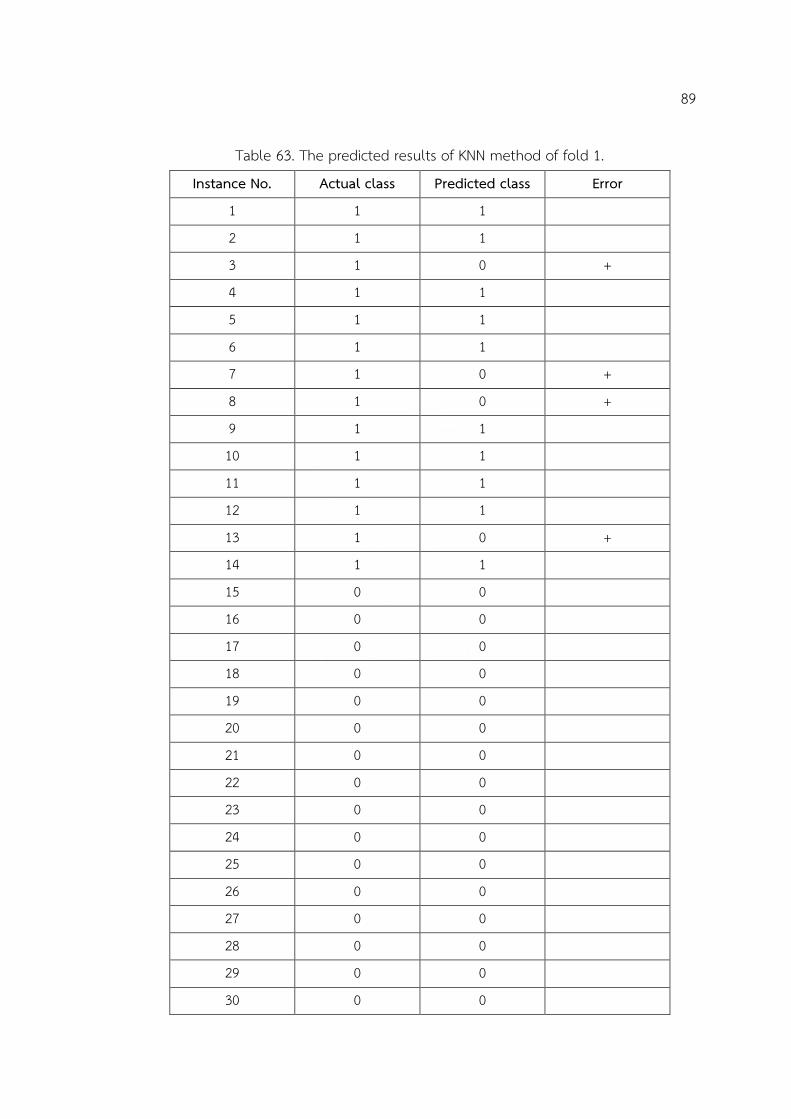
89
Table 63. The predicted results of KNN method of fold 1. Instance No. Actual class Predicted class Error
1 1 1
2 1 1
3 1 0 +
4 1 1
5 1 1
6 1 1
7 1 0 +
8 1 0 +
9 1 1
10 1 1
11 1 1
12 1 1
13 1 0 + 14 1 1
15 0 0
16 0 0
17 0 0
18 0 0
19 0 0
20 0 0
21 0 0
22 0 0
23 0 0
24 0 0
25 0 0
26 0 0
27 0 0
28 0 0
29 0 0
30 0 0

90
Table 64. The predicted results of KNN method of fold 2. Instance No. Actual class Predicted class Error
1 1 1
2 1 1
3 1 1
4 1 0 + 5 1 1
6 1 1
7 1 0 +
8 1 1
9 1 1
10 1 1
11 1 0 + 12 1 1
13 1 1
14 1 1
15 0 0
16 0 0
17 0 0
18 0 0
19 0 0
20 0 0
21 0 0
22 0 1 + 23 0 1 +
24 0 0
25 0 0
26 0 0
27 0 0
28 0 0
29 0 0
30 0 1 +

91
Table 65. The predicted results of KNN method of fold 3. Instance No. Actual class Predicted class Error
1 1 1
2 1 0 + 3 1 1
4 1 0 + 5 1 1
6 1 1
7 1 1
8 1 0 +
9 1 1
10 1 1
11 1 1
12 1 1
13 1 1
14 1 1
15 0 0
16 0 1 +
17 0 1 + 18 0 0
19 0 0
20 0 1 +
21 0 0
22 0 0
23 0 0
24 0 0
25 0 1 +
26 0 0
27 0 0
28 0 0
29 0 0
30 0 0

92
Table 66. The predicted results of KNN method of fold 4. Instance No. Actual class Predicted class Error
1 1 1
2 1 1
3 1 1
4 1 1
5 1 1
6 1 1
7 1 1
8 1 1
9 1 1
10 1 1
11 1 1
12 1 1
13 1 1
14 1 1
15 0 0
16 0 0
17 0 0
18 0 0
19 0 1 + 20 0 0
21 0 0
22 0 0
23 0 0
24 0 0
25 0 0
26 0 1 + 27 0 0
28 0 0
29 0 0
30 0 0

93
Table 67. The predicted results of KNN method of fold 5. Instance No. Actual class Predicted class Error
1 1 1
2 1 1
3 1 1
4 1 1
5 1 1
6 1 1
7 1 1
8 1 1
9 1 1
10 1 0 +
11 1 1
12 1 1
13 1 1
14 1 1
15 0 0
16 0 0
17 0 0
18 0 0
19 0 0
20 0 0
21 0 1 +
22 0 1 + 23 0 0
24 0 0
25 0 0
26 0 0
27 0 0
28 0 0
29 0 0
30 0 1 +

94
Table 68. The predicted results of KNN method of fold 6. Instance No. Actual class Predicted class Error
1 1 1
2 1 1
3 1 1
4 1 1
5 1 1
6 1 1
7 1 1
8 1 1
9 1 1
10 1 1
11 1 1
12 1 1
13 1 0 + 14 1 1
15 0 0
16 0 0
17 0 0
18 0 0
19 0 0
20 0 0
21 0 1 +
22 0 0
23 0 0
24 0 0
25 0 0
26 0 1 + 27 0 0
28 0 0
29 0 0
30 0 1 +

95
Table 69. The predicted results of KNN method of fold 7. Instance No. Actual class Predicted class Error
1 1 1
2 1 1
3 1 1
4 1 1
5 1 0 +
6 1 1
7 1 0 +
8 1 1
9 1 1
10 1 1
11 1 1
12 1 1
13 1 1
14 1 1
15 0 0
16 0 1 +
17 0 0
18 0 0
19 0 0
20 0 1 +
21 0 0
22 0 0
23 0 0
24 0 0
25 0 0
26 0 0
27 0 0
28 0 0
29 0 0
30 0 0
31 0 0

96
Table 70. The predicted results of KNN method of fold 8. Instance No. Actual class Predicted class Error
1 1 1
2 1 1
3 1 1
4 1 1
5 1 1
6 1 0 + 7 1 1
8 1 1
9 1 1
10 1 1
11 1 0 + 12 1 1
13 1 1
14 1 1
15 0 0
16 0 1 +
17 0 0
18 0 0
19 0 0
20 0 0
21 0 0
22 0 1 +
23 0 0
24 0 0
25 0 0
26 0 0
27 0 0
28 0 0
29 0 0
30 0 0
31 0 0

97
Table 71. The predicted results of KNN method of fold 9. Instance No. Actual class Predicted class Error
1 1 1
2 1 0 +
3 1 0 +
4 1 1
5 1 1
6 1 1
7 1 1
8 1 0 +
9 1 1
10 1 1
11 1 0 + 12 1 0 +
13 1 1
14 1 1
15 0 0
16 0 0
17 0 0
18 0 0
19 0 0
20 0 0
21 0 0
22 0 0
23 0 0
24 0 0
25 0 1 + 26 0 1 +
27 0 0
28 0 0
29 0 0
30 0 0
31 0 0

98
Table 72. The predicted results of KNN method of fold 10. Instance No. Actual class Predicted class Error
1 1 1
2 1 1
3 1 1
4 1 1
5 1 1
6 1 1
7 1 1
8 1 1
9 1 1
10 1 0 +
11 1 1
12 1 1
13 1 0 + 14 0 0
15 0 0
16 0 0
17 0 0
18 0 0
19 0 0
20 0 0
21 0 0
22 0 1 + 23 0 0
24 0 0
25 0 0
26 0 0
27 0 0
28 0 0
29 0 0
30 0 0

99
Table 73. The predicted results of J48 Decision tree of fold 1. Instance No. Actual class Predicted class Error
1 1 1
2 1 1
3 1 1
4 1 1
5 1 1
6 1 1
7 1 0 +
8 1 0 +
9 1 0 + 10 1 1
11 1 1
12 1 1
13 1 0 + 14 1 1
15 0 1 + 16 0 1 +
17 0 0
18 0 0
19 0 1 + 20 0 1 +
21 0 0
22 0 0
23 0 0
24 0 0
25 0 0
26 0 0
27 0 0
28 0 0
29 0 0
30 0 0

100
Table 74. The predicted results of J48 Decision tree of fold 2. Instance No. Actual class Predicted class Error
1 1 1
2 1 1
3 1 1
4 1 0 + 5 1 1
6 1 0 + 7 1 0 +
8 1 1
9 1 1
10 1 1
11 1 0 + 12 1 1
13 1 1
14 1 1
15 0 0
16 0 0
17 0 0
18 0 0
19 0 0
20 0 0
21 0 0
22 0 1 + 23 0 0
24 0 0
25 0 0
26 0 0
27 0 0
28 0 0
29 0 0
30 0 0

101
Table 75. The predicted results of J48 Decision tree of fold 3. Instance No. Actual class Predicted class Error
1 1 1
2 1 0 + 3 1 1
4 1 0 + 5 1 1
6 1 1
7 1 1
8 1 0 +
9 1 1
10 1 1
11 1 1
12 1 1
13 1 1
14 1 1
15 0 0
16 0 0
17 0 0
18 0 0
19 0 0
20 0 0
21 0 0
22 0 0
23 0 0
24 0 0
25 0 1 +
26 0 0
27 0 0
28 0 0
29 0 0
30 0 0

102
Table 76. The predicted results of J48 Decision tree of fold 4. Instance No. Actual class Predicted class Error
1 1 1
2 1 1
3 1 1
4 1 0 + 5 1 1
6 1 1
7 1 1
8 1 1
9 1 1
10 1 0 +
11 1 1
12 1 1
13 1 1
14 1 1
15 0 0
16 0 0
17 0 0
18 0 0
19 0 1 + 20 0 0
21 0 0
22 0 0
23 0 0
24 0 0
25 0 0
26 0 1 + 27 0 0
28 0 0
29 0 0
30 0 1 +

103
Table 77. The predicted results of J48 Decision tree of fold 5. Instance No. Actual class Predicted class Error
1 1 1
2 1 0 + 3 1 1
4 1 1
5 1 1
6 1 1
7 1 1
8 1 0 +
9 1 1
10 1 0 +
11 1 1
12 1 1
13 1 1
14 1 1
15 0 0
16 0 0
17 0 0
18 0 0
19 0 0
20 0 0
21 0 0
22 0 1 + 23 0 0
24 0 1 + 25 0 0
26 0 0
27 0 0
28 0 0
29 0 0
30 0 1 +

104
Table 78. The predicted results of J48 Decision tree of fold 6. Instance No. Actual class Predicted class Error
1 1 1
2 1 1
3 1 1
4 1 1
5 1 1
6 1 1
7 1 0 +
8 1 1
9 1 1
10 1 1
11 1 0 + 12 1 1
13 1 0 + 14 1 1
15 0 0
16 0 0
17 0 0
18 0 1 +
19 0 0
20 0 1 +
21 0 0
22 0 0
23 0 0
24 0 0
25 0 1 +
26 0 1 + 27 0 0
28 0 0
29 0 0
30 0 1 +

105
Table 79. The predicted results of J48 Decision tree of fold 7. Instance No. Actual class Predicted class Error
1 1 1
2 1 1
3 1 1
4 1 0 +
5 1 1
6 1 0 + 7 1 0 +
8 1 0 +
9 1 1
10 1 1
11 1 0 + 12 1 1
13 1 1
14 1 1
15 0 0
16 0 0
17 0 1 +
18 0 1 + 19 0 1 +
20 0 1 +
21 0 1 +
22 0 1 +
23 0 0
24 0 0
25 0 1 + 26 0 0
27 0 0
28 0 0
29 0 0
30 0 1 +
31 0 0

106
Table 80. The predicted results of J48 Decision tree of fold 8. Instance No. Actual class Predicted class Error
1 1 1
2 1 0 +
3 1 1
4 1 1
5 1 0 +
6 1 1
7 1 1
8 1 1
9 1 1
10 1 0 +
11 1 0 + 12 1 1
13 1 1
14 1 1
15 0 0
16 0 1 +
17 0 0
18 0 0
19 0 0
20 0 1 +
21 0 0
22 0 0
23 0 0
24 0 0
25 0 0
26 0 0
27 0 0
28 0 0
29 0 0
30 0 0
31 0 0

107
Table 81. The predicted results of J48 Decision tree of fold 9. Instance No. Actual class Predicted class Error
1 1 1
2 1 0 +
3 1 0 +
4 1 1
5 1 0 +
6 1 0 + 7 1 1
8 1 0 +
9 1 1
10 1 1
11 1 0 + 12 1 0 +
13 1 1
14 1 1
15 0 0
16 0 0
17 0 0
18 0 0
19 0 0
20 0 0
21 0 0
22 0 0
23 0 0
24 0 0
25 0 0
26 0 1 +
27 0 0
28 0 0
29 0 0
30 0 0
31 0 0

108
Table 82. The predicted results of J48 Decision tree of fold 10. Instance No. Actual class Predicted class Error
1 1 1
2 1 1
3 1 1
4 1 1
5 1 0 +
6 1 1
7 1 0 +
8 1 1
9 1 1
10 1 0 +
11 1 1
12 1 1
13 1 0 + 14 0 0
15 0 0
16 0 0
17 0 0
18 0 0
19 0 0
20 0 0
21 0 0
22 0 0
23 0 0
24 0 0
25 0 0
26 0 0
27 0 0
28 0 1 + 29 0 0
30 0 0

109
Table 83. The predicted results of the mixed classifier based on Naïve Bayes approach, SVM and J48 Decision tree using majority vote of fold 1.
Instance No.
Actual class
Naïve Bayes
approach SVM
J48 Decision
tree
Majority vote
Error
1 1 1 1 1 1
2 1 1 1 1 1
3 1 1 1 1 1
4 1 1 1 1 1
5 1 1 1 1 1
6 1 1 1 1 1
7 1 0 0 0 0 +
8 1 0 0 0 0 +
9 1 1 1 0 1
10 1 1 1 1 1
11 1 1 1 1 1
12 1 1 1 1 1
13 1 0 0 0 0 +
14 1 1 1 1 1
15 0 1 0 1 1 + 16 0 0 0 1 0
17 0 0 0 0 0
18 0 0 0 0 0
19 0 0 0 1 0
20 0 1 1 1 1 + 21 0 0 0 0 0
22 0 0 0 0 0
23 0 0 0 0 0
24 0 0 0 0 0
25 0 0 0 0 0

110
Instance No.
Actual class
Naïve Bayes
approach SVM
J48 Decision
tree
Majority vote
Error
26 0 0 0 0 0
27 0 0 0 0 0
28 0 1 0 0 0
29 0 0 0 0 0
30 0 0 0 0 0

111
Table 84. The predicted results of the mixed classifier based on Naïve Bayes approach, SVM and J48 Decision tree using majority vote of fold 2.
Instance No.
Actual class
Naïve Bayes
approach SVM
J48 Decision
tree
Majority vote
Error
1 1 1 1 1 1
2 1 1 1 1 1
3 1 1 1 1 1
4 1 0 0 0 0 + 5 1 1 1 1 1
6 1 1 1 0 1
7 1 0 0 0 0 +
8 1 1 1 1 1
9 1 1 1 1 1
10 1 0 1 1 1
11 1 0 0 0 0 +
12 1 1 1 1 1
13 1 1 1 1 1
14 1 1 1 1 1
15 0 0 0 0 0
16 0 1 0 0 0
17 0 0 0 0 0
18 0 0 0 0 0
19 0 1 1 0 1 +
20 0 0 0 0 0
21 0 0 0 0 0
22 0 1 0 1 1 +
23 0 0 0 0 0
24 0 0 0 0 0
25 0 0 0 0 0

112
Instance No.
Actual class
Naïve Bayes
approach SVM
J48 Decision
tree
Majority vote
Error
26 0 0 0 0 0
27 0 0 0 0 0
28 0 0 0 0 0
29 0 0 0 0 0
30 0 0 0 0 0

113
Table 85. The predicted results of the mixed classifier based on Naïve Bayes approach, SVM and J48 Decision tree using majority vote of fold 3.
Instance No.
Actual class
Naïve Bayes
approach SVM
J48 Decision
tree
Majority Vote
Error
1 1 1 1 1 1
2 1 1 0 0 0 +
3 1 1 1 1 1
4 1 1 0 0 0 + 5 1 1 1 1 1
6 1 1 1 1 1
7 1 1 1 1 1
8 1 0 1 0 0 +
9 1 1 1 1 1
10 1 1 1 1 1
11 1 1 1 1 1
12 1 1 1 1 1
13 1 1 1 1 1
14 1 1 1 1 1
15 0 0 0 0 0
16 0 0 1 0 0
17 0 1 0 0 0
18 0 0 0 0 0
19 0 0 0 0 0
20 0 0 0 0 0
21 0 0 0 0 0
22 0 0 0 0 0
23 0 0 0 0 0
24 0 0 0 0 0
25 0 1 1 1 1 +

114
Instance No.
Actual class
Naïve Bayes
approach SVM
J48 Decision
tree
Majority Vote
Error
26 0 0 0 0 0
27 0 0 0 0 0
28 0 0 0 0 0
29 0 0 0 0 0
30 0 0 0 0 0

115
Table 86. The predicted results of the mixed classifier based on Naïve Bayes approach, SVM and J48 Decision tree using majority vote of fold 4.
Instance No.
Actual class
Naïve Bayes
approach SVM
J48 Decision
tree
Majority vote
Error
1 1 1 1 1 1
2 1 1 1 1 1
3 1 1 1 1 1
4 1 1 1 0 1
5 1 1 1 1 1
6 1 0 1 1 1
7 1 1 1 1 1
8 1 1 1 1 1
9 1 1 1 1 1
10 1 1 1 0 1
11 1 1 1 1 1
12 1 1 1 1 1
13 1 1 1 1 1
14 1 1 1 1 1
15 0 0 0 0 0
16 0 0 0 0 0
17 0 0 0 0 0
18 0 0 0 0 0
19 0 1 1 1 1 +
20 0 0 0 0 0
21 0 0 0 0 0
22 0 0 0 0 0
23 0 0 0 0 0
24 0 0 0 0 0
25 0 0 0 0 0

116
Instance No.
Actual class
Naïve Bayes
approach SVM
J48 Decision
tree
Majority vote
Error
26 0 0 0 1 0
27 0 0 0 0 0
28 0 0 0 0 0
29 0 0 0 0 0
30 0 0 0 1 0

117
Table 87. The predicted results of the mixed classifier based on Naïve Bayes approach, SVM and J48 Decision tree using majority vote of fold 5.
Instance No.
Actual class
Naïve Bayes
approach SVM
J48 Decision
tree
Majority vote
Error
1 1 1 1 1 1
2 1 0 0 0 0 +
3 1 1 1 1 1
4 1 1 1 1 1
5 1 1 1 1 1
6 1 1 1 1 1
7 1 1 1 1 1
8 1 1 0 0 0 +
9 1 1 1 1 1
10 1 0 0 0 0 +
11 1 1 1 1 1
12 1 1 1 1 1
13 1 1 1 1 1
14 1 1 1 1 1
15 0 0 0 0 0
16 0 0 0 0 0
17 0 0 0 0 0
18 0 0 0 0 0
19 0 0 0 0 0
20 0 0 0 0 0
21 0 0 0 0 0
22 0 0 1 1 1 +
23 0 0 0 0 0
24 0 0 0 1 0
25 0 0 0 0 0

118
Instance No.
Actual class
Naïve Bayes
approach SVM
J48 Decision
tree
Majority vote
Error
26 0 0 0 0 0
27 0 0 0 0 0
28 0 0 0 0 0
29 0 0 0 0 0
30 0 1 1 1 1 +

119
Table 88. The predicted results of the mixed classifier based on Naïve Bayes approach, SVM and J48 Decision tree using majority vote of fold 6.
Instance No.
Actual class
Naïve Bayes
approach SVM
J48 Decision
tree
Majority Vote
Error
1 1 1 1 1 1
2 1 1 1 1 1
3 1 1 1 1 1
4 1 1 1 1 1
5 1 0 1 1 1
6 1 1 1 1 1
7 1 1 0 0 0 +
8 1 1 1 1 1
9 1 1 1 1 1
10 1 1 1 1 1
11 1 1 1 0 1
12 1 1 1 1 1
13 1 0 0 0 0 +
14 1 1 1 1 1
15 0 0 0 0 0
16 0 0 0 0 0
17 0 0 0 0 0
18 0 0 0 1 0
19 0 0 0 0 0
20 0 1 0 1 1 + 21 0 0 1 0 0
22 0 0 0 0 0
23 0 0 0 0 0
24 0 0 0 0 0
25 0 0 0 1 0

120
Instance No.
Actual class
Naïve Bayes
approach SVM
J48 Decision
tree
Majority Vote
Error
26 0 0 1 1 1 + 27 0 0 0 0 0
28 0 0 0 0 0
29 0 0 0 0 0
30 0 1 1 1 1 +

121
Table 89. The predicted results of the mixed classifier based on Naïve Bayes approach, SVM and J48 Decision tree using majority vote of fold 7.
Instance No.
Actual class
Naïve Bayes
approach SVM
J48 Decision
tree
Majority vote
Error
1 1 1 1 1 1
2 1 1 1 1 1
3 1 1 1 1 1
4 1 1 1 0 1
5 1 1 1 1 1
6 1 1 1 0 1
7 1 0 0 0 0 +
8 1 1 1 0 1
9 1 1 1 1 1
10 1 1 1 1 1
11 1 1 0 0 0 +
12 1 1 1 1 1
13 1 1 1 1 1
14 1 0 1 1 1
15 0 0 0 0 0
16 0 1 1 0 1 +
17 0 0 0 1 0
18 0 0 0 1 0
19 0 0 0 1 0
20 0 1 1 1 1 + 21 0 0 0 1 0
22 0 0 0 1 0
23 0 0 0 0 0
24 0 0 0 0 0
25 0 1 1 1 1 +

122
Instance No.
Actual class
Naïve Bayes
approach SVM
J48 Decision
tree
Majority vote
Error
26 0 0 0 0 0
27 0 0 0 0 0
28 0 0 0 0 0
29 0 0 0 0 0
30 0 0 1 1 1 +
31 0 0 0 0 0

123
Table 90. The predicted results of the mixed classifier based on Naïve Bayes approach, SVM and J48 Decision tree using majority vote of fold 8.
Instance No.
Actual class
Naïve Bayes
approach SVM
J48 Decision
tree
Majority vote
Error
1 1 1 1 1 1
2 1 1 1 0 1
3 1 1 1 1 1
4 1 1 1 1 1
5 1 1 1 0 1
6 1 0 0 1 0 + 7 1 1 1 1 1
8 1 1 1 1 1
9 1 0 0 1 0 + 10 1 1 0 0 0 +
11 1 1 0 0 0 +
12 1 1 1 1 1
13 1 1 1 1 1
14 1 1 1 1 1
15 0 0 0 0 0
16 0 0 0 1 0
17 0 0 0 0 0
18 0 0 0 0 0
19 0 0 0 0 0
20 0 1 0 1 1 + 21 0 0 0 0 0
22 0 0 0 0 0
23 0 1 1 0 1 + 24 0 0 0 0 0
25 0 0 0 0 0

124
Instance No.
Actual class
Naïve Bayes
approach SVM
J48 Decision
tree
Majority vote
Error
26 0 0 0 0 0
27 0 0 0 0 0
28 0 0 0 0 0
29 0 0 0 0 0
30 0 0 0 0 0
31 0 0 0 0 0

125
Table 91. The predicted results of the mixed classifier based on Naïve Bayes approach, SVM and J48 Decision tree using majority vote of fold 9.
Instance No.
Actual class
Naïve Bayes
approach SVM
J48 Decision
tree
Majority vote
Error
1 1 1 1 1 1
2 1 0 0 0 0 +
3 1 0 0 0 0 +
4 1 1 1 1 1
5 1 1 1 0 1
6 1 0 1 0 0 + 7 1 1 1 1 1
8 1 0 0 0 0 +
9 1 1 1 1 1
10 1 1 1 1 1
11 1 0 0 0 0 +
12 1 0 0 0 0 + 13 1 1 1 1 1
14 1 1 1 1 1
15 0 0 0 0 0
16 0 0 0 0 0
17 0 0 0 0 0
18 0 0 0 0 0
19 0 0 0 0 0
20 0 0 0 0 0
21 0 0 0 0 0
22 0 0 0 0 0
23 0 0 0 0 0
24 0 0 0 0 0
25 0 1 1 0 1 +

126
Instance No.
Actual class
Naïve Bayes
approach SVM
J48 Decision
tree
Majority vote
Error
26 0 1 1 1 1 + 27 0 0 0 0 0
28 0 0 0 0 0
29 0 0 0 0 0
30 0 0 0 0 0
31 0 0 0 0 0

127
Table 92. The predicted results of the mixed classifier based on Naïve Bayes approach, SVM and J48 Decision tree using majority vote of fold 10.
Instance No.
Actual class
Naïve Bayes
approach SVM
J48 Decision
tree
Majority vote
Error
1 1 1 1 1 1
2 1 1 1 1 1
3 1 1 1 1 1
4 1 1 0 1 1
5 1 1 1 0 1
6 1 1 1 1 1
7 1 0 0 0 0 +
8 1 1 1 1 1
9 1 1 1 1 1
10 1 0 0 0 0 +
11 1 1 1 1 1
12 1 1 1 1 1
13 1 0 0 0 0 +
14 0 0 0 0 0
15 0 0 0 0 0
16 0 0 0 0 0
17 0 0 0 0 0
18 0 0 0 0 0
19 0 0 0 0 0
20 0 1 1 0 1 + 21 0 0 0 0 0
22 0 1 0 0 0
23 0 0 0 0 0
24 0 0 0 0 0
25 0 0 0 0 0

128
Instance No.
Actual class
Naïve Bayes
approach SVM
J48 Decision
tree
Majority vote
Error
26 0 0 0 0 0
27 0 0 0 0 0
28 0 0 0 1 0
29 0 0 0 0 0
30 0 0 0 0 0

129
Table 93. The predicted results of the mixed classifier based on Naïve Bayes approach, SVM and KNN method using majority vote of fold 1.
Instance No.
Actual class
Naïve Bayes
approach SVM
KNN method
Majority vote
Error
1 1 1 1 1 1
2 1 1 1 1 1
3 1 1 1 0 1
4 1 1 1 1 1
5 1 1 1 1 1
6 1 1 1 1 1
7 1 0 0 0 0 +
8 1 0 0 0 0 +
9 1 1 1 1 1
10 1 1 1 1 1
11 1 1 1 1 1
12 1 1 1 1 1
13 1 0 0 0 0 +
14 1 1 1 1 1
15 0 1 0 0 0
16 0 0 0 0 0
17 0 0 0 0 0
18 0 0 0 0 0
19 0 0 0 0 0
20 0 1 1 0 1 + 21 0 0 0 0 0
22 0 0 0 0 0
23 0 0 0 0 0
24 0 0 0 0 0
25 0 0 0 0 0

130
Instance No.
Actual class
Naïve Bayes
approach SVM
KNN method
Majority vote
Error
26 0 0 0 0 0
27 0 0 0 0 0
28 0 1 0 0 0
29 0 0 0 0 0
30 0 0 0 0 0

131
Table 94. The predicted results of the mixed classifier based on Naïve Bayes approach, SVM and KNN method using majority vote of fold 2.
Instance No.
Actual class
Naïve Bayes
approach SVM
KNN method
Majority vote
Error
1 1 1 1 1 1
2 1 1 1 1 1
3 1 1 1 1 1
4 1 0 0 0 0 + 5 1 1 1 1 1
6 1 1 1 1 1
7 1 0 0 0 0 +
8 1 1 1 1 1
9 1 1 1 1 1
10 1 0 1 1 1
11 1 0 0 0 0 +
12 1 1 1 1 1
13 1 1 1 1 1
14 1 1 1 1 1
15 0 0 0 0 0
16 0 1 0 0 0
17 0 0 0 0 0
18 0 0 0 0 0
19 0 1 1 0 1 +
20 0 0 0 0 0
21 0 0 0 0 0
22 0 1 0 1 1 +
23 0 0 0 1 0
24 0 0 0 0 0
25 0 0 0 0 0

132
Instance No.
Actual class
Naïve Bayes
approach SVM
KNN method
Majority vote
Error
26 0 0 0 0 0
27 0 0 0 0 0
28 0 0 0 0 0
29 0 0 0 0 0
30 0 0 0 1 0
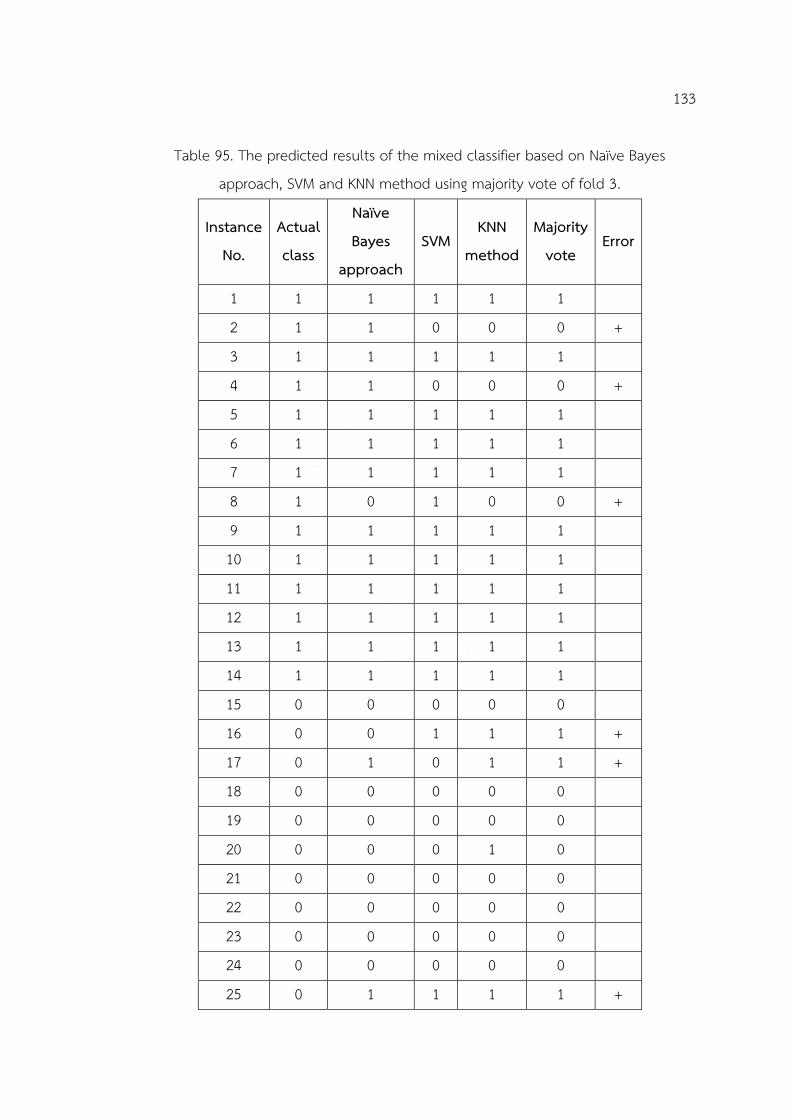
133
Table 95. The predicted results of the mixed classifier based on Naïve Bayes approach, SVM and KNN method using majority vote of fold 3.
Instance No.
Actual class
Naïve Bayes
approach SVM
KNN method
Majority vote
Error
1 1 1 1 1 1
2 1 1 0 0 0 +
3 1 1 1 1 1
4 1 1 0 0 0 + 5 1 1 1 1 1
6 1 1 1 1 1
7 1 1 1 1 1
8 1 0 1 0 0 +
9 1 1 1 1 1
10 1 1 1 1 1
11 1 1 1 1 1
12 1 1 1 1 1
13 1 1 1 1 1
14 1 1 1 1 1
15 0 0 0 0 0
16 0 0 1 1 1 +
17 0 1 0 1 1 + 18 0 0 0 0 0
19 0 0 0 0 0
20 0 0 0 1 0
21 0 0 0 0 0
22 0 0 0 0 0
23 0 0 0 0 0
24 0 0 0 0 0
25 0 1 1 1 1 +

134
Instance No.
Actual class
Naïve Bayes
approach SVM
KNN method
Majority vote
Error
26 0 0 0 0 0
27 0 0 0 0 0
28 0 0 0 0 0
29 0 0 0 0 0
30 0 0 0 0 0

135
Table 96. The predicted results of the mixed classifier based on Naïve Bayes
approach, SVM and KNN method using majority vote of fold 4.
Instance No.
Actual class
Naïve Bayes
approach SVM
KNN method
Majority vote
Error
1 1 1 1 1 1
2 1 1 1 1 1
3 1 1 1 1 1
4 1 1 1 1 1
5 1 1 1 1 1
6 1 0 1 1 1
7 1 1 1 1 1
8 1 1 1 1 1
9 1 1 1 1 1
10 1 1 1 1 1
11 1 1 1 1 1
12 1 1 1 1 1
13 1 1 1 1 1
14 1 1 1 1 1
15 0 0 0 0 0
16 0 0 0 0 0
17 0 0 0 0 0
18 0 0 0 0 0
19 0 1 1 1 1 +
20 0 0 0 0 0
21 0 0 0 0 0
22 0 0 0 0 0
23 0 0 0 0 0
24 0 0 0 0 0
25 0 0 0 0 0

136
Instance No.
Actual class
Naïve Bayes
approach SVM
KNN method
Majority vote
Error
26 0 0 0 1 0
27 0 0 0 0 0
28 0 0 0 0 0
29 0 0 0 0 0
30 0 0 0 0 0

137
Table 97. The predicted results of the mixed classifier based on Naïve Bayes approach, SVM and KNN method using majority vote of fold 5.
Instance No.
Actual class
Naïve Bayes
approach SVM
KNN method
Majority vote
Error
1 1 1 1 1 1
2 1 0 0 1 0 +
3 1 1 1 1 1
4 1 1 1 1 1
5 1 1 1 1 1
6 1 1 1 1 1
7 1 1 1 1 1
8 1 1 0 1 1
9 1 1 1 1 1
10 1 0 0 0 0 +
11 1 1 1 1 1
12 1 1 1 1 1
13 1 1 1 1 1
14 1 1 1 1 1
15 0 0 0 0 0
16 0 0 0 0 0
17 0 0 0 0 0
18 0 0 0 0 0
19 0 0 0 0 0
20 0 0 0 0 0
21 0 0 0 1 0
22 0 0 1 1 1 +
23 0 0 0 0 0
24 0 0 0 0 0
25 0 0 0 0 0

138
Instance No.
Actual class
Naïve Bayes
approach SVM
KNN method
Majority vote
Error
26 0 0 0 0 0
27 0 0 0 0 0
28 0 0 0 0 0
29 0 0 0 0 0
30 0 1 1 1 1 +

139
Table 98. The predicted results of the mixed classifier based on Naïve Bayes approach, SVM and KNN method using majority vote of fold 6.
Instance No.
Actual class
Naïve Bayes
approach SVM
KNN method
Majority vote
Error
1 1 1 1 1 1
2 1 1 1 1 1
3 1 1 1 1 1
4 1 1 1 1 1
5 1 0 1 1 1
6 1 1 1 1 1
7 1 1 0 1 1
8 1 1 1 1 1
9 1 1 1 1 1
10 1 1 1 1 1
11 1 1 1 1 1
12 1 1 1 1 1
13 1 0 0 0 0 +
14 1 1 1 1 1
15 0 0 0 0 0
16 0 0 0 0 0
17 0 0 0 0 0
18 0 0 0 0 0
19 0 0 0 0 0
20 0 1 0 0 0
21 0 0 1 1 1 +
22 0 0 0 0 0
23 0 0 0 0 0
24 0 0 0 0 0
25 0 0 0 0 0

140
Instance No.
Actual class
Naïve Bayes
approach SVM
KNN method
Majority vote
Error
26 0 0 1 1 1 + 27 0 0 0 0 0
28 0 0 0 0 0
29 0 0 0 0 0
30 0 1 1 1 1 +

141
Table 99. The predicted results of the mixed classifier based on Naïve Bayes approach, SVM and KNN method using majority vote of fold 7.
Instance No.
Actual class
Naïve Bayes
approach SVM
KNN method
Majority vote
Error
1 1 1 1 1 1
2 1 1 1 1 1
3 1 1 1 1 1
4 1 1 1 1 1
5 1 1 1 0 1
6 1 1 1 1 1
7 1 0 0 0 0 +
8 1 1 1 1 1
9 1 1 1 1 1
10 1 1 1 1 1
11 1 1 0 1 1
12 1 1 1 1 1
13 1 1 1 1 1
14 1 0 1 1 1
15 0 0 0 0 0
16 0 1 1 1 1 +
17 0 0 0 0 0
18 0 0 0 0 0
19 0 0 0 0 0
20 0 1 1 1 1 + 21 0 0 0 0 0
22 0 0 0 0 0
23 0 0 0 0 0
24 0 0 0 0 0
25 0 1 1 0 1 +

142
Instance No.
Actual class
Naïve Bayes
approach SVM
KNN method
Majority vote
Error
26 0 0 0 0 0
27 0 0 0 0 0
28 0 0 0 0 0
29 0 0 0 0 0
30 0 0 1 0 0
31 0 0 0 0 0

143
Table 100. The predicted results of the mixed classifier based on Naïve Bayes approach, SVM and KNN method using majority vote of fold 8.
Instance No.
Actual class
Naïve Bayes
approach SVM
KNN method
Majority vote
Error
1 1 1 1 1 1
2 1 1 1 1 1
3 1 1 1 1 1
4 1 1 1 1 1
5 1 1 1 1 1
6 1 0 0 0 0 + 7 1 1 1 1 1
8 1 1 1 1 1
9 1 0 0 1 0 + 10 1 1 0 1 1
11 1 1 0 0 0 +
12 1 1 1 1 1
13 1 1 1 1 1
14 1 1 1 1 1
15 0 0 0 0 0
16 0 0 0 1 0
17 0 0 0 0 0
18 0 0 0 0 0
19 0 0 0 0 0
20 0 1 0 0 0
21 0 0 0 0 0
22 0 0 0 1 0
23 0 1 1 0 1
24 0 0 0 0 0
25 0 0 0 0 0

144
Instance No.
Actual class
Naïve Bayes
approach SVM
KNN method
Majority vote
Error
26 0 0 0 0 0
27 0 0 0 0 0
28 0 0 0 0 0
29 0 0 0 0 0
30 0 0 0 0 0
31 0 0 0 0 0

145
Table 101. The predicted results of the mixed classifier based on Naïve Bayes approach, SVM and KNN method using majority vote of fold 9.
Instance No.
Actual class
Naïve Bayes
approach SVM
KNN method
Majority vote
Error
1 1 1 1 1 1
2 1 0 0 0 0 +
3 1 0 0 0 0 +
4 1 1 1 1 1
5 1 1 1 1 1
6 1 0 1 1 1
7 1 1 1 1 1
8 1 0 0 0 0 +
9 1 1 1 1 1
10 1 1 1 1 1
11 1 0 0 0 0 +
12 1 0 0 0 0 + 13 1 1 1 1 1
14 1 1 1 1 1
15 0 0 0 0 0
16 0 0 0 0 0
17 0 0 0 0 0
18 0 0 0 0 0
19 0 0 0 0 0
20 0 0 0 0 0
21 0 0 0 0 0
22 0 0 0 0 0
23 0 0 0 0 0
24 0 0 0 0 0
25 0 1 1 1 1 +
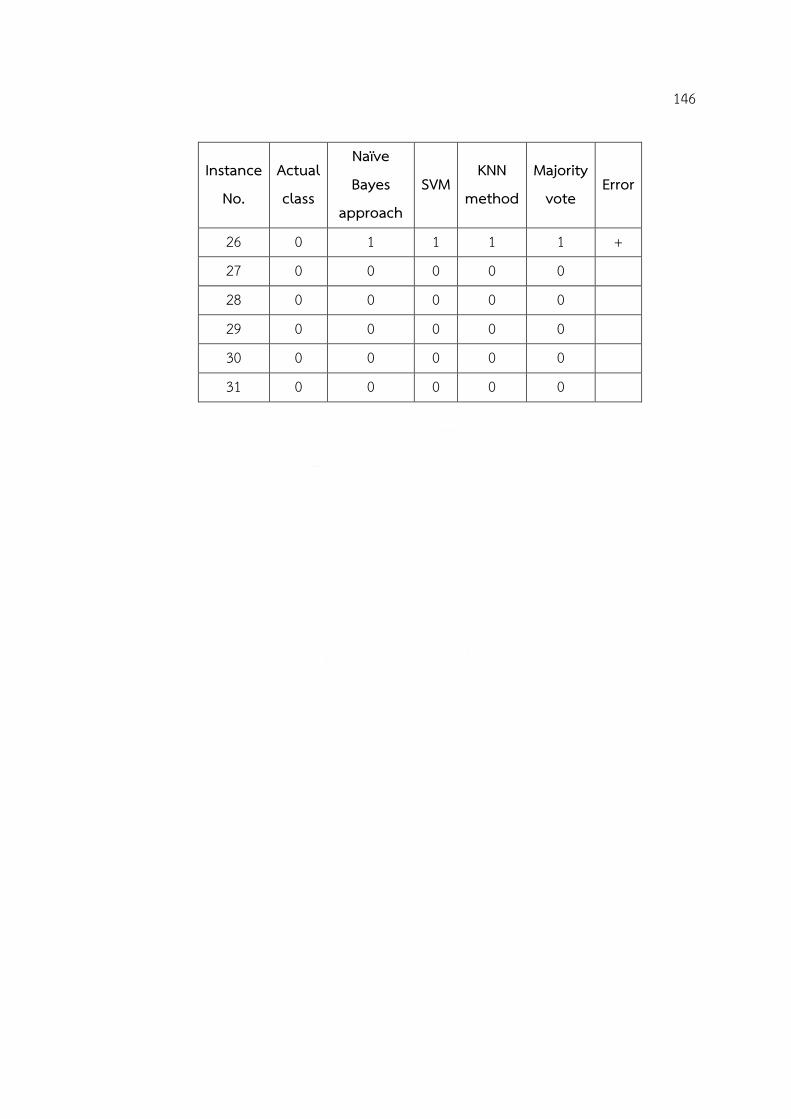
146
Instance No.
Actual class
Naïve Bayes
approach SVM
KNN method
Majority vote
Error
26 0 1 1 1 1 + 27 0 0 0 0 0
28 0 0 0 0 0
29 0 0 0 0 0
30 0 0 0 0 0
31 0 0 0 0 0

147
Table 102. The predicted results of the mixed classifier based on Naïve Bayes approach, SVM and KNN method using majority vote of fold 10.
Instance No.
Actual class
Naïve Bayes
approach SVM
KNN method
Majority vote
Error
1 1 1 1 1 1
2 1 1 1 1 1
3 1 1 1 1 1
4 1 1 0 1 1
5 1 1 1 1 1
6 1 1 1 1 1
7 1 0 0 1 0 +
8 1 1 1 1 1
9 1 1 1 1 1
10 1 0 0 0 0 +
11 1 1 1 1 1
12 1 1 1 1 1
13 1 0 0 0 0 +
14 0 0 0 0 0
15 0 0 0 0 0
16 0 0 0 0 0
17 0 0 0 0 0
18 0 0 0 0 0
19 0 0 0 0 0
20 0 1 1 0 1 + 21 0 0 0 0 0
22 0 1 0 1 1 +
23 0 0 0 0 0
24 0 0 0 0 0
25 0 0 0 0 0

148
Instance No.
Actual class
Naïve Bayes
approach SVM
KNN method
Majority vote
Error
26 0 0 0 0 0
27 0 0 0 0 0
28 0 0 0 0 0
29 0 0 0 0 0
30 0 0 0 0 0

149
Table 103. The predicted results of the proposed method of fold 1. Instance No. Actual class Predicted class Error
1 1 1
2 1 1
3 1 0 +
4 1 1
5 1 1
6 1 1
7 1 0 +
8 1 0 +
9 1 1
10 1 1
11 1 1
12 1 1
13 1 0 + 14 1 1
15 0 0
16 0 0
17 0 0
18 0 0
19 0 0
20 0 0
21 0 0
22 0 0
23 0 0
24 0 0
25 0 0
26 0 0
27 0 0
28 0 0
29 0 0
30 0 0

150
Table 104. The predicted results of the proposed method of fold 2.
Instance No. Actual class Predicted class Error 1 1 1
2 1 1
3 1 1
4 1 0 + 5 1 1
6 1 1
7 1 0 +
8 1 1
9 1 1
10 1 1
11 1 0 + 12 1 1
13 1 1
14 1 1
15 0 0
16 0 0
17 0 0
18 0 0
19 0 0
20 0 0
21 0 0
22 0 1 + 23 0 0
24 0 0
25 0 0
26 0 0
27 0 0
28 0 0
29 0 0
30 0 0

151
Table 105. The predicted results of the proposed method of fold 3. Instance No. Actual class Predicted class Error
1 1 1
2 1 0 + 3 1 1
4 1 0 + 5 1 1
6 1 1
7 1 1
8 1 0 +
9 1 1
10 1 1
11 1 1
12 1 1
13 1 1
14 1 1
15 0 0
16 0 1 +
17 0 1 + 18 0 0
19 0 0
20 0 0
21 0 0
22 0 0
23 0 0
24 0 0
25 0 1 +
26 0 0
27 0 0
28 0 0
29 0 0
30 0 0

152
Table 106. The predicted results of the proposed method of fold 4. Instance No. Actual class Predicted class Error
1 1 1
2 1 1
3 1 1
4 1 1
5 1 1
6 1 1
7 1 1
8 1 1
9 1 1
10 1 1
11 1 1
12 1 1
13 1 1
14 1 1
15 0 0
16 0 0
17 0 0
18 0 0
19 0 1 + 20 0 0
21 0 0
22 0 0
23 0 0
24 0 0
25 0 0
26 0 0
27 0 0
28 0 0
29 0 0
30 0 0

153
Table 107. The predicted results of the proposed method of fold 5. Instance No. Actual class Predicted class Error
1 1 1
2 1 0 + 3 1 1
4 1 1
5 1 1
6 1 1
7 1 1
8 1 1
9 1 1
10 1 0 +
11 1 1
12 1 1
13 1 1
14 1 1
15 0 0
16 0 0
17 0 0
18 0 0
19 0 0
20 0 0
21 0 0
22 0 1 + 23 0 0
24 0 0
25 0 0
26 0 0
27 0 0
28 0 0
29 0 0
30 0 1 +

154
Table 108. The predicted results of the proposed method of fold 6. Instance No. Actual class Predicted class Error
1 1 1
2 1 1
3 1 1
4 1 1
5 1 1
6 1 1
7 1 1
8 1 1
9 1 1
10 1 1
11 1 1
12 1 1
13 1 0 + 14 1 1
15 0 0
16 0 0
17 0 0
18 0 0
19 0 0
20 0 0
21 0 1 +
22 0 0
23 0 0
24 0 0
25 0 0
26 0 1 + 27 0 0
28 0 0
29 0 0
30 0 1 +

155
Table 109. The predicted results of the proposed method of fold 7. Instance No. Actual class Predicted class Error
1 1 1
2 1 1
3 1 1
4 1 1
5 1 0 +
6 1 1
7 1 0 +
8 1 1
9 1 1
10 1 1
11 1 1
12 1 1
13 1 1
14 1 1
15 0 0
16 0 1 +
17 0 0
18 0 0
19 0 0
20 0 1 +
21 0 0
22 0 0
23 0 0
24 0 0
25 0 0
26 0 0
27 0 0
28 0 0
29 0 0
30 0 1 +
31 0 0

156
Table 110. The predicted results of the proposed method of fold 8. Instance No. Actual class Predicted class Error
1 1 1
2 1 1
3 1 1
4 1 1
5 1 1
6 1 0 + 7 1 1
8 1 1
9 1 0 +
10 1 1
11 1 0 + 12 1 1
13 1 1
14 1 1
15 0 0
16 0 0
17 0 0
18 0 0
19 0 0
20 0 0
21 0 0
22 0 0
23 0 0
24 0 0
25 0 0
26 0 0
27 0 0
28 0 0
29 0 0
30 0 0
31 0 0

157
Table 111. The predicted results of the proposed method of fold 9. Instance No. Actual class Predicted class Error
1 1 1
2 1 0 +
3 1 0 +
4 1 1
5 1 1
6 1 1
7 1 1
8 1 0 +
9 1 1
10 1 1
11 1 0 + 12 1 0 +
13 1 1
14 1 1
15 0 0
16 0 0
17 0 0
18 0 0
19 0 0
20 0 0
21 0 0
22 0 0
23 0 0
24 0 0
25 0 1 + 26 0 1 +
27 0 0
28 0 0
29 0 0
30 0 0
31 0 0

158
Table 112. The predicted results of the proposed method of fold 10.
Instance No. Actual class Predicted class Error 1 1 1
2 1 1
3 1 1
4 1 1
5 1 1
6 1 1
7 1 0 +
8 1 1
9 1 1
10 1 0 +
11 1 1
12 1 1
13 1 0 + 14 0 0
15 0 0
16 0 0
17 0 0
18 0 0
19 0 0
20 0 0
21 0 0
22 0 1 + 23 0 0
24 0 0
25 0 0
26 0 0
27 0 0
28 0 0
29 0 0
30 0 0

159
Table 113. The confusion matrix of Naïve Bayes approach of fold 1.
Table 114. The confusion matrix of Naïve Bayes approach of fold 2.
Table 115. The confusion matrix of Naïve Bayes approach of fold 3.
Table 116. The confusion matrix of Naïve Bayes approach of fold 4.
Predicted class
Non-Risk Risk Ac
tual
cla
ss
Non-Risk 13 3
Risk 3 11
Predicted class
Non-Risk Risk
Actu
al cl
ass
Non-Risk 13 3
Risk 4 10
Predicted class
Non-Risk Risk
Actu
al cl
ass
Non-Risk 14 2
Risk 1 13
Predicted class
Non-Risk Risk
Actu
al cl
ass
Non-Risk 15 1
Risk 1 13

160
Table 117. The confusion matrix of Naïve Bayes approach of fold 5.
Table 118. The confusion matrix of Naïve Bayes approach of fold 6.
Table 119. The confusion matrix of Naïve Bayes approach of fold 7.
Table 120. The confusion matrix of Naïve Bayes approach of fold 8.
Predicted class
Non-Risk Risk Ac
tual
cla
ss
Non-Risk 15 1
Risk 2 12
Predicted class
Non-Risk Risk
Actu
al cl
ass
Non-Risk 14 2
Risk 2 12
Predicted class
Non-Risk Risk
Actu
al cl
ass
Non-Risk 14 3
Risk 2 12
Predicted class
Non-Risk Risk
Actu
al cl
ass
Non-Risk 15 2
Risk 2 12

161
Table 121. The confusion matrix of Naïve Bayes approach of fold 9.
Table 122. The confusion matrix of Naïve Bayes approach of fold 10.
Table 123. The confusion matrix of SVM of fold 1.
Table 124. The confusion matrix of SVM of fold 2.
Predicted class
Non-Risk Risk A
ctua
l cla
ss
Non-Risk 15 2
Risk 6 8
Predicted class
Non-Risk Risk
Actu
al cl
ass
Non-Risk 15 2
Risk 3 10
Predicted class
Non-Risk Risk
Actu
al cl
ass
Non-Risk 15 1
Risk 3 11
Predicted class
Non-Risk Risk
Actu
al cl
ass
Non-Risk 15 1
Risk 3 11

162
Table 125. The confusion matrix of SVM of fold 3.
Table 126. The confusion matrix of SVM of fold 4.
Table 127. The confusion matrix of SVM of fold 5.
Table 128. The confusion matrix of SVM of fold 6.
Predicted class
Non-Risk Risk Ac
tual
cla
ss
Non-Risk 14 2
Risk 2 12
Predicted class
Non-Risk Risk
Actu
al cl
ass
Non-Risk 15 1
Risk 0 14
Predicted class
Non-Risk Risk
Actu
al cl
ass
Non-Risk 14 2
Risk 3 11
Predicted class
Non-Risk Risk
Actu
al cl
ass
Non-Risk 13 3
Risk 2 12

163
Table 129. The confusion matrix of SVM of fold 7.
Table 130. The confusion matrix of SVM of fold 8.
Table 131. The confusion matrix of SVM of fold 9.
Table 132. The confusion matrix of SVM of fold 10.
Predicted class
Non-Risk Risk Ac
tual
cla
ss
Non-Risk 13 4
Risk 2 12
Predicted class
Non-Risk Risk
Actu
al cl
ass
Non-Risk 16 1
Risk 4 10
Predicted class
Non-Risk Risk
Actu
al cl
ass
Non-Risk 15 2
Risk 5 9
Predicted class
Non-Risk Risk
Actu
al cl
ass
Non-Risk 16 1
Risk 4 9

164
Table 133. The confusion matrix of KNN method of fold 1.
Table 134. The confusion matrix of KNN method of fold 2.
Table 135. The confusion matrix of KNN method of fold 3.
Table 136. The confusion matrix of KNN method of fold 4.
Predicted class
Non-Risk Risk Ac
tual
cla
ss
Non-Risk 16 0
Risk 4 10
Predicted class
Non-Risk Risk
Actu
al cl
ass
Non-Risk 13 3
Risk 3 11
Predicted class
Non-Risk Risk
Actu
al cl
ass
Non-Risk 12 4
Risk 3 11
Predicted class
Non-Risk Risk
Actu
al cl
ass
Non-Risk 14 2
Risk 0 14

165
Table 137. The confusion matrix of KNN method of fold 5.
Table 138. The confusion matrix of KNN method of fold 6.
Table 139. The confusion matrix of KNN method of fold 7.
Table 140. The confusion matrix of KNN method of fold 8.
Predicted class
Non-Risk Risk Ac
tual
cla
ss
Non-Risk 13 3
Risk 1 13
Predicted class
Non-Risk Risk
Actu
al cl
ass
Non-Risk 13 3
Risk 1 13
Predicted class
Non-Risk Risk
Actu
al cl
ass
Non-Risk 15 2
Risk 2 12
Predicted class
Non-Risk Risk
Actu
al cl
ass
Non-Risk 15 2
Risk 2 12

166
Table 141. The confusion matrix of KNN method of fold 9.
Table 142. The confusion matrix of KNN method of fold 10.
Table 143. The confusion matrix of J48 Decision tree of fold 1.
Table 144. The confusion matrix of J48 Decision tree of fold 2.
Predicted class
Non-Risk Risk Ac
tual
cla
ss
Non-Risk 15 2
Risk 5 9
Predicted class
Non-Risk Risk
Actu
al cl
ass
Non-Risk 16 1
Risk 2 11
Predicted class
Non-Risk Risk
Actu
al cl
ass
Non-Risk 12 4
Risk 4 10
Predicted class
Non-Risk Risk
Actu
al cl
ass
Non-Risk 15 1
Risk 4 10

167
Table 145. The confusion matrix of J48 Decision tree of fold 3.
Table 146. The confusion matrix of J48 Decision tree of fold 4.
Table 147. The confusion matrix of J48 Decision tree of fold 5.
Table 148. The confusion matrix of J48 Decision tree of fold 6.
Predicted class
Non-Risk Risk Ac
tual
cla
ss
class
Non-Risk 15 1
Risk 3 11
Predicted class
Non-Risk Risk
Actu
al cl
ass
Non-Risk 13 3
Risk 2 12
Predicted class
Non-Risk Risk
Actu
al cl
ass
Non-Risk 13 3
Risk 3 11
Predicted class
Non-Risk Risk
Actu
al cl
ass
Non-Risk 11 5
Risk 3 11

168
Table 149. The confusion matrix of J48 Decision tree of fold 7.
Table 150. The confusion matrix of J48 Decision tree of fold 8.
Table 151. The confusion matrix of J48 Decision tree of fold 9.
Table 152. The confusion matrix of J48 Decision tree of fold 10.
Predicted class
Non-Risk Risk Ac
tual
cla
ss
Non-Risk 9 8
Risk 5 9
Predicted class
Non-Risk Risk
Actu
al cl
ass
Non-Risk 15 2
Risk 4 10
Predicted class
Non-Risk Risk
Actu
al cl
ass
Non-Risk 16 1
Risk 7 7
Predicted class
Non-Risk Risk
Actu
al cl
ass
Non-Risk 16 1
Risk 4 9

169
Table 153. The confusion matrix of the mixed classifier based on Naïve Bayes approach, SVM and J48 Decision tree using majority vote of fold 1.
Table 154. The confusion matrix of the mixed classifier based on Naïve Bayes
approach, SVM and J48 Decision tree using majority vote of fold 2.
Table 155. The confusion matrix of the mixed classifier based on Naïve Bayes
approach, SVM and J48 Decision tree using majority vote of fold 3.
Table 156. The confusion matrix of the mixed classifier based on Naïve Bayes
approach, SVM and J48 Decision tree using majority vote of fold 4.
Predicted class
Non-Risk Risk Ac
tual
cla
ss
Non-Risk 14 2
Risk 3 11
Predicted class
Non-Risk Risk
Actu
al cl
ass
Non-Risk 14 2
Risk 3 11
Predicted class
Non-Risk Risk
Actu
al cl
ass
Non-Risk 15 1
Risk 3 11
Predicted class
Non-Risk Risk
Actu
al cl
ass
Non-Risk 15 1
Risk 0 14

170
Table 157. The confusion matrix of the mixed classifier based on Naïve Bayes approach, SVM and J48 Decision tree using majority vote of fold 5.
Table 158. The confusion matrix of the mixed classifier based on Naïve Bayes
approach, SVM and J48 Decision tree using majority vote of fold 6.
Table 159. The confusion matrix of the mixed classifier based on Naïve Bayes
approach, SVM and J48 Decision tree using majority vote of fold 7.
Table 160. The confusion matrix of the mixed classifier based on Naïve Bayes
approach, SVM and J48 Decision tree using majority vote of fold 8.
Predicted class
Non-Risk Risk Ac
tual
cla
ss
Non-Risk 14 2
Risk 3 11
Predicted class
Non-Risk Risk
Actu
al cl
ass
Non-Risk 13 3
Risk 2 12
Predicted class
Non-Risk Risk
Actu
al cl
ass
Non-Risk 13 4
Risk 2 12
Predicted class
Non-Risk Risk
Actu
al cl
ass
Non-Risk 15 2
Risk 4 10

171
Table 161. The confusion matrix of the mixed classifier based on Naïve Bayes approach, SVM and J48 Decision tree using majority vote of fold 9.
Table 162. The confusion matrix of the mixed classifier based on Naïve Bayes
approach, SVM and J48 Decision tree using majority vote of fold 10.
Table 163. The confusion matrix of the mixed classifier based on Naïve Bayes
approach, SVM and KNN method using majority vote of fold 1.
Table 164. The confusion matrix of the mixed classifier based on Naïve Bayes
approach, SVM and KNN method using majority vote of fold 2.
Predicted class
Non-Risk Risk Ac
tual
cla
ss
Non-Risk 15 2
Risk 6 8
Predicted class
Non-Risk Risk
Actu
al cl
ass
Non-Risk 16 1
Risk 3 10
Predicted class
Non-Risk Risk
Actu
al cl
ass
Non-Risk 15 1
Risk 3 11
Predicted class
Non-Risk Risk
Actu
al cl
ass
Non-Risk 14 2
Risk 3 11

172
Table 165. The confusion matrix of the mixed classifier based on Naïve Bayes approach, SVM and KNN method using majority vote of fold 3.
Table 166. The confusion matrix of the mixed classifier based on Naïve Bayes approach SVM and KNN method using majority vote of fold 4.
Table 167. The confusion matrix of the mixed classifier based on Naïve Bayes approach SVM and KNN method using majority vote of fold 5.
Table 168. The confusion matrix of the mixed classifier based on Naïve Bayes approach SVM and KNN method using majority vote of fold 6.
Predicted class
Non-Risk Risk Ac
tual
class
Non-Risk 13 3
Risk 3 11
Predicted class
Non-Risk Risk
Actu
al cla
ss
Non-Risk 15 1
Risk 0 14
Predicted class
Non-Risk Risk
Actu
al cla
ss
Non-Risk 14 2
Risk 2 12
Predicted class
Non-Risk Risk
Actu
al cla
ss
Non-Risk 13 3
Risk 1 13

173
Table 169. The confusion matrix of the mixed classifier based on Naïve Bayes approach SVM and KNN method using majority vote of fold 7.
Table 170. The confusion matrix of the mixed classifier based on Naïve Bayes approach SVM and KNN method using majority vote of fold 8.
Table 171. The confusion matrix of the mixed classifier based on Naïve Bayes approach SVM and KNN method using majority vote of fold 9.
Table 172. The confusion matrix of the mixed classifier based on Naïve Bayes approach SVM and KNN method using majority vote of fold 10.
Predicted class
Non-Risk Risk Ac
tual
cla
ss
Non-Risk 14 3
Risk 1 13
Predicted class
Non-Risk Risk
Actu
al cla
ss
Non-Risk 16 1
Risk 3 11
Predicted class
Non-Risk Risk
Actu
al cla
ss
Non-Risk 15 2
Risk 5 9
Predicted class
Non-Risk Risk
Actu
al cla
ss
Non-Risk 15 2
Risk 3 10

174
Table 173. The confusion matrix of the proposed method of fold 1.
Table 174. The confusion matrix of the proposed method of fold 2.
Table 175. The confusion matrix of the proposed method of fold 3.
Table 176. The confusion matrix of the proposed method of fold 4.
Predicted class
Non-Risk Risk Ac
tual
cla
ss
Non-Risk 16 0
Risk 4 10
Predicted class
Non-Risk Risk
Actu
al cl
ass
Non-Risk 15 1
Risk 3 11
Predicted class
Non-Risk Risk
Actu
al cl
ass
Non-Risk 13 3
Risk 3 11
Predicted class
Non-Risk Risk
Actu
al cl
ass
Non-Risk 15 1
Risk 0 14

175
Table 177. The confusion matrix of the proposed method of fold 5.
Table 178. The confusion matrix of the proposed method of fold 6.
Table 179. The confusion matrix of the proposed method of fold 7.
Table 180. The confusion matrix of the proposed method of fold 8.
Predicted class
Non-Risk Risk Ac
tual
cla
ss
Non-Risk 14 2
Risk 2 12
Predicted class
Non-Risk Risk
Actu
al cl
ass
Non-Risk 13 3
Risk 1 13
Predicted class
Non-Risk Risk
Actu
al cl
ass
Non-Risk 14 3
Risk 2 12
Predicted class
Non-Risk Risk
Actu
al cl
ass
Non-Risk 17 0
Risk 3 11

176
Table 181. The confusion matrix of the proposed method of fold 9.
Table 182. The confusion matrix of the proposed method of fold 10.
Table 183. Actual class selection of eight patterns in training set 1.
No. Pattern Number
of risk (1) class
Number of non-risk (0)
class
Actual class Naïve Bayes
approach SVM KNN
method 1 1 1 1 93 7 Risk (1) 2 1 1 0 1 4 Non-risk (0)
3 1 0 1 6 3 Risk (1) 4 1 0 0 3 3 Non-risk (0)
5 0 1 1 5 4 Risk (1) 6 0 1 0 1 1 Non-risk (0)
7 0 0 1 3 6 Non-risk (0) 8 0 0 0 15 118 Non-risk (0)
Predicted class
Non-Risk Risk Ac
tual
cla
ss
Non-Risk 15 2
Risk 5 9
Predicted class
Non-Risk Risk
Actu
al cl
ass
Non-Risk 16 1
Risk 3 10

177
Table 184. Actual class selection of eight patterns in training set 2.
No. Pattern Number
of risk (1) class
Number of non-risk (0)
class
Actual class Naïve Bayes
approach SVM KNN
method
1 1 1 1 92 7 Risk (1) 2 1 1 0 2 4 Non-risk (0)
3 1 0 1 6 2 Risk (1) 4 1 0 0 4 4 Non-risk (0)
5 0 1 1 4 4 Risk (1) 6 0 1 0 1 1 Non-risk (0)
7 0 0 1 3 4 Non-risk (0) 8 0 0 0 15 120 Non-risk (0)
Table 185. Actual class selection of eight patterns in training set 3.
No. Pattern Number
of risk (1) class
Number of non-risk (0)
class
Actual class
Naïve Bayes approach
SVM KNN
method
1 1 1 1 91 6 Risk (1) 2 1 1 0 2 5 Non-risk (0)
3 1 0 1 6 2 Risk (1) 4 1 0 0 2 5 Non-risk (0)
5 0 1 1 5 3 Risk (1) 6 0 1 0 0 1 Non-risk (0) 7 0 0 1 3 5 Non-risk (0)
8 0 0 0 18 119 Non-risk (0)

178
Table 186. Actual class selection of eight patterns in training set 4.
No. Pattern Number
of risk (1) class
Number of non-risk (0)
class
Actual class
Naïve Bayes approach
SVM KNN
method
1 1 1 1 89 7 Risk (1) 2 1 1 0 2 5 Non-risk (0)
3 1 0 1 5 3 Risk (1) 4 1 0 0 4 5 Non-risk (0)
5 0 1 1 4 4 Risk (1) 6 0 1 0 1 1 Non-risk (0)
7 0 0 1 3 6 Non-risk (0) 8 0 0 0 17 117 Non-risk (0)
Table 187. Actual class selection of eight patterns in training set 5.
No. Pattern Number
of risk (1) class
Number of non-risk (0)
class
Actual class
Naïve Bayes approach
SVM KNN
method
1 1 1 1 91 6 Risk (1) 2 1 1 0 2 5 Non-risk (0)
3 1 0 1 5 3 Risk (1) 4 1 0 0 4 5 Non-risk (0) 5 0 1 1 5 3 Risk (1) 6 0 1 0 1 1 Non-risk (0) 7 0 0 1 2 5 Non-risk (0)
8 0 0 0 17 118 Non-risk (0)

179
Table 188. Actual class selection of eight patterns in training set 6.
No. Pattern Number
of risk (1) class
Number of non-risk (0)
class
Actual class
Naïve Bayes approach
SVM KNN
method
1 1 1 1 91 6 Risk (1) 2 1 1 0 2 5 Non-risk (0)
3 1 0 1 5 3 Risk (1) 4 1 0 0 4 4 Non-risk (0)
5 0 1 1 4 2 Risk (1) 6 0 1 0 1 1 Non-risk (0)
7 0 0 1 3 6 Non-risk (0) 8 0 0 0 17 119 Non-risk (0)
Table 189. Actual class selection of eight patterns in training set 7.
No. Pattern Number
of risk (1) class
Number of non-risk (0)
class Actual class Naïve Bayes
approach SVM
KNN method
1 1 1 1 92 5 Risk (1) 2 1 1 0 1 4 Non-risk (0)
3 1 0 1 5 3 Risk (1) 4 1 0 0 4 5 Non-risk (0)
5 0 1 1 4 4 Risk (1) 6 0 1 0 1 0 Non-risk (1) 7 0 0 1 3 6 Non-risk (0)
8 0 0 0 17 118 Non-risk (0)

180
Table 190. Actual class selection of eight patterns in training set 8.
No. Pattern Number
of risk (1) class
Number of non-risk (0)
class
Actual class
Naïve Bayes approach
SVM KNN
method
1 1 1 1 92 7 Risk (1) 2 1 1 0 2 4 Non-risk (0)
3 1 0 1 5 3 Risk (1) 4 1 0 0 3 4 Non-risk (0)
5 0 1 1 5 4 Risk (1) 6 0 1 0 1 1 Non-risk (0)
7 0 0 1 2 4 Non-risk (0) 8 0 0 0 17 118 Non-risk (0)
Table 191. Actual class selection of eight patterns in training set 9.
No. Pattern Number
of risk (1) class
Number of non-risk (0)
class
Actual class
Naïve Bayes approach
SVM KNN
method
1 1 1 1 94 5 Risk (1) 2 1 1 0 2 5 Non-risk (0)
3 1 0 1 6 3 Risk (1) 4 1 0 0 4 5 Non-risk (0) 5 0 1 1 4 4 Risk (1) 6 0 1 0 1 1 Non-risk (0) 7 0 0 1 3 6 Non-risk (0)
8 0 0 0 13 116 Non-risk (0)

181
Table 192. Actual class selection of eight patterns in training set 10.
No. Pattern Number
of risk (1) class
Number of non-risk (0)
class
Actual class
Naïve Bayes approach
SVM KNN
method
1 1 1 1 93 7 Risk (1) 2 1 1 0 2 4 Non-risk (0)
3 1 0 1 5 2 Risk (1) 4 1 0 0 4 5 Non-risk (0)
5 0 1 1 5 4 Risk (1) 6 0 1 0 1 1 Non-risk (0)
7 0 0 1 2 6 Non-risk (0) 8 0 0 0 16 116 Non-risk (0)

182
VITA
VITA
Name: Sarawut Meesri
Affiliation: Advanced Virtual and Intelligent Computing (AVIC) Center, Department of Mathematics and Computer Science, Faculty of Science, Chulalongkorn University.
Country: Thailand
Biography: Mr. Sarawut Meesri was born on February 20, 1993, in Phetchabun Province, Thailand. He received a Bachelor's Degree in Computer Science from Sripatum University. Now he is a Master's degree student in Computer Science and Information Technology, Department of Mathematics and Computer Science, Faculty of Science, Chulalongkorn University.

183