Mr. PK Panigrahi, Sr. DDG (BW), DOT
37
Green Solutions to Power Problems (Solar & Solar-Wind Hybrid Systems ) For Telecom Infrastructure
Transcript of Mr. PK Panigrahi, Sr. DDG (BW), DOT
Green Solutions to Power Problems
(Solar & Solar-Wind Hybrid Systems )
ForTelecom Infrastructure

• Mobile Towers : 5.88 LakhsPower Requirement : 1 - 5 KW (24X7)Telecom Sector Energy Requirement : 14 Million Units per annum
(Green Peace report).Energy is a dominant cost component for Telecom.
Urban - 30% of OPEX Rural - 50% of OPEX
Mobile Tower Sites

Specific Problems of Power
Power availability is a major challenge Rural areas conventional grid power not availableMore than one lakh villages still remain to be electrifiedWherever grid supply is available power quality is poor and erratic Power availability less than 12 hours a day.

Contd..
Poor power quality mainly due to a. Supply interruption b. Sudden change in voltagec. Under voltage/over voltaged. Voltage fluctuation
Operators necessarily invest in providing back up options

Two of the most common alternate power solutions
DG Set– Transportation, storage, pilferage, high cost of
diesel pose major hurdles in operating DG sets. – Causes pollution (environmental & noise)
Inverter-Battery Systems– Low voltage and intermittent supply of electricity
renders inverter-battery ineffective and battery doesn’t get fully charged due to unreliable supply of grid power.
Operator depend heavily on diesel generator to power BTS towers.Power deficit coupled with rising cost of diesel pose the significant challenge for the sector.

D.G. Operation
DG Running Hours : 16 – 20 Hrs per day.(Rural / Semi-urban)Each BTS tower : 4000 Lt diesel / year.Last year expenditure on Diesel : Rs. 7000 Crores.
(Economic times 8th March)Without Diesel subsidy the cost of power generation shall go up by 20 – 25 % more.We need to integrate low energy and low carbon considerations in our operations.

Carbon Emission
Mobile Towers : 5.88 LakhsDG set : 15/20 KVADiesel Consumption : 2.75 Litres / hour.Diesel Running Hours : 8 - 12 Hours / dayDiesel Consumption : More than 2 billion litres1 litre diesel emits : 2.68 Kg of CO2
Mobile Towers generating : Tons of carbonThere is a need for estimation of carbon emission by the Telecom Industry.

Monitoring and Accounting
Fixation of bench mark standards.(a) Units / mobile connection / month(b) Units / mobile traffic / month(c) Units / revenue generation / month(d) Units / Cell site / month(e) Carbon (Kg) / Cell site / month
0.84 Kg. / unit of Grid supply 2.68 Kg / litre of diesel consumption

Alternate RE Solutions
Decentralized Distributed Generation based on Renewable energy resources is an effective solution to power problems specially rural areas
Solar Photo Voltaic (SPV)Wind Turbine GeneratorFuel CellsBio MassHybrid Solutions

Dept of Telecom carried out pilot projects of non-conventional energy sources
Solar & Solar-wind Hybrid system
To power mobile towers in USOF phase-I rural sites.
Solar Initiatives

ObjectivesObjectives……....
Utilization of natural Solar Power Optimization of Fuel consumption Minimise Run-Hour of Diesel Generator Low maintenance cost. Savings in Operational Expenses. Eco-friendly atmosphere will minimizeoperational hazards.

Solar Photo Voltaic Cells
1 Kwp SPV generates: 3.5 - 4 units (Kwh) / dayArea requirement : 10-12 sq mt / Kwp SPVInstallation : South facing, placement angle as per altitude of the placeNo maintenance (cleaning of panel necessary)Cost of installation : Rs. 2.2 – 2.5 lakhs / Kwp
(SPV, battery & control panel)
Life : 20 - 25 yrs (battery – 5 yrs)
High CAPEX – Low OPEX

Wind Turbine Generator
• Wind speed - National Average: 5-6 m/s.• Aero Generator : 3-5 Kw. (Smaller capacity) • Height : 20 mt. • 1Kw WT Generates: 3 units / day.• Cost of 1 Kw WTG : Rs. 1 lakh• Life : 20-25 years
(Available in Maharashtra, Tamil Nadu, Gujarat, Karnataka and parts of Orissa, Andhra Pradesh & Madhya Pradesh.)

Pilot Project
System Designed for A Solar PV panel : 10 KwpWind Turbine Generator : 5 KwpBattery (48 V, 2500 AH) – Tubular VRLA Gel batteryCharge Control Unit(CCU)
Centralized power plant, battery bank, SPV2 - 7 hrs DG operation

SPV Calculations
Eqpt. Load SPV(Stand alone)
SPV + DG (2-7 Hrs)
Area reqd. (12m2/KWp)
Cost (Rs.250/Wp)Rs. Lakhs
2 KW 15 KWp 7.5 KWp 90 m2 19
3 KW 22 KWp 11 KWp 130 m2 28
4 KW 30 KWp 15 KWp 180 m2 38
6 KW 44 KWp 22 KWp 250 m2 55

Grid
Gen
3-Ø
20 KVA, 3-Ø
Service Provider 1
48 V DC bus
LT panel-Surge
arrestors
SMPS(1+1)
BTS equipment
Batterybank (1+1)
48 V DC bus
LT panel-Surge
arrestors
SMPS(1+1)
BTS equipment
Batterybank (1+1)
48 V DC bus
LT panel-Surge
arrestors
SMPS(1+1)
BTS equipment
Batterybank (1+1)
Service Provider 2
Service Provider 3

Grid
Gen
3-Ø
15 KVA, 1-Ø
Battery bank(1+1)
48 V DCAutomatic
Phase selector DC bus
SMPS
(1+1)
Service Provider 1
Service Provider 2
Service Provider 3
Centralized DC Distribution
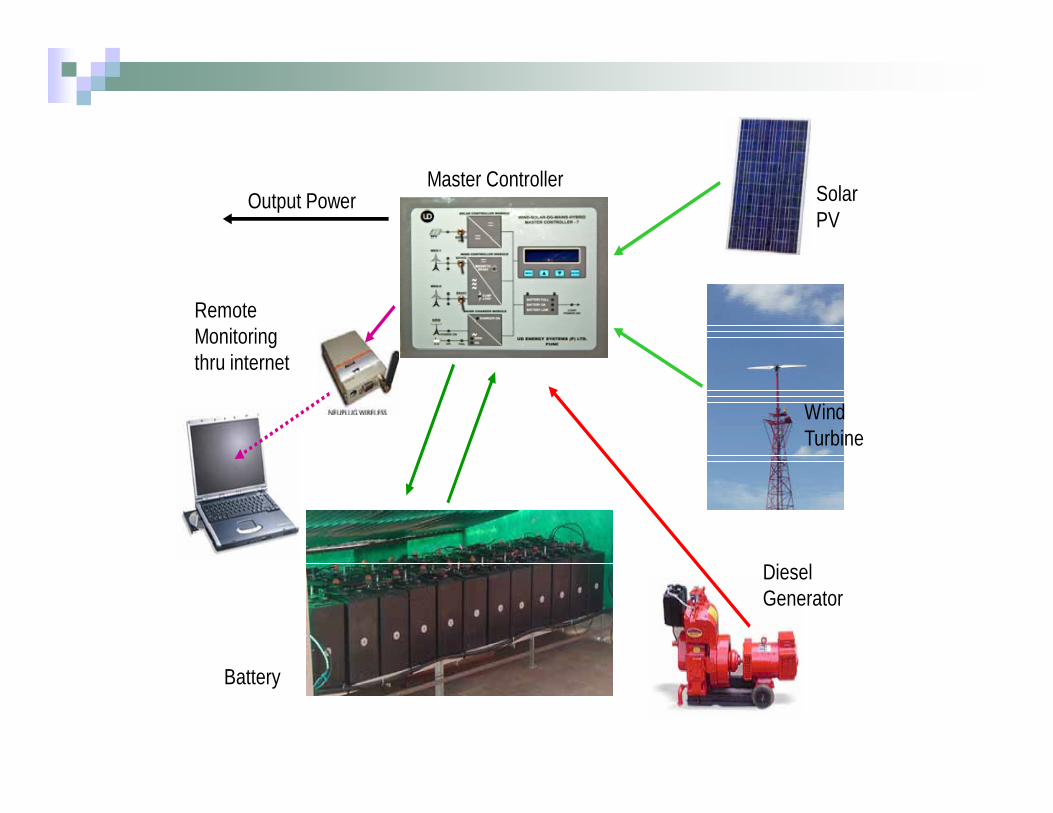
Diesel Generator
Battery
Wind Turbine
Solar PV
Master Controller
Remote Monitoring thru internet
Output Power

Option-I: 10 KWp SPV COST COMPARISON OF RUNNING THE EQUIPMENT ON DG SET &
SPV
Existing Proposed 24 Hrs. DG Operation
Load - 3 KW
4 Lt/hr - Rs. 35 /lt SPV- 10 KW
Daily DG operation : 3 Hrs
Capital Cost - 25 Lakhs
Loan @ 13.75% for 7 yrs
Costing for 7 years, 10% inflation / year
Year Diesel Cost
Diesel Cost Installment Interest
Total outflow Benefit Cumulative
( Rs.- Lakhs)
( Rs.- Lakhs)
( Rs.- Lakhs)
( Rs.- Lakhs)
( Rs.- Lakhs) Benefit
1 12.26 1.53 3.57 3.44 8.54 3.72 3.722 13.49 1.69 3.57 2.95 8.20 5.29 9.013 14.84 1.85 3.57 2.46 7.88 6.96 15.974 16.32 2.04 3.57 1.96 7.58 8.75 24.715 17.96 2.24 3.57 1.47 7.29 10.67 35.386 19.75 2.47 3.57 0.98 7.02 12.73 48.117 21.73 2.72 3.57 0.49 6.78 14.95 63.05
Pay Back Period : 4 Yrs (approx.)

Location : Shreepati Nagar(Sundar ban)
State : West Bengal
PROJECT – 1

Solar Photovoltaic Project
a. OFF Grid site.Service Providers: Reliance / BSNL / Vodafone.Average Energy Required: 1530 Units / Month
: 51 Units/day.
b. 20 KVA D.G. set running: 16 hours / day.
c. Solar array capacity: 10 KWPTotal Unit Generated during a month: 1220.60 Units.Average unit generated daily: 40.69 units/day.


BATTERY & CONTROL PANELBATTERY & CONTROL PANEL……....


B a t t e r y S t a t u s ( A
H )
D a i l y C o n s u m pt i o n ( A H )
S P V ( A H ) B a l a n c e ( A H )
D e f i c i e n cy t o b e c a t e r e d b y D G ( A H )
D G ( A m p s )
D G H r s
2 5 0 0 1 4 4 0 8 0 0 1 8 6 0 6 4 0 2 8 3 . 3 3 2 . 2 6
3 K W L o a d ‐ 1 0 K W p S P V , 2 5 0 0 A H B a t t e r y
2 5 0 0
1 4 4 0
8 0 0
1 8 6 0
6 4 0
0
5 0 0
1 0 0 0
1 5 0 0
2 0 0 0
2 5 0 0
3 0 0 0
1 2 3 4 5

S.No. Items Before After With SPV
Savings
1 20 KVA DG Set running
16 Hours/day
2.5 Hours/day
13.5 Hours/day
2. Fuel Consumption(2.75 litres/hour)
1320 litres/month
206.3 litres/month
1113.7 litres/month(Rs. 44,548/-per month)
Rs 5,34,576/-per annum
3. Carbon Emission 3405 Kg/ month
541 Kg/month
2864 Kg/month34368 Kg/annum

PROJECT - 2
Location : Shivarampura
Distt. : Tumkur
State : Karnataka.

a. Grid site.Service Providers : Airtel/BSNL/Vodafone.Average Energy Required: 2200 Units / Month.
:72 (36 + 36) Units/day
b. Grid Supply : 6 hours / day20 KVA D.G. set running : 10 hours / day.
c. Solar array capacity : 10 KWPWTG Capacity : 5.1 KWUnit Generated :1470(1110+360) /M.Average unit generated : 49 (37+12) Units/day


S.No. Items Before After With Solar-Wind Hybrid System
Savings
1. 20 KVA DG Set running
10 Hours /day 0 hours 10 Hours /day
2. Fuel Consumption(2.75 litres/hour)
825 litres/ month
0 Litres 825 Litres / month.Rs. 33,000/-per month.Rs. 3,96,000/-per annum.
3. Carbon Emission 2211Kg/month
0 26532Kg/annum
4. Grid Supply 36 Units / day 23 Units / day 13 Units /dayRs. 28,080/-per annum.

Incentives / Subsidies
Due to High CAPEX of SPV installation operators look at Incentives/subsidies from Government.
30% subsidy available on Solar off grid Solutions from MNRE .
80% accelerated depreciation in Income Tax.
We have to look at CAPEX Vs OPEX savings.

Converting solar energy in to electricity could be the answer to the mounting power problems in rural areas for powering telecom towers.
Its suitability for decentralized applications and its environment-friendlynature make it an attractive option to supplement the energy supplyfrom other sources.
If we install Solar Photovoltaic Cells / Wind turbine generator , much of the rural power needs could be met, adequately cutting down harmfulgreenhouse gases and reduction in carbon footprint.
Carbon emission targets and energy efficiency standards needs to be followed and disclosed.
Conclusion

THANK YOUTHANK YOU