Mr. G. D. Birla and Mr. Aditya Birla, our founding fathers.The Aditya Birla Group in perspective...
202
Transcript of Mr. G. D. Birla and Mr. Aditya Birla, our founding fathers.The Aditya Birla Group in perspective...


Mr. G. D. Birla and Mr. Aditya Birla, our founding fathers.
We live by their values.
Integrity, Commitment, Passion, Seamlessness and Speed

THE CHAIRMAN’S LETTER TO SHAREHOLDERS
Dear Shareholder,
The global economy is gradually
emerging from the throes of the
meltdown of 2008. While growth rates
have picked up, it will still be a while to
get back to the pre-crisis path. However,
the fundamentals of the global economy
appear to be reasonably good. The IMF
has forecasted a growth of 2.3% for the
advanced countries and 6.3% for the
emerging economies for 2010. Of all
the countries, China’s growth has been
most impressive. Its economy has
recorded a double-digit growth for
several quarters. And it continues to
surge.
India also is on a strong growth
trajectory. Our economy is slated to grow
in excess of 8%. Consumer spending is
gaining momentum. Private investment
is picking up steam globally and in India
too, the trend is encouraging. These
impact your Company’s growth and
performance.
For the financial Year 2009-10, your
Company’s performance has been
robust. Consolidated net revenues at
Rs.15,505 Crore, is up by 8% over that
of the preceding year. Consolidated net
profit at Rs.155 Crore vis-à-vis a loss of
Rs.436 Crore in the previous year, is
indeed very encouraging.

THE CHAIRMAN’S LETTER TO SHAREHOLDERS
STRATEGIC INITIATIVES TAKEN
A number of strategic initiatives have been taken by your management in the interests of its
multiple stakeholders. As these have been detailed in the ‘Management’s Discussion and Analysis’,
I will give you a helicopter view.
In the Financial Services business, I must say we have made our mark. Most of its seven verticals
namely life insurance, asset management, NBFC, private equity, broking, wealth management and
distribution, and general insurance advisory have posted an impressive growth in revenues. Combined
net profit, excluding life insurance, has more than doubled. Life Insurance business has also
reduced its net loss considerably.
The financial services business has a significant customer base and distribution reach, with about
5.5 million customers, over 1,550 branches and more than 200,000 channel partners. The sector
offers enormous growth potential.
I believe, Aditya Birla Financial Services is all set to becoming a leader and role model in the
financial services sector with a broad based and integrated business.
In the Telecom business, Idea Cellular has clocked a growth of 22% on a year-on-year basis.
This makes Idea the fastest growing major telecom operator in India for three consecutive years.
Idea’s revenues market share has risen, and it has a customer base of 67 million. More tellingly, in
a market characterised by over capacity and hyper competition, Idea, in fact, has stepped up its net
profit.
In the recently concluded 3G auction, Idea has
won 3G spectrum in 11 service areas. These
service areas cover about 80% of its existing
revenues, the highest among the major telecom
operators.
Idea’s service area specific strategy, it’s improving
capacity utilisation, its sophisticated management
processes supported by a power brand,
underscore Idea’s ability to ride out the rough
times.
In the IT-ITeS business, Aditya Birla Minacs
braved the downturn, although it faced de-growth
in the top-line as few of its global clients suffered
For the financial Year 2009-10,
your Company’s performance has
been robust. Consolidated net
revenues at Rs. 15,505 Crore,
is up by 8% over that of the
preceding year. Consolidated net
profit at Rs. 155 Crore vis-à-vis a
loss of Rs. 436 Crore in the previous
year, is indeed very encouraging.

THE CHAIRMAN’S LETTER TO SHAREHOLDERS
the meltdown. Regardless, it remained cash profit positive round the year, driven by consolidation
of sites. With a bench strength in excess of 14,500 employees, Minacs is gaining momentum.
It has already garnered a strong order book of about USD 600 million.
To strengthen its capabilities, we have made two acquisitions in this domain. The acquisition of
Compass BPO, a leading pure-play, end-to-end finance and accounting provider strengthens
Minacs’ F&A vertical.
Close on its heels, we acquired the US based Bureau of Collection Recovery. A leading accounts
receivables management company catering to the credit industry, it will invigorate Minacs’ core
customer lifecycle services.
These acquisitions will further fuel Minacs’ growth by enhancing its capability of delivering end-to-
end solutions to its clients.
Moving on to the Fashion & Lifestyle business, what is striking is that the business has undergone
a major transformation. The business has become EBITDA positive. The restructuring of the garments
business and its consolidation will pave the way for higher growth in revenues and earnings as we
go forward.
At the macro level, I am happy to inform you that the Group’s Carbon Black business, which is
the 4th largest in the world, has reached significant milestones. The recent commissioning of the
Greenfield capacity of your Company at Patalganga in India and Brownfield capacity of Thai
Carbon Black in Thailand, takes the Group’s business closer to its vision of becoming a 1 million
tonnes business by 2012. With these new manufacturing facilities on stream, the Group’s capacity
has reached to about 900,000 tonnes.
Your Company has plans to augment its carbon black capacity by additional 85,000 tonnes each
at Patalganga as well as in the Southern India in the next phase of expansion. Your Company’s
Carbon Black business is slated for higher growth.
Your Company’s team is working closely with the Aditya Birla Science & Technology Centre for the
development of innovative products, with the objective of meeting the changing expectations of
end customers.
The Agri-business achieved its highest ever urea sales volumes at about 1.1 million tonnes.
However, revenues have been lower, with subsidies coming off peak levels in line with the raw
material prices reached the year before. EBITDA was lower to the extent of higher subsidy arrears
and IPP gain accrued during the previous year. Going forward the accent is on customised
fertilisers. Hence the business is evaluating the feasibility of setting up a plant that will specialise in

THE CHAIRMAN’S LETTER TO SHAREHOLDERS
manufacturing customised fertilisers. In my view,
the fertilisers sector has great growth prospects.
In the Rayon business, your Company is the
second largest manufacturer of VFY in India. The
business has posted its highest ever profitability.
To take the business to a far higher level, we are
looking at acquiring best in class technology for
premium yarn, catering to a niche segment. My
sense is that this sector will witness a rather
modest rate of growth.
Your Company, as you may be aware, is among
the top 4 global leaders in the Insulators
business. The business has achieved its highest
ever sales volumes led by capacity expansion
and improved yield. Its product range has been
enhanced to cater to the 765 KV and 1,200 KV
lines. The team is also developing a product portfolio for the high voltage direct current
application. In India, the augmentation of the power sector, as we know, is integral to the GDP
growth, which augurs well for the Insulators business.
To our teams
I very warmly want to thank all of our colleagues in Aditya Birla Nuvo for their immense contribution
to your Company’s praiseworthy performance. I look forward to their continued commitment to
your Company’s reaching greater heights and enhancing shareholder value.
The Aditya Birla Group in perspective
Today, we are a multicultural, multinational, multidimensional Group anchored by over 130,000
employees, belonging to 30 nationalities, across 6 continents. Our Group turnover is a little over
USD 29 billion. Our leadership across several levels is fleet of foot, flexible enough to adapt to the
ever changing environment, and ambitious enough to dream audaciously.
Our goal is to become a USD 65 billion Group by 2015 from USD 30 billion today. We expect
your Company to contribute significantly to this growth and earnings.
Today, we are a multicultural,
multinational, multidimensional
Group anchored by over
130,000 employees, belonging to
30 nationalities, across 6 continents.
Our Group turnover is a little over
USD 29 billion. Our leadership
across several levels is fleet of foot,
flexible enough to adapt
to the ever changing environment,
and ambitious enough to
dream audaciously.

THE CHAIRMAN’S LETTER TO SHAREHOLDERS
To attain this bold and ambitious vision, we have launched a series of people centered strategies.
I believe, the best of goals can only fruition if we have the best of people and harness people
potential, irrespective of positions.
A WORLD OF OPPORTUNITIES
As the Group continues to expand globally, exploring and seizing opportunities, we have accelerated
the pace of offerings to our intellectual capital. Our endeavour is to provide them with unparalleled
opportunities, dynamic challenges, a rewarding professional career and a sense of fulfillment on
the personal front. This is a priority area. To take this forward, we launched our employee value
proposition. Simply put, it is “a world of opportunities”. It entails the reinforcement of a four
pronged approach.
Firstly, offering exciting career prospects that give employees a leeway to chart their own growth
trajectory.
Secondly, intensifying learning processes that
hone existing skills. Transcending it, we have taken
the learning to a higher stage where talented
employees are able to convert knowledge into
action through exposure to the best global minds.
For example, this year at Gyanodaya, our
benchmarkable Institute of Management Learning,
more than 500 colleagues at senior levels
participated in specially designed, intellectually
stimulating, innovative focused programmes.
These related to globalisation, leadership,
innovation and getting far beyond the mind of
the customer. These were conducted in
collaboration with the best in class faculty from International Business Schools and consulting
organisations. Among these feature, The Ross School of Business, The Duke University, UCLA (all
from USA), ISB (Hyderabad), The Hay Group and Mercer Consulting.
It might interest you to learn that this year as well over a 1,000 executives enlisted for different
learning sessions. Gyanodaya’s virtual campuses reached out to more than 13,500 learners
through its e-learning courses and webinars.
I believe, our Employee Value
Proposition also helps to
create an enabling environment
that sets people up for success,
enthuses in them the drive to excel,
achieve and push back the
frontiers of excellence.

THE CHAIRMAN’S LETTER TO SHAREHOLDERS
Thirdly, as part of our concerted efforts towards a sharp organisational focus and alignment in the
talent management processes, across the businesses, we put in place critical differentiators. Besides
linking rewards to performance, special performance incentives, international assignments, and
Group-wide recognition programmes have been set in motion.
Fourthly, promoting enriched living by encouraging talent to look beyond just professional
enhancement and to work toward building a wholesome, balanced life.
I believe, our Employee Value Proposition also helps to create an enabling environment that sets
people up for success, enthuses in them the drive to excel, achieve and push back the frontiers of
excellence.
GREAT PLACE FOR LEADERS
Finally, I am delighted to share with you that in a comprehensive global study of organisational
leadership across the world, conducted by The Hewitt Associates, in partnership with The RBL
Group and Fortune Magazine (2009) on “Top Companies for Leaders to engage in”, our Group,
was adjudged “The 6th great place for leaders in the Asia pacific Region”. That of 177 companies
who participated in this study, we should have been chosen is indeed a great achievement. Their
critical assessment criteria included strength and depth of leadership practices, culture, examples
of developing world class leaders, business performance and company reputation. On all counts,
we are on course.
Yours sincerely,
Kumar Mangalam Birla

A landscape lit by millions of smilesA business is known not by its balance sheet alone, but also by the smiles it brings to
the lives it touches – be it the lives of customers, investors, employees or business
associates. It is a world of people. It keeps growing, as the business keeps growing.
Aditya Birla Nuvo has many such businesses. And all are in the common business of
making people happy. At all touchpoints. Providing them with superior quality, greater
value and uncompromising satisfaction.
At Aditya Birla Nuvo, it has always been a continuous endeavour to reach out to people
and make a difference to their lives. Helping them look up to a better today, and
tomorrow. Lighting up the entire landscape. With smile, after smile, after smile...
Aditya Birla Nuvo. Touching lives of more than 70 million Indians. Anchored by more
than 50,000 employees. Nationwide presence through 1 million touchpoints / channel
partners. Trusted by more than 1.5 lacs shareholders.

Secured future is smiling
A father is happy to have secured the future of his daughter by taking
a dependable protection cover from Birla Sun Life Insurance besides
trusting Birla Sun Life Asset Management for creating wealth from
his hard-earned savings.
Aditya Birla Financial Services, a business that is a part of Aditya Birla
Nuvo, has a significant presence across various verticals, including life
insurance, asset management, private equity, non-banking financial
services, broking, wealth management and general insurance
advisory. It is among top five private life insurers and top five asset
management companies in India besides being one of the leading
players in other verticals.
Financial Services

Telecom connectivity is smiling
A hardworking fisherman is overwhelmed as he gets a big timely
order on his cell phone, networked by Idea Cellular.
Idea Cellular, the telecom venture of Aditya Birla Nuvo, has redefined
telephony standards through continuous innovative plans and value
added services that keep its customers well connected at all times.
Idea is third largest cellular operator in India in terms of revenue
market share.
Telecom

Business solutions are smiling
A retired pensioner is delighted to have his queries sorted out over
the phone as his case is being looked into by efficient executives of
Aditya Birla Minacs, the technology support business of Aditya Birla
Nuvo.
Aditya Birla Minacs has been partnering global corporations in
banking, financial services, insurance, telecom, technology
infrastructure, media, entertainment, and manufacturing sectors.
It leverages its process, technology and domain expertise to deliver
superior business value to clients with its seamless customer lifecycle
and enterprise services. It is among top ten Indian BPO companies by
revenue size.
IT-ITeS

Trendy lifestyle is smiling
A high-fashion model glows with panache as she reveals her stylish
wardrobe of readymades from Madura Garments, a fashion & lifestyle
business that is a part of Aditya Birla Nuvo.
Madura Garments has revolutionised the readymade apparel market
with inspiring designs through ‘Collective’ - its high-end international
luxury brands store, along with premium brands like ‘Louis Philippe’,
‘Van Heusen’, ‘Allen Solly’ and mass brand ‘Peter England’. It is the
largest premium branded apparel player in India.
Fashion & Lifestyle

Wheels of progress are smiling
A dedicated transporter marvels at the longer tyre life that, he
believes, come from the quality of tyres, reinforced by the Carbon
Black made by Hi-Tech Carbon, a business that is a part of Aditya Birla
Nuvo.
The Carbon Black made by Hi-Tech Carbon is used not just in the tyre
industry but also in the non-tyre sector, notably as reinforcing filler
in rubber products and in the printing inks and paints industry. The
second largest Carbon Black manufacturer in India, Hi-Tech Carbon
aspires to be the most respected, green, globally-advanced fillers
business.
Carbon Black

Fertile fields are smiling
An enthusiastic farmer shows off his prolific produce of crops made
possible with the help of ‘Birla Shaktiman’ urea produced by Indo
Gulf Fertilisers, a business that is a part of Aditya Birla Nuvo.
Indo Gulf Fertilisers manufactures and markets urea, agricultural
seeds and agrochemicals in an effort to provide complete agri
solutions to farmers. Birla Shaktiman - its flagship brand - has gone
on to enjoy leadership position in the Indo-Gangetic plains.
Agri Business

Style statements are smiling
A bride glows with the joy of looking her best in the colourful attire
made out of ‘Ray One’, a viscose filament yarn manufactured by
Indian Rayon, a business that is a part of Aditya Birla Nuvo.
Indian Rayon is the second-largest producer and the largest exporter
of viscose filament yarn in India. The yarn captures a wide array of
colours, ranging from natural whites to vibrant shades, through
medium tones to help make style statements.
Rayon

Insulator reliability is smiling
A persevering student is glad to be able to study for her exams with
the support of illumination, in the late hours of night, thanks to the
power transmission helped by superior-quality porcelain insulators
manufactured by Aditya Birla Insulators, a business that is a part of
Aditya Birla Nuvo.
The extreme reliability of an extensive product range made by
Aditya Birla Insulators comes from world-class technology. This,
along with cost competitiveness, has enabled the business to
become India’s largest and the world’s fourth largest manufacturer
of porcelain insulators.
Insulators

Linen comfort is smiling
A renowned fashion designer beams confidently as he flaunts his
varied range of couture created from ‘Linen Club’ fabric –
high-quality linen made by Jaya Shree Textiles, a business that is a
part of Aditya Birla Nuvo.
Jaya Shree Textiles, India’s largest linen yarn and fabric producer,
epitomises a successful journey of linen from a commodity product
to a lifestyle icon. It has the only integrated linen factory in the
country with state-of-the-art facilities from Switzerland and Italy.
It has revolutionised the Indian textile market by popularising linen
in India across a wide customer base.
Textiles

ADITYA BIRLA NUVO LIMITED
BOARD OF DIRECTORS
Mr. Kumar Mangalam Birla, Chairman
Mrs. Rajashree Birla
Mr. B. L. Shah
Mr. P. Murari
Mr. B. R. Gupta
Ms. Tarjani Vakil
Mr. S. C. Bhargava
Mr. G. P. Gupta
Dr. Rakesh Jain
Mr. Pranab Barua
MANAGING DIRECTOR
Dr. Rakesh Jain
CHIEF FINANCIAL OFFICER
Mr. Sushil Agarwal
DY. CHIEF FINANCIAL OFFICER
Mr. Manoj Kedia
COMPANY SECRETARY
Mr. Devendra Bhandari
AUDITORS
Khimji Kunverji & Co., Chartered Accountants
S.R. Batliboi & Co., Chartered Accountants
OTHER BRANCH AUDITORS
K. S. Aiyar & Co., Chartered Accountants
Deloitte Haskins & Sells, Chartered Accountants
SOLICITORS
Mulla & Mulla and Craigie, Blunt & Caroe,
Mumbai
BUSINESS EXECUTIVES
FINANCIAL SERVICES
Mr. Ajay Srinivasan Chief Executive Officer
Mr. Pankaj Razdan Dy. Chief Executive Officer
TELECOM
Mr. Sanjeev Aga Managing Director, Idea Cellular Ltd.
IT-ITeS*
Mr. Deepak Patel Chief Executive Officer
FASHION & LIFESTYLE AND TEXTILES
Mr. Pranab Barua Business Director
Mr. Ashish Dikshit President - Madura Garments
Mr. S. Krishnamurthy President - Jaya Shree Textiles
CARBON BLACK
Dr. Santrupt Misra Business Head
Mr. S. S. Rathi President
AGRI-BUSINESS*
Mr. S. K. Jain Sr. President
RAYON
Mr. Lalit Naik Business Head
Mr. Rahul Mohnot President
INSULATORS*
Mr. Jayant Dua President & CEO
* Dr. Rakesh Jain Business Director

Aditya Birla Nuvo : An Overview ............................................................................... 1
Financial Highlights................................................................................................... 3
Management’s Discussion and Analysis ..................................................................... 6
Corporate Governance Report ................................................................................... 35
Sustainable Development : Inclusive Growth .............................................................. 47
Sustainable Development : Environment Responsibility ............................................. 51
Shareholders’ Information ......................................................................................... 53
Directors’ Report ....................................................................................................... 62
Auditors’ Report ........................................................................................................ 77
Standalone Financial Statements ................................................................................ 82
Consolidated Financial Statements ............................................................................. 131
Statement Relating to Subsidiary Companies .............................................................. 170
CONTENTS

[1]
Financial
Services
Telecom3
#
(25.38%)
IT-ITeS2
(88.28%)
Fashion &
Lifestyle1
Manufacturing
Asset Management3
(50%)*
NBFC2
Private Equity2
Broking (75%)2
Wealth Management2
Insurance Advisory2
Carbon Black1
Agri-Business1
Rayon1
Insulators1
Textiles1
1
Represent Divisions 2
Represent Subsidiaries 3
Represent Joint Ventures *
JV with Sun Life Financial, Canada #Listed, Aditya Birla Group holds 46.99%
Note: Percentage figures indicated above represent ABNL’s shareholding in its subsidiaries / JV’s
Our Vision
To become a premium conglomerate with market leadership across businesses
delivering superior value to shareholders on a sustained basis
TRANSFORMATION TO A USD 3.5 BILLION CONGLOMERATE
Manufacturing45%
Manufacturing24%
Fashion &Lifestyle
13%
Fashion & Lifestyle8%
IT-ITeS6%
IT-ITeS10%
Telecom8%
Telecom21%
Financial Services 28%
(Life Insurance 26%)
Financial Services 37%
(Life Insurance 34%)
CAGR35%
Rs. 4,665 Crore in 2005-06
Rs. 15,505 Crore in 2009-10
Note: 1 USD = Rs. 45; 1 billion = 100 Crore
A UNIQUE CONGLOMERATE GUIDED BY VISION
Life Insurance3
(74%)*
Consolidated Net Revenues Mix
ADITYA BIRLA NUVO

[2]
2009-102008-092007-082006-072005-06
CAGR (’06-’10) 19%508
777677
146
1,024
CONSOLIDATED FINANCIAL SNAPSHOT
Net Revenues
(Rs. Crore)
EBITDA
(Rs. Crore)
EBDT
(Rs. Crore)
GROWTH SUPPORTED BY STRONG STANDALONE BALANCE SHEET
Standalone Capital Employed
(Rs. Crore)
Standalone Ratios
2009-102008-092007-082006-072005-06
CAGR (’06-’10) 35%
4,665
8,040
11,374
14,31515,505
2009-102008-092007-082006-072005-06
CAGR (’06-’10) 28%
625
1,163 1,153
867
1,686
Key Achievements in 2009-10
• Consolidated Net Revenues crossed Rs. 15,000 Crore
• Achieved highest ever EBITDA and Cash Profit
• More than 60% of standalone capital employed is deployed in long term investments.
• Leveraging at comfortable level supported by strong cash flows generated by manufacturing businesses.
• Equity infusion of Rs. 1,000 Crore through preferential allotment of 18.5 million warrants to promoters will
further strengthen balance sheet. Already received Rs. 575 Crore in 2009-10 as 25% application money and
on conversion of 8 million warrants.
2009-102008-092007-082006-072005-06
2,524
1,415
3,4783,910
4,982 5,436
2,6533,058
3,819 3,040Fixed Assets &
Working Capital
Long Term
Investments
0
2
4
6
8
Net Debt / EBITDA (RHS)
2009-102008-092007-082006-072005-06
0.0
0.2
0.4
0.6
0.8
1.0
Net Debt / Equity (LHS)
2.8
3.9 3.8
5.9
4.1
0.7
0.9
0.6
0.8
0.6
ADITYA BIRLA NUVO

FIN
AN
CIA
L H
IGH
LIG
HTS
[3]
FINANCIAL HIGHLIGHTS - CONSOLIDATED
Profit and Loss Account 2009-10 2008-09 2007-08 2006-07 2005-06
USD Million1 Rs. Crore Rs. Crore Rs. Crore Rs. Crore Rs. Crore
Life Insurance (Premium Income) 1,176.2 5,292.7 4,414.3 3,223.1 1,735.2 1,233.8
Other Financial Services (Merged w.e.f. 1st September 2005) 91.3 410.9 249.6 197.5 137.5 71.0
Telecom 740.2 3,330.8 2,891.8 2,135.6 1,421.8 388.3
IT-ITeS 340.1 1,530.3 1,777.2 1,677.5 1,109.1 249.1
Fashion & Lifestyle (Branded apparels & accessories) 277.9 1,250.6 1,115.8 1,025.8 830.4 620.6
Carbon Black 258.0 1,160.9 1,095.6 863.8 738.9 564.2
Agri-business (Merged w.e.f. 1st September 2005) 227.0 1,021.6 1,249.8 787.5 785.4 379.4
Rayon Yarn (Including Caustic Soda & Allied Chemicals) 119.5 537.7 537.1 476.0 441.5 385.6
Insulators 95.2 428.4 424.8 398.9 225.3 249.2
Textiles (Spun Yarn & Fabrics) 128.1 576.5 573.2 600.3 625.0 527.7
Others / Inter-Segment Elimination (7.8) (35.2) (13.8) (12.2) (10.0) (3.5)
Net Revenues (Including Other Operating Income) 3,445.6 15,505.2 14,315.5 11,373.8 8,040.1 4,665.4
Add : Investment Income /(Loss) on Policyholders’ Fund 889.6 4,003.2 (670.7) 487.3 194.9 325.5
Net Income From Operations 4,335.2 19,508.3 13,644.8 11,861.1 8,235.0 4,990.8
EBITDA 374.7 1,686.2 867.4 1,152.9 1,163.3 624.9
Less: Depreciation and Amortisation 192.6 866.5 695.6 524.9 422.8 225.0
EBIT 182.2 819.7 171.8 628.0 740.5 400.0
Less: Interest and Finance Charges 147.1 662.1 721.0 476.0 386.5 117.1
Earnings before Tax 35.0 157.6 (549.3) 152.0 354.0 282.9
Less : Provision for Taxation (Net) 25.3 114.0 81.1 125.9 111.9 94.1
Net Profit/(Loss) before Minority Interest 9.7 43.6 (630.3) 26.2 242.1 188.8
Less : Minority Interest & share in (Profit)/Loss of Associates (24.7) (111.0) (194.6) (124.6) (38.8) (15.3)
Net Profit/(Loss) 34.3 154.6 (435.7) 150.8 280.9 204.0
Balance Sheet 2009-10 2008-09 2007-08 2006-07 2005-06
USD Million1 Rs. Crore Rs. Crore Rs. Crore Rs. Crore Rs. Crore
Net Fixed Assets 1,553.0 6,988.4 6,672.0 5,447.8 3,777.6 2,157.6
Goodwill On Consolidation 642.7 2,892.3 3,422.6 2,571.0 2,594.9 961.3
Life Insurance (Shareholders’ & Policyholders’) Investments 3,584.4 16,129.9 9,168.4 6,892.7 4,020.0 2,554.8
Other Investments 183.7 826.6 1,914.0 427.4 523.3 362.1
Total Investments 3,768.1 16,956.5 11,082.4 7,320.2 4,543.4 2,916.9
Net Current Assets 478.8 2,154.5 2,576.9 2,252.8 1,750.2 1,017.6
Capital Employed 6,442.6 28,991.7 23,753.9 17,591.9 12,666.1 7,053.4
Net Worth 1,216.6 5,474.8 5,742.3 4,032.9 3,119.6 2,098.5
Life Insurance Policyholders’ Fund2
3,478.2 15,651.9 8,725.8 6,510.6 3,762.0 2,378.4
Total Loan Funds 1,653.0 7,438.6 8,886.8 6,647.9 5,461.6 2,364.6
Minority Interest 41.3 185.8 179.2 174.4 143.3 43.2
Deferred Tax Liability (Net) 53.5 240.6 219.8 226.2 179.6 168.7
Capital Employed 6,442.6 28,991.7 23,753.9 17,591.9 12,666.1 7,053.4
Ratios and Statistics Unit 2009-10 2008-09 2007-08 2006-07 2005-06
EBITDA Margin (EBITDA / Net Revenues) % 10.9 6.1 10.1 14.5 13.4
Net Margin (Net Profit / Net Revenues) % 1.0 (3.0) 1.3 3.5 4.4
Net Debt to Equity Ratio (Net Debt3/Net Worth) x 1.0 0.8 1.2 1.2 0.8
Net Debt to EBITDA Ratio (Net Debt3/EBITDA) x 3.1 5.6 4.1 3.2 2.6
Interest Cover (EBITDA/Interest expenses) x 2.5 1.2 2.4 3.0 5.3
ROACE (EBIT/Average Capital Employed4) % 5.8 1.3 6.3 10.9 11.9
ROAE (Net Profit/Average Net Worth) % 2.8 (8.9) 4.2 10.8 12.7
EPS (Weighted Average) Rs. 15.4 (34 Cents) (46.3) 16.0 32.0 26.1
Book Value Per Share Rs. 531.5 (USD 11.8) 604.3 424.5 334.3 251.3
No. of Equity Shareholders Numbers 158,163 155,497 155,028 164,603 89,287
Closing Price as on 31st March (NSE) Rs. 906.3 (USD 20.1) 445.0 1,396.2 1,070.9 748.0
Market Capitalisation (NSE) Rs. Crore 9,336 (USD Mn 2075) 4,227 13,265 9,992 6,246
Note 1: 1 USD = Rs. 45; 10 Million = 1 Crore Note
2: Including Fund for future appropriation
Note 3: Total Loan Funds less NBFC borrowings less Cash Surplus Note
4: Excluding Life Insurance Policyholders’ Fund

FIN
AN
CIA
L H
IGH
LIG
HTS
[4]
FINANCIAL HIGHLIGHTS - STANDALONE
Unit of
Measurement 2009-10 2008-09 2007-08 2006-07 2005-06
Production (Quantity)
Carbon Black MT 233,370 202,076 215,103 182,668 175,080
Urea (Merged w.e.f. 1st September, 2005) MT 1,097,705 1,069,691 880,991 1,028,064 575,646
Viscose Filament Rayon Yarn MT 16,759 16,625 17,000 17,669 17,233
Caustic Soda MT 88,250 78,574 74,468 67,663 57,051
Spun Yarns MT 9,610 9,185 11,261 17,720 19,190
Fabrics ‘ 000 Mtrs. 4,375 3,646 4,792 5,088 4,646
Insulators1
MT 36,063 32,904 32,921 — —
Sales (Quantity)
Branded Apparels ‘ 000 Nos. 12,421 11,754 10,966 10,709 11,104
Carbon Black MT 230,195 203,827 214,617 180,893 175,944
Urea MT 1,105,715 1,072,891 870,305 1,043,565 563,914
Viscose Filament Rayon Yarn MT 16,616 16,792 17,923 17,039 17,380
Caustic Soda MT 88,897 77,590 74,441 67,226 56,954
Spun Yarns MT 9,474 9,271 11,349 18,357 18,866
Fabrics ‘ 000 Mtrs. 4,194 4,049 4,710 4,645 4,418
Insulators (Domestic Sales in 2005-06 and 2006-07)1
MT 37,050 32,561 32,304 7,776 16,245
Note 1 : Insulators manufacturing unit earlier demerged w.e.f. 1st August, 2002, merged with Aditya Birla Nuvo Limited w.e.f. 1st April, 2007.
Profit and Loss Account 2009-10 2008-09 2007-08 2006-07 2005-06
USD Million2 Rs. Crore Rs. Crore Rs. Crore Rs. Crore Rs. Crore
Net Income from Operations 1,072.8 4,827.5 4,786.2 3,953.1 3,427.4 2,642.0
Less: Operating Expenses 903.1 4,063.8 4,232.5 3,331.9 2,862.6 2,226.1
Operating Profit 169.7 763.7 553.7 621.2 564.8 415.9
Add: Other Income 15.7 70.8 65.3 38.9 62.0 36.2
EBITDA 185.4 834.5 618.9 660.1 626.8 452.1
Less: Interest and Finance Charges 74.2 334.1 290.6 204.5 195.4 68.5
Earnings before Depreciation and Tax 111.2 500.4 328.3 455.7 431.4 383.6
Less: Depreciation and Amortisation 40.0 180.1 166.0 141.1 120.3 111.8
Earnings before Tax 71.2 320.3 162.3 314.6 311.1 271.7
Less: Provision for Taxation (Net) 8.2 36.9 24.9 71.5 86.1 84.8
Net Profit 63.0 283.4 137.4 243.1 225.0 186.9
Less: Dividend (Including Corporate Tax on Dividend) 13.2 59.5 42.4 63.9 58.5 47.6
Retained Profit 49.8 223.9 95.0 179.2 166.5 139.3
Note 2: 1 USD = Rs. 45; 10 Million = 1 Crore

FIN
AN
CIA
L H
IGH
LIG
HTS
[5]
FINANCIAL HIGHLIGHTS - STANDALONE
Balance Sheet 2009-10 2008-09 2007-08 2006-07 2005-06
USD Million3 Rs. Crore Rs. Crore Rs. Crore Rs. Crore Rs. Crore
Net Fixed Assets 403.4 1,815.3 1,605.0 1,501.6 1,308.1 1,135.5
Long term Investments 1,208.0 5,435.9 4,982.4 3,909.8 3,477.6 1,415.3
Current Investments — — 730.0 97.5 371.8 260.5
Total Investments 1,208.0 5,435.9 5,712.4 4,007.3 3,849.4 1,675.8
Net Current Assets 272.1 1,224.5 1,483.7 1,458.5 972.9 1,127.6
Capital Employed 1,883.5 8,475.6 8,801.1 6,967.5 6,130.5 3,938.9
Share Capital1
22.9 103.1 95.0 95.0 93.3 83.5
Share Warrants2
31.6 142.1 377.4 377.4 — —
Reserves and Surplus 981.4 4,416.3 3,649.2 3,551.3 3,031.2 2,124.1
Net Worth 1,035.9 4,661.5 4,121.7 4,023.7 3,124.5 2,207.6
Long Term Loans 599.9 2,699.4 2,651.2 1,841.2 1,869.2 972.5
Short Term Loans 208.1 936.3 1,848.0 902.2 962.7 591.1
Total Loan Funds 807.9 3,635.6 4,499.2 2,743.4 2,831.8 1,563.6
Deferred Tax Liability 39.7 178.5 180.2 200.3 174.1 167.7
Capital Employed 1,883.5 8,475.6 8,801.1 6,967.5 6,130.5 3,938.9
Note 1 : Capital raised through (a) conversion of 8 million warrants in October 2009 out of 18.5 million warrants issued to promoters in May
2009; (b) conversion of 1.7 million warrants in March 2008 out of 20.5 million warrants issued to promoters in February 2008 and (c) rights issue
in February 2007.
Note 2 : Represents (a) 25% application money received in 2009-10 on remaining 10.5 million warrants and (b) 10% application money in
2008-09 received on remaining 18.8 million warrants.
Ratios and Statistics Unit 2009-10 2008-09 2007-08 2006-07 2005-06
Operating Margin % 15.8 11.6 15.7 16.5 15.7
Net Profit Margin % 5.9 2.9 6.1 6.6 7.1
Interest Cover (EBITDA/Interest Expenses) x 2.5 2.1 3.2 3.2 6.6
ROACE (EBIT/Average Capital Employed) % 7.6 5.7 7.9 10.1 11.5
ROAE (Net Profit/Average Net Worth) % 6.5 3.4 6.8 8.4 10.5
Current Ratio x 2.2 2.9 3.1 3.1 3.3
Total Debt to Equity Ratio (Total Debt/Net Worth) x 0.8 1.1 0.7 0.9 0.7
Net Debt to Equity Ratio (Net Debt4/Net Worth) x 0.7 0.9 0.6 0.8 0.6
Net Debt to EBITDA Ratio (Net Debt4/EBITDA) x 4.1 5.9 3.8 3.9 2.8
Dividend Per Share Rs. 5.0 (11 Cents) 4.0 5.8 5.5 5.0
Dividend Including Tax (as % to Net Profit) % 21.0 30.9 26.3 26.0 25.5
EPS (Weighted Average) Rs. 28.8 (64 Cents) 14.5 26.1 25.6 24.5
Cash EPS (Weighted Average) Rs. 46.5 (USD 1) 29.7 43.9 41.0 38.2
Book Value Per Share Rs. 452.5 (USD 10.1) 433.8 423.5 334.9 264.4
Exports (FOB) Rs. Crore 606.1 (USD Mn 135) 636.2 624.3 482.6 460.1
Capital Expenditure (Net) Rs. Crore 256.3 (USD Mn 57) 268.8 224.8 293.9 197.8
Note 3 : 1 USD = Rs. 45 ; 10 Million = 1 Crore Note
4 : Total Debt Less Cash Surplus

MANAGEMENT’S DISCUSSION AND ANALYSIS
[6]
MA
NA
GEM
EN
T’S D
ISC
USSIO
N A
ND
A
NA
LYSIS
Indian Economy: Momentum Continues
India is the fourth largest economy in the world
by gross domestic product (“GDP”) at
purchasing power parity. Largely domestically
driven due to lower dependence on exports,
India enjoys one of the highest GDP growth
rates in the world. Even in the previous financial
year 2008-09, which was marked with the
advent of global economic slowdown, India’s
GDP managed to grow at 6.7%. In the financial
year 2009-10, the Indian economy marched
on the path of economic turnaround propelled
by Government stimulus and robust domestic
demand. Consumer spending is bouncing back
after being impacted by global slowdown during
the previous financial year. However, weak
monsoon impacted the growth of agricultural
sector. India’s GDP grew by 7.4% in 2009-10.
The Confederation of Indian Industry (“CII”) has
projected the Indian economy to expand by up
to 8.5% in 2010-11. The CII is expecting a
recovery in agriculture sector leading to upside
in the GDP growth. It also expects growth in the
industry and services sectors to remain strong
led by capacity expansion to tap rising demand.
The most recent industry performance indicators
also signify a positive outlook for India. The
Index of Industrial Production (“IIP”) grew by
10.1% during April 2009 to February 2010
compared to 2.8% in the previous financial year.
(Source: Ministry of Statistics and Programme
Implementation, www.mospi.gov.in). Net inflows
from foreign institutional investors aggregated
over USD 30 billion in 2009-10 compared to
net outflows of USD 9.8 billion in the preceding
financial year, reflecting improved investor
confidence in the Indian economy [Source:
Securities and Exchange Board of India (“SEBI”),
www.sebi.gov.in]. Private consumption and
investment demand are expected to be the major
growth drivers ahead. To fuel this growth, a
sum of over USD 9 billion was raised through
qualified institutional placements and over USD
5 billion through initial public offerings
in 2009-10.
Having said this, inflation remains a big concern.
Wholesale Price Index for March 2010 was 9.9%
(year on year) compared to 1.2% in March
2009. The nature of inflation is shifting from a
supply side phenomenon to a demand-driven
one. In the recent credit policy, RBI has increased
key rates with a focus on containing inflation.
Moreover, though the Indian economic growth
is largely driven by domestic consumption
revival, India is not decoupled with the global
economy. Hence inflation, rise in interest rates
and global economic cues will be key factors to
watch going forward.
India: Huge investment opportunities
across the sectors
Over the years, India has witnessed a robust
wholesome economic growth and going forward
too it is all set to continue the trend. This growth
has been and will be pushed by four major
growth drivers viz., (a) Savings, (b) Consumption,
(c) Infrastructure Development and (d) Exports.
0%
4%
8%
12%
2010-11E2009-102008-092007-08
GDP Growth (%)
-10.0%
-5.0%
0.0%
5.0%
10.0%
Ru
ssia
Jap
an
UK
Ho
ng
Ko
ng
US
A
Bra
zil
S K
ore
a
Ind
on
esi
a
Ind
ia
Ch
ina
World : Real GDP growth rates - 2009

MANAGEMENT’S DISCUSSION AND ANALYSIS
[7]
MA
NA
GEM
EN
T’S D
ISC
USSIO
N A
ND
A
NA
LYSIS
Savings led Consumption ledInfrastructure
Exports led
Development led
High rate of savings Rising income High rate of Rising outsourcing
levels capital formation trend
Growth Lower penetration of A large young Steady economic Highly skilled
Driversfinancial services population reforms regime human capital
Growing awareness Burgeoning Investor friendly Low cost destination
for financial planning middle class policies, Increasing
FII & FDI flow
Key sectorsFinancial Services
Retail, Automobiles Telecom, Power,
IT-ITeSto benefit Fashion & Lifestyle Roads, Agriculture
Aditya Birla Nuvo : A large eco-system present across a wide spectrum of Indian Economy
Aditya Birla Nuvo is a USD 3.5 billion
conglomerate with leadership across its
businesses. Its presence in the Financial Services,
Telecom, IT-ITeS, Fashion & Lifestyle and
India’s Sectoral GDP
Agriculture &Industry
43%
Services57%
Telecom
FinancialServices
Manufacturing
Fashion & Lifestyle IT-ITeS
0
400
800
20
09
-10
20
07
-08
20
05
-06
20
03
-04
20
01
-02 0
15
30
45
60
Jap
an
UK
US
A
Ch
ina
Ind
ia
25
35 37 4045
A Young Population(Median Age - 2010)
Deriving
synergies from a
large
eco-system
Touching lives of more than 70
million Indians
Anchored by more than 50,000
employees
Nationwide presence through 1
million touch points / channel
partners
Trusted by more than 1.5 lacs
shareholders
Manufacturing businesses, makes it a large
eco-system which is well positioned to capitalise
on growth opportunities available across the
wide spectrum of Indian economy.

MANAGEMENT’S DISCUSSION AND ANALYSIS
[8]
MA
NA
GEM
EN
T’S D
ISC
USSIO
N A
ND
A
NA
LYSIS
In line with its vision ‘to become a premium
conglomerate with market leadership across
businesses delivering superior value to
shareholders on a sustained basis’, Aditya
Birla Nuvo, continued to pursue distinct strategic
objectives across its businesses to fortify their
presence and build a strong foundation for
future growth. The business-wise strategic
objectives and resulting key achievements are
stated as under:
• Financial Services – Be a leader and
role model with a broad based and
integrated business:
o With the successful launch of private
equity fund, Aditya Birla Financial
Services (“ABFS”) has built a prominent
presence across a wide spectrum of the
financial services space.
o Combined Assets under Management
(“AUM”) of ABFS grew by 42% to
Rs. 82,140 Crore (~USD 18 billion1
)
and combined revenues2
grew by 23%
to Rs. 5,850 Crore (~USD 1.25
billion1
).
o Aditya Birla Private Equity Fund – I closed
at a size of Rs. 881 Crore.
• Telecom – Building sustainable
competitiveness while maintaining
growth momentum:
o With the launch of remaining seven
services areas, Idea Cellular became a
Pan India player.
o Amidst hyper competition, Idea
increased its revenue market share
during financial year 2009-10 from
11.7% to 12.6%, reflecting its
competitive strength
o Idea added one third of its subscriber
base in one year itself to reach 63.82
million subscribers.
Note 1
: 1 USD = Rs. 45; 1 billion = 100 Crore Note 2
: Excluding Investment Income / (Loss) on Policyholders’ Funds
o Idea won 3G spectrum in 11 service
areas which contribute 80% of its existing
2G revenues.
• IT-ITeS – Diversifying capabilities and
building strong order book with a focus
on bottom-line:
o Aditya Birla Minacs acquired UK based
‘Compass BPO Limited’ and US based
‘Bureau of Collection Recovery LLC’ to
strengthen its capabilities in fast growing
Finance & Accounting and Accounts
Receivables Management segments
respectively.
o Besides building a strong sales pipeline
of ~ USD 1 billion [Total Contract Value
(“TCV”)] and order book of ~USD 600
million (TCV), its unrelenting focus on
cost rationalisation has improved
earnings by over Rs. 100 Crore.
• Fashion & Lifestyle – Capitalising on
expanded retail space to achieve
profitable growth:
o Led by revenues growth and cost
optimisation measures, the business
turned EBITDA positive (before site
closure costs) – A swing of more than
Rs. 150 Crore over previous financial
year.
• Manufacturing – Capturing sector growth
and realising full potential:
o Combined together, manufacturing
businesses posted highest ever EBITDA
at Rs. 748 Crore achieving 29% year
on year growth.
o To capture the power sector growth, the
insulators manufacturing capacity was
expanded by about 10,000 metric
tonnes per annum (“MTPA”) in April
2009 to reach a total capacity of
48,760 MTPA.
Aditya Birla Nuvo: Thrust on Profitable Growth

MANAGEMENT’S DISCUSSION AND ANALYSIS
[9]
MA
NA
GEM
EN
T’S D
ISC
USSIO
N A
ND
A
NA
LYSIS
Consolidated net revenues grew year on year by
8% to Rs. 15,505 Crore. The Financial Services,
Telecom and Fashion & Lifestyle businesses were
the major contributors. Life Insurance business
witnessed 20% rise in premium income. Revenues
of other financial services businesses achieved
65% growth led by the Asset Management and
the Broking businesses. Revenues growth in the
o The Greenfield Carbon Black capacity
expansion at Patalganga by 85,000
MTPA was completed in May 2010 end
to reach a total capacity of 315,000
MTPA. The Company is further planning
to augment its carbon black
manufacturing capacity by 85,000 MTPA
at Patalganga in the second phase
besides 85,000 MTPA expansion in the
southern India.
o The Company is also planning to
expand its caustic soda capacity by
45,625 MTPA to reach a total capacity
of 136,875 MTPA.
Continuous pursuit of strategic objectives
as stated above coupled with focus on
profitable growth across the businesses
yielded encouraging results. The
Company:
• Crossed consolidated net revenues of
Rs. 15,000 Crore (~USD 3.5 billion).
• Achieved its highest ever consolidated
EBITDA and Cash Profit.
• Turned positive at consolidated net profit level
– Achieving a swing of about Rs. 600 Crore.
• Strengthened its balance sheet.
Consolidated Revenues (Rs. Crore)
2009-10 2008-09
Financial Services 5,704 4,664
Life Insurance (Premium Income) 5,293 4,414
Other Financial Services 1
411 250
Telecom 2
3,331 2,892
IT-ITeS 1,530 1,777
Fashion & Lifestyle 3
1,251 1,116
Manufacturing 4
3,725 3,881
Inter-segment Elimination (35) (14)
Net Revenues (Including other Operating Income) 15,505 14,315
Investment Income / (Loss) on Life Insurance Policyholders’ Funds 4,003 (671)
Net Income from Operations 19,508 13,645
Note 1
: Other financial services include Asset Management, NBFC, Broking, Private Equity, Wealth Management and General Insurance Advisory
businesses. Aditya Birla Nuvo Limited (“ABNL”) acquired 76% stake in Aditya Birla Money Limited (“ABML”), the broking company w.e.f.
6th March 2009. Therefore, consolidated financial results of ABNL for 2008-09 include results of ABML from 6th March 2009 till 31st
March 2009 only. Birla Sun Life Asset Management, being a 50:50 joint venture, is consolidated at 50%.
Note 2
: Idea Cellular is consolidated at 31.78% till 27th August 2008, 27.02% till 1st March 2010 and 25.38% thereafter. Spice results are
consolidated with Idea at 41.09% as a joint venture since 16th October 2008 and as 100% subsidiary w.e.f. 1st March 2010.
Note 3
: Branded apparels and accessories.
Note 4
: Manufacturing businesses include Carbon Black, Agri-Business, Rayon, Insulators and Textiles.
Telecom business was driven by 48% rise in
subscriber’s base, however, average realised rate
per minute remained under competitive pressure.
In the IT-ITeS business, top-line remained under
pressure due to lower business from few clients
suffering slowdown. All the manufacturing
businesses achieved good volumes growth,
however, combined revenues marginally de-grew.

MANAGEMENT’S DISCUSSION AND ANALYSIS
[10]
MA
NA
GEM
EN
T’S D
ISC
USSIO
N A
ND
A
NA
LYSIS
This was largely because peak input and fuel
prices prevailing during part of the preceding
financial year led to higher subsidies in the
Agri-business during the previous year.
The significant rise in investment income on life
insurance policyholders’ funds reflects
appreciation in the value of life insurance
policyholders’ investments, largely driven by an
upturn in the equity markets during 2009-10.
As a result, net income from operations grew
considerably to Rs. 19,508 Crore.
14315
+1040 +439
-247
+135
-155 -21
15505
20
08
-09
Fin
an
cia
l
Se
rvic
es
Tele
com
IT-I
TeS
Fash
ion
&
Life
styl
e
Ma
nu
fact
uri
ng
Elim
ina
tio
n
20
09
-10
Consolidated Net Revenues Walk (Rs. Crore)
(Rs. Crore)
2009-10 2008-09
Earnings before Interest, Tax, Depreciation and Amortisation (EBITDA) 1,686 867
Less : Depreciation and Amortisation 866 696
Earnings before Interest and Tax (EBIT) 820 172
Segmental EBIT as per Accounting Standard (“AS”) — 17 2009-10 2008-09
Financial Services (337) (639)
Life Insurance (425) (687)
Other Financial Services 88 47
Telecom 431 475
IT-ITeS 42 (64)
Fashion & Lifestyle (81) (229)
Manufacturing 628 465
Segmental EBIT as per AS — 17 684 9
Add : Net of Unallocated Income / (Expenses) (12) (2)
Add : Finance Expenses of NBFC1
80 84
Add : Consolidated Interest Income (Excluding Interest Income of NBFC) 1
68 80
Consolidated EBIT 820 172
Note 1
: In accordance with AS-17 on ‘Segment Reporting’, finance expenses of NBFC are reduced from segment EBIT, hence, added back to arrive
at Consolidated EBIT. In accordance with AS-17, interest income (excluding interest income of NBFC) is not included in segment EBIT, hence,
added back to arrive at Consolidated EBIT.
Consolidated EBITDA almost doubled year on
year to Rs. 1,686 Crore driven by improved
profitability in the manufacturing businesses
coupled with reduced losses in the Life Insurance,
IT-ITeS and Fashion & Lifestyle businesses.
Depreciation grew by 25% largely due to
expansion in the Telecom business and
consolidation of Spice results. Consolidated
EBIT grew from Rs. 172 Crore to Rs. 820 Crore.

MANAGEMENT’S DISCUSSION AND ANALYSIS
[11]
MA
NA
GEM
EN
T’S D
ISC
USSIO
N A
ND
A
NA
LYSIS
Consolidated Net Profit Walk (Rs. Crore)
-436
+648+59
-33-84 155
2008-09 EBIT Interest
Expenses
Tax Minority
Interest
2009-10
Financial services business not only piloted the
revenues growth but also led the EBIT walk.
Increasing size of renewal premium and better
expense management led to reduction of losses
in the life insurance business. Asset Management
and Broking businesses led the earnings growth
of other financial services. Profitability in the
Telecom business was subdued due to
competitive pressure on realised rate per minute
Segmental EBIT Walk (Rs. Crore)
and launch of remaining seven service areas
during the year. Thrust on cost rationalisation
efforts drove turnaround at bottom-line in the
IT-ITeS and the Fashion & Lifestyle businesses.
Collectively, manufacturing businesses posted
their highest ever profitability driven by earnings
growth in the Carbon Black, Rayon and Textiles
businesses.
(Rs. Crore)
2009-10 2008-09
Earnings before Interest and Tax (EBIT) 820 172
Less : Interest Expenses 662 721
Less : Provision for Taxation (Net) 114 81
Less : Minority Interest / Share of (Profit)/Loss of Associates (111) (195)
Net Profit / (Loss) after Minority Interest 155 (436)
9
+302
-44
+106
+147
+163
684
2008-09 Financial
Services
Telecom IT-ITeS Fashion &
Lifestyle
Manufacturing 2009-10

MANAGEMENT’S DISCUSSION AND ANALYSIS
[12]
MA
NA
GEM
EN
T’S D
ISC
USSIO
N A
ND
A
NA
LYSIS
Interest expenses decreased led by repayment
of loans out of surplus funds in the Telecom
business coupled with working capital
rationalisation in the manufacturing businesses.
The Company posted consolidated net profit of
Rs. 155 Crore against a consolidated net loss
of Rs. 436 Crore incurred in the previous year.
An eye on profitable growth across the
businesses led the turnaround of about Rs. 600
Crore. This reflects the strength of a unique
conglomerate like Aditya Birla Nuvo.
To meet its existing as well as future investment
and capital expenditure requirements, the
Company issued and allotted 18.5 million
warrants to the Promoter Group Companies on
a preferential basis in June 2009, on receipt of
Rs. 250 Crore as 25% application money. The
Promoter Group further infused Rs. 325 Crore
(being balance 75% amount payable) on
conversion of 8 million warrants into equity
shares on 30th October, 2009. Thus, on
aggregate basis, a sum of Rs. 575 Crore was
received in 2009-10 out of total issue size of
about Rs. 1,000 Crore.
Led by improved earnings and equity infusion
by promoters, balance sheet has been
strengthened. Consolidated net debt to EBITDA
improved from 5.6 times to 3.1 times.
The business-wise performance and outlook
follows.
Consolidated Balance Sheet (Rs. Crore)
2009-10 2008-09
Net Worth 5,475 5,742
Total Debts 6,707 8,109
NBFC Borrowings 732 778
Minority Interest 186 179
Deferred Tax Liability (Net) 241 220
Capital Employed 13,340 15,028
Life Insurance Policyholders’ Funds (Including Funds for Future Appropriation) 15,652 8,726
Total Liabilities 28,992 23,754
Net Block 6,988 6,672
Goodwill 2,892 3,423
Long Term Investments 219 219
Life Insurance Investments 16,130 9,168
Net Working Capital 1,300 1,005
Cash Surplus1
1,462 3,267
Total Assets 28,992 23,754
Book Value (Rs.) 531 604
Net Debt / EBITDA (x) 3.1 5.6
Net Debt / Equity (x) 1.0 0.8
Note 1
: Includes cash, cheques in hand, remittances in transit, balances with banks, fertilisers bonds and current investments.

MANAGEMENT’S DISCUSSION AND ANALYSIS
[13]
MA
NA
GEM
EN
T’S D
ISC
USSIO
N A
ND
A
NA
LYSIS
Financial Services (Aditya Birla Financial Services)
With a vision to become a leader and role
model in the financial services sector with
a broad based and integrated business,
Aditya Birla Financial Services (“ABFS”) has
created a significant presence for itself in the
non-bank financial services space. In each of
its seven business verticals viz., life insurance,
asset management, NBFC, private equity, wealth
management and distribution, broking and
general insurance advisory, ABFS is committed
to strengthen its market positioning by building
distribution reach, offering innovative products
and services while delivering a unique customer
service experience. Anchored by over 16,500
employees and trusted by about 5.5 million
customers, ABFS has a nation-wide coverage
through more than 1,550 branches and over
2 lacs channel partners. During the year,
combined assets under management of ABFS
grew by 42% to Rs. 82,140 Crore. Combined
net revenues grew by 23% to Rs. 5,850 Crore.
Net profit (excl. Life Insurance) has more than
doubled.
Life Insurance (Birla Sun Life Insurance Company Ltd.) (Rs. Crore)
2009-10 2008-09
Branches (Nos.) 632 600
Direct Selling Agents (‘000) 170 166
Assets under Management (“AUM”) 16,130 9,168
Individual First Year Premium 2,288 2,480
Group First Year Premium 672 341
First Year Premium 2,960 2,821
Renewal Premium 2,546 1,751
Premium Income (Gross) 5,506 4,572
Less : Reinsurance Ceded and Service Tax (213) (158)
Premium Income (Net) 5,293 4,414
Add : Investment Income/(Loss) on Policyholders’ Funds 4,003 (671)
Net Income from Operations 9,296 3,744
Net Profit/(Loss) (435) (702)
Capital 2,450 2,000
ABNL’s Investment 1,814 1,481
The financial services sector in India offers a
strong growth potential driven by favourable
demographics and high rate of household
financial savings. The size of annual change in
financial assets of household sector has just
doubled in past five years from ~USD 84 billion
in 2003-04 to ~USD 166 billion in 2008-09
[Source : Reserve Bank of India (“RBI”),
www.rbi.org.in]. A large proportion of financial
savings is being deployed in deposits, which
offers a huge potential market size for financial
services and products. A fast growing economy,
large and young population, burgeoning middle
class segment, lower penetration of financial
services and products coupled with increasing
awareness towards financial planning are the
key drivers, which are expected to encourage
the growth of savings, protection and investment
products in India. The role of non-banking
financial institutions in driving this growth is
becoming increasingly significant. Currently, over
50% of total revenue pool of Indian financial
services sector flows from non-banking space.

MANAGEMENT’S DISCUSSION AND ANALYSIS
[14]
MA
NA
GEM
EN
T’S D
ISC
USSIO
N A
ND
A
NA
LYSIS
Industry Overview
The Indian Life insurance industry currently
comprises 22 private life insurers and one public
sector insurer – Life Insurance Corporation of
India. Life insurance industry has revived
successfully out of the slowdown witnessed in the
previous financial year 2008-09. The weighted
new received premium (new business) of the
industry surged by 28% to about Rs. 82,000
Crore in 2009-10 after de-growing by 3% in
2008-09. New business of private life insurers at
about Rs. 35,000 Crore grew by 13% compared
to 6% in the previous financial year [Source:
Insurance Regulatory and Development Authority
(“IRDA”), www.irdaindia.org]. About 80% of
private sector’s new business continues to be
contributed by the top seven private life insurers
including Birla Sun Life Insurance – indicating
their dominance in the industry. With increased
thrust on conservation of capital and profitability,
top industry players opted to slowdown the growth
in the distribution infrastructure and focused on
higher productivity and efficiency for achieving
growth.
Performance Review
Birla Sun Life Insurance (“BSLI”) completed its
10th year of successful operations in a
challenging external and uncertain regulatory
environment. The IRDA guidelines on ‘capping
on charges’ necessitated redesigning and
launching new Unit Linked Insurance Products
(“ULIP”). BSLI revamped its entire ULIP portfolio
by building a competitive suite of products to
balance the needs of customers, distributors and
shareholders.
BSLI outperformed the private sector growth in
the previous financial year 2008-09 with a 44%
rise in new business and continued to outperform
during the nine months ended 31st December
2009. However, a complete revamp of ULIP
portfolio in December 2009 led to an expected
impact on the sales during the fourth quarter.
During 2009-10, new business premium income
of BSLI grew by 5% to Rs. 2,960 Crore.
It garnered 8.4% market share among private
life insurers in terms of new business (Source:
IRDA).
The total premium income of BSLI grew by 20%
to Rs. 5,506 Crore led by a robust growth of
45% in the renewal premium which was driven
by high persistency levels. BSLI achieved 13th
month persistency by annualised premium at
~85%. AUM has been scaled up by 76% to
Rs. 16,130 Crore (~USD 3.6 billion).
BSLI took several steps to rationalise expenses
across the operations to increase value to the
customers without compromising on profit
margins. As a result, expense ratio improved
from 27% to 24%. Driven by declining expense
ratio, increasing size of in-force business and
improved product mix; net loss reduced from
Rs. 702 Crore to Rs. 435 Crore. Capital
requirement also reduced from Rs. 725 Crore
to Rs. 450 Crore out of which Aditya Birla Nuvo
contributed Rs. 333 Crore as its 74% share.
BSLI became the first Indian life insurance
company to get the results, assumptions and
methodology for preparing Embedded Value
(“EV”) and Value of New Business (“VNB”) for
the financial year 2008-09, peer reviewed by
an international actuarial firm. The EV of BSLI
is measured at Rs. 3,060 Crore as at 31st
March, 2009 against capital of Rs. 2,000 Crore
infused till that date. EV reflects the value of
future profits embedded in the in-force policies
written by the life insurance company. The VNB
margin, a measure used for gauging profitability
of new business stood at 20.3% for the financial
year 2008-09.
With a clear focus on profitable growth, BSLI
started the financial year with a thrust on driving
higher productivity across the channels, growing
alternate channel relationships, launching
innovative products, delivering strong investment
returns and superior service to the policyholders.
Direct Selling Agents channel continues to be
the largest distribution channel for BSLI
contributing 68% of its individual life business.

MANAGEMENT’S DISCUSSION AND ANALYSIS
[15]
MA
NA
GEM
EN
T’S D
ISC
USSIO
N A
ND
A
NA
LYSIS
Various initiatives were undertaken to improve
productivity across the sales force by way of
segmentation and structured training. BSLI
continued to strengthen alternate channel
relationships which grew from over 425 in March
2009 to over 600 in March 2010.
Bancassurance channel contributed 15% and
Corporate Agents and Brokers contributed 17%
of its individual life business.
BSLI launched 11 new products including
guaranteed ULIPs, over the counter products
and highest NAV plans. Some of the new
product suites include Saral Solutions, Dream
Solutions and Titanium Plus.
BSLI continued to deliver superior investment
returns to its policyholders with every fund
beating the benchmark performance. BSLI
achieved the distinction of attaining ‘zero
percent ’ claims outstanding ratio for a
consecutive second year, that means, 100% of
all the claims intimated during the year have
been processed. This is a live example of its
‘Customer First’ approach and clearly speaks
of the strong system and processes it has set in.
The brand recall score of BSLI has improved
from 84% to 93%.
Outlook
In an uncertain and volatile economic
environment, last two years have been quite
challenging for the life insurance industry in
terms of new business growth and regulatory
changes. This has given an opportunity to
existing players to review and improve their
operating models to drive higher efficiencies.
There could be some challenges in the short
term in terms of driving higher capacity
utilisation, especially in the agency channel and
change in the industry business model in light
of the ongoing regulatory changes. However, in
the long run, regulatory changes like capping
on charges will make ULIPs more cost
competitive and attractive for customers and
will prove beneficial for the industry.
The outlook for Indian life insurance industry
continues to be robust. The future growth will
be strongly driven by factors like long term
economic growth, lower penetration levels,
growing middle class, younger working
population, high saving rate and rising
awareness among the population on the need
for life insurance. The level of penetration,
particularly in life insurance, tends to rise as
income levels increase. The share of life
insurance in deployment of annual financial
household savings has doubled in past ten years
from 11% in 1998-99 to 20% in 2008-09
(Source : RBI).
BSLI is well positioned to capitalise on these
opportunities with a vision to be in top 3 private
players’ league. It will continue to focus on
improving persistency and maximising its in-force
book through superior investment performance
and customer service. While BSLI will continue
to maintain leading edge on the ULIP platform,
it is in advanced stages of expanding its
non-ULIP portfolio, to augment its product
offerings and safeguard against regulatory risks.
It will continue to drive higher efficiencies in the
areas of operations and across the distribution
channels to achieve profitable growth. BSLI also
plans to achieve excellence in the areas related
to brand saliency, customer experience, risk
management and compliance.
Asset Management (Birla Sun Life Asset
Management Company Ltd.)
Industry Overview
The Indian mutual fund industry currently
comprises 43 asset management companies
including 16 foreign players/predominantly
foreign joint ventures. The industry witnessed
entry of 8 new players during 2009-10. The
average AUM of the Indian mutual fund industry
grew by 52% from Rs. 4,92,936 Crore (~USD
110 billion) in March 2009 to Rs. 7,47,525
Crore (~USD 166 billion) in March 2010,
driven by higher inflows into liquid funds and
mark-to-market gains in equity funds. Equity
average AUM almost doubled from
Rs. 1,12,995 Crore (~USD 25 billion) in

MANAGEMENT’S DISCUSSION AND ANALYSIS
[16]
MA
NA
GEM
EN
T’S D
ISC
USSIO
N A
ND
A
NA
LYSIS
March 2009 to Rs. 2,13,282 Crore (~USD 47
billion) in March 2010, backed by strong
recovery in equity markets. Share of equity AUM
in total industry AUM increased from 23% to
29%. Debt and liquid fund assets continue to
contribute majority proportion of total industry
AUM dominated by banks’ and corporates’
treasury investments [Source : Association
of Mutual Funds in India (“AMFI”),
www.amfiindia.com].
In the recent past, the market regulator SEBI
has introduced a number of initiatives and
regulatory changes to safeguard and empower
retail investors. Among important regulatory
developments, SEBI introduced no load regime
where by entry load on mutual funds was
removed w.e.f. 1st August 2009. Consequently,
industry faced significant equity redemption and
net equity sales de-grew from Rs. 4,084 Crore
in 2008-09 to Rs. 1,456 Crore in 2009-10
(Source : AMFI).
Performance Review
Birla Sun Life Asset Management Company
(“BSAMC”) completed 15 years journey of
(Rs. Crore)
2009-10 2008-09
Branches (Nos.) 109 115
Investor Folios (In Millions) 2.5 2.3
Financial Advisors (‘000) 32 29
Average Assets under Management
Equity 11,051 4,607
Debt and Liquid 51,293 42,489
Domestic 62,343 47,096
Offshore (All Equity) 2,420 1,265
PMS 367 287
Total 65,130 48,649
Net Income from Operations 293 178
EBIT 70 16
Net Profit 48 8
Net Worth 141 92
continued wealth creation. It ranked 5th with
8.3% market share as on 31st March 2010
(Source: AMFI).
The total average AUM of BSAMC surged by
34% from Rs. 48,649 Crore to Rs. 65,130 Crore
(~USD 14.5 billion). About half of the increase
in the AUM in absolute terms was contributed
by growth in equity AUM.
Average equity AUM (including offshore) more
than doubled to Rs. 13,470 Crore, led by higher
net sales and strong fund performance. BSAMC
achieved highest growth rate in terms of
domestic average equity AUM among the top
five players. It garnered domestic equity net sales
of over Rs. 2,041 Crore to rank among the top
three equity mobilisers during the year. For
industry, mark to market gain contributed to
98% of growth in average equity AUM while
only less than 2% growth coming from equity
net sales. For BSAMC, more than 32% of growth
in domestic average equity AUM was contributed
by equity net sales. BSAMC’S share in industry’s
average equity AUM grew from 4.1% in March
2009 to 5.2% in March 2010.

MANAGEMENT’S DISCUSSION AND ANALYSIS
[17]
MA
NA
GEM
EN
T’S D
ISC
USSIO
N A
ND
A
NA
LYSIS
Increase in high margin assets like equity,
PMS and offshore coupled with better
expenses management has helped BSAMC in
delivering excellent financial performance. Net
income from operations grew by 65% to
Rs. 293 Crore. Net profit grew from Rs. 8 Crore
to Rs. 48 Crore.
BSAMC has a strong distribution network with
109 branches and over 32,000 financial
advisors as on 31st March 2010. The investor’s
base grew from 2.3 million folios to 2.5 million
folios. Live SIPs grew year on year by 47%.
BSAMC recorded the highest number of funds
in 4 and 5 star categories across the industry
throughout the year reflecting its strong
investment performance. According to Lipper
Global Data, ‘Birla Sun Life Tax Relief ’96’ was
awarded as the ‘World’s best performing equity
fund’ for the period September, 1996 to
September, 2009 among 3006 eligible equity
funds. BSAMC was adjudged as the ‘Best Wealth
Creator – Best Mutual Fund House’ and ‘Best
Wealth Creator – Best Debt Fund House’ by
Outlook Money – NDTV Profit in October, 2009.
It was also adjudged as best ‘Onshore Fund
House India, 2009’ by Asian Investor Magazine.
It was also awarded ‘Asset management
Company of the Year – 2009’ by The Asset,
Hong Kong.
Outlook
Mutual fund AUM as percentage of GDP at
~13% is very low in India compared to 50%-
90% in the developed countries (Source : AMFI,
RBI, Investment Company Institute – US).
Currently, only ~5% of Indian population invests
in mutual fund. Indian mutual fund industry is
expected to grow by 15%-25% from 2010 to
2015, backed by growth drivers such as lower
penetration, long term economic growth,
increase in retail participation with preference
for mutual funds over asset classes perceived to
be more risky, rising disposable incomes and
savings, favourable demographics (Source: CII
Mutual Fund Summit). Moreover, the mutual fund
players are increasingly focusing on the high
margin and alternate assets such as PMS, real
estate and offshore.
BSAMC aspires to be among the top 3 players
league with a focus on increasing share of high
margin and alternate assets like equity, PMS,
real estate and offshore funds. BSAMC will
continue to augment relationships across
channels besides launching innovative products,
optimising costs, building a strong retail
customer franchise and enhancing brand loyalty
through consistent returns as well as superior
customer service.
NBFC (Aditya Birla Finance Ltd., formerly
known as Birla Global Finance Company Ltd.)
Industry Overview
Demand for credit in a developing country like
India is huge and traditional financial institutions
like banks are often not able to meet the overall
demand. There NBFCs play an important role.
Credit growth in India has been robust at a
CAGR of 28% from 2004-05 to 2008-09.
NBFCs have around 12% share in overall credit
outstanding of ~USD 850 billion (March 2010
– Estimate) in India (Source : RBI).
In the previous financial year 2008-09, most
NBFCs had slowed down growth and curtailed
exposure as a risk mitigation against the general
slowdown in financial markets and liquidity crisis,
IPO financing market had also dried up due to
sharp volatility in the equity markets. However,
in 2009-10, market conditions have improved
and most of the NBFCs again scaled up the
book size.
Performance Review
Aditya Birla Finance (“ABFL”) is one of the
leading players in the Loan against Securities,
IPO financing and Corporate bill discounting
segments. ABFL not only absorbed the effects
of challenging environment in 2008-09 by
proactive reduction of exposure, but also
overcome the same and emerged strong in
2009-10 by re-aligning, re-structuring and

MANAGEMENT’S DISCUSSION AND ANALYSIS
[18]
MA
NA
GEM
EN
T’S D
ISC
USSIO
N A
ND
A
NA
LYSIS
re-engineering its business policies and plans.
Loan against securities portfolio more than
doubled in 2009-10 compared to the previous
year. It also disbursed more than Rs. 1,500
Crore for IPO financing. It also introduced new
products like Loan against Share Individual,
ESOP Financing, Bond Financing etc. to cater
to the needs of different customer segments.
(Rs. Crore)
2009-10 2008-09
Net Income from Operations 73 120
EBIT 46 44
Net Profit 30 30
Net Worth 235 211
Net income from operations decreased from
Rs. 120 Crore to Rs. 73 Crore since in later
half of the previous financial year 2008-09,
exposure was cautiously reduced to manage
downturn in the financial markets. Surplus funds
were judiciously invested and net profit was
maintained at Rs. 30 Crore.
ABFL’s short term debt programme has been
assigned a rating of ‘A1+’ by the rating agency
ICRA – the highest credit quality rating assigned
by the agency to short-term debt instruments.
Instruments rated in this category carry the lowest
credit risk in the short term.
Outlook
Credit penetration in India at ~60% of GDP is
lower compared to other emerging and
developed economies. Credit outstanding is
expected to grow at a CAGR of ~20% for next
three years (Source : RBI). This coupled with
Government’s move in the Union Budget to
give banking licenses to NBFC poses significant
growth opportunities for NBFCs.
ABFL aspires to be a significant player and aims
to expand its asset book by extending offerings
and leveraging Aditya Birla Group’s large
ecosystem for SME funding.
Private Equity (Aditya Birla Private Equity)
Industry Overview
Despite the global economic environment and
capital market conditions improving gradually
during the year under review, the private equity
investments in India (excluding real estate
investments) could touch only USD 3.8 billion
in the calendar year 2009 as against the peak
level of USD 14 billion in the calendar year
2007 and USD 10.5 billion in the calendar
year 2008 (Source: Venture Intelligence).
Performance Review
Aditya Birla Private Equity successfully launched
its maiden fund ‘Aditya Birla Private Equity –
Fund-I’, notwithstanding the challenges of weak
fund raising environment globally and increasing
competition in India with increasing number of
players starting to offer private equity funds.
Various institutional investors and HNIs showed
confidence in the fund and it closed at a size of
~ Rs. 881 Crore (including 20% sponsor’s
commitment) well above planned commitments
of Rs. 500 Crore. The fund proposes to target
substantial minority stakes, while investing
primarily in unlisted, mid-cap, high-
growth, India-centric companies and is
sector-agnostic.
Outlook
Though the fund raising by private equity funds
is yet to revert to the peak levels, there is a
huge opportunity in the private equity space in
India, driven by long term growth potential of
Indian industry, rising disposable income and
growing participation of high net-worth
individuals, mature and liquid financial markets
coupled with conducive government policies for
private investment.
Aditya Birla Private Equity is well positioned to
tap this opportunity backed by strong investment
management team and salient parentage brand
of the Aditya Birla Group.

MANAGEMENT’S DISCUSSION AND ANALYSIS
[19]
MA
NA
GEM
EN
T’S D
ISC
USSIO
N A
ND
A
NA
LYSIS
Broking (Aditya Birla Money Ltd., formerly
known as Apollo Sindhoori Capital Investments Ltd.)
Industry Overview
Indian retail broking industry is highly competitive
and fragmented comprising of several broking
players with top five players contributing to only
~16% of equity broking market size. Indian
retail broking sector has witnessed excellent
growth in recent past. Indian Cash market and
derivatives market grew at a CAGR of ~18%
and ~32% respectively in the past four years.
During the same period, Depository Participant
accounts grew at a CAGR of ~19% and
commodity segment at ~35%. [Source :
National Stock Exchange of India Ltd. (“NSE”),
Bombay Stock Exchange Ltd. (“BSE”), Multi
Commodity Exchange of India Ltd. (“MCX”),
National Commodity & Derivatives Exchange Ltd.
(“NCDEX”)]
The financial year 2009-10 has been an
outstanding year for the Indian equity markets.
Sensex, the benchmark index of BSE, rallied
77% and S&P CNX Nifty, the benchmark index
of NSE, surged by 74%, making India one of
the best performing equity markets globally. Total
Cash and Futures & Options volumes at NSE
and BSE, combined together, surged by 54% to
over USD 5 trillion. The combined commodities
volumes recorded in both MCX and NCDEX
increased by 43% to ~USD 1.6 trillion.
(Rs. Crore)
2009-10 2008-09
Net Income from Operations 112 83
EBIT 21 4
Net Profit 13 1
Net Worth 57 45
Note : Consolidated financials including wholly owned subsidiary Aditya
Birla Commodities Broking Ltd.
Performance Review
Aditya Birla Nuvo acquired Apollo Sindhoori
Capital Investments Ltd. in March 2009 and
re-branded it as Aditya Birla Money Ltd. (“ABML”).
The key task was to stabilise the business, rationalise
costs, bring operating efficiencies and get the
business back on a track of sustained profits, which
was successfully achieved as is reflected in the
financial performance.
Its net income from operations increased from
Rs. 83 Crore to Rs. 112 Crore supported by
55% rise in equity broking volumes and 45%
rise in commodity broking volumes. Its net profit
increased from Rs. 1 Crore to Rs. 13 Crore.
The number of clients increased from 1.96
lacs in March 2009 to over 2.2 lacs in March
2010. ABML has a strong nation-wide network
of more than 230 own and 550
franchise branches spread across more than
150 cities.
Outlook
Currently, only ~6% of household financial
savings are invested in equity in India compared
to 10%-30% in developed countries. This under
penetration translates into a huge opportunity
for retail broking sector given the positive long
term outlook for India’s equity markets.
Going forward, ABML will focus on strengthening
the five pillars of business – Brand, Product,
Distribution, Operations, Service and
People – in a sustained manner. It also plans to
augment its research and product offerings to
match the best in the industry. It will increase its
footprint mainly through business
partners. Additional branches are being added
predominantly in Western and Northern
India which represent a large opportunity for
broking.
Wealth Management and Distribution
(Aditya Birla Money Mart Ltd., formerly known
as Birla Sun Life Distribution Company Ltd.)
Industry Overview
Mutual fund distribution is still a fragmented
industry with top 40 distributors contributing only

MANAGEMENT’S DISCUSSION AND ANALYSIS
[20]
MA
NA
GEM
EN
T’S D
ISC
USSIO
N A
ND
A
NA
LYSIS
37% of the Industry AUM. During the year, the
market regulator SEBI implemented some
significant policy changes in the mutual fund
distribution space. In order to empower investor
through transparency in payment of commission
and load structure, SEBI abolished the payment of
entry load for all Mutual Fund Schemes w.e.f.
August 1, 2009. This impacted the margins of
mutual fund distribution industry in 2009-10.
Distributors are looking to change their business
model and move from transaction based
business model to advisory business model.
Distributors are also looking to increase their
basket of services by moving to alternate assets
like structured products, private equity, real
estate etc.
Performance Review
In the wake of above dynamic regulatory
changes witnessed during the year, Aditya Birla
Money Mart (“ABMM”) diversified its offerings
and product portfolio to increase the customer
base and mitigate the impact on mutual fund
distribution segment. The new product offerings
encompassed investment solutions such as
private equity, Gold SIP, alternative investments,
structured products and real estate broking
services. It also launched online platform ‘MF
Insta-Invest’ enabling the customers to transact
mutual fund through online mode.
This has helped ABMM to safeguard its revenues
even after removal of entry load. Its net income
from operations increased from Rs. 24 Crore to
Rs. 59 Crore. However, bottom-line was strained
due to business building costs viz., investment
in the people, process and technology related
infrastructure coupled with reduction in margins
due to removal of entry load. Its net loss
marginally grew from Rs. 11 Crore to Rs. 12
Crore.
The assets under advisory grew by 72% from
Rs. 9,525 Crore to Rs. 16,387 Crore. During
the year, ABMM mobilised funds aggregating
more than USD 75 billion under different asset
classes. ABMM has a strong nation-wide
presence through 37 branches and over 7,000
channel partners serving more than 2.5 lacs
customers.
ABMM became the second largest corporate
distributor of mutual funds in India in terms of
assets under advisory. It also became the largest
distributor for Aditya Birla Private Equity
Fund–I launched during the year and the third
largest corporate agent for Birla Sun Life
Insurance.
Outlook
The long term outlook for the wealth
management sector portends well with the
increasing preference towards investment with
the help of professional advisors coupled with
high financial savings.
ABMM’s thrust will be to provide quality financial
planning to its clients through product innovation
and technology support. It will also focus on
expanding its offerings to diversify its product
portfolio besides deriving synergies with other
Aditya Birla Financial Services verticals.
General Insurance Advisory (Birla Insurance
Advisory and Broking Services Ltd.)
Industry Overview
The General Insurance industry premium grew
by 13% in 2009-10 over the previous financial
year. The financial year 2009-10 witnessed
hardening of prices in the health insurance
segment towards the end. In view of the adverse
loss experience, the insurance companies also
capped brokerage on health insurance at 7.5%.
Performance Review
Supported by the reinsurance and retail broking
segments, net income from operations of Birla
Insurance Advisory and Broking Services Limited
grew by 25% from Rs. 16 Crore to Rs. 21 Crore.
Profitability was lower due to capping of health
insurance brokerage. Net profit de-grew from
Rs. 5 Crore to Rs. 4 Crore.

MANAGEMENT’S DISCUSSION AND ANALYSIS
[21]
MA
NA
GEM
EN
T’S D
ISC
USSIO
N A
ND
A
NA
LYSIS
Outlook
In 2010-11, the general insurance industry is
expected to grow by more than 15%. Improved
economic outlook is also likely to boost growth
in general insurance premium. However, margins
for general insurance brokers may remain under
pressure due to hardening of rates following
higher losses incurred by insurance companies
and restrictions imposed by the reinsurers.
Telecom (Idea Cellular Ltd.)
Industry Overview
During the last 15 months, the number of
operators has jumped as licenses obtained
during the telecom bubble days in 2007 got
converted into live operations. The consequent
over-capacity and hyper competition led to tariff
war. To grab market share, new launches offered
subscription at throw away prices loaded with
free talk time. This led to use and throw
phenomenon of new SIM cards. Introduction of
per-second billing even worsen the situation.
Consequently, though wireless subscribers’ base
grew by 49% from 392 million to 584 million
in 2009-10, national mobility sector revenue
growth for the calendar year 2009 contracted
to 12% (after normalisation for Interconnection
Usage Charges) compared to 22% growth in
the earlier year. [Source : Telecom Regulatory
Authority of India (“TRAI”), www.trai.gov.in].
Performance Review
Idea Cellular became a Pan India player with
the launch of operations in remaining seven
service areas i.e. Orissa, Tamil Nadu & Chennai,
Jammu & Kashmir, West Bengal, Kolkata, Assam
and North East. It added its highest ever yearly
net adds to reach 63.82 million subscribers
from 43.02 million a year ago. Spice
Communications was merged with Idea w.e.f.
1st March 2010.
Idea ranks 3rd in terms of revenue market share
which grew from 11.7% in the fourth quarter of
2008-09 to 12.6% in the fourth quarter of
2009-10, amidst hyper competition. It ranks
2nd with ~20.6% revenues market share in
9 service areas where it holds 900MHz
spectrum. Industry derives ~48% of its gross
revenues from these 9 out of total 22 service
areas (Source : Gross revenues for UAS and
Mobile license only, as released by TRAI). Idea
holds 16% stake in the world’s largest tower
company, Indus Towers, a joint venture with
Bharti Infratel Ltd. and Vodafone Essar Ltd.
(Rs. Crore)
2009-10 2008-09
Subscribers (Nos. in Million) 63.82 43.02
Net Income from Operations 12,398 10,131
EBITDA 3,621 3,051
EBIT 1,606 1,648
Net Profit 954 882
Cash Surplus 1,420 5,132
Net Worth 11,372 13,265
Total Debt 7,859 8,912
Capital Employed 19,232 22,178
ROACE (%) 8% 10%
ABNL’s Investment 2,356 2,356
ABNL’s shareholding in
Idea at the year end (%) 25.38% 27.02%
Idea registered a 22% upsurge in revenues from
Rs. 10,131 Crore to Rs. 12,398 Crore. Cash
profit grew by 32% to Rs. 3,090 Crore. Net
profit grew from Rs. 882 Crore to Rs. 954 Crore
even after absorbing a drop of 23% in average
realised rate per minute due to competitive
pressure and the gestating impact of seven new
service areas launched during the year.
Net Debt to Equity stands at 0.6 and Net Debt
to EBITDA stands at 1.8 as on 31st March,
2010 reflecting a strong balance sheet.
In the recently concluded 3G auction, Idea won
3G spectrum in 11 service areas, which cover
~80% of its existing 2G revenues. These eleven
service areas account for ~ 49% of Industry’s

MANAGEMENT’S DISCUSSION AND ANALYSIS
[22]
MA
NA
GEM
EN
T’S D
ISC
USSIO
N A
ND
A
NA
LYSIS
all India revenues. Ideas ranks 1st
or 2nd
in
seven out of these eleven service areas. The
total payment made for the 3G spectrum was
Rs. 5,769 Crore which was lowest among the
major operators.
Outlook
The business models of most of the telecom
operators are facing the stress test from an
overcapacity led hyper-competition. With most
of the new operators operating at tariffs lower
than the cost, these operations are unsustainable
in the long run and eventually, sector
consolidation looks inevitable. In the long run,
prospects of the Indian telecom industry looks
positive in the light of lower tele-density and
lower penetration of value added services. With
the roll of 3G operations, usage of value added
services is expected to increase multi-fold.
Idea’s service area specific strategy, its improving
capacity utilisation, its sophisticated
management processes supported by a power
brand, underscore Idea’s ability to ride out the
rough times, and to emerge competitively
enhanced once the phase of overcapacity and
hyper competition draws to its inevitable close.
IT-ITeS
ITeS (Aditya Birla Minacs Worldwide Ltd.)
Industry Overview
The global ITeS industry has also been affected
by the recessionary situation. Whilst business
volumes declined due to customer business and
rate reductions, overall global ITeS is estimated
to have grown by 4%-5% in 2009. There were
fewer new deals in the markets and the trend
has been that a significant share of these
contracts insisted that the jobs be retained in
the home country. Most clients asked for and
negotiated prices downwards on existing
contracts. Most of the companies have looked
at the recession and its aftermath as an
opportunity to optimise costs and contain
attrition.
Performance Review
With a track record of over 28 years, Aditya
Birla Minacs provides business solutions across
the clients’ value chains. Its portfolio span across
their customer lifecycle management processes,
from marketing solutions, to sales and order
management, technical, product and channel
support, customer care and loyalty processes,
and to collections outsourcing. Minacs also
delivers enterprise services supporting finance
and accounting, procurement, and IT
requirements of its clients – along with its
IT services unit, Aditya Birla Minacs IT
Services Ltd. Aditya Birla Minacs ranks among
the top 10 Indian ITeS companies by revenues
size.
Aditya Birla Minacs continued augmenting
capabilities, building strong order book with a
sharp focus on bottom-line. To diversify and
strengthen its business solutions capabilities, it
acquired Compass BPO Ltd., a leading UK
based pure play end-to-end Finance and
Accounting (“F&A”) service provider in March
2010 and Bureau of Collection Recovery LLC
(“BCR”), a leading US based accounts
receivables management company in June
2010. Compass has 10 years of domain
expertise and has been ranked among the top
15 upcoming F&A players (Source : Gartner).
BCR has 25 years of domain expertise in the
US credit industry.
(Rs. Crore)
2009-10 2008-09
Operating Seats (Nos.) 9,916 8,326
Employees (Nos.) 14,724 11,621
Net Income from Operations 1,467 1,687
North America1
1,238 1,445
Asia Pacific2
229 242
EBITDA 90 5
EBIT 30 (61)
Net Profit/(Loss) (23) (121)
Note 1
: Represents revenues from delivery centres located in Canada,
Unites States and Europe.
Note 2
: Represents revenues from delivery centres located in India and
the Philippines.

MANAGEMENT’S DISCUSSION AND ANALYSIS
[23]
MA
NA
GEM
EN
T’S D
ISC
USSIO
N A
ND
A
NA
LYSIS
Aditya Birla Minacs witnessed de-growth in the
top-line due to the weak order flow from few
clients suffering slowdown. However, during the
year, it has built a strong sales pipeline of ~USD
1 billion (TCV) and order book of ~USD 600
million, which will benefit going forward.
Aditya Birla Minacs serves more than 80 clients
located mainly in US, Canada, Europe and India
with revenues mix of 77%, 13%, 6% and 4%
respectively. It is working continuously on
de-risking its business and as a result, the
revenues contribution from the top 5 clients
reduced from 69% in 2008-09 to 63% in
2009-10. Its revenues mix by verticals
(a) Manufacturing, (b) TIME (Telecom,
Technology Infrastructure, Media and
Entertainment), (c) Banking and Financial
Services and (d) Insurance and Healthcare is
53%, 31%, 15% and 1% respectively.
Aditya Birla Minacs has 29 delivery locations in
Canada, US, Europe, India and the Philippines.
It scaled up its operating capacities by adding
about 2,000 seats and more than 3,000
employees to reach a total of 9,916 seats and
more than 14,724 employees as on 31st March,
2010.
Aditya Birla Minacs has undertaken various
initiatives to mitigate the impact of slowdown
and improve operating efficiencies. Towards sites
rationalisation, three sites were consolidated in
2008-09 and one in 2009-10 by shifting their
business to more cost effectives sites.
Supported by cost control initiatives, business
remained positive at cash profit level throughout
the year. EBITDA margin improved by 600 basis
points over the previous financial year. Net loss
reduced significantly from Rs. 121 Crore to
Rs. 23 Crore.
Aditya Birla Minacs strengthened its balance
sheet by issuing zero-coupon Compulsory
Convertible Debentures for Rs. 250 Crore which
were used to repay loans, acquire Compass
and for capital expenditure.
IT Services (Aditya Birla Minacs IT
Services Ltd., formerly known as PSI Data
Systems Ltd.)
After getting requisite approval from the
shareholders, PSI Data Systems Ltd. was
de-listed from BSE w.e.f. 6th April 2009 and
re-branded as Aditya Birla Minacs IT Services
Ltd. As on 31st March 2010, Aditya Birla Nuvo
held 82.92% stake in it, directly and indirectly
through a wholly owned subsidiary.
The IT services business posted an improved
performance. While its net income from
operations remained flat at Rs. 94 Crore, it
posted net profit at Rs. 10 Crore in 2009-10
vis-à-vis loss of Rs. 7 Crore incurred in
2008-09.
Outlook
The global ITeS industry is expected to witness a
robust growth of around 6%-7%. Current
penetration levels, for both, Indian exports and
domestic ITeS markets are extremely low.
Increased outsourcing, even in low cost
economies, is a testimony that clients prefer to
outsource what is not vital to their businesses
and are looking at vendors for their domain
and process expertise - not just for cost benefits.
India is a great example of this trend, as the
domestic ITeS industry is expected to grow by
an estimated 15%-20% in 2010-11. Over the
next decade, majority of growth across the
globe, is expected to come from currently
untapped/non-core markets such as healthcare,
public sector, media, utilities etc. This huge
incremental growth opportunity will favour a
global business solutions delivery model
vis-à-vis current offshore mindset.
Aditya Birla Minacs will continue to meet
customers’ expectations with a thrust on
excellence in execution. It will focus on achieving
profitability by building a robust sales pipeline,
improving seats utilisation, off-shoring support
functions to low cost locations, increasing share
of high margin KPO segment and reduction in
overheads. Its global footprint, its capabilities
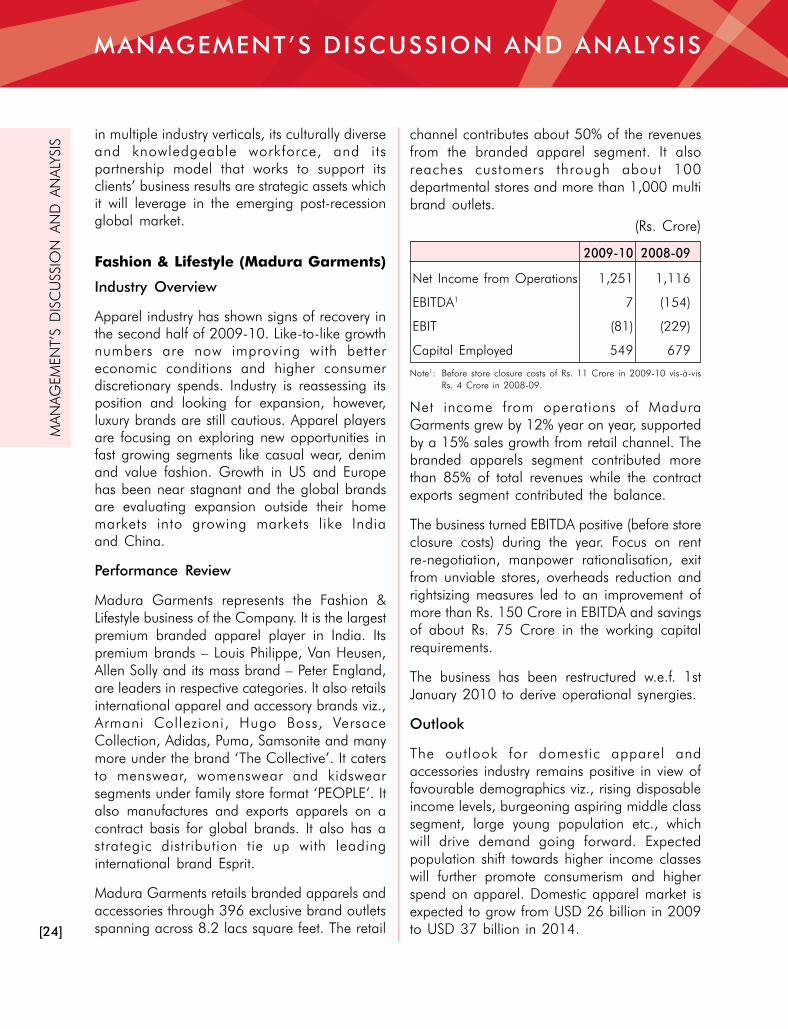
MANAGEMENT’S DISCUSSION AND ANALYSIS
[24]
MA
NA
GEM
EN
T’S D
ISC
USSIO
N A
ND
A
NA
LYSIS
in multiple industry verticals, its culturally diverse
and knowledgeable workforce, and its
partnership model that works to support its
clients’ business results are strategic assets which
it will leverage in the emerging post-recession
global market.
Fashion & Lifestyle (Madura Garments)
Industry Overview
Apparel industry has shown signs of recovery in
the second half of 2009-10. Like-to-like growth
numbers are now improving with better
economic conditions and higher consumer
discretionary spends. Industry is reassessing its
position and looking for expansion, however,
luxury brands are still cautious. Apparel players
are focusing on exploring new opportunities in
fast growing segments like casual wear, denim
and value fashion. Growth in US and Europe
has been near stagnant and the global brands
are evaluating expansion outside their home
markets into growing markets like India
and China.
Performance Review
Madura Garments represents the Fashion &
Lifestyle business of the Company. It is the largest
premium branded apparel player in India. Its
premium brands – Louis Philippe, Van Heusen,
Allen Solly and its mass brand – Peter England,
are leaders in respective categories. It also retails
international apparel and accessory brands viz.,
Armani Collezioni, Hugo Boss, Versace
Collection, Adidas, Puma, Samsonite and many
more under the brand ‘The Collective’. It caters
to menswear, womenswear and kidswear
segments under family store format ‘PEOPLE’. It
also manufactures and exports apparels on a
contract basis for global brands. It also has a
strategic distribution tie up with leading
international brand Esprit.
Madura Garments retails branded apparels and
accessories through 396 exclusive brand outlets
spanning across 8.2 lacs square feet. The retail
channel contributes about 50% of the revenues
from the branded apparel segment. It also
reaches customers through about 100
departmental stores and more than 1,000 multi
brand outlets.
(Rs. Crore)
2009-10 2008-09
Net Income from Operations 1,251 1,116
EBITDA1
7 (154)
EBIT (81) (229)
Capital Employed 549 679
Note1
: Before store closure costs of Rs. 11 Crore in 2009-10 vis-à-vis
Rs. 4 Crore in 2008-09.
Net income from operations of Madura
Garments grew by 12% year on year, supported
by a 15% sales growth from retail channel. The
branded apparels segment contributed more
than 85% of total revenues while the contract
exports segment contributed the balance.
The business turned EBITDA positive (before store
closure costs) during the year. Focus on rent
re-negotiation, manpower rationalisation, exit
from unviable stores, overheads reduction and
rightsizing measures led to an improvement of
more than Rs. 150 Crore in EBITDA and savings
of about Rs. 75 Crore in the working capital
requirements.
The business has been restructured w.e.f. 1st
January 2010 to derive operational synergies.
Outlook
The outlook for domestic apparel and
accessories industry remains positive in view of
favourable demographics viz., rising disposable
income levels, burgeoning aspiring middle class
segment, large young population etc., which
will drive demand going forward. Expected
population shift towards higher income classes
will further promote consumerism and higher
spend on apparel. Domestic apparel market is
expected to grow from USD 26 billion in 2009
to USD 37 billion in 2014.

MANAGEMENT’S DISCUSSION AND ANALYSIS
[25]
MA
NA
GEM
EN
T’S D
ISC
USSIO
N A
ND
A
NA
LYSIS
The Fashion & Lifestyle business of the Company
will leverage its expanded retail channel to
achieve improved sales per square feet. The
business is also focusing on achieving cost
efficiencies through exiting from unviable stores,
manpower rationalisation, increasing supply
chain management efficiency, reducing
overheads and better working capital
management. Besides this, new store openings
will be re-aligned to match the demand
scenario.
Manufacturing Businesses
The manufacturing businesses of the Company
comprise Carbon Black, Agri-business,
Insulators, Rayon and Textiles. All the
manufacturing businesses are among the leaders
in their respective sectors in terms of size as
well as margins. They have an outstanding track
record of consistently generating strong cash
flows, operating margins and return on capital
employed.
Collectively, they have posted their highest ever
EBITDA at Rs. 748 Crore vis-à-vis Rs. 578 Crore
in the previous year – a year on year growth of
29%. They have also achieved the highest ever
operating margin at 20% and return on average
capital employed (“ROACE”) at 27%.
Carbon Black (Hi-Tech Carbon)
Industry Overview
Carbon Black is a black powder which is used
to provide tensile strength and abrasion
resistance to rubber. The tyre industry accounts
for about 65% of carbon black demand in India.
It constitutes ~28% of tyre by weight. The
demand for carbon black is largely linked to
the demand scenario in the tyre industry. Indian
tyre industry achieved 15% year on year growth
during April 2009 to February 2010 led by
revival in demand from the domestic auto sector
coupled with good replacement demand. To
tap buoyant demand from tyre sector, domestic
carbon black manufacturer Phillips Carbon Black
Ltd. (“PCBL”) expanded its capacity by 90,000
MTPA and Himadri Chemicals and Industries
Limited by 50,000 MTPA during the year.
Hi-Tech Carbon, the carbon black business of
the Company, has also expanded its capacity
by 85,000 MTPA recently in May 2010 end.
PCBL and Hi-Tech Carbon are the leaders
accounting for ~42% and ~38% of total
production in India during 2009-10.
Performance Review
Hi-Tech Carbon, the second largest manufacturer
in India, achieved 13% increase in sales
volumes. However, realisation was lower by 8%
reflecting movement in raw material [Carbon
Black Feed Stock (“CBFS”)] prices in line with
crude oil prices. Net income from operations
grew by 6% to Rs. 1,161 Crore.
(Rs. Crore)
2009-10 2008-09
Capacity (MTPA) 230,000 230,000
Production (MT) 233,370 202,076
Sales Volumes (MT) 230,195 203,827
Realisation (Rs./MT) 46,824 51,117
Net Income from Operations 1,161 1,096
EBITDA 253 50
EBIT 227 25
Capital Employed 942 753
ROACE (%) 27% 3%
EBITDA of Hi-tech Carbon grew from Rs. 50
Crore to Rs. 253 Crore supported by higher
sales volumes and energy sales. Higher
profitability during part of the year is reflective
more of one time input price advantage.
Revenues from sale of power and steam grew
from Rs. 43 Crore to Rs. 73 Crore. The business
posted ROACE of 27%. During previous
financial year 2008-09, profitability was
impacted due to consumption of high priced
CBFS and lower sales volumes given the
demand slowdown in auto/tyre sector.
Power plant of 10 MW capacity has been
commissioned in March 2010 at Renukoot.

MANAGEMENT’S DISCUSSION AND ANALYSIS
[26]
MA
NA
GEM
EN
T’S D
ISC
USSIO
N A
ND
A
NA
LYSIS
Power plant of 23 MW capacity has also been
set up at Patalganga in May 2010 end along
with the Greenfield expansion. This has
increased the total Carbon Black capacity from
230,000 MTPA to 315,000 MTPA and installed
power plant capacity to ~75 MW.
Hi-Tech Carbon is planning to augment its
capacity further by 85,000 MTPA at Patalganga
in the second phase besides 85,000 MTPA
expansion in the Southern India.
Outlook
The demand from the tyre industry is expected
to grow by 13%-14% on account of continued
recovery in demand from auto industry and
improvement in the replacement market which
accounts for 60%-70% of overall tyre demand.
Many new projects have been announced by
leading domestic and international tyre
manufacturers such as Michelin, MRF, JK tyres
and Apollo in southern India over next two years.
Government has also imposed anti-dumping
duty ranging from USD 84 per MT to USD 423
per MT on import of carbon black from various
countries to support domestic carbon black
industry.
With its planned 170,000 MT capacity
expansion, Hi-tech Carbon is well positioned to
tap the demand growth and improve its market
share.
Agri-business (Indo-Gulf Fertilisers)
Industry Overview
The Indian agricultural sector registered a growth
of 0.2% in 2009-10 as against a growth of
1.6% in 2008-09 as a consequence of sub-
normal rainfall. While Kharif season saw drop
in production of key crops like rice and oilseeds
due to scanty rainfall, Rabi season witnessed
an increase in the sowing of wheat and maize
crops with favourable weather condition. The
demand for Agricultural inputs viz., Fertilisers,
Seeds and Agro-chemicals, was under pressure
in Kharif, but got picked up in Rabi. The overall
Urea consumption remained flat at 26.5 million
MT in 2009-10. Imports accounted for more
than 20% of total domestic consumption of urea.
The Government of India has announced
Nutrient Based Subsidy policy for all fertilisers
w.e.f. 1st April 2010 in which the retail price of
Urea was increased from Rs. 4,830 per MT to
Rs. 5,310 per MT (Source: Department of
Fertilizers).
(Rs. Crore)
2009-10 2008-09
Re-assessed Capacity (MTPA) 864,600 864,600
Urea Production (MT) 1,097,705 1,069,691
Urea Sales (MT) 1,105,715 1,072,891
Net Income from Operations 1,022 1,250
Urea 968 1,135
Agri-products Trading 53 115
EBITDA 155 228
EBIT 136 210
Capital Employed 300 587
ROACE (%) 31% 38%
Performance Review
Indo-Gulf fertilisers, the agri-business of the
Company, achieved its highest ever production
and sales volumes led by higher per day
productivity. Neem–coated urea, which fetches
higher realisation by Rs. 241.5 per MT,
accounted for 20% of total production as
maximum permitted by the government
regulations. Indo-Gulf was also conferred
Runners up Award for Best Production
performance of Nitrogenous Fertiliser–2009
from Fertiliser Association of India.
Net income from operations de-grew by 18%
despite higher sales volumes mainly because
higher input/fuel (Natural Gas/Naphtha) prices
prevailing during the previous financial year
2008-09 were reflected in higher subsidies in
the last year. Revenues were also lower to
the extent of lower subsidy arrears received in
2009-10 and lower revenue from agri-products
trading.

MANAGEMENT’S DISCUSSION AND ANALYSIS
[27]
MA
NA
GEM
EN
T’S D
ISC
USSIO
N A
ND
A
NA
LYSIS
EBITDA de-grew to Rs. 155 Crore largely to the
extent of lower subsidy arrears and lower Import
Parity Price (”IPP”) linked incentive accrued in
2009-10 compared to the previous year.
Indo-Gulf earned Rs. 3 Crore from sale of
carbon credits. It posted ROACE of 31%.
‘Birla Shaktiman’ Urea continues to maintain its
leadership position among the private players
in the target markets of Uttar Pradesh,
Bihar, Jharkhand and West Bengal with a
market share between 10%-20% (Source:
Department of Fertilizers). Indo-Gulf also
markets seeds and agro-chemicals in an effort
to provide complete agri-solutions to the farmers.
Indo-Gulf ranks second best among the
Indian fertiliser plants and best among the same
vintage fertiliser plants in terms of specific
energy consumption, a key cost driver for the
fertilisers business.
Outlook
The per hectare consumption of fertilisers in
nutrient terms has increased from 106 Kg. in
2005-06 to 129 Kg. in 2008-09 but it is still
lower as compared to other countries like China
and US (Source: Indian economic survey
2009-10). The marginal productivity of soil also
remains a challenge. This requires increased
and proper use of N-P-K (Nitrogen-Phosphorus-
Potassium) application based on soil analysis.
Besides, the recent government policies intend
to encourage indigenous production and reduce
subsidy burden by decreasing imports. The
outlook for the fertilisers industry continues to
be positive.
In the Nutrient Based Subsidy policy, recently
announced by the Government, all the fertilisers
other than Urea have been decontrolled. This
change involves shifting from a fixed retail price
and variable subsidy mechanism to a fixed
subsidy and variable retail price system. This is
a path breaking move, which will enable the
industry to offer value added customised
products to the Indian farmers, to meet their
total nutrient needs in a balanced manner.
Indo-Gulf is evaluating viability of setting up a
manufacturing facility for producing the
customised fertilisers. Indo-Gulf has a unique
geographical advantage of being based in the
Indo-gangetic plains. With a strong brand equity
and market reach, it is well positioned to capture
an increasing share of this growing market.
Rayon (Indian Rayon)
Industry Overview
Indian Viscose Filament Yarn industry witnessed
a production of 42,678 MT in 2009-10 which
remained flat compared to the previous financial
year 2008-09. Out of total sales volumes of
42,401 MT, about 13% was exported. With the
lower wood-pulp and sulphur prices during
2009-10, the margins of VFY manufacturers
improved. Century Textiles and Industries Limited
is the largest manufacture in India with 42%
production share in 2009-10, followed by Indian
Rayon, the VFY business of the Company, with
39% production share. For the fifth year in a
row, Indian Rayon became the largest VFY
exporter from India with 47% share in exports
in 2009-10.
(Rs. Crore)
2009-10 2008-09
VFY Capacity (MTPA) 16,400 16,400
VFY Production (MT) 16,759 16,625
VFY Sales Volumes (MT) 16,616 16,792
VFY Realisation (Rs./Kg.) 223 204
Caustic Soda Capacity (MTPA) 91,250 91,250
Caustic Soda Production (MT) 88,250 78,574
Caustic Soda Sales Volumes (MT) 88,897 77,590
ECU Realisation (Rs./MT.) 18,328 22,671
Net Income from Operations 538 537
VFY 371 342
Chemicals 167 195
EBITDA 155 123
EBIT 120 90
Capital Employed 430 437
ROACE (%) 28% 20%

MANAGEMENT’S DISCUSSION AND ANALYSIS
[28]
MA
NA
GEM
EN
T’S D
ISC
USSIO
N A
ND
A
NA
LYSIS
Performance Review
Net income from operations of the VFY segment
of Indian Rayon grew by 8% to Rs. 371 Crore
led by 10% rise in VFY realisation. Caustic soda
sales volumes grew by 15% to 88,897 MT
supported by 9,125 MTPA capacity expansion
in December 2008. ECU realisation de-grew
by 19% to Rs. 18,328 per MT due to lower
caustic soda prices. Net income from operations
from Chemicals segment de-grew by 14% to
Rs. 167 Crore largely due to lower ECU
realisation.
Indian Rayon achieved its highest ever EBITDA
at Rs. 155 Crore led by higher VFY realisation
and lower wood–pulp and sulphur prices,
absorbing impact of lower ECU realisation in
the chemical segment. ROACE improved from
20% to 28%.
Outlook
The long-term outlook of VFY business is moderate,
as demand is expected to grow at a modest rate.
Besides increasing share of value added yarns,
Indian Rayon will lay thrust on technological
upgradations to improve the intrinsic yarn quality.
These efforts will help the business to provide
superior customer value, to fetch a premium
and improve margins. The Company is also
planning to expand the caustic soda capacity
by 45,625 MTPA at a cost of Rs. 150 Crore.
Insulators (Aditya Birla Insulators)
Industry Overview
Insulators are used in power generation,
transmission and distribution and by original
equipment manufacturers. The growth of
insulators industry is linked to the growth of the
power sector. Power sector has achieved 66%
of targeted capacity addition of 14,500 MW
during 2009-10. This is 3 times capacity added
in the previous financial year [Source: Central
Electricity Authority (“CEA”), www.cea.nic.in].
Domestic insulators Industry witnessed lower
demand and slowing down of projects during
the first half of 2009-10 due to lower capacity
additions. It faced realisation pressure due to
increased competition. However, in the second
half, project activities gained momentum and
demand for insulators also spurred.
Performance Review
Aditya Birla Insulators, the insulators business of
the Company, is India’s largest and world’s fourth
largest manufacturer of insulators. It has
expanded its capacity in the transmission segment
by about 10,000 MTPA in first half of 2009-10
to reach a total capacity of 48,760 MTPA.
(Rs. Crore)
2009-10 2008-09
Capacity (MTPA) 48,760 38,800
Production (MT) 36,063 32,904
Sales Volumes (MT) 37,050 32,561
Net Income from Operations 428 425
EBITDA 116 123
EBIT 98 108
Capital Employed 294 264
ROACE (%) 35% 43%
Aditya Birla Insulators achieved highest ever
volumes led by capacity expansion and improved
yield. Domestic volumes grew by 20%, however,
realisation remained under pressure due to
increased competition. Exports volumes
were lower by 13%. Net income from
operations marginally grew to Rs. 428 Crore.
EBITDA was lower by 6% at Rs. 116 Crore.
During the first half year, profitability was
impacted due to lower realisation. In the second
half year, though realisation remained under
pressure, profitability improved over last year,
driven by expansion led higher volumes. The
business achieved ROACE of 35%.
Outlook
The demand for energy in India exceeds its supply
especially in the rural sector. The peak supply
shortage in India was 12.2% and energy

MANAGEMENT’S DISCUSSION AND ANALYSIS
[29]
MA
NA
GEM
EN
T’S D
ISC
USSIO
N A
ND
A
NA
LYSIS
deficit was 11.3% as of March 2010
(Source: CEA). The Government of India plans
to provide electricity throughout the country by
2012 and plans to increase installed power
generation capacity by 78,700 MW in its 11th
Five-Year Plan (2007-2012) (Source: Ministry of
Power, Annual Report 2009-10). The expansion
of India’s power infrastructure is expected to
increase demand for electrical equipments and
components including insulators.
To capitalise on the vibrant demand in the power
infrastructure sector, Aditya Birla Insulators will
focus on full utilisation of the recently expanded
capacity. Thrust will also be on yield
enhancement and manufacturing high rating
insulators range.
Textiles (Jaya Shree Textiles)
Industry Overview
Domestic demand is expected to remain buoyant
but the sluggishness continues in major overseas
markets. Volatility in major currencies like US
Dollar, Great Britain Pound, Euro and Australian
Dollar has made business decisions very
complex. Acquiring profitable customers and
improving margins will remain the key for
survival. Imposition of anti dumping duty by the
Government on import of linen fabric was a
move in the right direction and provided relief
to the domestic industry. Additional incentives,
if provided by the Government, will help the
industry in overseas territories.
Performance Review
Jaya Shree Textiles, the textiles business of the
Company, displayed strong resilience and
achieved its highest ever profitability supported
by low input prices, improved margins, cost
containment measures, prudent working capital
management and benign interest rates. Eleven
exclusive outlets of Linen Fabric were rolled out
under the buy and sell mode without incurring
any capital expenditure taking such stores count
to a total of 32.
(Rs. Crore)
2009-10 2008-09
Net Income from Operations 577 573
Linen Segment 215 183
Wool Segment 362 390
EBITDA 69 54
EBIT 47 33
Capital Employed 281 345
ROACE (%) 15% 9%
Net income from operations of Jaya Shree Textiles
grew marginally to Rs. 577 Crore. Linen yarn
witnessed robust demand leading to increase in
volumes. In wool segment, higher share of
commission combing reflected in lower
revenues.
Jaya Shree Textiles achieved its highest ever
EBITDA at Rs. 69 Crore led by higher linen
yarn volumes, lower flax fibre prices and
improved plant efficiency. In the previous
financial year 2008-09, wool segment was also
impacted by usage of high priced stock due to
sudden fall in commodity prices.
Outlook
The outlook of the textiles business remains
positive in view of stronger domestic demand
led by favourable viz., rising disposable income
levels, burgeoning aspiring middle class
segment, large young population etc. Gradual
global recovery will further support the business.
However, rising wool prices remain a matter of
concern.
Jaya Shree Textiles will focus on increasing share
of high margin retail segment through roll
out of more exclusive showrooms of Linen Fabric.

MANAGEMENT’S DISCUSSION AND ANALYSIS
[30]
MA
NA
GEM
EN
T’S D
ISC
USSIO
N A
ND
A
NA
LYSIS
Financial Review and Analysis
Standalone Profit and Loss Account
(Rs. Crore)
2009-10 2008-09
Net Income from Operations 4,827 4,786
EBITDA 835 619
Interest Expenses 334 291
EBDT 500 328
Depreciation 180 166
Earnings before Tax 320 162
Provision for Taxation (Net) 37 25
Net Profit 283 137
The standalone net income from operations of
the Company marginally grew to Rs. 4,827
Crore. Revenues have grown across all the
businesses except Agri-business where high
natural gas and naphtha prices prevailing during
the previous financial year 2008-09 were
reflected in higher subsidies in the last year.
The Company has achieved highest ever
standalone EBITDA which grew by 35% from
Rs. 619 Crore to Rs. 835 Crore. The Carbon
Black business was the largest contributor to
the year on year growth in profitability followed
by the Fashion & Lifestyle, Rayon and Textiles
businesses. Fertilisers business posted lower
EBITDA largely to the extent of higher subsidy
arrears and IPP gain accrued in the previous
financial year 2008-09. Insulators business has
achieved highest ever sales volume but the
realisation remained under pressure due to
increased competition.
In the previous financial year 2008-09, debt
had increased in the later half year to fund
investment requirement in the financial services
business and higher working capital requirement
predominantly in the Carbon Black and the
Fashion & Lifestyle businesses. The annualised
impact of the increased debt reflected in
2009-10. However, supported by improved
earnings and equity infusion by promoters, a
large part of the increased debt was repaid.
Depreciation grew largely due to new store
openings in the Fashion & Lifestyle business.
Improved profitability absorbed the increase in
interest and depreciation.
As a result, net profit of the Company doubled
from Rs. 137 Crore to Rs. 283 Crore.
Dividend
The Board of Directors of the Company has
recommended a final dividend of 50% for
2009-10 entailing a total outgo of Rs. 60 Crore
including dividend distribution tax.
Standalone Balance Sheet (Rs. Crore)
2009-10 2008-09
Net Worth 4,662 4,122
Total Debts 3,636 4,499
Deferred Tax Liabilities 178 180
Capital Employed 8,476 8,801
Net Block 1,815 1,605
Net Working Capital 1,045 1,356
Long Term Investments 5,436 4,982
Cash Surplus1
180 857
Book Value (Rs.) 453 434
Net Debt / EBITDA (x) 4.1 5.9
Net Debt / Equity (x) 0.7 0.9
Note 1
: Includes cash, cheques in hand, remittances in transit, balances with banks, fertilisers bonds and current investments.

MANAGEMENT’S DISCUSSION AND ANALYSIS
[31]
MA
NA
GEM
EN
T’S D
ISC
USSIO
N A
ND
A
NA
LYSIS
Standalone Cash Flow Analysis (Rs. Crore)
2009-10
Cash Flow from Operations (Net of Tax) 725
(Increase)/Decrease in Net Working Capital 329
Net Cash from Operating Activities 1,054
Capital Expenditure (Net) (256)
Investments in Subsidiaries/Joint Ventures/Associates (Net) (591)
(Increase)/Decrease in Inter-Corporate Deposits (Net) 42
Interest Received 52
Dividends/Profit on Sale of Current Investments 16
Net Cash from/(used in) Investing Activities (737)
Proceeds from/(Repayment of) Borrowings (Net) (1,189)
Proceeds from Issue of Equity Shares/Warrants to Promoters 575
Dividend Paid (42)
Interest Paid (341)
Net Cash from/(used in) Financing Activities (997)
Cash Acquired on Composite Scheme of Arrangement 1
Increase (Decrease) in Cash Surplus1
(678)
Note1
: Includes cash, cheques in hand, remittances in transit, balances with banks, fertilisers bonds and current investments.
Net Cash from Operating activities
Cash Flow from Operations
Net cash flow from operations stood at Rs. 725
Crore. The Carbon Black business contributed
significantly to the operating cash flows followed
by the Rayon business.
Working Capital
Net working capital decreased by Rs. 329 Crore.
Debtors and other receivables decreased by more
than Rs. 250 Crore while inventory increased by
Rs. 87 Crore against an increase of Rs. 165
Crore in creditors and other current liabilities.
Net Cash from/(used in) Investing Activities
Capital Expenditure
The Carbon Black business incurred a sum of
Rs. 155 Crore during 2009-10 for the
Greenfield expansion by 85,000 MTPA and
setting up of 23 MW power plant at Patalganga
which were completed in end May 2010. It has
also incurred a sum of Rs. 20 Crore for setting
up of 10 MW power plant at Renukoot.
The Fashion & Lifestyle business invested a sum
of Rs. 10 Crore for expansion of retail channel
through opening up of exclusive brand outlets.
The Insulators business spent a sum of Rs. 25
Crore in 2009-10 out of which a sum of Rs. 7
Crore was incurred in 2009-10 towards the
completion of capacity expansion by about
10,000 MTPA and a sum of Rs. 8 Crore was
spent for new pug mill and shaping machine
for process and yield improvement at Halol.
The balance capital expenditure was incurred
on modernisation and maintenance of plants
across the businesses.
Investments
The Company invested a sum of Rs. 333 Crore
in Birla Sun Life Insurance Company Ltd. to

MANAGEMENT’S DISCUSSION AND ANALYSIS
[32]
MA
NA
GEM
EN
T’S D
ISC
USSIO
N A
ND
A
NA
LYSIS
fund the growth of the business. It has also
invested Rs. 508 Crore in its wholly owned
subsidiary Aditya Birla Financial Services Private
Ltd. (“ABFSPL”).
The Company has transferred its investments in
Birla Sun Life Asset Management Company Ltd.,
Aditya Birla Money Ltd. and part of its
investments in Aditya Birla Finance Ltd. to
ABFSPL for Rs. 290 Crore.
Other major investments include purchase of
preference shares to the tune of Rs. 25 Crore in
Aditya Birla Finance Ltd.
Net Cash from/(used in) Financing Activities
The Company has received a sum of Rs. 575
Crore through preferential allotment to
promoters.
Proceeds/Repayment of Borrowings
The Company raised long-term loan
aggregating to Rs. 140 Crore by way of foreign
currency borrowings and Rs. 200 Crore by way
of Non-Convertible Debentures.
Term Loan aggregating to Rs. 428 Crore and
Commercial papers aggregating to Rs. 900
Crore (net) were repaid.
Risk Management
Governance, Risk Management and
Compliance processes form an integral part of
the Company’s planning and review mechanism.
The Company’s risk management framework
establishes risk management processes at each
business, helping in identifying, assessing and
mitigating risks that could materially impact the
Company’s performance in achieving its stated
objectives. The components of risk management
are different for different businesses and are
defined by various factors including the business
model, business strategy, organisational
structure, risk appetite and available dedicated
resources.
The Company’s structured Risk Management
process provides confidence to the stakeholders
that the Company’s risks are known and well
managed. The risk management framework
ensures compliance with the requirements of
amended Clause 49 of listing agreement.
Since the Company is a diversified
conglomerate, the risk events are identified,
assessed, mitigated and monitored for each
business separately.
The risk management approach comprises three
key components:
(1) Risk identification: External and internal
risk events which could affect the profitability
and/or image of the Company are identified
in the context of the strategy and specific
objectives of each individual business. These
risk events are assessed by senior
management team of the respective
businesses on defined criteria and prioritised
for development of risk mitigation plans.
(2) Risk mitigation: This step comprises
developing of a mitigation plan for the risks
identified and prioritising them.
(3) Risk monitoring and assurance: The Risk
Management Committee (“RMC”) is the
apex body taking all the decisions regarding
risk management activities. The overall role
of RMC is to review risk management
process and implementation and
effectiveness of risk mitigation plans. The
committee comprising of two independent
directors, managing director, business heads
and whole-time directors. The Board of
Directors reviews risk management processes
after such processes have been vetted by
the Audit Committee.
Business Risks
Business risks are classified into Strategic,
Operations, Financial and Knowledge risks,
which are further drilled down to market
structure, process, systems, legal compliance,
corporate governance and people culture.
Apart from the internal business risks, the
Company is exposed to external risks on account

MANAGEMENT’S DISCUSSION AND ANALYSIS
[33]
MA
NA
GEM
EN
T’S D
ISC
USSIO
N A
ND
A
NA
LYSIS
of interest rate, foreign exchange, commodity
pricing and regulatory changes, which are being
effectively monitored and mitigated.
Foreign Exchange Risk
The Company is exposed to fluctuations in
exchange rates of various foreign currencies due
to revenues earned or expenditure incurred in
such currencies. Additionally, the debt portfolio
of the Company includes a mix of foreign
currency loans, which carry risk of movement in
exchange rates of foreign currencies against
Indian Rupee. The Company uses appropriate
hedging tools such as forward contracts,
currency swap etc., to hedge foreign exchange
risk in accordance with its foreign exchange
risk management policy.
Interest Rate Risk
The Company has a mixed basket of fixed
and floating rate borrowings. It continuously
monitors its interest rate exposure to have a
proper mix of fixed and floating rate borrowings
in order to mitigate interest rate risk. The
Company also uses interest rate swap in case
of foreign currency borrowings having floating
interest rates.
Commodity Price Risk
The Company is exposed to the risk of
fluctuation in prices of raw materials as well as
finished goods in all its products. However, the
risk is mitigated well considering the inventory
levels and normal correlation in the price of
raw materials and finished goods.
Internal Control System
The Company has adequate internal control
systems for business processes across various
profit and cost centres, with regard to efficiency
of operations, financial reporting, compliance with
applicable laws and regulations, etc. The Internal
control system is supplemented by extensive audits
conducted by the Corporate Audit Cell.
Clearly defined roles and responsibilities for all
managerial positions have been institutionalised.
Regular internal audits and checks ensure that
responsibilities are executed effectively. The Audit
Committee of the Board of Directors actively
reviews the adequacy and effectiveness of the
internal control systems and suggests improvements.
The Management Information System is the
backbone of the Company’s control mechanism.
All operating parameters are monitored and
controlled regularly. Any material change in the
business outlook is reported to the Board of
Directors. Material deviations from the annual
planning and budgeting, if any, are reported
on a quarterly basis to the Board of Directors.
An effective budgetary control on all capital
expenditure ensures that actual spending is in
line with the capital budget.
Human Resource Management
The Company had more than 14,000
employees on its rolls as on 31st March, 2010.
Including its subsidiaries and joint ventures, the
manpower strength is just over 50,000
employees. This intellectual resource is integral
to the Company’s ongoing operations and
enables it to deliver superior performance year
after year. Human Resource processes of the
Company have been covered in depth in the
Director’s Report.
To Sum Up
The Company’s thrust on profitable growth
across all the businesses has led to a remarkable
turnaround in the reported financial year. The
Company, being a large eco-system as a
conglomerate, is well positioned to capitalise
on growth opportunities available across the
wide spectrum of Indian economy and deliver
significant value to the customers by offering
diversified services and products. A strong
balance sheet, an experienced and focused
management team, a salient brand equity,
leadership positions across businesses and a
talented human asset are the key drivers which
will support future growth of the Company and
create value for all the stakeholders.

MANAGEMENT’S DISCUSSION AND ANALYSIS
[34]
MA
NA
GEM
EN
T’S D
ISC
USSIO
N A
ND
A
NA
LYSIS
Disclaimer
Certain statements in this “Management’s
Discussion and Analysis” may not be based on
historical information or facts and may be
“forward looking statements” within the meaning
of applicable securities laws and regulations,
including, but not limited to, those relating to
general business plans and strategy of the
Company, its future outlook and growth prospects,
future development in its businesses, its
competitive and regulatory environment and
management’s current views and assumptions
which may not remain constant due to risks and
uncertainties. Actual results could differ materially
from those expressed or implied. Important factors
that could make a difference to the Company’s
operations include global and Indian demand
supply conditions, finished goods prices, feed
stocks availability and prices, cyclical demand
and pricing in the Company’s principal markets,
changes in Government regulations, tax regimes,
competitors actions, economic developments
within India and the countries within which the
Company conducts businesses and other factors
such as litigation and labour negotiations. The
Company assume no responsibility to publicly
amend, modify or revise any statements, on the
basis of any subsequent development, information
or events, or otherwise. The “Management
Discussion and Analysis” does not constitute a
prospectus, offering circular or offering
memorandum or an offer to acquire any shares
and should not be considered as a
recommendation that any investors should
subscribe for or purchase any of the Company’s
shares. The financial figures have been rounded
off to the nearest Rupee one Crore.

CO
RPO
RATE G
OVERN
AN
CE REPO
RT
[35]
Governance Philosophy
The Aditya Birla Group is committed to the
adoption of best governance practices and its
adherence in the true spirit, at all times. Our
governance practices are a product of self-desire,
reflecting the culture of the trusteeship that is deeply
ingrained in our value system and reflected in our
strategic thought process. At a macro level, our
governance philosophy rests on five basic tenets, viz.,
Board accountability to the Company and
shareholders, strategic guidance and effective
monitoring by the Board, protection of minority
interests and rights, equitable treatment of all
shareholders as well as superior transparency and
timely disclosure.
In line with this philosophy, Aditya Birla Nuvo
Limited, one of the flagship companies of the Aditya
Birla Group, is striving for excellence through
adoption of best governance and disclosure
practices. The Company, as a continuous process,
strengthens the quality of disclosures, on the Board
composition and its functioning, remunerations paid
and level of compliance with various Corporate
Governance Codes.
Compliance with Corporate Governance
Guidelines
The Company is compliant with the requirements
of the prevailing and applicable corporate
governance code, save and except as mentioned in
the report below, and is committed to ensure
compliance with any proposals for modifications
well ahead of their implementation timelines.
Your Company’s compliance with requirements
is presented in the subsequent sections of
this Report.
I. BOARD OF DIRECTORS
(A) Composition of the Board:
The Company has a balanced Board,
comprising Executive and Non-Executive
Directors which includes independent
professionals. During the year, Mr. Adesh
Gupta, Whole-time Director & Chief
Financial Officer (CFO), resigned as Director
& CFO of the Company. Dr. Bharat K. Singh,
Managing Director of the Company, ceased
to act as a Director of the Company
consequent to his retirement w.e.f. 30th June,
2009 and Dr. Rakesh Jain was appointed as
Managing Director in his place.
None of the Directors is a Director in more
than 15 companies and Member of more
than 10 Committees or a Chairman of more
than five Committees, across all companies
in which he/she is a Director. The Non-
Executive Directors are appointed or re-
appointed with the approval of shareholders.
All the Directors are liable to retire by
rotation except the Whole-time Directors and
Managing Director whose term has been
determined pursuant to the terms and
conditions of their appointment. The Non-
Executive Directors including Independent
Director on the Board are experienced,
competent and highly renowned persons from
their respective fields.
The details of the Directors with regards to
the outside Indian directorships (other than
Section 25 Companies), positions in either
Audit Committee or Shareholders’/Investors’
Grievance Committee as well as attendance
at Board Meeting/Annual General Meeting
(AGM) are as follows:
Director Category No. of Outside Outside Committee No. of Board Attended
Directorship(s) Held Positions Held1
Meetings Last
AGM
Public Private Member Chairman/ Held Attended
Chairperson
Mr. Kumar Mangalam Birla Non-Executive 9 13 — — 5 5 No
Mrs. Rajashree Birla Non-Executive 6 12 1 — 5 3 No
Mr. H. J. Vaidya* Independent — — — — 5 4 Yes
Mr. B. L. Shah Non-Executive 2 1 — — 5 5 Yes
CORPORATE GOVERNANCE REPORT

CO
RPO
RATE G
OVERN
AN
CE REPO
RT
[36]
Mr. P. Murari Independent 10 — 5 1 5 4 No
Mr. B. R. Gupta Independent 4 — — 3 5 5 No
Ms. Tarjani Vakil Independent 6 2 5 3 5 5 Yes
Mr. S. C. Bhargava Independent 11 1 4 1 5 5 No
Mr. G. P. Gupta Independent 10 3 4 5 5 5 No
Dr. Bharat K. Singh** Managing Director — — — — 2 2 NA
Dr. Rakesh Jain*** Managing Director 5 — 1 — 5 5 Yes
Mr. K.K. Maheshwari@
Whole-time Director 3 1 2 2 5 4 Yes
Mr. Adesh Gupta $
Whole-time — — — — 1 1 NA
Director & CFO
Mr. Pranab Barua %
Whole-time Director 5 1 1 — 4 3 No
Mr. Arun Maira #
Independent — — — — 2 2 No
1 Only two Committees, viz., Audit Committee and Shareholders’/Investors’ Grievance Committee are considered.
Director Category No. of Outside Outside Committee No. of Board Attended
Directorship(s) Held Positions Held1
Meetings Last
AGM
Public Private Member Chairman/ Held Attended
Chairperson
*
upto 1st April, 2010
**
upto 30th June, 2009
***
w.e.f. 1st July, 2009
@
upto 20th
May, 2010
$
upto 28th April, 2009
%
w.e.f. 1st
May, 2009
#
upto 23rd July, 2009
(C) Other Provisions as to Board and
Committees:
The Company’s Board of Directors play
primary role in ensuring good governance
and functioning of the Company. Board’s
role, functions, responsibility and
accountability are well defined. All relevant
information is regularly placed before the
Board. Board reviews compliance reports
of all laws as applicable to the Company,
as well as steps taken by the Company to
rectify instances of non-compliances, if any.
Members of the Board have complete
freedom to express their opinion, and
decisions are taken after detailed discussion.
Details of Board meetings held during
the FY 2009-2010 are as outlined below:
Date of Board Meeting City No. of Directors Present
28th April, 2009 Mumbai 14 out of 14
18th May, 2009 Mumbai 10 out of 14
29th July, 2009 Mumbai 11 out of 12
30th October, 2009 Mumbai 11 out of 12
29th January, 2010 Mumbai 10 out of 12
(B) Non-Executive Directors’ Compensation
and Disclosure:
Sitting fees for attending meeting of Board/
Committee is paid as per the provisions of
the Articles of Association of the Company/
Companies Act, 1956. Commission paid
to the Non-Executive Directors is decided
by the Board of Directors within the limits
approved by the shareholders. Details of
sitting fees/compensation paid to such
Directors are given separately in this section
of Annual Report.
CORPORATE GOVERNANCE REPORT

CO
RPO
RATE G
OVERN
AN
CE REPO
RT
[37]
(D) Code of Conduct:
The Board of Directors has laid down a
Code of Conduct (copy available on
Company’s website), applicable to all Board
Members and Senior Executives of the
Company. All the Board Members and
Senior Management Personnel have
confirmed compliance with the code. A
declaration by Managing Director affirming
the compliance of the Code of Conduct by
Board Members and Senior Management
Executives is annexed at the end of the
Report.
II. Audit Committee
(A) Qualified Independent Audit
Committee:
The Company has an Audit Committee at
the Board level with powers and role that
are in accordance with Clause 49 of the
Listing Agreement. The Committee acts as
a link between the management, the
statutory and internal auditors and the Board
of Directors, and oversees the financial,
reporting process. All the members of the
Company’s Audit Committee are Independent
Directors.
(B) Meetings of the Audit Committee:
The Managing Director and the CFO of
the Company are permanent invitees to the
meetings of the Committee. The statutory
as well as internal auditors of the Company
are also invited to the Audit Committee
meetings. The Company Secretary acts as
Secretary to the Committee.
During the year, the Audit Committee met
9 times to deliberate on various matters
and details of the attendance of the
Committee members are as follows:
Director Served in Past as No. of No. of
Meetings Meetings
Held Attended
Ms. Tarjani Vakil, Chairperson and Managing 9 9
Chairperson Director of Exim Bank
Mr. P. Murari Secretary to the President of India 9 7
before retiring from service in September
1992. He has held several key positions
in various institutions and professional bodies
Mr. B. R. Gupta Executive Director (Investments) of Life 9 7
Insurance Corporation of India
Mr. G. P. Gupta Chairman of Industrial Development
Bank of India and Chairman of
Unit Trust of India 9 9
The Scope of the functioning of the Audit
Committee is to review, from time to time, the
internal control procedures, the accounting
policies of the Company, oversight of the
Company’s financial reporting process to
ensure that the financial statement is correct,
sufficient and credible, and also such other
functions as may be recommended from time
to time by SEBI, Stock Exchanges and/or under
the Companies Act, 1956, which inter-alia
include the following:
1. Management Discussion and Analysis
of financial condition and results of
operations;
2. Statement of significant related party
transactions submitted by the
management;
3. Management letters/letters of internal
control weaknesses issued by the
statutory auditors;
4. Internal audit reports relating to internal
control weaknesses; and the
appointment, removal and terms of
remuneration of the Chief Internal
Auditor; and
5. Risk Framework.
CORPORATE GOVERNANCE REPORT

CO
RPO
RATE G
OVERN
AN
CE REPO
RT
[38]
Other Committees:
The names of other Committee(s), brief terms of reference and number of meetings held during the year
are as under:
Name of the Date of Members Terms of Reference No. of
Committee Constitution Meetings
Held in
2009-10
Risk Management 29th
July, 2006 Ms. Tarjani Vakil To review risk management Held on 3rd
Committee Mr. G. P. Gupta process and implementation September, 2009,
Dr. Bharat K. Singh #
and effectiveness of risk 27th November,
Dr. Rakesh Jain mitigation plans. 2009; and
Mr. K. K. Maheshwari 31st March, 2010
Mr. Adesh Gupta@
Mr. Ajay Srinivasan +
Dr. Santrupt Misra +
Mr. Pranab Barua
ESOS Compensation 7th
December, Mr. Kumar Mangalam Birla Formulating ESOS No meetings held
Committee 2006 Mr. H. J. Vaidya* Scheme, its during the year
Mr. B. R. Gupta implementation,
Mr. G. P. Gupta$
administration and
supervision and
formulating detailed
terms and conditions
in accordance with
relevant SEBI Guidelines
#
upto 30th June, 2010.
@
upto 28th April, 2009.
+
Business Directors
*
upto 1st April, 2010.
$
w.e.f. 7th
May, 2010
III. Subsidiary Companies
The Company has one material non-listed Indian
Subsidiary Company, namely, Birla Sun Life
Insurance Company Limited (BSLICL). The
Audit Committee reviews the financial statements
and investments made by unlisted subsidiary
companies. The minutes of the Board meetings
as well as statements of all significant
transactions of the unlisted subsidiary companies
are placed regularly before the Board of
Directors for their review.
Mr. G. P. Gupta and Ms. Tarjani Vakil and
Mr. P. Murari, Independent Directors of the
Company, are also Directors of BSLICL.
IV. Disclosures
(A) Basis of the Related Party Transactions:
All the related party transactions are strictly
done on arm’s length basis. The Company
places all the relevant details relating to
related party transactions before the Audit
Committee from time to time. Particulars of
related party transactions are listed out in
Schedule 20 of the Balance Sheet forming
part of the Annual Report.
CORPORATE GOVERNANCE REPORT

CO
RPO
RATE G
OVERN
AN
CE REPO
RT
[39]
(B) Disclosure of The Accounting Treatment:
The Company has followed all relevant
Accounting Standards while preparing the
financial statements.
(C) Risk Management:
The Company has developed comprehensive
risk management policy, and it is reviewed
by the Audit Committee, which in turn,
informs the Board about the risk assessment
and minimization procedures.
With a view to strengthen the risk
management framework and to continuously
review the risks that the businesses of the
Company are confronted with, the Board of
Directors has constituted a Risk Management
Committee comprising of the Whole-time
Directors including the Managing Director,
Business heads and two Independent
Directors viz. Ms. Tarjani Vakil and Mr. G. P.
Gupta.
The Committee reviews the risk management
process and implementation of risk
mitigation plans. This process is improved
year after year.
(D) Proceeds from Public Issues, Right Issues,
Preferential Issues, etc.:
The Company discloses to the Audit
Committee, the uses/applications of
proceeds/funds raised from right issue,
preferential issue, etc., as part of the
quarterly review of the financial results.
(E) Remuneration of Directors:
The Company has a system where all the
directors or senior management of the
Company are required to disclose
all pecuniary relationship or transactions
with the Company. No significant
material transactions have been made with
the non-executive directors vis-à-vis the
Company.
Besides sitting fees of Rs. 20,000/- per
meeting of the Board or Committee thereof,
the Company also pays commission to the
non-executive directors.
For the F.Y. 2009-10, considering the
financial performance of the Company, the
Board has decided to pay commission
(Previous Year: Nil), not exceeding 1% of
the net profits of the Company, to the non-
executive directors of the Company pursuant
to the authority given by the Shareholders
at the Annual General Meeting of the
Company held on 9th July, 2008. The
amount of commission payable is
determined after assigning weightage to
attendance, type of meeting and
preparations required.
Name of Director Salary and Perquisites Performance- Sitting Fees
Fixed Allowance & Other linked Income/ Paid
Benefits Bonus Paid/
Commission
Payable
Whole-time Directors
Dr. Bharat K. Singh #
63,46,983 96,677 71,10,000 —
Dr. Rakesh Jain 3,06,23,445 53,51,509 92,50,000 —
Mr. K. K. Maheshwari 2,50,05,900 15,59,870 1,03,16,000 —
Mr. Pranab Barua 2,76,50,371 26,80,963 — —
Mr. Adesh Gupta #
10,54,150 39,225 37,12,000 —
CORPORATE GOVERNANCE REPORT

CO
RPO
RATE G
OVERN
AN
CE REPO
RT
[40]
Name of Director Salary and Perquisites Performance/ Sitting Fees
Fixed Allowance & Other linked Income/ Paid
Benefits Bonus Paid/
Commission
Payable
Others
Mr. Kumar Mangalam Birla — — 1,37,26,000 1,00,000
Mrs. Rajashree Birla — — 2,95,000 60,000
Mr. H. J. Vaidya — — 2,59,000 1,40,000
Mr. B. L. Shah — — 70,000 1,60,000
Mr. P. Murari — — 1,21,000 2,40,000
Mr. B. R. Gupta — — 1,32,000 2,40,000
Ms. Tarjani Vakil — — 1,60,000 3,40,000
Mr. S. C. Bhargava — — 64,000 1,00,000
Mr. G. P. Gupta — — 1,60,000 3,40,000
Mr. Arun Maira — — 13,000 20,000
# Remuneration relates to the part of the year.
Notes:
1. No Director is related to any other Director on the Board, except for Mr. Kumar Mangalam Birla
and Mrs. Rajashree Birla, who are son and mother respectively.
2. The Company has a policy of not advancing any loans to its Directors except to Executive Directors
in the course of normal employment.
3. The appointment of Executive Directors is subject to termination by three months notice in writing by
either side. Mr. K. K. Maheshwari, Mr. Pranab Barua and Dr. Rakesh Jain were appointed for five
years w.e.f. 1st October, 2005, 1
st May, 2009 and 1
st July, 2009 respectively.
4. There is no severance fees paid to any Director of the Company.
5. The Performance System is primarily based on competencies and values. The Company closely
monitors growth and development of top talent in the Company to align personal aspirations with
the organisation purpose.
Employee Stock Option Scheme - 2006
In accordance with applicable SEBI Guidelines, ESOS
Compensation Committee of the Board of Directors
of the Company, on 23rdAugust, 2007, granted
1,63,280 Stock Options at a price of Rs. 1,180/-
per share (1st Tranche) and on 25
thJanuary, 2008,
granted 1,66,093 stock options at a price of
Rs. 1,802/- per share (2nd
Tranche) to the eligible
employees including Whole-time Directors. Each
option is convertible into one equity share of the
Company upon vesting/exercise. The exercise price
of the option has been determined in accordance
with relevant SEBI Guidelines. (Refer Annexure ‘B’
to the Directors’ Report).
CORPORATE GOVERNANCE REPORT

CO
RPO
RATE G
OVERN
AN
CE REPO
RT
[41]
Details of Stock Options granted to the Directors are as under:
1st Tranche 2nd Tranche
Name of Director No. of Vesting Date/% Exercise No. of Vesting Date/% Exercise
Options Period Options Period
Granted (Within) Granted (Within)
Mr. K. K. Maheshwari@
20,200 23.08.08 (25%) 22.08.2013 43,400 25.01.09 (25%) 24.01.2014
23.08.09 (25%) 22.08.2014 25.01.10 (25%) 24.01.2015
Dr. Rakesh Jain 13,470 23.08.10 (25%) 22.08.2015 — 25.01.11 (25%) 24.01.2016
23.08.11 (25%) 22.08.2016 25.01.12 (25%) 24.01.2017
@
upto 20th
May 2010.
During the year, none of the Directors have exercised their options which have been vested under the term of grant
of options.
Details of shareholding of Non-Executive Directors in the Company as on 31st March, 2010,
are as follows:
Director No. of Shares Held @
Mr. Kumar Mangalam Birla* 4,609
Mrs. Rajashree Birla 1,27,634
Mr. H. J. Vaidya 3,500
Ms. Tarjani Vakil 177
Mr. S. C. Bhargava 233
Mr. G. P. Gupta 339
* Excluding 150 shares held as Karta of H.U.F.
@
Considered only shares held singly or as first shareholder.
(F) Management:
The Management Discussion and Analysis
Report is prepared in accordance with the
requirements laid out in Clause 49 of the
Listing Agreement and forms part of this
Annual Report.
No material transaction has been entered
into by the Company with the Promoters,
Directors or the Management, their
subsidiaries or relatives, etc., that may have
a potential conflict with interests of the
Company.
(G) Shareholders:
The Company has provided the details of
new Directors/Directors seeking re-
appointment in the Annual General Meeting
Notice attached with this Annual Report.
Quarterly Presentations on the Company
results are available on the website of the
Company (www.adityabirlanuvo.com) and
the Aditya Birla Group website
(www.adityabirla.com). The hard and soft
copies are also sent to concerned stock
exchanges simultaneously so as to enable
them to put them on their notice board/
website.
CORPORATE GOVERNANCE REPORT

CO
RPO
RATE G
OVERN
AN
CE REPO
RT
[42]
Shareholders’ Grievances Committee:
The Company has an “Investor Relations and
Finance Committee” comprising of Mr. P. Murari,
Mr. B. L. Shah and Dr. Rakesh Jain as the
members. Mr. P. Murari is the Chairman of the
Committee. The Committee looks into various
issues relating to shareholders including transfer
and transmission of shares as well as non-receipt
of dividend, Annual Report, shares after transfers
and delays in transfer of shares. In addition, the
Committee looks into other issues including
status of dematerialisation/rematerialisation of
shares as well as systems and procedures
followed to track investor complaints and,
suggests measures for improvement from time
to time.
During the year, under review, the Committee
met thrice to deliberate on various matters referred
above.
Details of attendance of Directors for the
Committee meetings held during 2009-10 are
as follows:
Name of Director Non-Executive/Independent No. of Meetings
Held Attended
Mr. P. Murari Independent 3 1
Mr. H. J. Vaidya* Independent 3 3
Mr. B. L. Shah Non-Executive 3 3
Dr. Bharat K. Singh** Executive 1 1
Dr. Rakesh Jain Executive 2 2
* upto 1st
April, 2010
** upto 30th
June, 2010
Consequent to retirement of Dr. Bharat K. Singh
and appointment of Dr. Rakesh Jain as
Managing Director in his place, Dr. Rakesh Jain
has been appointed as member of the above
committee in place of Dr. Bharat K. Singh.
The Company Secretary acts as Secretary to the
Committee. He is the compliance officer of the
Company and is also responsible for redressal
of investor complaints.
The Company’s shares are compulsorily traded
and delivered in the dematerialised form in all
Stock Exchanges. To expedite the transfer in the
physical segment, necessary authority has been
delegated to officers, to transfer upto 5000
shares under one transfer deed. Details of share
transfers/transmission approved by the officers
are placed before the Committee from time to
time.
Details of complaints received, number of shares
transferred during the year, time taken for
effecting these transfers and the number of share
transfers are given in the Shareholder
Information section of this Annual Report.
V. CEO/ CFO certification
The CEO and CFO certification of the financial
statements and the cash flow statement for the
year are enclosed separately at the end of this
Report.
VI. Report on Corporate Governance
A separate section on Corporate Governance
forms part of the Annual Report. Certificate from
the Statutory Auditors confirming compliance with
the conditions of Corporate Governance as
stipulated in Clause 49 of the Listing Agreement
of the Stock Exchanges in India, also forms part
of this Annual Report.
CORPORATE GOVERNANCE REPORT

CO
RPO
RATE G
OVERN
AN
CE REPO
RT
[43]
VII. General Body Meetings
Details of Annual General Meetings:
Location and time, where Annual General Meetings (AGMs) and Extra Ordinary General Meeting
(EOGMs) in the last three years were held:
Year AGM Location Date Time
2009-10 AGM Regd. Office, Veraval, Gujarat 10th July, 2009 11:00 A.M.
2008-09 EOGM Regd. Office, Veraval, Gujarat 17th June , 2009 11:00 A.M.
2007-08 AGM Regd. Office Veraval, Gujarat 9th July, 2008 11:00 A.M.
2007-08 EOGM Regd. Office, Veraval, Gujarat 6th February, 2008 11:00 A.M.
2006-07 AGM Regd. Office Veraval, Gujarat 1st August, 2007 11:00 A.M.
Apart from the above AGM/EOGMs held during
the year, a Court Convened Meeting of Equity
Shareholders was held on Saturday, the 19th
day of December, 2009, at 11.00 a.m. for the
purpose of approving with or without
modification(s), the arrangement embodied in
the Composite Scheme of Arrangement between
Aditya Birla Nuvo Limited and Madura Garments
Exports Limited and MG Lifestyle Clothing
Company Private Limited and Peter England
Fashions and Retail Limited and their respective
shareholders and creditors.
All the following special resolutions set out in
the respective Notices for AGMs & EOGMs held
in the last three years were passed by the
Shareholders:
Date of Section(s) Particulars of Special Resolution
AGM/EOGM
01.08.2007 198, 269, 309, 314 Approving the appointment of Dr. Bharat K. Singh as the
Managing Director of the Company for a period of two years
w.e.f. 1st November, 2006.
01.08.2007 198, 269, 309, 314 Approving the re-designation of Mr. Vikram Rao as the
Whole-time Director of the Company for a period of five years
w.e.f. 1st November, 2006.
06.02.2008 81(1A) Approving the issue and allotment of 2,05,00,000 Warrants to
Promoter and/or Promoter Group of the Company on a
preferential basis
09.07.2008 198, 309 Approving the payment to the non-executive directors of the
Company, in addition to sitting fees and reimbursement of
expenses for attending the meetings of the Board or Committees
thereof, commission on annual profits for a period of four years
commencing from 1st
April, 2008 for an amount not exceeding
1% of net profits of the Company.
09.07.2008 259 Approving amendment in Article 95 of Articles of Association
for increasing the number of Directors from 15 to 18.
17.06.2009 81(1A) Approving the issue and allotment of 1,85,00,000 Warrants to
Promoter and/or Promoter Group of the Company on a
preferential basis.
10.07.2009 198, 269, 309, 314 Approving the appointment of Mr. Pranab Barua as the
Whole-time Director of the Company for a period of five years
w.e.f. 1st May, 2009.
10.07.2009 198, 269 and 309 Approving the appointment of Dr. Rakesh Jain as the Managing
Director of the Company for a period of five years w.e.f.
1st July, 2009.
CORPORATE GOVERNANCE REPORT

CO
RPO
RATE G
OVERN
AN
CE REPO
RT
[44]
Postal Ballot
During the year, no resolution was passed through postal ballot by the shareholders.
Any special resolution which is required to be conducted through postal ballot will be conducted as per
prevailing law.
MEANS OF COMMUNICATION
Quarterly Results:
Newspaper in which normally Financial Results are published:
Newspaper Cities of Publication
Business Standard Ahmedabad, Bangalore, Chennai, Hyderabad, Kolkata, Mumbai and New Delhi
Financial Express Ahmedabad, Bangalore, Chandigarh, Chennai, Mumbai, Kochi, Kolkata and
New Delhi
The Economic Times Mumbai, Ahmedabad
Website, where displayed the information : www.adityabirlanuvo.com
www.adityabirla.com
Whether it also displays official news releases : Yes
Presentations made to investors/analysts : Yes
General Shareholder Information : Published as a separate section
in this Report.
Status of Compliance of Non Mandatory
requirement:
1) The Company maintains a separate office
for the Non-Executive Chairman. All
necessary infrastructure and assistance are
made available to enable him to discharge
his responsibilities effectively.
2) The Company does not have a
Remuneration Committee except for ESOP.
The remuneration of the Managing/Whole-
time Directors is fixed by the Board of
Directors and the Shareholders.
3) Performance update consisting of financial
and operational performance for the first
six months of the financial year is sent to
the shareholders.
4) During the period, under review, there is
no audit qualification in the financial
statement. The Company continues to adopt
best practices to ensure unqualified financial
statements.
5) The Company has established a policy for
employees to report to the management
concerns about unethical behaviours, actual
or suspected fraud or violation of the
Company’s Code of Conduct or ethics.
Voluntary Guidelines – 2009:
The Ministry of Corporate Affairs has issued a
set of Voluntary Guidelines on ‘Corporate
Governance’ and ‘Corporate Social
Responsibility ’ in December 2009. These
guidelines are expected to serve as a benchmark
for the Corporate Sector and also help them in
achieving the highest standard of corporate
governance.
Some of the provisions of these guidelines are
already in place as reported elsewhere in
this Report. The other provisions of these
guidelines are being evaluated, and your
Company will strive to adopt the same in a
phased manner.
CORPORATE GOVERNANCE REPORT

CO
RPO
RATE G
OVERN
AN
CE REPO
RT
[45]
CEO/CFO CERTIFICATION
The Managing Director and the CFO heading the Finance function have certified to the Board that:
1. They have reviewed the financial results of Aditya Birla Nuvo Limited for the period ended 31st March
2010 and to the best of their knowledge and belief:
I. These statements do not contain any materially untrue statement or omit any material fact or
contain statement that might be misleading;
II. These statements together present a true and fair view of the Company’s affairs and are in
compliance with the existing accounting standards, applicable laws and regulations.
2. There are, to the best of their knowledge and belief, no transactions entered into by the Company
during the quarter which are fraudulent, illegal or violative of the Company’s Code of Conduct;
3. They accept responsibility for establishing and maintaining internal controls for financial reporting and
they have evaluated the effectiveness of the internal control systems of the Company pertaining to
financial reporting and they have disclosed to the Auditors and the Audit Committee, deficiencies in the
design or operation of internal controls, if any, of which they are aware and the steps they have taken
or proposed to be taken to rectify the deficiencies.
4. They have indicated to the Auditors and the Audit Committee:
I. Significant changes in the Company’s internal control over financial reporting during the quarter.
II. Significant changes in accounting policies during the quarter and
III. Instances of significant fraud of which they have become aware and involvement therein if any of
the management or other employees having a significant role in the Company’s internal control
system over financial reporting.
Place : Mumbai Sushil Agarwal Dr. Rakesh Jain
Date : May 7, 2010 Chief Financial Officer Managing Director
DECLARATION
As provided under Clause 49 of the Listing Agreement with the Stock Exchange(s), I hereby declare that all
the Board Members and Senior Management personnel of the Company have affirmed the compliance with
the Code of Conduct for the year ended 31st March, 2010.
Place: Mumbai Dr. Rakesh Jain
Date: May 7, 2010 Managing Director
CORPORATE GOVERNANCE REPORT

CO
RPO
RATE G
OVERN
AN
CE REPO
RT
[46]
Persons constituting group coming within the definition of “group” for the purpose of Regulation 3 (1)(e)(i) of
the Securities and Exchange Board of India (Substantial Acquisition of Shares and Takeovers) Regulations,
1997, include the following :
Shri Kumar Mangalam Birla
Smt. Rajashree Birla
Smt. Neerja Birla
Master Aryaman Vikram Birla
Birla Group Holdings Private Limited
BGH Exim Limited
Birla TMT Holdings Private Limited
Chaturbhuj Enterprises LLP
Essel Mining & Industries Limited
Global Holdings Private Limited
Gwalior Properties And Estates Private Limited
Heritage Housing Finance Limited
IGH Holdings Private Limited
Infocyber India Private Limited
Mangalam Services Limited
Naman Finance And Investment Private Limited
Rajratna Holdings Private Limited
Seshasayee Properties Private Limited
Siddhipriya Enterprises LLP
Shuban Enterprises LLP
TGS Investment And Trade Private Limited
Trapti Trading And Investments Private Limited
Turquoise Investments And Finance Private Limited
Umang Commercial Company Limited
Vinayaka Enterprises LLP
Vighnahara Enterprises LLP
Vaibhav Holdings Private Limited

IN
CLU
SIVE G
RO
WTH
[47]
SUSTAINABLE DEVELOPMENT : INCLUSIVE GROWTH
Corporate Social Responsibility Policy
For us in the Aditya Birla Group, reaching out to
underserved communities is part of our DNA. We
believe in the trusteeship concept. This entails
transcending business interests and grappling with
the “quality of life” challenges that underserved
communities face, and working towards making a
meaningful difference to them.
Our vision is - “to actively contribute to the social
and economic development of the communities in
which we operate. In so doing build a better,
sustainable way of life for the weaker sections of
society and raise the country’s human development
index” (Mrs. Rajashree Birla, Chairperson, Aditya
Birla Centre for Community Initiatives and Rural
Development).
Implementation process: Identification of
projects
All projects are identified in a participatory manner,
in consultation with the community, literally sitting
with them and gauging their basic needs. We
recourse to the participatory rural appraisal mapping
process. Subsequently, based on a consensus and
in discussion with the village panchayats, and other
influentials, projects are prioritized.
Arising from this the focus areas that have emerged
are Education, Health care, Sustainable livelihood,
Infrastructure development, and espousing social
causes. All of our community projects are carried
out under the aegis of The Aditya Birla Centre for
Community Initiatives and Rural Development.
In Education, our endeavour is to spark the desire
for learning and knowledge at every stage through
• Formal schools • Balwadis for elementary
education • Quality primary education • Aditya Bal
Vidya Mandirs • Girl child education • Adult
education programmes.
In Health care our goal is to render quality health
care facilities to people living in the villages and
elsewhere through our Hospitals. • Primary health
care centres • Mother and Child care projects •
Immunization programmes with a thrust on polio
eradication • Health care for visually impaired, and
physically challenged • Preventive health through
awareness programmes.
In Sustainable Livelihood our programmes aim at
providing livelihood in a locally appropriate and
environmentally sustainable manner through •
Formation of Self Help Groups for women
empowerment • Vocational training through Aditya
Birla Rural Technology Parks • Agriculture
development and better farmer focus • Watershed
development • Partnership with Industrial Training
Institutes.
In Infrastructure Development we endeavour to
set up essential services that form the foundation of
sustainable development through • Basic
infrastructure facilities • Housing facilities • Safe
drinking water • Sanitation & hygiene • Renewable
sources of energy.
To bring about Social Change, we advocate and
support • Dowryless marriage • Widow remarriage
• Awareness programmes on anti social issues •
De-addiction campaigns and programmes •
Espousing basic moral values.
(Mrs. Rajashree Birla, Chairperson, Aditya Birla
Centre for Community Initiatives and Rural
Development).
Our vision is - “to actively contribute
to the social and economic
development of the communities
in which we operate. In so doing
build a better, sustainable way of life
for the weaker sections of society
and raise the country’s human
development index”

SUSTAINABLE DEVELOPMENT : INCLUSIVE GROWTHIN
CLU
SIVE G
RO
WTH
[48]
Activities, setting measurable targets with
timeframes and performance management.
Prior to the commencement of projects, we carry
out a baseline study of the villages. The study
encompasses various parameters such as – health
indicators, literacy levels, sustainable livelihood
processes, population data - below the poverty line
and above the poverty line, state of infrastructure,
among others. From the data generated, a 1-year
plan and a 5-year rolling plan are developed for
the holistic and integrated development of the
marginalized. These plans are presented at the
Annual Planning and Budgeting meet. All projects
are assessed under the agreed strategy, and are
monitored every quarter, measured against targets
and budgets. Wherever necessary, midcourse
corrections are affected.
Organizational mechanism and responsibilities
The Aditya Birla Centre for Community Initiatives
and Rural Development provides the vision under
the leadership of its Chairperson, Mrs. Rajashree
Birla. This vision underlines all CSR activities. Every
Manufacturing Unit has a CSR Cell. Every Company
has a CSR Head, who reports to the Group Executive
President (Communications & CSR) at the Centre.
At the Company, the Business Director takes on the
role of the mentor, while the onus for the successful
and time bound implementation of the projects is
on the various Unit Presidents and CSR teams. To
measure the impact of the work done, a social
satisfaction survey / audit is carried out by an external
agency.
Partnerships
Collaborative partnerships are formed with the
Government, the District Authorities, the village
panchayats, NGOs and other like-minded
stakeholders. This helps widen the Company’s reach
and leverage upon the collective expertise, wisdom
and experience that these partnerships bring to the
table.
In collaboration with FICCI, we have set up Aditya
Birla CSR Centre for Excellence to make CSR an
integral part of corporate culture.
The Company engages with well established and
recognized programs and national platforms such
as the CII, FICCI, ASSOCHAM to name a few,
given their commitment to inclusive growth.
Budgets
A specific budget is allocated for CSR activities. This
budget is project driven.
Information dissemination
The Company’s engagement in this domain is
disseminated on its website, Annual Reports, its house
journals and through the media.
Management Commitment
Our Board of Directors, our Management and all
of our employees subscribe to the philosophy of
compassionate care. We believe and act on an ethos
of generosity and compassion, characterized by a
willingness to build a society that works for everyone.
This is the cornerstone of our CSR policy.
Our Corporate Social Responsibility policy conforms
to the Corporate Social Responsibility Voluntary
Guidelines spelt out by the Ministry of Corporate
Affairs, Government of India in collaboration with
FICCI (2009).

IN
CLU
SIVE G
RO
WTH
[49]
SUSTAINABLE DEVELOPMENT : INCLUSIVE GROWTH
TOWARDS INCLUSIVE GROWTH
A snapshot of your Company’s work :-
Your Company’s CSR activities extend to 1,082 villages, in proximity to its plants, across the country.
Health Care
• At the rural medical camps organized for general health check-
ups 42,382 villagers were examined. Those afflicted with serious
ailments were taken to the company’s hospitals for treatment.
• Intra Ocular lens surgery benefited 1,488 cataract patients at
Veraval, Jagdishpur and Renukoot.
• The Company’s skin care centre at Jagdishpur attended to 9,000
patients.
• More than 5,000 truck drivers, their helpers and migrant workers
were sensitized to the dangers of HIV/AIDS.
Mother and Child Care
• We administered 3.9 lakh polio doses to children at Hi Tech
Carbon, Gummidipoondi; Indian Rayon, Veraval; Indo Gulf
Fertilizers, Jagdishpur; Hi Tech Carbon, Renukoot; Jayashree
Textiles, Rishra and Aditya Birla Insulators, Halol.
• More than 885 couples have opted for planned families and
responsible parenting at Veraval.
• Over 5.3 lakh expectant mothers were provided pre and post
natal care at Indo Gulf Fertilizers, Jagdishpur.
• Nearly 3 lakh children were immunized against tuberculosis,
diphtheria, tetanus and measles.
Education
• Your company supports the education of the girl child. This year
we were able to persuade the parents of 725 girls who had
dropped out from their schools in the villages to get back to their
studies. These girls have since been enlisted at the 8 Kasturba
Gandhi Balika Vidyalaya supported by us.
• At the Aditya Birla Primary School (Renukoot), 160 tribal children
receive free education.
• Uniforms, books and bags have been distributed to 3,641 children
in rural areas in proximity to our plants.
• At Gummidipoondi and Veraval, 200 students were trained in
Office Applications (MS Office and Tally).
• Adult education centres at Gummidipoondi, Veraval and
Jagdishpur continue to provide informal education to 217 adult women.
• At Jagdishpur the talent search program has proved extremely popular. This year 1,227 students
participated in it.

SUSTAINABLE DEVELOPMENT : INCLUSIVE GROWTHIN
CLU
SIVE G
RO
WTH
[50]
Safe drinking water and sanitation
• The Safe Drinking Water Project implemented through the
installation of the reverse osmosis plant in 14 Government Primary
and High Schools in Tamil Nadu, 9,547 children now have access
to clean water.
• More than 244 hand-pumps were installed at your Company’s
plants.
• The “Nirmal Gram Puraskar Award” (2009-10), a prestigious
National award has been conferred upon S. R. Khangittai (Tamil
Nadu), our model village.
• Over 200 individual household toilets were constructed in
Papamkuppam and S. R. Khangittai (Tamil Nadu).
• Sanitary vending machines in six Government Secondary Schools installed by us at Gummidipoondi,
have resulted in increased attendance of girls at the schools.
Infrastructure
• To conserve water and support agriculture, 67 ponds, check dams and bore-wells were constructed.
• At Jagdishpur, the renovation of 110 Government Primary Schools and facilitating the setting up of the
mid-day meal kitchen at Veraval has attracted more children to the schools.
• The installation of 59 solar lamps at schools in Renukoot has been a boon to students.
• A community hall at Gummidipoondi, community health centres at Renukoot and Rishra and a 75,000
litre overhead tank at Veraval with adequate pipelines to the villages, have provided a welcome relief in
these critical areas.
Sustainable livelihood
• At Jagdishpur, 43 students trained at the Birla Shaktiman
Vocational Training Centre, this year have become entrepreneurs.
Alongside, 30 leprosy cured patients have been rehabilitated.
They have been integrated into the mainstream. All of them have
taken to different trades to eke out a sustainable livelihood.
Elsewhere in Bangalore, Gummidipoondi and Jagdishpur over
110 women trained by us have set up tailoring and zardosi
embroidery and provision stores.
• To promote sustainable agriculture at Veraval, 17 farmer interest
groups covering 160 farmers have been formed through a robust
linkage with the Agriculture Technology Management Agency
(ATMA). At Renukoot 150 farmers have been trained in modern
agricultural practices.
• We linked 7,500 women through 500 Self Help Groups this year in our efforts towards women
empowerment. This initiative has been undertaken at all of your Company’s Units.
In all of our work, our goal is to bring in inclusive growth, collaborating with the Government and other
stakeholders.

[51]
SUSTAINABLE DEVELOPMENT :
ENVIRONMENT RESPONSIBILITY
EN
VIRO
NM
EN
T RESPO
NSIBILITY
The chal lenges that the world faces on
environment conservation, are indeed alarming.
Just to highlight a few – climate change, the
severity of droughts and floods, their impact on
rain fed agriculture, the emission of greenhouse
gases and our ability to pursue sustainable
development. We in India are no exception to
these issues. Environment conservation and
sustainable development are continuously on your
Company’s radar. Hence these are integrated into
its business strategies as well as its efforts towards
fostering inclusive growth through its rural
development and community initiatives.
Your Company’s plants – the Rayon Plant at Veraval,
Jaya Shree Textiles at Rishra, the Carbon Black Plants
at Renukoot and Gummidipoondi and Insulator
Plants at Rishra and Halol are all ISO 14000 EMS
certified. Your Company’s plants have also received
the OHSAS 18001 Certification for Safety
Management Systems and are SA 8000 certified for
Social Accountability Standards.
An in-depth environmental audit is conducted at
your Company’s plants by professional Environment
Auditors, The Central Salt and Marine Chemical
Institute (Bhavnagar) – a Gujarat Pollution Control
Board recognized Institute, GITCO-Ahmedabad and
the Bureau of Indian Standards. Their Audit Reports
validate our commitment to environment
conservation. Additionally, trained environment
systems auditors conduct periodic checks.
Your Company’s Rayon Division is the only private
Unit in the Saurastra Region (Gujarat) to operate its
Marine pipeline independently. It is also the first in
Viscose Filament Yarn and Caustic Soda
manufacturing industries to adopt long term solutions
for Waste Water Management.
To monitor the treatment of effluent quality at all
times the latest version of online pH meter and
magnetic flow meter were installed.The Rayon Unit
is now recovering the sodium sulphate and zinc
from the effluent water which reduces the water
pollution load. Its Caustic Division is reckoned as a

[52]
EN
VIRO
NM
EN
T RESPO
NSIBILITY
SUSTAINABLE DEVELOPMENT :
ENVIRONMENT RESPONSIBILITY
benchmark plant with the lowest rate of solid waste
per ton of production and specific power
consumption. This year onwards e-waste is being
sold to Eco Recyclers Limited, Mumbai which has
been approved by the Maharashtra Pollution Control
Board, Mumbai for scientific disposal.
At your Company’s Insulators Plant (Rishra, Kolkata),
the entire cooling water used for the different heat
exchangers is recycled. The cooling water passes
through a closed loop with a cooling tower in a
manner which ensures that the entire water is
reusable.
Dual burners in kilns suitable for LPG and as well
as coal gas have been introduced. Earlier kerosene
oil was used for firing the kiln, LPG is a much
cleaner fuel as it reduces the pollution level in the
environment. Eco friendly bamboo is gradually
replacing wood for packing the insulators as a better
option seeing its durability and lifecycle. Sludge
generated from the effluent treatment plant is
recycled and sold to the cottage industries and as
raw materials of low tension insulators industries.
Jayashree Textiles (Rishra) continues to receive
Carbon Credits for its energy efficiency improvement
projects registered under the UNFCC’s Clean
Development Mechanism projects.
At Hi-Tech Carbon Division Carbon in
Gummidipoondi, an additional settling pond has
been made for filtering storm and the Plant’s waste
water for reuse in gardening and cleaning activities.
Several initiatives have been launched towards
reducing electricity consumption by totally
overhauling the lighting system at the Plant and in
the colony.
At your Company’s Fertilisers Division, innovative
mechanisms for environment protection are well in
place. Process optimization, water conservation
projects and using recycled treated effluent has
substantially lowered the plant’s water consumption.
The Plant’s water consumption level is comparable
to world class Urea fertilizer plants globally. Indo
Gulf Fertilisers is constantly earning carbon credits
from its CDM (Clean Development Mechanism)
projects.
Rain water harvesting continues to be a priority area
for us. Water bodies in the catchment areas for
rainwater storage and ground water recharging have
been set up.
The greenbelt at our plants is simply awesome.
Thousands of trees line our plants. At Veraval, the
greenbelt covers more than 50% of the industrial
complex. In most Plants, palm trees dot the horizon.
At some points, you cannot even see the skyline.
Only the leaves and the flowers and hear the
cacophony of the birds. When you walk through this
wooded ambience, you can never imagine that there
would be a plant in the midst of nature.
Our Board, our Management and all of our
colleagues are committed to living in harmony with
nature.

SH
AREH
OLD
ERS’ IN
FO
RM
ATIO
N
[53]
SHAREHOLDERS’ INFORMATION
1. Annual General Meeting
Date and Time : 6th August, 2010, at 11.00 a.m.
Venue : Registered Office
Indian Rayon Compound
Veraval - 362 266
Gujarat, India
2. Financial Calendar
Financial reporting for the quarter ending June 30, 2010 : End July 2010
Financial reporting for the half year ending September 30, 2010 : End October 2010
Financial reporting for the quarter ending December 31, 2010 : End January 2011
Financial reporting for the year ending March 31, 2011 : End April 2011
Annual General Meeting for the year ended March 31, 2011 : June/July 2011
3. Dates of Book Closure : 31st July, 2010 to 6
th August, 2010
(both days inclusive)
4. Dividend Payment Date : 2nd
or 3rd week of August 2010
5a. Registered Office : Indian Rayon Compound
Veraval – 362 266
Gujarat, India
Tel: (02876) 245711/248495
Fax: (02876) 243220
Email:[email protected]
5b. Websites : http://www.adityabirlanuvo.com
http://www.adityabirla.com
6a. Listing on Stock Exchanges at:
Equity Shares Global Depository Receipts (GDRs)
Bombay Stock Exchange Limited Luxembourge Stock Exchange Undertaking
Phiroze Jeejeebhoy Towers Societe de la Bourse de Luxembourg
Dalal Street L-2011, Luxembourg
Mumbai – 400 001
National Stock Exchange of India Ltd.
”Exchange Plaza, ”Plot No. C/1, G – Block
Bandra-Kurla Complex, Bandra (East)
Mumbai – 400 051
Note: Listing Fees has been paid to all the Stock Exchanges as per their schedule.
6b. Stock Code:
Stock Code Reuters Bloomberg
Bombay Stock Exchange 500303 ABRL.BO ABNL IN
National Stock Exchange ABIRLANUVO ABRL.NS NABNL IN
Global Depository Receipts (GDRs) IRYN.LU IRIG LX
ISIN of Equity Shares INE069A01017
ISIN of GDRs US0070271137

SH
AREH
OLD
ERS’ IN
FO
RM
ATIO
N
[54]
SHAREHOLDERS’ INFORMATION
6c. Overseas Depository for GDRs : Citibank N.A.
Depository Receipts
388 Greenwich Street
NEW YORK, NY – 10013, USA
Phone: 001212-657-8782
Fax: 212/825-5398
6d. Domestic Custodian of GDRs : ICICI Bank Limited
Securities Market Services,
F7/E7 1st Floor,
Empire Complex,
414, Senapati Bapat Marg,
Lower Parel,
Mumbai - 400 013
Phone: (+91-22) 66672000
Fax: (+91-22) 66672779/40
7. Stock Price Data:
Year/ Bombay Stock Exchange Limited National Stock Exchange Luxembourg
Month Stock Exchange
High Low Close Av. High Low Close Av. High Low Close
Volume Volume
(In Rs.) (In Nos.) (In Rs.) (In Nos.) (In US$)
2009
April 627.65 441.05 528.10 52449.88 626.65 440.05 526.10 191793.88 20.23 18.24 20.23
May 956.50 500.00 928.10 79654.65 954.00 503.90 929.45 272787.75 18.76 17.35 18.24
June 1035.00 846.00 861.70 39114.36 1030.00 853.50 865.50 158192.27 21.19 18.18 18.33
July 920.00 725.10 875.15 33893.70 942.00 650.10 874.70 120879.17 19.59 18.04 18.85
August 1043.00 831.00 1006.40 104261.10 1043.80 829.05 1004.35 305487.05 18.72 16.32 17.94
September 1054.00 921.00 953.55 42185.55 1050.00 945.00 952.60 186889.75 21.38 16.84 16.84
October 1029.90 786.00 790.30 78990.45 1027.00 782.55 793.20 275155.85 20.95 19.51 19.91
November 879.50 762.20 832.60 39711.30 879.70 760.00 831.20 183278.25 20.80 17.79 20.58
December 918.90 826.20 876.30 49195.95 919.90 830.25 875.25 193363.33 18.54 15.52 18.32
2010
January 973.65 805.15 846.15 65862.74 973.90 805.00 847.15 245628.00 21.37 18.00 18.00
February 891.45 785.60 840.85 21314.40 883.70 789.20 842.10 97157.60 19.82 10.38 19.82
March 919.95 835.00 908.70 32195.81 914.85 838.00 906.30 92197.43 11.73 8.99 10.58
8. Stock Performance (Indexed)
0
50
100
150
200
250
Aditya Birla Nuvo Ltd. S&P CNX Nifty
Apr-09 May-09 Jun-09 Jul-09 Aug-09 Sep-09 Oct-09 Nov-09 Dec-09 Jan-10 Feb-10 Mar-10

SH
AREH
OLD
ERS’ IN
FO
RM
ATIO
N
[55]
SHAREHOLDERS’ INFORMATION
9. Stock Performance over the past few years:
Absolute Returns (In %) Annualised Returns (In %)
(In Percentage) 1 Year 5 Years (In Percentage) 1 Year 5 Years
Aditya Birla Nuvo 103.69% 133.11% Aditya Birla Nuvo 103.69% 18.44%
BSE Sensex 80.54% 169.96% BSE Sensex 80.54% 21.97%
NSE Nifty 73.76% 157. 86% NSE Nifty 73.76% 20.86%
10. Registrar and Transfer Agents:
(For share transfers and other : In-house Share Transfer
communication relating to Registered with SEBI as Category II - Share Transfer Agent
share certificates, dividend and (Registration No. INR 000001815)
change of address)
Investor Service Centre
Registered Office:
Indian Rayon Compound
Veraval - 362 266
Gujarat, India
Tel: (02876) 245711
Fax: (02876) 243220
E-mail: [email protected]
11. Share Transfer System : Share transfers in physical form are registered normally within 2-3
days from the date of receipt, provided that the documents are
clear in all respects.
Investor Relations & Finance Committee of the Board consider and
approve transfer of above 5,000 shares under one transfer deed.
Further, certain officers of the Company have been authorised to
approve transfers upto 5,000 shares under one transfer deed.
The total number of shares transferred in physical form during the
year was 38,722 (Previous Year: 55,445). Majority of transfers
were completed within 2-3 days from the date of receipt.
2009-10 2008-09
Transfer No. of No. of % Cumulative No. of No. of % Cumulative
Period Transfers Shares Total Transfers Shares Total
(in days) % %
1 – 5 584 28,787 70.87 70.87 1021 46,577 87.94 87.94
6-10 59 2,026 7.16 78.03 24 2,155 2.07 90.01
11-15 75 2,317 9.10 87.13 22 1,640 1.89 91.90
16-20 47 2,460 5.70 92.83 44 1,864 3.79 95.69
21-30 59 3,132 7.17 100.00 50 3,209 4.31 100.00
TOTAL 824 38,722 100.00 — 1,161 55,445 100.00
No transfer is pending as on 31.03.2010.

SH
AREH
OLD
ERS’ IN
FO
RM
ATIO
N
[56]
SHAREHOLDERS’ INFORMATION
12. Investor Services:
(a) The Investor Service Centre of the Company has been accredited with ISO 9001:2000 Certification
for providing Investor and Secretarial Services by Intertek systems Certification, Mumbai, with effect
from August 24, 2007, for a period of three years. This Certification testifies to the standards that
the Company’s Investor Services has achieved in complying with statutory and regulatory requirements
and redressing investor grievances.
(b) Complaints received during the year :
Nature of complaints 2009-10 2008-09
Received Cleared Received Cleared
Opening Balance — — 8 8
1) Transfer, Transmission, Duplicate 8 8 8 16
2) Dividend, Interest, Redemption, etc. 19 19 16 11
3) Annual Report 1 1 11 6
4) Demat – Remat 9 9 6 6
5) Rights Issue related — — 6 4
6) Others — — 4 5
Total 37 37 56 56
(c) Legal proceedings on share transfer issues, if any: There are no major legal proceedings relating
to transfer of shares.
13. Distribution of Shareholding as on 31st March, 2010:
2010 2009
No. of Equity No. of % of No. of % No. of % of No. of %
Shares Held Share- Share- Shares Share- Share- Share- Shares Share-
holders holders Held holdings holders holders Held holdings
1-100 124,921 78.99 3,153,693 3.07 123,505 79.42 3,019,661 3.17
101-200 16,911 10.69 2,407,230 2.34 16,136 10.38 2,281,242 2.40
201 – 500 10,755 6.80 3,331,448 3.23 10,528 6.77 3,238,229 3.41
501-1000 3,248 2.05 2,276,088 2.21 3,144 2.02 2,184,151 2.30
1001-5000 1,944 1.23 3,655,691 3.55 1,859 1.20 3,455,589 3.64
5001-10000 132 0.08 920,870 0.89 117 0.08 798,801 0.84
10001 & above 252 0.16 87,264,522 84.71 208 0.13 80,031,617 84.24
Total 158,163 100.00 103,009,542 100.00 155,497 100.00 95,009,290 100.00

SH
AREH
OLD
ERS’ IN
FO
RM
ATIO
N
[57]
SHAREHOLDERS’ INFORMATION
14. Categories of Shareholding as on 31st
March, 2010:
Category 2010 2009
No. of % of No. of % of No. of % of No. of % of
Share- Share- Shares Share- Share- Share- Shares Share
holders holders Held holdings holders holders Held holdings
Promoters and
Promoter group 21 0.01 47,444,697 46.06 21 0.01 39,444,787 41.52
UTI and other
mutual funds 85 0.05 3,212,847 3.12 88 0.06 4,414,293 4.65
Banks, Financial
Institutions and
Insurance
Companies 74 0.05 12,058,833 11.71 114 0.07 11,303,869 11.90
FIIs 171 0.11 17,608,829 17.09 147 0.08 19,487,623 20.51
NRIs/OCBs 5,865 3.71 1,174,067 1.14 5,789 3.72 1,168,909 1.23
GDRs 3 0.00 3,262,792 3.17 3 0.00 3,277,725 3.45
Other Corporates 2,245 1.42 4,050,738 3.93 1,767 1.14 2,390,139 2.52
Individuals 149,699 94.65 14,196,739 13.78 147,568 94.92 13,521,945 14.22
Total 158,163 100.00 103,009,542 100.00 155,497 100.00 95,009,290 100.00
15. Dematerialisation of : The shares of the Company are required to be compulsorily traded
Shares and Liquidity in the dematerialised form. The shares of the Company are admitted
for trading under both the Depository Systems in India–NSDL and
CDSL. The International Securities Identification Number (ISIN)
allotted to the Company’s Shares under the Depository System is
INE069A01017. A total of 99,025,955 shares of the Company
constituting 96.13% of the Issued and Subscribed Share Capital
were dematerialised as on 31st March, 2010.
16. Outstanding GDR/Warrants : Outstanding GDRs as on 31st March, 2010, are 3,262,792 amounting
and Convertible Bonds, to 3.17% of outstanding paid-up equity capital of the Company.
Conversion date and likely Each GDR represents one underlying Equity Share. The Company
impact on Equity has also issued and allotted 18,500,000 warrants on preferential
basis to the Promoter and Promoter Group Companies. These
warrants, entitle the holder thereof to apply for and obtain allotment
of one equity share of the face value of Rs. 10/- each at a premium
of Rs. 531.19 per share within a period of 18 months from the
date of allotment. Out of 18,500,000 warrants, 8,000,000 warrants
were converted into Equity Shares on exercise of option by the three
allottees. Upon conversion of balance warrants into equity shares
the Equity Capital will increase by Rs. 10.50 Crore and share
premium of Rs. 557.75 Crore.
In respect of 18,800,000 warrants which were allotted on 21st
February, 2008 at a price of Rs. 2,007.45, the holder of said
warrant vide its letter dated 16th May, 2009 informed the Company
that it would not exercise its options acquiring shares in respect of
18,800,000 warrants. Hence, the Company, in terms of relevant
SEBI Guidelines has cancelled the said warrants and forfeited the
sum of Rs. 377.41 Crores received upfront on such warrants.

SH
AREH
OLD
ERS’ IN
FO
RM
ATIO
N
[58]
SHAREHOLDERS’ INFORMATION
17. Secretarial Audit:
As stipulated by Securities and Exchange Board of India (SEBI), a qualified practicing Company Secretary
carries out the Secretarial Audit to reconcile the total admitted capital with National Securities Depository
Limited (NSDL) and Central Depository Services (India) Limited (CDSL) and the total issued and listed
capital. This audit is carried out every quarter, and the report thereon is submitted to stock exchanges,
NSDL and CDSL, and is also placed before the Board of Directors.
18. Plant Locations:
Garments Division: Rayon Division:
Madura Garments Indian Rayon Division
MG House (Regent-Gateway) Veraval - 362 266,
Plot No. 5B, Gujarat
Doddanekkundi Industrial Area, Phone : (02876) 245711/248401
1 Stage, Krishnaraja Puram Hobli, Fax: (02876) 243220
Brookefields, E-mail: [email protected]
Bangalore - 560 048
Phone:(080) - 67271600
Fax: (080) - 67272626
Carbon Black Division: Fertilisers Division:
Hi-Tech Carbon Indo Gulf Fertilisers,
Murdhwa Industrial Area, P.O. Jagdishpur Industrial Area,
P.O. Renukoot, 231 217, Dist. Sultanpur - 227 817,
Dist. Sonbhadra, Uttar Pradesh Uttar Pradesh, India
Phone:(05446) 252387 to 391 Phone: (05361) 270032-38
Fax: (05446) 252502/252858 Fax: (05361) 270165 & 270595
E-mail: [email protected] E-mail: [email protected]
Hi-Tech Carbon Insulators Division:
K-16, Phase II, SIPCOT Industrial Complex, Aditya Birla Insulators
P.O. Gummidipoondi - 601 201, P.O. Meghasar Taluka Halol,
Dist. Tiruvallur - Tamil Nadu Dist. Panchmahal, Gujarat - 389 330
Phone:(044) 27989233 to 36 Phone: (02676) 221002
Fax: (044) 27989129/27989116 Fax: (02676) 223375
E-mail: [email protected] E-mail: [email protected]
Hi-Tech Carbon Aditya Birla Insulators
Village : Lohop, Patalganga, P.O. Prabhas Nagar,
Taluka : Khalapur, Rishra,
Dist. Raigad - 410 207, Dist. Hoogly - 712 249,
Maharashtra, India West Bengal
Phone: (033) 26723535
Textiles Division: Fax: (033) 26722705
Jaya Shree Textiles E-mail: [email protected]
P.O. Prabhasnagar - 712 249,
Dist Hooghly, West Bengal
Phone:(033) 26721146
Fax: (033) 26721683/26722626
E-mail: [email protected]

SH
AREH
OLD
ERS’ IN
FO
RM
ATIO
N
[59]
SHAREHOLDERS’ INFORMATION
19. Investor Correspondence:
Other than Secretarial Matters : Chief Financial Officer
Aditya Birla Nuvo Limited
Corporate Finance Division
Aditya Birla Centre, A Wing, 4th Floor
S. K. Ahire Marg, Worli,
Mumbai - 400 030
Phone: (022) 6652 5000/2499 5000
Fax: (022) 6652 5821/2499 5821
E-mail: [email protected]/
On Secretarial and Investor : The Company Secretary
Grievance Matters Aditya Birla Nuvo Limited
Registered Office:
Investor Service Centre
Indian Rayon Compound
Veraval - 362 266, Gujarat, India
E-mail: [email protected]
Corporate Office:
A-4, Aditya Birla Centre,
S.K. Ahire Marg, Worli, Mumbai - 400 030
Phone: (022) 6652 5585
Fax: (022) 6652 5821/2499 5821
E-mail: [email protected]
20. Per Share Data:
2009-10 2008-09 2007-08 2006-07 2005-06
Net Earnings (Rs. Crore) 283.40 137.43 243.07 224.97 186.93
Cash Earnings (Rs. Crore) 457.20 282.34 409.41 360.45 291.82
EPS (Rs.) 28.81 14.46 26.05 25.60 24.48
CEPS (Rs.) 46.48 29.72 43.88 41.02 38.22
Dividend Per Share (Rs.) 5.00@
4.00 5.75 5.50 5.00
Dividend Payout (on Net Earnings) (%) 20.98 30.87 26.29 26.02 25.47
Book Value Per Share (Rs.) 452.53 433.82 423.51 334.87 264.38
Price to Earnings (NSE) 31.46 30.77 53.60 41.83 30.56
Price to Cash Earnings (NSE) 19.50 14.97 31.82 26.11 19.57
Price to Book Value (NSE) 2.00 1.03 3.30 3.20 2.83
@
Recommended by Board for approval of shareholders at ensuing AGM.

SH
AREH
OLD
ERS’ IN
FO
RM
ATIO
N
[60]
SHAREHOLDERS’ INFORMATION
21. Investor Services:
1. Equity shares of the Company are under
compulsory demat trading by all investors,
with effect from 5th April, 1999. Considering
the advantages of scripless trading,
shareholders are requested, in their own
interest, to consider demateralisation of their
shareholding so as to avoid inconvenience
in future.
2. Shareholders/Beneficial Owners are
requested to quote their Folio No./DP and
Client ID Nos., as the case may be, in all
correspondence with the Company.
All correspondences, regarding securities
of the Company, should be addressed
to the Investor Service Centre of the
Company situated at the Registered Office
of the Company at Indian Rayon
Compound, Veraval. Company has also
designated an exclusive E-mail ID:
[email protected] for effective
investor’s services where they can register
their complaints/queries and requests for
speedy and prompt redressal.
3. Shareholders holding shares in physical form
are requested to notify to the Company,
change in their address/Pin Code number
with proof of address and Bank Account
Details promptly by written request under
the signatures of sole/first joint holder.
Beneficial Owners of shares in demat form
are requested to send their instructions
regarding change of name, bank details,
nomination, power of attorney, etc., directly
to their DP.
4. To prevent fraudulent encashment of
dividend warrants, members are requested
to provide their Bank Account details (if not
provided earlier) to the Company (if shares
are held in physical form) or to DP (if shares
are held in demat form), as the case may
be, for printing of the same on their dividend
warrants.
5. Non-resident members are requested to
immediately notify the following to the
Company in respect of shares held in
physical form and to their DPs in respect of
shares held in dematerialised form:
• Indian address for sending all
communications, if not provided so far;
• Change in their residential status on
return to India for permanent settlement;
• Particulars of the Bank Account
maintained with a bank in India, if not
furnished earlier;
• E-mail ID and Fax No(s), if any.
6. In case of loss/misplacement of shares,
investors should immediately lodge FIR/
Complaint with the Police and inform to the
Company along with original or certified
copy of FIR/Acknowledged copy of Police
complaint.
7. For expeditious transfer of shares,
shareholders should fill in complete and
correct particulars in the transfer deed.
Wherever applicable, registration number
of Power of Attorney should also be
quoted in the transfer deed at the
appropriate place.
8. Shareholders are requested to keep record
of their specimen signature before
lodgement of shares with the Company to
obviate the possibility of difference in
signature at a later date.
9. Shareholders of the Company who have
multiple accounts in identical name(s) or
holding more than one Share Certificate in
the same name under different Ledger
Folio(s) are requested to apply for
consolidation of such Folio(s) and send the
relevant Share Certificates to the Company.
10. Section 109A of the Companies Act, 1956,
extends nomination facility to individuals
holding shares in physical form in
companies. Shareholders, in particular,
those holding shares in single name, may
avail the above facility by furnishing the
particulars of their nominations in the
prescribed Nomination Form, which can be
downloaded from the website of the
Company or obtained from the Share
Department of the Company by sending
written request through any mode including
E-mail on [email protected]

SH
AREH
OLD
ERS’ IN
FO
RM
ATIO
N
[61]
SHAREHOLDERS’ INFORMATION
11. Shareholders are requested to visit the
Company’s website
www.adityabirlanuvo.com for —
• Information on investor services offered
by the Company.
• Downloading of various forms/formats,
viz., Nomination Form, ECS Mandate
Form, Indemnity, Affidavits, etc.
12. In terms of a notification issued by the
Reserve Bank of India, with effect from
1st October, 2009, remittance of dividend
through ECS is replaced by National
Electronic Clearing Service (NECS). Banks
have been instructed to move to the NECS
platform. The advantages of NECS over ECS
include faster credit of remittance to the
beneficiary’s account, coverage of more
bank branches and ease of operations.
NECS essentially operates on the new and
unique bank account number, allotted by
banks post implementation of Core Banking
Solutions (CBS) for centralised processing
of inward instructions and efficiency in
handling bulk transactions.
To enable remittance of dividend through
NECS, Members are requested to provide
their new account number allotted to them
by their respective banks after
implementation of CBS. The account
number must be provided to the Company
in respect of shares held in physical form
and to the Depository Participants in respect
of shares held in electronic form.”
13. Shareholders are requested to give their
valuable suggestions for improvement of
Company’s investor services.

[62]
DIREC
TO
RS’ REPO
RT
Dear Shareholder,
We are pleased to present the 53rd
Annual Report
together with the audited accounts of your Company
for the financial year ended 31st March, 2010.
With the GDP growth at 7.4% during 2009-10,
India continued to remain one of the fastest growing
economies in the world. The strong recovery in IIP
growth, consumer spending, FII investments and
capital inflows through IPOs and private placements
reflects improved confidence in the Indian economy
and signifies a positive outlook going forward.
CONSOLIDATED FINANCIAL PERFORMANCE
Driven by a strong focus on achieving profitable
growth across the businesses, your Company
has posted excellent operating results during
the year. The consolidated net revenues of your
Company has crossed Rs. 15,000 Crore mark. It
has achieved highest ever consolidated EBITDA
at Rs.1,686 Crore which has almost doubled from
Rs. 867 Crore attained in the previous year. The
earnings growth was driven by improved profitability
in the manufacturing businesses coupled with
reduced losses in the Life Insurance, IT-ITeS and
Fashion & Lifestyle businesses. As a result, your
Company posted consolidated net profit of Rs.155
Crore vis-à-vis net loss of Rs. 436 Crore in the
previous year – registering a swing of about
Rs. 600 Crore.
Led by improved earnings coupled with equity
infusion by the promoters, your companys’s balance
sheet has also been strengthened.
The Financial Services business was the major
contributor to the top-line as well as the bottom-line
growth. With the launch of Private Equity fund, Aditya
Birla Financial Services (“ABFS”) has now spread its
wings across a wide spectrum of financial services
space.
• Combined together, revenues of Aditya Birla
Financial Services grew by 23% to Rs. 5,850
Crore. Combined Assets Under Management
(AUM) grew by 42% to Rs. 82,140 Crore. Net
profit, excluding Life Insurance, has more than
doubled.
• The net loss and capital requirements of Birla
Sun Life Insurance Company Ltd., reduced
considerably driven by better expense
management and growth in renewal premium.
its AUM grew by 76% to Rs. 16,130 Crore.
DIRECTORS’ REPORT TO THE SHAREHOLDERS
• The average AUM of Birla Sun Life Asset
Management Company Ltd. crossed
Rs. 65,000 Crore – achieving 34% growth over
last year.
In the Telecom business, Idea Cellular Ltd. became
pan India player by launching remaining seven
service areas. Idea ranks 3rd in terms of wireless
revenue market share, which stands enhanced from
11.7% to 12.6% during 2009-10 amidst hyper-
competition. Even after absorbing the competitive
pressure on realised rate per minute and launch of
new circles, net profit grew from Rs. 882 Crore to
Rs. 954 Crore. In the recently concluded 3G auction,
Idea has won 3G spectrum for 11 service areas
which contribute 80% of its existing 2G revenues.
In the IT-ITeS business, Aditya Birla Minacs
strengthened its business solutions capabilities with
the acquisition of U.K. based Compass BPO Limited
and U.S. based Bureau of Collection Recovery, LLC.
Led by a strong focus on cost rationalisation, the
IT-ITeS and Fashion & Lifestyle businesses achieved
significant improvement in EBITDA to the tune of
Rs.100 Crore and Rs.150 Crore respectively over
the previous year.
Manufacturing businesses, combined together, have
posted highest ever EBITDA at Rs. 748 Crore. The
Greenfield Carbon Black project at Patalganga with
a capacity of 85,000 MTPA was completed in end
May 2010, thereby taking the total capacity to
315,000 MTPA.
STANDALONE FINANCIAL PERFORMANCE
The standalone net income from operations
remained flat at Rs.4,827 Crore. This was
largely because peak input and fuel prices prevailing
during the previous financial year led to higher
subsidies in the Agri-business in the last year. The
standalone EBITDA grew from Rs.619 Crore to
Rs.835 Crore supported by improved earnings in
the Carbon Black, Fashion & Lifestyle, Rayon and
Textiles businesses. Net profit grew from Rs.137 Crore
to Rs.283 Crore.
Equity infusion through Preferential Allotment
strengthened balance sheet
Your Company issued and allotted 18.5 million
warrants to the Promoter Group Companies on a
preferential basis in June 2009 on receipt of
Rs. 250 Crore as 25% application money. The
Promoter Group further infused Rs. 325 Crore (being

[63]
DIREC
TO
RS’ REPO
RT
balance 75% amount payable) on conversion of
8 million warrants into equity shares on 30th October,
2009. As a result, the paid up capital of your
Company increased from Rs. 95 Crore to Rs. 103
Crore on allotment of 8 million equity shares.
Restructuring of Fashion & Lifestyle business to
derive operational synergies
In order to achieve utmost synergy and efficiency of
operations and management, your Company
strengthened its Fashion & Lifestyle business, by
merger of its subsidiaries “Madura Garments Exports
DIRECTORS’ REPORT TO THE SHAREHOLDERS
Ltd.” and “MG Lifestyle Clothing Company Pvt. Ltd.”,
into the Company. Further, the domestic business of
“Peter England Fashions and Retail Ltd.” has also
been demerged with your Company. On receipt
of requisite approvals, the composite scheme
of merger/demerger has been made effective from
1st
January, 2010 (the “Appointed Date”).
The business-wise performance review, outlook and
strategy have been spelt out in depth in the
Management Discussion and Analysis section, which
forms part of the Annual Report.
(Rs. Crore)
Consolidated Standalone
2009-10 2008-09 2009-10 2008-09
Profit before Depreciation/Amortisation and Tax 1024.05 146.37 500.40 328.26
Depreciation and Amortisation 866.48 695.64 180.10 165.96
Profit/(Loss) before Tax 157.57 (549.27) 320.30 162.30
Provision for Taxation (Net) 114.00 81.05 36.90 24.87
Net Profit/(Loss) before Minority Interest 43.57 (630.32) 283.40 137.43
Minority Interest in the loss of consolidated
subsidiaries (111.03) (194.59) — —
Share of Profit/(loss) of Associate (0.04) — — —
Net Profit/(Loss) 154.56 (435.73) 283.40 137.43
Balance brought forward (1112.61) (642.48) 86.03 21.06
Amount transferred on change in stake in
Subsidiaries/Joint venture and Mergers (105.20) 50.37 (139.60) —
Profit available for Appropriation (1063.25) (1027.84) 229.83 158.49
Appropriations :
Proposed/Interim Dividend 53.26 41.01 51.51 38.00
Corporate Tax on Dividend 8.86 7.18 7.95 4.43
General Reserve 100.00 13.75 100.00 13.75
Debenture redemption reserve 53.19 16.28 53.19 16.28
Special Reserve 6.40 6.55 — —
Surplus/(Deficit) carried to Balance Sheet (1284.96) (1112.61) 17.18 86.03
(1063.25) (1027.84) 229.83 158.49

[64]
DIREC
TO
RS’ REPO
RT
DIVIDEND
Your Directors recommend for your consideration a
dividend of Rs. 5/- per Equity Share of Rs.10/- each
and Rs 6/- per Preference share of Rs 100/- each
issued on 10th March, 2010 on pro rata basis as
the same were issued during the year for the financial
year ended 31st March, 2010.
The final outgo on dividend is as under –
(Rs. Crore)
2009-10 2008-09
On 1,03,009,542, fully
paid-up Equity Shares of
Rs.10/- each, @ Rs. 5.00/-
per share and
51.51 —
On 10,000, fully paid-up
Preference Shares of
Rs 100/- each, @ Rs 6.00/-
per share on pro-rata basis
(Previous Final dividend — 38.00
on 95,009,290 fully
paid-up Equity Shares
of Rs.10/- each
@ Rs. 4.00/- per share)
Corporate Dividend Tax 7.95 4.43
FINANCE
Your Company raised long-term loan aggregating
to Rs. 140 Crore by way of foreign currency
borrowings and Rs. 200 Crore by way of Non-
Convertible Debentures.
During the year, Term Loan aggregating to Rs. 428
Crore and Commercial papers aggregating to
Rs. 900 Crore (net) were repaid.
Standalone Net Debt to EBITDA reduced significantly
from 5.9 times as on 31st March, 2009 to 4.1
times on 31st March, 2010 resulting from equity
infusion by Promoters, improved profitability and debt
repayments.
HUMAN RESOURCES
Your Company continuously strives to foster a culture
of high performance. Your Management has infused
a lot of rigor and intensity in its people development
DIRECTORS’ REPORT TO THE SHAREHOLDERS
processes and in honing skill sets. Its HR processes
are absolutely aligned to organizational goals.
The implementation of People Soft HRMS (Human
Resource Management System), the variable pay plan
and job bands have been institutionalized.
Ongoing learning, refreshing HR systems in line
with global benchmarks, aligning rewards and
recognition with performance, have enabled your
Company sustain its reputation of a meritocratic
organization.
The Group’s Corporate Human Resources function
has played and continues to play an integral role in
your Company’s Talent Management Processes.
CONSOLDATED FINANCIAL RESULTS
Consolidated Financial Statements pursuant to
Clause 41 of the Listing Agreement entered into
with the Stock Exchanges and prepared in
accordance with the Accounting Standards prescribed
by the Institute of Chartered Accountants of India,
are attached for your reference.
CORPORATE GOVERNANCE
Your Directors reaffirm their commitment to good
corporate governance practices and adheres to all
the major stipulations laid down by the SEBI
Corporate Governance Practices.
This Annual Report contains a section on Corporate
Governance highlighting adherence to the SEBI Code
on Corporate Governance.
Your Company’s Statutory Auditors’ Certificate
confering compliance with Clause 49 of the Listing
Agreement with Stock Exchanges is annexed to
(Annexure A) and forms part of the Directors’ Report.
As required under Section 217(2AA) of the
Companies Act, 1956, your Directors confirm that:
i) in the preparation of the annual accounts, the
applicable accounting standards have been
followed along with proper explanation relating
to material departures;
ii) the Directors have selected such accounting
policies and applied them consistently and made
judgements and estimates that are reasonable
and prudent so as to give a true and fair view
of the state of affairs of the Company at the
end of the financial year and of the profit of the
Company for that period;
}

[65]
DIREC
TO
RS’ REPO
RT
iii) the Directors have taken proper and sufficient
care for the maintenance of adequate
accounting records in accordance with the
provisions of this Act for safeguarding the assets
of the Company and for preventing and
detecting fraud and other irregularities; and
iv) the Directors have prepared the annual accounts
on a ‘going concern basis’.
SUBSIDIARY COMPANIES
During the year, LIL Investment Ltd., Compass BPO
Ltd., UK, Compass BPO Inc., USA, Compass
Business Process Outsourcing Ltd., India and
Compass BPO FZE, UAE became subsidiaries of
the Company.
During the year, Madura Garments International
Brands Company Ltd., Madura Garments Exports
Ltd., (since merged with the Company), MG Lifestyle
Clothing Company Private Ltd., (since merged with
the Company) LIL Investment Limited ceased to be
the subsidiaries of the Company.
To reflect group’s strong parentage and commitment
to its businesses, as also to signify the nature of
business, the names of following subsidiary
companies were changed:-
DIRECTORS’ REPORT TO THE SHAREHOLDERS
Sr. No Former name New name
1. Apollo Sindhoori Capital Investments Ltd. Aditya Birla Money Ltd.
2. Apollo Sindhoori Commodities Trading Ltd. Aditya Birla Commodities Broking Ltd.
3. PSI Data Systems Ltd. Aditya Birla Minacs IT Services Ltd.
4. Laxminarayan Investment Ltd. ABNL Investment Ltd.
5. Birla Sun Life Distribution Company Ltd. Aditya Birla Money Mart Ltd.
6. Birla Global Finance Company Ltd. Aditya Birla Finance Ltd.
7. BSDL Insurance Advisory Services Ltd. Aditya Birla Money Insurance Advisory Services Ltd.
8. Birla Technologies Ltd. Aditya Birla Minacs Technologies Ltd.
The Annual Accounts of the subsidiary companies
are open for inspection by any investor at the
Registered Office of the Company and of the
concerned subsidiary Company. Any shareholder /
investor of subsidiary Company, who wishes to
obtain a copy of the said documents of any of the
subsidiary companies, may send a request in writing
to the Company Secretary at the Registered Office
of the Company so that the needful can be done.
EMPLOYEE STOCK OPTION SCHEME (ESOS)
As mentioned last year, in terms of ESOS – 2006,
the ESOS Compensation Committee granted Stock
Options to the Whole Time Directors and employees
of the Company, including 10,770 Options to some
employees of the Subsidiary Companies, in two
tranches. Out of the total options granted, 1,20,746
options have lapsed so far. As on 31st March, 2010,
2,08,627 options are outstanding which are
convertible into shares on exercise of option for
conversion as per schedule of vesting.
Details of the options issued under ESOS - 2006,
as also the disclosures in compliance with Clause
12 of Securities and Exchange Board of India
(Employees Stock Option Scheme) Guidelines 1999
are set out in the Annexure B to this report.
In line with the approval granted by the Central
Government under Section 212(8) of the Companies
Act, 1956, copies of the Balance Sheet, Profit and
Loss Account, Report of the Board of Directors and
Report of the Auditors of the subsidiary companies
have not been attached to the Balance Sheet of the
Company as at 31st March, 2010.
FIXED DEPOSITS
Your Company was accepting fixed deposits from
the employees. Acceptance of such fixed deposits
has been discontinued from January 2009 onwards.
The total outstanding deposits are Rs. 0.80 Crore
as at 31st March, 2010.

[66]
DIREC
TO
RS’ REPO
RT
The erstwhile Birla Global Finance Ltd. (since
amalgamated with the Company) had accepted
deposits from the public till May 2005. Of the total
matured fixed deposits, as on 31st March, 2010,
there were unclaimed fixed deposits of Rs. 4.66
lacs. These unclaimed deposits are kept in a separate
earmarked bank account.
PARTICULARS AS PER SECTION 217 OF THE
COMPANIES ACT, 1956
The Information relating to the Conservation of
Energy, Technology Absorption and Foreign Exchange
Earnings and Outgo required under Section 217(1)
(e) of the Companies Act, 1956, is set out in a
separate statement attached to this Report (Annexure
C) and forms part of it.
In accordance with the provisions of Section 217(2A)
read with the Companies (Particulars of Employees)
Rules, 1975, the names and other particulars of
employees are to be set out in the Directors’ Report,
as an addendum thereto. However, as per the
provisions of Section 219(1)(b)(iv) of the Companies
Act, 1956, the Report and accounts as therein set
out, are being sent to all members of the Company
excluding the aforesaid information about the
employees. Any member, who is interested in
obtaining such particulars about employees, may
write to the Company Secretary at the Registered
Office of the Company.
DIRECTORS
Mr. Arun Maira, who was appointed as a Director
on August 4, 2008, resigned w.e.f. July 23, 2009
to join the Planning Commission of India as its
Member.
Mr. H. J. Vaidya, Director of the Company since
14th July, 1967, expressed his inability to continue
as Director of the Company on account of ill-health
and resigned w.e.f. 1st April 2010.
The Board places on record its sincere appreciation
of the valuable services rendered by Mr. Arun Maira
and Mr. K. K. Maheshwari, Whole-time Director of
the Company resigned w.e.f. 20th May, 2010. Mr.
H. J. Vaidya during their tenure as directors of the
Company.
Ms. Tarjani Vakil, Mr. G. P. Gupta and Mr. S. C.
Bhargava Directors of the Company retire from office
by rotation, and being eligible, offer themselves for
reappointment at the ensuing Annual General
Meeting.
DIRECTORS’ REPORT TO THE SHAREHOLDERS
Resolutions seeking appointment of Ms. Tarjani Vakil,
Mr. G.P Gupta and Mr. S. C. Bhargava have been
included in the Notice of ensuing Annual General
Meeting together with their brief details.
AWARDS AND RECOGNITION
Your Company has been the proud recipient of the
following awards and recognitions –
■ INDIAN RAYON DIVISION
• Gold Award in Chemical Sector for
outstanding achievement in Environment
Management from Greentech Foundation,
Kerala.
• Excellent Energy Efficient Unit Award under
the National Energy Management Award,
2009.
• Environment Excellence Award in Chemical
Sector from Greentech Foundation.
• National Award for Excellence in Energy
Management 2009 from Confederation of
Indian Industry.
• ISO 9001:2000 Certification awarded for
conforming to the Quality Management
System Standard by DET NORSKE VERITAS.
• OHSAS 18001:2007 Certificate awarded
by DET NORSKE VERITAS for conforming
to the Occupational Health and Safety
Management System Standard.
• ISO 14001:2004 Certificate from UL DQS
Inc. for implementation and maintenance
of – Environmental, Responsible Care &
Health, Safety and Security Management
System.
• Social Accountability 8000:2008
Certification received from DET NORSKE
VERITAS for conforming to the Social
Accountability Standard in manufacturing
category.
■ JAYA SHREE TEXTILES DIVISION
• SHE Award for Best Entry (Small & Medium
Scale) from Confederation on Indian
Industry.
■ INDO GULF FERTILISERS DIVISION
• The FAI Runner-up Award for Best Production
Performance of Nitrogenous Fertiliser from
Fertiliser Association of India.

[67]
DIREC
TO
RS’ REPO
RT
• ISO 9001:2008 Certification from AFNOR
Certification for meeting the requirements
of Quality Management System
• ISO 14004:2004 Certification from AFNOR
Certification for meeting requirements of
Environment Management System
• OHSAS 18001:2007 from AFAQ-EAQA
Limited for complying with the requirements
of Occupational Health & Safety
Management System (OHSAS 18001:2007)
• ISO / IEC / 27001:2005 Certification from
Bureau Veritas Certification for Management
of Information Security for all operations.
■ MADURA GARMENTS DIVISION
• Peter England was awarded Second Best
“Brand Equity- Most Trusted Brands 2009”
in Apparel segment.
• Louis Philippe received Partner’s Choice
Award in Men’s Formal Wear category, by
Central Icons.
■ ADITYA BIRLA INSULATORS
DIVISION – RISHRA
• Certificate of Merit in IMC Ramakrishna
Bajaj National Quality Awards 2009 in
manufacturing category.
• Bronze-Level Recognition received by
Quality Circle Team “Kiran” in International
Convention on Quality Circle held in
Philippines.
■ ADITYA BIRLA INSULATORS
DIVISION – HALOL
• TOP Award in the category of ‘Product
covered by the Ceramic and Allied Products
including Refractories Panel’ received from
Chemicals and Allied Products Export
Promotion Council.
DIRECTORS’ REPORT TO THE SHAREHOLDERS
■ HI TECH CARBON DIVISION – RENUKOOT
• ‘Excellent’-level recognition received by the
Quality Circle Teams, “Asset & Dynamic” in
the National Level Competition, at
Bangalore.
AUDITORS
The observations made in the Auditors’ Report are
self-explanatory and therefore, do not call for any
further comments under Section 217(3) of the
Companies Act, 1956.
Your Directors request you to appoint Auditors for
the current year as set out in the accompanying
notice of the Annual General Meeting.
APPRECIATION
Your Directors take this opportunity to express their
sincere appreciation for the excellent support and
co-operation extended by the shareholders,
customers, suppliers, bankers and other business
associates. Your Directors gratefully acknowledge the
ongoing co-operation and support provided by
Central and State Governments and all Regulatory
bodies.
Your Directors place on record their deep
appreciation for the exemplary contribution made
by employees at all levels. Their dedicated efforts
and enthusiasm have been pivotal to your
Company’s growth.
For and on behalf of the Board
Kumar Mangalam Birla
Chairman
Mumbai
3rd
June, 2010

[68]
DIREC
TO
RS’ REPO
RT
To
The Members of Aditya Birla Nuvo Limited
1. We have examined the compliance of conditions of Corporate Governance by Aditya Birla Nuvo
Limited (‘the Company’) for the year ended March 31, 2010, as stipulated in clause 49 of the Listing
Agreement of the Company with Stock Exchanges.
2. The compliance of conditions of Corporate Governance is the responsibility of the management. Our
examination was limited to procedures and implementation thereof, adopted by the Company for
ensuring the compliance of the conditions of the Corporate Governance. It is neither an audit nor an
expression of opinion on the financial statements of the Company.
3 In our opinion and to the best of our information and according to the explanations given to us, we
certify that the Company has complied with the conditions of Corporate Governance as stipulated in
the above mentioned Listing Agreement.
4. We further state that such compliance is neither an assurance as to the future viability of the Companynor
the efficiency or effectiveness with which the management has conducted the affairs of the Company.
For KHIMJI KUNVERJI & CO. For S. R. BATLIBOI & CO.
Chartered Accountants Chartered Accountants
Firm Registration Number:105146W Firm Registration Number:301003E
Per Shivji K. Vikamsey Per Vijay Maniar
Partner (F-2242) Partner (F-36738)
Mumbai Mumbai
June 3, 2010 June 3, 2010
ANNEXURE ‘A’ TO THE DIRECTORS’ REPORT

[69]
DIREC
TO
RS’ REPO
RT
Disclosure pursuant to the provisions of the Securities and Exchange Board of India (Employee
Stock Option Scheme) Guidelines, 1999
Nature of disclosure Particulars
a) Options granted 3,29,373
b) The pricing formula Tranche 1: The exercise price was determined by
averaging the daily closing price of the Company’s
equity shares during 7 days immediately preceding the
date of grant and discounting it by 10%. Exercise price
- Rs. 1,180 per option
Tranche 2: The exercise price was the closing market
price, prior to the date of grant – Exercise price -
Rs. 1,802 per option.
c) Options vested 96,273
d) Options exercised NIL
e) The total number of shares arising as a
result of exercise of options NIL
f) Options lapsed 1,20,746
g) Variation of terms of options NIL
h) Money realized by exercise of options NIL
i) Total number of options in force 208,627
j) Employee-wise details of options granted:
i) Senior managerial personnel: Dr. Rakesh Jain :- 13,470
Mr. K.K.Maheshwari :- 63,600
ii) Any other employee who received
a grant in any one year of option
amounting to 5 % or more of
options granted during that year NIL
iii) Identified employees who were
granted option, during any one year,
equal to or exceeding 1% of the
issued capital (excluding outstanding
warrants and conversions) of the
Company at the time of grant NIL
k) Diluted Earnings Per Share NA
ANNEXURE ‘B’ TO THE DIRECTORS’ REPORT

[70]
DIREC
TO
RS’ REPO
RT
l) The impact of this difference on profits The effect of adopting the fair value on the net income
and on EPS of the company and earnings per share for 2009-10 is as presented
below:
Particulars Rs. (in Crs.)
Net Income 283.40
Add: 0.10
Intrinsic Value Compensation Cost
Less: 3.16
Fair Value Compensation Cost
Adjusted Net Income 280.34
Earnings Per share * Basic Diluted
(in Rs.) (in Rs.)
As Reported : 28.81 27.62
As Adjusted : 28.49 27.32
*Subject to change of Net Income
m) (i) Weighted-average exercise prices Options granted under Tranche 2
and weighted-average fair values of Weighted average exercise price (Rs.) : 1,802.00
options whose exercise price equals Weighted average fair value (Rs.) : 825.67
the market price of the stock
(ii) Weighted-average exercise prices Options granted under Tranche 1
and weighted-average fair values of Weighted average exercise price (Rs.) : 1,180.00
options whose exercise price is less Weighted average fair value (Rs.) : 591.53
then the market price of the stock
(iii) Weighted-average exercise prices NIL
and weighted-average fair values of
options whose exercise exceeds the
market price of the stock
n) A description of the method and
significant assumptions used during
the year to estimate the fair values of
options, including the following
weighted-average information:
(i) risk-free interest rate (%) 7.78
(ii) expected life (No. of years) 5
(iii) expected volatility (%) 38
(iv) dividend yield (%) 0.52
(v) the price of the underlying share in Tranche 1: Rs. 1,283
market at the time of option grant Tranche 2: Rs. 1,949
ANNEXURE ‘B’ TO THE DIRECTORS’ REPORT

[71]
DIREC
TO
RS’ REPO
RT
ANNEXURE ‘C ’ TO THE DIRECTORS’ REPORT
Form-A
Form for disclosure of particulars with respect to conservation of energy.
(A) Power and Fuel Consumption:
UNITS CURRENT PREVIOUS
YEAR YEAR
1. Electricity
(A) Purchased - Units KWH in Lakh 1058.61 986.23
Total Amount Rs. in Lakh 4590.24 4007.81
Rate per Unit Rs. 4.34 4.06
(B) Own Generation
(i) Through Diesel Generator - Units KWH in Lakh 432.74 200.31
Unit per Ltr. of Diesel Oil — 2.42 2.30
Cost per Unit Rs. 7.53 8.44
(ii) Through Steam Turbine/Generator - Units KWH in Lakh 5436.36 3859.43
Unit per Ton of Steam Coal — 0.42 0.80
Cost per Unit Rs. 1.62 2.75
(iii) Through Gas Turbine MWH 174987.20 177060.60
Natural Gas + Naphtha KWH/MCAL 550.30 551.73
Cost per Unit Rs./KWH 2.79 4.77
2. Coal (Grade B, C and D)(used in Boilers)
Quantity ‘000 Tonne 274.80 261.82
Total Cost Rs. in Lakh 8747.74 10626.06
Average Rate Rs. per Tonne 3183.39 4058.59
3. Furnace Oil
Quantity K.Ltr. 18950.61 12032.96
Total Amount Rs. in Lakh 4555.32 3338.63
Average Rate Rs. per K.Ltr. 24037.85 27745.73
4. Natural Gas —
Quantity ‘000 Sm3 133703.77 111465.31
Total Amount Rs. in Lakh 17406.70 21505.03
Average Rate Rs./1000 Sm3 13018.85 19293.02
5. Naphtha
Quantity MT 18110.89 25511.95
Total Amount Rs./Lakh 5981.98 9615.98
Average Rate Rs./MT 33029.74 37692.07

[72]
DIREC
TO
RS’ REPO
RT
(B) Consumption per Unit of Production: Production CURRENT PREVIOUS
Unit YEAR YEAR
1. Electricity (KWH)
Viscose Filament Rayon Yarn MT 4224.00 4102.00
Other Yarns MT 6919.00 6805.20
Caustic Soda MT 2336.00 2423.00
Fabrics ‘000 Mtr. 1732.10 1889.20
Carbon Black MT 408.94 457.88
Urea MT 166.90 162.65
Insulators MT 842.00 913.00
2. Furnace Oil (Kilo Ltr.)
Viscose Filament Rayon Yarn MT 0.58 0.20
Other Yarns MT 28.10 70.90
Insulators MT 0.25 0.28
3. Coal (Grade B, C and D)
Viscose Filament Rayon Yarn MT 2.03 3.17
Other Yarns MT 408.50 586.30
Fabrics ‘000 Mtr. 9.70 8.40
4 Natural Gas
Insulators Sm3 794.19 0.00
Urea Sm3 114.04 103.99
5. Naphtha kg 16.50 23.84
ANNEXURE ‘C ’ TO THE DIRECTORS’ REPORT

[73]
DIREC
TO
RS’ REPO
RT
Information under Section 217(1)(e) of the
Companies Act, 1956 read with Companies
(Disclosure of Particulars in the Report of Board of
Directors) Rules, 1988 and forming part of the
Directors’ Report for the year ended 31st March, 2010.
A. CONSERVATION OF ENERGY
a) Energy conservation measures taken:
In line with the Company ’s declared
commitment towards conservation of natural
resources, all business units have continued
with their efforts to improve energy usage
efficiencies.
The Company is engaged in the continuous
process of energy conservation through
improved operational and maintenance
practices.
Steps taken by various divisions of the
Company in the direction are as under:-
i) Rayon Division
• Waste heat recovery from flash steam in
after-treatment department for heating of
water.
• Modification in Multi Stage Flash
Evaporator caustic circulation line for
reduction in steam consumption.
• Optimizing the nozzle sizes of vacuum
equipments for reduction in steam
consumption.
• Heat recovery through Heat evaporator
during return spin bath process.
• Increasing the capacity of fast effect
heater in anhydrous evaporator for
reduction in steam consumption.
ii) Carbon Black Division
• Energy conservation at Gummidipoondi
Division by installing Conzerve make
coolite for lightings in total plant areas,
the lighting occupancy sensor in
unmanned plant buildings and rooms,
VFD-6nos for plant equipment after
identifying the potential, the energy
efficiency motors- 17nos
iii)Textiles Division
• Modified autoclave machine as electrical
heating system in place of steam heating
by boiler.
ANNEXURE ‘C ’ TO THE DIRECTORS’ REPORT
• Replaced five nos. of stream traps and
ensuring regular monitoring.
• Modified pipe line of chiller plant so as
to maintain temperature.
• Replaced oil fired boiler with coal-fired
boiler.
iv) Fertilisers Division
• Initiated performance evaluations for
turbines, compressor, Heat Exchangers,
Boilers etc. are carried out to ensure
optimum utilisation of energy.
v) Insulators Division
a) Rishra
• Saving of electricity consumption at
various places through installation of
Variable Frequency Drives (VFDs) and
timer based operation of high energy
consuming equipments.
• Achieved increase in the capacity of
body-ball mill by 8% and quartz-ball
mill by 25% and thus reduced the
specific power consumption in slip
house.
b) Halol
• Conversion of all kilns to Natural Gas
firing from liquid fuel firing.
• Reduction in Cycle Hours of shuttle
Kilns
• Use of Hot air in Cementing Booths
• Use of Hot air in Grog Dryer
• Installation of AC drives in willet
pumps in slip house.
• Installation of AC variable frequency
drives in shuttle kilns blowers.
• Optimizing the compressor efficiency
for plant process air
• Replacement of High-Pressure
Mercury-Vapor (HPMV) lights by metal
halide lights.
• Stopped the kiln compressors after
switching in gas fuel from liquid fuel
in kiln

[74]
DIREC
TO
RS’ REPO
RT
b) Additional Investments & Proposals, if any,
being implemented for reduction of
consumption of Energy.
i) Rayon Division
• Installation of VFD in Fresh Air Fans and
exhaust fan in After Treatment plant for
reduction in power consumption.
• Installation of VFD in Fresh Air Fan and
Exhaust Fan in textile packing department
for reduction in power consumption.
• Installation of VFD in Viscose Cooling
Tower fan for reduction in power
consumption.
• Installation of Light-Emitting Diode (LED)-
based light fittings in place of tube lights
for reduction in power consumption.
• Replacement of old and inefficient Air-
conditioners by energy efficient for
reduction in power consumption.
ii) Carbon Black Division
• Installation of VFD for Bolier-3 feed water
pump
iii)Fertilisers Division
• In the process of finalisation of various
energy saving and techno-economically
viable schemes.
iv) Insulators Division (Halol)
• Conversion of Brick lining to fiber lining
in two Shuttle Kilns.
• Installation of Recuperator in K-6.
• Conversion of all oil-fired dryers to
Thermic fluid heating system.
• Conversion of Brick pillars of Kiln No.4
cars to Sic pillars.
c) Impact of measures at (a) and (b) above
for reduction of energy consumption and
consequent impact on the cost of
production of goods:
The energy conservations measures taken in
Rayon Division have resulted in energy saving
and consequent decrease in the cost of
production.
ANNEXURE ‘C ’ TO THE DIRECTORS’ REPORT
The energy conservation measures taken in
Carbon Black Division have resulted into
energy saving and consequent reduction in
cost of production.
The above measures taken in Insulators
Division have resulted into energy saving,
reduction in power consumption & power
loss and consequent reduction in cost of
production.
The Energy conservation measures taken by
Fertilisers Division have resulted in reducing
the energy consumption in the fertiliser
complex. Besides these measures, have led to
reduction in consumption of fossil fuel (natural
gas/naphtha) and consequential reduction in
Co2 gas emission, a green house gas, thus
abating global warming.
The energy conservations measures taken in
Textiles Division has resulted in energy saving
and consequent decrease in cost of production.
d) Total Energy Consumption and Energy
Consumption per Unit of Production as per
prescribed Form – A:
As per annexure attached.
B. TECHNOLOGY ABSORPTION
Efforts made in technology absorption – as per
Form B given below:
Form – B
1) RESEARCH AND DEVELOPMENT
a) Specific areas in which research &
development (R&D) is being carried out
i) Rayon Division
• Developed and launched Lakshya Yarn
in Embroidery & High tenacity yarn
segment.
• Yarn trials are being taken in knitting
segment, which is comparatively a new
segment for Viscose Filament Yarn
(VFY) in India.
• Optimizing the key technical
parameters of different segments like
Embroidery & Knitting and joint
projects with customers to improve
upon the intrinsic quality of the yarn.

[75]
DIREC
TO
RS’ REPO
RT
• Study on different recipes for Viscose
for improving quality and optimizing
composition.
• Trials taken in Pilot plant with different
pulps to develop alternative Suppliers
of soft wood pulp.
• Developed Super fine denier yarns
both in Pot Spun Yarn (PSY) as well as
Continuous Spun Yarn (CSY).
• Dehumidifiers installed in at for low
temperature drying of cakes to
enhance the quality in terms of
whiteness and brightness of the yarn.
• Automation of Dye units in spinning
by installing dye to viscose ratio
controller for reducing shade variation.
• Focus enhanced on 200 chosen
shades to improve the repeatability
and reproducibility of the dyed yarn
and new “Denier wise shade Card”
introduced.
ii) Insulators Division
• The Plant at Rishra has developed
certain new products through its in
house R&D activities, Viz., 210 KN
A/F, 320 mm 80KN A/F, 320 mm
160KN A/F, 90 KN,120KN &160 KN
Semifog, 52-6, 52-10 (ANSI), 120 KN
Superfog
• Various product design modifications
were done with the objective of cost
optimization and quality consistency.
iii)Fertilisers Division
• Development activities towards Energy
Conservation, Waste Recycling,
Pollution Control and Quality
Improvement.
• Focused activities in the areas of new
product development i.e. Zincated,
Boronated & Sulfonated Urea
iv) Textiles Division
• Processing of very fine wool 14.5
micron by modification in process and
machine setting (2nd
best company in
the world to produce 14.5 micron wool)
ANNEXURE ‘C ’ TO THE DIRECTORS’ REPORT
• Auto suction of dust from carding and
modification in oil spray system on
scoured wool
b) Benefits derived as a result of the above
R & D.
The research and development activities
carried out in Rayon Division, has resulted
in Improvement in process and productive
capacity, Better quality and marketability of
products, Development of new market
segment, Value addition in the existing
products, Improved customer satisfaction,
Development of eco friendly products and
reduction of cost of production and
Providing edge for sourcing cost effective
raw material – Wood Pulp,
The research and development activities
carried out in Textiles Division has resulted
in Profitability is higher in case of fine wool
tops and Improvement in yield as wool fibre
going with dust could be stopped and also
breakage got reduced due to uniform spray
of oil on wool
In the year 2009-10, Fertilisers Divison
produced about 2.196 Lakhs MT of value
added product Neem-Coated Urea for the
farmers under the brand name
“KRISHIDEV”. In a very short time, company
established a leadership in the field of
Neem-coated Urea.
c) Future Plan of Action
i) Rayon Division
• Enhance colour yarn quality, Efforts
towards reduction of energy
consumption ratios of various
components of production,
Improvement in intrinsic quality of
yarn, Reduction in raw material
consumption, Development of
specialty yarn, Introducing our yarn in
new segments.
ii) Fertilisers Division
Continuous Research & Development
activities in area of New Product
Development.
• To achieve excellence in producing
and marketing value added products

[76]
DIREC
TO
RS’ REPO
RT
• Initiation of Project in association with
IIT, Kanpur for the removal of
Ammonia, Urea and Carbon-dioxide
from Ammonia/Urea Process
Condensate using novel membrane
techniques.
d) Expenditure on R&D
i) Capital Expenditure - Nil
ii) Recurring Expenditure - Rs. 170.90 Lacs
iii) Total - Rs. 170.90 Lacs
iv) Total R&D Expenditure
as a percentage
of total turnover - 0.04 %
2) TECHNOLOGY ABSORPTION, ADAPTATION
AND INNOVATION
a) Efforts in brief, made towards technology
absorption, adaptation and innovation
i) Rayon Division
• Activities carried out for optimization
of spinning process to improve the
physical properties of the yarn through
learning from other Spinners.
• Developed new dye recipes’ to
improve the coloured yarn quality with
the help of Dye Suppliers.
• Implemented various configurations on
spinning machines to improve the
intrinsic properties.
• As a result of benchmarking exercise,
process optimization carried out in
Spinning and Coning processes.
ANNEXURE ‘C ’ TO THE DIRECTORS’ REPORT
ii) Insulators Division
• Installed of Humidification System
during Blank Turning Operations.
• Installed necessary equipments and m/
c for producing polymer insulators.
iii)Fertilisers Division
• Continued efforts in preparation of
steam, power and material balances
and to check on the actual
performance against design
• Exploring the possibility for installation
of APC (Advance Process Control) in
Ammonia Plant. which would lead to
reduction in energy reduction and
consequently reduction in Co2
gas
emissions, a green house gas, thus
abating global warming.
b) Benefits derived as a result of the above
efforts
Quality improvement in existing range,
development of new market segments,
improvement in process, productivity, and
cost control, increase in customer base and
yield, improvement in energy consumption
and energy efficiency and reduction in input
material consumption.
c) Information regarding Technology
imported during the last years
• Technology imported during last five
years : NIL
• Has technology been fully absorbed :
Not Applicable

AU
DITO
RS’ REPO
RT
[77]
AUDITORS’ REPORT TO THE MEMBERS
FINANCIALS

AU
DITO
RS’ REPO
RT
[78]
AUDITORS’ REPORT TO THE MEMBERS
1. We have audited the attached Balance Sheet of Aditya Birla Nuvo Limited as at March 31, 2010 and
also the Profit and Loss Account and the Cash Flow Statement for the year ended on that date annexed
thereto. These financial statements are the responsibility of the Company’s management. Our responsibility
is to express an opinion on these financial statements based on our audit.
2. We conducted our audit in accordance with auditing standards generally accepted in India. Those
Standards require that we plan and perform the audit to obtain reasonable assurance about whether
the financial statements are free of material misstatement. An audit includes examining, on a test basis,
evidence supporting the amounts and disclosures in the financial statements. An audit also includes
assessing the accounting principles used and significant estimates made by management, as well as
evaluating the overall financial statement presentation. We believe that our audit provides a reasonable
basis for our opinion.
3. As required by the Companies (Auditor’s Report) Order, 2003 (as amended) (hereinafter referred to as
“the Order”) issued by the Central Government of India in terms of sub-section (4A) of Section 227 of
the Companies Act, 1956 (hereinafter referred to as “the Act”) we enclose in the Annexure a statement
on the matters specified in paragraphs 4 and 5 of the said Order.
4. Further to our comments in the Annexure referred to above, we report that:
i. We have obtained all the information and explanations, which to the best of our knowledge and
belief were necessary for the purposes of our audit;
ii. In our opinion, proper books of account as required by law have been kept by the Company so far
as it appears from our examination of those books. The Branch Auditor’s Report have been
forwarded to us and have been appropriately dealt with in this report;
iii. The Balance Sheet, Profit and Loss Account and Cash Flow Statement dealt with by this report are
in agreement with the books of account and with audited returns from the branches;
iv. In our opinion, the Balance Sheet, Profit and Loss Account and Cash Flow Statement dealt with by
this report comply with the accounting standards referred to in sub-section (3C) of section 211 of
the Act;
v. On the basis of written representations received from the directors as on March 31, 2010 and
taken on record by the Board of Directors, we report that none of the directors is disqualified as on
March 31, 2010 from being appointed as director in terms of section 274 (1)(g) of the Act;
vi. In our opinion and to the best of our information and according to the explanations given to us, the
said accounts give the information required by the Act in the manner so required and give a true
and fair view in conformity with the accounting principles generally accepted in India;
a) in the case of the Balance Sheet, of the state of affairs of the Company as at March 31, 2010;
b) in the case of the Profit and Loss Account, of the profit of the Company for the year ended on
that date; and
c) in case of Cash Flow Statement, of the cash flows of the Company for the year ended on that
date.
For KHIMJI KUNVERJI & CO. For S.R. BATLIBOI & CO.
Firm registration number: 105146W Firm registration number: 301003E
Chartered Accountants Chartered Accountants
Per Shivji K. Vikamsey Per Vijay Maniar
Partner Partner
Membership No.: 2242 Membership No.: 36738
Place: Mumbai Place: Mumbai
Date: May 07, 2010 Date: May 07, 2010

AU
DITO
RS’ REPO
RT
[79]
AUDITORS’ REPORT TO THE MEMBERS
Annexure referred to in paragraph 3 of our report of even date
Re: Aditya Birla Nuvo Limited
(i) (a) The Company has maintained proper records showing full particulars, including quantitative
details and situation of fixed assets.
(b) The Company has a phased program for physical verification of all its fixed assets which in our
opinion, is reasonable having regard to the size of the Company and the nature of its assets. As
informed, no material discrepancies were noticed on such verification.
(c) There was no substantial disposal of fixed assets during the year.
(ii) (a) The management has conducted physical verification of inventory at reasonable intervals during
the year.
(b) The procedures of physical verification of inventory followed by the management are reasonable
and adequate in relation to the size of the Company and the nature of its business.
(c) The Company is maintaining proper records of inventory and no material discrepancies were
noticed on physical verification.
(iii) (a) As informed, the Company has not granted any loans, secured or unsecured to companies, firms
or other parties covered in the register maintained under section 301 of the Act. Hence clause
(iii) (b), (c) & (d) of the Order are not applicable.
(e) As informed, the Company has not taken any loans, secured or unsecured from companies,
firms or other parties covered in the register maintained under section 301 of the Act. Hence
clauses (iii) (f) & (g) of the Order, are not applicable.
(iv) In our opinion and according to the information and explanations given to us, there is an adequate
internal control system commensurate with the size of the Company and the nature of its business, for
the purchase of inventory and fixed assets and for the sale of goods and services. During the course of
our audit, no major weakness has been noticed in the internal control system in respect of these areas.
(v) According to the information and explanations provided to us, there have been no transactions which
need to be entered in the register maintained under section 301 of the Act. Hence, clause (v) (b) of the
Order is not applicable to the Company.
(vi) In respect of deposits accepted, in our opinion and according to the information and explanations
given to us, directives issued by the Reserve Bank of India and the provisions of sections 58A, 58AA or
any other relevant provisions of the Act and the rules framed there under, to the extent applicable,
have been complied with. We are informed by the management that no order has been passed by the
Company Law Board, National Company Law Tribunal or Reserve Bank of India or any Court or any
other Tribunal.
(vii) In our opinion, the Company has an internal audit system commensurate with the size and nature of
its business.
(viii) We have broadly reviewed the books of account maintained by the Company pursuant to the rules
made by the Central Government for the maintenance of cost records under section 209(1)(d) of the
Act, in respect of the Company’s products to which the said rules are made applicable, and are of the
opinion that prima facie, the prescribed accounts and records have been made and maintained.
(ix) (a) The Company is generally regular in depositing with appropriate authorities undisputed statutory
dues including provident fund, investor education and protection fund, employees’ state insurance,
income-tax, sales-tax, wealth-tax, service tax, customs duty, excise duty, cess and other material
statutory dues applicable to it.
Further, since the Central Government has till date not prescribed the amount of cess payable
under section 441 A of the Act, we are not in a position to comment upon the regularity or
otherwise of the Company in depositing the same.

AU
DITO
RS’ REPO
RT
[80]
AUDITORS’ REPORT TO THE MEMBERS
(b) According to the information and explanations given to us, no undisputed amounts payable in
respect of provident fund, investor education and protection fund, employees’ state insurance,
income-tax, wealth-tax, service tax, sales-tax, customs duty, excise duty, cess and other undisputed
statutory dues were outstanding, at the year end, for a period of more than six months from the date
they became payable.
(c) According to the records of the Company, the dues outstanding of income-tax, sales-tax, wealth-
tax, service tax, customs duty, excise duty and cess on account of any dispute, are as follows:
Name of the Statute Nature of dues Amount Period to which the Forum where
(Rs. in Amount Relates Dispute is
Crores) pending
Central Excise Act Excise Duty including 2.65 1990-91 to 2009-10 Tribunal(s)
Interest and Penalty 10.42 1990-91 to 2009-10 Commissioner
(Appeals)
0.02 1977-78 High Court(s)
1.30 1984-85 to 2009-10 Assessing
Authorities
Sales Tax Act Sales Tax /Purchase 1981-82 to 1986-87 &
Tax including interest 0.45 1997-98 to 2004-05 Tribunal(s)
and Penalty2001-02, 2005-06 to
0.44 2006-07 & 2009-10 Commissioner
(Appeals)
1.22 2000-01 to 2002-03 High Court(s)
1988-89 to 1999-00 & Assessing
8.15 2002-03 to 2006-07 Authorities
Textile Commitee Act Textile Cess 0.63 1981-99 Tribunal(s)
0.65 1999-05 Assessing
Authorities
Entry Tax Tax Demand and 0.02 2002-03 to 2004-05 Assessing
Interest Authorities
75.37 2006-07 to 2009-10 High Court(s)
Value Added Tax Tax Demand and 0.06 2005-06 to 2006-07 Tribunal(s)
Interest/Non 0.04 2005-06 & 2008-09 Commissioner
Submission of forms (Appeals)
2.59 2005-06 to 2008-09 Assessing
Authorities
Customs Act Tax Demand and 0.11 2003-04 Tribunal(s)
Interest 1975-76 to 1976-77
0.39 1986-87 & 2001-02 High Court(s)
Income Tax Act Income Tax 11.39 1994-95 to 2008-09 Commissioner
(Appeals)
Employee’s State Employee’s State 0.07 1998-99 & 2003-06 Assessing
Insurance Act Insurance Dues Authorities
Electricity Tax Tamil Nadu Electricity Assessing
Taxation 3.21 1999-00 to 2007-08 Authorities
Finance Act, 1994 Service Tax 1.33 2003-04 to 2006-07 Tribunal(s)
(Service Tax) 0.38 2002-03 to 2006-07 Assessing
Authorities
U. P. Trade Tax Act, Tax Demand and 0.07 2002-03 Tribunal(s)
1948 Interest 0.07 2006-07 to 2007-08 Commissioner
(Appeals)

AU
DITO
RS’ REPO
RT
[81]
AUDITORS’ REPORT TO THE MEMBERS
(x) The Company has no accumulated losses at the end of the financial year and it has not incurred
cash losses in the current and immediately preceding financial year.
(xi) Based on our audit procedures and as per the information and explanations given by the management,
we are of the opinion that the Company has not defaulted in repayment of dues to a financial
institution, bank or debenture holders.
(xii) According to the information and explanations given to us and based on the documents and records
produced to us, the Company has not granted loans and advances on the basis of security by way of
pledge of shares, debentures and other securities.
(xiii) In our opinion, the Company is not a chit fund or a nidhi / mutual benefit fund / society. Therefore,
the provisions of clause 4(xiii) of the Order are not applicable to the Company.
(xiv) In our opinion, the Company is not dealing in or trading in shares, securities, debentures and other
investments. Accordingly, the provisions of clause 4(xiv) of the Order are not applicable to the
Company.
(xv) According to the information and explanations given to us, the Company has given guarantee for
loans taken by others from bank or financial institutions, the terms and conditions whereof in our
opinion are not prima-facie prejudicial to the interest of the Company.
(xvi) Based on information and explanations given to us by the management, term loans were applied for
the purpose for which the loans were obtained.
(xvii) According to the information and explanations given to us and on an overall examination of the
balance sheet of the Company, we report that no funds raised on short-term basis have been used for
long-term investment.
(xviii) The Company has made preferential allotment of shares to parties and companies covered in the
register maintained under section 301 of the Act. In our opinion the price at which shares have been
issued is not prejudicial to the interest of the Company.
(xix) According to the information and explanations given to us, during the period covered by our audit
report, the Company had issued 2,00,00,000 unsecured debentures of Rs.100 each on which no
security or charge is required to be created. The Company has created security or charge in respect of
secured debentures outstanding during the year.
(xx) The Company has not raised any money through a public issue during the year.
(xxi) According to the information and explanation given to us some irregularities by an employee has been
noticed by the management in the Seeds Business. The examination related to this is in progress and
the amount is yet to be quantified. The management has represented to us that the amount of
irregularities is not likely to be material in the context of the size of the Company. Apart from the
above, we have been informed that the Company has not noticed any fraud during the year.
For KHIMJI KUNVERJI & CO. For S.R. BATLIBOI & CO.
Firm registration number: 105146W Firm registration number: 301003E
Chartered Accountants Chartered Accountants
Per Shivji K. Vikamsey Per Vijay Maniar
Partner Partner
Membership No.: 2242 Membership No.: 36738
Place: Mumbai Place: Mumbai
Date: May 07, 2010 Date: May 07, 2010
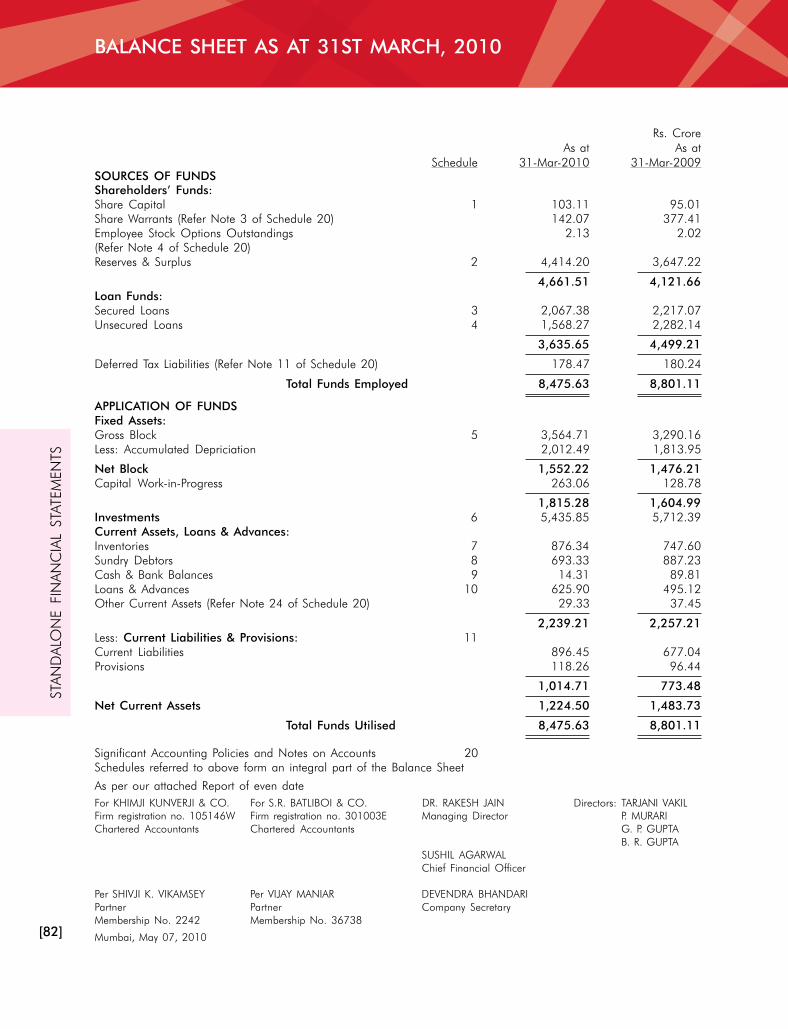
STA
ND
ALO
NE FIN
AN
CIA
L STATEM
EN
TS
[82]
BALANCE SHEET AS AT 31ST MARCH, 2010
Rs. Crore
As at As at
Schedule 31-Mar-2010 31-Mar-2009
SOURCES OF FUNDS
Shareholders’ Funds:
Share Capital 1 103.11 95.01
Share Warrants (Refer Note 3 of Schedule 20) 142.07 377.41
Employee Stock Options Outstandings 2.13 2.02
(Refer Note 4 of Schedule 20)
Reserves & Surplus 2 4,414.20 3,647.22
4,661.51 4,121.66
Loan Funds:
Secured Loans 3 2,067.38 2,217.07
Unsecured Loans 4 1,568.27 2,282.14
3,635.65 4,499.21
Deferred Tax Liabilities (Refer Note 11 of Schedule 20) 178.47 180.24
Total Funds Employed 8,475.63 8,801.11
APPLICATION OF FUNDS
Fixed Assets:
Gross Block 5 3,564.71 3,290.16
Less: Accumulated Depriciation 2,012.49 1,813.95
Net Block 1,552.22 1,476.21
Capital Work-in-Progress 263.06 128.78
1,815.28 1,604.99
Investments 6 5,435.85 5,712.39
Current Assets, Loans & Advances:
Inventories 7 876.34 747.60
Sundry Debtors 8 693.33 887.23
Cash & Bank Balances 9 14.31 89.81
Loans & Advances 10 625.90 495.12
Other Current Assets (Refer Note 24 of Schedule 20) 29.33 37.45
2,239.21 2,257.21
Less: Current Liabilities & Provisions: 11
Current Liabilities 896.45 677.04
Provisions 118.26 96.44
1,014.71 773.48
Net Current Assets 1,224.50 1,483.73
Total Funds Utilised 8,475.63 8,801.11
Significant Accounting Policies and Notes on Accounts 20
Schedules referred to above form an integral part of the Balance Sheet
As per our attached Report of even date
For KHIMJI KUNVERJI & CO. For S.R. BATLIBOI & CO. DR. RAKESH JAIN Directors: TARJANI VAKIL
Firm registration no. 105146W Firm registration no. 301003E Managing Director P. MURARI
Chartered Accountants Chartered Accountants G. P. GUPTA
B. R. GUPTA
SUSHIL AGARWAL
Chief Financial Officer
Per SHIVJI K. VIKAMSEY Per VIJAY MANIAR DEVENDRA BHANDARI
Partner Partner Company Secretary
Membership No. 2242 Membership No. 36738
Mumbai, May 07, 2010

STA
ND
ALO
NE FIN
AN
CIA
L STATEM
EN
TS
[83]
PROFIT AND LOSS ACCOUNT FOR THE YEAR ENDED 31ST MARCH, 2010
Rs. Crore
Year Ended Year Ended
Schedule 31-Mar-2010 31-Mar-2009
INCOME
Income from Operations 12 4,985.97 5,001.04
Less: Excise Duty 158.50 214.86
Net Income from Operations 4,827.47 4,786.18
Other Income 13 70.79 65.25
4,898.26 4,851.43
EXPENDITURE
(Increase)/Decrease in Stocks 14 5.06 (21.67)
Cost of Materials 15 2,391.20 2,564.69
Salaries, Wages and Employee Benefits 16 347.73 294.42
Manufacturing, Selling and Other Expenses 17 1,319.77 1,395.09
4,063.76 4,232.53
Profit before Interest, Depreciation/Amortisation and Tax 834.50 618.90
Interest and Finance Expenses 18 334.10 290.64
Profit before Depreciation/Amortisation and Tax 500.40 328.26
Depreciation/Amortisation 180.10 165.96
Profit before Tax 320.30 162.30
Provision for Taxation 19 36.90 24.87
Net Profit after Tax 283.40 137.43
Balance brought forward 86.03 21.06
Amount Transferred on account of Scheme of Arrangement (139.60) —
(Refer Note 5 of Schedule 20)
Profit Available for Appropriation 229.83 158.49
APPROPRIATIONS
Debenture Redemption Reserve 53.19 16.28
General Reserve 100.00 13.75
Proposed Dividend on Preference Shares β —
Proposed Dividend on Equity Shares 51.51 38.00
Corporate Tax on Dividend 7.95 4.43
Surplus Carried to Balance Sheet 17.18 86.03
229.83 158.49
Basic Earnings per Share - Rs. 28.81 14.46
Diluted Earnings per Share - Rs. (Refer Note 12 of Schedule 20) 27.62 14.46
(Face Value of Rs. 10/- each)
Significant Accounting Policies and Notes on Accounts 20
Schedules referred to above form an integral part of the Profit and Loss Account
As per our attached Report of even date
For KHIMJI KUNVERJI & CO. For S.R. BATLIBOI & CO. DR. RAKESH JAIN Directors: TARJANI VAKIL
Firm registration no. 105146W Firm registration no. 301003E Managing Director P. MURARI
Chartered Accountants Chartered Accountants G. P. GUPTA
B. R. GUPTA
SUSHIL AGARWAL
Chief Financial Officer
Per SHIVJI K. VIKAMSEY Per VIJAY MANIAR DEVENDRA BHANDARI
Partner Partner Company Secretary
Membership No. 2242 Membership No. 36738
Mumbai, May 07, 2010
}

STA
ND
ALO
NE FIN
AN
CIA
L STATEM
EN
TS
[84]
SCHEDULES
Rs. Crore
As at As at
Numbers 31-Mar-2010 31-Mar-2009
SCHEDULE 1
SHARE CAPITAL
Authorised:
Equity Shares of Rs. 10/- each 175,000,000 175.00 175.00
(175,000,000)
Redeemable Preference Shares of Rs. 100/- each 500,000 5.00 5.00
(500,000)
Total 180.00 180.00
Issued, Subscribed & Paid-up:
EQUITY SHARE CAPITAL
Equity Shares of Rs. 10/- each fully paid-up* 103,009,542 103.01 95.01
(95,009,290)
PREFERENCE SHARE CAPITAL
6% Redeemable Cumulative Preference Shares
of Rs. 100/- each, fully Paid-up+ 10,000 0.10 —
(NIL)
103.11 95.01
1. * Includes:
— 24,989,914 equity shares (Previous Year: 24,989,914) alloted as fully paid-up pursuant to contracts for
consideration other than cash.
— 23,375,235 equity shares (Previous Year: 23,375,185) issued as bonus shares by Capitalisation of Reserves
and Securities Premium.
— 3,262,792 equity shares (Previous Year: 3,277,725 ) represented by Global Depository Receipts.
2. Outstanding Warrants exercisable into 10,500,000 (Previous Year: 18,800,000) Equity Shares of Rs. 10/- each
(Refer Note 3 of Schedule 20).
3. Pursuant to the provisions of Section 206A of the Companies Act, 1956, the issue of following equity shares are
kept in abeyance:
Particulars No. of Shares
31-Mar-2010 31-Mar-2009
Right Issue (1994) 12,635 12,735
Bonus Shares on above 6,318 6,368
Right issue (2007) 24,159 24,281
43,112 43,384
4. Outstanding Employee Stock Options exercisable into 208,632 (Previous Year: 265,783) Equity Shares of
Rs. 10/- each (Refer Note 4 of Schedule 20).
5. + In Accordance with the Composite Scheme of Arrangement, 6% Redeemable Cumulative Preference Shares of
Rs. 100/- each fully paid-up are issued to preference shareholders (other than the ABNL) of Peter England
Fashions and Retail Limited. These preference shares are redeemable by the Company at any time after completion
of one year and on or before completion of five years from 01.01.2010 at the face value. (Refer Note 5 of
Schedule 20).
6. Figures in brackets represent corresponding number of shares of Previous Year.

STA
ND
ALO
NE FIN
AN
CIA
L STATEM
EN
TS
[85]
SCHEDULES
Rs. Crore
SCHEDULE 2
RESERVES & SURPLUS
Addition/
Balance as at Deduction Deductions/ Balance as at
31-Mar-2009 due to Scheme Additions Adjustments 31-Mar-2010
of Arrangement*
Capital Reserve 4.44 (119.16) 377.41 — 262.69
(Refer Note 3 of Schedule 20)
Capital Redemption Reserve 7.60 0.86 — β 8.46
Debenture Redemption Reserve 16.28 — 53.19 — 69.47
Securities Premium Account 1,503.18 — 424.96 — 1,928.14
General Reserve 2,009.74 (1.44) 100.01 — 2,108.31
Investment Allowance Reserve — 0.01 — 0.01 —
Investment Reserve 19.95 — — — 19.95
Surplus as per Profit and Loss Account 86.03 (139.60) 70.75 — 17.18
3,647.22 (259.33) 1,026.32 0.01 4,414.20
Previous Year 3,550.61 — 96.61 — 3,647.22
* Refer Note 5 of Schedule 20.
Rs. Crore
As at As at
31-Mar-2010 31-Mar-2009
SCHEDULE 3
SECURED LOANS
Non-Convertible Debentures 110.00 110.00
Loans from Banks 1,599.05 1,624.50
Other Loans:
Deferred Sales Tax Loan 78.99 87.50
Others 279.34 395.07
Refer Note 6 of Schedule 20. 2,067.38 2,217.07
SCHEDULE 4
UNSECURED LOANS
Fixed Deposits 0.82 3.51
Loans and Advances from Subsidiary Companies — 11.90
Short Term Loans From:
Banks 657.18 456.45
Commercial Paper [Maximum balance outstanding during the year 100.00 1,000.00
Rs. 1,000 Crore (Previous Year: Rs. 1,000 Crore)]
Other Loans From:
Banks 220.27 420.28
Non-Convertible Debentures 590.00 390.00
Refer Note 6 of Schedule 20. 1,568.27 2,282.14
Includes amounts repayable within one year 807.99 1,471.04

STA
ND
ALO
NE FIN
AN
CIA
L STATEM
EN
TS
[86]
SCHEDULES
SC
HED
ULE 5
FIXED
A
SSETS
Rs. C
rore
Gross Block
Depreciation/A
mortisation
Net Block
As at
Addition due to
Additions
Deductions/
As at
Upto at
Addition due to
For the
Deductions/
As at
As at
As at
31
-M
ar-0
9Schem
e of
for the Year
Adjustm
ents
31
-M
ar-1
03
1-M
ar-0
9Schem
e of
Year
Adjustm
ents
31
-M
ar-1
03
1-M
ar-1
03
1-M
ar-0
9
Arrangem
ent *
Arrangem
ent *
Tangible A
ssets
Land
Freehold
8.0
82
.4
4—
—1
0.5
2—
——
——
10
.5
28
.0
8
Leasehold
28
.8
6—
——
28
.8
61
.8
2—
0.1
5—
1.9
72
6.8
92
7.0
4
Railw
ay Sid
ing
5.8
4—
——
5.8
45
.5
5—
——
5.5
50
.2
90
.2
9
Buildin
gs
Freehold
26
8.2
0—
12
.1
7—
28
0.3
76
6.7
3—
6.4
0—
73
.1
32
07
.2
42
01
.4
7
Leasehold
0.5
92
3.1
0—
0.4
42
3.2
50
.1
54
.0
00
.3
50
.4
34
.0
71
9.1
80
.4
4
Leasehold
Im
provem
ents
7.5
91
.6
00
.1
5—
9.3
41
.1
30
.3
20
.9
5—
2.4
06
.9
46
.4
6
Pla
nt &
M
achin
ery
2,5
44
.6
71
28
.3
59
7.7
82
7.6
02
,7
43
.2
01
,4
83
.2
03
0.6
01
17
.8
52
2.0
31
,6
09
.6
21
,1
33
.5
81
,0
61
.4
7
Furniture, Fix
tures
& Equip
ment
19
1.2
51
8.0
81
5.4
36
.1
32
18
.6
39
3.9
97
.9
63
3.6
83
.2
21
32
.4
18
6.2
29
7.2
6
Vehic
les and A
ircraft
24
.7
90
.7
80
.9
42
.8
62
3.6
51
1.4
00
.3
53
.0
81
.8
51
2.9
81
0.6
71
3.3
9
Liv
estock
0.0
1—
——
0.0
10
.0
1—
——
0.0
1—
—
Intangible A
ssets
Goodw
ill
20
.3
50
.0
6—
—2
0.4
1—
——
——
20
.4
12
0.3
5
Tradem
ark/Brands/
Technic
al
Know
-how
16
7.2
06
.6
9—
—1
73
.8
91
37
.6
81
.5
91
3.8
8—
15
3.1
52
0.7
42
9.5
2
Specia
lised Softw
are
22
.7
42
.6
91
.3
1—
26
.7
41
2.3
00
.9
83
.9
2—
17
.2
09
.5
41
0.4
4
To
tal
3,2
90
.1
61
83
.7
91
27
.7
83
7.0
33
,5
64
.7
11
,8
13
.9
54
5.8
01
80
.2
62
7.5
32
,0
12
.4
91
,5
52
.2
21
,4
76
.2
1
Previo
us Year
3,1
11
.7
8—
21
7.6
33
9.2
43
,2
90
.1
61
,6
80
.8
9—
16
6.0
73
3.0
11
,8
13
.9
51
,4
76
.2
1
Notes:
Gross Blo
ck of Fix
ed A
ssets Inclu
des:
1.
Assets held
under co
-ow
nership
—
Leasehold
Land Rs. 1
8.2
3 C
rore (Previo
us Year: 1
8.2
3 C
rore), Buildin
gs Rs. 2
3.8
5 C
rore (Previo
us Year: Rs. 2
3.8
5 C
rore), Furniture, Fix
tures &
Equip
ment
Rs. 7
.7
9 C
rore (Previo
us Year: Rs. 7
.7
9 C
rore) and Vehic
les and A
ircraft Rs. 6
.8
3 C
rore (Previo
us Year: Rs. 6
.8
3 C
rore).
2.
The C
om
pany has m
ade an applicatio
n for exem
ptio
n under Sectio
n 2
0 of the U
rban Land (C
eilin
g &
Regula
tio
n) A
ct, 1
97
6, for excess la
nd of 4
.2
5 acres (Previo
us Year: 4
.2
5 acres) at Ris
hra.
3.
Buildin
gs in
clu
de Rs. 8
.1
9 C
rore (Previo
us Year: 8
.1
9 C
rore) bein
g cost of D
ebentures of and Shares in
a C
om
pany entitling the rig
ht of exclu
siv
e occupancy and use of certain
prem
ises.
4.
Pla
nt &
M
achin
ery in
clu
des Rs. 1
.5
4 C
rore (Previo
us: Year Rs. 1
.5
4 C
rore) bein
g assets not ow
ned by the C
om
pany.
* Refer N
ote 5
of Schedule
2
0.

STA
ND
ALO
NE FIN
AN
CIA
L STATEM
EN
TS
[87]
Rs. Crore
As at As at
Face Value Number 31-Mar-2010 Number 31-Mar-2009
SCHEDULE 6
INVESTMENTS
LONG TERM INVESTMENTS
Government Securities
National Saving Certificates (Unquoted) — β — β
Trade Investments
QUOTED
Equity Shares:
Hindalco Industries Limited 1 33,506,337 201.48 33,506,337 201.48
IDEA Cellular Limited 10 837,526,221 2,355.81 837,526,221 2,355.81
UNQUOTED
Equity Shares:
Birla Securities Limited 10 495,800 β 495,800 β
[Net of provision in diminution in value of
Rs. 2.52 Crore (Previous Year: Rs. 2.52 Crore)]
LIL Investment Limited 10 1,024,997 1.03 — —
Madura Garments International Brand
Company Limited 10 999,997 1.00 — —
Birla Sun Life Trustee Company Private
Limited 10 — — 9,950 0.01
Birla Sun Life Asset Management Company
Limited 10 — — 9,000,000 14.31
Aditya Birla Science & Technology Limited 10 2,400,000 2.40 2,400,000 2.40
Birla Management Centre Services Limited 10 7,000 β — —
Preference Shares:
3.50% Cumulative Redeemable Preference
Shares of Aditya Birla Health Services Limited # 100 1,500,000 15.00 1,500,000 15.00
8.0% Preference Shares of Birla Management
Centre Services Limited 10 200 β — —
Investment in Subsidiary Companies:
QUOTED
Equity Shares:
Aditya Birla Money Limited (Formerly known
as Apollo Sindhoori Capital Investments Limited) 1 — — 42,104,000 251.62
UNQUOTED
Equity Shares:
Aditya Vikram Global Trading House Limited,
Mauritius US$ 1 850,000 3.70 850,000 3.70
Aditya Birla Minacs Worldwide Limited 1 20,738,378 218.78 20,738,378 218.78
Aditya Birla Financial Services Private Limited 10 110,000,000 110.00 2,000,000 2.00
Aditya Birla Money Mart Limited (Formerly
known as Birla Sun Life Distribution
Company Limited) 10 20,000,000 24.08 7,174,999 11.23
Aditya Birla Finance Limited (Formerly known
as Birla Global Finance Company Limited) 10 75,000,000 75.00 105,964,841 102.62
SCHEDULES
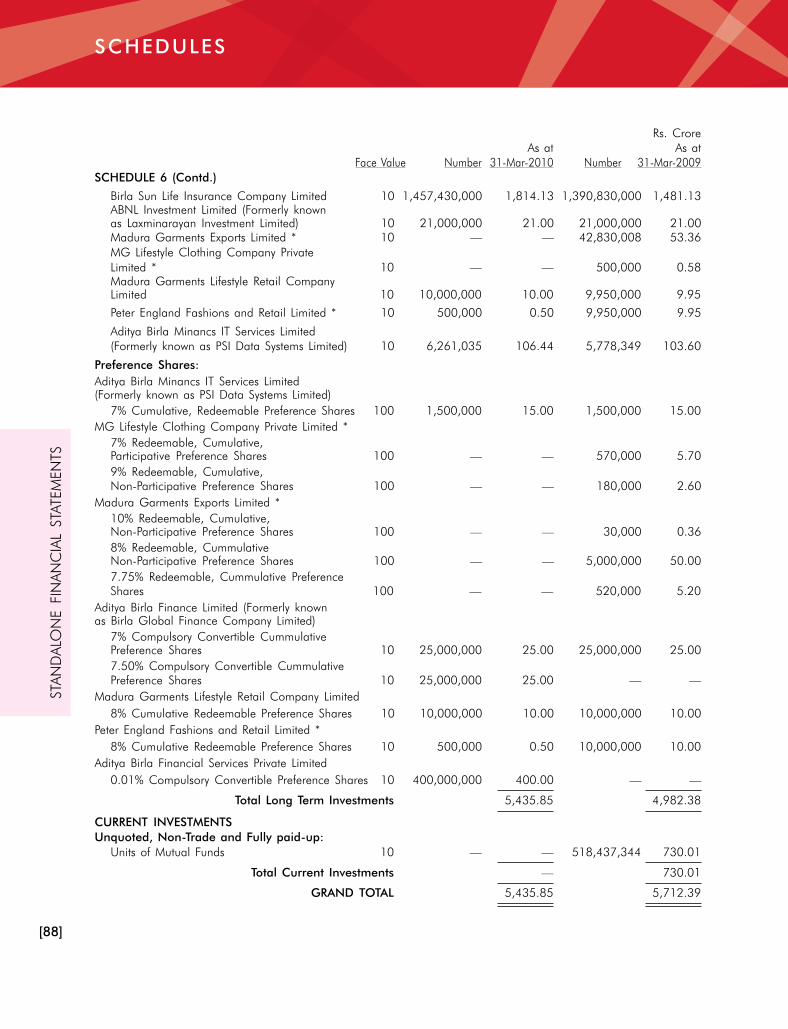
STA
ND
ALO
NE FIN
AN
CIA
L STATEM
EN
TS
[88]
Rs. Crore
As at As at
Face Value Number 31-Mar-2010 Number 31-Mar-2009
SCHEDULE 6 (Contd.)
Birla Sun Life Insurance Company Limited 10 1,457,430,000 1,814.13 1,390,830,000 1,481.13
ABNL Investment Limited (Formerly known
as Laxminarayan Investment Limited) 10 21,000,000 21.00 21,000,000 21.00
Madura Garments Exports Limited * 10 — — 42,830,008 53.36
MG Lifestyle Clothing Company Private
Limited * 10 — — 500,000 0.58
Madura Garments Lifestyle Retail Company
Limited 10 10,000,000 10.00 9,950,000 9.95
Peter England Fashions and Retail Limited * 10 500,000 0.50 9,950,000 9.95
Aditya Birla Minancs IT Services Limited
(Formerly known as PSI Data Systems Limited) 10 6,261,035 106.44 5,778,349 103.60
Preference Shares:
Aditya Birla Minancs IT Services Limited
(Formerly known as PSI Data Systems Limited)
7% Cumulative, Redeemable Preference Shares 100 1,500,000 15.00 1,500,000 15.00
MG Lifestyle Clothing Company Private Limited *
7% Redeemable, Cumulative,
Participative Preference Shares 100 — — 570,000 5.70
9% Redeemable, Cumulative,
Non-Participative Preference Shares 100 — — 180,000 2.60
Madura Garments Exports Limited *
10% Redeemable, Cumulative,
Non-Participative Preference Shares 100 — — 30,000 0.36
8% Redeemable, Cummulative
Non-Participative Preference Shares 100 — — 5,000,000 50.00
7.75% Redeemable, Cummulative Preference
Shares 100 — — 520,000 5.20
Aditya Birla Finance Limited (Formerly known
as Birla Global Finance Company Limited)
7% Compulsory Convertible Cummulative
Preference Shares 10 25,000,000 25.00 25,000,000 25.00
7.50% Compulsory Convertible Cummulative
Preference Shares 10 25,000,000 25.00 — —
Madura Garments Lifestyle Retail Company Limited
8% Cumulative Redeemable Preference Shares 10 10,000,000 10.00 10,000,000 10.00
Peter England Fashions and Retail Limited *
8% Cumulative Redeemable Preference Shares 10 500,000 0.50 10,000,000 10.00
Aditya Birla Financial Services Private Limited
0.01% Compulsory Convertible Preference Shares 10 400,000,000 400.00 — —
Total Long Term Investments 5,435.85 4,982.38
CURRENT INVESTMENTS
Unquoted, Non-Trade and Fully paid-up:
Units of Mutual Funds 10 — — 518,437,344 730.01
Total Current Investments — 730.01
GRAND TOTAL 5,435.85 5,712.39
SCHEDULES

STA
ND
ALO
NE FIN
AN
CIA
L STATEM
EN
TS
[89]
Aggregate Book Value - Quoted 2,557.29 2,808.90
- Unquoted 2,878.56 2,903.49
Aggregate Market Value - Quoted 6,093.10 4,419.73
Number Number
1. Units of various Mutual Funds schemes
purchased and redeemed during the year 7,236,492,901 3,178,606,002
# Each Preference Share is optionally convertible into 10 Equity Shares
of Rs. 10/- each fully paid-up on the expiry of a period of 15 years
from the date of allotment.
* Refer Note 5 of Schedule 20.
– All Shares are fully paid-up unless otherwise stated.
– Refer Note 8 of Schedule 20.
Rs. Crore
As at As at
31-Mar-2010 31-Mar-2009
SCHEDULE 7
INVENTORIES
Finished Goods 293.72 288.72
Stores and Spares 99.04 81.83
Raw Materials 416.33 320.71
Work-in-Progress 67.09 56.04
Waste/Scrap 0.16 0.30
876.34 747.60
SCHEDULE 8
SUNDRY DEBTORS *
(Unsecured, Considered Good except otherwise stated)
Due for period exceeding six months 36.21 17.79
[Net of doubtful, fully provided Rs. 15.14 Crore
(Previous Year: Rs. 9.5 Crore)]
Others # 657.12 869.44
[Net of doubtful, fully provided Rs. 0.02 Crore
(Previous Year: Rs. Nil Crore)]
693.33 887.23
* Includes amount in respect of which the Company holds deposits 55.89 74.75
and Letters of Credit/Guarantees from Banks.
# Includes subsidy receivable from Government of India Rs. 108.28 Crore
(Previous Year: Rs. 305.77 Crore).
SCHEDULE 9
CASH & BANK BALANCES
Cash in Hand 0.91 0.56
Cheques in Hand and Remittances in Transit 1.65 5.78
Balances with Scheduled Banks: *
Current Accounts 10.56 29.71
Deposit Accounts 1.13 53.76
Balances with Non-Scheduled Banks: #
On Current Account - (HSBC Bank, UK) 0.06 —
14.31 89.81
* Includes balance pertains to Right Issue Refund Order 0.07 0.08
* Includes balance pertains to Unclaimed Dividend 2.39 2.27
# Maximum amount due at any time during the year (HSBC Bank, UK) 1.92 —
# Maximum amount due at any time during the year (Standard Chartered Bank, UK) — β
Rs. Crore
As at As at
31-Mar-2010 31-Mar-2009
SCHEDULE 6 (Contd.)
SCHEDULES

STA
ND
ALO
NE FIN
AN
CIA
L STATEM
EN
TS
[90]
Rs. Crore
As at As at
31-Mar-2010 31-Mar-2009
SCHEDULE 10
LOANS & ADVANCES
(Unsecured, Considered Good except otherwise stated)
Due from Subsidiary Companies 199.48 88.54
Advances recoverable in cash or in kind or for
value to be received + 158.18 194.50
[Net of Doubtful, fully provided Rs. 1.88 Crore
(Previous Year: Rs. 1.07 Crore)]
Deposits+ 129.59 135.29
[Net of Doubtful, fully provided Rs. 2.31 Crore
(Previous Year: Rs. 0.32 Crore)]
Balances with Central Excise, Customs and Port Trust, etc. 106.35 58.01
[Net of Provision Rs. 3.04 Crore (Previous Year: Rs. 3.04 Crore)]
Advance Tax and Tax Deducted at Source 17.21 18.78
MAT Credit Entitlement 15.09 —
(Refer Note 9 of Schedule 20) 625.90 495.12
+ includes
(1) Amount due from Officers — 0.03
(2) Maximum Amount Due from Officers at any time during the year 0.03 0.04
SCHEDULE 11
CURRENT LIABILITIES & PROVISIONS
Current Liabilities:
Acceptances 47.90 28.02
Due to Subsidiary 0.11 14.18
Sundry Creditors
- Due to Micro and Small Enterprises (Refer Note 10 of Schedule 20) 1.45 1.06
- Other than Micro and Small Enterprises 639.91 449.76
Advances from Customers 56.64 39.31
Investors Education and Protection Fund to be credited as and when due
- Unpaid Dividend 2.39 2.27
- Unpaid Application Money 0.07 0.08
- Unpaid Matured Deposits 0.03 0.03
- Interest Accrued on above 0.02 0.02
Interest Accrued but not Due on Loans 59.72 66.57
Other Liabilities 88.21 75.74
896.45 677.04
Provisions For:
Proposed Dividend 51.51 38.00
Corporate Tax on Dividend 7.95 4.43
Retirement Benefits 58.80 54.01
118.26 96.44
1,014.71 773.48
SCHEDULES

STA
ND
ALO
NE FIN
AN
CIA
L STATEM
EN
TS
[91]
Rs. Crore
Year Ended Year Ended
31-Mar-2010 31-Mar-2009
SCHEDULE 12
INCOME FROM OPERATIONS
A. SALES
Revenue from Sale of Products 4,851.75 4,895.52
Income from Services 9.11 6.93
4,860.86 4,902.45
B. OTHER OPERATING INCOME
Scrap Sales 8.77 8.44
Export Incentives 35.51 35.74
Licence Fees and Royalties 1.32 1.96
Insurance Claim — 3.83
Government Grant 1.83 0.96
Power and Steam Sales 73.30 42.75
Certified Emission Reductions 4.12 4.61
Miscellaneous Other Operating Income 0.26 0.30
125.11 98.59
4,985.97 5,001.04
SCHEDULE 13
OTHER INCOME
Dividends on Long Term Investments:
Trade 4.52 3.77
Subsidiaries 3.29 11.56
Dividends on Current Investments (Non-Trade) 0.19 1.48
Profit/(Loss) on Sale of Investments (Net):
Current 7.82 6.87
Long Term (0.13) —
Interest on Long Term Investments — 0.01
Interest on Inter-Corporate Deposit 40.30 16.43
[Tax deducted at source 5.83 Crore
- (Previous Year: Rs. 3.76 Crore)]
Others Interest 8.31 16.95
[Tax deducted at source Rs. 0.30 Crore
- (Previous Year: Rs. 1.38 Crore)]
Miscellaneous Income 6.49 8.18
70.79 65.25
SCHEDULE 14
(INCREASE)/DECREASE IN STOCKS
Closing Stocks:
Finished Goods 293.72 288.72
Work-in-Progress 67.09 56.04
Waste/Scrap 0.16 0.30
360.97 345.06
Less: Opening Stocks:
Finished Goods 288.72 273.61
Work-in-Progress 56.04 53.48
Waste/Scrap 0.30 0.08
345.06 327.17
(Increase)/Decrease in Excise Duty on Stocks 1.90 (3.78)
Less: Stock acquired on 1st January, 2010, Pursuant to scheme
of arrangement (Refer Note 5 of Schedule 20) 19.07 —
(Increase)/Decrease 5.06 (21.67)
SCHEDULES

STA
ND
ALO
NE FIN
AN
CIA
L STATEM
EN
TS
[92]
Rs. Crore
Year Ended Year Ended
31-Mar-2010 31-Mar-2009
SCHEDULE 15
COST OF MATERIALS
Raw Material Consumption 2,192.30 2,322.01
Purchase of Finished Goods 198.90 242.68
2,391.20 2,564.69
SCHEDULE 16
SALARIES, WAGES AND EMPLOYEE BENEFITS
Payments to and Provisions for Employees:
Salaries, Wages and Bonus 302.51 253.41
Contribution to Provident & Other Funds 27.94 22.23
Welfare Expenses 17.18 17.49
Employee Compensation under ESOP 0.10 1.29
(Refer Note 4 of Schedule 20)
347.73 294.42
SCHEDULE 17
MANUFACTURING, SELLING & OTHER EXPENSES
Consumption of Stores & Spares 186.79 184.93
Power & Fuel 431.57 537.38
Processing Charges 86.50 82.78
Commission to Selling Agents 80.41 72.39
Brokerage & Discounts 13.19 9.17
Advertisement 60.75 52.86
Transportation & Handling Charges (Net) 47.63 56.12
Other Selling Expenses 136.65 130.12
Auditors’ Remuneration 2.20 1.88
Provisions for Bad & Doubtful Debts and Advances (Net) 3.46 (3.32)
Repairs & Maintenance of:
Buildings 7.84 6.59
Plant & Machinery 30.62 28.86
Others 5.25 8.30
Rent 118.42 116.04
Rates & Taxes 6.20 3.83
Insurance 8.90 6.78
Donations 0.52 0.70
Directors’ Fees and Travelling Expenses 0.21 0.15
Research & Development Expenses 1.71 1.80
Miscellaneous Expenses (Refer Note 13 of Schedule 20) 90.95 97.73
1,319.77 1,395.09
SCHEDULE 18
INTEREST AND FINANCE EXPENSES
On Debentures and Fixed Loans* 280.12 196.28
Others 40.85 78.15
Finance Expenses 13.13 16.21
334.10 290.64
*Net of Interest Rebate Subsidy from Technology Upgradation Fund 8.38 8.34
SCHEDULES

STA
ND
ALO
NE FIN
AN
CIA
L STATEM
EN
TS
[93]
SCHEDULES
Rs. Crore
Year Ended Year Ended
31-Mar-2010 31-Mar-2009
SCHEDULE 19
PROVISION FOR TAXATION
Current Tax 62.54 76.95
MAT Credit (15.09) —
Deferred Tax (6.30) (21.05)
Fringe Benefit Tax — 4.12
Write back of excess provision for Tax/Income Tax
refund related to earlier years (Net) (4.25) (35.15)
36.90 24.87
SCHEDULE 20
SIGNIFICANT ACCOUNTING POLICIES AND NOTES ON ACCOUNTS
A. ACCOUNTING CONVENTION
(I) BASIS OF PREPARATION
The financial statements have been prepared under the historical cost convention on an accrual basis in
compliance with all material aspect of the Accounting Standard Notified by the Companies Accounting
Standard Rules, 2006 (as amended), and the relevant provisions of the Companies Act, 1956. The
accounting policies have been consistently applied by the Company, and are consistent with those used in
the previous year.
(II) FIXED ASSETS
Fixed assets are stated at cost, less accumulated depreciation and impairment loss, if any. Cost comprises
the purchase price and any attributable cost of bringing the asset to its working condition for its intended
use.
(III) DEPRECIATION/AMORTISATION
a) Depreciation on Fixed Assets is provided on Straight Line Method at the rates and in the manner
specified in the Schedule XIV of the Companies Act, 1956, except in the case of the following, where
depreciation is equally charged over the estimated useful lives.
Estimated useful life
Capital Expenditure on Assets not owned - 5 years
Office Computers - 4 years
Vehicles - 5 years
Assets at Showrooms - 5 years
Furniture, Fixtures and Equipment - 7 years
Office Electronic Equipment - 4 years
Leasehold Land/Improvements - Over the primary period of the lease
Catalyst - On the estimated life as technically assessed
(ranging from 1.5 to 3 years)
b) Intangible Assets are Amortised Equally over:
Trademarks/Brands - 10 years
Technical Know-how - 7 years
Specialised Software - 3 years
Goodwill - Not being amortised
(Tested for Impairment)
c) Depreciation on the Fixed Assets, added/disposed off/discarded during the year, is provided on pro-
rata basis with reference to the month of addition/disposal/discarding.
“Continuous process plants” are classified based on technical assessment, and depreciation is
provided accordingly.

STA
ND
ALO
NE FIN
AN
CIA
L STATEM
EN
TS
[94]
SCHEDULES
(IV) IMPAIRMENT OF ASSETS
The carrying amounts of assets are reviewed at each Balance Sheet date if there is any indication of
impairment, based on internal/external factors. An asset is treated as impaired when the carrying cost of
the assets exceeds its recoverable value. An impairment loss, if any, is charged to the Profit and Loss
Account in the year in which an asset is identified as impaired. Reversal of impairment losses recognised in
prior years is recorded when there is an indication that the impairment losses recognised for the assets no
longer exist or have decreased.
(V) BORROWING COSTS
Borrowing costs attributable to acquisition and construction of qualifying assets, are capitalised as a part
of the cost of such asset upto the date when such assets are ready for its intended use.
Other borrowing costs are charged to the Profit and Loss Account.
(VI) TRANSLATION OF FOREIGN CURRENCY ITEMS
Transactions in foreign currency are recorded at the rate of exchange prevailing on the date of transaction.
Foreign currency monetary items are reported using closing rate of exchange at the end of the year. The
resulting exchange gain/loss is reflected in the Profit and Loss Account. Other non-monetary items, like
fixed assets, investments in equity shares, are carried in terms of historical cost using the exchange rate at
the date of transaction. Premium/Discount, in respect of forward foreign exchange contract, is recognised
over the life of the contracts. Profit/Loss on cancellation/renewal of forward exchange contract is recognised
as income/expense for the year.
(VII) DERIVATIVE INSTRUMENTS
The Company uses derivative financial instruments such as forward exchange contracts, currency swaps
and interest rate swaps to hedge its risks associated with foreign currency fluctuations and interest rate.
Currency and interest rate swaps are accounted in accordance with their contract.
(VIII) INVESTMENTS
Investments are recorded at cost on the date of purchase, which includes acquisition charges such as
brokerage, stamp duty, taxes, etc. Current Investments are stated at lower of cost and fair value. Long term
investments are stated at cost after deducting provisions made, if any, for other than temporary diminution
in the value.
(IX) INVENTORIES
Raw materials, components, stores and spares are valued at lower of cost and net realisable value.
However, these items are considered to be realisable at cost if the finished products in which they will be
used are expected to be sold at or above cost.
Work-in-progress and finished goods are valued at lower of cost and net realisable value. Finished goods
and work-in-progress include costs of conversion and other costs incurred in bringing the inventories to
their present location and condition.
Cost of inventories is computed on a weighted average/FIFO basis.
Proceeds in respect of sale of raw materials/stores are credited to the respective heads. Obsolete,
defective and unserviceable inventory is duly provided for.
(X) GOVERNMENT GRANTS
Government Grants are recognised when there is reasonable assurance that the same will be received.
Revenue grants are recognised in the Profit and Loss Account. Capital grants relating to specific fixed
assets are reduced from the gross value of the respective fixed assets. Other capital grants are credited to
capital reserve.
(XI) REVENUE RECOGNITION
Sales are recorded net of trade discounts, rebates and include excise duty. Revenue from sale of products
is recognised when the significant risks and rewards of ownership of the goods have passed to the buyer.
Income from services are recognised as they are rendered based on agreements/arrangements with the
concerned parties.
SCHEDULE 20 (Contd.)
SIGNIFICANT ACCOUNTING POLICIES AND NOTES ON ACCOUNTS

STA
ND
ALO
NE FIN
AN
CIA
L STATEM
EN
TS
[95]
SCHEDULE 20 (Contd.)
SIGNIFICANT ACCOUNTING POLICIES AND NOTES ON ACCOUNTS
SCHEDULES
Fertiliser price support under Group Concession and other Scheme of Government of India is recognised
based on management’s estimate taking into account the known policy parameters and input price
escalation/de-escalation.
Income from Certified Emission Reductions (CERs) is recognised at estimated realisable value on confirmation
of CERs by the concerned authorities.
Dividend income on investments is accounted for when the right to receive the payment is established.
(XII) RETIREMENT AND OTHER EMPLOYEE BENEFITS
(i) Defined Contribution Plan
The Company makes defined contribution to Provident Fund, ESI and Superannuation Schemes
which are recognised in the Profit and Loss Account on accrual basis.
(ii) Defined Benefit Plan
The Company’s liabilities under Payment of Gratuity Act, long term compensated absences and
pension are determined on the basis of actuarial valuation made at the end of each financial year,
using the projected unit credit method except for short term compensated absences which are
provided for based on estimates. Actuarial gain and losses are recognised immediately in the
statement of Profit and Loss Account as income or expense. Obligation is measured at the present
value of estimated future cash flows, using a discounted rate that is determined by reference to
market yields at the Balance Sheet date on Government bonds where the currency and terms of the
Government bonds are consistent with the currency and estimated terms of the defined benefit
obligation.
(XIII) EMPLOYEE STOCK OPTIONS
The stock options granted are accounted for as per the accounting treatment prescribed by Employee
Stock Option Scheme and Employee Stock Purchase Guidelines, 1999, issued by Securities and Exchange
Board of India, whereby the intrinsic value of the option is recognised as deferred employee compensation.
The deferred employee compensation is charged to Profit & Loss Account on straight-line basis over the
vesting period of the option. The employee stock option outstanding account is shown net of any
unamortised deferred employee compensation.
(XIV) TAXATION
Tax expense comprises of current, deferred tax.
Provision for current tax is made on the basis of estimated taxable income for the current accounting year
in accordance with the Income Tax Act, 1961.
The deferred tax for timing differences between the book and tax profits for the year is accounted for, using
the tax rates and laws that have been substantively enacted as of the Balance Sheet date. Deferred tax
assets arising from timing differences are recognised to the extent there is reasonable certainty that these
would be realised in future.
In case of unabsorbed losses and unabsorbed depreciation, all deferred tax assets are recognised only if
there is virtual certainty supported by convincing evidence that they can be realised against future taxable
profit. At each Balance Sheet date, the Company reassesses the unrecognised deferred tax assets.
Minimum Alternative Tax (MAT) credit is recognised as an asset only when and to the extent there is
convincing evidence that the Company will pay normal income tax during the specified period. In the year,
in which the MAT credit becomes eligible to be recognised as an asset in accordance with the
recommendations contained in the Guidance Note issued by the ICAI, the said asset is created by way of
a credit to the Profit and Loss Account and shown as MAT Credit Entitlement. The Company reviews the
same at each Balance Sheet date, and writes down the carrying amount of MAT Credit Entitlement to the
extent there is no longer convincing evidence to the effect that the Company will pay normal Income Tax
during the specified period.
(XV) OPERATING LEASES
Leases, where significant portion of risk and reward of ownership are retained by the Lessor, are classified
as Operating Leases and lease rentals thereon are charged to the Profit and Loss Account on a straight-
line basis over lease term.
Lease income is recognised in the Profit and Loss Account on a straight-line basis over lease term.

STA
ND
ALO
NE FIN
AN
CIA
L STATEM
EN
TS
[96]
SCHEDULE 20 (Contd.)
SIGNIFICANT ACCOUNTING POLICIES AND NOTES ON ACCOUNTS
(XVI) CONTINGENT LIABILITIES AND PROVISIONS
Contingent Liabilities are possible but not probable obligations as on Balance Sheet date, based on the
available evidence.
Provisions are recognised when there is a present obligation as a result of past event, and it is probable
that an outflow of resources will be required to settle the obligation, in respect of which a reliable estimate
can be made.
Provisions are determined based on the best estimate required to settle the obligation at the Balance Sheet
date.
B. NOTES ON ACCOUNTS
Rs. Crore
Current Year Previous Year
1. Contingent Liabilities not provided for:
a) Claims against the Company not acknowledged as debts
i) Income-tax 82.52 84.66
ii) Custom Duty 0.23 1.11
iii) Excise Duty 29.06 28.03
iv) Sales Tax 85.72 70.66
v) Service Tax 1.04 1.01
vi) Others 35.05 54.13
b) Bills discounted with Banks 66.16 50.17
c) Corporate Guarantees given to Banks for loans taken by subsidiaries 356.39 616.11
d) Corporate Guarantees given in connection with performance obligation
of the subsidiaries 88.88 38.21
e) Customs Duty on capital goods and raw materials imported under advance
licensing/EPCG scheme, against which export obligation is to be fulfilled 42.96 11.34
f) Under the Jute Packaging Material (Compulsory use of Packing Commodities) Act, 1987, a specified percentage
of fertilisers dispatched was required to be supplied in jute bags upto 31st August, 2001. The unit made
conscious efforts to use jute packaging material as required under the said Act. However, due to non-
availability of material as per the unit’s product specifications as well as due to strong customer resistance to
use of jute bags, the specific percentage could not be adhered to. The unit has received a show cause notice,
against which a writ petition has been filed with the Hon’ble High Court, which is awaiting for hearing. The
Jute Commissioner, Kolkata had filed transfer petition, various writ petitions has been filed in different High
Courts have by other aggrieved parties, including the unit, before the Hon’ble Supreme Court of India,
praying for consolidation of all cases at one Court. The transfer petition is pending before the Hon’ble
Supreme Court. The unit has been advised that the said levy is bad in law.
g) Idea Cellular Ltd. (Idea), in which the Company currently has the largest shareholding, was originally a
tripartite joint venture between A.V. Birla Group, Tata Group and AT&T Group. With the exit of AT&T and the
Tata Group, Idea is now part of A.V. Birla Group. Prior to its exit, Tata Group had alleged that the A.V. Birla
Group had committed material breach of the Shareholders’ Agreements and the Tata Group invoked the
arbitration clause, pursuant to which an Arbitral Tribunal has been constituted, which will be considering the
claims of the Tata Group and the counter-claims of the A.V. Birla Group.
The Company believes that it has a strong case to counter the allegations of breach, and it does not
contemplate any liability to arise on this matter.
SCHEDULES

STA
ND
ALO
NE FIN
AN
CIA
L STATEM
EN
TS
[97]
SCHEDULE 20 (Contd.)
SIGNIFICANT ACCOUNTING POLICIES AND NOTES ON ACCOUNTS
Rs. Crore
Current Year Previous Year
2. a) Estimated amount of contracts remaining to be executed on capital
account and not provided for (Net of Advances) 64.60 80.35
b) Aditya Birla Minacs Worldwide Ltd. (‘ABMWL’), a subsidiary of the Company, has issued Zero Coupon Compulsorily
Convertible Debentures (‘CCD’) aggregating Rs. 250 Crore to be converted into Equity of ABMWL on the expiry
of a period of 60 months from the date of allotment of such CCD. The Company has entered into an option
agreement with the subscribers of such CCD, pursuant to which the subscribers has call option on the Company
and the Company has put option on the subscribers on expiry of 24, 36, 48 and 60 months from the date of
allotment of CCD at a pre-agreed price. Further on happening of certain events, the put option can also be
exercised by the subscribers on the Company on any other date on happening of such events.
3. a) In accordance with approval of the shareholders in the extra-ordinary general meeting of the Company held
on June 17, 2009, the Company has, on a preferential basis, issued 1.85 Crore Warrants of Rs. 10/- each
to the Promoter and/or Promoter Group at a price of Rs. 541.19. The holder of each Warrant is entitled to
apply for and obtain allotment of 1 Equity Share against each Warrant at any time after the date of allotment
but on or before the expiry of 18 months from the allotment in one or more tranches. The Company has
received an amount of Rs. 250.30 Crore equivalent to 25% of the price and Rs. 324.71 Crore (net of receipt
of Rs. 108.23 Crore received on allotment of warrant) on exercise of 80 Lacs Warrants of Rs. 10/- each by
the Promoter Group. Total amount of Rs. 575.01 Crore received from the preferential allotment of the
warrants has been fully utilised.
b) One of the Promoter Group, holding 1.88 Crore Warrants issued to it on a preferential basis on February 21,
2008, had informed the Company that it will not exercise the option of acquiring equity shares in respect of
the above Warrants. Consequently, Rs. 377.41 Crore paid by the said Promoter Group Company, being 10%
of the issue price, has been forfeited and transferred to capital reserves. Also the option attached to the
aforesaid Warrants has been cancelled.
4. a) Under the Employee Stock Options Scheme - 2006 (ESOS - 2006 ), the Company has granted options to the
eligible employees of the Company and its Subsidiaries. These options are convertible into equivalent equity
shares of the Company. The details are as under:
(A) Employees Stock Option Scheme:
Particulars Tranche - I Tranche - II
No. of Options * 163,280 166,093
Method of Accounting Intrinsic Value Intrinsic Value
Vesting Plan Graded Vesting - Graded Vesting -
25% every year 25% every year
Exercise Period 5 years from the 5 years from the
date of Vesting date of Vesting
Grant Date 23.08.2007 25.01.2008
Grant/Exercise Price (Rs. Per Share) 1,180.00 1,802.00
Market Price on the date of Grant of Option 1,282.55 1,948.70
(Rs. Per Share)
SCHEDULES

STA
ND
ALO
NE FIN
AN
CIA
L STATEM
EN
TS
[98]
SCHEDULE 20 (Contd.)
SIGNIFICANT ACCOUNTING POLICIES AND NOTES ON ACCOUNTS
(B) Movement of Options Granted:
Particulars Current Year Previous Year
Options outstanding at the beginning of the year 265,783 326,013
Granted during the year — —
Exercised during the year — —
Lapsed during the year 57,151 60,230
Options outstanding at the end of the year 208,632 265,783
Options unvested at the end of the year 110,669 196,807
Options exercisable at the end of the year 97,963 68,976
* Includes 7,400 options granted to the employees of Subsidiaries.
The ESOP compensation cost is amortised on a straight-line basis over the total vesting period of the options.
Accordingly Rs. 0.10 Crore {net of recovery of Rs. 0.01 Crore} (Previous Year: Rs. 1.29 Crore net of recovery
of Rs. 0.02 Crore from the subsidiaries) has been charged to the current year Profit and Loss Account.
(C) Fair Valuation:
The fair value of the options used to compute proforma net profit and earnings per share have been done by
an independent valuer on the date of grant using Black - Scholes Model. The key assumptions and the Fair
Value are as under:
Particulars Tranche - I Tranche - II
Risk Free Interest Rate (%) 7.78 7.78
Option Life (Years) 5 5
Expected Volatility (%) 38.00 38.00
Expected Dividend Yield (%) 0.52 0.52
Weighted Average Fair Value per Option (Rs.) 591.53 825.67
Had the compensation cost for the stock options granted under ESOS-2006 been recognised, based on fair
value at the date of grant in accordance with Black and Scholes Model, the proforma amount of net profit
and earnings per share of the Company would have been as under:
Rs. Crore
Particulars Current Year Previous Year
Net Profit 283.40 137.43
Add: Compensation Cost as per Intrinsic Value 0.10 1.29
Less: Compensation Cost as per Fair Value 3.16 7.52
Adjusted Net Income 280.34 131.20
Weighted Average number of Basic Equity Shares
Outstanding (In Nos.) 98,362,821 95,008,617
Weighted Average number of Diluted Equity Shares
Outstanding (In Nos.) 102,611,557 95,052,001
Face Value of the Equity Shares (In Rs.) 10 10
Reported Earning Per Share (EPS)
- Basic EPS (In Rs.) 28.81 14.46
- Diluted EPS (In Rs.) 27.62 14.46
Proforma Earning Per Share (EPS)
- Basic EPS (In Rs.) 28.49 13.80
- Diluted EPS (In Rs.) 27.32 13.80
SCHEDULES

STA
ND
ALO
NE FIN
AN
CIA
L STATEM
EN
TS
[99]
SCHEDULE 20 (Contd.)
SIGNIFICANT ACCOUNTING POLICIES AND NOTES ON ACCOUNTS
b) Employee Stock Options Outstanding account Rs. 2.51 Crore (Previous Year: Rs. 3.27 Crore) and Deferred
Employee Compensation account Rs. 0.38 Crore (Previous Year: Rs. 1.26 Crore).
5. Pursuant to the Composite Scheme of Arrangement (the Scheme) under Sections 391 to 394 of the Companies
Act, 1956, between Aditya Birla Nuvo Limited (‘the Company’) and Madura Garments Exports Limited (MGEL),
MG Lifestyle Clothing Company Private Limited (MGCCPL) and Peter England Fashions and Retail Limited (PEFRL),
the wholly owned subsidiaries of the Company, MGEL and MGCCPL have been merged with the Company, and
domestic garments business of PEFRL has demerged from PEFRL and merged with the Company with effect from
January 01, 2010 (the Appointed Date), pursuant to the Order passed by the Hon’ble High Court of Gujarat on
January 28, 2010.
The effective date of the Scheme is February 22, 2010. MGEL was in the business of contract exports,
MGCCPL was in the business of manufacturing of garments and PEFRL was in the business of retailing of
branded garments.
In terms of the Scheme, all assets and liabilities of MGEL, MGCCPL and assets and liabilities of domestic
garments business of PEFRL have been transferred and stand vested with the Company with effect from the
Appointed Date at its respective book values on that date. MGEL, MGCCPL and domestic garments business of
PEFRL carried on all its businesses and activities for the benefit of and in trust for, the Company from the
Appointed Date. Thus, the profit or income accruing or arising to MGEL, MGCCPL and domestic garments
business of PEFRL, or expenditure or losses arising or incurred by it from the Appointed Date have been treated as
the profit or income or expenditure or loss, as the case may be, of the Company. The Scheme has accordingly
been given effect to in these accounts.
A Amalgamation of MGEL and MGCCPL with the Company:
(i) The Company has accounted for the arrangement as amalgamation in the nature of merger as prescribed
by Accounting Standard 14 – Accounting for Amalgamation (AS 14) issued by the Institute of Chartered
Accountants of India (ICAI). Accordingly, all the assets and liabilities of MGEL and MGCCPL are
recorded in the books of the Company at their book values as on the Appointed Date.
(ii) In terms of the Scheme, the Company has acquired assets having Net Book Value of Rs. (22.27) Crore
as detailed hereunder:
Rs. Crore
MGEL MGCCPL Total
Fixed Assets (Net, including CWIP) 73.68 49.41 123.09
Current Assets, Loans and Advances 98.20 22.01 120.21
Total Assets 171.88 71.42 243.30
Less:
Current Liabilities and Provisions 36.76 19.55 56.31
Loans 170.42 35.30 205.72
Deferred Tax Liability — 3.54 3.54
Total Liabilities 207.18 58.39 265.57
Net Book Value (35.30) 13.03 (22.27)
SCHEDULES

STA
ND
ALO
NE FIN
AN
CIA
L STATEM
EN
TS
[100]
SCHEDULE 20 (Contd.)
SIGNIFICANT ACCOUNTING POLICIES AND NOTES ON ACCOUNTS
(iii) The difference between the net book value, after adjusting reserves of MGEL and MGCCPL and the
investment already made in MGEL and MGCCPL (which is now cancelled as per the Scheme) is
transferred to the General Reserve, in accordance with the respective Scheme, as detailed hereunder:
MGEL MGCCPL Total
Net Book Value (as above) (A) (35.30) 13.03 (22.27)
Less: Profit and Loss Account considered
as Profit and Loss Account of the Company (144.43) 4.83 (139.60)
Less: General Reserve considered as
General Reserve of the Company — 0.02 0.02
Less: Capital Redemption Reserve considered
as Capital Redemption Reserve of the Company 0.69 0.17 0.86
Less: Investment Allowance Reserve considered
as Investment Allowance Reserve of the Company — 0.01 0.01
Total (B) (143.74) 5.03 (138.71)
Balance (C) = (A) - (B) 108.44 8.00 116.44
Cancellation of the Company’s Investment into
MGEL/MGCCPL (D) 109.02 8.87 117.90
The Balance transferred to General Reserve
of the Company (E) = (C) - (D) (0.58) (0.87) (1.46)
Consequent to the amalgamation income-tax impact of Rs. 48.73 Crore on account of carry forward
business losses, unabsorbed depreciation and certain other items of MGEL and MGCCPL under the
Income-tax Act has been adjusted against the current year’s tax provision of the Company.
B Merger of Domestic Garments Business of PEFRL with the Company:
(i) In terms of the Scheme, the Company has acquired assets having Net Book Value of Rs. (100.06) Crore
as detailed hereunder:
Rs. Crore
Fixed Assets ( Net, including CWIP) 18.27
Current Assets, Loans and Advances 10.90
Total Assets 29.17
Less:
Current Liabilities and Provisions 10.01
Loans 119.22
Total Liabilities 129.23
Net Book Value (100.06)
(ii) Reduction in book value of the investment and the difference between consideration and net book value
transferred to the Capital Reserve, in accordance with the Scheme, as detailed hereunder:
Rs. Crore
Net Book Value (100.06)
Less: Issue of Preference Share 0.10
The Balance transferred to Capital Reserve of the Company (A) (100.16)
Reduction in Book Value of Investment (B) (19.00)
Total Amount transferred to Capital Reserve (A) +(B) (119.16)
SCHEDULES

STA
ND
ALO
NE FIN
AN
CIA
L STATEM
EN
TS
[101]
(iii) As a consequence of demerger, the investment of the Company into PEFRL is brought down to the extent
provided as under:
1) 5,00,000 equity shares of Rs. 10/- each; and
2) 5,00,000 8% Redeemable Cumulative preference shares of Rs 10/- each.
As consequence of the demerger, the Company has issued and allotted to the preference shareholder(s)
of the PEFRL (other than the Company) one fully paid-up 6% Redeemable Preference Share of
Rs. 100/- each of the Company as fully paid-up for every one 6% Redeemable Preference Share of
Rs. 100/- each fully paid-up and held in PEFRL.
Consequent to the merger of Domestic Garments Business of PEFRL with the Company, income-tax
impact of Rs. 40.36 Crore on account of carry forward business losses, unabsorbed depreciation and
certain other items of PEFRL under the Income-tax Act has been adjusted against the current year’s tax
provision of the Company.
C In view of the aforesaid Scheme, effective from January 01, 2010, the figures for the previous year are not
comparable with current year.
Rs. Crore
Current Year Previous Year
6. (I) SECURED LOANS:
i) Term loans secured by way of first pari-passu charge
created by mortgage of the immovable properties of the
Company situated at Veraval, Rishra (Textile Division),
Jagdishpur (Argon Gas Plant), Renukoot, and
hypothecation of movables (save and except books debts)
situated at these locations, subject to prior charge(s) created
on certain assets in favour of a Financial Institution and
on current assets (except book debts) in favour of the
Company’s Bankers for working capital borrowings. 172.13 185.75
ii) Term loan secured by way of first pari-passu charge created
by mortgage of the immovable properties of the Company
situated at Veraval, Rishra (Textile Division), Jagdishpur
(Argon Gas Plant), Renukoot, and hypothecation of
movables (save and except current assets) situated at these
locations, subject to prior charge(s) created on certain
assets in favour of a Financial Institution. 92.15 94.05
iii) Term Loan secured by way of exclusive first charge created
on assets acquired there-against. 3.41 4.27
iv) Term loan secured by way of first pari-passu charge created
by hypothecation of movable fixed assets situated at
Veraval, Rishra (Textile Division), Jagdishpur (Argon Gas
Plant) and Renukoot. 34.65 35.00
v) Term loan secured by way of first pari-passu charge created
by hypothecation of movable fixed assets situated at
Hi-Tech Carbon Division at Gummidipoondi. — 47.50
vi) Term loan secured by way of first pari-passu charge by
hypothecation of movable fixed assets situated at Insulator
Divisions at Halol and Rishra. — 47.50
SCHEDULE 20 (Contd.)
SIGNIFICANT ACCOUNTING POLICIES AND NOTES ON ACCOUNTS
SCHEDULES

STA
ND
ALO
NE FIN
AN
CIA
L STATEM
EN
TS
[102]
vii) Term Loan secured by way of exclusive first charge created
by hypothecation of Brand Rights/Trademark and movable
properties of the Company’s Madura Garment Division at
Bangalore and movable properties at Bangalore. 100.00 100.00
viii) Term Loan secured by way of first pari-passu charge created
by hypothecation of movable properties (save and except
investment and current assets) of the Fertiliser Plant of
the Company situated at Jagdishpur. 100.00 100.00
ix) Term Loan secured by way of second pari-passu charge
created by mortgage of immovable properties of the
Company’s Rayon & Caustic Soda Plant at Veraval,
Textile Plant at Rishra, Carbon Black Plant at Renukoot
and Argon Gas Plant at Jagdishpur, and hypothecation
of movable properties of the Company relating to these
Plants, Garments Division at Bangalore and Corporate
Finance Division at Mumbai, and the entire current
assets (save and except investments) of the Company. 90.00 135.00
x) Term Loan secured by way of second pari-passu charge
created by mortgage of immovable properties of the
Company’s Rayon & Caustic Soda Plant at Veraval, Textiles
Plants at Rishra, Carbon Black Plant at Renukoot and
Argon Gas Plant at Jagdishpur, and hypothecation of
movable properties of the Company relating to these Plants,
Garments Division at Bangalore and Corporate Finance
Division at Mumbai, and the entire current assets (save
and except investments) of the Company. 190.00 190.00
xi) Term Loan secured by way of second pari-passu charge
created by mortgage of the immovable properties of the
Company’s Rayon & Caustic Soda Plant at Veraval, Textile
Plant at Rishra, Carbon Black Plant at Renukoot and Argon
Gas Plant at Jagdishpur, and hypothecation of movable
properties of the Company relating to these Plants,
Garments Division at Bangalore and Corporate Finance
Division at Mumbai, the entire current assets (save and
except investments) of the Company and Brand Rights/
Trademarks owned by Garments Division, Bangalore. 209.98 243.32
xii) Term Loans secured by way of first charge created by
mortgage of the immovable properties situated at Insulator
Division, Halol, and hypothecation of movable properties
(except current assets) of the Insulators Division of the
Company situated at Halol and Rishra. -– 3.33
xiii) Term Loans secured by way of first pari-passu charge
created by mortgage of immovable properties of the
Company’s Madura Garments Exports Plants at Bangalore
and hypothecation of movable fixed assets of the Company
at these plants. 35.62 —
SCHEDULE 20 (Contd.)
SIGNIFICANT ACCOUNTING POLICIES AND NOTES ON ACCOUNTS
Rs. Crore
Current Year Previous Year
SCHEDULES

STA
ND
ALO
NE FIN
AN
CIA
L STATEM
EN
TS
[103]
xiv) Term Loans secured by way of first pari-passu charge to
be created of mortgage of immovable properties of the
Company’s Madura Garments Exports Plant at Bangalore,
and charge created by way of hypothecation of movable
fixed assets of the Company at these plants. 3.68 —
xv) Term Loans secured by way of first pari-passu charge
created by hypothecation of stocks and bookdebts and of
entire movable fixed assets of the Company’s Madura
Garments Exports Plant at Bangalore. 15.64 —
xvi) Term Loan secured by way of first pari-passu charge created
by mortgage of immovable properties of the Company’s
MG Lifestyle Clothing Plant at Bangalore, and
hypothecation of movable fixed assets of the Company at
these plants. 7.98 —
xvii) Term Loan secured by way of first pari-passu charge created
by hypothecation of movable plant and machinery of the
Company’s MG Lifestyle Clothing Plant at Bangalore. 24.46 —
xviii) Term Loan secured by way of first pari-passu charge created
by hypothecation of furniture & fixtures and other movable
fixed assets of the Company’s Peter England People
Stores at Bangalore and Delhi. 48.00 —
xix) Foreign Currency Loans secured by way of first pari-passu
charge created by hypothecation of movable properties
(save and except stocks and book debts) of the Company
situated at Gummidipoondi. 130.90 113.26
xx) Foreign Currency Loan secured by way of first pari-passu
charge created by hypothecation of all movable assets
(excluding current assets) of the Company’s Fertiliser Plant
situated at Jagdishpur (excluding assets relating to Argon
Gas Plant), and mortgage on immovable properties of the
Company’s Office Premises at Sakar Bhavan, Mumbai. 81.12 81.12
xxi) Foreign Currency Loans secured by way of first pari-passu
charge created by hypothecation of movable properties of
the Company’s Rayon Division at Veraval, Textile Plant at
Rishra, Argon Gas Plant at Jagdishpur and Carbon Black
Plant at Renukoot. 172.53 172.53
xxii) Foreign Currency Loans secured by way of first pari-passu
charge created by hypothecation of movable properties
(save and except current assets) of the Carbon Black Plant
of the Company situated at Patalganga. 125.67 25.00
xxiii) Foreign Currency Loan secured by way of first pari-passu
charge created by hypothecation of movable fixed assets
situated at Insulators Division at Halol and Rishra. 62.27 62.27
SCHEDULE 20 (Contd.)
SIGNIFICANT ACCOUNTING POLICIES AND NOTES ON ACCOUNTS
Rs. Crore
Current Year Previous Year
SCHEDULES

STA
ND
ALO
NE FIN
AN
CIA
L STATEM
EN
TS
[104]
xxiv) Working Capital Borrowings are secured by hypothecation
of inventories, book debts and other movables (except
investment held as Current Assets), both present and
future, held as current assets. 178.19 379.67
xxv) Deferred Sales Tax Loan for the Caustic Soda Unit at
Veraval to be secured by first pari-passu charge over the
fixed assets of Caustic Soda Unit of the Company at
Veraval and for Carbon Black Plant at Gummidipoondi to
be secured by second pari-passu charge over the fixed
assets of the respective plant. 78.99 87.50
xxvi) Non-Convertible Debentures secured by way of first pari-
passu charge created by mortgage of the immovable
property of the Company located at Ahmedabad, Gujarat
and secured by mortgage of immovable properties of the
Company’s Fertiliser Plant (excluding assets relating to
Argon Gas plant) at Jagdishpur:
12.25 % 25th Series (Redeemable at par on 12th December
2011. Put/Call option at the end of two years) 110.00 110.00
II) UNSECURED LOANS
i) Secured by way of first pari-passu charge created by
mortgage of the immovable property of the Company
located at Ahmedabad, Gujarat:
13.00% 23rd Series (Redeemable at par on 7th November, 2011) 125.00 125.00
12.50% 24th Series (Redeemable at par on 5th December, 2011) 40.00 40.00
11.50% 26th Series (Redeemable at par on 19th December, 2011) 225.00 225.00
As the value of Security provided to secure the aforesaid
NCD’s is not significant, the NCD’s have been shown as
Unsecured.
ii) 8.40% 27th Series (Redeemable at par on 23rd November, 2012) 200.00 —
III) Foreign Currency Loans have been fully hedged for foreign exchange and interest rate fluctuation by way
of Currency Swaps, Interest Rate Swaps and Forward Cover.
7. a) Capital Work-in-Progress includes advances to suppliers 25.24 43.37
b) Pre-operative Expenses:
Interest 7.06 0.83
Salaries and Wages 2.57 0.12
Contribution to Provident and Other Funds 0.02 —
Depreciation 0.05 —
Miscellaneous Expenses 0.43 —
Raw Material Consumption 0.01 —
Power and Fuel 0.58 —
Total 10.72 0.95
Add: Amount Brought Forward from previous year 0.63 —
Less: Amount Capitalised During the year 0.77 0.32
Balance Pending Allocation 10.58 0.63
SCHEDULES
SCHEDULE 20 (Contd.)
SIGNIFICANT ACCOUNTING POLICIES AND NOTES ON ACCOUNTS
Rs. Crore
Current Year Previous Year

STA
ND
ALO
NE FIN
AN
CIA
L STATEM
EN
TS
[105]
8 a) Market/Book Values of certain long term quoted investments aggregating to Rs. NIL (Previous Year: Rs.
453.10 Crore) and unquoted investments aggregating to Rs. 2,311.47 Crore (Previous Year Rs.: 1,779.38
Crore) are lower than its cost.
Considering the strategic and long-term nature of the aforesaid investments and asset base and business plan
of the investee companies, in the opinion of the management, the decline in the market/book value of the
aforesaid investments is of temporary nature, requiring no provision.
An amount of Rs. 19.95 Crore is lying in “Investment Reserve” is to be used to meet the diminution other than
temporary, if any, that may arise in future, in the value of present and future long term strategic investments.
b) Transfer of investments in IDEA Cellular Ltd. (IDEA) and Birla Sun Life Insurance Co. Ltd. is restricted by the terms
contained in their respective joint venture agreements. Non-disposal undertakings for IDEA, Aditya Birla Minacs
Worldwide Ltd. (ABMWL), Aditya Birla Minacs IT Services Limited and Madura Garments Lifestyle Retail Company
Limited investment have also been provided to certain Banks for respective credit facilities extended by them.
c) Pursuant to the Shareholders’ Agreement entered into with the Joint Venture partner, the Company has in
respect of Birla Sun Life Insurance Company Limited agreed to infuse its share of capital from time to time to
meet the solvency requirement prescribed by the regulatory authority.
9. Loans and Advances include:
Rs. Crore
Amount Receivable From Balance Balance Maximum Maximum
as on as on Amount Amount
31-Mar- 31-Mar- Due at any Due at any
2010 2009 time during time during
the year the year
ended ended
31-Mar-2010 31-Mar-2009
(i) Subsidiaries
Aditya Birla Trustee Company Private Limited — 0.34 0.35 0.34
ABNL Investment Limited (Formerly known
as Laxminarayan Investment Limited) 30.16 17.67 68.02 37.10
Madura Garments Exports Limited
(Merged with ABNL w.e.f. 01.01.2010) — 0.02 54.80 53.00
Aditya Birla Minacs IT Services Limited
(Formerly known as PSI Data Systems Limited) 7.50 β 21.65 0.28
Birla Sun Life Insurance Company Limited 0.18 0.04 0.32 0.14
Aditya Birla Finance Limited (Formerly known
as Birla Global Finance Company Limited) 69.59 11.91 600.00 25.04
Madura Garments Lifestyle Retail Company Limited 59.10 25.69 478.69 89.98
Peter England Fashions and Retail Limited — 32.87 218.52 99.41
MG Lifestyle Clothing Company Private Limited
(Merged with ABNL w.e.f. 01.01.2010) — — — 10.00
Aditya Birla Money Limited (Formerly known
as Apollo Sindhoori Capital Investments Limited) 20.01 — 35.00 —
Birla Technologies Limited 12.65 — 12.65 —
Aditya Birla Minacs Worldwide Limited 0.22 — 0.22 —
Aditya Birla Capital Advisors Private Limited — — 0.60 —
Aditya Birla Money Mart Limited (Formerly known
as Birla Sun Life Distribution Company Limited) — 0.01 7.05 —
Birla Insurance Advisory and Broking Services Limited 0.07 — 0.07 —
(ii) Joint Ventures:
Birla Sun Life Asset Management Company Limited — — — 0.04
IDEA Cellular Limited — — — 75.00
SCHEDULE 20 (Contd.)
SIGNIFICANT ACCOUNTING POLICIES AND NOTES ON ACCOUNTS
SCHEDULES

STA
ND
ALO
NE FIN
AN
CIA
L STATEM
EN
TS
[106]
SCHEDULE 20 (Contd.)
SIGNIFICANT ACCOUNTING POLICIES AND NOTES ON ACCOUNTS
(iii) Employees loan given in the ordinary course of the
business and as per the service rules of the Company
- no repayment schedule or repayment
beyond seven years 1.63 0.84 2.02 0.88
- no interest or at an interest rate below
which is specified in Section 372A of
the Companies Act, 1956 7.95 5.98 10.05 8.05
(iv) The Company is one of the Promoter members of Aditya Birla Management Corporation Private. Limited, a
company limited by guarantee, which has been formed to provide a common pool of facilities and
resources to its members, with a view to optimise the benefits of specialisation and minimise cost to each
member. The Company’s share of expenses under the common pool has been accounted for under the
appropriate heads. Total Amount outstanding as on 31st March, 2010 is Rs 3.28 Crore (Previous Year:
Rs. 16.30 Crore).
Rs. Crore
Current Year Previous Year
10. Information related to Micro, Small and Medium Enterprises
Development Act, 2006 (Act), is disclosed hereunder. The information
given below has been determined to the extent such parties have
been identified on the basis of information available with the
Company.
a) (i) Principal amount remaining unpaid to any supplier at the
end of the accounting year 1.54 1.06
(ii) Interest due on above β β
The Total of (i) and (ii) 1.54 1.06
b) Amount of interest paid by the buyer in terms of Section 16 of
the Act, along with amount of the payment made beyond the
appointed date during the year — —
c) Amounts of interest accrued and remaining unpaid at the end
of the financial year β β
d) Amount of interest due and payable for the period of delay in
making payment (which have been paid but beyond the due
date during the year) but without adding the interest specified
under the Act — —
e) Amount of further interest remaining due and payable even in
the succeeding years, until such date when the interest dues as
above are actually paid to the small enterprise, for the purpose
of disallowance as a deductible expenditure under
Section 23 of the Act β —
SCHEDULES
9. Loans & Advances include (Contd.)
Rs. Crore
Amount Receivable From Balance Balance Maximum Maximum
as on as on Amount Amount
31-Mar- 31-Mar- Due at any Due at any
2010 2009 time during time during
the year the year
ended ended
31-Mar-2010 31-Mar-2009

STA
ND
ALO
NE FIN
AN
CIA
L STATEM
EN
TS
[107]
SCHEDULE 20 (Contd.)
SIGNIFICANT ACCOUNTING POLICIES AND NOTES ON ACCOUNTS
Rs. Crore
Current Year Previous Year
11. Deferred Tax Liability/(Asset) at the period end comprise
timing differences on account of:
Depreciation 207.64 205.37
Expenditure/Provisions Allowable (29.17) (25.13)
178.47 180.24
12. Earnings Per Share (EPS) is calculated as under:
Net Profit as per Profit and Loss Account 283.40 137.43
Less: Preference Dividend and Tax thereon β —
Net Profit for EPS - A 283.40 137.43
Weighted Average number of Equity Shares for
calculation of Basic EPS B 98,362,821 95,008,617
- Basic EPS (Rs.) A/B 28.81 14.46
Weighted Average number of Equity Shares Outstanding 98,362,821 95,008,617
Add: Shares held in Abeyance 43,112 43,384
Add: Potential Equity Shares Due to Warrant 4,205,624 —
Weighted Average number of Equity Shares for calculation
of Diluted EPS C 102,611,557 95,052,001
- Diluted EPS (Rs.) A/C 27.62 14.46
Nominal Value of Shares (Rs.) 10.00 10.00
13. The following amount are included in the Miscellaneous
Expenses in Profit and Loss Account:
a) Foreign Exchange (Gain)/Loss (Net) (0.80) (1.73)
b) All Insurance Claims (unless clearly identifiable with the
respective heads of expenses and Loss of Profit policy) (0.66) (1.36)
c) Unspent liabilities, excess provision and unclaimed balances
in respect of earlier years written back (net of short provision
and sundry balances written off) (5.58) (5.92)
d) (Profit)/Loss on sale/discard of Fixed Assets (Net) 7.13 (0.64)
14. Leases:
A. Operating Lease payment recognised into Profit and Loss Account 116.58 114.40
B. The Company has taken certain office premises, showrooms
and residential houses on non-cancellable operating lease.
The future minimum lease rental payments in respect of
non-cancellable operating lease are as follows:
i) Not later than one year 35.37 42.52
ii) Later than one year and not later than five years 29.46 59.37
iii) Later than five years 2.17 —
SCHEDULES

STA
ND
ALO
NE FIN
AN
CIA
L STATEM
EN
TS
[108]
SCHEDULE 20 (Contd.)
SIGNIFICANT ACCOUNTING POLICIES AND NOTES ON ACCOUNTS
Rs. Crore
Current Year Previous Year
15. The Company has given certain Plant and Machinery
(Storage Tank) on non-cancellable operating lease:
The gross carrying amount of the above referred assets 4.90 4.90
The accumulated depreciation for the above assets 1.82 1.59
The depreciation for the above assets for the year 0.23 0.23
The future minimum lease rental in respect of aforesaid lease is as follows:
i) Not later than one year 1.62 2.15
ii) Later than one year and not later than five years 4.06 8.70
iii) Later than five years — —
16. Disclosure in respect of Retirement Benefits pursuant to Accounting Standard-15 (Revised) - refer Annexure I
17. The following are included under other heads of expenses in the Profit and Loss Account:
Stores and Spares Consumed 13.21 12.05
Salaries and Wages 0.50 0.40
Staff Welfare Expenses 0.89 0.11
Insurance 0.84 0.90
Depreciation 0.10 0.10
Repairs and Maintenance - others 3.27 2.41
Rates and Taxes 2.28 0.91
Miscellaneous Expenses 16.62 20.43
18. Details of Auditors’ Remuneration:
Payments to Statutory Auditor
- As Auditor:
- Audit Fees (Including Limited Review Fees) 0.87 0.82
- Tax Audit Fees 0.18 0.17
- Reimbursement of Expenses 0.17 0.15
- As advisor in respect of:
- Taxation Matters 0.04 0.11
- Management Services 0.45 0.27
- In Other Manner:
- Certification 0.15 0.10
Payment to Branch Auditor:
- Audit Fees 0.18 0.15
- Certification Work — —
- Management Services 0.08 0.05
- Reimbursement of Expenses 0.06 0.03
Payment to Cost Auditors:
- Audit Fees 0.02 0.02
- Reimbursement of Expenses 0.00 0.01
Grand Total 2.20 1.88
SCHEDULES
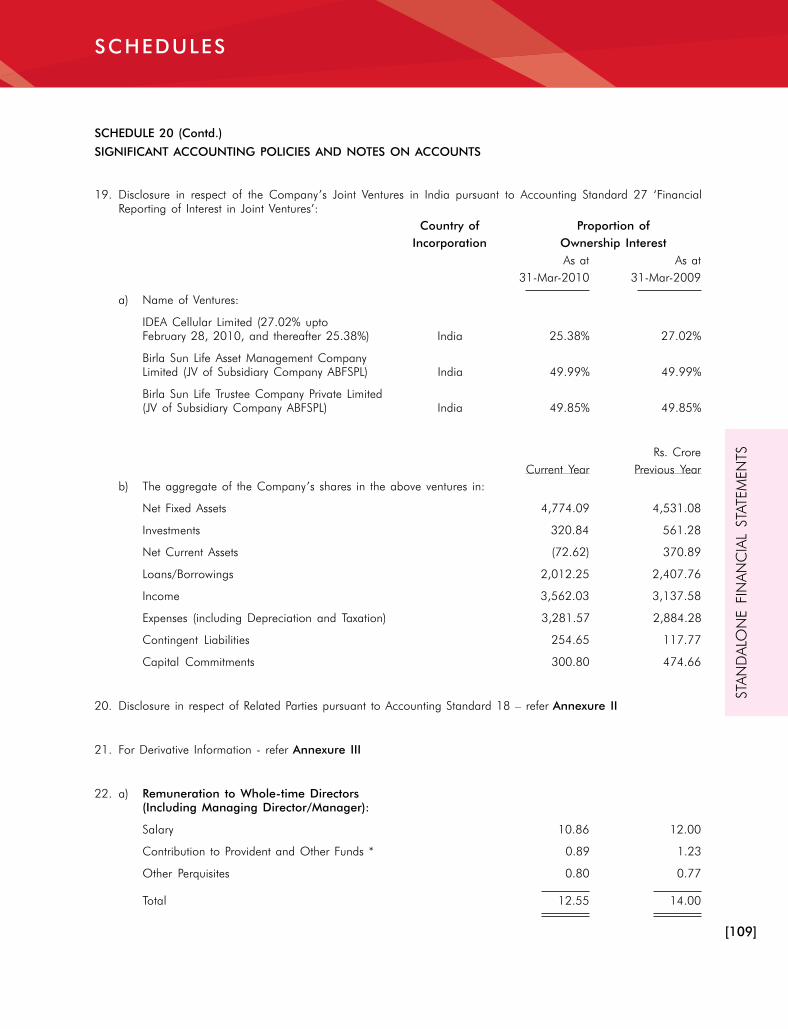
STA
ND
ALO
NE FIN
AN
CIA
L STATEM
EN
TS
[109]
SCHEDULE 20 (Contd.)
SIGNIFICANT ACCOUNTING POLICIES AND NOTES ON ACCOUNTS
19. Disclosure in respect of the Company’s Joint Ventures in India pursuant to Accounting Standard 27 ‘Financial
Reporting of Interest in Joint Ventures’:
Country of Proportion of
Incorporation Ownership Interest
As at As at
31-Mar-2010 31-Mar-2009
a) Name of Ventures:
IDEA Cellular Limited (27.02% upto
February 28, 2010, and thereafter 25.38%) India 25.38% 27.02%
Birla Sun Life Asset Management Company
Limited (JV of Subsidiary Company ABFSPL) India 49.99% 49.99%
Birla Sun Life Trustee Company Private Limited
(JV of Subsidiary Company ABFSPL) India 49.85% 49.85%
Rs. Crore
Current Year Previous Year
b) The aggregate of the Company’s shares in the above ventures in:
Net Fixed Assets 4,774.09 4,531.08
Investments 320.84 561.28
Net Current Assets (72.62) 370.89
Loans/Borrowings 2,012.25 2,407.76
Income 3,562.03 3,137.58
Expenses (including Depreciation and Taxation) 3,281.57 2,884.28
Contingent Liabilities 254.65 117.77
Capital Commitments 300.80 474.66
20. Disclosure in respect of Related Parties pursuant to Accounting Standard 18 – refer Annexure II
21. For Derivative Information - refer Annexure III
22. a) Remuneration to Whole-time Directors
(Including Managing Director/Manager):
Salary 10.86 12.00
Contribution to Provident and Other Funds * 0.89 1.23
Other Perquisites 0.80 0.77
Total 12.55 14.00
SCHEDULES

STA
ND
ALO
NE FIN
AN
CIA
L STATEM
EN
TS
[110]
SCHEDULE 20 (Contd.)
SIGNIFICANT ACCOUNTING POLICIES AND NOTES ON ACCOUNTS
Rs. Crore
Current Year Previous Year
b) Computation of Managerial Remuneration:
Profit before Tax as per Profit and Loss Account 320.30 162.30
Add: Managing and Whole-time Directors’ remuneration and commission 12.55 14.00
Commission paid to Non-Executive Directors 1.50 —
Directors’ Fees 0.21 0.15
Provision for Doubtful Debts and Advances 3.46 1.04
Loss on Sale of Fixed Assets (Net) 7.13 —
Provision for Wealth Tax 0.28 0.27
345.43 177.76
Less: Bad Debts written off 2.51 0.43
Profit on Sale of Current Investment as per Profit and Loss Account (Net) 7.82 6.87
Profit on Sale of Long Term Investment as per Profit and Loss Account (Net) (0.13) —
Profit on Sale of Fixed Assets (Net) — 0.64
Net Profit as per Section 349 of the Companies Act, 1956 335.23 169.82
Maximum permissible remuneration to Whole-time Directors
under Section 198 of the Companies Act, 1956 @ 10% of the
profits computed above 33.52 16.98
Restricted as per Service Agreement 12.55 14.00
Maximum permissible managerial remuneration to Non-Executive
Directors under Section 198 of the Companies Act, 1956 @ 1% of the
profits computed above 3.35 —
Restricted as per Board Resolution 1.50 —
*In the determination of Manager’s remuneration, certain perquisites have been valued in accordance with the
Income Tax Rules, 1962.
Expenses towards gratuity and leave encashment provisions are determined actuarially on an overall Company
basis at the end of each year, and accordingly have not been considered in the above information. Employee
Compensation under Employee Stock Options Scheme has also not been considered in the above information.
23. In September 2005, the Company had purchased 37.18 Crore equity shares of IDEA Cellular Ltd. (IDEA) from
M/s. AT&T Cellular Private. Ltd, Mauritius, and paid consideration of US$ 150 Million without deduction of tax at
source after obtaining an order under Section 195(2) of the Income Tax Act from the Income Tax Department. The
Deputy Director of Income Tax (International Taxation), DDIT, Mumbai, has issued order under Section 163(1) of
the Income Tax Act dated March 25, 2009, treating the Company as an agent of New Cingular Wireless Services
Inc. for the sale of shares of IDEA by its subsidiary AT&T Cellular Private Limited, Mauritius. The Company has
challenged the order of DDIT before the appropriate authority and, based on the opinion of Tax Expert, the
Company is reasonably certain that no tax liability would devolve.
24. During the previous year, the Company has received fertilisers bonds of Rs. 65.5 Crore from the Ministry of
Fertilisers, the Government of India, against the outstanding amount of subsidy receivable, out of which bonds
amounting to Rs. 29.33 Crore (Previous Year: Rs. 37.45 Crore) are outstanding at the year end. The market value
of the above bonds are lower than the book value, therefore the diminution in the value of above bonds
amounting to Rs. 0.46 Crore (Previous Year: Rs. 5.11 Crore) has been accounted under Miscellaneous Expenses.
The aforesaid bonds have been classified as “Other Current Assets” in the Financial Statements.
SCHEDULES

STA
ND
ALO
NE FIN
AN
CIA
L STATEM
EN
TS
[111]
25. Other Interest include Interest on Income Tax Refund of Rs. 2.34 Crore (Previous Year: Rs. 4.57 Crore).
26. For additional information as required under paras 3, 4C and 4D of Part II of Schedule VI to the Companies Act,
1956 - refer Annexure IV.
27. Segments have been identified in line with the Accounting Standard on Segment Reporting (AS17), taking into
account the organisational structure as well as differential risk and returns of these segments.
Garments Branded Apparels and Accessories, Contract Exports
Rayon Yarn Viscose Filament Yarn, Caustic Soda and Allied Chemicals
Carbon Black Carbon Black
Insulator Insulators
Textiles Spun Yarn and Fabrics
Fertilisers Urea, Ammonia, Argon Gas, Pesticides and Seeds
Financial Services Corporate Finance, Syndication and Distribution
The Company considers secondary segment based on revenues within India as Domestic Revenues and outside
India as Export Revenues. Since assets are used interchangeably, carrying amount of assets and cost incurred
during the year to acquire assets based on secondary segment have not been disclosed.
For Segment Information - refer Annexure V
28. Figures of Rs. 50,000 or less have been denoted by β
29. Previous year’s figures have been regrouped/rearranged wherever necessary.
For KHIMJI KUNVERJI & CO. For S.R. BATLIBOI & CO. DR. RAKESH JAIN Directors: TARJANI VAKIL
Firm registration no. 105146W Firm registration no. 301003E Managing Director P. MURARI
Chartered Accountants Chartered Accountants G. P. GUPTA
B. R. GUPTA
SUSHIL AGARWAL
Chief Financial Officer
Per SHIVJI K. VIKAMSEY Per VIJAY MANIAR DEVENDRA BHANDARI
Partner Partner Company Secretary
Membership No. 2242 Membership No. 36738
Mumbai, May 07, 2010
SCHEDULE 20 (Contd.)
SIGNIFICANT ACCOUNTING POLICIES AND NOTES ON ACCOUNTS
SCHEDULES

STA
ND
ALO
NE FIN
AN
CIA
L STATEM
EN
TS
[112]
SCHEDULE 20 (Contd.)
SIGNIFICANT ACCOUNTING POLICIES AND NOTES ON ACCOUNTS
ANNEXURE - I
RETIREMENT BENEFITS
Rs. Crore
Current Year Previous Year
a) The details of the Company’s defined benefit plans for
its employees are given below:
Amounts recognised in the Balance Sheet in respect of gratuity:
Present Value of the funded defined benefit obligation at
the end of the period 80.08 75.30
Fair Value of Plan Assets 78.16 77.30
Net Liability/(Asset) 1.92 (2.00)
Amounts recognised in Salary, Wages and Employee Benefits in the
Profit and Loss Account in respect of gratuity:
Current Service Cost 5.42 4.94
Interest on Defined Benefit Obligations 5.38 5.01
Expected Return on Plan Assets (6.10) (4.46)
Net Actuarial (Gain)/Loss recognised during the period 0.26 (3.00)
Net Gratuity Cost 4.96 2.49
Actual Return on Plan Assets:
Expected Return on Plan Assets 6.10 4.46
Actuarial Gain/(Loss) on Plan Assets (3.32) 8.54
Actual Return on Plan Assets 2.78 13.00
Reconciliation of Present Value of the Obligation and
the Fair Value of the Plan Assets:
Opening Defined Benefit Obligation 75.30 64.28
Current Service Cost 5.42 4.94
Interest Cost 5.38 5.02
Actuarial (Gain)/Loss (3.06) 5.55
Liability Assumed on Amalgamation 3.23 —
Benefits Paid (6.18) (4.49)
Closing Defined Benefit Obligation 80.09 75.30
Change in Fair Value of Plan Assets:
Opening Fair Value of the Plan Assets 77.30 61.36
Expected Return on Plan Assets 6.10 4.46
Actuarial Gain/(Loss) (3.32) 8.55
Assets Acquired on Amalgamation 0.09 —
Contributions by the Employer 4.18 7.42
Benefits Paid (6.18) (4.49)
Closing Fair Value of the Plan Assets 78.17 77.30
Investment Details of Plan Assets
Government of India Securities 22% 15%
Corporate Bonds 2% 8%
Insurer Managed Fund 76% 74%
Others — 3%
Total 100% 100%
SCHEDULES

STA
ND
ALO
NE FIN
AN
CIA
L STATEM
EN
TS
[113]
Experience Adjustment Rs. Crore
31-Mar-2010 31-Mar-2009 31-Mar-2008 31-Mar-2007 31-Mar-2006
Defined Benefit Obligation 80.08 75.30 64.28 49.02 47.64
Plan Assets 78.16 77.30 61.36 49.17 46.18
Surplus/(Deficit) (1.92) 2.00 (2.92) 0.15 (1.46)
Experience Adjustment on Plan Liabilities 1.16 4.72 1.83 0.39 —
Experience Adjustment on Plan Assets (3.32) 8.54 (1.65) (0.23) —
There are no amount included in the Fair Value of Plan Assets for:
i) Company’s own financial instrument.
ii) Property occupied by or other assets used by the Company.
Expected rate of return on assets is based on the average long term rate of return expected on investments of the
funds during the estimated term of the obligations.
General Description of Fair Value of the Plan
The Company has approved gratuity trust except for the fertiliser division which is having insurer Managed Fund.
Current Year Previous Year
Principal Actuarial Assumptions at the Balance Sheet Date:
Discount Rate 8.15% 7.55%
Estimated Rate of Return on Plan Assets 8.00% 8.00%
The estimates of future salary increases, considered in actuarial valuation, take account of inflation, seniority,
promotion and other relevant factors, such as supply and demand in the employment market.
Rs. Crore
Current Year Previous Year
b) The details of the Company’s defined benefit plans in respect of Pension for
its employees are given below:
Amounts recognised in the Balance Sheet in respect of Pension
(unfunded by the company):
Present Value of Unfunded Obligation at the end of the period 7.20 7.49
Fair Value of Plan Assets — —
Net Liability/(Asset) 7.20 7.49
Amounts recognised in Salary, Wages and Employee Benefits in
the Profit and Loss Account in respect of Pension (Unfunded by
the Company):
Interest on Defined Benefit Obligations 0.53 0.56
Net Actuarial (Gain)/Loss recognised during the period 0.27 0.58
Net Pension Cost 0.80 1.14
SCHEDULE 20 (Contd.)
SIGNIFICANT ACCOUNTING POLICIES AND NOTES ON ACCOUNTS
ANNEXURE - I (Contd.)
SCHEDULES

STA
ND
ALO
NE FIN
AN
CIA
L STATEM
EN
TS
[114]
Reconciliation of Present Value of the Obligation and the
Fair Value of the Plan Assets:
Opening Defined Benefit Obligation 7.48 7.39
Interest Cost 0.53 0.56
Actuarial (Gain)/Loss 0.27 0.58
Benefits Paid (1.09) (1.05)
Closing Defined Benefit Obligation 7.19 7.48
Change in Fair Value Plan Assets:
Contributions by the Employer 1.09 1.05
Benefits Paid (1.09) (1.05)
Closing Fair Value of the Plan Assets — —
Experience Adjustment
31-Mar-2010 31-Mar-2009 31-Mar-2008 31-Mar-2007 31-Mar-2006
Defined Benefit Obligation 7.20 7.49 7.39 7.48 7.91
Plan Assets — — — — —
Surplus/(Deficit) (7.20) (7.49) (7.39) (7.48) (7.91)
Experience adjustment on Plan Liabilities 0.55 0.31 1.00 0.23 —
c) Defined Contribution Plans –
The Company has recognised the following amount as an expense and included in the Schedule 16 - “Contribution
to Provident and Other Funds:
Rs. Crore
Current Year Previous Year
i) Contribution to Employees’ Provident Fund 15.57 13.37
ii) Contribution to Superannuation Fund 5.08 4.67
iii) Contribution to ESI 2.18 1.72
The Guidance Note on implementation of AS-15 (Revised), “Employee Benefits” issued by the ICAI states that
Provident Fund setup the employers, which requires interest shortfall to be met by the employer, needs to be
treated as defined benefits plan. The Company setup Provident Fund does not have existing deficit of Interest
shortfall. With regards to future obligation arising due to interest shortfall (i.e., government interest to be paid on,
the Provident Fund Scheme exceeding rate of interest earned on investment) pending issuance of the Guidance
Note from Actuarial Society of India, the Company’s actuary has expressed his inability to reliably measure the
Provident Fund liability.
SCHEDULE 20 (Contd.)
SIGNIFICANT ACCOUNTING POLICIES AND NOTES ON ACCOUNTS
ANNEXURE - I (Contd.)
Rs. Crore
Current Year Previous Year
SCHEDULES

STA
ND
ALO
NE FIN
AN
CIA
L STATEM
EN
TS
[115]
SCHEDULE 20 (Contd.)
SIGNIFICANT ACCOUNTING POLICIES AND NOTES ON ACCOUNTS
ANNEXURE-II
a) List of Related Parties:
Parties where control exists — Subsidiaries:
Aditya Birla Financial Services Private Limited (ABFSPL) (w.e.f. November 4, 2008)
Aditya Birla Capital Advisors Private Limited (ABCAPL) (Subsidiary of ABFSPL) (w.e.f. November 4, 2008)
Aditya Birla Customers Services Private Limited (ABCSPL) (Subsidiary of ABFSPL) (w.e.f. December 11, 2008)
Aditya Birla Securities Private Limited (ABSPL) (Subsidiary of ABFSPL) (w.e.f. November 4, 2008, and ceased to be
a Subsidiary w.e.f. March 13, 2009)
Aditya Birla Trustee Company Private Limited (ABTCPL) (Subsidiary of ABFSPL) (w.e.f. November 28, 2008)
Aditya Birla Financial Shared Services Limited (ABFSSL) (Subsidiary of ABFSPL) (w.e.f. June 19, 2008)
Aditya Birla Money Limited (ABML) (formerly known as Apollo Sindhoori Capital Investments Limited) (Subsidiary of
ABFSPL) (w.e.f. March 6, 2009)
Aditya Birla Commodities Broking Limited (ABCBL) (formerly known as Apollo Sindhoori Commodities Trading
Limited) (100% Subsidiary of ABML) (w.e.f. March 6, 2009)
Birla Insurance Advisory & Broking Services Limited (50.01% Subsidiary of ABFSPL)
Aditya Birla Money Mart Limited (ABMML) (formerly known as Birla Sun Life Distribution Company Limited)
(w.e.f. March 31, 2009)
Aditya Birla Money Insurance Advisory Services Limited (formerly known as BSDL Insurance Advisory Services
Limited) (100 % Subsidiary of ABMML)
Aditya Birla Minacs Worldwide Limited (ABMWL)
Transworks Inc. (TW Inc.) (100% Subsidiary of ABMWL)
Aditya Birla Minacs Philippines Inc. (ABMPI) (100% Subsidiary of ABMWL)
AV Transworks Limited (AVTL) (100% Subsidiary of ABMWL)
Aditya Birla Minacs Worldwide Inc. (ABMWI) (100% Subsidiary of AVTL) (formerly known as Minacs Worldwide Inc.)
Compass BPO Limited, U.K. (Subsidiary of ABMWI) (w.e.f. March 9, 2010)
Compass BPO, Inc., U.S.A (w.e.f. March 9, 2010)
Compass Business Process Outsourcing Private Limited, India (w.e.f. March 9, 2010)
Compass BPO FZE, U.A.E. (w.e.f. March 9, 2010)
Minacs Worldwide SA de CV (100% Subsidiary of ABMWI)
Minacs Group (USA) Inc. (100% Subsidiary of ABMWI)
Minacs Limited (100% Subsidiary of ABMWI)
Minacs Worldwide GmbH (100% Subsidiary of Minacs Limited)
Minacs Kft. (100% Subsidiary of Minacs GmbH)
Aditya Vikram Global Trading House Limited (AVGTHL)
Aditya Birla Finance Limited (ABFL) (formerly known as Birla Global Finance Company Limited)
Birla Sun Life Insurance Company Limited (BSLICL)
ABNL Investment Limited (ABCL) (formerly known as Laxminarayan Investment Limited)
Madura Garments International Brand Company Limited (MGIBCL) (on becoming Associate, ceased to be
an Subsidiary w.e.f. November 27, 2009)
LIL Investment Limited (w.e.f. July 27, 2009, and on becoming Associate, ceased to be a Subsidiary w.e.f.
November 27, 2009)
Madura Garments Exports Limited (MGEL) (merged with the Company w.e.f. January 1, 2010)
SCHEDULES

STA
ND
ALO
NE FIN
AN
CIA
L STATEM
EN
TS
[116]
Madura Garments Exports US, Inc. (ceased to be a Subsidiary from February 9, 2010)
Madura Garments Lifestyle Retail Company Limited (MGLRCL)
MG Lifestyle Clothing Company Private Limited (MGCCPL) (merged with the Company w.e.f. January 1, 2010)
Peter England Fashions and Retail Limited (PEFRL)
Aditya Birla Minacs IT Services Limited (ABMITS) (formerly known as PSI Data Systems Limited)
Birla Technologies Limited (100% Subsidiary of ABMITS)
Joint Ventures:
Birla Sun Life Asset Management Company Limited (BSAMC) (directly held by the Company till March 22, 2010,
thereafter Joint Venture of ABFSPL)
Birla Sun Life Trustee Company Private Limited (BSTPL) (directly held by the Company till March 22, 2010,
thereafter Joint Venture of ABFSPL)
Birla Sun Life Distribution Company Limited (BSDL) (on becoming Subsidiary, ceased to be Joint Venture w.e.f.
March 31, 2009)
IDEA Cellular Limited (31.78% upto August 12, 2008; 27.02% upto February 28, 2010, and thereafter 25.38%)
Associates:
Birla Securities Limited
Madura Garments International Brand Company Limited (MGIBCL) (w.e.f. November 27, 2009)
LIL Investment Limited (w.e.f. November 27, 2009)
Key Management Personnel and their relatives and enterprises having common Key Management
Personnel:
Dr. Bharat K. Singh – Managing Director (Upto 30th June, 2009)
Mr. Adesh Gupta – Whole-time Director (Upto 30th April, 2009)
Mr. K. K. Maheshwari – Whole-time Director
Dr. Rakesh Jain – Managing Director
Mr. Pranab Barua – Whole-time Director (w.e.f. 1st May, 2009)
Mr. Vikram Rao – Whole-time Director (Upto 31st January, 2009)
Relatives of Key Management Personnel:
Mrs. Usha Gupta (Wife of Mr. Adesh Gupta) (Upto 30th April, 2009)
Mrs. Sharda Maheshwari (Wife of Mr. K. K. Maheshwari)
Mrs. Vidya Rao (Wife of Mr. Vikram Rao) (Upto 31st January, 2009)
SCHEDULE 20 (Contd.)
SIGNIFICANT ACCOUNTING POLICIES AND NOTES ON ACCOUNTS
ANNEXURE-II (Contd.)
SCHEDULES

STA
ND
ALO
NE FIN
AN
CIA
L STATEM
EN
TS
[117]
SCHEDULE 20 (Contd.)
SIGNIFICANT ACCOUNTING POLICIES AND NOTES ON ACCOUNTS
ANNEXURE-II (Contd.)
b) During the year following transactions were carried out with the related parties in the ordinary course of business:
Rs. Crore
Relatives
Key of Key
Manage- Manage-
Transaction/Nature Joint ment ment Grand
of Relationship Subsidiaries Ventures Associates Personnel Personnel Total
Purchase of Goods and Services
MGEL 2.80 — — — — 2.80
(20.09) — — — — (20.09)
MGCCPL 53.60 — — — — 53.60
(64.45) — — — — (64.45)
OTHERS 0.74 0.20 — — 0.04 0.97
(0.84) — — — (0.13) (0.97)
57.13 0.20 — — 0.04 57.37
(85.38) — — — (0.13) (85.51)
Sales of Goods and Services
MGEL 2.71 — — — — 2.71
(8.73) — — — — (8.73)
MGLRCL 6.93 — — — — 6.93
(0.79) — — — — (0.79)
PEFRL 2.53 — — — — 2.53
(0.15) — — — — (0.15)
OTHERS 0.63 0.03 — — — 0.67
(1.07) (0.32) — — — (1.39)
12.79 0.03 — — — 12.82
(9.80) (0.32) — — — (10.12)
Interest Received
MGEL 1.78 — — — — 1.78
(2.13) — — — — (2.13)
ABFL 16.93 — — — — 16.93
(0.10) — — — — (0.10)
MGLRCL 8.37 — — — — 8.37
(5.45) — — — — (5.45)
PEFRL 8.31 — — — — 8.31
(7.28) — — — — (7.28)
OTHERS 4.90 — 0.03 β — 4.93
(1.26) — — (β) — (1.26)
40.29 — 0.03 β — 40.32
(16.22) — — (β) — (16.22)
Dividend Received
ABFL 3.29 — — — — 3.29
(11.56) — — — — (11.56)
3.29 — — — — 3.29
(11.56) — — — — (11.56)
SCHEDULES

STA
ND
ALO
NE FIN
AN
CIA
L STATEM
EN
TS
[118]
SCHEDULE 20 (Contd.)
SIGNIFICANT ACCOUNTING POLICIES AND NOTES ON ACCOUNTS
ANNEXURE-II (Contd.)
Rs. Crore
Relatives
Key of Key
Manage- Manage-
Transaction/Nature Joint ment ment Grand
of Relationship Subsidiaries Ventures Associates Personnel Personnel Total
Receipt against reimbursement
of Revenue/Capital Expenditure
PEFRL — — — — — —
(7.77) — — — — (7.77)
IDEA — 0.01 — — — 0.01
— — — — — —
MGLRCL — — — — — —
(4.82) — — — — (4.82)
BSLI 0.01 — — — — 0.01
— — — — — —
OTHERS — — — — — —
— (β) — — — (β)
0.01 0.01 — — — 0.02
(12.59) (β) — — — (12.59)
Interest Expenses
ABFL 0.05 — — — — 0.05
(0.33) — — — — (0.33)
ABMWL — — — — — —
(1.20) — — — — (1.20)
IDEA — — — — — —
— (0.76) — — — (0.76)
0.05 — — — — 0.05
(1.53) (0.76) — — — (2.29)
Managerial Remuneration Paid*
Mr. Pranab Barua — — — 2.47 — 2.47
— — — — — —
Dr. Bharat K. Singh — — — 1.36 — 1.36
— — — (3.28) — (3.28)
Mr. Adesh Gupta — — — 0.48 — 0.48
— — — (1.63) — (1.63)
Mr. K. K. Maheshwari — — — 3.69 — 3.69
— — — (3.21) — (3.21)
Dr. Rakesh Jain — — — 4.55 — 4.55
— — — (3.70) — (3.70)
Mr. Vikram Rao — — — — — —
— — — (2.18) — (2.18)
— — — 12.55 — 12.55
— — — (14.00) — (14.00)
* Excluding Gratuity and Leave Encashment provision and Employee Compensation under ESOP.
SCHEDULES

STA
ND
ALO
NE FIN
AN
CIA
L STATEM
EN
TS
[119]
Fresh Investment Made
ABFSPL 508.00 — — — — 508.00
(2.00) — — — — (2.00)
BSLICL 333.00 — — — — 333.00
(536.50) — — — — (536.50)
MGEL 0.10 — — — — 0.10
(82.75) — — — — (82.75)
OTHERS 28.06 — 2.03 — — 30.09
(68.20) (7.64) — — — (75.84)
869.16 — 2.03 — — 871.19
(689.45) (7.64) — — — (697.09)
Sale of Investment
ABFSPL 290.50 14.32 — — — 304.82
— — — — — —
290.50 14.32 — — — 304.82
— — — — — —
Purchase of Investment
ABFSPL 24.09 — — — — 24.09
— — — — — —
24.09 — — — — 24.09
— — — — — —
Loans Granted (including Inter-
Corporate Deposits)
ABCL 165.46 — — — — 165.46
(75.04) — — — — (75.04)
ABFL 2,437.25 — — — — 2,437.25
(31.50) — — — — (31.50)
MGEL 53.98 — — — — 53.98
(57.41) — — — — (57.41)
PEFRL 196.30 — — — — 196.30
(58.07) — — — — (58.07)
MGLRCL 878.75 — — — — 878.75
(69.78) — — — — (69.78)
OTHERS 169.90 — 1.13 — — 171.03
(0.34) — — — — (0.34)
3,901.63 — 1.13 — — 3,902.76
(292.14) — — — — (292.14)
SCHEDULE 20 (Contd.)
SIGNIFICANT ACCOUNTING POLICIES AND NOTES ON ACCOUNTS
ANNEXURE-II (Contd.)
Rs. Crore
Relatives
Key of Key
Manage- Manage-
Transaction/Nature Joint ment ment Grand
of Relationship Subsidiaries Ventures Associates Personnel Personnel Total
SCHEDULES

STA
ND
ALO
NE FIN
AN
CIA
L STATEM
EN
TS
[120]
SCHEDULE 20 (Contd.)
SIGNIFICANT ACCOUNTING POLICIES AND NOTES ON ACCOUNTS
ANNEXURE-II (Contd.)
Rs. Crore
Relatives
Key of Key
Manage- Manage-
Transaction/Nature Joint ment ment Grand
of Relationship Subsidiaries Ventures Associates Personnel Personnel Total
Loans Granted received back
(including Inter-Corporate
Deposits)
ABFL 2,372.25 — — — — 2,372.25
(31.50) — — — — (31.50)
MGEL — — — — — —
(92.90) — — — — (92.90)
PEFRL 152.00 — — — — 152.00
(67.95) — — — — (67.95)
MGLRCL 839.60 — — — — 839.60
(68.35) — — — — (68.35)
ABCL 152.72 — — — — 152.72
(57.37) — — — — (57.37)
OTHERS 130.09 — — β — 130.09
(10.00) — — (0.01) — (10.01)
3,646.65 — — β — 3,533.72
(328.07) — — (0.01) — (328.08)
Loans Taken (including Inter-
Corporate Deposits and
Bills Re-discounting )
ABMWL — — — — — —
(41.00) — — — — (41.00)
IDEA — — — — — —
— (75.00) — — — (75.00)
ABFL — — — — — —
(36.90) — — — — (36.90)
— — — — — —
(77.90) (75.00) — — — (152.90)
Loans Repaid (including Inter-
Corporate Deposits and
Bills Re-discounting)
ABFL 11.90 — — — — 11.90
(25.00) — — — — (25.00)
ABMWL — — — — — —
(41.00) — — — — (41.00)
IDEA — — — — — —
— (75.00) — — — (75.00)
11.90 — — — — 11.90
(66.00) (75.00) — — — (141.00)
SCHEDULES

STA
ND
ALO
NE FIN
AN
CIA
L STATEM
EN
TS
[121]
SCHEDULE 20 (Contd.)
SIGNIFICANT ACCOUNTING POLICIES AND NOTES ON ACCOUNTS
ANNEXURE-II (Contd.)
Rs. Crore
Relatives
Key of Key
Manage- Manage-
Transaction/Nature Joint ment ment Grand
of Relationship Subsidiaries Ventures Associates Personnel Personnel Total
Guarantees Given
during the year
MGCCPL — — — — — —
(20.00) — — — — (20.00)
PEFRL — — — — — —
(70.00) — — — — (70.00)
ABMWL 54.70 — — — — 54.70
— — — — — —
MGLRCL 3.60 — — — — 3.60
(60.00) — — — — (60.00)
58.30 — — — — 58.30
(150.00) — — — — (150.00)
Outstanding Balances
as at 31.03.2010
Loan Granted 194.04 — 1.13 — — 195.17
(64.26) — — (0.03) — (64.28)
Interest Accrued on Loans Granted 1.34 — 0.04 — — 1.39
(4.85) — — — — (4.85)
Loans Taken — — — — — —
(11.90) — — — — (11.90)
Amount Receivable against Debtors 3.34 — — — — 3.34
(1.33) — — — — (1.33)
Amounts Receivable against Advances 4.10 — — — — 4.10
(19.45) — — — — (19.45)
Amounts Payable 0.11 — 0.02 — — 0.13
(14.18) — — — — (14.18)
Guarantees Provided for 445.27 — — — — 445.27
(621.20) — — — — (621.20)
Deposits Receivable — — — — 2.00 2.00
— — — — (3.00) (3.00)
Deposits Payable 0.01 0.01 — — — 0.02
— (0.01) — — — (0.01)
Investments 2,859.25 2,355.81 2.03 — — 5,217.09
(2,393.37) (2,370.13) (0.01) — — (4,763.51)
- Figures in brackets represent corresponding amount of Previous Year.
- No amount in respect of the related parties have been written off/back are provided for during the year.
- Related party relationship have been identified by the management and relied upon by the auditors.
SCHEDULES

STA
ND
ALO
NE FIN
AN
CIA
L STATEM
EN
TS
[122]
SCHEDULE 20 (Contd.)
SIGNIFICANT ACCOUNTING POLICIES AND NOTES ON ACCOUNTS
ANNEXURE-III
Statement of Derivatives Outstanding at the Balance Sheet Date :
a) Derivatives : Outstanding as at Balance Sheet Date :
Amount in Foreign Currency As at
Nature of Contract Foreign Option 31-Mar-2010 31-Mar-2009 Purpose
Currency
Currency and Interest Rate
Swap JYen Buy 14,442,600,000 14,953,600,000 Hedging of Loan
Currency and Interest Rate
Swap USD Buy 15,000,000 — Hedging of Loan
Forward Contracts and
Interest Rate Swap USD Buy 15,192,277 — Hedging of Loan
Buyers’ Credit JYen Buy — 9,012,396,108 Hedging of Loan
Buyers’ Credit USD Buy 118,848,683 109,774,424 Hedging of Loan
Forward Contracts USD
Buy 63,682,954 30,246,105
Hedging Purpose
Sell 2,273,393 4,667,183
Forward Contracts EURO
Buy 119,221 178,427
Hedging Purpose
Sell 1,897,941 1,825,000
Forward Contracts GBP Sell 1,030,000 1,165,000 Hedging Purpose
Forward Contracts AUD Buy 629,501 800,000 Hedging Purpose
b) Foreign Currency exposure which are not hedged as at Balance Sheet Date :
Foreign Currency Receivable Payable Investments Net
USD 10,428,746 18,037,839 850,000 -6,759,093
(7,125,993) (15,806,140) (850,000) (-7,830,147)
EURO 742,941 136,230 — 606,711
(2,549,989) (761,646) — (1,788,343)
GBP 408,052 1,049,602 — -641,550
(982,959) (51,523) — (931,436)
AUD — — — —
— (470) — (470)
Figures in brackets represent corresponding amount of Previous Year.
SCHEDULES

STA
ND
ALO
NE FIN
AN
CIA
L STATEM
EN
TS
[123]
SCHEDULE 20 (Contd.)
SIGNIFICANT ACCOUNTING POLICIES AND NOTES ON ACCOUNTS
ANNEXURE - IV
INFORMATION PURSUANT TO THE PROVISIONS OF PARAGRAPHS 3, 4C AND 4D OF PART II OF SCHEDULE VI OF
THE COMPANIES ACT, 1956
(a) Details of Products Manufactured, Turnover, Opening Stock, Closing Stock, etc. :
Rs. Crore
Particulars Installed Opening Stock** Production Purchase Turnover Closing Stock
Year Ended Capacity
Unit 31st March Per Annum Quantity Amount Quantity Quantity Amount Quantity@ Amount Quantity Amount
Garments Nos./000 2010 7,837 176.43 3,300* 4,065 145.69 12,421 1,063.96 2,781 165.90
Nos./000 2009 5,200 157.21 8,579* 3,627 135.21 11,754 897.33 5,652 162.12
Viscose Filament Rayon Yarn MT 2010 16,400 481 8.43 16,759 — — 16,616 393.35 624 11.90
MT 2009 16,400 648 11.16 16,625 — — 16,792 362.09 481 8.43
Sulphuric Acid and MT 2010 55,300 785 0.24 47,671 — — 47,707 21.96 749 0.31
Allied Chemicals MT 2009 55,300 1,336 0.96 47,020 — — 47,572 31.02 784 0.24
Caustic Soda MT 2010 91,250 1,871 1.70 88,250 — — 88,897 133.81 1,224 0.98
MT 2009 91,250 887 0.65 78,574 — — 77,590 160.09 1,871 1.70
Chlorine MT 2010 80,665 311 (0.01) 72,377 — — 72,284 11.94 404 0.13
MT 2009 80,665 507 0.25 65,716 — — 65,914 13.95 310 (0.01)
Hydro Chloric Acid MT 2010 11,115 168 (0.00) 17,356 — — 17,293 0.91 231 0.04
MT 2009 11,115 359 0.07 11,811 — — 12,002 0.98 168 (0.00)
Spun Yarn MT 2010 43768 Spdl. 551 28.72 9,610 — — 9,474 445.52 687 28.80
MT 2009 43768 Spdl. 576 26.59 9,185 60 3.89 9,271 454.55 551 28.72
Cloth 000Mtr. 2010 106 looms 1,086 18.87 4,375 — — 4,194 105.82 1,267 17.21
000Mtr. 2009 106 looms 1,489 21.94 3,646 — — 4,049 96.19 1,086 18.87
Carbon Black MT 2010 230,000 3,211 16.82 233,370 — — 230,195 1,175.67 6,386 25.50
MT 2009 230,000 4,962 18.79 202,076 — — 203,827 1,183.66 3,211 16.82
High and Low Tension
Insulators MT 2010 48,760 3,043 29.64 36,063 1,110 4.17 37,050 446.84 3,166 24.71
and Bushings MT 2009 38,800 2,426 18.54 32,904 274 0.93 32,561 443.61 3,043 29.64
Liquid Argon ‘000 SM3 2010 3,000 112 0.34 485 — — 546 1.38 51 0.14
‘000 SM3 2009 3,000 91 0.44 1,561 — — 1,540 6.33 112 0.34
Urea MT 2010 2620 per day 12,823 10.41 1,097,705 — — 1,105,715 959.59 4,813 3.40
MT 2009 2620 per day 16,023 11.07 1,069,691 — — 1,072,891 1,107.94 12,823 10.41
Traded Goods 2010 — 3.21 — — 40.21 — 46.60 — 2.07
2009 — 1.30 — 89.69 — 107.32 — 3.21
Others 2010 — 8.53 — — 8.83 — 178.62 — 12.79
2009 — 4.71 — — 12.96 — 135.99 — 8.53
Total 2010 303.33 198.90 4,985.97 293.88
2009 273.68 242.68 5,001.04 289.02
The Installed Capacity is as Certified by the Management and licensed capacity is not given as licensing has been abolished.
@ Turnover quantity includes captive consumption, damages, sample sales, and shortages, and value includes export benefits.
* Garment production includes items produced on jobwork basis by outside parties and purchases.
** Includes Quantity 2185322 and Value Rs. 14.31 Crore of inventories as a result of composite scheme of arrangement.
SCHEDULES

STA
ND
ALO
NE FIN
AN
CIA
L STATEM
EN
TS
[124]
SCHEDULE 20 (Contd.)
SIGNIFICANT ACCOUNTING POLICIES AND NOTES ON ACCOUNTS
ANNEXURE - IV (Contd.)
Current Year Previous Year
MT Rs. Crore MT Rs. Crore
b) Raw Materials Consumed:
Wood Pulp 18,253 90.46 18,077 100.20
Wool Fibre 6,958 240.06 7,493 271.15
Flax Fibre 3,137 35.55 3,206 45.73
Staple and Synthetic Fibre 908 14.65 739 13.56
Cotton Staple and Synthetic Yarn 1,985 58.18 794 27.42
Carbon Black Feed Stock/Coal Tar 439,747 818.16 386,140 955.16
Fabrics in ‘000 Mtrs. 18,783 220.13 11,316 176.14
Natural Gas/RNLG (000SM3) 575,054 459.99 554,089 434.38
Naphtha (’000) 0.68 2.26 8.46 31.90
Metal Parts* — 95.67 — 88.64
Clays 47,049 19.02 26,691 14.71
Others 138.17 163.02
2,192.30 2,322.01
* It is not practicable to furnish quantitative information in view of the large number of items which differ in size
and nature, each being less than 10% in value of the total.
c) Value of Imports calculated on C.I.F. Basis:
Raw Materials 1,149.69 1,289.90
Stores and Spare Parts 18.41 23.66
Capital Goods 62.20 90.20
Purchase of Finished Goods 30.49 40.60
d) Expenditure in Foreign Currency (on actual payment basis):
Advertisement 1.10 2.66
Technical Assistance Fees/Royalty 0.86 4.70
Interest and Commitment Charges 24.91 9.39
Professional Charges 1.19 4.20
Travelling 1.23 2.12
Commission 9.23 11.25
Others 5.34 5.31
SCHEDULES

STA
ND
ALO
NE FIN
AN
CIA
L STATEM
EN
TS
[125]
SCHEDULE 20 (Contd.)
SIGNIFICANT ACCOUNTING POLICIES AND NOTES ON ACCOUNTS
ANNEXURE - IV (Contd.)
e) Value of Imported and Indigenous Raw Materials, Spare Parts and Components consumed and percentage
thereof to the total consumption:
Current Year Previous Year
Percentage Rs. Crore Percentage Rs. Crore
Raw Materials:
Imported 56.60% 1,240.76 61.00% 1,416.53
Indigenous 43.40% 951.55 39.00% 905.48
2,192.30 2,322.01
Stores, Spare Parts and Components:
Imported 9.59% 19.17 10.29% 20.26
Indigenous 90.41% 180.83 89.71% 176.72
200.00 196.98
f) Amount remitted in Foreign Currency on account of Dividend:
Dividend in respect of Accounting Year 2008-09 0.06 —
(562 Shareholders holding 149,608 Equity Shares)
Dividend in respect of Accounting Year 2007-08 — 0.08
(576 Shareholders holding 137,621 Equity Shares)
Dividend in respect of Accounting Year 2006-07 — β
(1 Shareholder holding 666 Equity Shares)
Dividend in respect of Accounting Year 2005-06 — β
(11 Shareholders holding 2,169 Equity Shares)
g) Earnings in Foreign Currency:
i) On Export of Goods (F.O.B. Basis):
(a) Foreign Currency 606.08 636.24
(b) Rupee Payments 14.71 43.41
(c) Export through Merchant Exporters 1.70 1.00
ii) Sale of Certified Emission Reduction 4.12 4.61
iii) Service Charge 0.18 0.07
SCHEDULES

STA
ND
ALO
NE FIN
AN
CIA
L STATEM
EN
TS
[126]
SEGMENT DISCLOSURES FOR THE YEAR ENDED 31ST
MARCH, 2010
ANNEXURE V
Rs. Crore
(I) Primary Segments - Business Garments Rayon Yarn (Incl. Carbon Black Insulators Textiles (Includes
Caustic Soda and Spun Yarns
Allied Chemicals) and Fabrics)
Current Previous Current Previous Current Previous Current Previous Current Previous
Period Period Period Period Period Period Period Period Period Period
a Segment Revenue #
Sales to External Customers
including Export Benefits but net
of Excise Duty 1,103.94 906.43 537.69 537.11 1,160.87 1,095.64 428.43 424.89 574.99 572.04
Inter-Segment Revenue — — — — — — (0.03) (0.07) 1.55 1.17
Total Segment Revenue 1,103.94 906.43 537.69 537.11 1,160.87 1,095.64 428.40 424.82 576.54 573.21
b Segment Result (PBIT) (14.37) (48.54) 120.01 89.82 227.33 24.69 97.66 108.25 46.80 32.69
Less: Interest and Finance Charges *
Add: Interest Income
Add: Unallocable Income Net of
Unallocable Expenditure
Profit before Tax
Provision for Taxation
Profit after Tax
c Carrying Amount of
Segment Assets 876.00 681.96 500.13 513.39 1,195.20 938.63 360.75 326.74 363.33 411.11
Unallocated Assets
Total Assets
d Carrying Amount of
Segment Liabilities 382.93 270.32 70.20 76.50 252.90 185.54 66.41 62.40 82.09 65.99
Unallocated liabilities
Total Liabilities
e Cost incurred to acquire Segment 17.74 106.89 29.53 34.66 19.68 16.10 38.05 26.96 3.51 30.62
Fixed Assets during the year
Unallocated Assets
f Depreciation/Amortisation 58.53 50.21 34.93 33.14 25.38 25.15 18.05 14.37 22.57 21.51
Unallocated Depreciation
* Interest and finance charges exclude interest of Rs. NIL (Previous Year: Rs. 0.22 Crore) on Financial Services Business, since it is considered
as an expense for deriving Segment Result.
(II) Secondary segment – Geographical Current Period Previous Year
The Company’s operating facilities are located in India
Domestic Revenues 4,202.78 4,136.65
Exports Revenues 624.69 649.53
Total 4,827.47 4,786.18
# Inter-segment revenues are recognised on arm’s length basis.

STA
ND
ALO
NE FIN
AN
CIA
L STATEM
EN
TS
[127]
ANNEXURE - V
Rs. Crore
(I) Primary Segments - Business Fertilisers Financial Services Gross Total Inter-Segment Net Total
Elimination
Current Previous Current Previous Current Previous Current Previous Current Previous
Period Period Period Period Period Period Period Period Period Period
a Segment Revenue #
Sales to External Customers
including Export Benefits
but net of Excise Duty 1,021.56 1,249.76 — 0.31 4,827.47 4,786.18
Inter-Segment Revenue — — — — 1.52 1.10
Total Segment Revenue 1,021.56 1,249.76 — 0.31 4,828.99 4,787.28 (1.52) (1.10) 4,827.47 4,786.18
b Segment Result (PBIT) 136.47 209.74 — (8.54) 613.91 408.11 — — 613.91 408.11
Less: Interest and Finance charges * 334.10 290.43
Add: Interest Income 48.61 33.38
Add: Unallocable Income Net of (8.11) 11.24
Unallocable Expenditure
Profit before Tax 320.30 162.30
Provision for Taxation 36.90 24.87
Profit after Tax 283.40 137.43
c Carrying Amount of
Segment Assets 406.21 681.13 — 14.69 3,701.64 3,567.65 — — 3,701.64 3,567.65
Unallocated Assets 5,788.71 6,006.95
Total Assets 9,490.34 9,574.60
d Carrying Amount of
Segment Liabilities 106.22 94.51 — 15.02 960.74 770.28 — — 960.74 770.28
Unallocated liabilities 3,868.08 4,682.65
Total Liabilities 4,828.83 5,452.93
e Cost incurred to acquire Segment 18.89 1.96 — 0.03 127.40 217.22 — — 127.40 217.22
Fixed Assets during the year
Unallocated Assets 0.37 0.40
f Depreciation/Amortisation 18.84 18.72 — 0.38 178.30 163.48 — — 178.30 163.48
Unallocated Depreciation 1.96 2.59
SEGMENT DISCLOSURES FOR THE YEAR ENDED 31ST
MARCH, 2010

STA
ND
ALO
NE FIN
AN
CIA
L STATEM
EN
TS
[128]
CASH FLOW STATEMENT FOR THE YEAR ENDED 31ST MARCH, 2010
Rs. Crore
PARTICULARS 31-Mar-2010 31-Mar-2009
A CASH FLOW FROM OPERATING ACTIVITIES
Net Profit before Tax 320.30 162.30
Adjustments for:
Depreciation 180.26 166.07
Provision for Bad and Doubtful Debts,
Advances and Other Current Assets (Net) 3.92 1.79
Interest Expenses 334.10 290.64
Interest Income (48.61) (33.38)
Employee Stock Options Outstanding 0.10 1.29
(Profit)/Loss on Fixed Assets Sold 7.13 (0.64)
(Profit)/Loss on Sale of Investments (7.69) (6.87)
Dividend Income (8.00) 461.21 (16.81) 402.09
OPERATING PROFIT BEFORE WORKING
CAPITAL CHANGES 781.51 564.39
Adjustment for:
Decrease/(Increase) in Sundry Debtors
and Other Receivables 259.25 (151.55)
Decrease/(Increase) in Inventories (87.16) 29.00
Increase/(Decrease) in Current Liabilities
and Provisions 165.11 337.20 85.36 (37.19)
CASH GENERATED FROM OPERATIONS 1,118.71 527.20
Income Taxes Refund/(Paid) (Net) (56.11) (82.74)
NET CASH FROM OPERATING ACTIVITIES 1,062.60 444.46
B CASH FLOW FROM INVESTING ACTIVITIES
Proceeds from Sale of Fixed Assets 2.37 6.85
Purchase of Fixed Assets (258.67) (274.84)
(Increase)/Decrease in Inter-Corporate Deposits (93.80) 25.91
Interest Received 52.11 33.59
Dividend Received 8.00 16.81
Sale/Redemption (Purchase) of Current
Investments (Net) 737.83 (625.61)
Sale of Investment in Subsidiaries 278.96 1.51
Investment in Subsidiaries (881.74) (948.71)
Sale of Investments 14.30 0.50
Purchase of investments (2.03) (125.87)
NET CASH (USED IN)/FROM INVESTING ACTIVITIES (142.67) (1,889.86)

STA
ND
ALO
NE FIN
AN
CIA
L STATEM
EN
TS
[129]
C CASH FLOW FROM FINANCING ACTIVITIES
Proceeds from Issue of Share Capital 8.00 —
Proceeds from Issue of Share Warrants
(Net of Conversion) 142.07 —
Share Premium Received (Net) 424.96 0.03
Capital Subsidy Received — 1.58
Proceeds from Borrowings 669.97 2,157.43
Repayment of Borrowings (1,858.48) (401.64)
Dividends Paid (including Tax thereon) (42.43) (63.91)
Interest and Finance Charges Paid (340.95) (255.43)
NET CASH (USED IN)/FROM FINANCING ACTIVITIES (996.86) 1,438.06
NET INCREASE IN CASH AND EQUIVALENTS (76.93) (7.34)
CASH AND CASH EQUIVALENTS (OPENING BALANCE) 89.81 97.15
Cash Acquired on Composite Scheme of Arrangement
(Refer Note 5 of Schedule 20) 1.43 —
CASH AND CASH EQUIVALENTS (CLOSING BALANCE) 14.31 89.81
Notes:
1) Cash and Cash Equivalents include:
Cash, Cheque in Hand and Remittance in Transit 2.56 6.34
Balance with Banks 11.75 83.47
14.31 89.81
2) Previous year’s figures have been regrouped/rearranged to confirm to the current year’s presentation, whenever
necessary.
3) Closing cash and cash equivalents includes Rs. 2.46 Crore (Previous Year: Rs. 2.35 Crore) lying in designated
account with scheduled banks on account of unclaimed Dividend and right issue refund order account, which
are not available for use by the Company.
Rs. Crore
PARTICULARS 31-Mar-2010 31-Mar-2009
For KHIMJI KUNVERJI & CO. For S.R. BATLIBOI & CO. DR. RAKESH JAIN Directors: TARJANI VAKIL
Firm registration no. 105146W Firm registration no. 301003E Managing Director P. MURARI
Chartered Accountants Chartered Accountants G. P. GUPTA
B. R. GUPTA
SUSHIL AGARWAL
Chief Financial Officer
Per SHIVJI K. VIKAMSEY Per VIJAY MANIAR DEVENDRA BHANDARI
Partner Partner Company Secretary
Membership No. 2242 Membership No. 36738
Mumbai, May 07, 2010
CASH FLOW STATEMENT FOR THE YEAR ENDED 31ST MARCH, 2010

STA
ND
ALO
NE FIN
AN
CIA
L STATEM
EN
TS
[130]
DR. RAKESH JAIN Directors: TARJANI VAKIL
Managing Director P. MURARI
G. P. GUPTA
B. R. GUPTA
SUSHIL AGARWAL
Chief Financial Officer
DEVENDRA BHANDARI
Mumbai, May 07, 2010 Company Secretary
I Registration Details
Registration No. 1 1 0 7 State Code 0 4
Balance Sheet Date 3 1 0 3 2 0 1 0
Date Month Year
II Capital Raised during the Year (Amount in Rs. Crore)
Public Issue Preferential Issue
N I L 5 7 5 . 0 1
Bonus Issue Private Placement
N I L N I L
III Position of Mobilisation and Development of Fund (Amount in Rs. Crore)
Total Liabilities Total Assets
8 4 7 5 . 6 3 8 4 7 5 . 6 3
Sources of Funds Paid-up Capital Reserves & Surplus*
1 0 3 . 1 1 4 5 5 8 . 4 0
Secured Loans Unsecured Loans
2 0 6 7 . 3 8 1 5 6 8 . 2 7
Application of Funds Net Fixed Assets Investments
1 8 1 5 . 2 8 5 4 3 5 . 8 5
Net Current Assets** Misc. Expenditure
1 0 4 6 . 0 3 N I L
* Includes Share Warrants and Employee Stock Options Outstanding.
** Net of Deferred Tax Liability.
IV Performance of Company (Amount in Rs. Crore)
Turnover Total Expenditure
4 8 9 8 . 2 6 4 5 7 7 . 9 6
Profit Before Tax Profit After Tax
3 2 0 . 3 0 2 8 3 . 4 0
Earning per Share Dividend Rate %
2 8 . 8 1 5 0 . 0 0
V Generic Names of Three Principal Products/Services of the Company (as per Monetary Terms)
Item Code No. (ITC Code) Product Description
6 2 0 0 0 0 Garments
5 4 0 3 1 1 0 . 0 9 Viscose Filament Rayon Yarn
2 8 0 3 Carbon Black
3 1 0 2 1 0 0 0 Urea
BALANCE SHEET ABSTRACT AND COMPANY’S GENERAL BUSINESS PROFILE

CO
NSO
LID
ATED
FIN
AN
CIA
L STATEM
EN
TS
[131]
AUDITORS’ REPORT ON THE CONSOLIDATED FINANCIAL STATEMENTS
The Board of Directors
Aditya Birla Nuvo Limited
1. We have audited the attached Consolidated Balance Sheet of Aditya Birla Nuvo Limited (‘the Company’) and its Subsidiaries,
Joint Ventures and Associates (collectively referred to as ‘the Group’), as at March 31, 2010 and also the Consolidated Profit
and Loss Account and the Consolidated Cash Flow Statement for the year ended on that date annexed thereto. These
Consolidated Financial Statements are the responsibility of the Company’s management and have been prepared by the
management on the basis of separate financial statements and other financial information regarding components. Our responsibility
is to express an opinion on these Consolidated Financial Statements based on our audit.
2. We conducted our audit in accordance with the auditing standards generally accepted in India. Those Standards require that we
plan and perform the audit to obtain reasonable assurance about whether the Consolidated Financial Statements are free of
material misstatement. An audit includes examining, on a test basis, evidence supporting the amounts and disclosures in the
Consolidated Financial Statements. An audit also includes assessing the accounting principles used and significant estimates
made by management, as well as evaluating the overall Consolidated Financial Statement presentation. We believe that our
audit provides a reasonable basis for our opinion.
3. We report that the Consolidated Financial Statements have been prepared by the Company in accordance with the requirements
of Accounting Standard (‘AS’) 21 Consolidated Financial Statements, AS 23 Accounting for Investments in Associates in
Consolidated Financial Statements and AS 27 Financial Reporting of Interests in Joint Ventures, notified by Companies Accounting
Standard Rules, 2006 (as amended).
4. Without qualifying our opinion we draw attention to Note 9 of schedule 21 to the Consolidated Financial Statement regarding
substituting unaudited consolidated figures of IDEA for the year ended March 31, 2009 with its audited consolidated figures for
that year. The impact of such substitution on the net profit for the year is not material.
5. Included in these Consolidated Financial Statement are total assets of Rs.24,678.39 Crore as at March 31, 2010, total revenues
of Rs.13,611.02 Crore and net cash outflow of Rs. 665.94 Crore for the year then ended, which have not been jointly audited
by us. These have been audited by either of us singly or jointly with others or by other auditors whose reports have been
furnished to us, and our opinion, in so far as it relates to the amounts included in respect of these entities, is based solely on
reports of those respective auditors.
6. Included in these Consolidated Financial Statement are total assets of Rs.535.91 Crore as at March 31, 2010, total revenues of
Rs.1,246.80 Crore and net cash flow of Rs.4.09 Crore for the year then ended, of Minacs Worldwide Inc., Canada and
Transwork BPO Phillippines Inc., Phillippines, subsidiaries of Aditya Birla Minacs Worldwide Limited (‘ABMWL’), (a subsidiary of
the Company). Theses have been audited by other auditors as per requirements of respective Country’s Generally Accepted
Accounting Principles (‘GAAP’). These have been converted as per requirements of Indian GAAP by the management of ABMWL.
The conversion has been audited by one of the joint auditors and our opinion, in so far as it relates to the amounts included in
respect of these entities, is based solely on reports of those auditors and its conversion in to Indian GAAP as stated above.
7. The actuarial valuation of liabilities of Birla Sunlife Insurance Company Limited (BSCL) for policies in force is responsibility of the
BSCL’s appointed actuary. The auditors of BSCL have relied on the appointed actuary’s certificate in this regard.
8. Based on our audit and on consideration of reports of other auditors on Separate Financial Statements and on the other
financial information of the Components and to the best of our information and according to the explanations given to us, we
are of the opinion that the attached Consolidated Financial Statement, give a true and fair view in conformity with accounting
principles generally accepted in India:
(a) in the case of the Consolidated Balance Sheet, of the state of affairs of the Company and its Subsidiaries, Joint Ventures
and Associates as at March 31, 2010;
(b) in the case of the Consolidated Profit and Loss Account, of the profit for the year ended on that date; and
(c) in the case of the Consolidated Cash Flow Statement, of the cash flows for the year ended on that date.
For KHIMJI KUNVERJI & CO. For S.R. BATLIBOI & CO.
Firm registration number: 105146W Firm registration number: 301003E
Chartered Accountants Chartered Accountants
Per Shivji K. Vikamsey Per Vijay Maniar
Partner Partner
Membership No.: 2242 Membership No.: 36738
Place: Mumbai Place: Mumbai
Date: May 07, 2010 Date: May 07, 2010

CO
NSO
LID
ATED
FIN
AN
CIA
L STATEM
EN
TS
[132]
CONSOLIDATED BALANCE SHEET AS AT 31ST MARCH, 2010
Rs. Crore
As at As at
Schedule 31-Mar-2010 31-Mar-2009
SOURCES OF FUNDS
Shareholders’ Funds:
Equity Share Capital 1 103.01 95.01
Preference Share Capital 1 25.59 25.52
Share Warrants (Refer Note 8 of Schedule 21) 142.07 377.41
Employee Stock Options Outstanding 14.67 6.94
Reserves & Surplus 2 5,189.44 5,237.37
5,474.78 5,742.25
Minority Interest 185.78 179.25
Loan Funds:
Secured Loans 3 4,624.10 5,047.03
Unsecured Loans 4 2,814.52 3,839.74
7,438.62 8,886.77
Deferred Tax Liabilities (Refer Note 10 of Schedule 21) 244.02 221.95
Policyholders’ Fund 15,353.45 8,596.88
Fund for Future Appropriations 298.42 128.96
Total Funds Employed 28,995.07 23,756.06
APPLICATION OF FUNDS
Fixed Assets:
Gross Block 5 11,567.84 10,033.05
Less: Accumulated Depreciation 5,012.27 4,086.96
Net Block 6,555.57 5,946.09
Capital Work-in-Progress 432.86 725.93
6,988.43 6,672.02
Goodwill on Consolidation 2,892.28 3,422.57
Investments
Life Insurance Policyholders’ Investment 6A 15,625.47 8,701.36
Other Investments 6B 1,331.00 2,381.04
16,956.47 11,082.40
Deferred Tax Assets (Refer Note 10 of Schedule 21) 3.40 2.18
Current Assets, Loans & Advances:
Inventories 7 902.66 834.80
Sundry Debtors 8 1,170.13 1,354.56
Cash & Bank Balances 9 794.84 1534.37
Interest Accrued on Investments 34.51 19.64
Loans & Advances 10 2,544.13 1,827.04
Other Current Assets 11 95.14 67.42
5,541.41 5,637.83
Less: Current Liabilities & Provisions: 12
Current Liabilities 3,214.78 2,912.60
Provisions 172.14 148.34
3,386.92 3,060.94
Net Current Assets 2,154.49 2,576.89
Total Funds Utilised 28,995.07 23,756.06
Significant Accounting Policies and Notes on Accounts 21
Schedules referred to above form an integral part of the Balance Sheet
As per our attached Report of even date
For KHIMJI KUNVERJI & CO. For S.R. BATLIBOI & CO. DR. RAKESH JAIN Directors: TARJANI VAKIL
Firm registration no. 105146W Firm registration no. 301003E Managing Director P. MURARI
Chartered Accountants Chartered Accountants G. P. GUPTA
B. R. GUPTA
SUSHIL AGARWAL
Chief Financial Officer
Per SHIVJI K. VIKAMSEY Per VIJAY MANIAR DEVENDRA BHANDARI
Partner Partner Company Secretary
Membership No. 2242 Membership No. 36738
Mumbai, May 07, 2010

CO
NSO
LID
ATED
FIN
AN
CIA
L STATEM
EN
TS
[133]
CONSOLIDATED PROFIT & LOSS ACCOUNT FOR THE YEAR ENDED
31ST MARCH, 2010
}
Rs. Crore
Year Ended Year Ended
Schedule 31-Mar-2010 31-Mar-2009
INCOME
Gross Revenue 13A 15,530.53 14,416.95
Less: Excise Duty 158.50 214.86
Net Revenue 15,372.03 14,202.09
Other Operating Income
- Investment Income/(Loss) on Life Insurance Policyholders’ Fund 4,003.15 (670.66)
- Others 13B 133.13 113.41
Net Income from Operations 19,508.31 13,644.84
Other Income 14 247.74 263.13
19,756.05 13,907.97
EXPENDITURE
(Increase)/Decrease in Stocks 15 20.33 (48.70)
Cost of Materials 16 2,482.78 2,705.68
Salaries, Wages and Employee Benefits 17 2,254.34 2,404.36
Manufacturing, Selling and Other Expenses 18 6,386.43 5,763.93
Change in Valuation of Liability in respect of Life Insurance Policies in Force 6,925.97 2,215.29
18,069.85 13,040.56
Profit before Interest, Depreciation/Amortisation and Tax 1,686.20 867.41
Interest and Finance Expenses 19 662.15 721.04
Profit before Depreciation/Amortisation and Tax 1,024.05 146.37
Depreciation/Amortisation 866.48 695.64
Profit/(Loss) before Tax from Operating Activities 157.57 (549.27)
Impairment in license value/Non-Compete Fee and Expenses relating to
Spice Amalgamation Scheme (of IDEA) ( Refer Note 5 of Schedule 21) 112.11 146.96
Less: Amount Withdrawn from Securities Premium/Business Restructuring Reserve (112.11) — (146.96) —
Profit/(Loss) before Tax 157.57 (549.27)
Provision for Taxation 20 114.00 81.05
Profit/(Loss) before Minority Interest 43.57 (630.32)
Minority Interest in the Loss of Consolidated Subsidiaries (111.03) (194.59)
Share of Profit/(Loss) of Associate (0.04) —
Net Profit/(Loss) 154.56 (435.73)
Balance Brought Forward (1,112.61) (642.48)
Amount Transferred on stake change/amalgamation of Subsidiaries/Joint Ventures (105.20) 50.37
Profit Available for Appropriation (1,063.25) (1,027.84)
APPROPRIATIONS
Debenture Redemption Reserve 53.19 16.28
Special Reserve 6.40 6.55
General Reserve 100.00 13.75
Dividend on Preference Shares 1.75 3.01
Proposed Dividend on Equity Shares 51.51 38.00
Corporate Tax on Dividend 8.86 7.18
Surplus/(Deficit) carried to Balance Sheet (1,284.96) (1,112.61)
(1,063.25) (1,027.84)
Basic Earnings per Share - Rs. 15.44 (46.28)
Dilutive Earnings per Share - Rs. (Refer Note 18 of Schedule 21) 14.80 (46.28)
(Face Value of Rs. 10/- each)
Significant Accounting Policies and Notes on Accounts 21
Schedules referred to above form an integral part of the Profit and Loss Account
As per our attached Report of even date
For KHIMJI KUNVERJI & CO. For S.R. BATLIBOI & CO. DR. RAKESH JAIN Directors: TARJANI VAKIL
Firm registration no. 105146W Firm registration no. 301003E Managing Director P. MURARI
Chartered Accountants Chartered Accountants G. P. GUPTA
B. R. GUPTA
SUSHIL AGARWAL
Chief Financial Officer
Per SHIVJI K. VIKAMSEY Per VIJAY MANIAR DEVENDRA BHANDARI
Partner Partner Company Secretary
Membership No. 2242 Membership No. 36738
Mumbai, May 07, 2010

CO
NSO
LID
ATED
FIN
AN
CIA
L STATEM
EN
TS
[134]
SCHEDULES
SCHEDULE 1 Rs. Crore
As at As at
SHARE CAPITAL Numbers 31-Mar-2010 31-Mar-2009
Authorised:
Equity Shares of Rs. 10/- each 175,000,000 175.00 175.00
(175,000,000)
Redeemable Preference Shares of Rs. 100/- each 500,000 5.00 5.00
(500,000)
180.00 180.00
Issued, Subscribed & Paid-up:
EQUITY SHARE CAPITAL
Equity Shares of Rs. 10/- each, fully paid-up 103,009,542 103.01 95.01
(95,009,290)
103.01 95.01
PREFERENCE SHARE CAPITAL
6% Redeemable Cumulative Preference Shares of Rs. 100/- each,
fully paid-up of the Company 10,000 0.10 —
(NIL)
0.10 —
Subsidiaries/Joint Ventures
6% Redeemable Cumulative Preference Shares of Rs. 100/- each,
fully paid-up of the subsidiary company 0.01 —
7% Compulsory Convertible Cumulative Preference Shares of Rs. 10/- each,
fully paid-up of the subsidiary company 25.00 25.00
Compulsory Convertible Preference Shares of Rs. 10/- each,
fully paid-up of the subsidiary company of Joint Venture company 0.48 0.52
25.49 25.52
25.59 25.52
Figures in brackets represent corresponding number of shares of Previous Year.
SCHEDULE 2
RESERVES & SURPLUS Rs. Crore
Addition on Deletion on
Balance as at Stake Change/ Stake Change/ Deductions/ Balance as at
31-Mar-2009 Addition Amalgamation Amalgamation Adjustments 31-Mar-2010
Capital Reserve 39.56 377.41 — 150.93 — 266.04
Capital Fund 0.01 — — — — 0.01
Capital Redemption Reserve 8.75 — 0.86 — β 9.61
Debenture Redemption Reserve 16.28 53.19 — — — 69.47
Securities Premium Account 4,214.79 425.93 — 707.55 — 3,933.17
General Reserve 2,015.98 100.01 557.83 559.16 — 2,114.66
Investment Allowance Reserve — — 0.01 — 0.01 —
Investment Reserve 19.95 — — — — 19.95
Special Reserve 12.53 6.40 — — — 18.93
Credit/(Debit) Fair Value Change Account 0.01 0.01 — — — 0.02
Amalgamation Reserve 1.08 — — 1.08 — —
Business Restructuring Reserve — — 4.28 — — 4.28
Foreign Currency Translation Reserve 21.04 17.22 — — — 38.26
Surplus as per Profit & Loss Account (1,112.61) — — 105.20 67.15 (1,284.96)
5,237.37 980.17 562.98 1,523.92 67.16 5,189.44
Previous Year 3,507.72 2,634.51 50.37 434.73 520.50 5,237.37

CO
NSO
LID
ATED
FIN
AN
CIA
L STATEM
EN
TS
[135]
SCHEDULES
Rs. Crore
As at As at
31-Mar-2010 31-Mar-2009
SCHEDULE 3
SECURED LOANS
Non-Convertible Debentures 110.00 110.00
Loans from Banks 3,706.20 3,975.02
Finance Lease Liability 8.62 79.85
Other Loans:
Deferred Sales Tax Loan 78.98 87.50
Others 720.30 794.66
4,624.10 5,047.03
SCHEDULE 4
UNSECURED LOANS
Fixed Deposits 0.82 3.51
Commercial Paper # 695.00 1,525.00
Short Term Loans from:
Banks 657.18 539.28
Others 176.33 673.14
Other Loans from:
Banks 442.70 661.19
Convertible Debentures 250.00 —
Non-Convertible Debentures 590.00 390.00
Others 2.49 47.62
2,814.52 3,839.74
Includes amounts repayable within one year 1,580.09 2,740.45
# Maximum amount due at any time during the year 1,670.00 1,630.00

CO
NSO
LID
ATED
FIN
AN
CIA
L STATEM
EN
TS
[136]
SC
HED
ULE 5
FIXED
A
SSETS
Rs. C
rore
Gross Blo
ck
Deprecia
tio
n/A
mortis
atio
nN
et Blo
ck
Additio
n/
Additio
n/
Dele
tion on
Dele
tion on
Foreig
nStake
Deduc-
Foreig
nStake
Deduc-
Exchange
Change/
Additio
ns
tio
ns/
Exchange
Change/
tio
ns/
As at
Transla
tion
Am
alg
a-
for the
Adju
st-
As at
Upto
Transla
tion
Am
alg
a-
For the
Adju
st-
Upto
As at
As at
31
-M
ar-0
9D
ifference
matio
nYear
ments
31
-M
ar-1
03
1-M
ar-0
9D
ifference
matio
nYear
ments
31
-M
ar-1
03
1-M
ar-1
03
1-M
ar-0
9
Tangib
le A
ssets
Land:
Freeho
ld1
3.1
7—
0.6
60
.6
3—
14
.4
6—
——
——
—1
4.4
61
3.1
7
Leaseho
ld3
3.6
1—
(0.3
1)
0.5
70
.0
73
3.8
03
.0
0—
(0.0
9)
0.4
50
.0
23
.3
43
0.4
63
0.6
1
Railw
ay Sid
ing
5.8
4—
——
—5
.8
45
.5
5—
——
—5
.5
50
.2
90
.2
9
Buildin
gs
Freeho
ld3
05
.1
9—
4.2
02
1.1
60
.1
03
30
.4
57
5.5
3—
0.9
98
.1
70
.0
98
4.6
02
45
.8
52
29
.6
6
Leaseho
ld2
6.5
5—
—0
.3
23
.6
22
3.2
53
.8
8—
—1
.4
51
.2
64
.0
71
9.1
82
2.6
7
Leasehold
Im
provem
ents
15
7.0
35
.6
2—
26
.6
68
.4
11
80
.9
07
8.8
92
.3
5—
23
.6
26
.9
29
7.9
48
2.9
67
8.1
4
Pla
nt
& M
achin
ery
7,4
14
.6
5(0
.1
1)
(43
.3
5)
1,3
52
.7
71
47
.8
08
,5
76
.16
2,6
93
.6
1(0
.0
6)
40
.0
36
15
.3
16
0.5
93
,2
88
.3
05
,2
87
.8
64
,7
21
.0
4
Furniture,
Fix
tures &
Equip
ment
91
6.9
42
2.2
71
6.0
38
4.4
43
4.6
01
,0
05
.0
85
79
.7
71
8.9
41
5.9
81
19
.9
92
2.4
77
12
.2
12
92
.8
73
37
.1
7
Vehic
les &
A
ircraft
61
.7
2(0
.0
4)
(0.5
1)
8.7
79
.69
60
.2
52
4.9
60
.2
0(0
.4
9)
11
.6
35
.1
73
1.1
32
9.1
23
6.7
6
Liv
esto
ck
0.0
1—
——
—0
.0
10
.0
1—
——
—0
.0
1—
—
Intangib
le A
ssets
Entr
y/Lic
ence Fees
67
8.6
5—
69
.7
51
00
.0
40
.0
88
48
.3
63
69
.3
1—
52
.1
94
0.7
00
.0
84
62
.1
23
86
.2
43
09
.3
4
Go
odw
ill
60
.1
7(0
.5
4)
——
—5
9.6
31
1.4
60
.0
6—
——
11
.5
24
8.1
14
8.7
1
Investm
ent
Managem
ent
Rig
hts
26
.92
——
——
26
.9
29
.4
2—
—2
.6
9—
12
.1
11
4.8
11
7.5
0
Client
Acquis
itio
n—
——
1.7
6—
1.7
6—
——
0.6
5—
0.6
51
.11
—
Tra
dem
ark
/Bra
nds/Technic
al
Know
-how
17
7.5
4—
——
—1
77
.5
41
42
.2
1—
—1
4.6
0—
15
6.8
12
0.7
33
5.3
3
So
ftw
are
15
5.0
6—
9.4
46
1.5
82
.6
52
23
.4
38
9.3
6—
10
.1
94
2.5
40
.1
81
41
.9
18
1.5
26
5.7
0
Total
10
,0
33
.0
52
7.2
05
5.9
11
,6
58
.7
02
07
.0
21
1,5
67
.8
44
,0
86
.9
62
1.4
91
18
.8
08
81
.8
09
6.7
85
,0
12
.2
76
,5
55
.5
75
,9
46
.0
9
Previo
us Year
8,3
18
.7
84
2.4
4(3
44
.8
1)
2,1
97
.5
91
80
.9
61
0,0
33
.0
53
,5
29
.8
62
3.1
7(3
1.2
6)
69
5.8
81
30
.6
94
,0
86
.9
65
,9
46
.0
9
Gross Blo
ck of
Fix
ed A
ssets
In
clu
des:
1.
Assets
held
under co
-ow
nership
—
Leasehold
Land Rs. 1
8.2
3 C
rore (Previo
us Year : Rs. 1
8.2
3 C
rore), Buildin
gs Rs. 2
3.8
5 C
rore (Previo
us Year: Rs. 2
3.8
5 C
rore), Furniture, Fix
tures and Equip
ment
Rs. 7
.7
9 C
rore (Previo
us Year: Rs. 7
.7
9 C
rore) and Vehic
les and A
ircraft Rs. 6
.8
3 C
rore (Previo
us Year: Rs. 6
.8
3 C
rore).
2.
The C
om
pany has m
ade an application fo
r exem
ption under Section 2
0 of
the U
rban Land (C
eilin
g &
Regula
tion) A
ct, 1
97
6, fo
r excess la
nd of
4.2
5 acres (Previo
us Year: 4
.2
5 acres) at
Ris
hra.
3.
Buildin
gs in
clu
de Rs 8
.1
9 C
rore (Previo
us Year: 8
.1
9 C
rore) bein
g cost
of
Debentu
res of
and Shares in
a com
pany entitlin
g th
e rig
ht
of
exclu
siv
e occupancy and use of
certa
in prem
ises.
4.
Pla
nt
& M
achin
ery in
clu
de Rs. 1
.5
4 C
rore (Previo
us Year: Rs. 1
.5
4 C
rore) bein
g assets
not
ow
ned by th
e C
om
pany.
7.
Pla
nt
& M
achin
ery in
clu
des A
sset
held
fo
r dis
posal
- G
ross Blo
ck Rs. 0
.2
6 C
rore (Previo
us Year: Rs 2
1.1
6 C
rore) and N
et
Blo
ck Rs. N
il (Previo
us Year: Rs. N
il).
6.
Pla
nt &
M
achin
ery in
clu
des G
ross Blo
ck of
Assets
capitalised under Fin
ance Lease Rs. 9
1.9
3 C
rore (Previo
us Year: Rs. 1
17
.2
1 C
rore) and correspondin
g A
ccum
ula
ted D
eprecia
tion bein
g Rs. 4
2.8
9
Crore (Previo
us Year: Rs 2
5.6
8 C
rore).
7.
Softw
are in
clu
des G
ross Blo
ck of
Assets
capitalised under Fin
ance Lease Rs. 2
2.0
0 C
rore (Previo
us Year: Rs. 7
.3
0 C
rore) and correspondin
g A
ccum
ula
ted D
eprecia
tion bein
g Rs.7
.7
2 C
rore
(Previo
us Year Rs. 2
.4
2 C
rore).
8.
Leasehold
im
provem
ents
in
clu
des G
ross Blo
ck of
Assets
capitalised under Fin
ance Lease Rs.1
4.7
5 C
rore (Previo
us Year: Rs. 1
4.9
4 C
rore) and correspondin
g A
ccum
ula
ted D
eprecia
tion bein
g Rs.
4.0
3 C
rore (Previo
us Year: Rs. 2
.7
8 C
rore).
9.
Furniture, Fix
tures &
Equip
ments
in
clu
des G
ross Blo
ck of
Assets
capitalised under Fin
ance Lease Rs. 6
5.7
3 C
rore (Previo
us Year: Rs. 7
5.8
0 C
rore) and correspondin
g A
ccum
ula
ted D
eprecia
tion
bein
g Rs. 5
0.7
6 C
rore (Previo
us Year: Rs. 5
0.0
4 C
rore).
SCHEDULES

CO
NSO
LID
ATED
FIN
AN
CIA
L STATEM
EN
TS
[137]
Rs. Crore
As at As at
31-Mar-2010 31-Mar-2009
SCHEDULE 6
INVESTMENTS
A. Life Insurance Policyholders’ Investments
LONG TERM INVESTMENTS
Quoted
Government Securities/Bonds 1,618.96 760.68
Debentures/Bonds 3,377.94 2,638.96
Equity 7,216.06 3,163.34
Unquoted
Debentures/Bonds 21.45 15.11
Equity 16.11 —
SHORT TERM INVESTMENTS
Quoted
Government Securities/Bonds 131.25 114.79
Debentures/Bonds 622.95 331.28
Unquoted
Debentures/Bonds 13.05 51.08
Mutual Funds 1,119.14 462.05
Other Investments 1,488.56 1,164.07
A 15,625.47 8,701.36
B. Other Investments
LONG TERM INVESTMENTS
Quoted
Government Securities/Bonds 192.18 132.83
Debentures/Bonds 108.53 30.27
Equity 201.48 201.54
Other Investments — 67.89
Unquoted
Government Securities/Bonds 0.01 β
Debentures/Bonds 30.00 —
Mutual Funds 23.70 8.40
Equity 4.45 2.44
Other Investments 50.95 15.01
SHORT TERM INVESTMENTS
Quoted
Government Securities/Bonds 68.20 93.67
Debentures/Bonds 15.86 20.19
Other Investments — 25.70
Unquoted
Mutual Funds 556.86 1,726.38
Equity — 43.22
Other Investments 78.78 13.50
B 1,331.00 2,381.04
Total Investment A + B 16,956.47 11,082.40
Investment in Associates 1.99 —
Market Value - Quoted 16,530.21 7,569.52
Aggregate Book Value - Quoted 13,553.42 7,581.15
Aggregate Book Value - Unquoted 3,403.05 3,501.25
SCHEDULES

CO
NSO
LID
ATED
FIN
AN
CIA
L STATEM
EN
TS
[138]
Rs. Crore
As at As at
31-Mar-2010 31-Mar-2009
SCHEDULE 7
INVENTORIES
Finished Goods 308.20 326.96
Stores and Spares 110.88 95.16
Raw Materials 416.33 345.76
Material-in-Process 67.09 66.62
Waste/Scrap 0.16 0.30
902.66 834.80
SCHEDULE 8
SUNDRY DEBTORS
(Unsecured, considered good except otherwise stated)
Due for period exceeding six months 55.19 27.30
[(Net of doubtful, fully provided Rs. 63.65 Crore)
(Previous Year : Rs. 89.61 Crore)]
Others * 1,114.94 1,327.26
[(Net of doubtful, fully provided Rs. 7.93 Crore)
(Previous Year : Rs. 5.42 Crore)]
1,170.13 1,354.56
* Includes subsidy receivable from Government of India Rs. 108.28 Crore (Previous Year: Rs. 305.77 Crore).
SCHEDULE 9
CASH & BANK BALANCES
Cash & Cheques in Hand and Remittances in Transit 142.81 176.55
Balances with Scheduled Banks: *
Current Accounts 162.59 232.26
Deposit Accounts 470.37 1,110.37
Balances with Non-Scheduled Banks:
On Current Account 19.07 15.18
On Deposit Account — 0.01
794.84 1,534.37
* Includes Rs. 62.82 Crore (Previous Year: Rs. 36.96 Crore) on account of following:
Unclaimed Dividend 2.49 2.37
Margin Money 59.62 30.42
Lien Marked in favour of IRDA 0.64 0.64
Unutilised IPO Money — 3.45
Right Issue Refund Order 0.07 0.08
SCHEDULES

CO
NSO
LID
ATED
FIN
AN
CIA
L STATEM
EN
TS
[139]
Rs. Crore
As at As at
31-Mar-2010 31-Mar-2009
SCHEDULE 10
LOANS & ADVANCES
(Unsecured, considered good except otherwise stated)
Bills of Exchange 79.25 97.03
Loan against Collateral Security 628.27 345.96
[(Net of Doubtful, fully provided Rs. Nil Crore)
(Previous Year : Rs. 6.58 Crore)]
Advances Recoverable in Cash or in Kind or for Value to be Received 622.39 596.54
[(Net of Doubtful, fully provided Rs. 16.76 Crore)
(Previous Year : Rs. 4.08 Crore)]
Inter-Corporate Deposits 629.04 343.12
Deposits 277.40 262.81
[(Net of Doubtful, fully provided Rs. 0.02 Crore)
(Previous Year: Rs. 1.01 Crore)]
Balances with Central Excise, Customs & Port Trust etc 110.35 67.33
[(Net of Doubtful, fully provided Rs. 30.78 Crore)
(Previous Year: Rs. 33.88 Crore)]
Advance Tax and Tax Deducted at Source (Net of provisions) 85.10 68.48
MAT Credit Entitlement 112.33 45.77
2,544.13 1,827.04
SCHEDULE 11
OTHER CURRENT ASSETS
Fertilisers Bonds (Refer Note 21(i) of Schedule 21) 29.33 37.45
Unbilled Revenue 65.81 29.97
95.14 67.42
SCHEDULE 12
CURRENT LIABILITIES & PROVISIONS
Current Liabilities:
Acceptances 47.91 33.15
Sundry Creditors
— Due to Micro and Small Enterprises 1.45 1.06
— Other than Micro and Small Enterprises 2,251.36 2,015.40
Advances from Customers 344.58 237.48
Income Received in Advance 44.03 6.47
Interest Accrued but not Due on Loans 74.77 127.00
Investors Education and Protection Fund to be Credited as and when due 2.60 2.49
Other Liabilities * 448.08 489.55
3,214.78 2,912.60
Provisions for:
Proposed Dividend 53.26 39.38
Corporate Tax on Dividend 8.86 6.94
Retirement Benefits 110.02 102.02
172.14 148.34
3,386.92 3,060.94
* Includes Bank Overdraft as per books. 212.18 277.61
SCHEDULES

CO
NSO
LID
ATED
FIN
AN
CIA
L STATEM
EN
TS
[140]
Rs. Crore
Year Ended Year Ended
31-Mar-2010 31-Mar-2009
SCHEDULE 13
INCOME FROM OPERATIONS
A. GROSS REVENUE
Revenue from Sale of Products 4,986.77 5,076.53
Income from Services 4,850.61 4,678.35
Life Insurance Premium 5,292.68 4,414.27
Income from Financial Services 400.47 247.80
15,530.53 14,416.95
B. OTHER OPERATING INCOME
Scrap Sales 9.07 8.91
Exports Incentives 43.23 50.09
Licence Fees and Royalties 1.32 1.96
Insurance Claims — 3.83
Government Grant 1.83 0.96
Power and Steam Sales 73.30 42.75
Certified Emission Reductions 4.12 4.61
Miscellaneous Other Operating Income 0.26 0.30
133.13 113.41
SCHEDULE 14
OTHER INCOME
Dividend on:
Long Term Investments 7.47 7.15
Current Investments 2.72 4.12
Profit/(Loss) on Sale of Investments (Net):
Long Term 0.82 (0.20)
Current 77.01 89.91
Investment Income — Life Insurance Shareholders’ Fund 30.14 34.24
Miscellaneous Income — Life Insurance Policyholders’ Fund 14.35 17.08
Interest on:
Long Term Investments — 0.01
Others 95.29 97.07
Miscellaneous Income 19.94 13.75
247.74 263.13
SCHEDULES

CO
NSO
LID
ATED
FIN
AN
CIA
L STATEM
EN
TS
[141]
Rs. Crore
Year Ended Year Ended
31-Mar-2010 31-Mar-2009
SCHEDULE 15
(INCREASE)/DECREASE IN STOCKS
Closing Stocks:
Finished Goods 308.20 326.96
Work-in-Process 67.09 66.62
Waste/Scrap 0.16 0.30
375.45 393.88
Less:
Opening Stocks:
Finished Goods 326.96 285.44
Work-in-Process 66.62 63.21
Waste/Scrap 0.30 0.09
393.88 348.74
(Increase)/Decrease in Excise Duty on Stocks 1.90 (3.78)
Less: Stock Acquired on Amalgamation/Acquisition — 0.22
(Increase)/Decrease 20.33 (48.70)
SCHEDULE 16
COST OF MATERIALS
Raw Material Consumption 2,255.64 2,444.13
Purchase of Finished Goods 227.14 261.55
2,482.78 2,705.68
SCHEDULE 17
SALARIES, WAGES AND EMPLOYEE BENEFITS
Payments to and Provisions for Employees:
Salaries, Wages and Bonus 2,036.11 2,162.88
Contribution to Provident and Other Funds 78.02 77.80
Welfare Expenses 131.19 158.06
Employee Compensation under ESOP 9.02 5.62
2,254.34 2,404.36
SCHEDULES

CO
NSO
LID
ATED
FIN
AN
CIA
L STATEM
EN
TS
[142]
Rs. Crore
Year Ended Year Ended
31-Mar-2010 31-Mar-2009
SCHEDULE 18
MANUFACTURING, SELLING AND OTHER EXPENSES
Consumption of Stores & Spares 188.08 187.41
Power & Fuel 706.76 701.55
Processing Charges 98.71 82.16
Tele-Service Charges 1,021.61 973.21
Connectivity Charges 127.87 114.46
Commission to Selling Agents 766.02 677.40
Brokerage & Discounts 61.96 31.64
Advertisement 334.47 359.49
Transportation & Handling Charges (Net) 50.51 65.12
Other Selling Expenses 430.18 366.48
Benefits Paid (Insurance Business) 1,138.78 646.44
Auditors’ Remuneration 6.64 6.67
Provision for Bad and Doubtful Debts and Advances (Net) 19.73 18.76
Repairs & Maintenance:
Buildings 12.79 12.17
Plant & Machinery 160.20 126.62
Others 87.31 73.65
Rent 438.61 348.17
Rates & Taxes (Refer Note 21 (ii) of Schedule 21) 34.47 71.34
Insurance 18.42 16.11
Research & Development Expenses 1.78 1.83
Miscellaneous Expenses (Refer Note 12 of Schedule 21) 681.53 883.25
6,386.43 5,763.93
SCHEDULE 19
INTEREST AND FINANCE EXPENSES
On Debentures and Fixed Loans* 522.04 511.73
Others 100.26 166.75
Finance Expenses 39.85 42.56
662.15 721.04
*Net of Interest Rebate Subsidy from Technology Upgradation Fund 10.28 10.97
SCHEDULE 20
PROVISION FOR TAXATION
Current Tax 162.24 144.96
MAT Credit (72.54) (36.30)
Deferred Tax 28.52 (7.43)
Fringe Benefit Tax — 15.65
Write back of excess provision for Tax/Income Tax refund related to
earlier years (Net) (4.22) (35.83)
114.00 81.05
SCHEDULES

CO
NSO
LID
ATED
FIN
AN
CIA
L STATEM
EN
TS
[143]
SCHEDULE 21
SIGNIFICANT ACCOUNTING POLICIES AND NOTES ON ACCOUNTS
A ACCOUNTING POLICIES
(I) ACCOUNTING CONVENTION
The Consolidated Financial Statements (CFS) comprises the financial statement of Aditya Birla Nuvo Ltd.
(“Company”) and its Subsidiaries, Joint Ventures and Associates (herein after referred to as “Group Companies”
and together as “Group”). The CFS of the Group have been prepared under the historical cost convention on an
accrual basis in compliance with material aspect of the Accounting Standards notified by the Companies
Accounting Standard Rules, 2006 (as amended), in case of Life Insurance Company guidelines issued by the
Insurance Regulatory and Development Authority (IRDA), and in case of Non Banking Financial Companies
(NBFC) prudential norms issued by the Reserve Bank of India (RBI) for asset classification, income recognition
and provisioning for non-performing assets. The accounting policies have been consistently applied by the
Group, and are consistent with those used in the previous year.
(II) ACCOUNTING ESTIMATES
The preparation of Financial Statements requires management to make estimates and assumption that affect
reported amounts of assets and liabilities, and disclosure of contingent liabilities at the date of the financial
statements and the results of operations during the reporting period end. Although these estimates are based
upon management best knowledge of current event and actions, actual results could defer from these estimates.
(III) PRINCIPLES OF CONSOLIDATION
The financial statements of the Company and its subsidiary companies have been combined on a line-by-line
basis by adding together the book values of like items of assets, liabilities, income and expenses, after eliminating
intra-group balances and transactions as per Accounting Standard (AS) 21 “Consolidated Financial Statements”.
Investments in Associate Companies have been accounted under the equity method as per AS 23 - “Accounting
for Investments in Associates in Consolidated Financial Statements”.
Interests in Joint Ventures have been accounted by using the proportionate consolidation method as per AS 27 -
“Financial Reporting of Interests in Joint Ventures”.
The excess/deficit of cost to the Company of its investment over its portion of net worth in the consolidated
entities at the respective dates on which the investment in such entities was made is recognised in the CFS as
goodwill/capital reserve.
Entities acquired during the year have been consolidated from the respective dates of their acquisition.
List of companies included in Consolidation are mentioned in Annexure A.
(IV) FIXED ASSETS
Fixed assets are stated at cost, less accumulated depreciation and impairment loss, if any. Cost comprises the
purchase price and any attributable cost of bringing the assets to its working condition for its intended use.
(V) DEPRECIATION/AMORTISATION
a) Fixed Assets
The Group provides depreciation on straight-line method over useful life estimated by the management.
The rates of depreciation for fixed assets are not lower than the rates prescribed in Schedule XIV of the
Companies Act, 1956.
Fixed assets, individually costing less than Rs. Five thousand, are fully depreciated in the year of purchase.
b) Intangible Assets are amortised equally over:
Estimated Useful Life
Trademarks/Brands/Technical Know-how - 7 to10 years
Software - 3 to 5 years
Entry and Licence Fees - Over period of licence
Investment Management Rights - Over period of 10 years
The Group does not amortise Goodwill, and is tested for impairment as at Balance Sheet date.
SCHEDULES

CO
NSO
LID
ATED
FIN
AN
CIA
L STATEM
EN
TS
[144]
(VI) IMPAIRMENT OF ASSETS
The carrying amounts of assets are reviewed at each Balance Sheet date if there is any indication of impairment
based on internal/external factors. An asset is treated as impaired when the carrying cost of the assets exceeds
its recoverable value. An impairment loss, if any, is charged to Profit and Loss Account in the year in which an
asset is identified as impaired. Reversal of impairment losses recognised in prior years is recorded when there is
an indication that the impairment losses recognised for the assets no longer exist or have decreased.
(VII) BORROWING COSTS
Borrowing costs, attributable to acquisition and construction of qualifying assets, are capitalised as a part of the
cost of such assets upto the date when such assets are ready for its intended use. Other borrowing costs are
charged to the Profit and Loss Account.
(VIII) TRANSLATION OF FOREIGN CURRENCY ITEMS
Transactions in foreign currency are recorded at the rate of exchange prevailing on the date of transaction.
Foreign currency monetary items are reported using closing rate of exchange at the end of the year. The
resulting exchange gain/loss is reflected in the Profit and Loss Account. Other non-monetary items, like fixed
assets, investments in equity shares, are carried in terms of historical cost using the exchange rate at the date of
transaction. Premium/Discount, in respect of forward foreign exchange contract, is recognised over the life of the
contracts. Profit/Loss on cancellation/renewal of forward exchange contract is recognised as income/expense for
the year.
Translation of foreign subsidiary is done in accordance with AS – 11 (Revised) “The Effects of Changes in Foreign
Exchange Rates”. In the case of subsidiaries, the operation of which are considered as integral, the Balance
Sheet items have been translated at closing rate except share capital and fixed assets, which have been
translated at the transaction date. The income and expenditure items have been translated at the average rate
for the year. Exchange Gain/(Loss) are recognised in the Profit and Loss Account.
In case of subsidiaries, the operation of which are considered as non-integral, all assets and liabilities are
converted at the closing rate at the end of the year, and items of income and expenditure items have been
translated at the average rate for the year. Exchange gain/(loss) arising on conversion are recognised under
Foreign Currency Translation Reserve.
(XI) DERIVATIVE INSTRUMENTS
Derivative financial instruments such as forward exchange contracts, currency swaps and interest rate swaps are
used to hedge risks associated with foreign currency fluctuations and interest rate. Currency and interest rate
swaps are accounted in accordance with their contract.
(X) INVESTMENTS
Investments are recorded at cost on the date of purchase, which includes acquisition charges such as brokerage,
stamp duty, taxes, etc. Current Investments are stated at lower of cost and fair value. Long term investments are
stated at cost after deducting provisions made, if any, for other then temporary diminution in the value.
Investments of Life Insurance Business:
Investments are made in accordance with the Insurance Act, 1938, the Insurance Regulatory and Development
Authority (Investment) Regulations, 2000, the Insurance Regulatory and Development Authority (Investment)
(Amendment) Regulations, 2001, and various other circulars/notifications issued by the IRDA in this context from
time to time.
All debt securities are considered as ‘held to maturity’ and stated at amortised cost.
The discount or premium which is the difference between the purchase price and the redemption amount of the
securities is amortised in the Profit and Loss Account, as the case may be, on a straight-line basis over the
remaining period to maturity of these securities.
Mutual fund investments are valued at realisable net asset value.
Listed equity shares are valued and stated at fair value, being the last quoted closing prices on the National
Stock Exchange (NSE), at the Balance Sheet date. If the equity shares are not traded on the NSE then closing
prices of the Bombay Stock Exchange (BSE) is considered.
SCHEDULE 21 (Contd.)
SIGNIFICANT ACCOUNTING POLICIES AND NOTES ON ACCOUNTS
SCHEDULES

CO
NSO
LID
ATED
FIN
AN
CIA
L STATEM
EN
TS
[145]
Unlisted equity shares are valued as per the valuation policy of the Birla Sun Life Insurance Company Limited
(BSLICL). A provision is made for diminution, if any; in the value of these shares to the extent that such
diminution is other than temporary.
(XI) INVENTORIES
Raw materials, components, stores and spares are valued at lower of cost and net realisable value. However,
these items are considered to be realisable at cost if the finished products in which they will be used, and are
expected to be sold at or above cost.
Work-in-progress and finished goods are valued at lower of cost and net realisable value. Finished goods and
work-in-progress include costs of conversion and other costs incurred in bringing the inventories to their present
location and condition.
Cost of inventories is computed on a weighted average/FIFO basis.
Proceeds in respect of sale of raw materials/stores are credited to the respective heads. Obsolete, defective and
unserviceable inventory are duly provided for.
(XII) GOVERNMENT GRANTS
Government Grants are recognised when there is reasonable assurance that the same will be received. Revenue
grants are recognised in the Profit and Loss Account. Capital grants relating to specific fixed assets are reduced
from the gross value of the respective fixed assets. Other capital grants are credited to capital reserve.
(XIII) REVENUE RECOGNITION
For Manufacturing business, revenue is recognised as follows:
Revenue from sale of products is recognised when the significant risks and rewards of ownership of the goods
have passed to the buyer.
Sales are recorded net of trade discounts, rebates and include excise duty.
Income from services are recognised as they are rendered based on agreements/arrangements with the concerned
parties. In case of fixed price contracts revenue is recognised on percentage of completion method and revenue
from time, and materials contract is recognised as the services are provided. Maintenance income is accrued
evenly over the period of contract.
Unbilled revenue represents revenues recognised in excess of the amounts billed as at the Balance Sheet date.
Amounts collected from customers prior to the performance of services are recorded as deferred revenue. These
advances are amortised to revenue in accordance with the Company’s policy on revenue recognition.
Income from Certified Emission Reductions (CERs) is recognised at estimated realisable value on confirmation of
CERs by the concerned authorities.
Fertiliser price support under Group Concession and other Scheme of Government of India is recognised based
on management’s estimate taking into account, the known policy parameters and input price escalation/de-
escalation.
For Life Insurance business, revenue is recognised as follows:
Premium is recognised as income when due from policyholders. For unit-linked businesses, premium income is
recognised when the associated units are created. Premium on lapsed policies is recognised as income when
such policies are reinstated. Premiums are net of service tax on risk premium collected, if any.
In case of Linked-Business, Top-up premiums paid by policyholders are considered as single premium, and are
unitised as prescribed by the regulations. This premium is recognised when the associated units are created.
Investment Management fee on linked funds is recognised when due.
Reinsurance premium ceded is accounted for at the time of recognition of the premium income in accordance
with the terms and conditions of the relevant treaties with the reinsurers. Impact on account of subsequent
revisions to or cancellations of premium are recognised in the year in which they occur.
SCHEDULE 21 (Contd.)
SIGNIFICANT ACCOUNTING POLICIES AND NOTES ON ACCOUNTS
SCHEDULES

CO
NSO
LID
ATED
FIN
AN
CIA
L STATEM
EN
TS
[146]
In case of Telecom business recharge fees on recharge vouchers is recognised as revenue as and when the
recharge voucher is activated by the subscriber. Unbilled receivables, represent revenues recognised from the
bill cycle date to the end of each month. These are billed in subsequent periods as per the terms of the billing
plans.
Income from Financial Services includes brokerage and fees on mutual fund units, bonds, fixed deposits, IPOs,
private equity and other alternative products, and services, which is recognised when due on completion of
transaction. Management fees from the schemes of the Mutual Fund are accounted on an accrual basis as per
Securities and Exchange Board of India (SEBI) Regulations, and for venture capital funds as per investment
management agreement entered with the Fund. Advisory and portfolio management fees are accounted on an
accrual basis as per contractual terms with clients.
Stock and Commodity Brokerage Income is recognised on trade basis of National Stock Exchange of India
Limited, The Bombay Stock Exchange Limited, Multi Commodities Exchange, and National Commodity and
Derivative Exchange.
Dividend income on investments is accounted for when the right to receive the payment is established.
(XIV) BENEFITS PAID (INCLUDING CLAIMS)
In case of Life Insurance Business maturity benefits are accounted for, when due for payment. Deaths and
other claims are accounted for, when notified. Surrenders/Withdrawals under linked policies are accounted in
the respective schemes when the associated units are cancelled. Claims payable, include the direct costs of
settlement. Reinsurance recoverable thereon, is accounted for in the same period as the related claim. Repudiated
claims, disputed before judicial authorities, are provided for based on management prudence, considering the
facts and evidences available in respect of such claims.
(XV) LICENCE FEES — REVENUE SHARE (TELECOM BUSINESS)
With effect from August 1, 1999, the variable License fee computed at prescribed rates of revenue share is being
charged to the Profit and Loss Account in the period in which the related revenue arises. Revenue for this
purpose comprises adjusted gross revenue as per the licence agreement of the licence area to which the licence
pertains.
(XVI) SCHEME EXPENSES (ASSET MANAGEMENT BUSINESS)
Recurring expenses of the schemes of Mutual Fund in excess of limits prescribed under the SEBI Regulations are
charged to the Profit and Loss Account in the year in which they are incurred. Trail Commission paid for future
period for Equity Link Saving Schemes (ELSS), Fixed Tenure Schemes, Close ended schemes and Systematic
Investment Plans (SIPs) in different schemes during the year are treated as prepaid expenses, and such brokerage
and commission are expensed out over three years in case of ELSS or duration of closed schemes or over the
duration of the SIP. Any other brokerage/commission is expensed in the year in which they are incurred.
(XVII) DISTRIBUTION COST (PRIVATE EQUITY FUND)
Distribution costs incurred by the Company in respect of Private Equity Fund have been accrued over the
Commitment Period of the Fund as defined in the Fund’s Private Placement Memorandum.
(XVIII) RETIREMENT AND OTHER EMPLOYEE BENEFITS
(i) Defined Contribution Plan
The Group makes defined contribution to Provident Fund, ESI and Superannuation Schemes which are
recognised in the Profit and Loss Account on accrual basis.
(ii) Defined Benefit Plan
The Group’s liabilities under Payment of Gratuity Act, long term compensated absences and pension are
determined on the basis of actuarial valuation made at the end of each financial year using the projected
SCHEDULE 21 (Contd.)
SIGNIFICANT ACCOUNTING POLICIES AND NOTES ON ACCOUNTS
SCHEDULES

CO
NSO
LID
ATED
FIN
AN
CIA
L STATEM
EN
TS
[147]
unit credit method except for short term compensated absences which are provided for on based on
estimates. Actuarial gains and losses are recognised immediately in the statement of Profit and Loss Account
as income or expense. Obligation is measured at the present value of estimated future cash flows using a
discounted rate that is determined by reference to market yields at the Balance Sheet date on Government
bonds where the currency and terms of the Government bonds are consistent with the currency and
estimated terms of the defined benefit obligation.
(XIX) EMPLOYEE STOCK-BASED COMPENSATION
The stock options granted are accounted for as per the accounting treatment prescribed by Employee Stock
Option Scheme and Employee Stock Purchase Guidelines, 1999, issued by Securities and Exchange Board of
India, whereby the intrinsic value (except in case of BPO business where fair value of the option is used) is
recognised as deferred employee compensation. The deferred employee compensation is charged to Profit and
Loss Account on straight-line basis over the vesting period of the option.
(XX) TAXATION
Tax expense comprises of current and deferred tax.
Provision for current tax is made on the basis of estimated taxable income for the current accounting year.
The deferred tax for timing differences between the book and tax profits for the year is accounted for, using the
tax rates and laws that have been substantively enacted as of the Balance Sheet date. Deferred tax assets arising
from timing differences are recognised to the extent there is reasonable certainty that these would be realised in
future. In case of unabsorbed losses and unabsorbed depreciation, all deferred tax assets are recognised only if
there is virtual certainty supported by convincing evidence that they can be realised against future taxable profit.
At each Balance Sheet date, the Company reassesses the unrecognised deferred tax assets.
Minimum Alternative Tax (MAT) credit is recognised as an asset only when and to the extent there is convincing
evidence that the companies in the Group will pay normal income tax during the specified period. In the year, in
which the MAT credit becomes eligible to be recognised as an asset in accordance with the recommendations
contained in Guidance Note issued by The Institute of Chartered Accountants of India, the said asset is created
by way of a credit to the Profit and Loss Account and shown as MAT Credit Entitlement. The companies in the
Group reviews the same at each Balance Sheet date and writes down the carrying amount of MAT Credit
Entitlement to the extent there is no longer convincing evidence to the effect that the Group will pay normal
Income Tax during the specified period.
(XXI) OPERATING LEASES
Leases, where significant portion of risk and reward of ownership are retained by the Lessor, are classified as
Operating Leases and lease rentals thereon are charged to Profit and Loss Account on a straight-line basis over
lease term. Lease income is recognised in the Profit and Loss Account on a straight-line basis over lease term.
(XXII) FINANCE LEASE
Finance lease, which effectively transfers to the Group substantially all the risks and benefits incidental to
ownership of the leased item, are capitalised at lower of fair value and present value of the minimum lease
payments at the inception of the lease term and disclosed as leased assets. Lease payments are apportioned
between the finance charges and reduction of the lease liability based on implicit rate of return. Finance charges
are charged directly against income. Lease management fees, lease charges and other initial direct costs are
capitalised.
(XXIII) CONTINGENT LIABILITIES AND PROVISIONS
Contingent Liabilities are possible but not probable obligation as on the Balance Sheet date, based on the
available evidence.
Provisions are recognised when there is a present obligation as a result of past event, and it is probable that an
outflow of resources will be required to settle the obligation, in respect of which a reliable estimate can be made.
Provisions are determined based on the best estimate required to settle the obligation at the Balance Sheet date.
SCHEDULE 21 (Contd.)
SIGNIFICANT ACCOUNTING POLICIES AND NOTES ON ACCOUNTS
SCHEDULES

CO
NSO
LID
ATED
FIN
AN
CIA
L STATEM
EN
TS
[148]
Annexure ‘A’ to Accounting Policies
Proportion of Proportion of
Ownership Ownership
Country of Interest as on Interest as on
Incorporation March 31, 2010 March 31, 2009
SUBSIDIARIES
Aditya Birla Financial Services Private Limited (ABFSPL)
(w.e.f. November 4, 2008) India 100.00% 100.00%
Aditya Birla Capital Advisors Private Limited (ABCAPL)
(Subsidiary of ABFSPL) (w.e.f. November 4, 2008) India 100.00% 100.00%
Aditya Birla Customers Services Private Limited (ABCSPL)
(Subsidiary of ABFSPL) (w.e.f. December 11, 2008) India 100.00% 100.00%
Aditya Birla Securities Private Limited (ABSPL)
(Subsidiary of ABFSPL) (w.e.f. November 4, 2008 and
ceased to be a Subsidiary w.e.f. March 13, 2009) India — —
Aditya Birla Trustee Company Private Limited (ABTCPL)
(Subsidiary of ABFSPL) (w.e.f. November 28, 2008) India 100.00% 100.00%
Aditya Birla Money Limited (ABML)
(formerly known as Apollo Sindhoori Capital Investments Limited)
(directly held by the Company till February 22, 2010,
thereafter a Subsidiary of ABFSPL) (w.e.f. March 6, 2009)
(76.00 % upto March 12, 2010) India 75.00% 76.00%
Aditya Birla Commodities Broking Limited (ABCBL)
(formerly known as Apollo Sindhoori Commodities Trading Limited)
(100% Subsidiary of ABML) (w.e.f. March 6, 2009) India 75.00% 76.00%
Aditya Birla Financial Shared Services Limited (ABFSSL)
(Subsidiary of LIL till August 02, 2009, thereafter a Subsidiary of ABFSPL)
(w.e.f. June 19, 2008 ) India 100.00% 100.00%
Birla Insurance Advisory & Broking Services Limited (BIABSL)
(Subsidiary of ABFL till March 14, 2010, thereafter a Subsidiary of ABFSPL)
(50.01% Subsidiary of ABFSPL) India 50.01% 50.01%
Aditya Birla Minacs Worldwide Limited (ABMWL) India 88.28% 88.28%
Transworks Inc. (TW Inc.) (100% Subsidiary of ABMWL) USA 88.28% 88.28%
Aditya Birla Minacs Philippines Inc. (ABMPI)
(100% Subsidiary of ABMWL) Philippines 88.28% 88.28%
AV TransWorks Limited. (AVTL) (100% Subsidiary of ABMWL) Canada 88.28% 88.28%
Aditya Birla Minacs Worldwide Inc. (ABMWI) (100% Subsidiary of AVTL) Canada 88.28% 88.28%
Compass BPO Limited (CBL) (100% Subsidiary of ABMWI)
(w.e.f. March 09, 2010) UK 88.28% —
Compass Business Process Outsourcing Private Limited
(100% Subsidiary of CBL) (w.e.f. March 09, 2010) India 88.28% —
Compass BPO Inc. (100% Subsidiary of CBL) (w.e.f. March 09, 2010) USA 88.28% —
Compass BPO FZE (100% Subsidiary of CBL) (w.e.f. March 09, 2010) UAE 88.28% —
Minacs Worldwide SA de CV (100% Subsidiary of ABMWI) Mexico 88.28% 88.28%
Minacs Group (USA) Inc. (100% Subsidiary of ABMWI) USA 88.28% 88.28%
Minacs Limited (100% Subsidiary of ABMWI) UK 88.28% 88.28%
Minacs Worldwide GmbH (100% Subsidiary of Minacs Limited) Germany 88.28% 88.28%
Minacs Kft. (100% Subsidiary of Minacs GmbH) Hungary 88.28% 88.28%
SCHEDULE 21 (Contd.)
SIGNIFICANT ACCOUNTING POLICIES AND NOTES ON ACCOUNTS
SCHEDULES

CO
NSO
LID
ATED
FIN
AN
CIA
L STATEM
EN
TS
[149]
Aditya Birla Money Mart Limited (ABMML) (formerly known as
Birla Sun Life Distribution Company Limited) (w.e.f. March 31, 2009) India 100.00% 100.00%
Aditya Birla Money Insurance Advisory Services Limited
(100% Subsidiary of ABMML) India 100.00% 100.00%
Aditya Vikram Global Trading House Limited (AVGTHL) Mauritius 100.00% 100.00%
BGFL Corporate Finance Private Limited (BGCFPL)
(ceased to be a Subsidiary w.e.f. March 31, 2009) India — —
Aditya Birla Finance Limited (ABFL)
(formerly known as Birla Global Finance Company Limited) India 100.00% 100.00%
Birla Sun Life Insurance Company Limited (BSLICL) India 74.00% 74.00%
ABNL Investment Limited (ABIL)
(formerly known as Laxminarayan Investment Limited) India 100.00% 100.00%
Madura Garments International Brand Company Limited (MGIBCL)
(on becoming Associate, ceased to be a Subsidiary
w.e.f. November 27, 2009) India — 100.00%
LIL Investment Limited (w.e.f. July 27, 2009, and on becoming
Associate, ceased to be a subsidiary w.e.f. November 27, 2009) India — —
Madura Garments Exports Limited (MGEL)
(merged with the Company w.e.f. January 01, 2010) India — 100.00%
Madura Garments Exports US, Inc.
(ceased to be a Subsidiary from February 09, 2010) USA — 100.00%
Madura Garments Lifestyle Retail Company Limited (MGLRCL) India 100.00% 100.00%
MG Lifestyle Clothing Company Private Limited (MGCCPL)
(merged with the Company w.e.f. January 01, 2010) India — 100.00%
Peter England Fashions and Retail Limited (PEFRL) India 100.00% 100.00%
Aditya Birla Minacs IT Services Limited (ABMITS)
(formerly known as PSI Data Systems Limited) India 82.92% 76.89%
Birla Technologies Limited (100% Subsidiary of ABMITS) India 82.92% 76.89%
JOINT VENTURES
Birla Sun Life Asset Management Company Limited (BSAMC)
(directly held by the Company till March 22, 2010,
thereafter Joint Venture of ABFSPL) India 49.99% 49.99%
Birla Sun Life Trustee Company Private Limited (BSTPL)
(directly held by the Company till March 22, 2010,
thereafter a Joint Venture of ABFSPL) India 49.85% 49.85%
Birla Sun Life Distribution Company Limited (BSDL)
(on becoming a Subsidiary, ceased to be a Joint Venture India — —
w.e.f. March 31, 2009)
IDEA Cellular Limited India 25.38% 27.02%
(31.78% upto August 12, 2008; 27.02% upto February 28, 2010,
and thereafter 25.38%)
ASSOCIATES
Birla Securities Limited (BSL) India 50.00% 50.00%
Madura Garments International Brand Company Limited (MGIBCL)
(w.e.f. November 27, 2009) India 49.99% —
LIL Investment Limited (w.e.f. November 27, 2009) India 49.99% —
Proportion of Proportion of
Ownership Ownership
Country of Interest as on Interest as on
Incorporation March 31, 2010 March 31, 2009
SCHEDULE 21 (Contd.)
SIGNIFICANT ACCOUNTING POLICIES AND NOTES ON ACCOUNTS
SCHEDULES

CO
NSO
LID
ATED
FIN
AN
CIA
L STATEM
EN
TS
[150]
B NOTES ON ACCOUNTS
Rs. Crore
Current Year Previous Year
1. Contingent Liabilities not provided for in respect of:
i) Claims against the companies not acknowledged as debts
a) Income-tax 107.54 93.18
b) Custom Duty 1.01 1.45
c) Excise Duty 29.06 28.03
d) Sales Tax 144.99 89.42
e) Service Tax 101.91 54.29
f) Others 171.77 146.51
ii) Bills discounted with banks 66.16 50.17
iii) Corporate guarantees given to Banks/Financial Institutions
for loans taken by the companies 17.58 21.25
iv) Uncalled commitment in respect of investments in units of
Aditya Birla Power Equity Fund I 140.90 —
v) Customs Duty on capital goods and raw materials imported
under advance licensing/EPCG scheme, against which export
obligation is to be fulfilled 44.22 30.68
Total 825.14 514.98
vi) Under the Jute Packaging Material (Compulsory use of Packing Commodities) Act, 1987, a specified
percentage of fertilisers dispatched was required to be supplied in jute bags upto 31st August, 2001. The
unit made conscious efforts to use jute packaging material as required under the said Act. However, due
to non-availability of material as per the unit’s product specifications as well as due to strong customer
resistance to use of jute bags, the specific percentage could not be adhered to. The unit has received a
show cause notice, against which a writ petition has been filed with the Hon’ble High Court, which is
awaiting for hearing. The Jute Commissioner, Kolkata had filed transfer petition, various writ petitions
have been filed in different High Courts by other aggrieved parties, including the unit, before) the
Hon’ble Supreme Court of India praying for consolidation of all cases at one Court. The transfer petition
is pending before the Hon’ble Supreme Court. The unit has been advised that the said levy is bad in law.
vii) Idea Cellular Ltd. (Idea), in which the Company currently has the largest shareholding, was originally a
tripartite joint venture between A.V. Birla Group, Tata Group and AT&T Group. With the exit of AT&T and
the Tata Group, Idea is now part of A.V. Birla Group.
Prior to its exit, Tata Group had alleged that the A.V. Birla Group had committed material breach of the
Shareholders, Agreement, and the Tata Group invoked the arbitration clause, pursuant to which an
Arbitral Tribunal has been constituted, which will be considering the claims of the Tata Group and the
counter-claims of the A.V. Birla Group.
The Company believes that it has a strong case to counter the allegations of breach and it does not
contemplate any liability to arise on this matter.
Rs. Crore
Current Year Previous Year
2. Estimated amount of Contracts remaining to be executed on
Capital Account and not provided for (Net of Advances) 370.47 563.50
3. a) Aditya Birla Minacs Worldwide Ltd. (ABMWL), a subsidiary of the Company, has issued Zero Coupon
Compulsorily Convertible Debentures (CCD) aggregating Rs. 250 Crore to be converted into Equity of
ABMWL on the expiry of a period of 60 months from the date of allotment of such CCD. The Company
has entered into an option agreement with the subscribers of such CCD, pursuant to which the subscribers
SCHEDULE 21 (Contd.)
SIGNIFICANT ACCOUNTING POLICIES AND NOTES ON ACCOUNTS
SCHEDULES

CO
NSO
LID
ATED
FIN
AN
CIA
L STATEM
EN
TS
[151]
has call option on the Company, and the Company has put option on the subscribers on expiry of 24,
36, 48 and 60 months from the date of allotment of CCD at a pre-agreed price. Further on happening
of certain events, the put option can also be exercised by the subscribers on the Company on any other
date on happening of such events.
b) Idea Cellular Limited (IDEA), a Joint Venture Company, has a contingent obligation to buy compulsory
convertible preference shares issued by Aditya Birla Telecom Limited, its wholly owned subsidiary, from
the holder at the original price, the Group’s share of the same is Rs. 532.55 Crore.
4. The actuarial liabilities of Life Insurance Business are calculated in accordance with the accepted actuarial
practice, requirements of the Insurance Act, 1938, Regulations notified by the IRDA and Guidance Notes
prescribed by the Institute of Actuaries of India.
5. The scheme of amalgamation (‘the Scheme’) of Spice Communications Limited (‘Spice’), with Idea Cellular
Limited (‘IDEA’), was approved by the Hon’ble High Court of Gujarat and the Hon’ble High Court of Delhi
and became effective on 1st March, 2010.
As per the Scheme, the amalgamation has been given effect under the ‘Pooling of Interest Method’ in
accordance with the applicable Accountin2g Standard, pursuant to which assets, liabilities and reserves of
Spice has been recorded in the books of IDEA at their carrying values at the close of business immediately
preceding the effective date.
As per the Scheme following impacts have been given in the Group’s Financial Statements:
a) The Group’s balance in the Amalgamation Reserve Account aggregating Rs. 1.08 Crore and Capital
Reserve Account aggregating Rs. 30.44 Crore of IDEA has been transferred to the General Reserve
Account. The Group’s shares in net debit aggregating Rs. 434.88 Crore on account of (i) cancellation of
IDEA’s investment in Spice and Issue of the fresh equity shares by IDEA to the shareholder of Spice
reduced by (ii) cancellation of share capital of Spice, is charged to General Reserve Account. The
shortfall in General Reserve Account as a result of above has been withdrawn from the Securities
Premium Account and credited to the General Reserve Account.
b) The Group’s share of the value of impairment loss provided by Spice on licences, which overlap with
those of the IDEA and included in the balance of accumulated Loss aggregating Rs.122.96 Crore being
added to the Profit & Loss Account of the IDEA on amalgamation, has been adjusted by withdrawal from
General Reserve. An equivalent amount has been withdrawn from Securities Premium Account and
credited to General Reserve.
c) The Group’s share of Rs. 25.38 Crore has been withdrawn from Securities Premium Account and
transferred to Business Restructuring Reserves and the Group’s share of Rs. 21.10 Crore has been
withdrawn from Business Restructuring Reserve and transferred to Profit and Loss Account for setting off
impairment loss on Fixed Assets, legal charges and other scheme, related expenses.
d) The scheme of de-merger of overlapping UAS license of Punjab and Karnataka held by IDEA not
becoming effective, an impairment loss amounting to Group’s share of Rs. 91.01 Crore (being the cost
of these licences) is debited to the Profit and Loss Account and set off with a corresponding equivalent
amount withdrawn from the Securities Premium Account as per the Scheme.
e) Had the scheme not mandated the above accounting treatment, the Group’s share in:
i) Securities Premium would have been higher by Rs. 642.71 Crore;
ii) Amalgamation Reserve would have been higher by Rs. 1.08 Crore;
iii) Capital Reserve would have been higher by Rs. 30.44 Crore;
iv) Business Restructuring Reserve would have been lower by Rs. 4.28 Crore;
v) Debit balance of the carried forward Profit and Loss Account higher by Rs. 669.95 Crore;
and
vi) the Profit for the year lower by Rs. 112.11 Crore;
6. a) In IDEA, pursuant to the change in agreements, certain sites taken under Finance Lease have been
reclassified into operating lease in current year. Consequently, the Group’s Share of net fixed assets
aggregating Rs. 67.64 Crore against these sites has been de-capitalised, finance lease liability and
related provisions aggregating Rs. 80.82 Crore have been reversed and difference of Rs.13.18 Crore
has been recognised in the Profit and Loss Account under the Unspent liabilities, excess provision and
unclaimed balances in respect of earlier years written back.
SCHEDULE 21 (Contd.)
SIGNIFICANT ACCOUNTING POLICIES AND NOTES ON ACCOUNTS
SCHEDULES

CO
NSO
LID
ATED
FIN
AN
CIA
L STATEM
EN
TS
[152]
b) As per transitional provisions given in the notification issued by Ministry of Corporate Affairs, dated
March 31, 2009, IDEA has opted for the option of adjusting the exchange differences on long term
foreign currency monetary items to the cost of the assets acquired out of these foreign currency monetary
items. During the year the, Group’ share of exchange gain amounting to Rs. 24.57 Crore has been de-
capitalised.
7. i) Pursuant to the Composite Scheme of Arrangement (the Scheme) under Sections 391 to 394 of the
Companies Act, 1956, between Aditya Birla Nuvo Limited (Company) and Madura Garments Export
Limited (MGEL), MG Lifestyle Clothing Company Private Limited (MGCCPL), and Peter England Fashions
and Retail Company Limited (PEFRL), the wholly owned subsidiaries of the Company. MGEL and
MGCCPL have been merged with the Company and domestic garments business of PEFRL has demerged
from PEFRL and merged with the Company with effect from January 01, 2010 (the Appointed Date)
pursuant to the Order, passed by Hon’ble High Court of Gujarat on January 28, 2010. The effective
date of the Scheme is February 22, 2010. Pursuant to the Scheme, accumulated losses of PEFRL
amounting to Rs. 119.16 Crore has been transferred to the Capital Reserve.
ii) As consequence of the demerger, the Company has issued and allotted to the preference shareholder(s)
of the PEFRL (other than the Company) one fully paid-up 6% Redeemable Preference share of Rs. 100/- each
of the Company as fully paid up for every one 6% Redeemable Preference share of Rs 100/- each fully
paid up and held in PEFRL.
8. i) In accordance with approval of the shareholders in the extra-ordinary general meeting of the Company
held on June 17, 2009, the Company has, on a preferential basis issued 1.85 Crore Warrants of Rs. 10/- each
to the Promoter and/or Promoter Group at a price of Rs. 541.19. The holder of each warrant is entitled
to apply for and obtain allotment of 1 Equity Share against each warrant at any time after the date of
allotment but on or before the expiry of 18 months from the allotment in one or more tranches. The
Company has received an amount of Rs. 250.30 Crore equivalent to 25% of the price and Rs. 324.71
Crore (net of receipt of Rs. 108.24 Crore received on allotment of warrant) on exercise of 80 Lacs
Warrants of Rs. 10/- each by the Promoter Group. Total amount of Rs. 575.01 Crore received from the
preferential allotment of the warrants has been fully utilised.
ii) One of the Promoter Group, holding 1.88 Crore warrants issued to it on a preferential basis on February
21, 2008, had informed the Company that it will not exercise the option of acquiring equity shares in
respect of the above Warrants. Consequently, Rs. 377.41 Crore paid by the said Promoter Group, being
10% of the issue price, has been forfeited and transferred to Capital Reserve. Also the option attached to
the aforesaid warrants has been cancelled.
9. Previous Year’s Figures
During preparation of CFS for the year ended March 31, 2009, the CFS of IDEA were considered, which
were limited reviewed by its auditors. Subsequently, audited CFS of IDEA was available. Accordingly, previous
year’s figures have been recasted. The effect of this substitution on the previous year’s figures is as under:
Rs. Crore
Restated Original
Reserves and Surplus 5,237.37 5,389.54
Loan Funds 8,886.77 8,887.92
Deferred Tax Liabilities 221.95 216.20
Net Block including CWIP 6,672.02 6,665.79
Non-Compete Fee — 146.96
Net Current Assets 2,576.89 2,583.74
Income 13,907.97 13,906.36
Expenses 14,457.24 14,456.17
Profit/(Loss) before Tax (549.27) (549.81)
Provision for Taxation 81.05 75.29
Net Profit/(Loss) before Minority Interest (630.32) (625.10)
SCHEDULE 21 (Contd.)
SIGNIFICANT ACCOUNTING POLICIES AND NOTES ON ACCOUNTS
SCHEDULES

CO
NSO
LID
ATED
FIN
AN
CIA
L STATEM
EN
TS
[153]
10. Deferred Tax (Assets)/Liability at the period end comprise timing difference on account of:
Rs. Crore
Current Year Previous Year
Depreciation 396.21 360.89
Expenditure/Provisions Allowable (155.59) (141.12)
Total 240.62 219.77
Reflected as Deferred Tax Liabilities 244.02 221.95
Reflected as Deferred Tax Assets 3.40 2.18
Net Deferred Tax Liabilities 240.62 219.77
Deferred tax assets are not recognised on losses and unabsorbed depreciation in certain subsidiaries.
11. The Company’s proportionate share in the Assets, Liabilities, Income and Expenses of its Joint Venture
companies included in these Consolidated Financial Statements are given below:
Rs. Crore
BALANCE SHEET Current Year Previous Year
SOURCES OF FUNDS
Equity Share Capital 846.54 846.54
Preference Share Capital 0.49 0.52
Employee Stock Options Outstanding 11.28 4.93
Reserves and Surplus (Refer detail below) 2,098.45 2,777.93
2,956.76 3,629.92
Loan Funds:
Secured Loans 1,857.02 1,768.27
Unsecured Loans 155.23 639.48
2,012.25 2,407.75
Deferred Tax Liabilities 54.85 32.29
Total Funds Employed 5,023.86 6,069.96
APPLICATION OF FUNDS
Fixed Assets:
Gross Block 6,912.85 5,587.23
Less: Accumulated Depreciation (2,277.48) (1,635.67)
Net Block: 4,635.37 3,951.56
Capital WIP 138.72 579.52
Goodwill on Consolidation 1.55 606.72
Investments 320.84 561.28
SCHEDULE 21 (Contd.)
SIGNIFICANT ACCOUNTING POLICIES AND NOTES ON ACCOUNTS
SCHEDULES

CO
NSO
LID
ATED
FIN
AN
CIA
L STATEM
EN
TS
[154]
Current Assets, Loans and Advances:
Inventories 13.61 14.08
Sundry Debtors 126.23 99.94
Cash and Bank Balances 75.21 838.11
Interest Accrued on Investments — —
Loans and Advances 737.28 520.50
Other Current Assets 62.92 28.57
1,015.25 1,501.20
Less: Current Liabilities and Provisions
Current Liabilities 1,070.72 1,115.00
Provisions 17.15 15.32
1,087.87 1,130.32
Net Current Assets (72.62) 370.88
Total Funds Utilised 5,023.86 6,069.96
Contingent Liability 254.65 117.77
Capital Commitment 300.80 474.66
PROFIT AND LOSS ACCOUNT
INCOME
Income from Operations 3,477.13 2,991.35
Less: Excise Duty — —
Net Income from Operations 3,477.13 2,991.35
Other Income 84.90 146.23
3,562.03 3,137.58
EXPENDITURE
(Increase)/Decrease in Stocks (0.50) (1.25)
Cost of Materials 8.69 5.30
Salaries, Wages and Employee Benefits 210.49 189.40
Manufacturing, Selling and Other Expenses 2,281.95 1,997.86
Interest and Other Finance Expenses 187.70 266.35
2,688.33 2,457.66
Profit before Depreciation/Amortisations 873.70 679.92
Depreciation/Amortisation 548.52 405.25
Profit before Tax 325.18 274.67
Provision for Taxes 44.72 21.37
Net Profit 280.46 253.30
Rs. Crore
Current Year Previous Year
SCHEDULE 21 (Contd.)
SIGNIFICANT ACCOUNTING POLICIES AND NOTES ON ACCOUNTS
SCHEDULES

CO
NSO
LID
ATED
FIN
AN
CIA
L STATEM
EN
TS
[155]
Rs. Crore
Proportionate Share in Reserves of Joint Ventures: Current Year Previous Year
Amalgamation Reserve — 17.39
Capital Reserve — 38.21
Capital Fund 0.01 0.01
Capital Redemption Reserve — —
Securities Premium Reserve 2,162.00 2,828.74
General Reserve 3.43 3.43
Business Restructuring Reserve 4.28 —
Surplus as per Profit and Loss Account (71.27) (109.85)
2,098.45 2,777.93
12. The following amount are included in the Miscellaneous expenses in Profit and Loss Account:
Rs. Crore
Particulars Current Year Previous Year
a) (Profit)/Loss on sale/discard of fixed assets (net) 15.05 4.25
b) Foreign Exchange (gain)/loss (net) 9.33 133.73
c) All Insurance claims (unless clearly identifiable with the
respective heads of expenses and Loss of Profit policy) (0.66) (1.36)
d) Unspent liabilities, excess provision and unclaimed balances
in respect of earlier years written back (net of short provision
and sundry balances written off) (33.82) (14.05)
13. The CFS of Aditya Birla Minacs Worldwide Inc. and Financial Statement of Aditya Birla Minacs Philippines Inc.
have been prepared under Canadian and Philippines Generally Accepted Accounting Principles (GAAP)
respectively. These financial statements have been restated as per Indian GAAP for the purpose of Consolidation.
14. For the purpose of consolidation, AVGTHL and TW Inc. are considered as integral operations and AVTL,
ABMWI (Consolidated) and Aditya Birla Minacs Philippines Inc., are considered as non-integral operations.
15. The effect of acquisition/disposal of subsidiaries during the year is as under: Rs. Crores
Name of Subsidiary Revenue Net Profit/ Net Assets(Post (Loss) (Post
Acquisition) Acquisition)
Current Year:
Compass BPO Limited (Consolidated) 1.83 β 5.91
Previous Year:
Aditya Birla Money Limited (Consolidated) 5.67 (1.00) 44.77
Aditya Birla Money Mart Limited (Consolidated) NIL NIL 0.48
16. a) Capital Work-in-Progress includes advances to suppliers: 39.97 43.37
b) Pre-operative expenditure capitalised to Fixed Assets and
Capital Work in-Progress
Interest 7.06 7.41
Salaries and Wages 2.57 2.90
Contribution to Provident and Other Funds 0.02 —
Rent — 0.11
Depreciation 0.29 0.12
Miscellaneous Expenses 4.18 16.62
Power and Fuel 0.58 —
Total 14.70 27.16
SCHEDULE 21 (Contd.)
SIGNIFICANT ACCOUNTING POLICIES AND NOTES ON ACCOUNTS
SCHEDULES

CO
NSO
LID
ATED
FIN
AN
CIA
L STATEM
EN
TS
[156]
17. Disclosure in respect of Related Parties pursuant to Accounting Standard 18
i) List of Related Parties
Associates:
Birla Securities Limited
Madura Garments International Brand Company Limited (MGIBCL) (w. e. f. November 27, 2009)
LIL Investment Limited (w. e. f. November 27, 2009)
Key Management Personnel:
Dr. Bharat K. Singh - Managing Director (Upto June 30, 2009)
Mr. Adesh Gupta – Whole-time Director (Upto April 30, 2009)
Mr. K.K. Maheshwari – Whole-time Director
Dr. Rakesh Jain – Managing Director
Mr. Pranab Barua – Whole-time Director (w.e.f. May 01, 2009)
Mr. Vikram Rao – Whole-time Director (Upto January 31, 2009)
Relatives of Key Management Personnel:
Mrs. Usha Gupta (Wife of Adesh Gupta) (Upto 30th April, 2009)
Mrs. Sharda Maheshwari (Wife of K. K. Maheshwari)
Mrs. Vidya Rao (Wife of Mr. Vikram Rao) (Upto 31st January, 2009)
ii) For transactions carried out with the related parties in the ordinary course of the business
refer Annexure - I.
Rs. Crore
Current Year Previous Year
18. Earnings per Share (EPS) is calculated as under:
Particulars:
Net Profit/(Loss) as per Profit and Loss Account 154.56 (435.73)
Less: Preference Dividend and Tax thereon 2.66 3.93
Net Profit/(Loss) for EPS A 151.90 (439.66)
Weighted average number of Equity Shares for calculation of
Basic EPS B 98,362,821 95,008,617
Basic EPS (Rs.) A/B 15.44 (46.28)
Weighted average number of Equity Shares Outstanding 98,362,821 95,008,617
Add: Shares held in abeyance * 43,112 —
Add: Potential Equity Shares Due to Share Warrant 4,205,624 —
Weighted average number of Equity Shares for calculation of
Diluted EPS C 102,611,557 95,008,617
Diluted EPS (Rs.) A/C 14.80 (46.28)
Nominal Value of Shares (in Rs.) 10.00 10.00
* The Impact of Share held in abeyance and Potential Equity Share of Share Warrant being anti-dilutive in the
previous year, hence not taken
SCHEDULE 21 (Contd.)
SIGNIFICANT ACCOUNTING POLICIES AND NOTES ON ACCOUNTS
SCHEDULES

CO
NSO
LID
ATED
FIN
AN
CIA
L STATEM
EN
TS
[157]
19. Leases
Rs. Crore
Current Year Previous Year
(A) Assets taken on Lease:
i) Lease payment recognised in the Profit and Loss Account 657.48 312.44
ii) The Group has taken certain Office Premises, Main
Switching Centre Locations, Leasehold Improvements,
Furniture & Fixtures, Information Technology & Office
Equipment, BPO centres, Showrooms and Residential
Houses on non-cancellable operating lease.
The details of future rental payable on non-cancellable
operating lease are given below:
- Not later than one year 334.92 199.90
- Later than one year and not later than five years 803.60 509.40
- Later than five years 492.34 240.10
iii) The details of finance lease payments payable and their Present value of the Group as at the Balance
Sheet date:
Rs. Crore
Particulars Total Lease Present Value Interest
Charges Payable
i. Not later than one year 7.82 7.48 0.34
(31.23) (19.64) (11.59)
ii. Later than one year and not later than five years 1.40 1.14 0.26
(61.25) (26.38) (34.87)
iii. Later than five years — — —
(49.05) (33.83) (15.22)
Total 9.22 8.62 0.60
(141.53) (79.85) (61.68)
Figures in brackets represent corresponding amount of previous year.
(B) Assets Given on Lease:
Rs. Crore
Current Year Previous Year
iii) The Group has given certain Plant and Machinery (Storage Tank)
on non-cancellable operating lease.
- The gross carrying amount of the above referred assets 4.90 4.90
- The accumulated depreciation for the above assets 1.82 1.59
- The depreciation for the above assets for the year 0.23 0.23
The future minimum lease rental in respect of aforesaid lease is as follows:
- Not later than one year 1.62 2.15
- Later than one year and not later than five years 4.06 8.70
- Later than five years — —
SCHEDULE 21 (Contd.)
SIGNIFICANT ACCOUNTING POLICIES AND NOTES ON ACCOUNTS
SCHEDULES

CO
NSO
LID
ATED
FIN
AN
CIA
L STATEM
EN
TS
[158]
20. In September 2005, the Company had purchased 37.18 Crore equity shares of IDEA Cellular Ltd (IDEA) from
M/s. AT&T Cellular Pvt. Ltd Mauritius, and paid consideration of US$ 150 Million without deduction of tax at
source after obtaining an order under Section 195(2) of the Income Tax Act from the Income Tax Department. The
Deputy Director of Income Tax (International Taxation) (DDIT), Mumbai, has issued order under Section 163(1) of
the Income Tax Act dated March 25, 2009, treating the Company as an agent of New Cingular Wireless Services
Inc. for the sale of shares of IDEA by its subsidiary AT&T Cellular Private Limited, Mauritius. The Company has
challenged the order of DDIT before the appropriate authority and, based on the opinion of Tax Expert, the
company is reasonably certain that no tax liability would devolve.
21. i) During the previous year the Company has received fertilisers bonds of Rs. 65.5 Crore from the Ministry of
Fertilisers, the Government of India against the outstanding amount of subsidy receivable, out of which bonds
amounting to Rs. 29.33 Crore (Previous Year: Rs. 37.45 Crore) are outstanding at the year end. The market
value of the above bonds are lower than book value therefore the diminution in the value of above bonds
amounting to Rs. 0.46 Crore (Previous Year Rs. 5.11 Crore) has been accounted under Miscellaneous
Expenses. The aforesaid bonds have been classified as “Other Current Assets” in the financial statements.
ii) Rates & Taxes is net of reversal of impairment relating to unutilised input credit of service tax for earlier years
of Rs. 33.89 Crore.
iii) Interest earned from Financial Services Activity is included in Income from Operations.
22. Disclosure in respect of Retirement Benefits pursuant to Accounting Standard 15 (Revised) - refer
Annexure - II.
23. Derivatives Information:
For Derivatives Outstanding as at Balance Sheet date and Foreign currency exposure, which are not hedged as at,
Balance Sheet date, refer Annexure - III.
24. Disclosure in respect of Segment Information pursuant to Accounting Standard 17 - refer Annexure - IV
Segments have been identified in line with the Accounting Standard on Segment Reporting (AS17), taking into
account the organisational structure as well as differential risk and returns of these segments.
Garments Branded Apparels and Accessories, Contract Exports
Rayon Yarn Viscose Filament Yarn, Caustic Soda and Allied Chemicals
Carbon Black Carbon Black
Insulators Insulators
Textiles Spun Yarn, Fabrics
Fertilisers Urea, Ammonia, Argon Gas, Pesticides and Seeds
Financial Services Retail Asset Finance, Corporate Finance, Capital Market, Syndication, Insurance
Advisory, Asset Management, Private Equity, Brokerage Income, Stock and
Commodity broking
Life Insurance Life Insurance Services
Telecom Telecommunication Services
IT and ITES Business Process Outsourcing Services and Software Services
SCHEDULE 21 (Contd.)
SIGNIFICANT ACCOUNTING POLICIES AND NOTES ON ACCOUNTS
SCHEDULES

CO
NSO
LID
ATED
FIN
AN
CIA
L STATEM
EN
TS
[159]
The Group considers secondary segment based on revenues within India as Domestic Revenues and outside India
as Export Revenues. Since assets are used interchangeably, carrying amount of assets and cost incurred during the
period to acquire assets based on secondary segment has not been disclosed.
25. For Cash Flow Statement - refer Annexure - V.
26. Figures of Rs. 50,000 or less have been denoted by β.
27. Figures for the current year of consolidated financial statement are not comparable with the previous year, since
there has been acquisitions/disposals/stake changes/mergers/demergers in subsidiaries and Joint Ventures of the
Company.
28. Previous year’s figures have been regrouped/rearranged wherever necessary.
For KHIMJI KUNVERJI & CO. For S.R. BATLIBOI & CO. DR. RAKESH JAIN Directors: TARJANI VAKIL
Firm registration no. 105146W Firm registration no. 301003E Managing Director P. MURARI
Chartered Accountants Chartered Accountants G. P. GUPTA
B. R. GUPTA
SUSHIL AGARWAL
Chief Financial Officer
Per SHIVJI K. VIKAMSEY Per VIJAY MANIAR DEVENDRA BHANDARI
Partner Partner Company Secretary
Membership No. 2242 Membership No. 36738
Mumbai, May 07, 2010
SCHEDULE 21 (Contd.)
SIGNIFICANT ACCOUNTING POLICIES AND NOTES ON ACCOUNTS
SCHEDULES

CO
NSO
LID
ATED
FIN
AN
CIA
L STATEM
EN
TS
[160]
Annexure- I
During the year, the following transactions were carried out with the related parties in the ordinary course of business:
Rs. Crore
Transactions/Nature of Associates Key Relatives Grand
Relationship Management of Key Total
Personnel Management
Personnel
Purchase of Goods and Services
Mrs. Usha Gupta — — β β
— — (0.04) (0.04)
Mrs. Sharda Maheshwari — — 0.04 0.04
— — (0.04) (0.04)
Mrs. Vidya Rao — — — —
— — (0.05) (0.05)
— — 0.04 0.04
— — (0.13) (0.13)
Interest Received
MGIBCL 0.02 — — 0.02
— — — —
LIL Investment β — — β
— — — —
Mr. Adesh Gupta — β — β
— (β) — (β)
0.02 β — 0.02
— (β) — (β)
Managerial Remuneration Paid *
Mr. Pranab Barua — 2.47 — 2.47
— — — —
Dr. Bharat K. Singh — 1.36 — 1.36
— (3.28) — (3.28)
Mr. Adesh Gupta — 0.48 — 0.48
— (1.63) — (1.63)
Mr. K. K. Maheshwari — 3.69 — 3.69
— (3.21) — (3.21)
Dr. Rakesh Jain — 4.55 — 4.55
— (3.70) — (3.70)
Mr. Vikram Rao — — — —
— (2.18) — (2.18)
— 12.55 — 12.55
— (14.00) — (14.00)
* Excluding Gratuity and Leave Encashment provision and Employee Compensation under ESOP.
SCHEDULE 21 (Contd.)
SIGNIFICANT ACCOUNTING POLICIES AND NOTES ON ACCOUNTS
SCHEDULES

CO
NSO
LID
ATED
FIN
AN
CIA
L STATEM
EN
TS
[161]
Fresh Investment Made
MGIBCL 1.00 — — 1.00
— — — —
LIL Investment 1.03 — — 1.03
— — — —
2.03 — — 2.03
— — — —
Loans Granted (including Inter-Corporate Deposits)
MGIBCL 1.03 — — 1.03
— — — —
LIL Investment 0.10 — — 0.10
— — — —
1.13 — — 1.13
— — — —
Loans Granted Received Back
(including Inter - Corporate Deposits)
Mr. Adesh Gupta — β — β
— (0.01) — (0.01)
— β — β
— (0.01) — (0.01)
Outstanding Balances as at 31.03.2010
Loans Granted 1.13 — — 1.13
— (0.03) — (0.03)
Amounts Receivable 0.04 — — 0.04
— — — —
Amounts Payable 0.02 — — 0.02
— — — —
Deposits Receivable — — 2.00 2.00
— — (3.00) (3.00)
Investments 2.03 — — 2.03
(0.01) — — (0.01)
- Figures in brackets represent corresponding amount of Previous Year.
- No amount in respect of the related parties have been written off/back are provided for during the year.
- Related party relationships have been identified by the management and relied upon by the auditors.
Rs. Crore
Transactions/Nature of Associates Key Relatives Grand
Relationship Management of Key Total
Personnel Management
Personnel
SCHEDULE 21 (Contd.)
SIGNIFICANT ACCOUNTING POLICIES AND NOTES ON ACCOUNTS
SCHEDULES

CO
NSO
LID
ATED
FIN
AN
CIA
L STATEM
EN
TS
[162]
Annexure - II
Retirement Benefits
Rs. Crore
Current Year Previous Year
a) The details of the Group’s defined benefit plans in respect of Gratuity:
Amounts recognised in the Balance Sheet in respect of Gratuity:
Present value of defined benefit obligation at the end of the period 105.97 96.85
Fair Value of Plan Assets 98.22 93.09
Net Liability/(Asset) 7.75 3.76
Amounts recognised in Salary, Wages and Employee Benefits in the
Profit and Loss Account in respect of Gratuity:
Current Service Cost 13.74 11.91
Interest on Defined Benefit Obligations 7.23 6.18
Expected Return on Plan Assets (7.28) (5.30)
Net Actuarial (Gain)/Loss recognised during the period (2.52) (0.08)
Net Gratuity Cost 11.17 12.71
Actual Return on Plan Assets:
Expected Return on Plan Assets 7.28 5.30
Actuarial Gain/(Loss) on Plan Assets (1.88) 8.50
Actual Return on Plan Assets 5.40 13.80
Reconciliation of Present Value of the obligation and the
Fair Value of the Plan Assets:
Opening Defined Benefit Obligation 96.85 76.96
Current Service Cost 13.74 11.91
Interest Cost 7.23 6.18
Actuarial (Gain)/Loss (4.40) 8.42
Liability on Stake Change/Amalgamation of Subsidiaries/Joint Ventures 0.29 0.43
Benefits Paid (7.74) (7.05)
Closing Defined Benefit Obligation 105.97 96.85
Change in Fair Value of the Plan Assets:
Opening Fair Value of the Plan Assets 93.09 70.14
Expected Return on Plan Assets 7.28 5.30
Actuarial Gain/(Loss) (1.88) 8.50
Asset on Stake Change/Amalgamation of Subsidiaries/Joint Ventures (0.13) (0.46)
Contributions by the Employer 7.31 15.56
Benefits Paid (7.45) (5.95)
Closing Fair Value of the Plan Assets 98.22 93.09
SCHEDULE 21 (Contd.)
SIGNIFICANT ACCOUNTING POLICIES AND NOTES ON ACCOUNTS
SCHEDULES

CO
NSO
LID
ATED
FIN
AN
CIA
L STATEM
EN
TS
[163]
Investment Details of Plan Assets:
Government of India Securities 18% 13%
Corporate Bonds 2% 7%
Insurer Managed Fund* 79% 77%
Others 1% 3%
Total 100% 100%
* included in the Fair Value of Plan Assets, invested in group owned
financial instruments (funds of Birla Sun Life Insurance Company Limited) 61.04 52.80
Principal Acturial Assumptions at the Balance Sheet Date
Discount Rate 7.15% - 8.25% 7% - 7.75%
Estimated Rate of Return on Plan Assets 7.50% - 8.25% 7% - 8.1%
The Estimates of future salary increase, considered in actuarial valuation,
take account of inflation, seniority, promotion and other relevant factors
such as supply & demand in the employment market
b) The details of the Company’s defined benefit plans in respect of Pension
for its employees are given below:
Amounts recognised in the Balance Sheet in respect of Pension
(unfunded by the Company):
Present value of unfunded obligation at the end of the period 7.20 7.49
Fair Value of Plan Assets — —
Net Liability/(Asset) 7.20 7.49
Amounts recognised in Salary, Wages and Employee Benefits in the
Profit and Loss Account in respect of Pension (unfunded by the Company):
Interest on Defined Benefit Obligations 0.53 0.56
Net Actuarial (Gain)/Loss recognised during the period 0.27 0.58
Net Pension Cost 0.80 1.14
Reconciliation of present value of the obligation and the
Fair Value of the Plan Assets:
Opening Defined Benefit Obligation 7.48 7.39
Interest Cost 0.53 0.56
Actuarial (Gain)/Loss 0.27 0.58
Benefits Paid (1.09) (1.05)
Closing Defined Benefit Obligation 7.19 7.48
Rs. Crore
Current Year Previous Year
SCHEDULE 21 (Contd.)
SIGNIFICANT ACCOUNTING POLICIES AND NOTES ON ACCOUNTS
SCHEDULES

CO
NSO
LID
ATED
FIN
AN
CIA
L STATEM
EN
TS
[164]
c) Defined Contribution Plans:
The Group has recognised the following amount as an expense and included
in the Schedule 17 - “Contribution to Provident and Other Funds”:
i) Contribution to Employees’ Provident Fund 45.77 49.19
ii) Contribution to Superannuation Fund 6.91 6.82
iii) Contribution to ESI 3.35 2.99
iv) Contribution to Overseas Pension Fund 1.42 1.22
The Guidance Note on implementation of AS-15 (Revised), “Employee Benefits” issued by the ICAI states that
Provident Fund setup the employers, which requires interest shortfall to be met by the employer, needs to be
treated as defined benefits plan. The Group setup Provident Fund does not have existing deficit of interest shortfall.
With regards to future obligation arising due to interest shortfall (i.e., government interest to be paid on the
Provident Fund scheme exceeding rate of interest earned on investment) pending issuance of the Guidance Note
from Actuarial Society of India, the Company’s actuary has expressed his inability to reliably measure the
Provident Fund liability.
Rs. Crore
Current Year Previous Year
SCHEDULE 21 (Contd.)
SIGNIFICANT ACCOUNTING POLICIES AND NOTES ON ACCOUNTS
SCHEDULES

CO
NSO
LID
ATED
FIN
AN
CIA
L STATEM
EN
TS
[165]
Annexure - III
a) Derivatives: Outstanding as at Balance Sheet Date:
Nature of Contract Foreign Option Amount in Foreign Currency as at Purpose
Currency 31-Mar-2010 31-Mar-2009
Currency and Interest Rate Swap USD Buy 15,000,000 — Hedging of Loan
Currency and Interest Rate Swap JYen Buy 14,654,722,000 15,322,425,000 Hedging of Loan
Currency and Interest Rate Swap CAD Buy 20,321,000 20,321,000 Hedging of Loan
Sell 30,950,000 —
Buyers’ Credit JYen Buy — 9,012,396,108 Hedging of Loan
Buyers’ Credit USD Buy 118,848,683 109,774,424 Hedging of Loan
Forward Contracts USD Buy 165,204,983 115,590,995 Hedging Purpose
Sell 130,854,851 152,843,536
Forward Contracts JYen Buy 4,499,439,696 4,789,376,720 Hedging Purpose
Forward Contracts EURO Buy 377,249 178,427 Hedging Purpose
Sell 1,897,941 1,825,000
Forward Contracts GBP Buy 8,649 — Hedging Purpose
Sell 1,030,000 1,915,000
Forward Contracts AUD Buy 629,501 800,000 Hedging Purpose
Forward Contracts and
Interest Rate Swap USD Buy 15,192,277 — Hedging of Loan
b) Foreign Currency Exposure which are not hedged as at Balance Sheet Date:
Foreign Currency Receivable Payable Net
USD 14,474,288 103,514,765 -89,040,477
(13,229,810) (98,991,671) (-85,761,861)
EURO 760,708 151,196 609,512
(3,402,503) (941,495) (2,461,008)
GBP 589,927 1,382,161 -792,234
(3,202,567) (337,922) (2,864,645)
AUD 189,929 — 189,929
(189,929) (470) (189,459)
Yen 14,547,201 7,868,690 6,678,511
(11,369,890) (7,543,830) (3,826,060)
CAD 204,708 52,507 152,201
(412,902) (86,010) (326,892)
MYR 71,145 — 71,145
(71,145) — (71,145)
CHF 15,503 — 15,503
— — —
Figures in brackets represent corresponding amount of previous year.
SCHEDULE 21 (Contd.)
SIGNIFICANT ACCOUNTING POLICIES AND NOTES ON ACCOUNTS
SCHEDULES

CO
NSO
LID
ATED
FIN
AN
CIA
L STATEM
EN
TS
[166]
CONSOLIDATED SEGMENT DISCLOSURES FOR THE YEAR ENDED
31ST MARCH, 2010
Annexure – IV
Rs. Crore
Primary Segments— Garments Rayon Yarn (Includes Carbon Black Insulators Textiles Fertilisers Financial
Business Caustic Soda and (Includes Spun Services
allied Chemicals) Yarns, and Fabrics)
Current Previous Current Previous Current Previous Current Previous Current Previous Current Previous Current Previous
Year Year Year Year Year Year Year Year Year Year Year Year Year Year
Segment Revenue #
Income from External
Customers 1,250.64 1,115.81 537.69 537.11 1,160.87 1,095.64 428.43 424.89 574.24 570.86 1,021.56 1,249.76 403.26 249.46
Inter-segment Revenue — — — — — — (0.03) (0.07) 2.30 2.35 — — 7.68 0.18
Total Segment Revenue 1,250.64 1,115.81 537.69 537.11 1,160.87 1,095.64 428.40 424.82 576.54 573.21 1,021.56 1,249.76 410.94 249.64
Segment Result (PBIT) (81.12) (228.53) 120.01 89.82 227.33 24.69 97.66 108.25 46.80 32.69 136.47 209.74 87.74 47.32
Less: Interest and Finance
charges*
Add: Interest Income*
Add: Unallocable Income
(Net of Unallocable
Expenditure)
Profit/(Loss) before Tax
Provision for Taxation
Net Profit/(Loss) before
Minority Interest
Minority Interest
Share of Profit/(Loss) of
Associate
Net Profit/(Loss)
Carrying Amount of
Segment Assets 943.27 1,047.60 500.13 513.39 1,195.21 938.63 360.75 326.74 363.33 411.11 406.21 681.13 1,969.22 1,492.32
(including Goodwill)
Unallocated Assets
Total Assets
Carrying Amount of
Segment Liabilities 393.93 368.84 70.20 76.50 252.90 185.54 66.41 62.40 82.09 65.99 106.22 94.51 1,067.10 932.32
Unallocated Liabilities
Total Liabilities
Cost incurred to acquire
Segment Fixed Assets 26.86 187.72 29.53 34.66 19.68 16.10 38.05 26.96 3.51 30.62 18.89 1.96 26.64 16.33
during the year
Unallocated Assets
Depreciation/
Amortisation 77.34 70.11 34.93 33.14 25.37 25.15 18.05 14.37 22.57 21.51 18.84 18.72 17.99 9.01
Unallocated Depreciation
* Interest and finance charges exclude interest and finance charges of Rs. 79.98 Crore (PY: 84.28 Crore) and Interest Income excludes interest income of Rs. 27.47 crore (PY: 16.78 Crore)
on Financial Services Business, since it is considered as an expense and income respectively for deriving Segment Result.
Secondary Segment – Geographical Current Year Previous Year
The Company’s operating facilities are mainly located in India
Domestic Revenues 17,349.97 11,087.56
Exports Revenues 2,158.34 2,557.28
Total 19,508.31 13,644.84
# Inter segment revenues are recognised on arm’s length basis.

CO
NSO
LID
ATED
FIN
AN
CIA
L STATEM
EN
TS
[167]
CONSOLIDATED SEGMENT DISCLOSURES FOR THE YEAR ENDED
31ST MARCH, 2010
Annexure – IV
Rs. Crore
Primary Segments— Life Insurance Telecom IT and ITES Gross Total Inter-Segment Net Total
Business Elimination
Current Previous Current Previous Current Previous Current Previous Current Previous Current Previous
Year Year Year Year Year Year Year Year Year Year Year Year
Segment Revenue #
Income from External
Customers 9,295.83 3,743.61 3,330.75 2,891.84 1,505.04 1,765.86 19,508.31 13,644.84
Inter- segment Revenue — — — — 25.28 11.29 35.23 13.75
Total Segment Revenue 9,295.83 3,743.61 3,330.75 2,891.84 1,530.32 1,777.15 19,543.54 13,658.59 (35.23) (13.75) 19,508.31 13,644.84
Segment Result (PBIT) (424.61) (686.56) 431.42 475.00 42.42 (63.62) 684.12 8.81 684.11 8.81
Less: Interest and Finance
charges* 582.16 636.76
Add: Interest Income* 67.82 80.29
Add: Unallocable Income (12.21) (1.61)
(Net of Unallocable
Expenditure)
Profit/(Loss) before Tax 157.56 (549.27)
Provision for Taxation 114.00 81.06
Net Profit/(Loss) before
Minority Interest 43.56 (630.32)
Minority Interest (111.03) (194.59)
Share of Profit/(Loss) of
Associate (0.04) —
Net Profit/(Loss) 154.55 (435.73)
Carrying Amount of
Segment Assets 16,922.59 9,904.18 7,759.85 8,978.80 1,419.04 1,261.60 31,839.60 25,555.50 (204.96) (70.95) 31,634.64 25,484.55
(including Goodwill)
Unallocated Assets 743.96 1,330.27
Total Assets 32,378.60 26,814.82
Carrying Amount of
Segment Liabilities 16,494.84 9,490.95 901.24 1,033.62 222.46 181.44 19,657.39 12,492.11 (204.96) (70.95) 19,452.43 12,421.17
Unallocated Liabilities 7,265.62 8,472.18
Total Liabilities 26,718.05 20,893.35
Cost incurred to acquire
Segment Fixed Assets 41.84 37.49 1,388.17 1,820.01 65.17 25.34 1,658.34 2,197.19 — — 1,658.34 2,197.19
during the year
Unallocated Assets 0.37 0.40
Depreciation/
Amortisation 46.23 34.27 556.24 398.96 62.29 68.05 879.85 693.29 — — 879.85 693.29
Unallocated Depreciation 1.96 2.59

CO
NSO
LID
ATED
FIN
AN
CIA
L STATEM
EN
TS
[168]
CONSOLIDATED CASH FLOW STATEMENT FOR THE YEAR ENDED
MARCH 31, 2010
Annexure – V
Rs. Crore
PARTICULARS 2009-10 2008-09
A. CASH FLOW FROM OPERATING ACTIVITIES
Net/(Loss) Profit before tax 157.57 (549.27)
Adjustments for:
Depreciation/Amortisation 881.80 695.88
Change in Valuation of Liabilities in
respect of life policies 5,511.95 2,486.11
Provision for Bad and Doubtful Debts,
Advances and Other Current Assets (Net) 19.58 24.23
Employee Stock Options Outstanding 7.73 4.76
Effect of exchange fluctuation on
Foreign Currency Translation Reserve (57.75) (6.87)
Interest Expenses 601.77 638.24
Interest Income (67.96) (81.61)
(Profit)/Loss on Fixed Assets Sold 15.05 4.25
(Profit)/Loss on Sale of Investments (77.83) (89.71)
Investment Income on Shareholders’ Fund (30.14) (34.24)
Dividend Income (10.19) (11.28)
6,794.01 3,629.76
OPERATING PROFIT BEFORE WORKING CAPITAL CHANGES 6,951.58 3,080.49
Adjustments for:
Decrease/(Increase) in Sundry Debtors
and Other Receivables (215.17) 133.42
Decrease/(Increase) in Inventories (68.46) (1.76)
Increase/(Decrease) in Current Liabilities
and Provisions 279.39 (4.24) 536.14 667.80
CASH GENERATED FROM OPERATIONS 6,947.34 3,748.29
Income Taxes Refund/(Paid) (Net) (168.46) (200.33)
NET CASH FROM OPERATING ACTIVITIES 6,778.88 3,547.96
B. CASH FLOW FROM INVESTING ACTIVITIES
(Purchase)/Sale of Fixed Assets (Net) (1,370.94) (2,343.51)
Investments in Subsidiaries/Joint Ventures (Net of Cash) (33.53) (770.92)
Sale of Investments in Subsidiaries (Net of Cash) 3.19 (0.59)
Sale/(Purchase) of Investments (Net) (4,400.49) (4,223.64)
(Increase)/Decrease in Inter-Corporate Deposits (285.94) (213.59)
Interest Received 53.09 74.98
Investment Income on Shareholders’ Fund 30.14 34.24
Dividend Received 10.19 11.28
NET CASH (USED IN)/FROM INVESTING ACTIVITIES (5,994.29) (7,431.75)

CO
NSO
LID
ATED
FIN
AN
CIA
L STATEM
EN
TS
[169]
CONSOLIDATED CASH FLOW STATEMENT FOR THE YEAR ENDED
MARCH 31, 2010
Rs. Crore
PARTICULARS 2009-10 2008-09
C CASH FLOW FROM FINANCING ACTIVITIES
Reduction in Preference Share Capital of Subsidiaries — (25.00)
Proceeds from issue of Preference Shares 0.10 0.52
Proceeds from issue of Equity Shares 8.00 —
Proceeds from issue of Shares Warrants 142.07 —
Proceeds from issue of Shares to Minority 116.99 188.50
Security Premium on issue of Shares of the
Company and Joint Ventures 425.93 2,573.04
Capital Subsidy — 1.58
Proceeds from/(Repayment of) Borrowings (Net) (1,516.10) 2,505.64
Dividends Paid (including Tax thereon) (46.33) (66.17)
Interest and Finance Charges Paid (653.99) (554.34)
NET CASH (USED IN)/FROM FINANCING ACTIVITIES (1,523.33) 4,623.77
Foreign Exchange difference on translation of
foreign currency cash and cash equivalents (0.03) 0.40
NET INCREASE IN CASH AND EQUIVALENTS (738.77) 740.38
CASH AND CASH EQUIVALENTS (OPENING BALANCE) 1,534.37 793.99
CASH ACQUIRED/REDUCED ON STAKE CHANGE/MERGER
OF SPICE WITH IDEA (0.76) —
CASH AND CASH EQUIVALENTS (CLOSING BALANCE) 794.84 1,534.37
Notes:
1) Cash and Cash Equivalent include:
Cash, Cheques in Hand and Remittance in Transit 142.81 176.55
Balance with Banks 652.03 1,357.82
Total 794.84 1534.37
2) Previous Year’s figures have been regrouped/rearranged to confirm to the Current Year’s presentation, wherever necessary.
3) Cash and Cash Equivalents include restricted Cash and Cash Equivalent of Rs. 62.86 Crore (Previous Year: Rs. 36.96 Crore)
which are not available for use by the Group.
For KHIMJI KUNVERJI & CO. For S.R. BATLIBOI & CO. DR. RAKESH JAIN Directors: TARJANI VAKIL
Firm registration no. 105146W Firm registration no. 301003E Managing Director P. MURARI
Chartered Accountants Chartered Accountants G. P. GUPTA
B. R. GUPTA
SUSHIL AGARWAL
Chief Financial Officer
Per SHIVJI K. VIKAMSEY Per VIJAY MANIAR DEVENDRA BHANDARI
Partner Partner Company Secretary
Membership No. 2242 Membership No. 36738
Mumbai, May 07, 2010

STATEM
EN
T RELATIN
G TO
SU
BSID
IA
RY C
OM
PA
NIES
CMYK
[170]
S TAT E M E N T P U R S U A N T T O S E C T I O N 2 1 2 O F T H E
COMPANIES ACT, 1956, RELATING TO SUBSIDIARY COMPANIES
(Rs. in
C
rore unle
ss oth
erw
ise sta
ted)
Aditya Birla
Aditya Birla
Aditya Birla
Aditya Birla
Aditya Vik
ram
Aditya Birla
Aditya Birla
Aditya Birla
Birla
In
surance
Fin
ance Servic
es
Capital
Advis
ors
Custo
mer
Servic
es
Truste
e C
om
pany
Glo
bal
Tradin
gM
oney Lim
ited
Com
moditie
sFin
ance
Advis
ory and
Priv
ate
Lim
ited
Priv
ate
Lim
ited
Priv
ate
Lim
ited
Priv
ate
Lim
ited
House Lim
ited
Brokin
g Lim
ited
Lim
ited
Brokin
g Servic
es
(Note
N
o.
7)
Lim
ited
US $
Rs.
in la
cs
in C
rore
The Fin
ancia
l year/perio
d of
the Subsid
iary C
om
pany
1st
April 2
00
91
st
April 2
00
91
st
April 2
00
91
st
April 2
00
91
st
April 2
00
9 to
1st
April 2
00
91
st
April 2
00
91
st
April 2
00
91
st
April 2
00
9
31
st
March 2
01
03
1st
March 2
01
03
1st
March 2
01
03
1st
March 2
01
03
1st
March 2
01
03
1st
March 2
01
03
1st
March 2
01
03
1st
March 2
01
03
1st
March 2
01
0
Extent of in
terest in
Subsid
iary C
om
pany
Equity Share C
apital
11
0.0
03
.5
00
.0
10
.0
58
.5
03
.7
05
.5
42
.0
01
05
.9
62
.7
0
% Share held
by A
ditya Birla
N
uvo Ltd
. and its Subsid
iarie
s1
00
.0
0%
10
0.0
0%
10
0.0
0%
10
0.0
0%
10
0.0
0%
75
.0
0%
10
0.0
0%
10
0.0
0%
50
.0
1%
Net
aggregate
am
ount
of
the profits
/(losses)
of
the Subsid
iary
Com
pany fo
r th
e perio
d,
so fa
r as it concerns m
em
bers of
Aditya Birla
N
uvo Ltd
.
a)
not
dealt w
ith in
th
e A
ccounts
of
the C
om
pany
(i)
For th
e financia
l year of
the subsid
iary
(6.4
7)
(1.3
5)
(0.2
3)
(0
.0
1)
0.1
5(0
.6
2)
7.1
13
.2
13
0.0
21
.8
5
(ii)
For th
e previo
us financia
l years sin
ce it
becam
e th
e subsid
iary of
the C
om
pany
0.0
4(0
.0
1)
(0.0
3)
(0.0
2)
3.3
22
.3
3(0
.7
8)
(0.2
1)
56
.7
06
.3
5
b)
dealt w
ith in
th
e A
ccounts
of
the C
om
pany
(i)
For th
e financia
l year of
the subsid
iary
Nil
Nil
Nil
Nil
Nil
Nil
Nil
Nil
3.2
9N
il
(ii)
For th
e previo
us financia
l years sin
ce it
becam
e th
e subsid
iary of
the C
om
pany
Nil
Nil
Nil
Nil
Nil
Nil
Nil
Nil
11
.5
6N
il
Additio
nal
Info
rm
ation u/s 2
12
(5
)N
ot
Applicable
Not
Applicable
Not
Applicable
Not
Applicable
Not
Applicable
Not
Applicable
Not
Applicable
Not
Applicable
Not
Applicable

STATEM
EN
T RELATIN
G TO
SU
BSID
IA
RY C
OM
PA
NIES
CMYK
[171]
S TAT E M E N T P U R S U A N T T O S E C T I O N 2 1 2 O F T H E
COMPANIES ACT, 1956, RELATING TO SUBSIDIARY COMPANIES
(Rs. in
C
rore unle
ss oth
erw
ise sta
ted)
Birla
Sun Life
Aditya Birla
Aditya Birla
M
oney
AB
NL
Aditya Birla
Madura
Garm
ent
Pete
r
Engla
nd
Aditya Birla
Bir
laA
ditya Birla
Insurance
Money M
art
Insurance
Advis
ory
Investm
ent
Fin
ancia
l Shared
LifeSty
le
Reta
ilFashio
ns
and
Min
acs IT
Techno
logie
sM
inacs
Com
pany
Lim
ited
Lim
ited
Servic
es Ltd
.Lim
ited
Servic
es
Lim
ited
Lim
ited
Reta
il Lim
ited
Servic
es
Lim
ited
Lim
ited
World
wid
e
(Note
N
o. 7
)(N
ote
N
o. 7
)(N
ote
N
o. 7
)Lim
ited
The Fin
ancia
l year/ perio
d of
the Subsid
iary
1st
April 2
00
91
st
April 2
00
91
st
April 2
00
91
st
April 2
00
91
st
April 2
00
91
st
April 2
00
91
st
April 2
00
91
st
April 2
00
91
st
April 2
00
91
st
April 2
00
9
Com
pany
31
st
March 2
01
03
1st
March 2
01
03
1st
March 2
01
03
1st
March 2
01
03
1st
March 2
01
03
1st
March 2
01
03
1st
March 2
01
03
1st
March 2
01
03
1st
March 2
01
03
1st
March 2
01
0
Extent of in
terest in
Subsid
iary C
om
pany
Equity Share C
apital
1,9
69
.5
02
0.0
00
.4
92
1.0
00
.0
51
0.0
00
.5
07
.5
59
.8
02
.3
5
% Share held
by A
ditya Birla
N
uvo Ltd
.
and its Subsid
iarie
s7
4.0
0%
10
0.0
0%
10
0.0
0%
10
0.0
0%
10
0.0
0%
10
0.0
0%
10
0.0
0%
82
.9
2%
10
0.0
0%
88
.2
8%
Net
aggregate
am
ount
of
the profits
/(losses)
of
the Subsid
iary C
om
pany fo
r th
e perio
d,
so fa
r
as it concerns m
em
bers of
Aditya Birla
N
uvo Ltd
.
a)
not
dealt w
ith in
th
e A
ccounts
of
the C
om
pany
(i)
For th
e financia
l year of
the subsid
iary
(32
2.2
7)
(10
.2
0)
(1.3
5)
1.3
3—
(36
.8
9)
(25
.3
7)
7.2
61
.3
3(2
6.0
6)
(ii)
For th
e previo
us financia
l years sin
ce it
becam
e th
e subsid
iary of
the C
om
pany
(1,1
76
.2
1)
(9.1
2)
(1.8
7)
9.2
8(0
.0
4)
(59
.4
8)
(94
.6
7)
(36
.2
1)
(13
.0
9)
(0.5
8)
b)
dealt w
ith in
th
e A
ccounts
of
the C
om
pany
(i)
For th
e financia
l year of
the subsid
iary
Nil
Nil
Nil
Nil
Nil
Nil
Nil
Nil
Nil
Nil
(ii)
For th
e previo
us financia
l years sin
ce it
becam
e th
e subsid
iary of
the C
om
pany
Nil
Nil
Nil
Nil
Nil
Nil
Nil
Nil
Nil
0.1
6
Additio
nal
Info
rm
ation u/s 2
12
(5
)N
ot
Applicable
Not
Applicable
Not
Applicable
Not
Applicable
Not
Applicable
Not
Applicable
Not
Applicable
Not
Applicable
Not
Applicable
Not
Applicable

STATEM
EN
T RELATIN
G TO
SU
BSID
IA
RY C
OM
PA
NIES
CMYK
[172]
S TAT E M E N T P U R S U A N T T O S E C T I O N 2 1 2 O F T H E
COMPANIES ACT, 1956, RELATING TO SUBSIDIARY COMPANIES
Transw
orks
A V Tranw
orks Lim
ited,
Aditya Birla
M
inacs
Aditya Birla
M
inacs W
orld
wid
e Inc,
Inc, U
SA
Canada
Philip
pin
es Inc.
Canada (C
onsolidated) (N
ote N
o. 5
&
6
)
CA
D in
la
cs
Rs. in
C
rore
PH
P in
la
cs
Rs. in
C
rore
CA
D in
la
cs
Rs. in
C
rore
US $
in
la
cs
Rs. in
C
rore
The Fin
ancia
l year/ perio
d of the Subsid
iary C
om
pany
1st A
pril 2
00
9 to
1st A
pril 2
00
9 to
1st A
pril 2
00
9 to
1st A
pril 2
00
9 to
31
st M
arch 2
01
03
1st M
arch 2
01
03
1st M
arch 2
01
03
1st M
arch 2
01
0
Extent of interest in Subsidiary C
om
pany
Equity Share C
apital
--
1,5
70
.0
06
93
.3
19
69
.2
39
.8
41
,2
03
.9
35
31
.6
5
% Share held
by A
ditya Birla
N
uvo Ltd. and its Subsid
iarie
s1
00
.0
0%
10
0.0
0%
10
0.0
0%
10
0.0
0%
Net aggregate am
ount of the profits /(lo
sses) of the Subsid
iary
Com
pany for the perio
d, so far as it concerns m
em
bers of
Aditya Birla
N
uvo Ltd.
a)
not dealt w
ith in
the A
ccounts of the C
om
pany
(i)
For the fin
ancia
l year of the subsid
iary
(1
.5
3)
(0
.8
5)
(1
3.0
8)
(5
.7
0)
(2
21
.1
2)
(2
.2
4)
34
.6
31
5.2
4
(ii)
For the previo
us fin
ancia
l years sin
ce it
becam
e the subsid
iary of the C
om
pany
1.0
00
.9
1(5
.8
4)
(2
.4
1)
(1
22
2.3
0)
(1
2.5
8)
(4
59
.9
9)
(1
84
.5
0)
b)
dealt w
ith in
the A
ccounts of the C
om
pany
(i)
For the fin
ancia
l year of the subsid
iary
Nil
Nil
Nil
Nil
Nil
Nil
Nil
Nil
(ii)
For the previo
us fin
ancia
l years sin
ce it
becam
e the subsid
iary of the C
om
pany
Nil
Nil
Nil
Nil
Nil
Nil
Nil
Nil
Additio
nal
Inform
atio
n u/s 2
12
(5
)N
ot A
pplicable
Not A
pplicable
Not A
pplicable
Not A
pplicable
Notes :
1M
adura G
arm
ents Exports Ltd. and M
G Lifestyle
C
lothin
g C
om
pany Priv
ate Ltd. ceases to be subsid
iary of A
BN
L w
.e.f 1
Jan, 2
01
0 and m
erged w
ith A
BN
L under garm
ent busin
ess restructurin
g schem
e
2LIL Investm
ent Lim
ited becam
e subsid
iary w
.e.f. 2
7 July, 2
00
9 and ceased to be subsid
iary w
.e.f. 2
7 N
ovem
ber, 2
00
9
3M
adura G
arm
ents Internatio
nal
Brands C
o Ltd. ceased to be subsid
iary w
.e.f. 2
7 N
ovem
ber, 2
00
9
4M
adura G
arm
ents Exports U
S Inc. ceased to be subsid
iary w
.e.f. 9
February, 2
01
0
5A
ditya Birla
M
inacs W
orld
wid
e Inc, C
anada (C
onsolidated) is
converted at the average rate of exchnage of C
AD
$ =
Rs 4
4.0
1
6For details of subsid
iarie
s of M
inacs W
orld
wid
e Inc, C
anada refer A
nnexure “1
”
7N
am
e changed sin
ce receip
t of exem
ptio
n from
C
entral
Governm
ent under Sectio
n 2
12
:-
From
Birla
G
lobal
Fin
ance C
o Ltd. (BG
FC
L) to A
ditya Birla
Fin
ance Ltd. (A
BFL)
From
Birla
Sun Life D
istrib
utio
n C
o. Ltd. (BSD
L) to A
ditya Birla
M
oney M
art Ltd. (A
BM
M)
From
BSD
L Insurance A
dvis
ory Servic
es Ltd. to A
BM
Insurance A
dvis
ory Servic
es Ltd. (A
BM
IA
S)
From
Laxm
inaryan Investm
ent Ltd. (LIL) to A
BN
L Investm
ent Ltd.
(Rs. in
C
rore unle
ss oth
erw
ise sta
ted)

STATEM
EN
T RELATIN
G TO
SU
BSID
IA
RY C
OM
PA
NIES
CMYK
[173]
The M
inis
try of C
om
pany A
ffairs, G
overnm
ent of India
vid
e its order N
o. 4
7/8
4/2
01
0-C
L-III dated 5
th A
pril, 2
01
0 is
sued under sectio
n 2
12
(8
) of the C
om
panie
s A
ct, 1
95
6, has exem
pted the C
om
pany
from
attachin
g the docum
ents of subsid
iarie
s (exclu
din
g com
panie
s m
arked asteric
in
A
nnexure 1
of Statem
ent 2
12
) of the C
om
pany on 3
1st M
arch, 2
01
0 under sectio
n 2
12
(1
) of the C
om
panie
s A
ct,
19
56
. H
ow
ever, A
nnual
Accounts of the subsid
iary com
panie
s for the year endin
g on 3
1st M
arch, 2
01
0 and the rela
ted detailed in
form
atio
n w
ill
be m
ade available
to the in
vestors of the com
pany at any
poin
t of tim
e. The annual
accounts of the subsid
iary com
panie
s are available
for in
spectio
n by any in
vestor at the Regis
tered O
ffic
e of the C
om
pany and of the concerned subsid
iary of the C
om
pany.
TA
RJA
NI VA
KIL
P. M
URA
RI
G. P. G
UPTA
DR. RA
KESH
JA
IN
SU
SH
IL A
GA
RW
AL
DEVEN
DRA
BH
AN
DA
RI
B. R. G
UPTA
Mum
bai, 7
th M
ay 2
01
0M
anagin
g D
irector
Chie
f Fin
ancia
l O
ffic
er
Com
pany Secretary
Directors
The M
inis
try of C
om
pany A
ffairs, G
overnm
ent of India
vid
e its order N
o. 4
7/8
4/2
01
0-C
L-III dated 2
nd June, 2
01
0 is
sued under sectio
n 2
12
(8
) of the C
om
panie
s A
ct, 1
95
6, has exem
pted the C
om
pany
from
attachin
g the docum
ents of subsid
iarie
s of the C
om
pany on 3
1st M
arch, 2
01
0 under sectio
n 2
12
(1
) of the C
om
panie
s A
ct, 1
95
6. H
ow
ever, A
nnual
Accounts of the subsid
iary com
panie
s for the year
endin
g on 3
1st M
arch, 2
01
0 and the rela
ted detailed in
form
atio
n w
ill
be m
ade available
to the in
vestors of the com
pany at any p
oin
t of tim
e. The annual
accounts of the subsid
iary com
panie
s are
available
for in
spectio
n by any in
vestor at the Regis
tered O
ffic
e of the C
om
pany and of the concerned subsid
iary of the C
om
pany.
S TAT E M E N T P U R S U A N T T O S E C T I O N 2 1 2 O F T H E
COMPANIES ACT, 1956, RELATING TO SUBSIDIARY COMPANIES

STATEM
EN
T RELATIN
G TO
SU
BSID
IA
RY C
OM
PA
NIES
CMYK
[174]
ANNEXURE ‘1 ’ OF STATEMENT PURSUANT TO SECTION 212 OF
THE COMPANIES ACT, 1956
Annexure ‘1
’ of Statem
ent 2
12
of the C
om
panie
s A
ct, 1
95
6
Min
acs
World
wid
eM
inacs K
ft.-
Min
acs
World
wid
eM
inacs G
mbH
,M
inacs G
roup,
Com
pass B.P.O
.C
om
pass BPO
Com
pass BPO
Com
pass BPO
In
c, C
anada
Hungary
Min
acs Ltd
. U
KS.A
. de C
.V., M
axic
oG
erm
any
USA
Pvt. Ltd
IN
DIA
*Ltd
U
K*
FZE U
AE*
INC
U
S *
CA
D in
Rs. in
HU
F in
Rs. in
GBP in
Rs. in
MXN
in
Rs. in
EU
R in
Rs. in
USD
in
Rs. in
Rs. in
GBP in
Rs. in
AED
in
Rs. in
USD
in
Rs. in
lacs
Cro
re
lacs
Cro
re
lacs
Cro
re
lacs
Cro
re
lacs
Cro
re
lacs
Cro
re
Cro
re
lacs
Cro
re
lacs
Cro
re
lacs
Cro
re
The perio
d of
the
Subsid
iary
Com
pany
1st
April 2
00
9 to
1st
April 2
00
9 to
1st
April 2
00
9 to
1st
April 2
00
9 to
1st
April 2
00
9 to
1st
April 2
00
9 to
9th
M
ar 2
01
0 to
9th
M
ar 2
01
0 to
9th
M
ar 2
01
0 to
9th
M
ar 2
01
0 to
31
st
March 2
01
03
1st
March 2
01
03
1st
March 2
01
03
1st
March 2
01
03
1st
March 2
01
03
1st
March 2
01
03
1st
March 2
01
03
1st
March 2
01
03
1st
Ma
rch 2
01
03
1st
March 2
01
0
Extent of interest in
Subsidiary C
om
pany
Equity Share C
apital
1,2
03
.9
35
31
.6
53
0.0
00
.0
70
.0
10
.0
15
.0
00
.1
80
.2
50
.1
53
.0
21
.3
61
.7
40
.1
90
.1
31
.0
00
.1
20
.0
00
.0
0
% Share held
by A
ditya Birla
Nuvo Ltd
. and its Subsid
iarie
s1
00
.0
0%
10
0.0
0%
10
0.0
0%
10
0.0
0%
10
0.0
0%
10
0.0
0%
10
0.0
0%
10
0.0
0%
10
0.0
0%
10
0.0
0%
Net
aggregate
am
ount
of
the profits
/(lo
sses) of
the
Subsid
iary C
om
pany fo
r th
e
perio
d, so fa
r as it concerns
mem
bers of
Aditya Birla
N
uvo Ltd
.
a)
not
dealt w
ith in
th
e
Accounts
of
the C
om
pany
(i)
For th
e financia
l year
of
the subsid
iary
13
.2
55
.7
71
46
.5
10
.3
50
.8
40
.6
60
.0
0-
3.1
12
.0
41
3.9
16
.4
2(0
.0
5)
0.1
00
.0
8(0
.6
9)
(0
.0
9)
0.1
60
.0
7
(ii)
For th
e previo
us financia
l
years sin
ce it becam
e th
e
subsid
iary of
the C
om
pany
(5
38
.9
3)
(2
15
.8
2)
41
8.3
00
.9
73
.2
02
.6
50
.0
0-
8.4
05
.0
66
9.2
92
9.7
4N
ilN
ilN
ilN
ilN
ilN
ilN
il
b)
dealt w
ith in
th
e A
ccounts
of
the C
om
pany
(i)
For th
e financia
l year of
the
subsid
iary
Nil
Nil
Nil
Nil
Nil
Nil
Nil
Nil
Nil
Nil
Nil
Nil
Nil
Nil
Nil
Nil
Nil
Nil
Nil
(ii)
For th
e previo
us financia
l
years sin
ce it becam
e th
e
subsid
iary of
the C
om
pany
Nil
Nil
Nil
Nil
Nil
Nil
Nil
Nil
Nil
Nil
Nil
Nil
Nil
Nil
Nil
Nil
Nil
Nil
Nil
Additio
nal
Info
rm
ation u/s 2
12
(5
)N
ot
Applicable
Not
Applicable
Not
Applicable
Not
Applicable
Not
Applicable
Not
Applicable
Not
Applicable
Not
Applicable
Not
Applicable
Not
Applicable
Average Exchange rate
1 C
AD
=
Rs.4
3.5
91
H
UF=
Rs. 0
.2
39
91
G
BP =
Rs. 7
8.3
06
1 M
XN
=
Rs. 3
.9
12
1 EU
R =
Rs. 6
5.6
01
U
SD
=
Rs. 4
6.1
91
GBP =
Rs. 7
8.3
06
1 A
ED
=
Rs. 1
3.3
61
U
SD
=
Rs. 4
6.1
9
Exchange Rate
as on
31
M
arch, 2
01
01
C
AD
=
Rs.4
4.1
61
H
UF=
Rs. 0
.2
27
91
G
BP =
Rs. 6
7.8
68
1 M
XN
=
Rs. 3
.6
36
1 EU
R =
Rs. 6
1.7
41
U
SD
=
Rs. 4
5.0
31
GBP =
Rs. 6
7.8
71
A
ED
=
Rs. 1
2.2
51
U
SD
=
Rs. 4
5.0
3
* Refe
r N
ote
belo
w Sta
tem
ent
pursuant
to Section 2
12
of
the C
om
panie
s A
ct, 1
95
6 regardin
g approval
receiv
ed fr
om
C
entr
al
Govern
ment
(Rs. in
C
rore unle
ss oth
erw
ise sta
ted)

STATEM
EN
T RELATIN
G TO
SU
BSID
IA
RY C
OM
PA
NIES
CMYK
[175]
S TAT E M E N T P U R S U A N T T O S E C T I O N 2 1 2 ( 8 ) O F T H E
COMPANIES ACT, 1956 RELATING TO SUBSIDIARY COMPANIES
The particula
rs of
Com
panie
s as required under section 2
12
(8
) of
the C
om
panie
s A
ct, 1
95
6 are as fo
llow
s :
(Rs. in
C
rore unle
ss oth
erw
ise sta
ted)
Aditya
Aditya
Aditya
Aditya
Aditya
Adity
Aditya
Aditya
Birla
Birla
Birla
Birla
Birla
Birla
Vik
ram
Birla
Birla
Birla
Insurance
Sun Life
Fin
ance
Capital
Custom
er
Trustee
Glo
bal
Tradin
gM
oney
Com
mo
-Fin
ance
Advis
ary
Insurance
Servic
es
Advis
ors
Servic
es
Com
pany
House
Lim
ited
ditie
sLim
ited
and Brokin
gC
om
pany
Priv
ate
Priv
ate
Priv
ate
Priv
ate
Lim
ited
Brokin
gServic
es
Lim
ited
Lim
ited
Lim
ited
Lim
ited
Lim
ited
Ltd.
Lim
ited
US $
in
la
cs
Rs. in
C
rore
Share C
apital
(Equity and Preference)
51
0.0
03
.5
00
.0
10
.0
58
.5
03
.7
05
.5
42
.0
01
80
.9
62
.7
01
,9
69
.5
0
Reserves &
Surplu
s (net of debit bala
nce of
profit &
lo
ss account and m
iscellaneous
expenditure to the extent not w
ritten off)
(6
.4
5)
(1
.3
6)
(0
.2
7)
(0
.0
2)
3.4
61
.7
04
9.3
82
.5
35
3.9
91
6.7
6(1
,5
47
.4
7)
Total
Assets (Fix
ed A
ssets+
Current A
ssets)
15
2.8
91
2.2
00
.0
00
.0
71
2.0
65
.4
52
27
.1
93
5.0
01
,0
18
.5
12
2.0
77
87
.7
0
Total
Lia
bilitie
s (D
ebts +
C
urrent
Lia
bilitie
s &
provis
ions)
2.4
71
5.5
70
.2
60
.0
40
.1
00
.0
51
74
.2
73
0.4
78
13
.5
72
.6
21
6,4
95
.5
3
Details of Investm
ents
(exclu
din
g in
vestm
ents in
subsid
iary com
panie
s)
(details as per A
nnexure A
)7
3.2
95
.5
1—
——
—0
.0
1—
30
.0
1—
16
,1
29
.8
6
Turnover
1.0
93
.7
9—
0.0
10
.4
10
.2
01
00
.9
91
5.3
71
42
.6
12
2.0
59
,9
22
.6
1
Profit before Taxatio
n(6
.4
7)
(1
.3
5)
(0
.2
3)
(0
.0
1)
0.1
5(0
.6
2)
15
.5
35
.0
04
5.6
75
.2
5(4
35
.5
0)
Provis
ion for Taxatio
n—
0.0
0—
——
—6
.0
51
.7
91
5.6
51
.5
4—
Profit after Taxatio
n(6
.4
7)
(1
.3
5)
(0
.2
3)
(0
.0
1)
0.1
5(0
.6
2)
9.4
83
.2
13
0.0
23
.7
1(4
35
.5
0)
Proposed/Interim
div
idend
(Inclu
din
g D
ivid
end Tax)
Nil
Nil
Nil
Nil
Nil
Nil
Nil
Nil
6.2
9N
ilN
il
(Inclu
din
g on preference share)

STATEM
EN
T RELATIN
G TO
SU
BSID
IA
RY C
OM
PA
NIES
CMYK
[176]
S TAT E M E N T P U R S U A N T T O S E C T I O N 2 1 2 ( 8 ) O F T H E
COMPANIES ACT, 1956 RELATING TO SUBSIDIARY COMPANIES
Aditya
ABM
Laxm
i-A
ditya
Madura
Peter
PSI D
ata
Birla
Aditya
Transw
orks
Birla
Insurance
narayan
Birla
Garm
ent
Engla
nd
System
sTechno
-Birla
Inc, U
SA
Money
Advis
ory
Investm
ent
Fin
ancia
lLife Style
Fashio
ns
Lim
ited
logie
sM
inacs
Mart
Servic
es
Lim
ited
Shared
Retail
and
Lim
ited
World
wid
e
Lim
ted
Ltd
Servic
es
Lim
ited
Retail
Ltd.
Ltd
Lim
ited
Rs. in
C
rore
US $
in
la
cs
Rs. in
C
rore
Share C
apital
(Equity and Preference)
20
.0
00
.4
92
1.0
00
.0
52
0.0
01
.0
12
2.5
59
.8
02
.3
5—
—
Reserves &
Surplu
s (net of debit bala
nce of
profit &
lo
ss account and m
iscellaneous
expenditure to the extent not w
ritten off)
(1
2.5
9)
(3
.2
6)
10
.6
2(0
.0
4)
(9
6.3
7)
(0
.8
9)
(1
1.4
2)
(1
9.3
8)
22
3.6
40
.4
70
.2
1
Total
assets (Fix
ed A
ssets+
Current A
ssets)
28
.7
66
.5
14
2.4
66
.9
57
0.0
00
.9
82
3.4
53
.7
62
27
.1
50
.5
40
.2
4
Total
Lia
bilitie
s (D
ebts +
C
urrent Lia
bilitie
s &
provisions)
21
.8
59
.2
83
0.8
46
.9
41
46
.3
70
.8
72
3.5
91
3.3
47
70
.5
20
.0
60
.0
3
Details of Investm
ents
(exclu
din
g in
vestm
ents in
subsid
iary
com
panie
s) (details as per A
nnexure A
)—
——
——
—0
.0
0—
93
.5
0—
—
Turnover
53
.3
21
0.2
25
.6
6—
30
.4
11
9.0
69
3.3
71
3.8
22
26
.3
3—
—
Profit before Taxatio
n(1
0.2
0)
(1
.3
5)
2.2
5—
(3
6.8
9)
(2
5.3
1)
8.9
11
.3
4(2
9.3
3)
(1
.5
0)
(0
.8
4)
Provis
ion for Taxatio
n—
—0
.9
2—
—0
.0
70
.1
50
.0
10
.2
00
.0
30
.0
2
Profit after Taxatio
n(1
0.2
0)
(1
.3
5)
1.3
3—
(3
6.8
9)
(2
5.3
7)
8.7
61
.3
3(2
9.5
2)
(1
.5
3)
(0
.8
5)
Proposed/ Interim
div
idend
(Inclu
din
g D
ivid
end Tax)
Nil
Nil
Nil
Nil
Nil
Nil
Nil
Nil
NIL
Nil
Nil
(Inclu
din
g on preference share)
(Rs. in
C
rore unle
ss oth
erw
ise sta
ted)

STATEM
EN
T RELATIN
G TO
SU
BSID
IA
RY C
OM
PA
NIES
CMYK
[177]
S TAT E M E N T P U R S U A N T T O S E C T I O N 2 1 2 ( 8 ) O F T H E
COMPANIES ACT, 1956 RELATING TO SUBSIDIARY COMPANIES
A V Tranw
orks Lim
ited,
Aditya Birla
M
inacs
Min
acs W
orld
wid
e Inc,
Min
acs K
ft.- H
ungary
Min
acs Ltd. U
KM
inacs W
orld
wid
e S.A
. de
Canada
Phillippin
s IN
CC
anada (Standalo
ne)
C.V., M
exic
o
CA
D in
la
cs
Rs. in
C
rore
PH
P in
la
cs
Rs. in
C
rore
CA
D in
la
cs
Rs. in
C
rore
HU
F in
la
cs
Rs. in
C
rore
GBP in
la
cs
Rs. in
C
rore
MXN
in
la
cs
Rs. in
C
rore
Share C
apital
(Equity and Preference)
1,5
70
.0
06
93
.3
19
69
.2
39
.8
41
,2
03
.9
35
31
.6
53
0.0
00
.0
70
.0
10
0.0
10
.5
00
.1
8
Reserves &
Surplu
s
(net of debit bala
nce of
profit &
lo
ss account and
mis
cellaneous expenditure to
the extent not w
ritten off)
(1
8.9
1)
(8
.1
2)
(1
,4
35
.2
4)
(1
4.5
7)
(7
14
.9
4)
(3
15
.7
2)
69
5.4
41
.5
82
.6
81
.8
2(0
.5
0)
(0
.1
8)
Total
assets
(Fix
ed A
ssets+
Current A
ssets)
1.7
40
.7
78
70
.3
08
.8
31
,2
13
.2
45
35
.7
71
,9
70
.2
94
.4
98
.6
15
.8
4—
—
Total
Lia
bilitie
s
(D
ebts +
C
urrent Lia
bilitie
s &
provisions)
6.3
22
.7
91
,3
36
.3
01
3.5
77
24
.2
63
19
.8
31
,2
44
.8
52
.8
45
.9
24
.0
2—
—
Details of Investm
ents
(exclu
din
g in
vestm
ents in
subsid
iary com
panie
s)
(details as per A
nnexure A
)—
——
——
——
——
——
—
Turnover
1.5
70
.6
91
,4
55
.7
71
4.7
81
,5
85
.0
66
91
.0
14
,0
19
.5
99
.6
42
3.9
21
8.7
3—
—
Profit before Taxatio
n(1
3.0
8)
(5
.7
0)
(2
21
.1
2)
(2
.2
4)
13
.2
55
.7
72
47
.4
20
.5
91
.1
60
.9
1—
—
Provis
ion for Taxatio
n—
——
0.0
0—
—1
00
.9
10
.2
40
.3
30
.2
6—
—
Profit after Taxatio
n(1
3.0
8)
(5
.7
0)
(2
21
.1
2)
(2
.2
4)
13
.2
55
.7
71
46
.5
10
.3
50
.8
40
.6
6—
—
Proposed/ Interim
div
idend
(Inclu
din
g D
ivid
end Tax)
Nil
Nil
Nil
Nil
Nil
Nil
Nil
Nil
Nil
Nil
Nil
Nil
(Inclu
din
g on preference share)
(Rs. in
C
rore unle
ss oth
erw
ise sta
ted)

STATEM
EN
T RELATIN
G TO
SU
BSID
IA
RY C
OM
PA
NIES
CMYK
[178]
S TAT E M E N T P U R S U A N T T O S E C T I O N 2 1 2 ( 8 ) O F T H E
COMPANIES ACT, 1956 RELATING TO SUBSIDIARY COMPANIES
Min
acs G
mbH
,M
inacs G
roup,
Com
pass
Com
pass BPO
Ltd
Com
pass BPO
Com
pass BPO
IN
C
Germ
any
USA
B.P.O
.U
K FZE U
AE
U
S
Pvt. Ltd
IN
DIA
EU
R in
la
cs
Rs. in
C
rore
USD
in
la
cs
Rs. in
C
rore
Rs. in
C
rore
GBP in
la
cs
Rs. in
C
rore
AED
in
la
cs
Rs. in
C
rore
USD
in
la
cs
Rs. in
C
rore
Share C
apital
(Equity and Preference)
0.2
50
.1
53
.0
21
.3
61
.7
30
.1
90
.1
31
.0
00
.1
20
.0
00
.0
0
Reserves &
Surplu
s
(net of debit bala
nce of profit &
lo
ss
account and m
iscellaneous expenditure
to the extent not w
ritten off)
20
.9
41
2.9
38
1.0
23
6.4
8(0
.1
3)
9.0
86
.1
7(0
.9
3)
(0
.1
1)
1.6
50
.7
4
Total
assets (Fix
ed A
ssets+
Current A
ssets)
24
.9
51
5.4
03
87
.2
81
74
.3
95
.1
88
.4
55
.7
32
.5
30
.3
14
.8
62
.1
9
Total
Lia
bilitie
s
(D
ebts +
C
urrent Lia
bilitie
s &
provis
ions)
3.7
62
.3
23
03
.2
31
36
.5
53
.5
71
.8
61
.2
62
.4
70
.3
03
.2
11
.4
4
Details of Investm
ents
(exclu
din
g in
vestm
ents in
subsid
iary com
panie
s)
(details as per A
nnexure A
)
Turnover
73
.6
34
8.3
19
70
.1
84
48
.1
32
4.0
92
0.4
91
6.0
52
5.5
33
.4
13
0.8
21
5.1
3
Profit before Taxatio
n4
.3
02
.8
22
2.5
11
0.4
01
.4
2(2
.2
2)
(1
.7
4)
(1
0.5
8)
(1
.4
1)
0.8
00
.3
9
Provis
ion for Taxatio
n1
.1
90
.7
88
.6
03
.9
70
.0
9(0
.2
4)
(0
.1
9)
——
0.2
40
.1
2
Profit after Taxatio
n3
.1
12
.0
41
3.9
16
.4
21
.3
4(1
.9
8)
(1
.5
5)
(1
0.5
8)
(1
.4
1)
0.5
60
.2
8
Proposed/Interim
div
idend
(Inclu
din
g D
ivid
end Tax)
Nil
Nil
Nil
Nil
Nil
Nil
Nil
Nil
Nil
Nil
Nil
(Inclu
din
g on preference share)
(Rs. in
C
rore unle
ss oth
erw
ise sta
ted)

STATEM
EN
T RELATIN
G TO
SU
BSID
IA
RY C
OM
PA
NIES
CMYK
[179]
ANNEXURE ‘A’ OF STATEMENT U/S 212(8) OF THE
COMPANIES ACT, 1956
A) Details of Investments of Birla Sun Life Insurance Company Limited as at 31 March, 2010
(Rs. In crore)
Shareholders Policyholders Assets held to Total
cover Linked
liabilities
LONG TERM INVESTMENTS
1 Government securities and Government
guaranteed bonds including Treasury Bills 192.18 419.60 1,195.52 1,807.30
2 Other Investments
(a) Debenture/Bonds 28.31 154.40 1,758.84 1,941.55
(b) Equity — — 5,042.34 5,042.34
(c) Others — — 3.84 3.84
3 Investment in Infrastructure and
Social Sector Bonds 77.73 158.13 2,564.05 2,799.91
4 Other than Approved Investments 2.50 — 953.80 956.30
Total (A) 300.72 732.14 11,518.39 12,551.24
SHORT TERM INVESTMENTS
1 Government securities and Government
guaranteed bonds including Treasury Bills 68.20 126.37 4.88 199.45
2 Other Approved Securities
— Fixed deposits — — — —
— Others 70.03 76.28 696.26 842.57
3 Other approved Investments
(a) Mutual Funds 40.85 19.60 642.72 703.18
(b) Debenture / Bonds 6.94 17.68 383.11 407.73
(c) Others — — — —
4 Investment in Infrastructure and
Social Sector Bonds 8.92 86.10 173.37 268.38
5 Other than Approved Investments 8.75 — 461.81 470.56
Total (B) 203.68 326.03 2,362.16 2,891.88
Other Assets
1 Bank Balances — — 376.31 376.31
2 Interest Accrued on Investments — — 159.41 159.41
3 Fund Charges — — — —-
4 Outstanding Contract (Net) — — 151.02 151.02
Sub Total (C) — — 686.74 686.74
Total (A+B+C) 504.40 1,058.17 14,567.30 16,129.86

STATEM
EN
T RELATIN
G TO
SU
BSID
IA
RY C
OM
PA
NIES
CMYK
[180]
ANNEXURE ‘A’ OF STATEMENT U/S 212(8) OF THE
COMPANIES ACT, 1956
B) Details of Investment of Aditya Birla Financial Services Pvt.Ltd.
As at
31 March, 2010
Number Rs Crores
LONG TERM INVESTMENTS
Investment in Birla Sun Life Asset Management Company Limited 8,999,980 14.31
Investment in Birla Sun Life Trustee Company Private Limited 9,950 0.01
Investment in Aditya Birla Private Equity - Fund I 35.23
Investment in Mutual fund
Birla Sunlife Savings Fund Instl. Premium - Growth 7,107,646 12.09
Birla Sun Life Cash Plus- Instl. Prem.- Growth 17 0.00
Birla Sunlife Cash Plus 7,915,686 11.65
Total 73.29
C) Details of Investment of Aditya Birla Capital Advisors Pvt. Ltd.
CURRENT INVESTMENTS
(At lower of the cost or net asset value)
Birla Sunlife Saving Fund Intitutional Daily Dividend Reinvestment Scheme 5,504,605 5.51
Total 5.51
D) Details of Investment of Aditya Birla Money Ltd.
LONG TERM INVESTMENTS
a) Equity Shares
Unquoted
BSE Limited 130,000 0.00
Apollo Sindhoori Hotels Limited 6,600 0.01
Total 0.01
E) Details of Investment of Aditya Birla Finance Ltd.
LONG TERM INVESTMENTS
a) Equity Shares
Quoted
HDFC Bank Ltd 260 0.00
Unquoted
Birla Management Centre Services Ltd 7,000 0.01
Birla Sun Life Trustee Co. Pvt. Ltd. 20 0.00
b) Debentures - Unquoted
ABK Consultants Pvt Ltd 30 30.00
Total 30.01
F) Details of Investment of Aditya Birla Minacs Worldwide Ltd.
CURRENT INVESTMENTS
(At lower of the cost or net asset value)
Birla Sunlife Cash Plus - Institutional Premium - Growth 5,772,261 8.50
Birla Sunlife Saving Fund - Institutional Growth 57,722,606 85.00
93.50

Printed at Infom
edia18 Ltd.
ADITYA BIRLA NUVO & ITS SUBSIDIARIES AND JOINT VENTURES*
ADITYA BIRLA NUVO LTD. : Fashion & Lifestyle, Carbon Black, Agri-business,
Rayon Yarn (Incl. Caustic Soda & allied
chemicals), Insulators, Textiles (Spun Yarn &
Fabrics)
I) ADITYA BIRLA FINANCIAL SERVICES
Subsidiaries
� Birla Sun Life Insurance Company Ltd.
[JV with Sun Life Financial Inc of Canada] : Life Insurance
� Aditya Birla Financial Services Pvt. Ltd. (“ABFSPL”) : Investment
• Aditya Birla Money Ltd. : Equity Broking
� Aditya Birla Commodities Broking Ltd. : Commodities Broking
• Aditya Birla Capital Advisors Pvt. Ltd. Private Equity Investment, Advisory &
Management Services
• Aditya Birla Trustee Company Pvt. Ltd. : Trustee of Private Equity Fund
• Aditya Birla Customer Services Pvt. Ltd : General Services
• Aditya Birla Financial Shared Services Ltd. : Financial & IT enabled services
• Birla Insurance Advisory and Broking Services Ltd. : Non-life Insurance Advisory and Broking
� Aditya Birla Finance Ltd. : NBFC / Fund Based Lending
� Aditya Birla Money Mart Ltd. : Wealth Management & Distribution
• Aditya Birla Money Insurance Advisory Services Ltd. : Life Insurance Advisory
� ABNL Investment Ltd. : Investment
Joint Ventures (through ABFSPL)
� Birla Sun Life Asset Management Company Ltd. : Asset Management
� Birla Sun Life Trustee Company Pvt. Ltd. : Trustee of Birla Sun Life Mutual Fund
II) IT-ITeS SUBSIDIARIES
� Aditya Birla Minacs Worldwide Ltd. & its subsidiaries : Information Technology enabled Services (ITeS)
• Transworks Inc. USA
• Aditya Birla Minacs Philippines Inc, Philippines
• AV Transworks Ltd., Canada
• Aditya Birla Minacs Worldwide Inc.,
Canada & its subsidiaries
� Minacs Group, (USA) Inc.
� Minacs Worldwide S.A. de C.V., Mexico
� Minacs Ltd, UK
� Minacs Worldwide GmbH, Germany
� Minacs Kft., Hungary
� Compass BPO Ltd. UK
• Compass BPO Inc. USA
• Compass Business Process Outsourcing Pvt. Ltd., India
• Compass BPO FZE, UAE
� Aditya Minacs IT Services Ltd. & its subsidiary : Information Technology services
• Aditya Birla Minacs Technologies Ltd.
III) GARMENTS & OTHERS SUBSIDIARIES
� Madura Garments Lifestyle Retail Company Ltd. : Apparel Retail
� Peter England Fashions and Retail Ltd. : Apparel Retail
� Aditya Vikram Global Trading House Ltd. : International General Trading
IV) TELECOM (JOINT VENTURE)
� Idea Cellular Ltd. : Telecommunication Services
* As on 31st March, 2010

Aditya Birla Nuvo Ltd.
Corporate Finance Division
Aditya Birla Centre, ‘A’ Wing, 4th
Floor,
S.K. Ahire Marg, Worli, Mumbai 400 030. India
Registered Office : Indian Rayon Compound, Veraval – 362 266, Gujarat
Telephone +91 22 66525000, 24995000
Fax +91 22 66525821, 24995821
Website www.adityabirlanuvo.com
www.adityabirla.com
E-mail [email protected]
AD
IT
YA
B
IR
LA
N
UV
O LIM
IT
ED
A
NN
UA
L R
EP
OR
T 2
00
9-2
01
0