MPUMALANGA H & S ROADSHOW 22 July 2017 Mpumalanga Roadshow22 June 2017 CERS.pdf · Introduction...
22
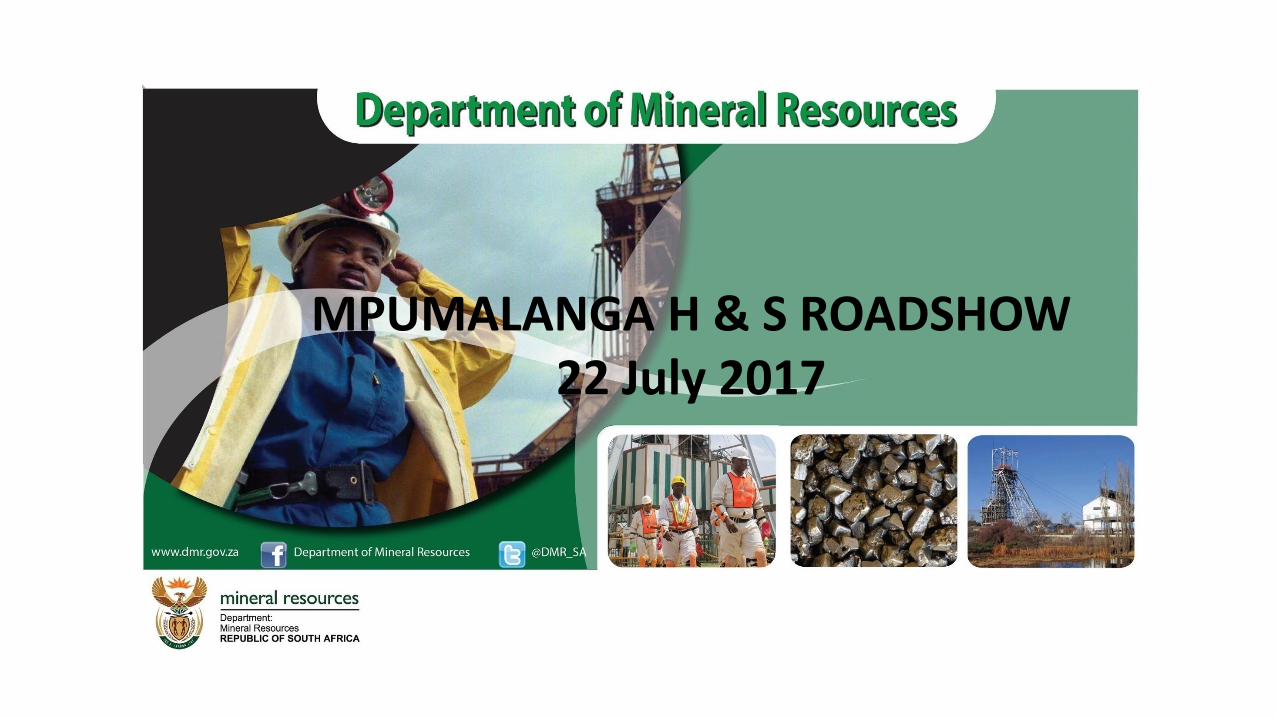
MPUMALANGA H & S ROADSHOW 22 July 2017
Transcript of MPUMALANGA H & S ROADSHOW 22 July 2017 Mpumalanga Roadshow22 June 2017 CERS.pdf · Introduction...
MPUMALANGA H & S ROADSHOW 22 July 2017

Table of content Introduction
H&S Statistics
MP Regional challenges
MP Regional enforcement strategy
Message from the PI’s desk
Conclusion
Questions and comments
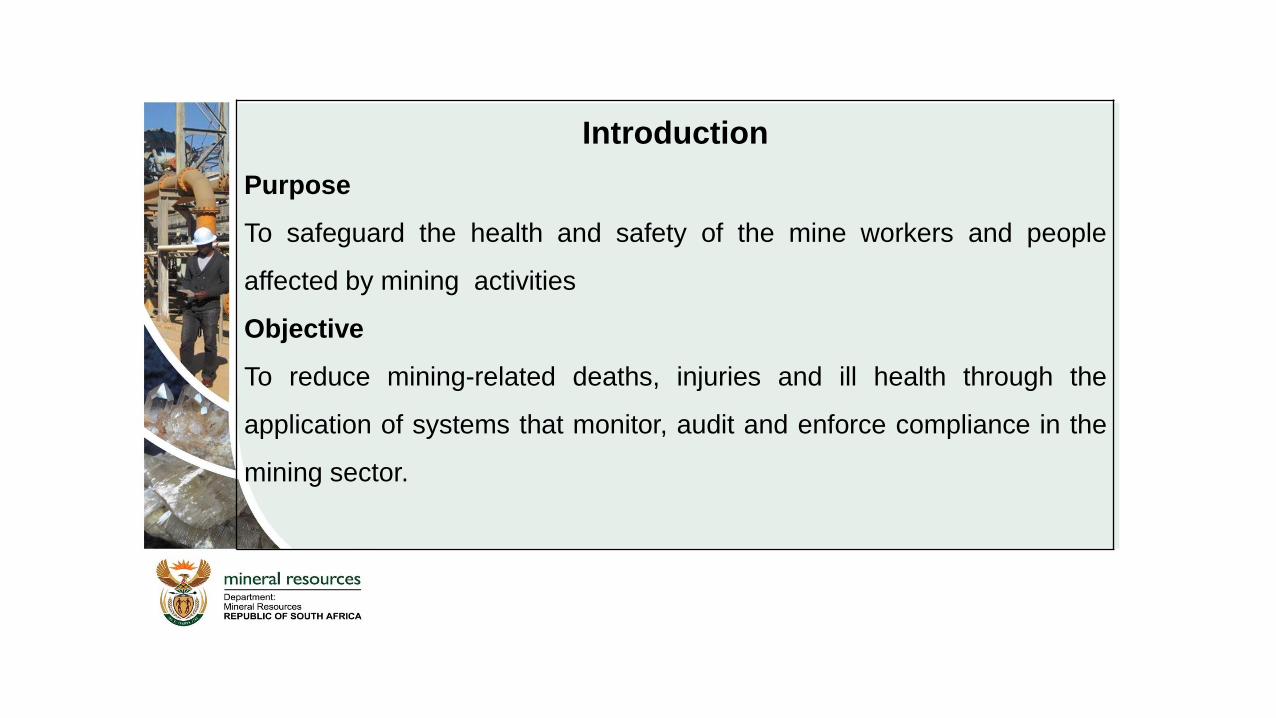
Introduction
Purpose
To safeguard the health and safety of the mine workers and people
affected by mining activities
Objective
To reduce mining-related deaths, injuries and ill health through the
application of systems that monitor, audit and enforce compliance in the
mining sector.

Fatalities* Injuries*
Actual Actual
01/01/2016 -
19/06/2016
01/01/2017 -
19/06/2017 % change
Total fatal
accidents**
01/01/2016 -
19/06/2016
01/01/2017 -
19/06/2017 % change
Total 38 35 -8 32 1322 1103 -17
Gold 16 14 -13 13 553 449 -19
Coal 1 4 300 4 107 68 -36
Platinum 15 12 -20 11 508 471 -7
Other 6 5 -17 4 154 115 -25
Region
Fatalities* Injuries*
Actual Actual
01/01/2016 -
19/06/2016
01/01/2017 -
19/06/2017 % change
Total fatal
accidents
01/01/2016 -
05/06/2016
01/01/2017 -
19/06/2017
01/01/2017 -
19/06/2017
Total 38 35 -8 32 1322 1103 -17
Western Cape 0 2 200 1 4 2 -50
Northern Cape 4 0 -400 0 67 52 -22
Free State 7 6 -14 6 102 110 8
Eastern Cape 0 0 0 0 1 0 -100
KwaZulu/Natal 0 0 0 0 24 5 -79
Mpumalanga 0 6 600 6 114 72 -37
Limpopo 2 3 50 3 71 66 -7
Gauteng 11 8 -27 7 313 242 -23
Klerksdorp 0 0 0 0 131 97 -26
Rustenburg 14 10 -29 9 495 457 -8

JAN FEB MAR APR MAY JUN JUL AUG SEP OCT NOV DEC
9
4
3
9 9
4
7
9
7
5 4
3
Fatalities per Month 2016 and 2017 2016 2017

MP TOTAL FATALITIES ACCIDENTS PER MONTH JAN 2012 – MAY 2017
2
1
0
2
1 1
0 0
1
2
1
0
2 2
1
0 0
3
0
1
2
0 0
2
1 1
0
1
0
1 1
2
0 0 0
1
0
1 1 1
2
0 0 0 0 0 0 0 0 0 0
2
0
1
0 0 0 0
1 1
2 2
000
0.5
1
1.5
2
2.5
3
3.5
Jan-
12
Mar
-12
May
-12
Jul-1
2
Sep-
12
Nov
-12
Jan-
13
Mar
-13
May
-13
Jul-1
3
Sep-
13
Nov
-13
Jan-
14
Mar
-14
May
-14
Jul-1
4
Sep-
14
Nov
-14
Jan-
15
Mar
-15
May
-15
Jul-1
5
Sep-
15
Nov
-15
Jan-
16
Mar
-16
May
-16
Jul-1
6
Sep-
16
Nov
-16
Jan-
17
Mar
-17
May
-17

MP TOTAL FATALITIES ACCIDENTS PER MONTH COAL MINES
JAN 2012 – MAY 2017
2
1
0 0
1 1
0 0
1
0
1
0
2
1 1
0 0
1
0 0
2
0 0 0
1 1
0 0
1
0
1 1 1
0 0 0 0 0
1
0
1
0 0 0 0 0 0 0 0 0 0 0
1
0
1
0 0 0 0
1
0
1
2
0
1
0
0.5
1
1.5
2
2.5
3
3.5
Jan-
12
Mar
-12
May
-12
Jul-1
2
Sep-
12
Nov
-12
Jan-
13
Mar
-13
May
-13
Jul-1
3
Sep-
13
Nov
-13
Dec
-13
Feb-
14
Apr-
14
Jun-
14
Aug-
14
Oct
-14
Dec
-14
Feb-
15
Apr-
15
Jun-
15
Aug-
15
Oct
-15
Dec
-15
Feb-
16
Apr-
16
Jun-
16
Aug-
16
Oct
-16
Dec
-16
Feb-
17
Apr-
17

MP TOTAL FATALITIES ACCIDENTS PER MONTH GOLD MINES
JAN 2012 – MAY 2017
0 0 0
2
0 0 0 0 0
2
0 0 0
1
0 0 0
2
0 0 0 0 0
1
0
1
0 0 0 0 0
1
0 0 0 0 0 0
1
0
1
0 0 0 0 0 0 0 0 0 0
1
0 0 0 0 0 0 0
1 1
0 000
0.5
1
1.5
2
2.5
Jan-
12
Mar
-12
May
-12
Jul-1
2
Sep-
12
Nov
-12
Jan-
13
Mar
-13
May
-13
Jul-1
3
Sep-
13
Nov
-13
Jan-
14
Mar
-14
May
-14
Jul-1
4
Sep-
14
Nov
-14
Jan-
15
Mar
-15
May
-15
Jul-1
5
Sep-
15
Nov
-15
Jan-
16
Mar
-16
May
-16
Jul-1
6
Sep-
16
Nov
-16
Jan-
17
Mar
-17
May
-17

MP TOTAL FATALITIES ACCIDENTS PER MONTH PLATINUM MINES
JAN 2012 – MAY 2017
0 0 0 0 0 0 0 0 0 0 0 0 0 0 0 0 0 0 0 0 0 0 0 0 0 0 0 0 0 0 0 0 0 0 0 0 0 0 0 0 0 0 0 0 0 0 0 0 0 0 0 0 0 0 0 0 0 0 0 0 0 0 0 000
0.1
0.2
0.3
0.4
0.5
0.6
0.7
0.8
0.9
1
Jan-
12
Mar
-12
May
-12
Jul-1
2
Sep-
12
Nov
-12
Jan-
13
Mar
-13
May
-13
Jul-1
3
Sep-
13
Nov
-13
Jan-
14
Mar
-14
May
-14
Jul-1
4
Sep-
14
Nov
-14
Jan-
15
Mar
-15
May
-15
Jul-1
5
Sep-
15
Oct
-15
Dec
-15
Feb-
16
Apr-
16
Jun-
16
Aug-
16
Oct
-16
Dec
-16
Feb-
17
Apr-
17

MP TOTAL FATALITIES ACCIDENTS PER MONTH OTHER MINES
JAN 2012 – MAY 2017
0 0 0 0 0 0 0 0 0 0 0 0 0 0 0 0 0 0 0
1
0 0 0 0 0 0 0 0 0 0 0 0 0 0 0
1
0 0 0 0 0 0 0 0 0 0 0 0 0 0 0 0 0 0 0 0 0 0 0 0 0 0 000
0.5
1
1.5
Jan-
12
Mar
-12
May
-12
Jul-1
2
Sep-
12
Nov
-12
Jan-
13
Mar
-13
May
-13
Jul-1
3
Sep-
13
Nov
-13
Jan-
14
Mar
-14
May
-14
Jul-1
4
Sep-
14
Nov
-14
Jan-
15
Mar
-15
May
-15
Jul-1
5
Sep-
15
Nov
-15
Jan-
16
Mar
-16
May
-16
Jul-1
6
Sep-
16
Nov
-16
Jan-
17
Mar
-17
May
-17

2131
1824 19
5
75
63
4552
45
26
174
155 151
102 102
45
2318 18
2518
11
0
20
40
60
80
100
120
140
160
180
200
2012 2013 2014 2015 2016 2017
TOTAL ACCIDENTS PER YEAR PER MAIN CONTRIBUTOR JAN 2012 - MAY 2017
Fall of ground T&M General Machinery

FALL OF GROUND ACCIDENTS
JAN 2017 – MAY 2017
Rockburst -
Sidewall
20%
Strainburst -
Face
20%
Gravity - Face
20%
Gravity -
Hanging wall
40%

MACHINERY ACCIDENTS
JAN 2017 – MAY 2017
Tail pulley
18%Other portable
power tools
27%
Loading/transfer
chute
28%
Other conveyor
belt related
accidents
18%
Portable electric
tools
9%

TRANSPORTATION & MINING ACCIDENTS >1
JAN 2017 – MAY 2017
Load haul
dumper (LHD)
37%
Roofbolter
27%
Coupling/uncoupling
9%
Haul truck
9%
Utility Vehicle
9% Scooptram
9%

GENERAL ACCIDENTS >1
JAN 2017 – MAY 2017
Fall of material
14%
Roll ing rock
7%
Pull ing
7%
Lif t ing
7%
Lowering
7%
Slipping
19%
Tripping over
14%
Stumbling
7%
Fal l ing from m achine
7%
Struck by any object
being physica l ly
handled by a worker
11%

12
5 2
18
28
65
8
2 2
9 7
28
0 0 1
5 7
13 11
0 0 2 1
14
2 0 0
3 2
7
2 0 0 0
2 4
0
10
20
30
40
50
60
70
Jan-17 Feb-17 Mar-17 Apr-17 May-17 Totals
Regional Health Incident Reports January 2017 to May 2017
PTB NIHL CWP COAD MDR-TB SIL

Reporting of accidents as per chapter 23 of MHSA
Regulation not complied with.
Unsafe areas declared safe due to inadequate entry
examination.
Cold stress alert and winter season campaigns not
popularized in other mines .
Late submission of accident investigation by mines.
Poor quality of system analysis especially on section
54’s and accidents to address the root cause.
MP Regional challenges

Poor control and management of explosives .
Inadequate risk identification and poor quality of
risk assessment.
Poor maintenance of shafts and steel works.
Poor maintenance of statutory and none statutory
equipment.
Inadequate training of employees on mine standard
and procedures.
MP Regional challenges cont.

Continue with group audits and group inspections to
ensure legal compliance at the mines.
Ensure increase of Inspector’s visibility at the mines.
Make effective use of RTF’s to establish task teams.
Follow up on instructions given and inspections
conducted.
Monitor the effective implementation of action
plans as per group audits and inspections.
Regional enforcement strategy

Blasting examination certificate is now with the
DMR.
Any application of interest must be sent to the
office three months prior the required feedback.
2.13.9 applications must be inclusive of the
information from all mines involved.
All union letters must have letterhead to
support/not support the Sunday labor applications.
Message from the PI’s desk

Conclusion
• All the stakeholders should live the theme of
Striving for zero harm
• Ensuring that every mine worker returns from work
unharmed every day
• Changing minds, changing mines_ Culture
• VISION – VALUES*DESTINY – DISCIPLINE