MPLAB IDE v6.xx Quick Start Guide - Driscoll/Dubin/O'Neil...
32
2003 Microchip Technology Inc. DS51281C MPLAB IDE v6.xx Quick Start Guide
Transcript of MPLAB IDE v6.xx Quick Start Guide - Driscoll/Dubin/O'Neil...
2003 Microchip Technology Inc. DS51281C
MPLAB IDE v6.xx
Quick Start Guide
Note the following details of the code protection feature on Microchip devices:
• Microchip products meet the specification contained in their particular Microchip Data Sheet.
• Microchip believes that its family of products is one of the most secure families of its kind on the market today, when used in the
intended manner and under normal conditions.
• There are dishonest and possibly illegal methods used to breach the code protection feature. All of these methods, to our knowl-
edge, require using the Microchip products in a manner outside the operating specifications contained in Microchip's Data
Sheets. Most likely, the person doing so is engaged in theft of intellectual property.
• Microchip is willing to work with the customer who is concerned about the integrity of their code.
• Neither Microchip nor any other semiconductor manufacturer can guarantee the security of their code. Code protection does not
mean that we are guaranteeing the product as “unbreakable.”
Code protection is constantly evolving. We at Microchip are committed to continuously improving the code protection features of our
products.
Information contained in this publication regarding device
applications and the like is intended through suggestion only
and may be superseded by updates. It is your responsibility to
ensure that your application meets with your specifications.
No representation or warranty is given and no liability is
assumed by Microchip Technology Incorporated with respect
to the accuracy or use of such information, or infringement of
patents or other intellectual property rights arising from such
use or otherwise. Use of Microchip’s products as critical com-
ponents in life support systems is not authorized except with
express written approval by Microchip. No licenses are con-
veyed, implicitly or otherwise, under any intellectual property
rights.
DS51281C - page ii
Trademarks
The Microchip name and logo, the Microchip logo, KEELOQ,
MPLAB, PIC, PICmicro, PICSTART, PRO MATE and
PowerSmart are registered trademarks of Microchip
Technology Incorporated in the U.S.A. and other countries.
FilterLab, microID, MXDEV, MXLAB, PICMASTER, SEEVAL
and The Embedded Control Solutions Company are
registered trademarks of Microchip Technology Incorporated
in the U.S.A.
Accuron, Application Maestro, dsPIC, dsPICDEM,
dsPICDEM.net, ECONOMONITOR, FanSense, FlexROM,
fuzzyLAB, In-Circuit Serial Programming, ICSP, ICEPIC,
microPort, Migratable Memory, MPASM, MPLIB, MPLINK,
MPSIM, PICC, PICkit, PICDEM, PICDEM.net, PowerCal,
PowerInfo, PowerMate, PowerTool, rfLAB, rfPIC, Select
Mode, SmartSensor, SmartShunt, SmartTel and Total
Endurance are trademarks of Microchip Technology
Incorporated in the U.S.A. and other countries.
Serialized Quick Turn Programming (SQTP) is a service mark
of Microchip Technology Incorporated in the U.S.A.
All other trademarks mentioned herein are property of their
respective companies.
© 2003, Microchip Technology Incorporated, Printed in the
U.S.A., All Rights Reserved.
Printed on recycled paper.
2003 Microchip Technology Inc.
Microchip received QS-9000 quality system certification for its worldwide headquarters, design and wafer fabrication facilities in Chandler and Tempe, Arizona in July 1999 and Mountain View, California in March 2002. The Company’s quality system processes and procedures are QS-9000 compliant for its PICmicro® 8-bit MCUs, KEELOQ® code hopping devices, Serial EEPROMs, microperipherals, non-volatile memory and analog products. In addition, Microchip’s quality system for the design and manufacture of development systems is ISO 9001 certified.
MPLAB® IDE v6.xxQUICK START
Table of Contents
Chapter 1. Getting Started with MPLAB IDE ............................................11.1 Introduction ..................................................................................... 11.2 Highlights ........................................................................................ 11.3 Getting Started with MPLAB IDE.................................................... 2
Chapter 2. Debugging a Simple Project ...................................................52.1 Introduction ..................................................................................... 52.2 Creating Source Code .................................................................... 52.3 Creating a Project ........................................................................... 62.4 Building the Project....................................................................... 102.5 Running the Simulator .................................................................. 112.6 Debugging the Application............................................................ 12
Chapter 3. Next Steps ..............................................................................193.1 Introduction ................................................................................... 193.2 Programming a Device ................................................................. 193.3 Debugging with Advanced Simulator Features............................. 203.4 Accessing MPLAB IDE On-line Help ............................................ 223.5 Configuring Workspace and Project Debug Settings.................... 24
Worldwide Sales and Service..................................................................28
2003 Microchip Technology Inc. DS51281C-page iii

MPLAB® IDE v6.xx Quick Start
NOTES:
apRNOUN`-page iv 2003 Microchip Technology Inc.
MPLAB® IDE v6.xxQUICK START
Chapter 1. Getting Started with MPLAB IDE
1.1 INTRODUCTION
MPLAB Integrated Development Environment (IDE) is a comprehensive editor, project
manager and design desktop for application development of embedded designs using
Microchip PICmicro® microcontrollers.
This document covers the installation and set up of MPLAB® IDE version 6.20 and later.
An overview of debugging capabilities will be discussed using an example application
as a guide. In addition, a few of the many MPLAB IDE system features are presented
to help finish applications quickly.
This document is meant to help users get started, but some aspects of the user
interface will likely change in future releases, and new features will be added as
additional parts are released. This guide may quickly become out of date; for product
updates, check the Microchip web site. The on-line help is always the most up-to-date
reference for the current version of MPLAB IDE.
1.2 HIGHLIGHTS
The first section of this document details the installation of MPLAB IDE on the user’s
PC. Section two is a simple step-by-step tutorial that creates a project and explains the
debug capabilities of MPLAB. The last section covers the use of other tools and how to
customize MPLAB for a specific debugging environment.
• Getting Started with MPLAB IDE
• Debugging a Simple Project
- Creating a Project
- Running the Simulator
- Debugging the Application
• Next Steps
- Programming a Device
- Debugging with Advanced Simulator Features
- Accessing MPLAB IDE On-line Help
- Configuring Workspace and Project Debug Settings
2003 Microchip Technology Inc. DS51281C-page 1
MPLAB® IDE v6.xx Quick Start
1.3 GETTING STARTED WITH MPLAB IDE
MPLAB IDE is a Windows® OS based Integrated Development Environment for the
PICmicro® MCU families and the dsPIC™ Digital Signal Controllers. The MPLAB IDE
provides the ability to:
• Create and edit source code using the built-in editor.
• Assemble, compile and link source code.
• Debug the executable logic by watching program flow with the built-in simulator or
in real time with MPLAB ICE 2000 and 4000 emulators or MPLAB ICD 2 in-circuit
debugger.
• Make timing measurements with the simulator or emulator.
• View variables in Watch windows.
• Program firmware into devices with MPLAB ICD 2, PICSTART® Plus or
PRO MATE® II device programmers.
• Find quick answers to questions from the extensive MPLAB IDE on-line help.
1.3.1 System Requirements
The following minimum configuration is required to run MPLAB IDE:
• PC-compatible Pentium® class system
• Microsoft Windows 98 SE, Windows 2000 SP2, Windows NT® SP6, Windows ME,
Windows XP
• 64K MB memory (128MB recommended)
• 45 MB of hard disk space
• Internet Explorer 5.0 or greater
1.3.2 Install/Uninstall MPLAB IDE
To install MPLAB IDE on your system:
• For some Windows OS’s, administrative access is required in order to install
software on the PC.
• If installing from a CD-ROM, place the CD-ROM into the drive. Follow the
on-screen menu to install MPLAB IDE. If no on-screen menu appears, use
Explorer to find and execute the CD-ROM menu by double-clicking on the
executable file menu.exe.
• If downloading MPLAB IDE from the Microchip web site, double-click on the
downloaded executable file to begin installation.
To uninstall MPLAB IDE:
• Select UNWISE32 from the Start>Programs>Microchip MPLAB IDE menu, or
• Execute the file unwise32.exe in the MPLAB IDE installation directory.
Note: Selected third party tools are also supported by MPLAB. Check the release
notes or readme files for details.
DS51281C-page 2 2003 Microchip Technology Inc.
Getting Started with MPLAB® IDE
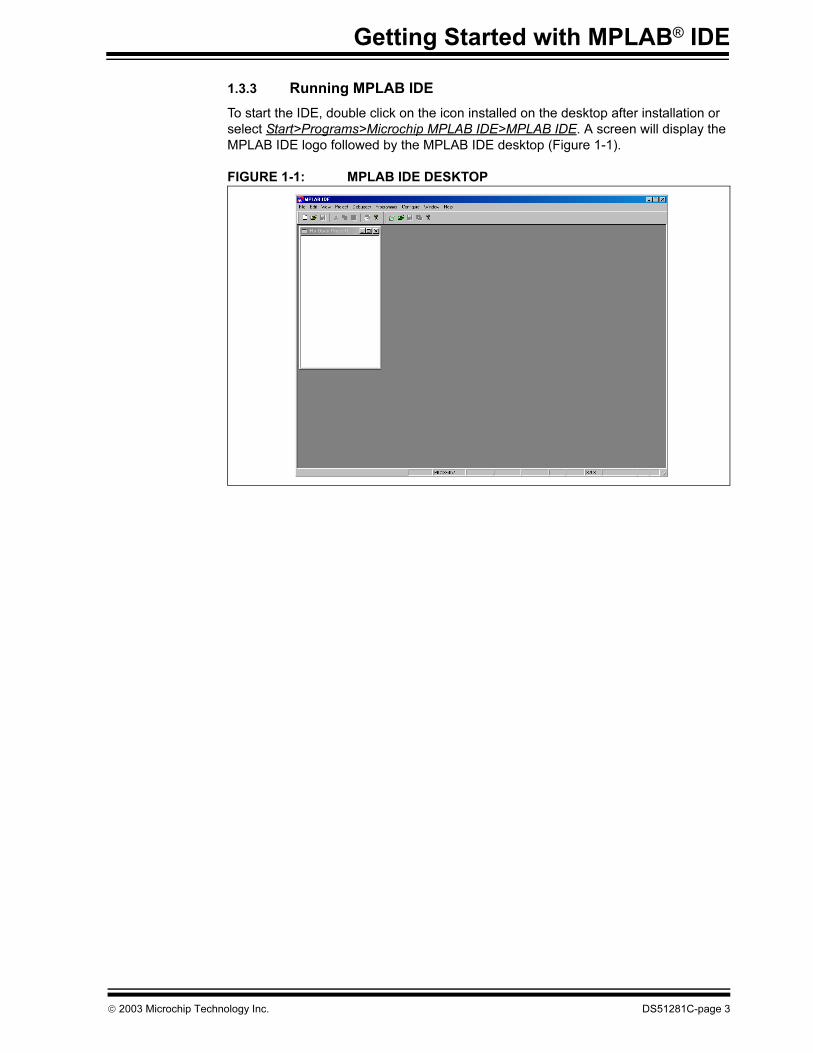
1.3.3 Running MPLAB IDE
To start the IDE, double click on the icon installed on the desktop after installation or
select Start>Programs>Microchip MPLAB IDE>MPLAB IDE. A screen will display the
MPLAB IDE logo followed by the MPLAB IDE desktop (Figure 1-1).
FIGURE 1-1: MPLAB IDE DESKTOP
2003 Microchip Technology Inc. DS51281C-page 3
MPLAB® IDE v6.xx Quick Start
NOTES:
DS51281C-page 4 2003 Microchip Technology Inc.
MPLAB® IDE v6.xxQUICK START
Chapter 2. Debugging a Simple Project
2.1 INTRODUCTION
In order to create code that is executable by the target PICmicro MCU, source files
need to be put into a project and then the code is built using selected language tools
(assemblers, compilers, linkers, etc.). In MPLAB IDE, the project manager takes care
of this process.
The first step is writing a very short source code file. Next, a project is created, source
code added, language tools are assigned to the project and finally, the code is built and
tested.
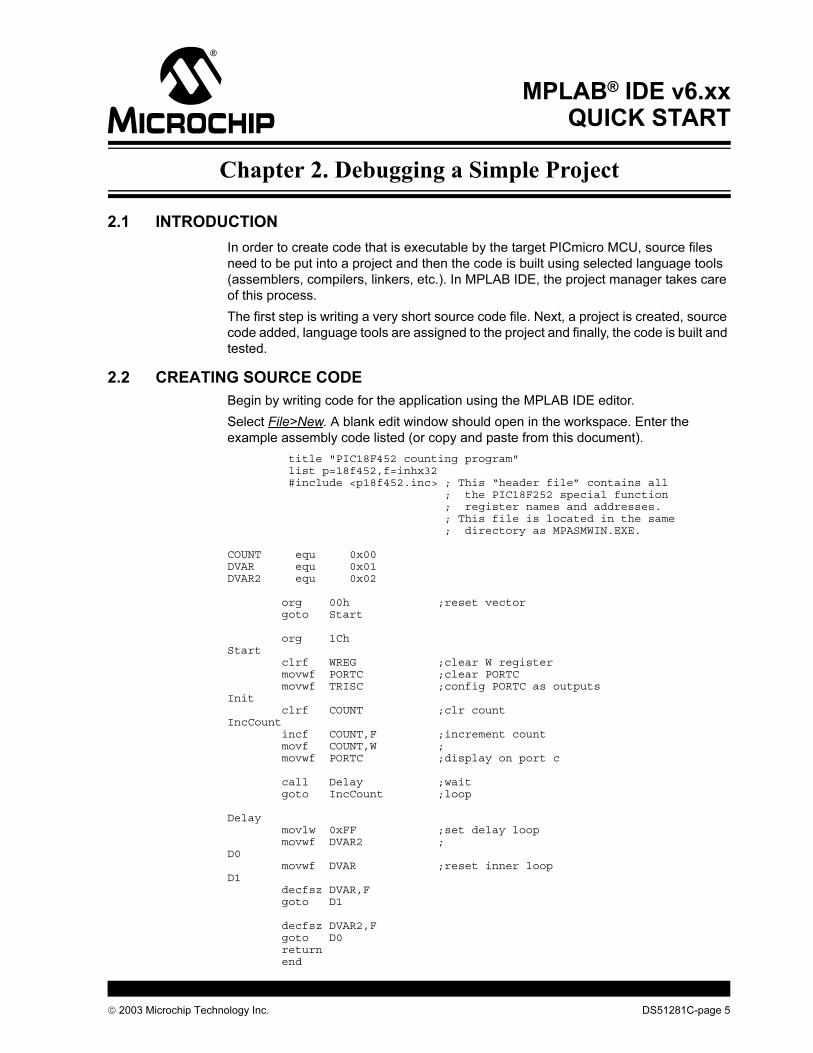
2.2 CREATING SOURCE CODE
Begin by writing code for the application using the MPLAB IDE editor.
Select File>New. A blank edit window should open in the workspace. Enter the
example assembly code listed (or copy and paste from this document).
title "PIC18F452 counting program" list p=18f452,f=inhx32 #include <p18f452.inc> ; This “header file” contains all ; the PIC18F252 special function ; register names and addresses. ; This file is located in the same ; directory as MPASMWIN.EXE.
COUNT equ 0x00DVAR equ 0x01DVAR2 equ 0x02
org 00h ;reset vector goto Start
org 1ChStart clrf WREG ;clear W register movwf PORTC ;clear PORTC movwf TRISC ;config PORTC as outputsInit clrf COUNT ;clr countIncCount incf COUNT,F ;increment count movf COUNT,W ; movwf PORTC ;display on port c
call Delay ;wait goto IncCount ;loop
Delay movlw 0xFF ;set delay loop movwf DVAR2 ;D0 movwf DVAR ;reset inner loopD1 decfsz DVAR,F goto D1
decfsz DVAR2,F goto D0 return end
2003 Microchip Technology Inc. DS51281C-page 5
MPLAB® IDE v6.xx Quick Start
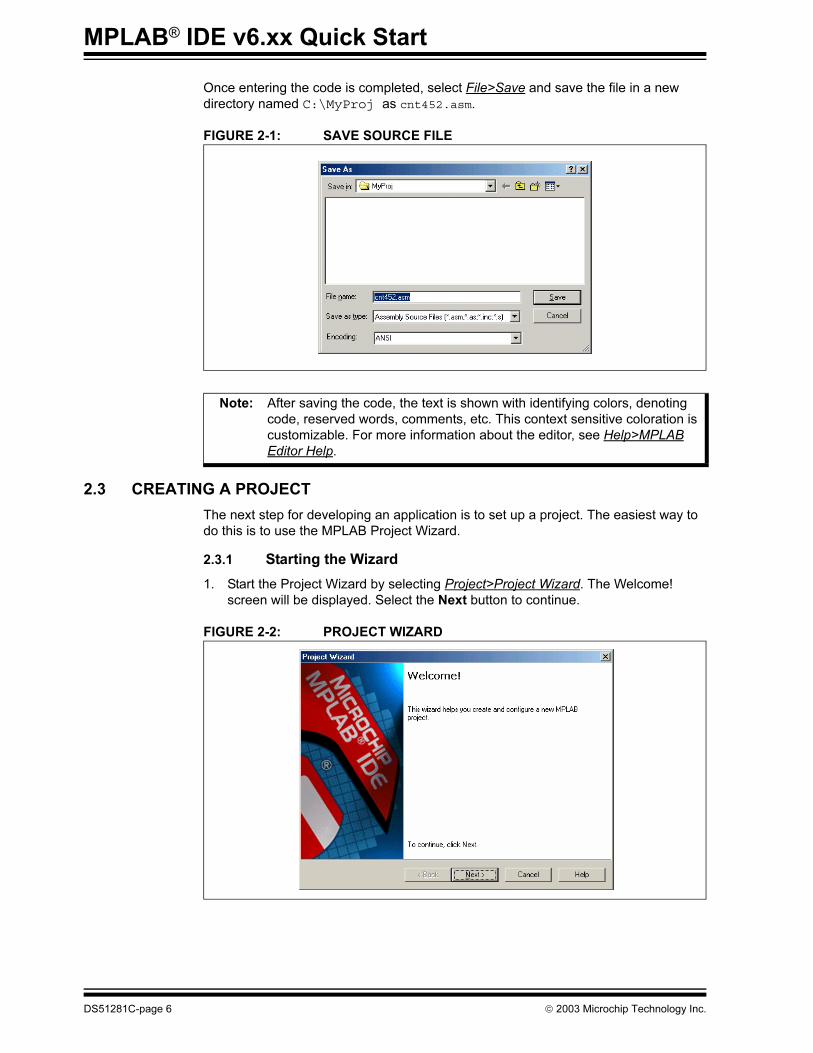
Once entering the code is completed, select File>Save and save the file in a new
directory named C:\MyProj as cnt452.asm.
FIGURE 2-1: SAVE SOURCE FILE
2.3 CREATING A PROJECT
The next step for developing an application is to set up a project. The easiest way to
do this is to use the MPLAB Project Wizard.
2.3.1 Starting the Wizard
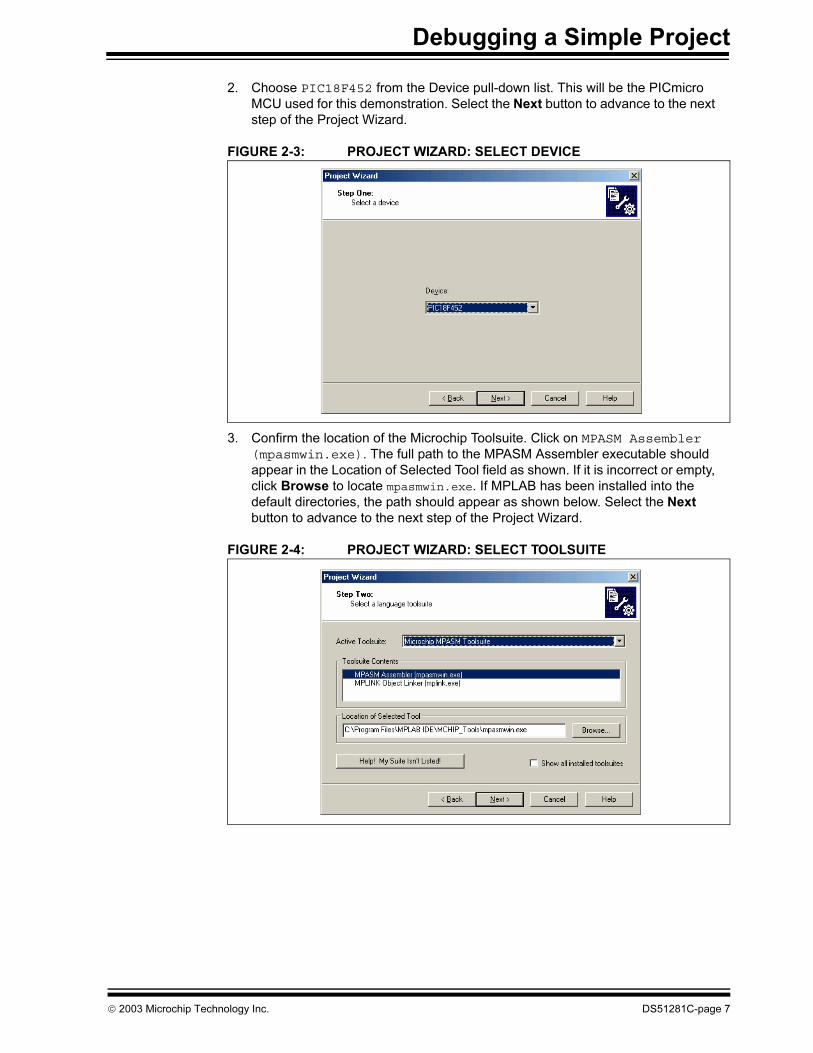
1. Start the Project Wizard by selecting Project>Project Wizard. The Welcome!
screen will be displayed. Select the Next button to continue.
FIGURE 2-2: PROJECT WIZARD
Note: After saving the code, the text is shown with identifying colors, denoting
code, reserved words, comments, etc. This context sensitive coloration is
customizable. For more information about the editor, see Help>MPLAB
Editor Help.
DS51281C-page 6 2003 Microchip Technology Inc.
Debugging a Simple Project
2. Choose PIC18F452 from the Device pull-down list. This will be the PICmicro
MCU used for this demonstration. Select the Next button to advance to the next
step of the Project Wizard.
FIGURE 2-3: PROJECT WIZARD: SELECT DEVICE
3. Confirm the location of the Microchip Toolsuite. Click on MPASM Assembler (mpasmwin.exe). The full path to the MPASM Assembler executable should
appear in the Location of Selected Tool field as shown. If it is incorrect or empty,
click Browse to locate mpasmwin.exe. If MPLAB has been installed into the
default directories, the path should appear as shown below. Select the Next
button to advance to the next step of the Project Wizard.
FIGURE 2-4: PROJECT WIZARD: SELECT TOOLSUITE
2003 Microchip Technology Inc. DS51281C-page 7
MPLAB® IDE v6.xx Quick Start
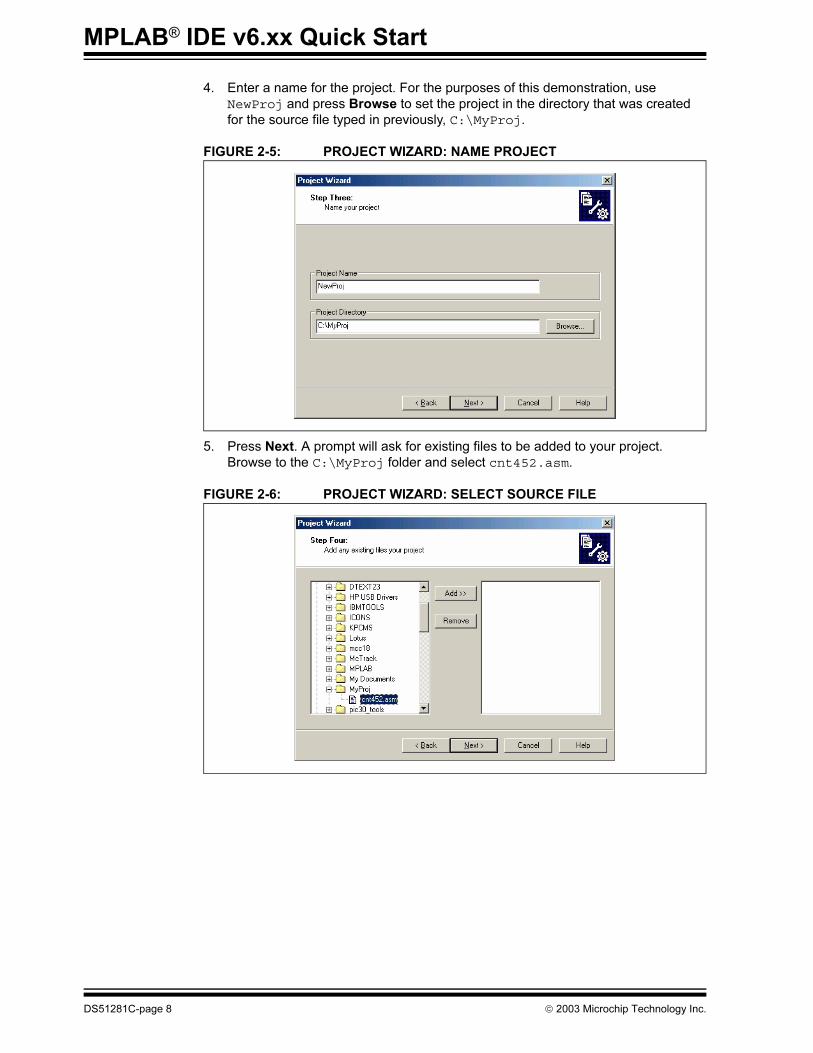
4. Enter a name for the project. For the purposes of this demonstration, use
NewProj and press Browse to set the project in the directory that was created
for the source file typed in previously, C:\MyProj.
FIGURE 2-5: PROJECT WIZARD: NAME PROJECT
5. Press Next. A prompt will ask for existing files to be added to your project.
Browse to the C:\MyProj folder and select cnt452.asm.
FIGURE 2-6: PROJECT WIZARD: SELECT SOURCE FILE
DS51281C-page 8 2003 Microchip Technology Inc.
Debugging a Simple Project
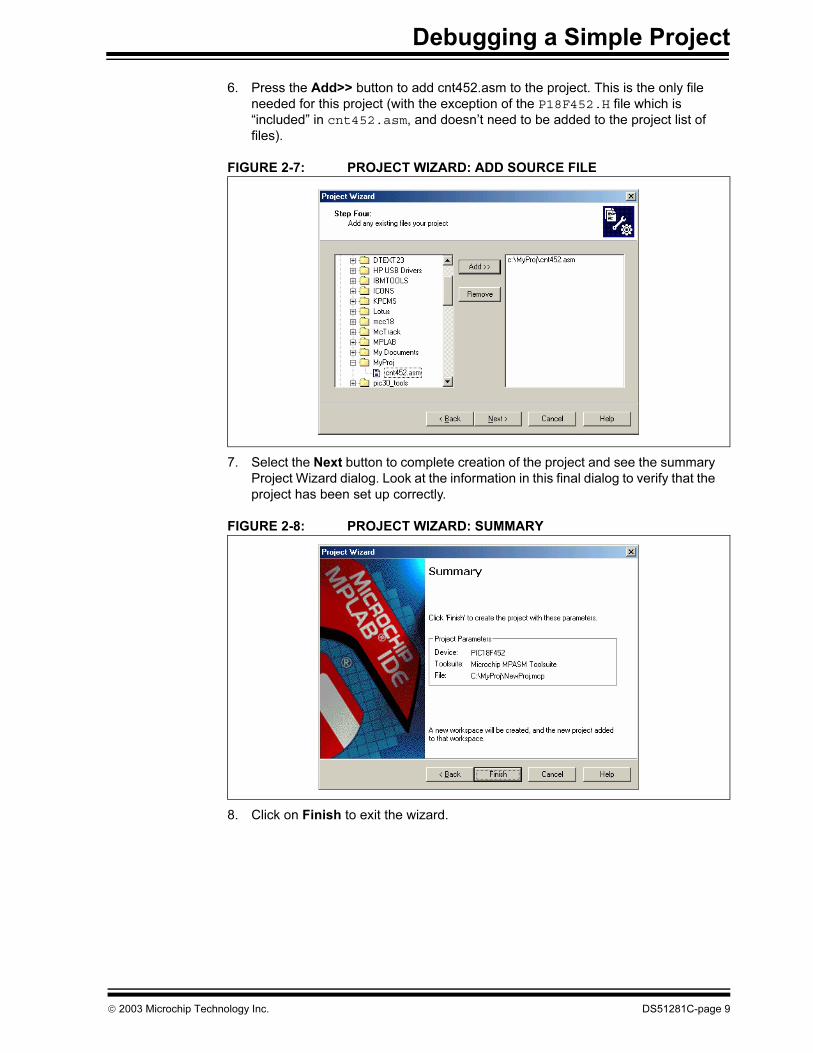
6. Press the Add>> button to add cnt452.asm to the project. This is the only file
needed for this project (with the exception of the P18F452.H file which is
“included” in cnt452.asm, and doesn’t need to be added to the project list of
files).
FIGURE 2-7: PROJECT WIZARD: ADD SOURCE FILE
7. Select the Next button to complete creation of the project and see the summary
Project Wizard dialog. Look at the information in this final dialog to verify that the
project has been set up correctly.
FIGURE 2-8: PROJECT WIZARD: SUMMARY
8. Click on Finish to exit the wizard.
2003 Microchip Technology Inc. DS51281C-page 9
MPLAB® IDE v6.xx Quick Start
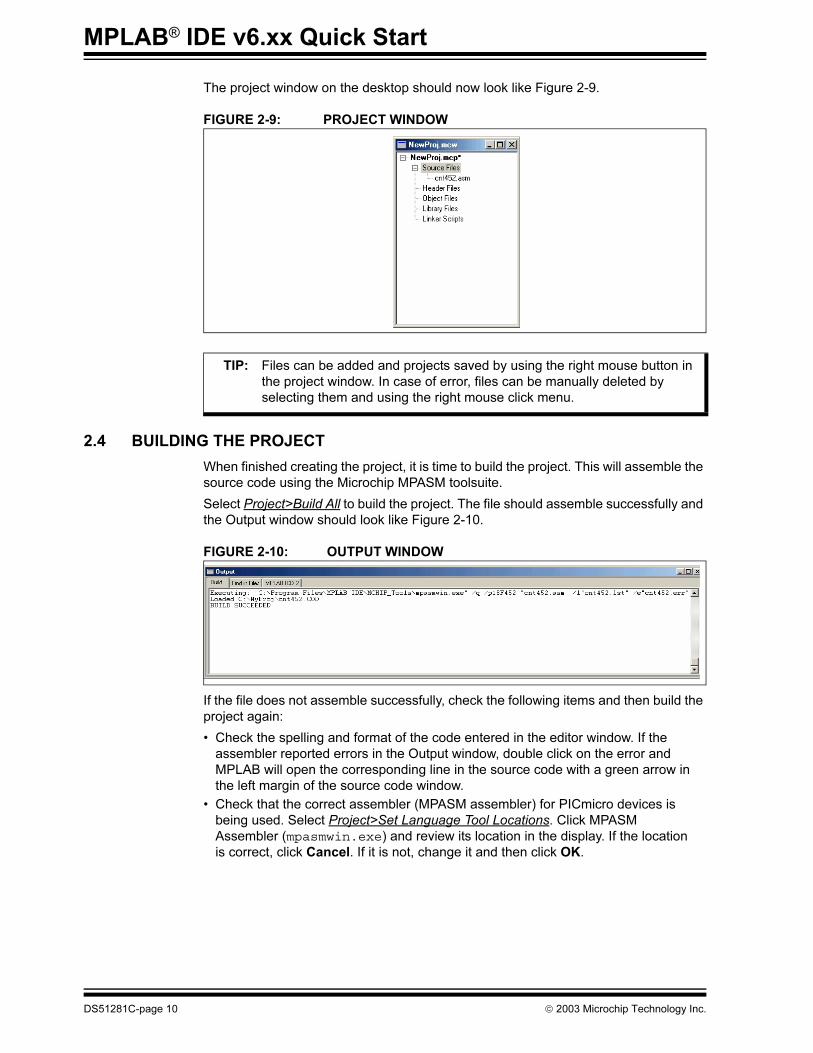
The project window on the desktop should now look like Figure 2-9.
FIGURE 2-9: PROJECT WINDOW
2.4 BUILDING THE PROJECT
When finished creating the project, it is time to build the project. This will assemble the
source code using the Microchip MPASM toolsuite.
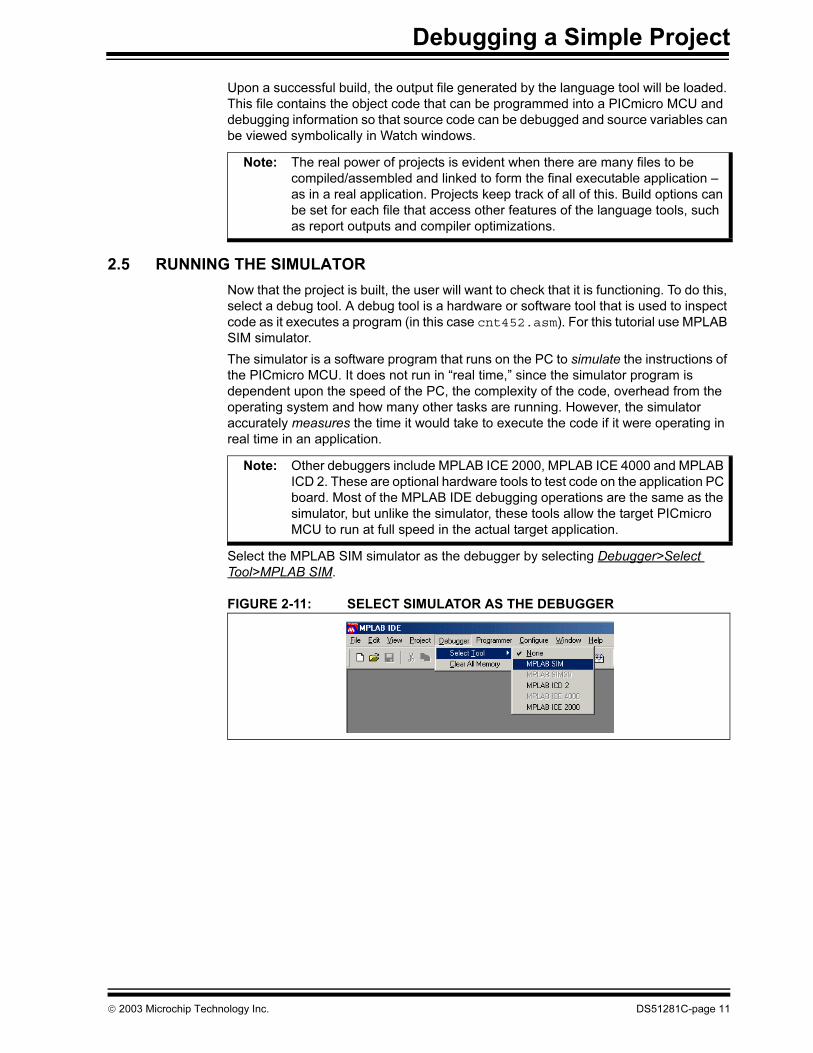
Select Project>Build All to build the project. The file should assemble successfully and
the Output window should look like Figure 2-10.
FIGURE 2-10: OUTPUT WINDOW
If the file does not assemble successfully, check the following items and then build the
project again:
• Check the spelling and format of the code entered in the editor window. If the
assembler reported errors in the Output window, double click on the error and
MPLAB will open the corresponding line in the source code with a green arrow in
the left margin of the source code window.
• Check that the correct assembler (MPASM assembler) for PICmicro devices is
being used. Select Project>Set Language Tool Locations. Click MPASM
Assembler (mpasmwin.exe) and review its location in the display. If the location
is correct, click Cancel. If it is not, change it and then click OK.
TIP: Files can be added and projects saved by using the right mouse button in
the project window. In case of error, files can be manually deleted by
selecting them and using the right mouse click menu.
DS51281C-page 10 2003 Microchip Technology Inc.
Debugging a Simple Project
Upon a successful build, the output file generated by the language tool will be loaded.
This file contains the object code that can be programmed into a PICmicro MCU and
debugging information so that source code can be debugged and source variables can
be viewed symbolically in Watch windows.
2.5 RUNNING THE SIMULATOR
Now that the project is built, the user will want to check that it is functioning. To do this,
select a debug tool. A debug tool is a hardware or software tool that is used to inspect
code as it executes a program (in this case cnt452.asm). For this tutorial use MPLAB
SIM simulator.
The simulator is a software program that runs on the PC to simulate the instructions of
the PICmicro MCU. It does not run in “real time,” since the simulator program is
dependent upon the speed of the PC, the complexity of the code, overhead from the
operating system and how many other tasks are running. However, the simulator
accurately measures the time it would take to execute the code if it were operating in
real time in an application.
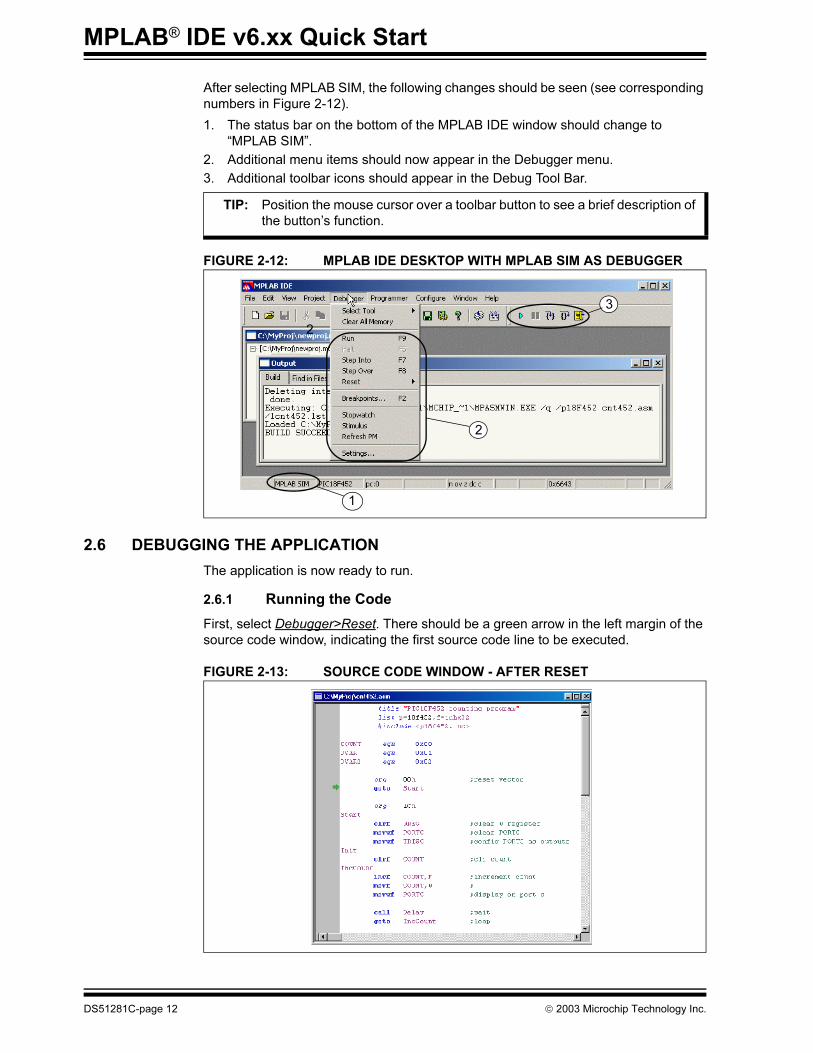
Select the MPLAB SIM simulator as the debugger by selecting Debugger>Select
Tool>MPLAB SIM.
FIGURE 2-11: SELECT SIMULATOR AS THE DEBUGGER
Note: The real power of projects is evident when there are many files to be
compiled/assembled and linked to form the final executable application –
as in a real application. Projects keep track of all of this. Build options can
be set for each file that access other features of the language tools, such
as report outputs and compiler optimizations.
Note: Other debuggers include MPLAB ICE 2000, MPLAB ICE 4000 and MPLAB
ICD 2. These are optional hardware tools to test code on the application PC
board. Most of the MPLAB IDE debugging operations are the same as the
simulator, but unlike the simulator, these tools allow the target PICmicro
MCU to run at full speed in the actual target application.
2003 Microchip Technology Inc. DS51281C-page 11
MPLAB® IDE v6.xx Quick Start
After selecting MPLAB SIM, the following changes should be seen (see corresponding
numbers in Figure 2-12).
1. The status bar on the bottom of the MPLAB IDE window should change to
“MPLAB SIM”.
2. Additional menu items should now appear in the Debugger menu.
3. Additional toolbar icons should appear in the Debug Tool Bar.
FIGURE 2-12: MPLAB IDE DESKTOP WITH MPLAB SIM AS DEBUGGER
2.6 DEBUGGING THE APPLICATION
The application is now ready to run.
2.6.1 Running the Code
First, select Debugger>Reset. There should be a green arrow in the left margin of the
source code window, indicating the first source code line to be executed.
FIGURE 2-13: SOURCE CODE WINDOW - AFTER RESET
TIP: Position the mouse cursor over a toolbar button to see a brief description of
the button’s function.
2
3
2
1
DS51281C-page 12 2003 Microchip Technology Inc.
Debugging a Simple Project
Select Debugger>Run to run the application. A text message “Running…” will appear
on the status bar.
To halt program execution, select Debugger>Halt. The line of code where the
application halted will be indicated by the green arrow.
To single step through the application program, select Debugger>Step Into. This will
execute the currently indicated line of code and move the arrow to the next line of code
to be executed.
There are shortcuts for these commonly used functions in the Debug Tool Bar.
FIGURE 2-14: DEBUG SHORT CUT ICONS
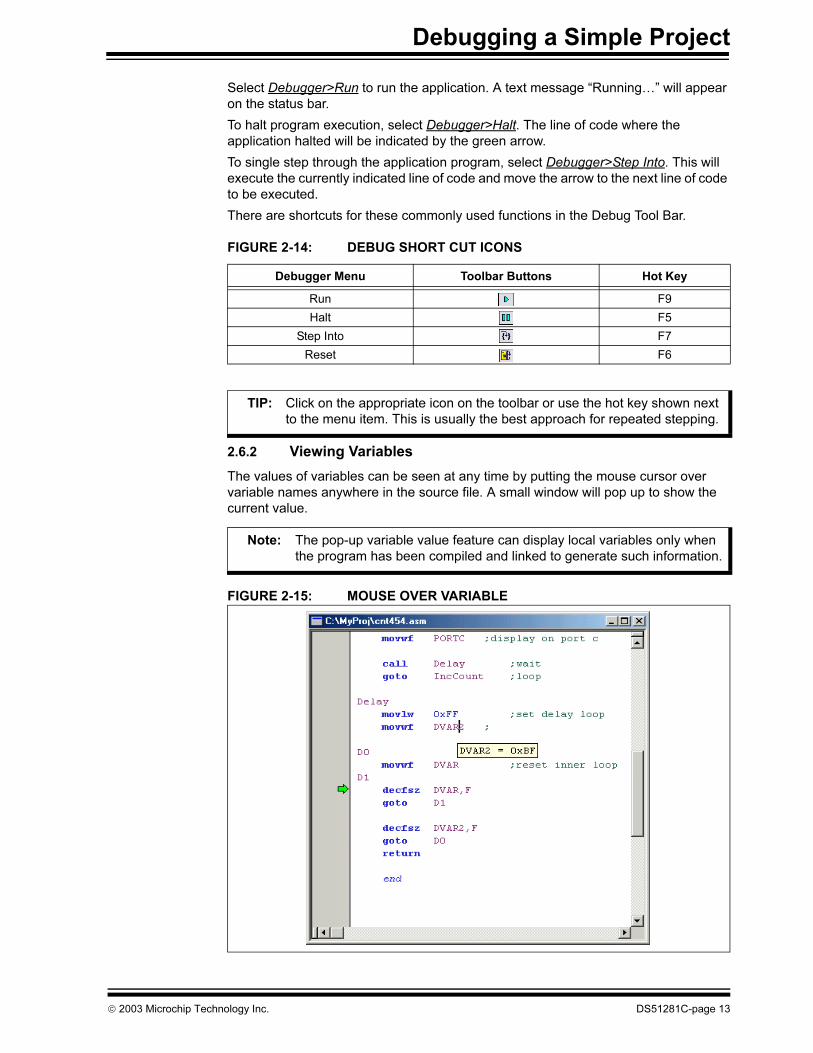
2.6.2 Viewing Variables
The values of variables can be seen at any time by putting the mouse cursor over
variable names anywhere in the source file. A small window will pop up to show the
current value.
FIGURE 2-15: MOUSE OVER VARIABLE
Debugger Menu Toolbar Buttons Hot Key
Run F9
Halt F5
Step Into F7
Reset F6
TIP: Click on the appropriate icon on the toolbar or use the hot key shown next
to the menu item. This is usually the best approach for repeated stepping.
Note: The pop-up variable value feature can display local variables only when
the program has been compiled and linked to generate such information.
2003 Microchip Technology Inc. DS51281C-page 13
MPLAB® IDE v6.xx Quick Start
2.6.3 Watch Windows
Users often want to watch certain key variables all the time. Rather than floating the
mouse cursor over the name each time to see the value, a watch window can be
opened. The watch window will remain on the screen and show the current variable
values. Watch windows may be found under the View menu.
1. Select View>Watch to open a new Watch window.
2. Select PORTC from the SFR selection box at the top of the window. Click Add SFR
to add it to the Watch window list. To quickly advance through the list, start typing
PORTC after selecting the pull down icon.
3. Select COUNT from the symbol selection box at the top of the window. Click Add
Symbol to add it to the Watch window list.
4. Symbols can be entered directly or selected from the pull down menu. To enter
directly, move the cursor down to the next blank line and type “DVAR” then press
Enter. Or select DVAR from the pull down symbol selection box at the top of the
window. Click Add Symbol to add it to the Watch window list.
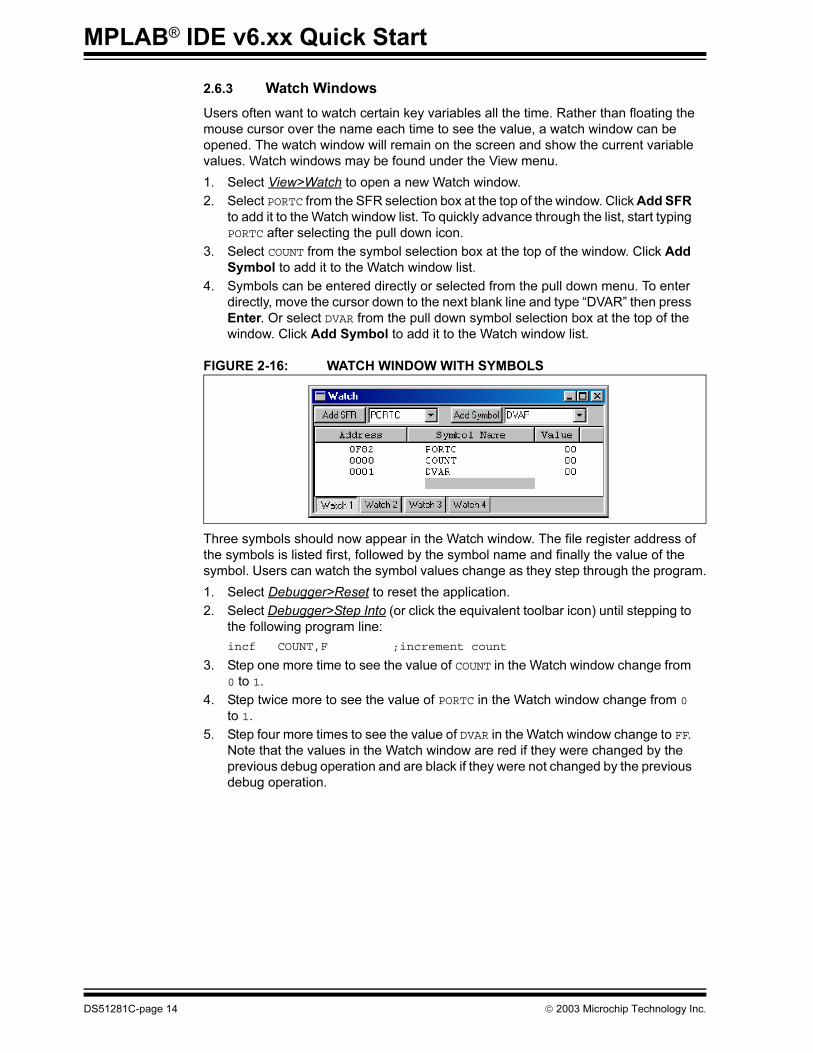
FIGURE 2-16: WATCH WINDOW WITH SYMBOLS
Three symbols should now appear in the Watch window. The file register address of
the symbols is listed first, followed by the symbol name and finally the value of the
symbol. Users can watch the symbol values change as they step through the program.
1. Select Debugger>Reset to reset the application.
2. Select Debugger>Step Into (or click the equivalent toolbar icon) until stepping to
the following program line:
incf COUNT,F ;increment count
3. Step one more time to see the value of COUNT in the Watch window change from
0 to 1.
4. Step twice more to see the value of PORTC in the Watch window change from 0
to 1.
5. Step four more times to see the value of DVAR in the Watch window change to FF.
Note that the values in the Watch window are red if they were changed by the
previous debug operation and are black if they were not changed by the previous
debug operation.
DS51281C-page 14 2003 Microchip Technology Inc.
Debugging a Simple Project
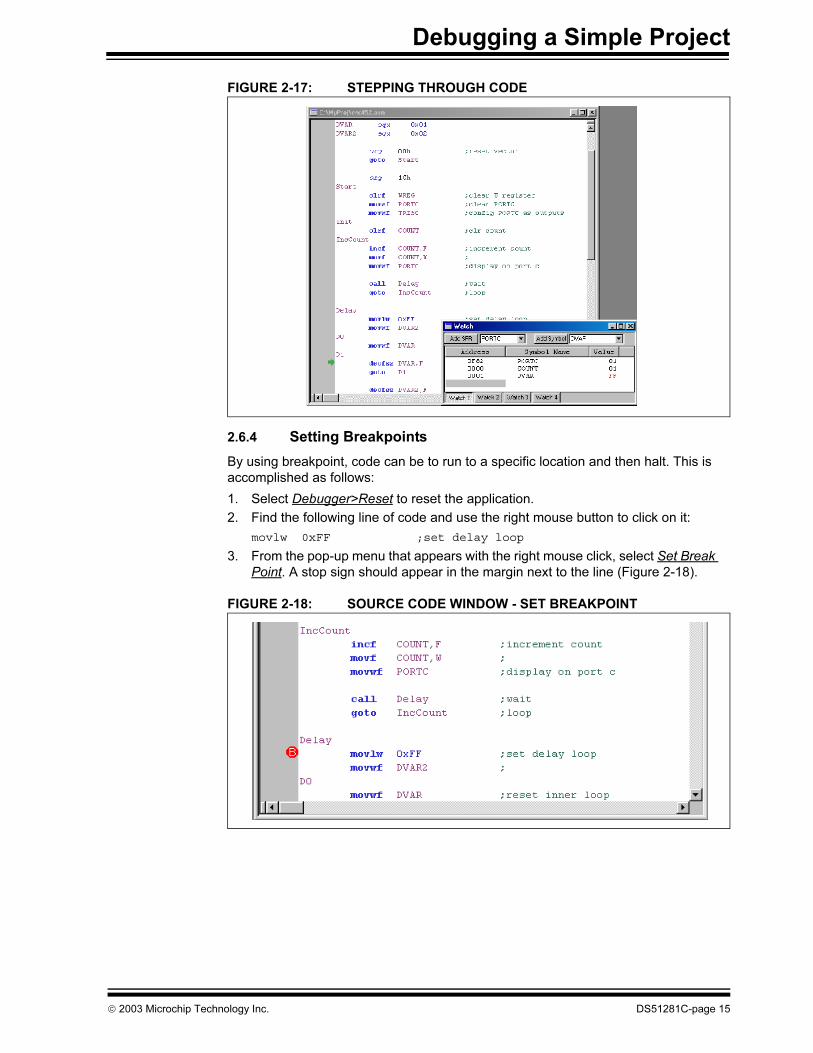
FIGURE 2-17: STEPPING THROUGH CODE
2.6.4 Setting Breakpoints
By using breakpoint, code can be to run to a specific location and then halt. This is
accomplished as follows:
1. Select Debugger>Reset to reset the application.
2. Find the following line of code and use the right mouse button to click on it:
movlw 0xFF ;set delay loop
3. From the pop-up menu that appears with the right mouse click, select Set Break
Point. A stop sign should appear in the margin next to the line (Figure 2-18).
FIGURE 2-18: SOURCE CODE WINDOW - SET BREAKPOINT
2003 Microchip Technology Inc. DS51281C-page 15
MPLAB® IDE v6.xx Quick Start
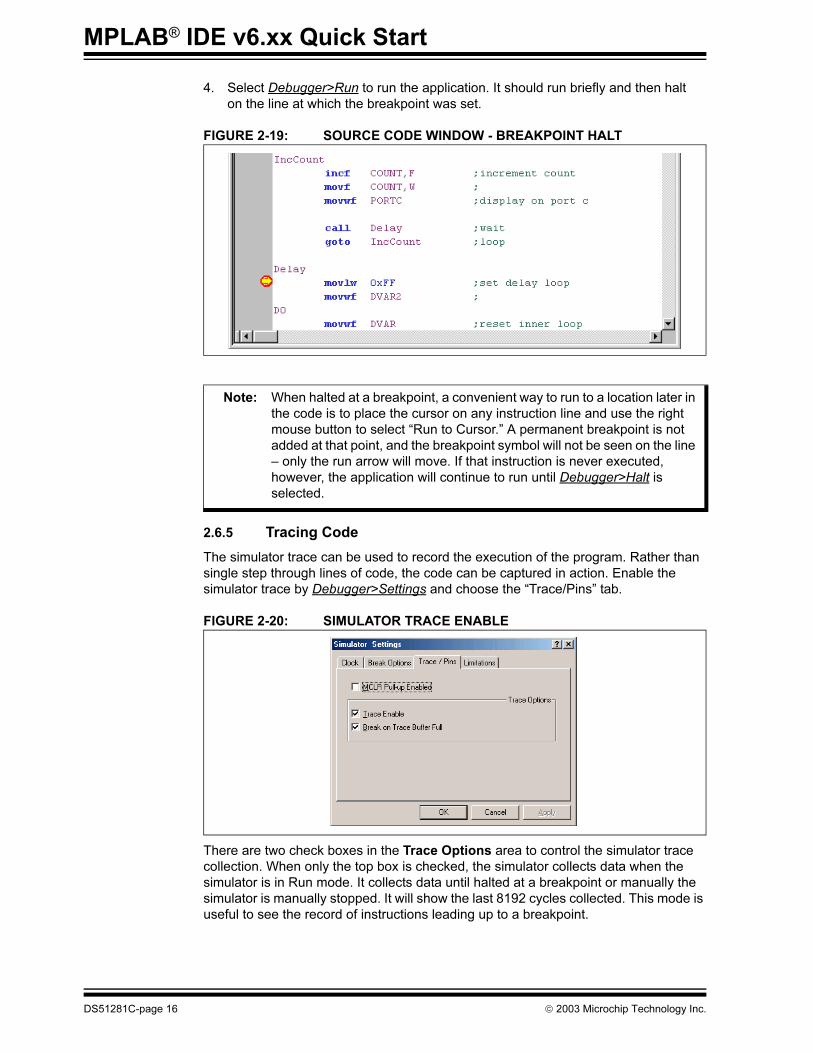
4. Select Debugger>Run to run the application. It should run briefly and then halt
on the line at which the breakpoint was set.
FIGURE 2-19: SOURCE CODE WINDOW - BREAKPOINT HALT
2.6.5 Tracing Code
The simulator trace can be used to record the execution of the program. Rather than
single step through lines of code, the code can be captured in action. Enable the
simulator trace by Debugger>Settings and choose the “Trace/Pins” tab.
FIGURE 2-20: SIMULATOR TRACE ENABLE
There are two check boxes in the Trace Options area to control the simulator trace
collection. When only the top box is checked, the simulator collects data when the
simulator is in Run mode. It collects data until halted at a breakpoint or manually the
simulator is manually stopped. It will show the last 8192 cycles collected. This mode is
useful to see the record of instructions leading up to a breakpoint.
Note: When halted at a breakpoint, a convenient way to run to a location later in
the code is to place the cursor on any instruction line and use the right
mouse button to select “Run to Cursor.” A permanent breakpoint is not
added at that point, and the breakpoint symbol will not be seen on the line
– only the run arrow will move. If that instruction is never executed,
however, the application will continue to run until Debugger>Halt is
selected.
DS51281C-page 16 2003 Microchip Technology Inc.
Debugging a Simple Project
If the second button is also checked, then the trace memory will collect 8192 cycles of
data then stop collecting and halt the application at a breakpoint. This mode is useful
for seeing the record of instructions after pressing run.
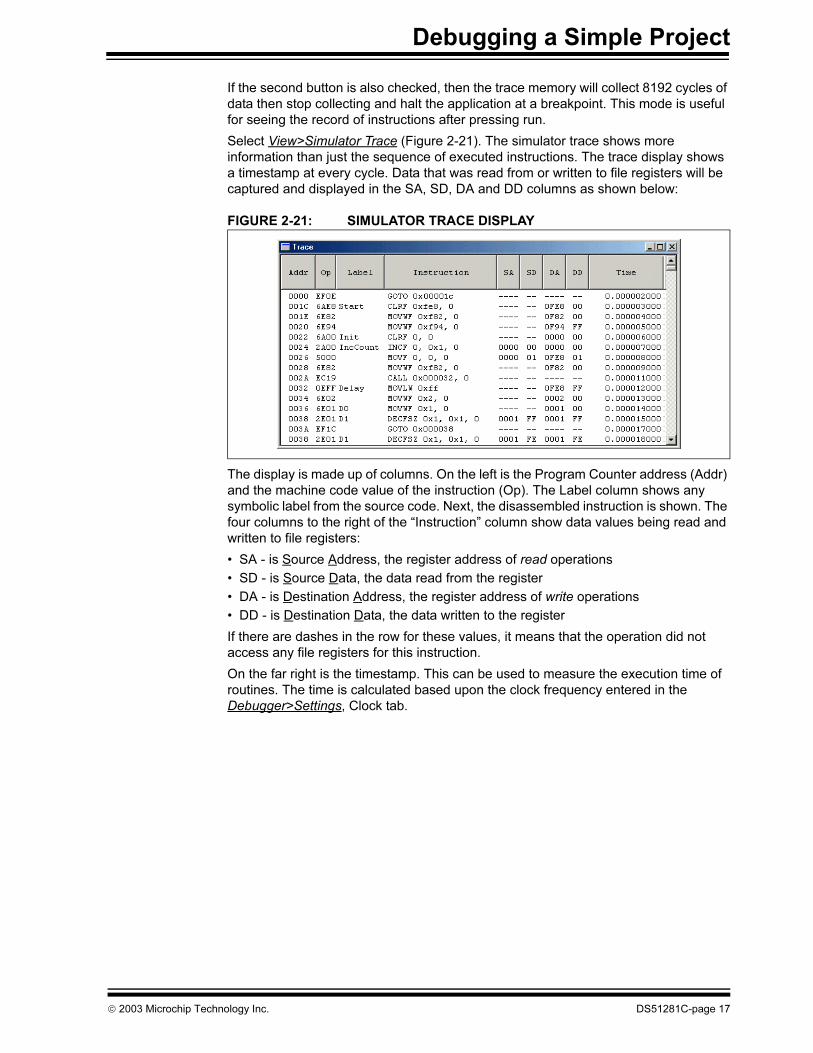
Select View>Simulator Trace (Figure 2-21). The simulator trace shows more
information than just the sequence of executed instructions. The trace display shows
a timestamp at every cycle. Data that was read from or written to file registers will be
captured and displayed in the SA, SD, DA and DD columns as shown below:
FIGURE 2-21: SIMULATOR TRACE DISPLAY
The display is made up of columns. On the left is the Program Counter address (Addr)
and the machine code value of the instruction (Op). The Label column shows any
symbolic label from the source code. Next, the disassembled instruction is shown. The
four columns to the right of the “Instruction” column show data values being read and
written to file registers:
• SA - is Source Address, the register address of read operations
• SD - is Source Data, the data read from the register
• DA - is Destination Address, the register address of write operations
• DD - is Destination Data, the data written to the register
If there are dashes in the row for these values, it means that the operation did not
access any file registers for this instruction.
On the far right is the timestamp. This can be used to measure the execution time of
routines. The time is calculated based upon the clock frequency entered in the
Debugger>Settings, Clock tab.
2003 Microchip Technology Inc. DS51281C-page 17
MPLAB® IDE v6.xx Quick Start
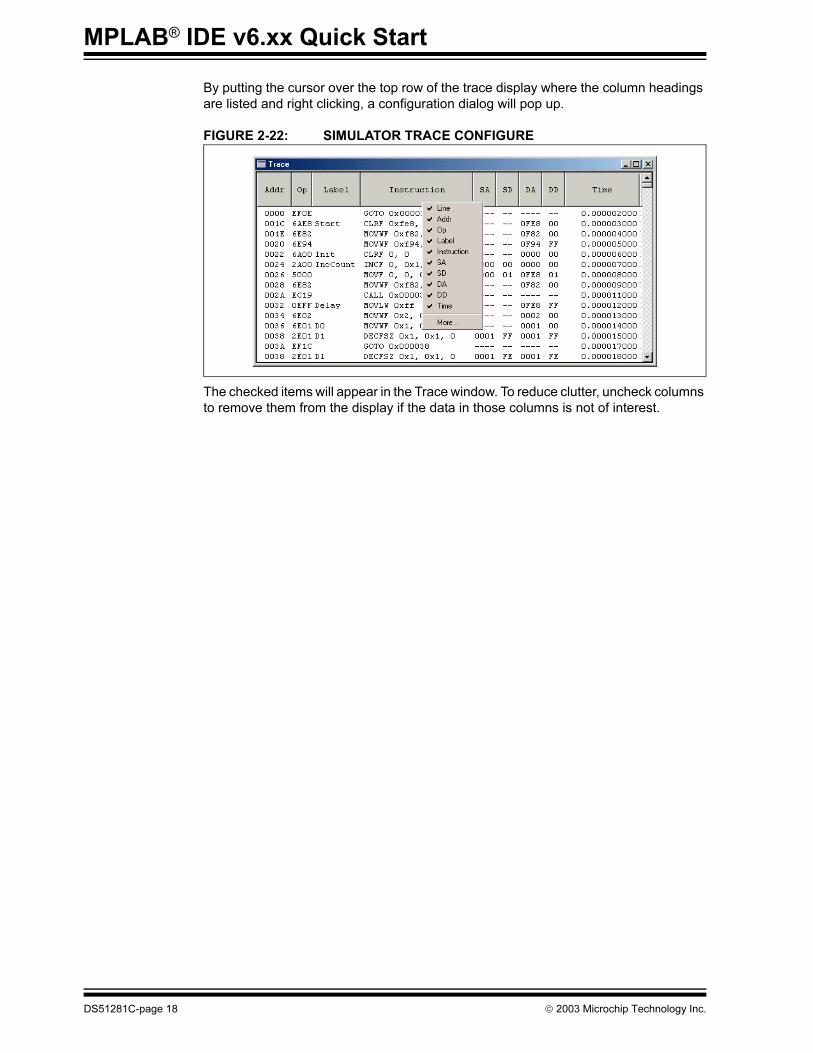
By putting the cursor over the top row of the trace display where the column headings
are listed and right clicking, a configuration dialog will pop up.
FIGURE 2-22: SIMULATOR TRACE CONFIGURE
The checked items will appear in the Trace window. To reduce clutter, uncheck columns
to remove them from the display if the data in those columns is not of interest.
DS51281C-page 18 2003 Microchip Technology Inc.
MPLAB® IDE v6.xxQUICK START
Chapter 3. Next Steps
3.1 INTRODUCTION
For on-line tutorials, look under the Help menu of MPLAB IDE. Much of the
documentation for MPLAB IDE and its components is available on line, part of the help
system of MPLAB IDE. The following sections will point out some of the features that
were not covered in the project tutorial, but which may be areas of interest.
3.2 PROGRAMMING A DEVICE
Once the application code is running as desired, the next step is to program an actual
device. If you have a PIC18F452 device and one of the following programmers, the
example code can be programmed into the device:
• MPLAB ICD 2
• PICSTART Plus Development Programmer
• PRO MATE II Device Programmer
To select and set up the programmer, do the following:
1. Select Programmer>Select Programmer, and select the desired programmer.
The Programmer menu items will change appropriately for the selected tool, and
toolbar items will be added.
2. Establish communications with the programmer. For the PICSTART Plus or
PRO MATE II, select Programmer>Enable Programmer. For the MPLAB ICD 2,
select Programmer>Connect.
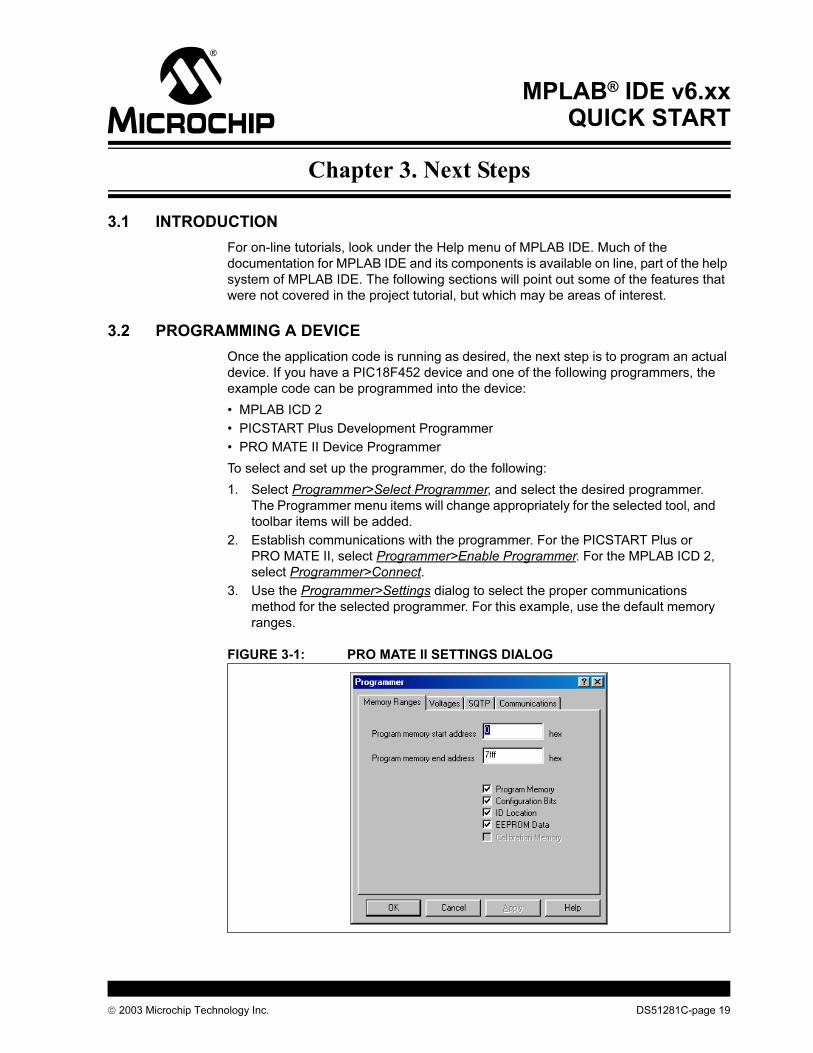
3. Use the Programmer>Settings dialog to select the proper communications
method for the selected programmer. For this example, use the default memory
ranges.
FIGURE 3-1: PRO MATE II SETTINGS DIALOG
2003 Microchip Technology Inc. DS51281C-page 19

MPLAB® IDE v6.xx Quick Start
4. Specify the configuration bits. If using this tutorial, the default configuration bit
settings are fine. If using an application of your own, specify the configuration bits
setting in the source code (recommended), or set them manually by using the
Configuration Bits window, invoked by selecting Configure>Configuration Bits.
5. Click Programmer>Program to program the information currently loaded in the
MPLAB IDE into the device. The operation progress is indicated in the status bar.
Results will be displayed in the Output window under the programmer tab, e.g.,
for PRO MATE II:
PRO MATE Error Log File
Programming
31-May-2002. 13:06:19
Device Type: PIC18F452
Programming/Verification Successful!
When the device is programmed, it is also automatically verified. To perform an extra
verification that the device programmed correctly, click Programmer>Verify.
3.3 DEBUGGING WITH ADVANCED SIMULATOR FEATURES
There are other characteristics of the simulator that can be configured from MPLAB
IDE dialogs.
3.3.1 Configuration Bits Settings
Normally, the default condition of the configuration bits has the Watchdog Timer (WDT)
enabled. This will cause the simulator to reset when the internal WDT times out.
• Select Configure>Configuration Bits to bring up this dialog.
• Click on the Setting item to change the Watchdog Timer to Disabled.
FIGURE 3-2: DISABLE THE WATCHDOG TIMER
TIP: If setting configuration bits in your source code, they will affect the debugger
operation. For example, if the source code specifies the oscillator
configuration, then the debugger will use that oscillator configuration.
DS51281C-page 20 2003 Microchip Technology Inc.
Next Steps
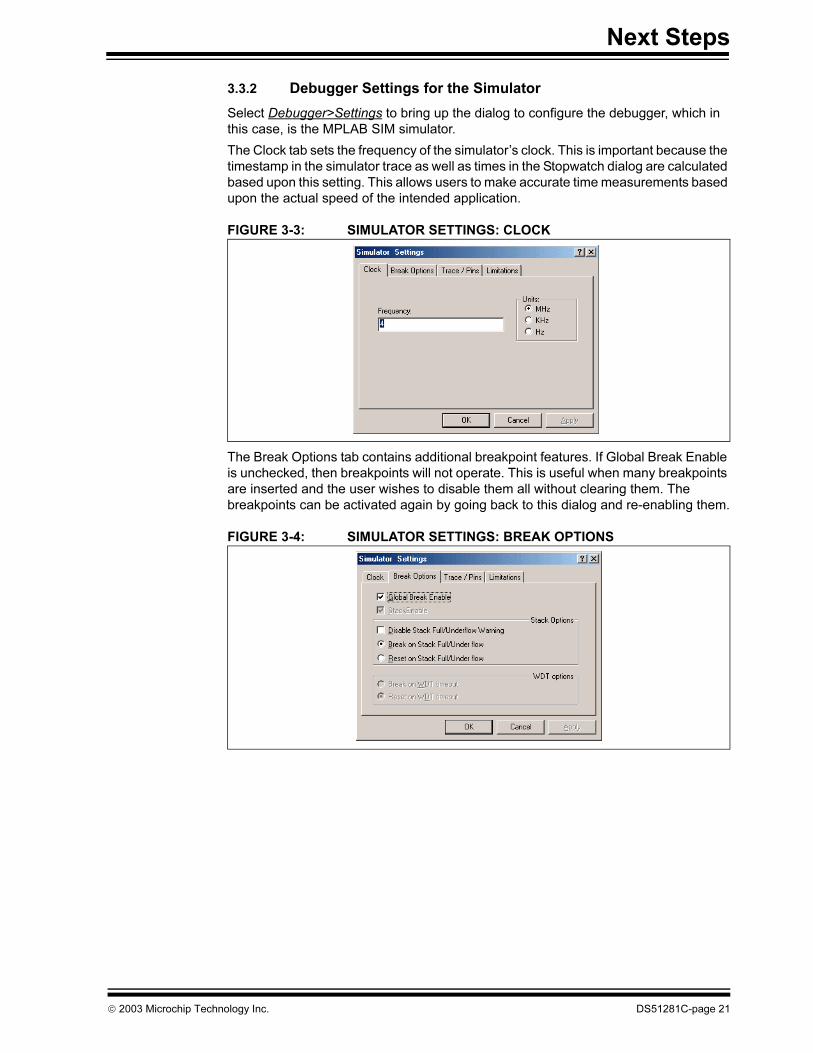
3.3.2 Debugger Settings for the Simulator
Select Debugger>Settings to bring up the dialog to configure the debugger, which in
this case, is the MPLAB SIM simulator.
The Clock tab sets the frequency of the simulator’s clock. This is important because the
timestamp in the simulator trace as well as times in the Stopwatch dialog are calculated
based upon this setting. This allows users to make accurate time measurements based
upon the actual speed of the intended application.
FIGURE 3-3: SIMULATOR SETTINGS: CLOCK
The Break Options tab contains additional breakpoint features. If Global Break Enable
is unchecked, then breakpoints will not operate. This is useful when many breakpoints
are inserted and the user wishes to disable them all without clearing them. The
breakpoints can be activated again by going back to this dialog and re-enabling them.
FIGURE 3-4: SIMULATOR SETTINGS: BREAK OPTIONS
2003 Microchip Technology Inc. DS51281C-page 21
MPLAB® IDE v6.xx Quick Start
3.4 ACCESSING MPLAB IDE ON-LINE HELP
MPLAB IDE comes with extensive on-line help, which is constantly being expanded. If
questions arise while using MPLAB IDE, be sure to check here for answers. Most
importantly, the on-line help lists the support limitations that exist for a particular tool in
its support of a particular device. Always try to review this section before working with
a new device/tool combination.
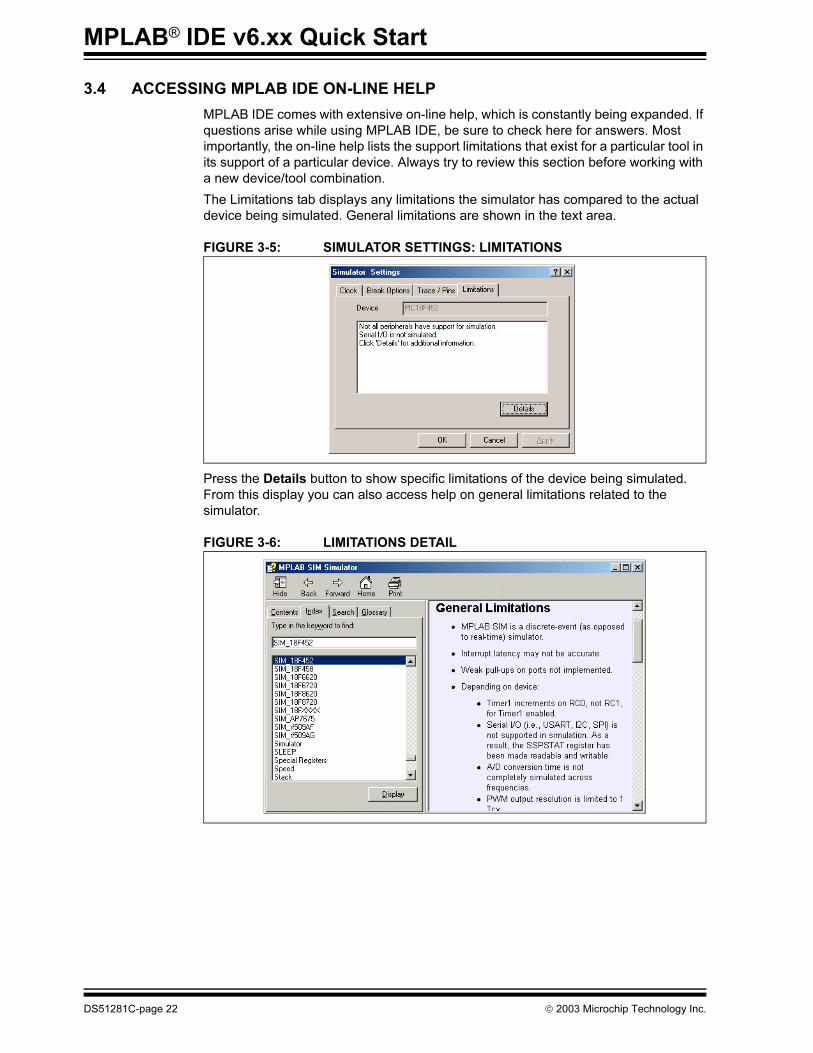
The Limitations tab displays any limitations the simulator has compared to the actual
device being simulated. General limitations are shown in the text area.
FIGURE 3-5: SIMULATOR SETTINGS: LIMITATIONS
Press the Details button to show specific limitations of the device being simulated.
From this display you can also access help on general limitations related to the
simulator.
FIGURE 3-6: LIMITATIONS DETAIL
DS51281C-page 22 2003 Microchip Technology Inc.
Next Steps
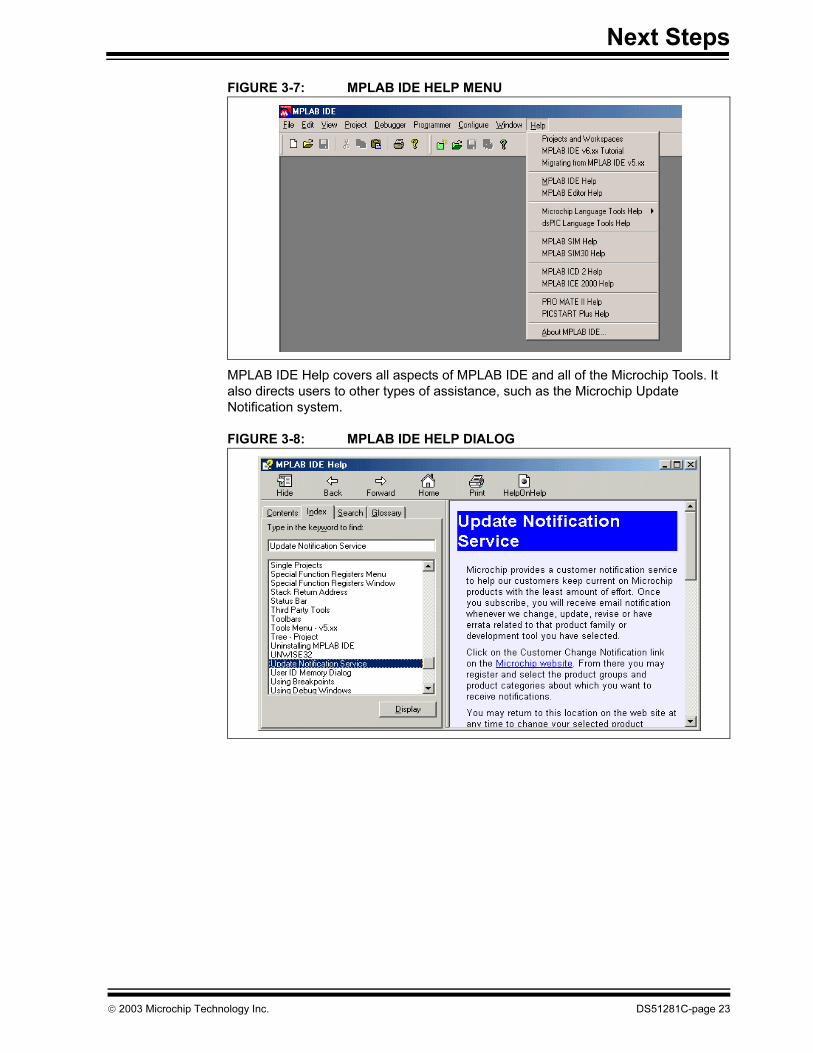
FIGURE 3-7: MPLAB IDE HELP MENU
MPLAB IDE Help covers all aspects of MPLAB IDE and all of the Microchip Tools. It
also directs users to other types of assistance, such as the Microchip Update
Notification system.
FIGURE 3-8: MPLAB IDE HELP DIALOG
2003 Microchip Technology Inc. DS51281C-page 23
MPLAB® IDE v6.xx Quick Start
3.5 CONFIGURING WORKSPACE AND PROJECT DEBUG SETTINGS
MPLAB IDE uses both workspaces and projects to help users manage their application
code development.
The MPLAB IDE workspace is the desktop area in the MPLAB IDE application window.
The workspace remembers which windows are open, which PICmicro device is
selected, which debugger and programmer is being used, and how the hardware tools
are connected to the PC. Generally, the workspace needs to be set up before starting
to make a project.
Projects are opened in the MPLAB IDE workspace and they contain the source files,
how to build them and which tools are used to build them. Projects are portable and
can be moved to different directories or to a different computer.
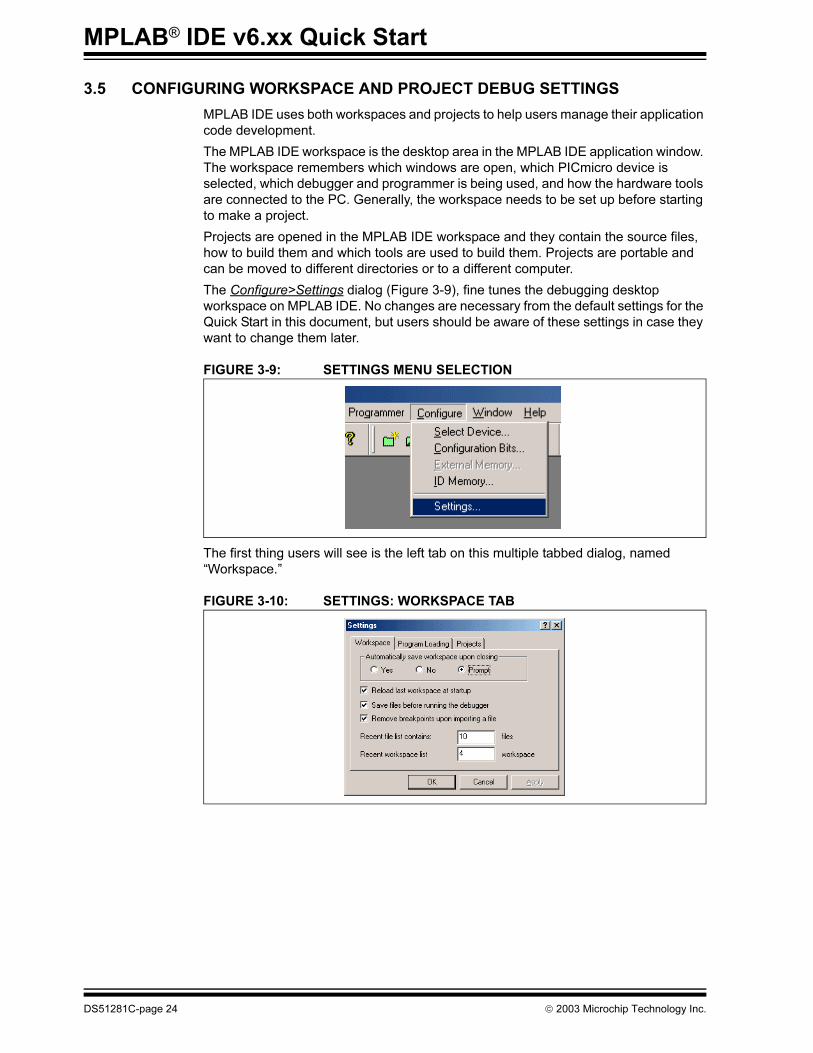
The Configure>Settings dialog (Figure 3-9), fine tunes the debugging desktop
workspace on MPLAB IDE. No changes are necessary from the default settings for the
Quick Start in this document, but users should be aware of these settings in case they
want to change them later.
FIGURE 3-9: SETTINGS MENU SELECTION
The first thing users will see is the left tab on this multiple tabbed dialog, named
“Workspace.”
FIGURE 3-10: SETTINGS: WORKSPACE TAB
DS51281C-page 24 2003 Microchip Technology Inc.
Next Steps
The Workspace tab on the Configure>Settings dialog allows users to:
• Reload their last workspace when entering MPLAB IDE. This is useful if users
want to continue working on a project where they last left off.
• Save all their text files before starting emulation or simulation. This ensures that
work will be saved and any changes are recompiled into the application before
debugging starts.
• Remove breakpoints when importing a HEX file. Typically this is the desired
action, but if for some reason, small changes to code are being made manually
and then reloaded into the HEX file, users may not want to clear all breakpoints.
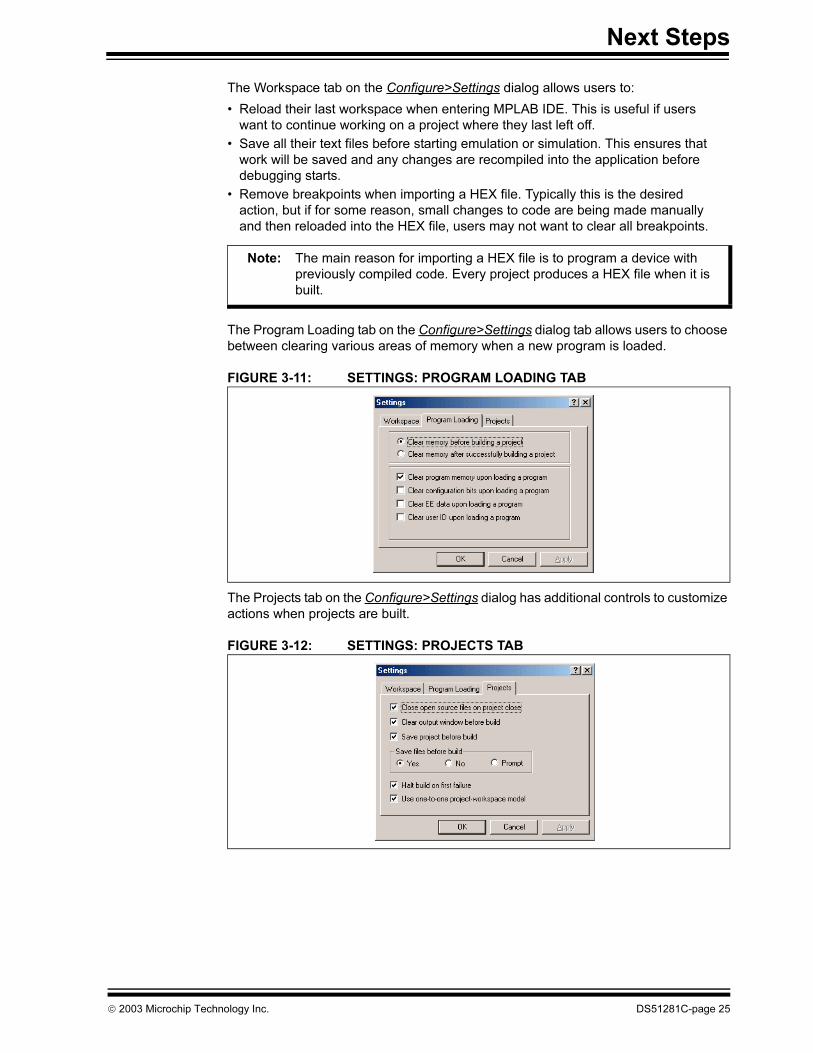
The Program Loading tab on the Configure>Settings dialog tab allows users to choose
between clearing various areas of memory when a new program is loaded.
FIGURE 3-11: SETTINGS: PROGRAM LOADING TAB
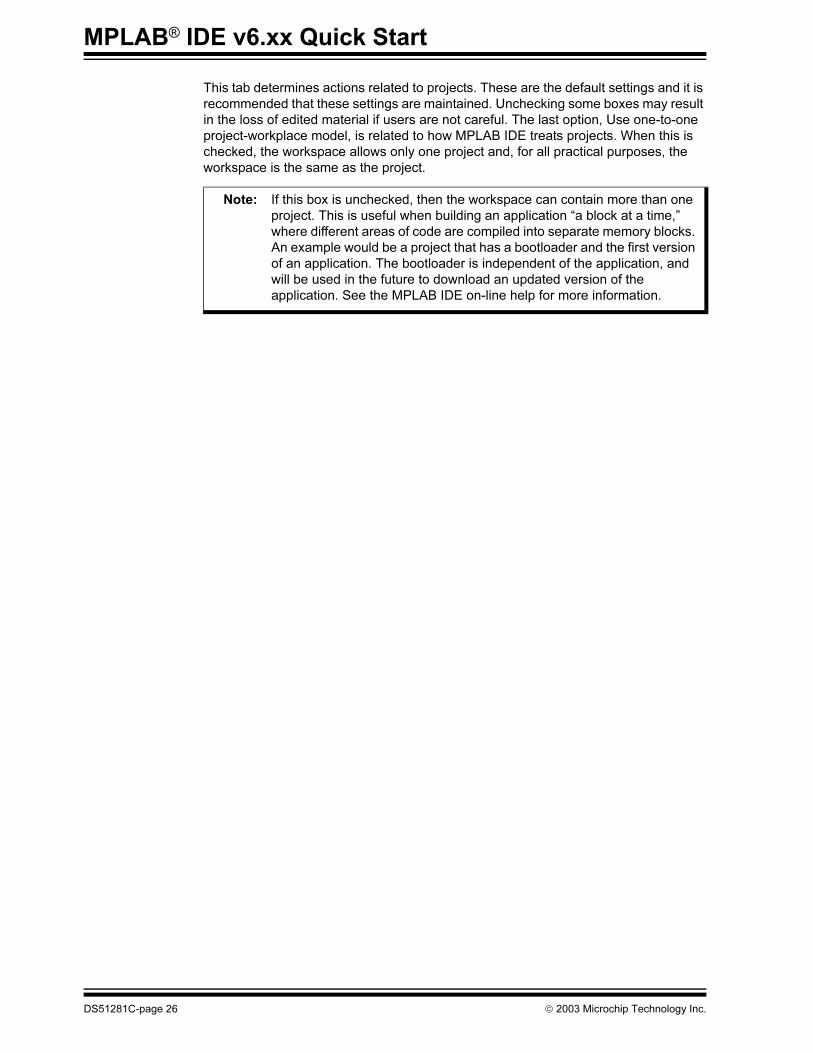
The Projects tab on the Configure>Settings dialog has additional controls to customize
actions when projects are built.
FIGURE 3-12: SETTINGS: PROJECTS TAB
Note: The main reason for importing a HEX file is to program a device with
previously compiled code. Every project produces a HEX file when it is
built.
2003 Microchip Technology Inc. DS51281C-page 25
MPLAB® IDE v6.xx Quick Start
This tab determines actions related to projects. These are the default settings and it is
recommended that these settings are maintained. Unchecking some boxes may result
in the loss of edited material if users are not careful. The last option, Use one-to-one
project-workplace model, is related to how MPLAB IDE treats projects. When this is
checked, the workspace allows only one project and, for all practical purposes, the
workspace is the same as the project.
Note: If this box is unchecked, then the workspace can contain more than one
project. This is useful when building an application “a block at a time,”
where different areas of code are compiled into separate memory blocks.
An example would be a project that has a bootloader and the first version
of an application. The bootloader is independent of the application, and
will be used in the future to download an updated version of the
application. See the MPLAB IDE on-line help for more information.
DS51281C-page 26 2003 Microchip Technology Inc.

Next Steps
NOTES:
2003 Microchip Technology Inc. DS51281C-page 27
DS51281C-page 28 2003 Microchip Technology Inc.
AMERICAS
Corporate Office2355 West Chandler Blvd.Chandler, AZ 85224-6199Tel: 480-792-7200 Fax: 480-792-7277Technical Support: 480-792-7627Web Address: http://www.microchip.com
Atlanta3780 Mansell Road, Suite 130Alpharetta, GA 30022Tel: 770-640-0034 Fax: 770-640-0307
Boston2 Lan Drive, Suite 120Westford, MA 01886Tel: 978-692-3848 Fax: 978-692-3821
Chicago333 Pierce Road, Suite 180Itasca, IL 60143Tel: 630-285-0071 Fax: 630-285-0075
Dallas4570 Westgrove Drive, Suite 160Addison, TX 75001Tel: 972-818-7423 Fax: 972-818-2924
DetroitTri-Atria Office Building 32255 Northwestern Highway, Suite 190Farmington Hills, MI 48334Tel: 248-538-2250 Fax: 248-538-2260
Kokomo2767 S. Albright Road Kokomo, IN 46902Tel: 765-864-8360 Fax: 765-864-8387
Los Angeles18201 Von Karman, Suite 1090Irvine, CA 92612Tel: 949-263-1888 Fax: 949-263-1338
Phoenix2355 West Chandler Blvd.Chandler, AZ 85224-6199Tel: 480-792-7966 Fax: 480-792-4338
San JoseMicrochip Technology Inc.2107 North First Street, Suite 590San Jose, CA 95131Tel: 408-436-7950 Fax: 408-436-7955
Toronto6285 Northam Drive, Suite 108Mississauga, Ontario L4V 1X5, CanadaTel: 905-673-0699 Fax: 905-673-6509
ASIA/PACIFIC
AustraliaMicrochip Technology Australia Pty LtdMarketing Support DivisionSuite 22, 41 Rawson StreetEpping 2121, NSWAustraliaTel: 61-2-9868-6733 Fax: 61-2-9868-6755
China - BeijingMicrochip Technology Consulting (Shanghai)Co., Ltd., Beijing Liaison OfficeUnit 915Bei Hai Wan Tai Bldg.No. 6 Chaoyangmen Beidajie Beijing, 100027, No. ChinaTel: 86-10-85282100 Fax: 86-10-85282104
China - ChengduMicrochip Technology Consulting (Shanghai)Co., Ltd., Chengdu Liaison OfficeRm. 2401-2402, 24th Floor, Ming Xing Financial TowerNo. 88 TIDU StreetChengdu 610016, ChinaTel: 86-28-86766200 Fax: 86-28-86766599
China - FuzhouMicrochip Technology Consulting (Shanghai)Co., Ltd., Fuzhou Liaison OfficeUnit 28F, World Trade PlazaNo. 71 Wusi RoadFuzhou 350001, ChinaTel: 86-591-7503506 Fax: 86-591-7503521
China - Hong Kong SARMicrochip Technology Hongkong Ltd.Unit 901-6, Tower 2, Metroplaza223 Hing Fong RoadKwai Fong, N.T., Hong KongTel: 852-2401-1200 Fax: 852-2401-3431
China - ShanghaiMicrochip Technology Consulting (Shanghai)Co., Ltd.Room 701, Bldg. BFar East International PlazaNo. 317 Xian Xia RoadShanghai, 200051Tel: 86-21-6275-5700 Fax: 86-21-6275-5060
China - ShenzhenMicrochip Technology Consulting (Shanghai)Co., Ltd., Shenzhen Liaison OfficeRm. 1812, 18/F, Building A, United PlazaNo. 5022 Binhe Road, Futian DistrictShenzhen 518033, ChinaTel: 86-755-82901380 Fax: 86-755-82966626
China - QingdaoRm. B505A, Fullhope Plaza,No. 12 Hong Kong Central Rd.Qingdao 266071, ChinaTel: 86-532-5027355 Fax: 86-532-5027205
IndiaMicrochip Technology Inc.India Liaison OfficeMarketing Support DivisionDivyasree Chambers1 Floor, Wing A (A3/A4)No. 11, O’Shaugnessey RoadBangalore, 560 025, IndiaTel: 91-80-2290061 Fax: 91-80-2290062
JapanMicrochip Technology Japan K.K.Benex S-1 6F3-18-20, ShinyokohamaKohoku-Ku, Yokohama-shiKanagawa, 222-0033, JapanTel: 81-45-471- 6166 Fax: 81-45-471-6122
KoreaMicrochip Technology Korea168-1, Youngbo Bldg. 3 FloorSamsung-Dong, Kangnam-KuSeoul, Korea 135-882Tel: 82-2-554-7200 Fax: 82-2-558-5934
SingaporeMicrochip Technology Singapore Pte Ltd.200 Middle Road#07-02 Prime CentreSingapore, 188980Tel: 65-6334-8870 Fax: 65-6334-8850
TaiwanMicrochip Technology (Barbados) Inc., Taiwan Branch11F-3, No. 207Tung Hua North RoadTaipei, 105, TaiwanTel: 886-2-2717-7175 Fax: 886-2-2545-0139
EUROPEAustriaMicrochip Technology Austria GmbHDurisolstrasse 2A-4600 WelsAustriaTel: 43-7242-2244-399Fax: 43-7242-2244-393
DenmarkMicrochip Technology Nordic ApSRegus Business CentreLautrup hoj 1-3Ballerup DK-2750 DenmarkTel: 45 4420 9895 Fax: 45 4420 9910
FranceMicrochip Technology SARLParc d’Activite du Moulin de Massy43 Rue du Saule TrapuBatiment A - ler Etage91300 Massy, FranceTel: 33-1-69-53-63-20 Fax: 33-1-69-30-90-79
GermanyMicrochip Technology GmbHSteinheilstrasse 10D-85737 Ismaning, GermanyTel: 49-89-627-144-0 Fax: 49-89-627-144-44
ItalyMicrochip Technology SRLVia Quasimodo, 1220025 Legnano (MI)Milan, Italy Tel: 39-0331-742611 Fax: 39-0331-466781
United KingdomMicrochip Ltd.505 Eskdale RoadWinnersh TriangleWokingham Berkshire, England RG41 5TUTel: 44 118 921 5869 Fax: 44-118 921-5820
03/25/03
WORLDWIDE SALES AND SERVICE