
Mozambique Madagascar - UNCTADunctad.org/en/docs/diaeia2011d1part3_en.pdf · 2009 243 . External...
93
Madaagascar 143 Area (‘000 km 2 ): 2008 587.0 Population (millions): 2010 20.1 Capital city: Antananarivo Official language: Malagasy and French Currency: Ariary Exchange rate (period average): 2009 MGA 1 708.37=$1 GDP in current prices (millions of dollars): 2009 8 431 Exports of goods and services (millions of dollars): 2009 2 018 Imports of goods and services (millions of dollars): 2009 3 676 Official development assistance (millions of dollars): 2009 243 External debt (millions of dollars): 2009 2 213 FDI inflows, 1992-2010 (Millions of dollars) FDI inflows as a percentage of gross fixed capital formation, 1992-2010 Note: Data for 2010 are estimates. Note: Data for 2010 are estimates. Madagascar Comoros Mozambique Antananarivo Inward FDI: geographical breakdown, by source, 2003-2009 (Millions of dollars) Region/economy Inward flows Inward stock 2003 2004 2005 2006 2007 2008 2009 2003 2004 2005 2006 2007 2008 2009 Denmark - - - - - - - - - - 0.5 - 0.4 - 0.2 - - France 22.6 28.6 54.7 65.2 - - - - - - - - - - Germany 3.4 3.7 - - 13.8 16.4 - - - - - - - - - Sweden - 0.2 - 0.2 - 0.4 - 0.2 - 0.2 - 0.4 - 0.6 - - - - - - - United States - - 11.0 - 11.0 - 11.0 - 12.0 - 9.0 - 9.0 - 6.0 - 5.0 - 17.0 - 29.0 - 38.0 - 47.0 Japan - - 8.7 5.0 70.3 89.1 - 159.6 - - - - - - - Mauritius 1.7 7.1 6.6 9.2 8.5 8.3 - - - - - - - - China 0.7 13.6 0.1 1.2 13.2 61.2 - 28.1 40.6 49.9 54.3 76.0 146.5 - Korea, Republic of - 2.6 0.2 28.2 134.4 109.5 285.7 0.1 2.7 2.9 31.1 165.4 273.2 558.9 Malaysia - 0.3 - - - 0.6 - - 0.3 0.3 0.3 0.3 0.9 - 0 500 1 000 1 500 21 15 6 10 10 14 16 58 83 93 61 95 95 86 294 777 1 180 543 1 125 1992 1993 1994 1995 1996 1997 1998 1999 2000 2001 2002 2003 2004 2005 2006 2007 2008 2009 2010 0 20 40 60 80 6.1 4.0 1.8 2.8 2.2 3.1 3.0 10.9 13.2 11.5 10.4 10.8 9.3 7.7 21.1 38.3 37.2 26.1 65.2 1992 1993 1994 1995 1996 1997 1998 1999 2000 2001 2002 2003 2004 2005 2006 2007 2008 2009 2010
-
Upload
hoangthuan -
Category
Documents
-
view
214 -
download
1
Transcript of Mozambique Madagascar - UNCTADunctad.org/en/docs/diaeia2011d1part3_en.pdf · 2009 243 . External...

Madaagascar 143
Area (‘000 km2): 2008 587.0 Population (millions): 2010 20.1 Capital city: AntananarivoOfficial language: Malagasy and French Currency: AriaryExchange rate (period average): 2009 MGA 1 708.37=$1 GDP in current prices (millions of dollars): 2009 8 431 Exports of goods and services (millions of dollars): 2009 2 018 Imports of goods and services (millions of dollars): 2009 3 676 Official development assistance (millions of dollars): 2009 243 External debt (millions of dollars): 2009 2 213
FDI inflows, 1992-2010 (Millions of dollars)
FDI inflows as a percentage of gross fixed capital formation, 1992-2010
Note: Data for 2010 are estimates.
Note: Data for 2010 are estimates.
Madagascar
Comoros
Mozambique
Antananarivo
Inward FDI: geographical breakdown, by source, 2003-2009(Millions of dollars)
Region/economy Inward flows Inward stock2003 2004 2005 2006 2007 2008 2009 2003 2004 2005 2006 2007 2008 2009
Denmark - - - - - - - - - - 0.5 - 0.4 - 0.2 - - France 22.6 28.6 54.7 65.2 - - - - - - - - - - Germany 3.4 3.7 - - 13.8 16.4 - - - - - - - - - Sweden - 0.2 - 0.2 - 0.4 - 0.2 - 0.2 - 0.4 - 0.6 - - - - - - - United States - - 11.0 - 11.0 - 11.0 - 12.0 - 9.0 - 9.0 - 6.0 - 5.0 - 17.0 - 29.0 - 38.0 - 47.0
Japan - - 8.7 5.0 70.3 89.1 -
159.6 - - - - - - -
Mauritius 1.7 7.1 6.6 9.2 8.5 8.3 - - - - - - - - China 0.7 13.6 0.1 1.2 13.2 61.2 - 28.1 40.6 49.9 54.3 76.0 146.5 - Korea, Republic of - 2.6 0.2 28.2 134.4 109.5 285.7 0.1 2.7 2.9 31.1 165.4 273.2 558.9 Malaysia - 0.3 - - - 0.6 - - 0.3 0.3 0.3 0.3 0.9 -
0
500
1 000
1 500
21 15 6 10 10 14 16 58 83 93 61 95 95 86 294 777 1 180 543 1 1251992 1993 1994 1995 1996 1997 1998 1999 2000 2001 2002 2003 2004 2005 2006 2007 2008 2009 2010
0
20
40
60
80
6.1 4.0 1.8 2.8 2.2 3.1 3.0 10.9 13.2 11.5 10.4 10.8 9.3 7.7 21.1 38.3 37.2 26.1 65.2
1992 1993 1994 1995 1996 1997 1998 1999 2000 2001 2002 2003 2004 2005 2006 2007 2008 2009 2010

Foreign Direct Investment in LDCs: Lessons Learned from the Decade 2001-2010 and the Way Forward144
Cross-border M&A sales, 1994-2010 (Millions of dollars and number)
Income on FDI, 1992-2009 (Millions of dollars)
FDI inward stock, 1992-2009 (Millions of dollars)
Note: Data for 2010 are estimates.
0
1 000
2 000
3 000
4 000
5 000
142 157 163 172 183 196 212 271 141 143 181 259 257 246 739 1 773 2 953 3 496 4 6211992 1993 1994 1995 1996 1997 1998 1999 2000 2001 2002 2003 2004 2005 2006 2007 2008 2009 2010
0
20
40
60
80
1.3 3.6 1.3 3.3 - 7.0 7.0 8.7 4.2 38.2 65.0 31.6 20.8 38.3 42.2 56.7 71.3 64.41992 1993 1994 1995 1996 1997 1998 1999 2000 2001 2002 2003 2004 2005 2006 2007 2008 2009
-
1
2
3
4
5
$m
illio
n
0
1
2
3
4
Num
ber
ValueNumber
- - - 0.1 - 4.0 - - - - - - 0.6 - - - -- - 1 1 1 2 - 1 - 1 1 3 3 - 3 - -
1994 1995 1996 1997 1998 1999 2000 2001 2002 2003 2004 2005 2006 2007 2008 2009 2010
Largest cross-border M&A deals, 1994-2010
Acquired company Industry Ult. acquiring company Ult. home economy Value YearCia Agricole et Industrielle Life insurance Investor Group Brunei Darussalam 58 1996Ambatovy Nickel Project Ferroalloy ores Dynatec Corp Canada 16 2005North Fork 17 Mining Project Misc nonmetallic minerals Platinum Works Inc United States 5 2003Stones & Wood Corp SARL Misc nonmetallic minerals Prom Resources Inc United States 4 1999Sapphire Fields Ltd Gold ores Mayfair Mining & Minerals United Kingdom 1 2006Loteri Nationale De Madagascar Amusement and recreation Magnum Corp Bhd Malaysia 0 1997Saowani Development SARL Misc nonmetallic minerals Prom Resources Inc United States - 1998BTM Bank, Madagascar Banks Investor Group Mali - 1999JBA Production SA Women's & children's underwear Tefron Ltd Israel - 2001
Societe Siranna SARL Misc nonmetallic mineralsSavoy Capital Investments Inc
United States - 2004
Ambatovy Nickel Project Ferroalloy ores Sumitomo Corp Japan - 2005Ambatovy Nickel Project Ferroalloy ores Impala Platinum Hldgs South Africa - 2005
Majunga Offshore Profond expltnCrude petroleum and natural gas
BG Group PLC United Kingdom - 2006
Union Prospection Miniere Gold ores Mayfair Mining & Minerals United Kingdom - 2006Madagascar Energy Intnl Gasoline service stations Golden Nova Holdings Hong Kong, China - 2008Madagascar Oil Co SA Crude petroleum and natural gas Total SA France - 2008Bureau de Recherches Geolog. & Min. Misc nonmetallic minerals Malagasy Minerals Ltd Australia - 2008
Madaagascar 145
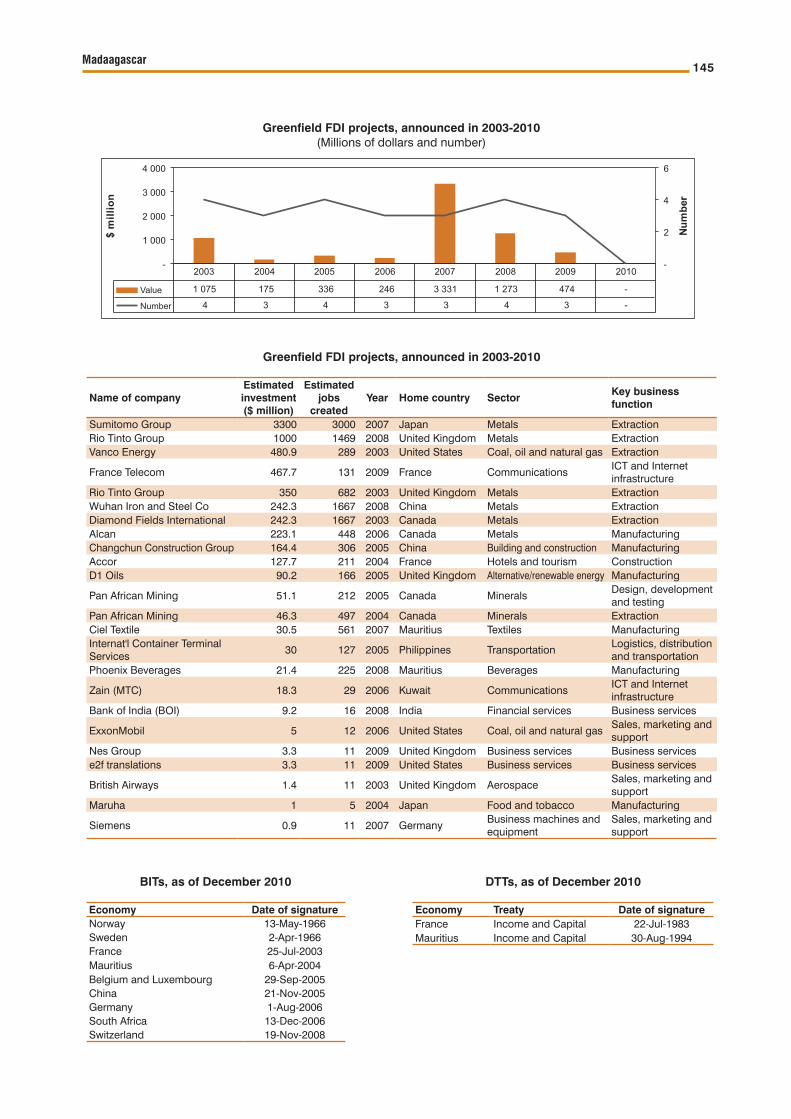
Greenfield FDI projects, announced in 2003-2010(Millions of dollars and number)
-
1 000
2 000
3 000
4 000
$m
illio
n
-
2
4
6
Num
ber
Value
Number
1 075 175 336 246 3 331 1 273 474 -4 3 4 3 3 4 3 -
2003 2004 2005 2006 2007 2008 2009 2010
Greenfield FDI projects, announced in 2003-2010
Name of companyEstimated investment ($ million)
Estimated jobs
createdYear Home country Sector
Key business function
Sumitomo Group 3300 3000 2007 Japan Metals ExtractionRio Tinto Group 1000 1469 2008 United Kingdom Metals ExtractionVanco Energy 480.9 289 2003 United States Coal, oil and natural gas Extraction
France Telecom 467.7 131 2009 France CommunicationsICT and Internet infrastructure
Rio Tinto Group 350 682 2003 United Kingdom Metals ExtractionWuhan Iron and Steel Co 242.3 1667 2008 China Metals ExtractionDiamond Fields International 242.3 1667 2003 Canada Metals ExtractionAlcan 223.1 448 2006 Canada Metals ManufacturingChangchun Construction Group 164.4 306 2005 China Building and construction ManufacturingAccor 127.7 211 2004 France Hotels and tourism ConstructionD1 Oils 90.2 166 2005 United Kingdom Alternative/renewable energy Manufacturing
Pan African Mining 51.1 212 2005 Canada MineralsDesign, development and testing
Pan African Mining 46.3 497 2004 Canada Minerals ExtractionCiel Textile 30.5 561 2007 Mauritius Textiles ManufacturingInternat'l Container Terminal Services
30 127 2005 Philippines TransportationLogistics, distribution and transportation
Phoenix Beverages 21.4 225 2008 Mauritius Beverages Manufacturing
Zain (MTC) 18.3 29 2006 Kuwait CommunicationsICT and Internet infrastructure
Bank of India (BOI) 9.2 16 2008 India Financial services Business services
ExxonMobil 5 12 2006 United States Coal, oil and natural gasSales, marketing and support
Nes Group 3.3 11 2009 United Kingdom Business services Business servicese2f translations 3.3 11 2009 United States Business services Business services
British Airways 1.4 11 2003 United Kingdom AerospaceSales, marketing and support
Maruha 1 5 2004 Japan Food and tobacco Manufacturing
Siemens 0.9 11 2007 GermanyBusiness machines and equipment
Sales, marketing and support
BITs, as of December 2010
Economy Date of signatureNorway 13-May-1966Sweden 2-Apr-1966France 25-Jul-2003Mauritius 6-Apr-2004Belgium and Luxembourg 29-Sep-2005China 21-Nov-2005Germany 1-Aug-2006South Africa 13-Dec-2006Switzerland 19-Nov-2008
DTTs, as of December 2010
Economy Treaty Date of signatureFrance Income and Capital 22-Jul-1983Mauritius Income and Capital 30-Aug-1994

Foreign Direct Investment in LDCs: Lessons Learned from the Decade 2001-2010 and the Way Forward146
Other relevant information
Membership of relevant international agreements as of January 2011: MIGA, ICSID, CREFAA, TRIMS, GATS and TRIPS•Address of investment agency: Economic Development Board of Madagascar (EDBM), Avenue Gabriel Ramamantsoa, •Antaninarenina, Antananarivo 101- Madagascar
Contact: Tel: +261 202 267 040, Fax : +261 202 266 105/ 230 172, Email : [email protected] Globe 500 investors: A.P. Moller - Marsk A/S, Bnp Paribas, Bouygues, Imperial Tobacco Group P L C, Rio Tinto Plc, •Royal Dutch Shell Plc, Sanofi-Aventis, Société LafargeMember of WAIPA as of January 2011: YES•
Data on foreign affiliates of the United States in Madagascar, 1995-2008(Millions of dollars in assets, value added and sales; thousands in employees)
Variable 1995 1996 1997 1998 1999 2000 2001 2002 2003 2004 2005 2006 2007 2008Number - - - - - - - - - 1 1 2 2 2Assets - - - - .. 1 1 1 1 .. .. .. .. ..Value added - - - - .. - - - - - 11 - 13 - 22 .. ..Sales - - - - .. - 1 1 1 1 1 1 .. ..
Selected foreign affiliates in Madagascar, 2010
Company Home economy Industry Sales EmploymentYear of
est.Societe Des Cigarettes Melia United Kingdom Cigarettes 20 260 2002Festival Sa France Broadwoven fabric mills, cotton 9 850 2001
Hoechst Madagascar S A FranceDrugs, drug proprietaries, and druggists' sundries
8 69 1969
Societe Malgache D'Emballages Metalliques United States Metal cans 7 72 1995Floreal Madagascar S A Mauritius Knitting mills, nec 7 4 100 1990Landis Madagascar S A Germany Automotive parts, supplies 4 95 1968Fimapila S A R L France Automotive parts, supplies 2 20 1952Plg Confection Sa France Men's and boys' clothing, nec 2 1 200 1993Madarail S A South Africa Railroads, line-haul operating 1 878 2001Hilton Madagascar United Kingdom Hotels and motels 1 60 ..Aromatics Madagascar Sarl Germany Groceries and related products, nec 1 26 2003
I B L Madagascar S A MauritiusComputers and peripheral equipment and software
1 48 1951
M C F I Madagascar S A R L Mauritius Farm supplies 1 20 1993Bni Madagascar Sa France Commercial banks, nec .. 86 900 1976Polo Garments Majunga Sarl Belgium Men's and boys' clothing, nec .. 800 1998B F V Societe Generale S A France Commercial banks, nec .. 800 1977Cimelta Madagascar Sa Virgin Islands Uk Residential construction, nec .. 700 1946
Logistique Petroliere Sa United KingdomPetroleum and petroleum products wholesalers, nec
.. 330 1999
Banque Malgache De L Ocean Indien Sa France Commercial banks, nec .. 325 1989Madagascar Hilton Sarl United Kingdom Hotels and motels .. 234 1970Societe Industrielle Des Produits Electriques France Storage batteries .. 220 1971Societe Malgache De Mobiles S A France Business services, nec .. 160 1998Inframad France Engineering services .. 130 ..
Soval Madagascar S A FrancePlumbing & heating equipment & supplies(hydronics)
.. 120 1956
Banque Sbm Madagascar Sa Mauritius Commercial banks, nec .. 102 1998Itd-Madagascar S.A Thailand Engineering services .. 20 2009
Somaphar Sa FranceDrugs, drug proprietaries, and druggists' sundries
.. 20 1974
T M V Sarl France Books, periodicals, and newspapers .. 17 1950Maersk Madagascar Sa Denmark Services, nec .. .. 2003

Malawi 147
Area (‘000 km2): 2008 118.5 Population (millions): 2010 15.6 Capital city: LilongweOfficial language: English Currency: Malawi KwachaExchange rate (period average): 2009 MWK 140.523 =$1 GDP in current prices (millions of dollars): 2009 4 611 Exports of goods and services (millions of dollars): 2009 863 Imports of goods and services (millions of dollars): 2009 1 420 Official development assistance (millions of dollars): 2009 439 External debt (millions of dollars): 2009 1 093
FDI inflows, 1992-2010 (Millions of dollars)
FDI inflows as a percentage of gross fixed capital formation, 1992-2010
Note: Data for 2010 are estimates.
Note: Data for 2010 are estimates.
MalawiZambia
Zimbabwe
Mozambique
United Republicof Tanzania
Lilongwe
Inward FDI: geographical breakdown, by source, 2003-2009(Millions of dollars)
Region/economy Inward flows Inward stock2003 2004 2005 2006 2007 2008 2009 2003 2004 2005 2006 2007 2008 2009
Denmark - - 1.7 - 0.3 - - - - 18.3 17.7 16.1 19.7 18.9 19.3 Germany - - 6.2 - - - - - - - - - - - Portugal 1.8 0.5 - - - - - - - - - - - - Sweden - - - - - - - - - - - - - - United States - 2.0 - 5.0 - - 1.0 - 2.0 - 1.0 8.0 10.0 5.0 5.0 3.0 1.0 - Japan - - - - - 1.9 - - - - - - - - China - - - - 0.2 5.4 - 0.7 0.7 0.7 1.0 1.2 6.6 - Malaysia - - - - - - - 3.3 3.3 3.3 3.5 3.8 3.6 -
- 50
0
50
100
150
200
- 7 8 25 6 16 15 12 58 40 60 17 66 108 52 72 92 170 60 1401992 1993 1994 1995 1996 1997 1998 1999 2000 2001 2002 2003 2004 2005 2006 2007 2008 2009 2010
- 20
0
20
40
60
-2.4 3.3 7.9 1.8 4.5 4.7 3.2 13.3 15.7 23.4 7.4 29.9 50.3 22.9 31.0 35.0 56.2 15.4 11.4
1992 1993 1994 1995 1996 1997 1998 1999 2000 2001 2002 2003 2004 2005 2006 2007 2008 2009 2010

Foreign Direct Investment in LDCs: Lessons Learned from the Decade 2001-2010 and the Way Forward148
Cross-border M&A sales, 1994-2010 (Millions of dollars and number)
Income on FDI, 1992-2009 (Millions of dollars)
FDI inward stock, 1992-2009 (Millions of dollars)
Note: Data for 2010 are estimates.
0
200
400
600
800
1 000
1 200
192 200 225 230 246 261 273 332 358 419 390 410 562 503 536 590 760 821 9611992 1993 1994 1995 1996 1997 1998 1999 2000 2001 2002 2003 2004 2005 2006 2007 2008 2009 2010
0
20
40
60
8.6 3.1 10.3 8.6 11.6 13.7 14.0 19.2 33.2 54.5 22.5 14.1 15.4 15.4 15.4 17.5 20.8 24.21992 1993 1994 1995 1996 1997 1998 1999 2000 2001 2002 2003 2004 2005 2006 2007 2008 2009
- 5
-
5
10
15
$m
illio
n
0
1
2
3
Num
ber
ValueNumber
- - 7.2 - - - 2.3 - 13.8 6.0 - - - - 4.7 - 0.5 0.1- - 3 1 - 1 1 1 1 - - 1 - 2 - 1 1
1994 1995 1996 1997 1998 1999 2000 2001 2002 2003 2004 2005 2006 2007 2008 2009 2010
Largest cross-border M&A deals, 1994-2010
Acquired company Industry Ult. acquiring company Ult. home economy Value YearBHP Minerals Mali Inc Chemical and mineral mining Gencor South Africa 53 1996Commercial Bank of Malawi Banks Standard Bank Group Ltd South Africa 14 2001Malital(African Lakes Corp PLC) Motor vehicles and car bodies Cie Francaise d' Afrique France 6 2002Portland Cement Co Concrete block and brick Commonwealth Corp South Africa 6 1996Kangankunde Carbonatite Com Miscellaneous metal ores, nec Lynas Corp Ltd Australia 4 2007Blantyre Hotels Ltd Hotels and motels Investor Group Malawi 2 1999Packaging Industries Ltd Packaging paper & plastics film Nampak Ltd South Africa 2 1996First Discount House Ltd Investment advice Kingdom Security Hldgs Zimbabwe 1 2007
Tonse SolutionsRadiotelephone communications
Norsat International Inc Canada 0 2009
Stazone Corp Sdn Bhd Stationery stores Chee Wah Corp Bhd Malaysia 0 2010Dwangwa Sugar Corp Ltd Sugarcane and sugar beets Lonrho PLC United Kingdom - 1997Kynoch-Optichem Phosphatic fertilizers Investor Group Malawi - 2000Mobil Oil Malawi Ltd Crude petroleum and natural gas Total SA France - 2005

Malawi 149
Greenfield FDI projects, announced in 2003-2010(Millions of dollars and number)
-
200
400
600
800
$m
illio
n
-
2
4
6
Num
ber
Value
Number
- - - - - 18 685 298- - - - - 2 4 3
2003 2004 2005 2006 2007 2008 2009 2010
Greenfield FDI projects, announced in 2003-2010
Name of companyEstimated investment ($ million)
Estimated jobs
createdYear Home country Sector Key business function
Globe Metals & Mining 233.7 1 524 2009 Australia Metals ExtractionPaladin Energy 220 328 2009 Australia Metals ExtractionLafarge 200 246 2009 France Building and construction Manufacturing
G-Mobile Holdings 150 60 2010 Mongolia CommunicationsICT and internet infrastructure
Bharti Group 100 144 2010 India CommunicationsICT and Internet infrastructure
Thumbay Group UAE 47.8 172 2010United Arab Emir.
Healthcare Construction
Lonrho 31.4 172 2009 United Kingdom Food and tobaccoLogistics, distribution and transportation
Ecobank 9.2 16 2008 Togo Financial services Business servicesICB Financial Group Holdings 9.2 16 2008 Malaysia Financial services Business services
BITs, as of December 2010
Economy Date of signatureTaiwan Province of China 22-Apr-1995Malaysia 5-Sep-1996Egypt 21-Oct-1997Italy 28-Aug-2003Netherlands 11-Dec-2003Zimbabwe 4-Jul-2003
DTTs, as of December 2010
Economy Treaty Date of signatureSweden Income and Capital 25-Nov-1954United Kingdom Income and Capital 25-Nov-1955Denmark Income and Capital 17-Jan-1959France Income and Capital 5-Nov-1963Norway Income and Capital 16-Dec-1963Switzerland Income and Capital 3-May-1965Netherlands Income and Capital 7-Jun-1969South Africa Income and Capital 3-May-1971Norway Income 8-Dec-2009
Data on foreign affiliates of the United States in Malawi, 1995-2008(Millions of dollars in assets, wages and salaries, value added and sales; thousands in employees)
Variable 1995 1996 1997 1998 1999 2000 2001 2002 2003 2004 2005 2006 2007 2008
Number 8 7 9 9 6 6 6 6 5 6 6 5 5 5
Assets 133 136 233 202 190 190 216 216 207 233 296 .. .. ..
Employees 8 - 3.9 4.6 4.8 2.8 3.1 3.8 3.8 .. .. .. .. ..
Wages and salaries 32 .. 14 18 19 16 18 15 16 .. .. .. .. ..
Value sdded 59 .. 40 50 41 45 56 40 41 .. .. .. .. ..
Sales - - - 379 362 362 360 359 286 268 319 425 388 401
Foreign Direct Investment in LDCs: Lessons Learned from the Decade 2001-2010 and the Way Forward150
Other relevant information
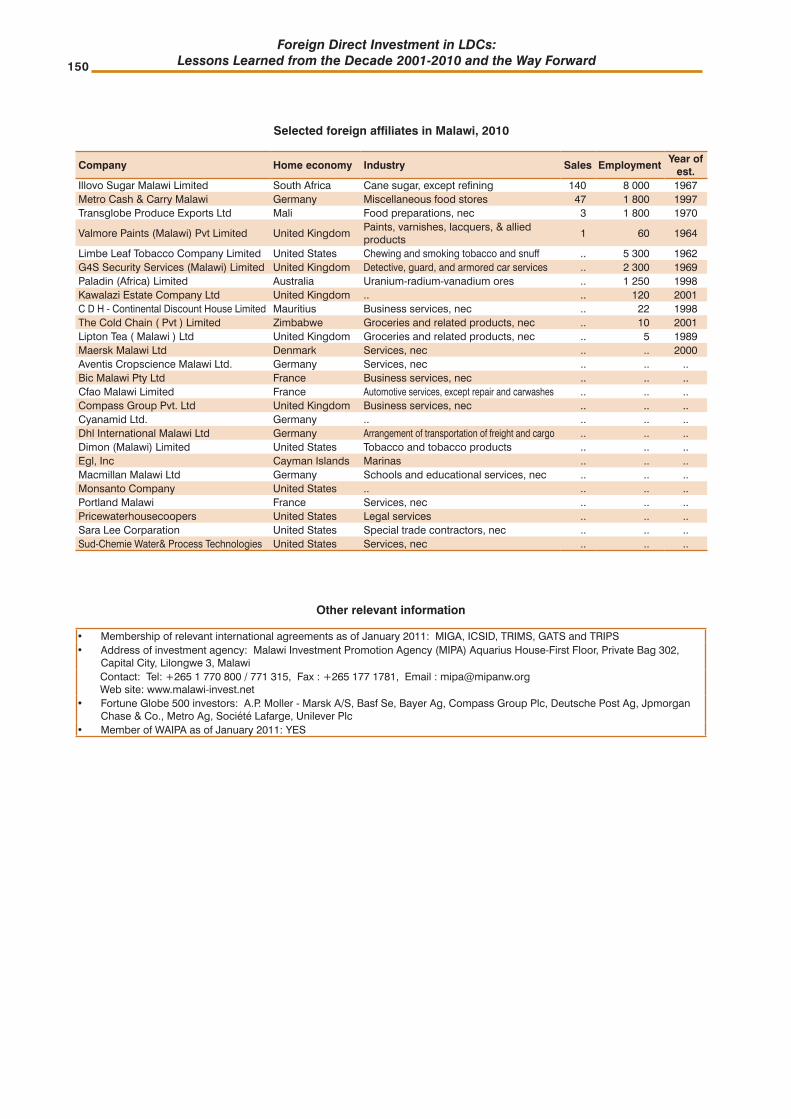
Membership of relevant international agreements as of January 2011: MIGA, ICSID, TRIMS, GATS and TRIPS•Address of investment agency: Malawi Investment Promotion Agency (MIPA) Aquarius House-First Floor, Private Bag 302, •Capital City, Lilongwe 3, Malawi
Contact: Tel: +265 1 770 800 / 771 315, Fax : +265 177 1781, Email : [email protected] Web site: www.malawi-invest.net
Fortune Globe 500 investors: A.P. Moller - Marsk A/S, Basf Se, Bayer Ag, Compass Group Plc, Deutsche Post Ag, Jpmorgan •Chase & Co., Metro Ag, Société Lafarge, Unilever PlcMember of WAIPA as of January 2011: YES•
Selected foreign affiliates in Malawi, 2010
Company Home economy Industry Sales EmploymentYear of
est.Illovo Sugar Malawi Limited South Africa Cane sugar, except refining 140 8 000 1967Metro Cash & Carry Malawi Germany Miscellaneous food stores 47 1 800 1997Transglobe Produce Exports Ltd Mali Food preparations, nec 3 1 800 1970
Valmore Paints (Malawi) Pvt Limited United KingdomPaints, varnishes, lacquers, & allied products
1 60 1964
Limbe Leaf Tobacco Company Limited United States Chewing and smoking tobacco and snuff .. 5 300 1962G4S Security Services (Malawi) Limited United Kingdom Detective, guard, and armored car services .. 2 300 1969Paladin (Africa) Limited Australia Uranium-radium-vanadium ores .. 1 250 1998Kawalazi Estate Company Ltd United Kingdom .. .. 120 2001C D H - Continental Discount House Limited Mauritius Business services, nec .. 22 1998The Cold Chain ( Pvt ) Limited Zimbabwe Groceries and related products, nec .. 10 2001Lipton Tea ( Malawi ) Ltd United Kingdom Groceries and related products, nec .. 5 1989Maersk Malawi Ltd Denmark Services, nec .. .. 2000Aventis Cropscience Malawi Ltd. Germany Services, nec .. .. ..Bic Malawi Pty Ltd France Business services, nec .. .. ..Cfao Malawi Limited France Automotive services, except repair and carwashes .. .. ..Compass Group Pvt. Ltd United Kingdom Business services, nec .. .. ..Cyanamid Ltd. Germany .. .. .. ..Dhl International Malawi Ltd Germany Arrangement of transportation of freight and cargo .. .. ..Dimon (Malawi) Limited United States Tobacco and tobacco products .. .. ..Egl, Inc Cayman Islands Marinas .. .. ..Macmillan Malawi Ltd Germany Schools and educational services, nec .. .. ..Monsanto Company United States .. .. .. ..Portland Malawi France Services, nec .. .. ..Pricewaterhousecoopers United States Legal services .. .. ..Sara Lee Corparation United States Special trade contractors, nec .. .. ..Sud-Chemie Water& Process Technologies United States Services, nec .. .. ..

Mali 151
Area (‘000 km2): 2008 1 240.2 Population (millions): 2010 13.3 Capital city: BamakoOfficial language: French Currency: CFA francExchange rate (period average): 2009 CFAfr 447.805 =$1 GDP in current prices (millions of dollars): 2009 8 797 Exports of goods and services (millions of dollars): 2009 1 966 Imports of goods and services (millions of dollars): 2009 2 714 Official development assistance (millions of dollars): 2009 576 External debt (millions of dollars): 2009 2 667
FDI inflows, 1992-2010 (Millions of dollars)
FDI inflows as a percentage of gross fixed capital formation, 1992-2010
Note: Data for 2010 are estimates.
Note: Data for 2010 are estimates.
Mali Mauritania
Algeria
NigerBamako
GuineaBurkina Faso
GhanaCôte d’Ivoire
Senegal
Inward FDI: geographical breakdown, by source, 2003-2009(Millions of dollars)
Region/economy Inward flows Inward stock2003 2004 2005 2006 2007 2008 2009 2003 2004 2005 2006 2007 2008 2009
Denmark - - - 0.2 0.2 - - - - 2.2 1.4 1.8 2.6 - - France 15.8 9.9 22.4 12.5 8.2 7.3 8.3 178.1 65.4 41.3 54.0 91.3 112.7 123.9 Germany - 1.2 - 6.2 - - - 6.9 - - - - - - - Portugal - - - - - - - - - - - - - - Sweden - - - - - - 0.1 - 0.1 - - - - - - - Canada - - - - - - - - - - - 18.2 - - United States - - - - - - - - - 4.0 - - - - - Morocco - - - - - - - 7.8 8.6 7.4 12.1 13.5 167.6 - China 5.4 - - 2.6 6.7 - 1.3 8.0 12.1 13.2 13.3 19.8 32.2 31.0 44.7
Korea, Republic of 0.7 0.2 - - - - - 4.8 1.8 1.8 1.8 1.8 - -
- 100
0
100
200
300
- 22 4 17 111 43 70 9 2 82 122 244 132 100 225 82 65 180 109 1481992 1993 1994 1995 1996 1997 1998 1999 2000 2001 2002 2003 2004 2005 2006 2007 2008 2009 2010
- 10
0
10
20
30
40
50
-4.5 0.8 3.3 14.7 7.0 11.7 1.7 0.4 16.5 21.2 38.7 17.4 11.9 26.5 8.1 4.7 11.4 7.2 8.5
1992 1993 1994 1995 1996 1997 1998 1999 2000 2001 2002 2003 2004 2005 2006 2007 2008 2009 2010

Foreign Direct Investment in LDCs: Lessons Learned from the Decade 2001-2010 and the Way Forward152
Cross-border M&A sales, 1994-2010 (Millions of dollars and number)
Income on FDI, 1992-2009 (Millions of dollars)
FDI inward stock, 1992-2009 (Millions of dollars)
Note: Data for 2010 are estimates.
0
500
1 000
1 500
209 213 230 342 385 455 310 228 132 210 524 683 756 872 966 967 978 1 087 1 2341992 1993 1994 1995 1996 1997 1998 1999 2000 2001 2002 2003 2004 2005 2006 2007 2008 2009 2010
-100
0
100
200
300
400
4.1 - 7.6 - 5.5 16.8 18.9 35.8 57.5 93.2 144.6 246.9 129.7 171.0 190.3 250.8 262.2 321.8 329.21992 1993 1994 1995 1996 1997 1998 1999 2000 2001 2002 2003 2004 2005 2006 2007 2008 2009
-
5
10
15
20
$m
illio
n
0
1
2
3
4
5
Num
ber
-ValueNumber
18.0 0.5 - - - - - 1.5 - - - 0.7 - - - -- 1 3 1 - 1 1 - 2 - 1 - 2 2 1 1 4
1994 1995 1996 1997 1998 1999 2000 2001 2002 2003 2004 2005 2006 2007 2008 2009 2010
Largest cross-border M&A deals, 1994-2010
Acquired company Industry Ult. acquiring company Ult. home economy Value YearSotelma Telephone communications Vivendi SA France 334 2009Randgold Resources Ltd Gold ores Anglo American PLC United Kingdom 132 2000Broken Hill Proprietary Co Ltd Gold ores Gencor South Africa 36 1996Nevsun Resources Ltd Iron ores Avion Resources Corp Canada 20 2008Mali-Kalana Gold Mining Rights Gold ores Investor Group South Africa 18 1995Broken Hill Proprietary Co Ltd Gold ores Gencor South Africa 17 1997Societe des Mines de Syama SA Gold ores Resolute Mining Ltd Australia 13 2004Mali Goldfields SARL Gold ores Papillon Resources Ltd Australia 5 2010Great Quest Metals Ltd Gold ores Avion Gold Corp Canada 4 2010AXMIN Inc-Kofi Gold Project Gold ores Avion Gold Corp Canada 3 2010Barnard Castle Ltd Ferroalloy ores Hanover Capital Group United Kingdom 1 2002Valley Forge Site Ltd Gold ores Hanover Capital Group United Kingdom 1 2002Sitakili Gold Project Gold ores North Atlantic Resources Ltd Canada 1 2006Mali Mining Concession Iron ores Robex Resources Inc Canada 1 1996Mininko-Kamasso Mis nonmetallic minerals Robex Resources Inc Canada 0 2007Shiega Resources Corp Gold ores Robex Resources Inc Canada 0 1999Consolidated Mining Corp Gold ores Trillion Resources Ltd Canada - 1996Abilab Testing laboratories Campbell Brothers Ltd Australia - 2006Bank of Africa Banks BMCE Morocco - 2007Songhoi Resources SARL Gold ores Papillon Resources Ltd Australia - 2010

Mali 153
Greenfield FDI projects, announced in 2003-2010(Millions of dollars and number)
-
200
400
600
800
$m
illio
n
-
2
4
Num
ber
Value
Number
- - 598 372 - 233 47 5- - 3 3 - 3 1 3
2003 2004 2005 2006 2007 2008 2009 2010
Greenfield FDI projects, announced in 2003-2010
Name of companyEstimated investment ($ million)
Estimated jobs
createdYear Home country Sector Key business function
Etruscan Resources 242.3 1 667 2005 Canada Metals ExtractionAvnel Gold 242.3 1 667 2005 United Kingdom Metals ExtractionRandgold Resources 242.3 1 667 2006 United Kingdom Metals ExtractionCarlson Companies 186.7 732 2008 United States Hotels and tourism ConstructionResolute Mining 120 176 2006 Australia Metals ExtractionRandgold Resources 113 166 2005 United Kingdom Metals ExtractionLonrho 47.4 399 2009 United Kingdom Food and tobacco ManufacturingAvion Resources 46.3 497 2008 Canada Minerals ExtractionBANDES 9.2 16 2006 Venezuela Financial services Business servicesMobiserve 2.1 13 2010 Egypt Communications Sales, marketing and supportBASF 1.4 6 2010 Germany Chemicals Sales, marketing and supportAtlas Copco 1.4 14 2010 Sweden Industrial machinery, equip. Sales, marketing and support
BITs, as of December 2010
Economy Date of signatureGermany 28-Jun-1977Switzerland 8-Mar-1978Tunisia 1-Jul-1986Algeria 11-Jul-1996Egypt 9-Mar-1998Korea, Democratic People's Rep. of 11-Oct-1999Benin 18-May-2001Cameroon 18-May-2001Chad 18-May-2001Comoros 18-May-2001Guinea 18-May-2001Qatar 18-May-2002Netherlands 13-Jul-2003Gabon 25-Mar-2005Senegal 12-Apr-2005China 12-Feb-2009
DTTs, as of December 2010
Economy Treaty Date of signatureFrance Income and Capital 22-Sep-1972Algeria Income and Capital 31-Jan-1999
Data on foreign affiliates of the United States in Mali, 1995-2008(Millions of dollars in assets, wages and salaries and value added; thousands in employees)
Variable 1995 1996 1997 1998 1999 2000 2001 2002 2003 2004 2005 2006 2007 2008Number 1 3 3 1 1 1 1 1 1 1 - - - -Assets 8 .. 437 10 .. .. .. .. .. 17 - - - -Employees 0.1 0.9 0.5 0.1 .. .. .. .. .. 0.1 - - - -Wages and salaries - 20 10 .. .. .. .. .. .. 1 - - - -Value added 7 34 24 7 .. .. .. .. .. - 1 .. .. .. -Sales - - - 17 .. .. .. .. .. 31 .. - .. -

Foreign Direct Investment in LDCs: Lessons Learned from the Decade 2001-2010 and the Way Forward154
Other relevant information
Membership of relevant international agreements as of January 2011: MIGA, ICSID, CREFAA, TRIMS, GATS and TRIPS•Address of investment agency: Agence pour la Promotion des Investissements au Mali (API-MALI), Quartier du Fleuve, BP: •1980 Bamako - République du Mali
Contact: Tel: (223) 20 22 95 25 or (223) 20 22 95 26, Fax : (223) 20 22 95 27, Email: [email protected] Globe 500 investors: Allianz Se, Bnp Paribas, Cie Financiere Participations Roullier, Michelin Et Cie, Royal Dutch Shell •Plc, Veolia EnvironnementMember of WAIPA as of January 2011: YES•
Selected foreign affiliates in Mali, 2010
Company Home economy Industry Sales EmploymentYear
of est.Laborex Mali Sa France Drugs, drug proprietaries, and druggists' sundries 166 55 1991Societe Malienne De Gaz Industriel S A France Natural gas distribution 2 26 1966Industrie Malienne Du Cycle Et Du Cyclomoteur France Transportation equipment, except motor vehicles 2 75 1970Tambaoura Minings Company Sa Canada Gold ores .. 488 1996Cfao Motors Mali Sa France Automotive parts, supplies .. 72 1977Hydrosahel France Engineering services .. 65 1982Cfao Technologies Mali Sa France Data processing services .. 61 1994Allianz Mali Asurances Germany Life insurance .. 24 1980A.R.C Treuhand Mining Corporation Mali Sarl Switzerland Gold ores .. 20 2008Societe Moderne Du Pneumatique Malien France Tires and inner tubes .. 15 1950The Uniqueness Of Christ International Ministries United States .. .. 15 ..Banque International Du Commerce France Branches and agencies of foreign banks .. .. ..Mts Mali France Oil and gas field exploration services .. .. ..Shell Mali S A United Kingdom Natural gas liquids .. .. ..Societe Auxilliaire De Distribution D' Eaux France Services, nec .. .. ..Timac Agro Mali France .. .. .. ..
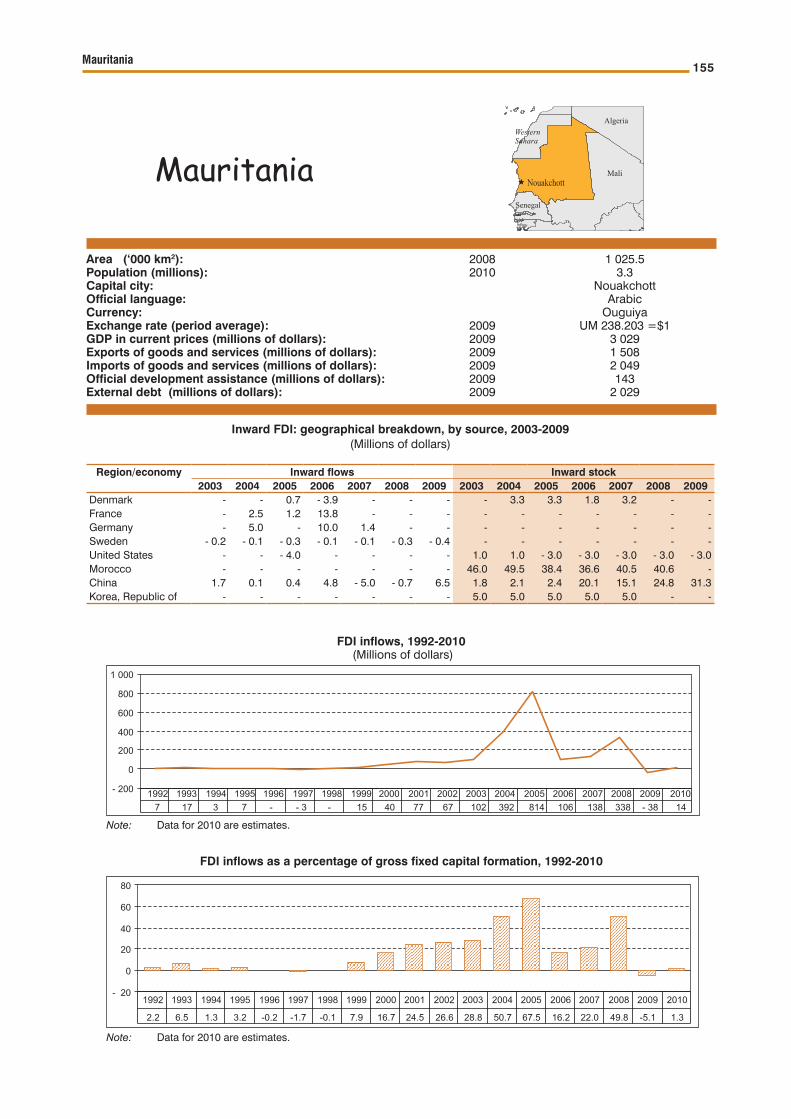
Mauritania 155
Area (‘000 km2): 2008 1 025.5 Population (millions): 2010 3.3 Capital city: NouakchottOfficial language: Arabic Currency: OuguiyaExchange rate (period average): 2009 UM 238.203 =$1 GDP in current prices (millions of dollars): 2009 3 029 Exports of goods and services (millions of dollars): 2009 1 508 Imports of goods and services (millions of dollars): 2009 2 049 Official development assistance (millions of dollars): 2009 143 External debt (millions of dollars): 2009 2 029
FDI inflows, 1992-2010 (Millions of dollars)
FDI inflows as a percentage of gross fixed capital formation, 1992-2010
Note: Data for 2010 are estimates.
Note: Data for 2010 are estimates.
MauritaniaWesternSahara
Algeria
Mali
Senegal
Nouakchott
Inward FDI: geographical breakdown, by source, 2003-2009(Millions of dollars)
Region/economy Inward flows Inward stock2003 2004 2005 2006 2007 2008 2009 2003 2004 2005 2006 2007 2008 2009
Denmark - - 0.7 - 3.9 - - - - 3.3 3.3 1.8 3.2 - - France - 2.5 1.2 13.8 - - - - - - - - - - Germany - 5.0 - 10.0 1.4 - - - - - - - - - Sweden - 0.2 - 0.1 - 0.3 - 0.1 - 0.1 - 0.3 - 0.4 - - - - - - - United States - - - 4.0 - - - - 1.0 1.0 - 3.0 - 3.0 - 3.0 - 3.0 - 3.0 Morocco - - - - - - - 46.0 49.5 38.4 36.6 40.5 40.6 - China 1.7 0.1 0.4 4.8 - 5.0 - 0.7 6.5 1.8 2.1 2.4 20.1 15.1 24.8 31.3 Korea, Republic of - - - - - - - 5.0 5.0 5.0 5.0 5.0 - -
- 200
0
200
400
600
800
1 000
7 17 3 7 - - 3 - 15 40 77 67 102 392 814 106 138 338 - 38 141992 1993 1994 1995 1996 1997 1998 1999 2000 2001 2002 2003 2004 2005 2006 2007 2008 2009 2010
- 20
0
20
40
60
80
2.2 6.5 1.3 3.2 -0.2 -1.7 -0.1 7.9 16.7 24.5 26.6 28.8 50.7 67.5 16.2 22.0 49.8 -5.1 1.3
1992 1993 1994 1995 1996 1997 1998 1999 2000 2001 2002 2003 2004 2005 2006 2007 2008 2009 2010
Foreign Direct Investment in LDCs: Lessons Learned from the Decade 2001-2010 and the Way Forward156
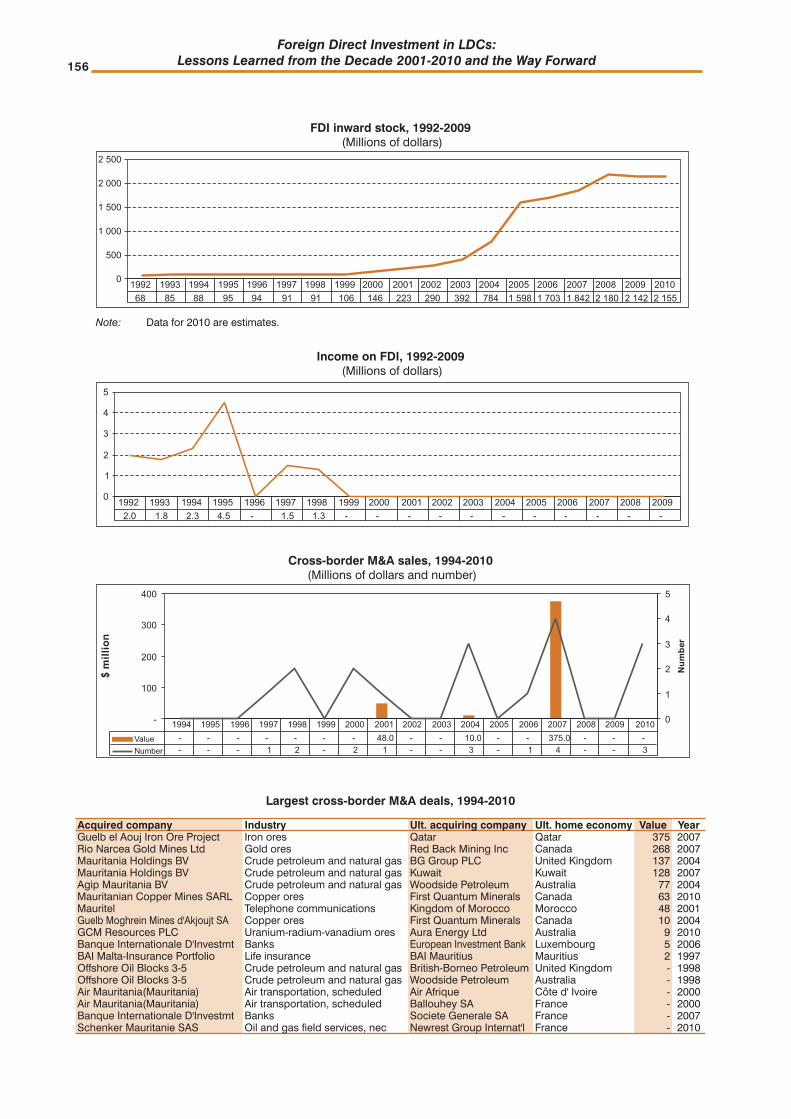
Cross-border M&A sales, 1994-2010 (Millions of dollars and number)
Income on FDI, 1992-2009 (Millions of dollars)
FDI inward stock, 1992-2009 (Millions of dollars)
Note: Data for 2010 are estimates.
0
500
1 000
1 500
2 000
2 500
68 85 88 95 94 91 91 106 146 223 290 392 784 1 598 1 703 1 842 2 180 2 142 2 1551992 1993 1994 1995 1996 1997 1998 1999 2000 2001 2002 2003 2004 2005 2006 2007 2008 2009 2010
0
1
2
3
4
5
2.0 1.8 2.3 4.5 - 1.5 1.3 - - - - - - - - - - -1992 1993 1994 1995 1996 1997 1998 1999 2000 2001 2002 2003 2004 2005 2006 2007 2008 2009
-
100
200
300
400
$m
illio
n
0
1
2
3
4
5
Num
ber
ValueNumber
- - - - - - - 48.0 - - 10.0 - - 375.0 - - -- - - 1 2 - 2 1 - - 3 - 1 4 - - 3
1994 1995 1996 1997 1998 1999 2000 2001 2002 2003 2004 2005 2006 2007 2008 2009 2010
Largest cross-border M&A deals, 1994-2010
Acquired company Industry Ult. acquiring company Ult. home economy Value YearGuelb el Aouj Iron Ore Project Iron ores Qatar Qatar 375 2007Rio Narcea Gold Mines Ltd Gold ores Red Back Mining Inc Canada 268 2007Mauritania Holdings BV Crude petroleum and natural gas BG Group PLC United Kingdom 137 2004Mauritania Holdings BV Crude petroleum and natural gas Kuwait Kuwait 128 2007Agip Mauritania BV Crude petroleum and natural gas Woodside Petroleum Australia 77 2004Mauritanian Copper Mines SARL Copper ores First Quantum Minerals Canada 63 2010Mauritel Telephone communications Kingdom of Morocco Morocco 48 2001Guelb Moghrein Mines d'Akjoujt SA Copper ores First Quantum Minerals Canada 10 2004GCM Resources PLC Uranium-radium-vanadium ores Aura Energy Ltd Australia 9 2010Banque Internationale D'Investmt Banks European Investment Bank Luxembourg 5 2006BAI Malta-Insurance Portfolio Life insurance BAI Mauritius Mauritius 2 1997Offshore Oil Blocks 3-5 Crude petroleum and natural gas British-Borneo Petroleum United Kingdom - 1998Offshore Oil Blocks 3-5 Crude petroleum and natural gas Woodside Petroleum Australia - 1998Air Mauritania(Mauritania) Air transportation, scheduled Air Afrique Côte d' Ivoire - 2000Air Mauritania(Mauritania) Air transportation, scheduled Ballouhey SA France - 2000Banque Internationale D'Investmt Banks Societe Generale SA France - 2007Schenker Mauritanie SAS Oil and gas field services, nec Newrest Group Internat'l France - 2010

Mauritania 157
Greenfield FDI projects, announced in 2003-2010(Millions of dollars and number)
-
200
400
600
800
1 000
1 200
$m
illio
n
-
2
4
6
Num
ber
Value
Number
784 522 1 107 542 37 242 - 2112 1 3 4 2 1 - 5
2003 2004 2005 2006 2007 2008 2009 2010
Greenfield FDI projects, announced in 2003-2010
Name of companyEstimated investment ($ million)
Estimated jobs
createdYear Home country Sector Key business function
Woodside Petroleum 550 154 2003 Australia Coal, oil and natural gas ExtractionHardman Resources 521.9 215 2006 Australia Coal, oil and natural gas ExtractionWoodside Petroleum 521.9 215 2004 Australia Coal, oil and natural gas ExtractionBaraka 521.9 215 2005 Australia Coal, oil and natural gas ExtractionWoodside Petroleum 521.9 215 2005 Australia Coal, oil and natural gas ExtractionArcelorMittal 242.3 1 667 2008 Luxembourg Metals ExtractionSphere Investments 233.7 1 524 2003 Australia Metals Extraction
Vasco Catalana 194.1 149 2010 Spain TransportationLogistics, distribution and transportation
Rio Narcea Gold Mines 63.5 93 2005 Canada Metals ExtractionAl Kharafi Group 27.5 250 2007 Kuwait Hotels and tourism ConstructionBNP Paribas 12.2 20 2006 France Financial services Business servicesQatar National Bank (QNB) 9.2 16 2010 Qatar Financial services Business servicesAttijariwafa Bank 9.2 16 2007 Morocco Financial services Business servicesGroup of Kaunas Grain Com 4.14 23 2010 Lithuania Food and tobacco ManufacturingIntegra Group 3.8 9 2006 Russian Fed. Business services Sales, marketing and supportGroupe Ortec 3.8 9 2006 France Business services Sales, marketing and supportVasco Catalana 3.2 20 2010 Spain Transportation Sales, marketing and support
BITs, as of December 2010
Economy Date of signatureSwitzerland 9-Sep-1976Germany 8-Dec-1982Belgium and Luxembourg 23-Nov-1983Tunisia 11-Mar-1986Romania 14-Mar-1988Morocco 13-Jun-2000Burkina Faso 18-May-2001Cameroon 18-May-2001Gambia 9-May-2001Ghana 18-May-2001Guinea 18-May-2001Mauritius 18-May-2001Italy 5-Apr-2003Qatar 25-Dec-2003Korea, Republic of 15-Dec-2004Lebanon 15-Jun-2004Kuwait 1-Aug-2006Algeria 6-Jan-2008Spain 24-Jul-2008
DTTs, as of December 2010
Economy Treaty Date of signatureFrance Income and Capital 15-Nov-1967Senegal Income and Capital 9-Jan-1971
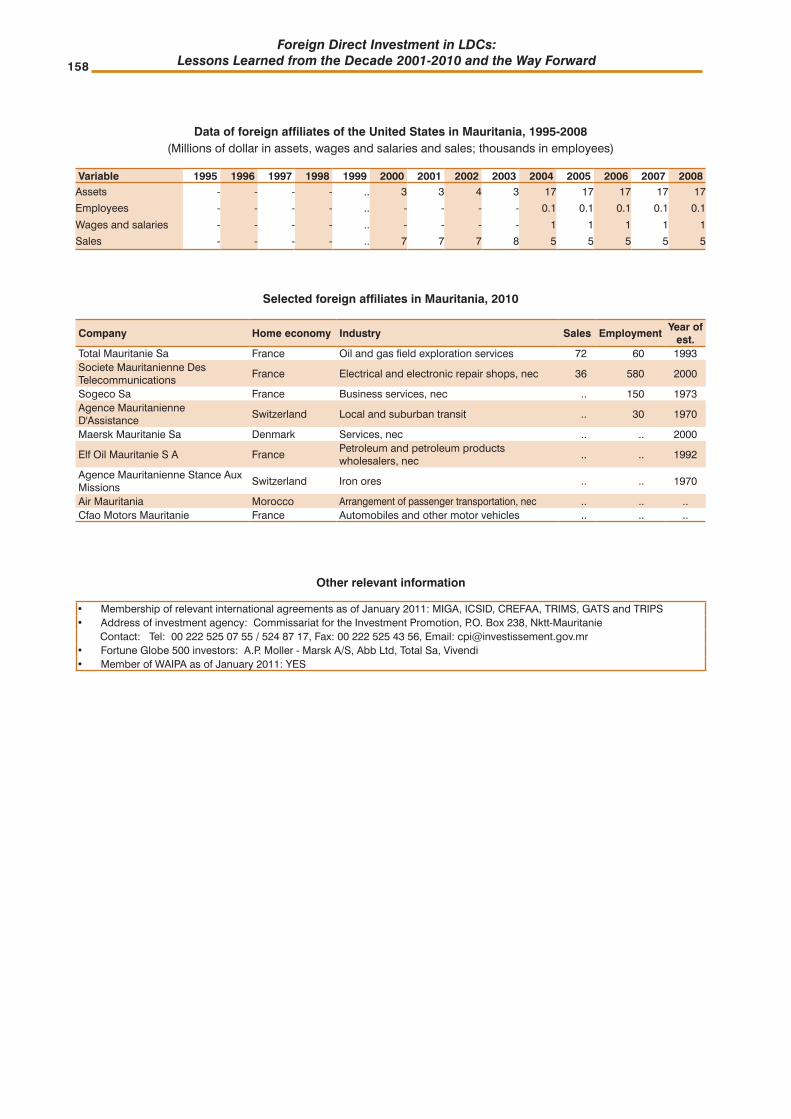
Foreign Direct Investment in LDCs: Lessons Learned from the Decade 2001-2010 and the Way Forward158
Other relevant information
Membership of relevant international agreements as of January 2011: MIGA, ICSID, CREFAA, TRIMS, GATS and TRIPS•Address of investment agency: Commissariat for the Investment Promotion, P.O. Box 238, Nktt-Mauritanie•
Contact: Tel: 00 222 525 07 55 / 524 87 17, Fax: 00 222 525 43 56, Email: [email protected] Globe 500 investors: A.P. Moller - Marsk A/S, Abb Ltd, Total Sa, Vivendi•Member of WAIPA as of January 2011: YES•
Data of foreign affiliates of the United States in Mauritania, 1995-2008(Millions of dollar in assets, wages and salaries and sales; thousands in employees)
Variable 1995 1996 1997 1998 1999 2000 2001 2002 2003 2004 2005 2006 2007 2008Assets - - - - .. 3 3 4 3 17 17 17 17 17
Employees - - - - .. - - - - 0.1 0.1 0.1 0.1 0.1
Wages and salaries - - - - .. - - - - 1 1 1 1 1
Sales - - - - .. 7 7 7 8 5 5 5 5 5
Selected foreign affiliates in Mauritania, 2010
Company Home economy Industry Sales EmploymentYear of
est.Total Mauritanie Sa France Oil and gas field exploration services 72 60 1993Societe Mauritanienne Des Telecommunications
France Electrical and electronic repair shops, nec 36 580 2000
Sogeco Sa France Business services, nec .. 150 1973Agence Mauritanienne D'Assistance
Switzerland Local and suburban transit .. 30 1970
Maersk Mauritanie Sa Denmark Services, nec .. .. 2000
Elf Oil Mauritanie S A FrancePetroleum and petroleum products wholesalers, nec
.. .. 1992
Agence Mauritanienne Stance Aux Missions
Switzerland Iron ores .. .. 1970
Air Mauritania Morocco Arrangement of passenger transportation, nec .. .. ..Cfao Motors Mauritanie France Automobiles and other motor vehicles .. .. ..

Mozambique159
Area (‘000 km2): 2008 801.6 Population (millions): 2010 23.4 Capital city: MaputoOfficial language: Portuguese Currency: MeticalExchange rate (period average): 2009 MZM 24.3006 =$1 GDP in current prices (millions of dollars): 2009 9 753 Exports of goods and services (millions of dollars): 2009 1 877 Imports of goods and services (millions of dollars): 2009 3 252 Official development assistance (millions of dollars): 2009 1 289 External debt (millions of dollars): 2009 4 168
FDI inflows, 1992-2010 (Millions of dollars)
FDI inflows as a percentage of gross fixed capital formation, 1992-2010
Note: Data for 2010 are estimates.
Note: Data for 2010 are estimates.
MozambiqueZambia
Malawi
Zimbabwe
Botswana
United Republicof Tanzania
South Africa Maputo
Inward FDI: geographical breakdown, by source, 2003-2009(Millions of dollars)
Region/economy Inward flows Inward stock2003 2004 2005 2006 2007 2008 2009 2003 2004 2005 2006 2007 2008 2009
Denmark - - - 0.3 - 0.2 - - - - - 0.2 - 0.2 1.2 0.2 - France - 3.7 1.2 - - - - - - - - - - - Germany - 3.7 - 1.3 4.1 1.5 1.4 - - - - - - - Portugal 6.0 2.8 12.0 11.4 110.4 65.4 2.7 430.7 475.4 388.1 426.7 638.9 1 071.6 - Sweden - 0.4 - 0.4 - 0.7 - 0.4 - 0.3 - 0.8 - 1.2 - - - - - - - Norway - - - - - - - - - - - - 2.6 - United States 1.0 - - 4.0 - 3.0 - 2.0 - 3.0 13.0 - - 6.0 5.0 5.0 4.0 Japan - - 0.8 - 1.8 - - - - - - - - - - Mauritius 18.7 9.2 18.0 8.5 4.7 0.4 - - - - - - - - South Africa - - - - - - - 763.7 780.8 724.7 764.8 839.5 836.0 - Brazil - - - - - - - 0.1 - - 0.6 1.4 3.0 - China - 0.7 2.9 - 10.0 5.9 15.9 2.4 5.6 14.7 14.7 34.2 43.0 75 Malaysia - - - 0.1 45.1 109.5 - 9.1 9.1 9.2 10.0 57.5 160.3 -
0
200
400
600
800
1 000
890 78925 32 35 45 73 64 235 382 139 255 347 337 245 108 154 427 5921992 1993 1994 1995 1996 1997 1998 1999 2000 2001 2002 2003 2004 2005 2006 2007 2008 2009 2010
0
10
20
30
40
50
32.4 30.76.4 7.6 7.1 6.5 11.1 8.2 29.6 42.1 10.4 31.4 27.6 32.4 23.0 8.8 12.3 30.7 28.5
1992 1993 1994 1995 1996 1997 1998 1999 2000 2001 2002 2003 2004 2005 2006 2007 2008 2009 2010

Foreign Direct Investment in LDCs: Lessons Learned from the Decade 2001-2010 and the Way Forward160
Cross-border M&A sales, 1994-2010 (Millions of dollars and number)
Income on FDI, 1992-2009 (Millions of dollars)
FDI inward stock, 1992-2009 (Millions of dollars)
Note: Data for 2010 are estimates.
0
1 000
2 000
3 000
4 000
5 000
6 000
73 105 140 356 429 493 728 1 110 1 249 1 505 1 852 2 189 2 442 2 630 2 789 3 216 3 808 4 689 5 4971992 1993 1994 1995 1996 1997 1998 1999 2000 2001 2002 2003 2004 2005 2006 2007 2008 2009 2010
0
200
400
600
- - - - - 1.6 6.1 5.8 0.3 20.3 27.7 42.1 167.6 284.0 471.4 553.6 544.5 83.51992 1993 1994 1995 1996 1997 1998 1999 2000 2001 2002 2003 2004 2005 2006 2007 2008 2009
-
10
20
30
40
50
$m
illio
n
0
2
4
6
8N
umbe
r
ValueNumber
40.0 14.0 10.7 - 13.1 1.3 - 10.0 - - - - 34.0 2.3 - - 35.02 2 3 2 2 2 1 1 - 2 1 - 7 2 2 3 5
1994 1995 1996 1997 1998 1999 2000 2001 2002 2003 2004 2005 2006 2007 2008 2009 2010

Mozambique161
Greenfield FDI projects, announced in 2003-2010(Millions of dollars and number)
Largest cross-border M&A deals, 1994-2010
Acquired company Industry Ult. acquiring company
Ult. home economy Value Year
Corridor Sands Ltd Miscellaneous metal ores, nec WMC Resources Ltd Australia 88 2003Minas Moatize LDA Coal and lignite surface mining Palmary Enterprises Ltd Ukraine 35 2010Cia de Cimentos de Mocambique Ready-mixed concrete Portugal Portugal 20 1994Sena Holdings Ltd Cane sugar, except refining Berneuil Participation France 20 2006Cimentos de Mozambique Cement, hydraulic Portugal Portugal 20 1994MacMahon Brewery,Beira Brewery Malt beverages South African Breweries United Kingdom 14 1995Industrias Florestais de Manica Timber tracts Efanor Investimentos Portugal 13 1998Commercial Bank of Mozambique Banks Investor Group Portugal 11 1996Banco Austral(Mozambique) Banks Absa Group Ltd South Africa 10 2001Desenvolvimento E Comerc.Agricola Grain and field beans White Nile Ltd Guernsey 10 2009Moatize Province Coal Tenements Coal and lignite surface mining Riversdale Mining Ltd Australia 9 2006Tantalum Mineracao e Prospeccao Ferroalloy ores, except vanadium Pacific Wildcat Resources Canada 5 2009Alfa Security Services Security systems services Group 4 Securicor PLC United Kingdom 5 2006Sociedade Comercial Bytes & Pieces Computers, peripheral equip. & software Lonrho PLC United Kingdom 2 2007S&B Construcoes Lda Engineering services Stefanutti Stocks Hldgs South Africa 1 2010Ceta Residential construction, nec Mozambique Investment Mauritius 1 1999Explorator Ltda Gold ores Pan African Resources United Kingdom 0 2006Banco Standard Totte Banks A.Champalimaud SGPS Portugal - 1995Vidreira Glass containers Barbosa e Almeida Portugal - 1996Banco Standard Totte de Mocambique Banks Standard Bank Group South Africa - 1996Banco Popular de Desenvolvimento Banks Southern Bank Bhd Malaysia - 1997Navique(Mozambique) Deep sea foreign transport Investor Group Portugal - 1997Corridor Sands Limitada Miscellaneous metal ores, nec Southern Mining Corp South Africa - 1998Systemas E Computadores Telephone communications Alexander Resources Canada - 1999Temane Gas Field Crude petroleum and natural gas Sasol Ltd South Africa - 2000Maputo Port Development Co Marine cargo handling Investor Group United Kingdom - 2003Beira Shipyard Ship building and repairing Pescanova Alimentacion Spain - 2004Banco de Desenvolvimento e Comercio Banks FirstRand Ltd South Africa - 2006Maputo Port Development Marine cargo handling Grindrod Ltd South Africa - 2006Mavita Nickel Project Ferroalloy ores, except vanadium Lithic Metals & Energy Zambia - 2006Alfa Security Services Security systems services Group 4 Securicor PLC United Kingdom - 2007Sena Holdings Ltd Cane sugar, except refining Acucar Guarani SA Brazil - 2008Anadarko Petroleum Corp Crude petroleum and natural gas Mitsui & Co Ltd Japan - 2008Osho Gremach Mining Ltda Coal and lignite surface mining Greenearth Resources India - 2009Trak-Auto Lda Motor vehicle dealers Lonrho PLC United Kingdom - 2010Cimentos de Nacala SA Cement, hydraulic Grupo Camargo Correa Brazil - 2010Sociedade de Aguas Bottled & canned soft drinks Undisclosed Acquiror unspecified - 2010
-
2 000
4 000
6 0008 000
10 000
12 000
14 000
$m
illio
n
-
5
10
15
20
25
Num
ber
Value
Number
577 1 609 - 595 2 112 11 607 1 563 3 1926 4 - 5 6 23 11 16
2003 2004 2005 2006 2007 2008 2009 2010

Foreign Direct Investment in LDCs: Lessons Learned from the Decade 2001-2010 and the Way Forward162
BITs, as of December 2010
Economy Date of signatureZimbabwe 12-Sep-1990Portugal 28-May-1996Mauritius 14-Feb-1997South Africa 6-May-1997Algeria 12-Dec-1998Egypt 8-Dec-1998Italy 14-Dec-1998United States 1-Dec-1998Indonesia 26-Mar-1999China 10-Jul-2001Cuba 20-Oct-2001Netherlands 18-Dec-2001Sweden 23-Oct-2001Denmark 12-Oct-2002France 15-Nov-2002Germany 6-Mar-2002Switzerland 29-Nov-2002United Arab Emirates 24-Sep-2003Finland 3-Sep-2004United Kingdom 18-Mar-2004Belgium and Luxembourg 18-Jul-2006Viet Nam 16-Jan-2007India 19-Feb-2009
DTTs, as of December 2010
Economy Treaty Date of signaturePortugal Income and Capital 21-Mar-1991Mauritius Income and Capital 14-Feb-1997United Arab Emirates Income and Capital 24-Sep-2003South Africa Income 18-Sep-2007
Greenfield FDI projects, announced in 2003-2010
Name of companyEstimated investment ($ million)
Estimated jobs
createdYear Home country Sector Key business function
Ayr Logistics 5 500 1 267 2008 United States Coal, oil and natural gas ManufacturingPortucel Soporcel Group 2 300 3 000 2010 Portugal Paper, printing and packaging ManufacturingRashtriya Chemicals & Fertilizers 2 000 3 000 2008 India Chemicals ManufacturingJindal Organisation 1 587 171 2008 India Coal, oil and natural gas ManufacturingVale 1 209 308 2007 Brazil Coal, oil and natural gas ExtractionSASOL 1 200 238 2004 South Africa Coal, oil and natural gas ExtractionVale 749 120 2009 Brazil Coal, oil and natural gas ElectricityNorsk Hydro 522 215 2006 Norway Coal, oil and natural gas ExtractionRiversdale Mining 522 215 2008 Australia Coal, oil and natural gas ExtractionSASOL 522 215 2008 South Africa Coal, oil and natural gas ExtractionKenmare Resources 500 734 2007 Ireland Metals ExtractionRiversdale Mining 481 289 2010 Australia Coal, oil and natural gas ExtractionSeacom 468 131 2009 Mauritius Communications ICT and Internet infrastructureKenmare Resources 365 536 2004 Ireland Metals ExtractionTelkom 260 1 400 2003 South Africa Communications ICT and Internet infrastructureVale 250 59 2008 Brazil Coal, oil and natural gas ExtractionArcelorMittal 223 448 2008 Luxembourg Metals ManufacturingArcelorMittal 223 448 2007 Luxembourg Metals ManufacturingCimpor 211 260 2008 Portugal Building and construction ManufacturingBHP Billiton 204 447 2003 Australia Metals ManufacturingDubai World 200 564 2008 United Arab Emirates Hotels and tourism ConstructionGalp Energia 171 152 2009 Portugal Alternative/renewable energy ManufacturingTongaat-Hulett 159 383 2007 South Africa Food and tobacco ExtractionRezidor Hotel Group 128 211 2008 Belgium Hotels and tourism ConstructionElsewedy Electric 100 12 2010 Egypt Coal, oil and natural gas ElectricityKenmare Resources 100 147 2008 Ireland Metals ExtractionAfrican Queen Mines 93 994 2008 Canada Minerals ExtractionSvensk Etanolkemi 90 166 2008 Sweden Alternative/renewable energy ManufacturingMoncada Costruzioni 90 166 2008 Italy Alternative/renewable energy ManufacturingAyr Logistics 80 703 2008 United States Real estate ConstructionVodafone 60 86 2010 United Kingdom Communications ICT and Internet infrastructureUniversal Leaf 55 1 600 2006 United States Food and tobacco ManufacturingTongaat Hulett 52 345 2003 South Africa Food and tobacco ManufacturingPescaNova 52 345 2009 Spain Food and tobacco ManufacturingAfrican Medical Investments 48 172 2010 United Kingdom Healthcare ConstructionLonrho 47 399 2009 United Kingdom Food and tobacco ManufacturingNestle 47 260 2010 Switzerland Food and tobacco ManufacturingMassmart 43 230 2004 South Africa Consumer products RetailNestle 33 171 2010 Switzerland Food and tobacco Logistics, distribution and transportCotton Company (Cottco) 31 561 2003 Zimbabwe Textiles ManufacturingBakhresa 30 167 2010 Tanzania, United Rep. of Food and tobacco ManufacturingGrupo Visabeira 30 85 2003 Portugal Hotels and tourism ConstructionJaipuria Group 30 261 2010 India Beverages ManufacturingPick n Pay 24 275 2010 South Africa Food and tobacco RetailSABMiller 21 262 2009 United Kingdom Beverages ManufacturingCapital Africa Steel 21 100 2009 South Africa Industrial machinery ManufacturingYu Xiao Real Estate 20 25 2007 China Building and construction materials Manufacturing

Mozambique163
Other relevant information
Membership of relevant international agreements as of January 2011: MIGA, ICSID, CREFAA, TRIMS, GATS and TRIPS•Address of investment agency: None•
Contact: Not availableFortune Globe 500 investors: A.P. Moller - Marsk A/S, Alcatel-Lucent Denmark A/S, Bayer Ag, Bt Group Plc, Maruha Nichiro Holdings, •Inc., Mitsubishi Corporation, Randstad Holding Nv, Rio Tinto Plc, Siemens Ag, Total Sa, Vattenfall Ab, Vodafone Group PlcMember of WAIPA as of January 2011: No•
Data on foreign affiliates of the United States in Mozambique, 1995-2008(Millions of dollars in assets, wages and salaries, value added and sales; thousands in employees)
Variable 1995 1996 1997 1998 1999 2000 2001 2002 2003 2004 2005 2006 2007 2008Number 1 1 1 1 1 1 2 2 1 1 - - - -Assets 8 8 .. 11 .. .. .. .. .. 35 15 15 15 15Employees 0.1 0.1 - .. .. .. .. .. .. 0.4 0.4 0.4 0.4 0.4Wages and salaries - - - .. .. .. .. .. .. 3 3 3 3 3Value added 3 3 2 2 .. .. .. .. .. 13 1 1 1 1Sales - - - 20 .. .. .. .. .. .. .. .. .. ..
Selected foreign affiliates in Mozambique, 2010
Company Home economy Industry Sales Employment Year of est.
Siemens Limitada Germany Electronic parts and equipment, nec 27 230 21 2002Hotel Tivoli Hotelaria E Servicos Lda Portugal Hotels and motels 447 30 1999Banco International De Mozambique S A R L Portugal Commercial banks, nec 166 1 400 2006Bci Fomento Portugal Commercial banks, nec 86 843 1996Cimentos De Mocambique Sarl Portugal Concrete products, except block and brick 72 426 1994J L M Industries Lda South Africa Retail stores, nec 32 .. ..Seguradora Internacional De Mozambique Sarl Portugal Insurance carriers, nec 23 115 ..Opca-Obras Publicas E Cimentos Armados Sa Portugal Residential construction, nec 9 500 1992Cimbetao - Cimpor Betao Mozambique Sarl Portugal Concrete products, except block and brick 9 22 1998Aguas De Mozambique Sarl Portugal Water supply 8 570 1999Entreposto Frigorifico De Pesca Japan .. 7 10 1945Soares Da Costa Mocambique SARL Portugal Engineering services 6 300 1990Soares Da Costa Mocambique Sarl Portugal Nonresidential building construction, nec 6 200 1990Colgate Palmolive Mocambique LDA United States Soap & other detergents, except specialty cleaners 5 110 1993Sociedade Mocambicana Do Acumulador Portugal Electrical apparatus and equip 4 180 1965Exploracoes Mineiras United Kingdom Gold ores 3 50 2004Sociedade Geral De Empreitadas Lda Spain Nonresidential building construction, nec 2 570 1958Tintas Cin De Mozambique SARL Portugal Paints, varnishes, lacquers, & allied products 1 39 1972Aquatec Lda Portugal Plastics materials and basic forms and shapes 1 22 1998Enop - Engenharia E Obras Publicas Lda Portugal Engineering services 1 60 1998Ferromocambique Comercio E Industria Portugal Metals service centers and offices 1 30 1998Macaloe Lda Portugal .. 1 150 2000Alcatel Lucent Denmark A/S Mozambique Branch Denmark Communications services, nec .. 76 410 2001Group 4 Securicor Mozambique Limited United Kingdom Security systems services .. 1 600 ..Sasol Petroleum Temane Limitada South Africa Oil and gas field exploration services .. 700 1998Cervejas De Mocambique Sarl United Kingdom Malt beverages .. 700 1995Brithol Michcoma Mocambique Lda United Kingdom Office equipment .. 500 1987Vm Sa United Kingdom Radiotelephone communications .. 187 2003Marmoles De Mozambique Sarl Portugal Dimension stone .. 140 1968Impar - Companhia De Seguros Portugal Insurance agents, brokers, and service .. 125 1993Mocambique Farms Lda Mauritius Poultry slaughtering and processing .. 120 2004Steeladale Mocambique Lda South Africa Fabricated structural metal .. 106 1997Visabeira Mocambique Limitada Portugal Offices of holding companies, nec .. 60 1990Lusomundo Mocambique Lda Portugal Services allied to motion picture distribution .. 50 1996Van Leer Mocambique Lda United States Durable goods, nec .. 49 1998L E M E Agencia De Navegacao Lda Portugal Arrangement of transportation of freight and cargo .. 40 1999Edimetal Mozambique Lda Portugal Metal doors, sash, trim .. 36 1993Orey (Mocambique) Comercio E Servicios Portugal Arrangement of transportation of freight and cargo .. 30 1998Steeledale Mocambique Lda South Africa Steel works, blast furnaces, and rolling mills .. 30 1997Texto Editores Lda Portugal Books: publishing, or publishing & printing .. 30 1996Higest De Mozambique Lda Portugal Farm supplies .. 25 1995Petrogal Mocambique Limitda Portugal Offices of holding companies, nec .. 20 1997Construcoes Edgar Miller Mocambique Portugal Nonresidential building construction, nec .. 20 1994Cornastone Mocambique Lda South Africa Computer programming services .. 16 2001Galp Mozambique Lda Portugal Petroleum and petroleum products wholesalers, nec .. 10 2008Parmalat Mocambique Produtos Alimentares Italy Fluid milk .. 10 1996Parmalat Sarl Central Leteira De Maputo Italy Fluid milk .. 10 1996Transitex Mozambique, Lda Portugal Transportation services, nec .. 6 2008B P I Dealer Portugal Business services, nec .. 5 2003Imobci Lda Portugal Real estate agents and managers .. 5 1998Simi Mozambique Lda Portugal Machinery,except electrical .. 5 ..Mundo Inox Lda South Africa Steel foundries, nec .. 4 2004Bpi Dealer - Sociedade Financeira Portugal Business services, nec .. 3 1999Imopar Imobiliaria De Mozambique Sarl Portugal Real estate agents and managers .. 2 1997E C L Servicos Ltda United Kingdom Rolling mill machinery and equipment .. 1 2002Movex Mocambique - Aluguer E Venda Portugal Prefabricated wood buildings and components .. .. 2007Schering Lusitana Africa, Lda Germany Drug stores and proprietary stores .. .. 2006Armor Group Mozambique Ltda United Kingdom Services, nec .. .. 2005Salvorhoteis Mocambique Unvestimentos Portugal Hotels and motels .. .. 1994

Foreign Direct Investment in LDCs: Lessons Learned from the Decade 2001-2010 and the Way Forward164
Area (‘000 km2): 2008 676.6 Population (millions): 2010 50.5 Capital city: Nay Pyi TawOfficial language: Myanmar Currency: KyatExchange rate (period average): 2009 Kt 5.38751 =$1 GDP in current prices (millions of dollars): 2009 25 924 Exports of goods and services (millions of dollars): 2009 4 883 Imports of goods and services (millions of dollars): 2009 3 984 Official development assistance (millions of dollars): 2009 242 External debt (millions of dollars): 2009 8 186
FDI inflows, 1992-2010 (Millions of dollars)
FDI inflows as a percentage of gross fixed capital formation, 1992-2010
Note: Data for 2010 are estimates.
Note: Data for 2010 are estimates.
Myanmar
Inward FDI: geographical breakdown, by source, 2003-2009(Millions of dollars)
Region/economy Inward flows Inward stock2003 2004 2005 2006 2007 2008 2009 2003 2004 2005 2006 2007 2008 2009
Cyprus - - - - - - - - - - - - - 4.1 Czech Republic - 0.0 - 0.2 - - - - - - 0.1 - - - - - France - 32.7 - - - 51.4 41.1 - 115.7 54.2 190.7 - - 43.5 78.0 62.6 105.2 Germany 2.3 - - - - - - - - - - - - - Portugal - - - - - - - 0.1 - - - - - - Sweden - 0.2 - 0.1 - 0.3 - 0.1 - 0.1 - 0.3 - 0.4 - - - - - - - United States - - 1.0 - - - - 1.0 - - 1.0 - - - - Japan - - 18.1 31.7 - 7.9 - 3.6 - 1.3 - - - - - - - China - 4.1 11.5 12.6 92.3 232.5 - 10.2 20.2 23.6 163.1 261.8 499.7 - Korea, Republic of 0.1 - 0.3 - 0.5 0.1 0.6 35.6 148.4 34.9 32.6 30.3 30.2 30.8 52.0 195.7 Malaysia 0.5 - - 13.4 55.7 49.6 - 53.0 53.0 53.3 71.0 133.8 175.4 - Singapore - - - - - - - 665.7 429.6 880.2 649.5 1 114.7 851.0 - Thailand 84.5 70.8 111.5 72.3 667.7 281.9 - 386.0 462.0 564.0 726.0 2 164.0 2 392.0 -
0
200
400
600
800
1 000
149 92 135 318 581 879 684 304 208 192 191 291 251 236 428 258 283 579 6301992 1993 1994 1995 1996 1997 1998 1999 2000 2001 2002 2003 2004 2005 2006 2007 2008 2009 2010
0
20
40
60
80
100
19.9 13.6 16.5 30.0 46.2 71.8 89.7 39.6 24.2 21.6 18.8 26.4 21.0 15.7 23.0 9.9 8.0 17.0 16.3
1992 1993 1994 1995 1996 1997 1998 1999 2000 2001 2002 2003 2004 2005 2006 2007 2008 2009 2010
BangladeshIndia
India
NepalBhutan
China
Thailand
Lao PDR
Viet Nam
Cambodia
Nay Pyi Taw

Myanmar 165
Cross-border M&A sales, 1994-2010 (Millions of dollars and number)
Income on FDI, 1992-2009 (Millions of dollars)
FDI inward stock, 1992-2009 (Millions of dollars)
Note: Data for 2010 are estimates.
0
2 000
4 000
6 000
8 000
665 757 892 1 210 1 790 2 669 3 353 3 657 3 865 4 057 4 248 4 539 4 791 4 862 5 005 5 263 5 546 5 869 6 4991992 1993 1994 1995 1996 1997 1998 1999 2000 2001 2002 2003 2004 2005 2006 2007 2008 2009 2010
0
1 000
2 000
3 000
4 000
152.9 - - - - - - 35.2 137.2 527.9 582.8 751.6 761.6 1 402.4 1 317.0 1 832.8 2 559.8 2 886.81992 1993 1994 1995 1996 1997 1998 1999 2000 2001 2002 2003 2004 2005 2006 2007 2008 2009
- 5
-
5
10
15
20
$m
illio
n
0
1
2
3
4
Num
ber
ValueNumber
- - - - - - - - - 17.3 - - - - 0.6 - - 0.3 -- 2 - 2 1 - - 1 2 4 2 - 1 1 - 1 -
1994 1995 1996 1997 1998 1999 2000 2001 2002 2003 2004 2005 2006 2007 2008 2009 2010
Largest cross-border M&A deals, 1994-2010
Acquired company Industry Ult. acquiring companyUlt. home economy
Value Year
Yetagun Oil Project,Myanmar Crude petroleum and natural gas Petronas Internat'l Malaysia 400 2003Texaco Inc Oil and gas field exploration services Premier Oil PLC United Kingdom 260 1997Goldwater Co Ltd Crude petroleum and natural gas Van der Horst Ltd Singapore 17 2003Air Mandalay Air transportation, scheduled Kemayan Corp Bhd Malaysia 7 1995FairPrice International Investors, nec Singapore Investmt Corp Singapore 2 1995Berger Paints Ltd Paints, varnishes & allied products EHL Myanmar 1 2007Myanmar Sea Master Co Ltd Canned and cured fish and seafoods Mascot Industries Co Ltd Myanmar 0 2009Myanmar DFS Ltd(Ben Foods Groceries, general line Undisclosed Acquiror unspecified 0 1998Berger Paints Ltd Paints, varnishes & allied products Berger International Ltd Singapore 0 2003Premier Oil PLC Crude petroleum and natural gas Petronas Carigali Malaysia - 1997Daewoo International Corp Crude petroleum and natural gas Korea Gas Corp Korea, Republic of - 2001Daewoo International Corp Crude petroleum and natural gas Gas Authority of India India - 2002Daewoo International Corp-A Crude petroleum and natural gas Oil & Natural Gas Corp India - 2002Rothmans of Pall Mall Ltd Cigarettes Distinction Invest Hldgs Singapore - 2003Block A-3 Crude petroleum and natural gas Daewoo International CorpKorea, Republic of - 2004HL Myanmar Investment Pte Investors, nec Hong Leong Corp Hldgs Singapore - 2004Myanmar Tat Hong Ltd Industrial machinery and equip. Undisclosed Acquiror unspecified - 2006

Foreign Direct Investment in LDCs: Lessons Learned from the Decade 2001-2010 and the Way Forward166
Greenfield FDI projects, announced in 2003-2010(Millions of dollars and number)
-
500
1 000
1 500
2 000
$m
illio
n
-
2
4
6
8
Num
ber
Value
Number
765 4 - 227 1 403 1 241 1 893 3725 1 - 2 3 6 6 5
2003 2004 2005 2006 2007 2008 2009 2010
Greenfield FDI projects, announced in 2003-2010
Name of companyEstimated investment ($ million)
Estimated jobs
createdYear Home country Sector Key business function
Daewoo 1 703.5 1 876 2009 Korea, Rep of Coal, oil and natural gas ExtractionPTT 1000 1 040 2007 Thailand Coal, oil and natural gas ExtractionChina Power Investment 669.5 131 2008 China Coal, oil and natural gas ElectricityDaewoo 407.8 204 2003 Korea, Rep of Coal, oil and natural gas ExtractionONGC 362.1 211 2007 India Coal, oil and natural gas ExtractionInterra Resources 362.1 211 2008 Singapore Coal, oil and natural gas ExtractionHoa Sen Group 300 860 2010 Viet Nam Metals ManufacturingIvanhoe Mines 203.5 258 2003 Canada Metals ManufacturingIvanhoe Mines 172.8 159 2006 Canada Metals ExtractionChina Nonferrous Metal Industry 172.8 159 2008 China Metals Extraction
China National Petroleum 165.8 214 2009 China TransportationLogistics, distribution and transport
Bangkok Airlines 127.9 213 2003 Thailand AerospaceLogistics, distribution and transport
ASV Holding 55.9 218 2010 Viet Nam Pharmaceuticals ManufacturingDNC Asiatic Holdings 54.2 816 2006 Malaysia Non-automotive transport OEM ManufacturingAltundas Textile 41.2 1 654 2007 Turkey Textiles ManufacturingCharoen Pokphand Group 25.3 207 2008 Thailand Food and tobacco ManufacturingTata Group 20 131 2009 India Automotive OEM ManufacturingTexchem Resources 18 118 2003 Malaysia Food and tobacco ManufacturingSacombank 7.4 15 2010 Viet Nam Financial services Business servicesBank for Invest & Develop of Viet Nam 7.4 15 2010 Viet Nam Financial services Business servicesQatar Islamic Bank 7.4 15 2008 Qatar Financial services Business servicesUnited Bank of India 7.4 15 2003 India Financial services Business servicesFocus Energy 4 4 2004 United Kingdom Coal, oil and natural gas ExtractionMalaysian Helicopter Services 3.8 13 2008 Malaysia Aerospace Business servicesFranklinCovey 2.6 11 2009 United States Business services Business servicesViettel 1.4 11 2009 Viet Nam Communications Sales, marketing and supportHoa Sen Group 0.8 5 2010 Viet Nam Metals Sales, marketing and support
BITs, as of December 2010
Economy Date of signaturePhilippines 17-Feb-1998Viet Nam 15-Feb-2000China 12-Dec-2001Lao People's Democratic Rep. 5-May-2003India 24-Jun-2008Thailand 14-Mar-2008
DTTs, as of December 2010
Economy Treaty Date of signatureUnited Kingdom Income and Capital 13-Mar-1950Malaysia Income and Capital 9-Mar-1998Singapore Income and Capital 23-Feb-1999Viet Nam Income 12-May-2000Korea, Republic of Income 22-Feb-2002Thailand Income 7-Feb-2002India Income 20-Sep-2006

Myanmar 167
Other relevant information
Membership of relevant international agreements as of January 2011: TRIMS, GATS and TRIPS•Address of investment agency: None•
Contact: Not availableFortune Globe 500 investors: Bayer Ag, Lsg Lufthansa Service Enterprises Limited, Marubeni-Itochu Tubulars Asia Pte Ltd, •Mitsubishi Corporation, Posco, Siemens Ag, Suzuki Motor Corporation, Toyota Tsusho Corporation, Wilmar China (Bermuda) LimitedMember of WAIPA as of January 2011: No•
Data on foreign affiliates of the United States in Myanmar, 1995-2008(Millions of dollars in assets, wages and salaries, value added and sales; thousands in employees)
Variable 1995 1996 1997 1998 1999 2000 2001 2002 2003 2004 2005 2006 2007 2008
Number 5 5 6 6 2 2 2 2 1 1 1 1 2 2
Assets 98 108 134 67 .. .. .. .. .. .. .. .. .. ..
Wages and salaries 1 1 1 - .. .. .. .. .. - - - .. ..
Value added - 8 - 10 23 - 38 .. .. .. .. .. 48 100 69 .. ..
Data on foreign affiliates of of Myanmar in the United States, 1995-2008
Variable 1995 1996 1997 1998 1999 2000 2001 2002 2003 2004 2005 2006 2007 2008
Number - - - - - - - - - - - - 1 -
Selected foreign affiliates in Myanmar, 2010
Company Home economy Industry Sales EmploymentYear of
est.Myanmar Haewae Co., Ltd Korea Rep. of Ship building and repairing .. 1 600 1998Premier Petroleum Myanmar Ltd United Kingdom Oil and gas field exploration services .. 300 2000Tusit Resort United States Hotels and motels .. 250 ..Diethelm & Co Ltd Switzerland Drugs, drug proprietaries, and druggists' sundries .. 200 1995
Ranbaxy Laboratories Limited IndiaDrugs, drug proprietaries, and druggists' sundries
.. 20 1997
Siemens Limited Germany Electronic parts and equipment, nec .. 14 ..Myanmar Nusantara Trading Ltd Singapore Automotive parts, supplies .. 11 ..Myanmar Posco Steel Company Limited Korea Rep. of Steel works, blast furnaces, and rolling mills .. .. 1997Bates Myanmar Limited Ireland Advertising agencies .. .. ..Berger Paints (Myanmar) Limited India .. .. .. ..Berger Paints Manufacturing Limited India .. .. .. ..Bj Service International, Inc. United States .. .. .. ..Chiyoda & Public Works Co. Ltd Japan Engineering services .. .. ..Cms Translink Parami Logistics Virgin Islands UK .. .. .. ..Eac-My Chemicals (Yangon) Co Ltd Thailand Chemicals and allied products, nec .. .. ..Gandamar Office Machines Limited United States Office equipment .. .. ..Golden Hill Tower Ltd. Japan .. .. .. ..Mitsubishi Corporation Japan .. .. .. ..Miwon Shwe Tha Zin Co., Ltd Korea Rep. of .. .. .. ..Myanma Steel Industries Co.,Ltd. Singapore .. .. .. ..Myanmar Aventis Cropscience Ltd. Germany .. .. .. ..Myanmar Berger Building Products Limited India .. .. .. ..Myanmar Bpl Resources Ltd Singapore .. .. .. ..Myanmar Jardine Schindler Limited Switzerland Industrial machinery and equipment .. .. ..Myanmar Kuok Oils & Grains Ltd Bermuda Nondurable goods, nec .. .. ..Myanmar Lsg Lufthansa Service Ltd. Hong Kong Eating places .. .. ..Myanmar Suzuki Motor Company Limited
Japan Motor vehicles and passenger car bodies .. .. ..
Myanmer Toyota Tsusho Co., Ltd. Japan .. .. .. ..Pttep International Limited Thailand Oil and gas field exploration services .. .. ..Sgs (Myanmar) Limited Switzerland Commercial nonphysical research .. .. ..

Foreign Direct Investment in LDCs: Lessons Learned from the Decade 2001-2010 and the Way Forward168
China
India
Kathmandu
Area (‘000 km2): 2008 147.2 Population (millions): 2010 29.9 Capital city: KathmanduOfficial language: Nepali Currency: Nepalese rupeeExchange rate (period average): 2009 NPR 69.7617 =$1 GDP in current prices (millions of dollars): 2009 13 436 Exports of goods and services (millions of dollars): 2009 1 684 Imports of goods and services (millions of dollars): 2009 5 001 Official development assistance (millions of dollars): 2009 505 External debt (millions of dollars): 2009 3 683
FDI inflows, 1992-2010 (Millions of dollars)
FDI inflows as a percentage of gross fixed capital formation, 1992-2010
Note: Data for 2010 are estimates.
Note: Data for 2010 are estimates.
Nepal
Inward FDI: geographical breakdown, by source, 2003-2009(Millions of dollars)
Region/economy Inward flows Inward stock2003 2004 2005 2006 2007 2008 2009 2003 2004 2005 2006 2007 2008 2009
Cyprus - 0.1 - - - - - - 0.2 0.1 0.1 0.2 0.2 - Germany - 1.1 - 1.2 - 1.2 - - - - - - - - - - - Sweden - - - - - - - - - - - - - - Norway - - - - - - - 41.2 47.7 44.6 16.1 - - - United States - - 1.0 - 1.0 - 1.0 - 1.0 1.0 - 2.0 2.0 1.0 1.0 1.0 1.0 2.0 1.0 Japan - - - - - 0.5 - - - - - - - - Bangladesh 2.4 0.4 0.5 - - - - - - - - - - - China - 1.7 1.4 0.3 1.0 - 1.2 1.8 3.3 3.0 3.6 8.7 8.7 14.1 Korea, Republic of - - - - 4.3 0.2 0.4 6.4 6.4 6.4 6.4 10.7 4.6 5.0 Malaysia - - - - - 1.4 - 3.6 3.6 3.6 3.9 4.1 5.3 - Philippines 0.1 - - - - - - - - - - - - -
- 20
0
20
40
60
- - - - 19 23 12 4 - 21 - 6 15 - 2 - 7 6 1 39 391992 1993 1994 1995 1996 1997 1998 1999 2000 2001 2002 2003 2004 2005 2006 2007 2008 2009 2010
- 1
0
1
2
3
0.0 0.0 0.0 0.0 1.7 1.9 1.0 0.4 0.0 1.7 -0.5 1.0 0.0 0.1 -0.3 0.2 0.0 1.2 1.1
1992 1993 1994 1995 1996 1997 1998 1999 2000 2001 2002 2003 2004 2005 2006 2007 2008 2009 2010

Nepal 169
Cross-border M&A sales, 1994-2010 (Millions of dollars and number)
Income on FDI, 1992-2009 (Millions of dollars)
FDI inward stock, 1992-2009 (Millions of dollars)
Note: Data for 2010 are estimates.
0
50
100
150
200
250
14 14 14 14 33 56 68 72 72 116 110 125 125 127 120 126 127 166 2051992 1993 1994 1995 1996 1997 1998 1999 2000 2001 2002 2003 2004 2005 2006 2007 2008 2009 2010
0
20
40
60
- - - - - - - - - - 44.8 42.1 44.9 56.6 55.7 54.0 44.1 44.21992 1993 1994 1995 1996 1997 1998 1999 2000 2001 2002 2003 2004 2005 2006 2007 2008 2009
- 15
- 10
- 5
-
5
10
15
$m
illio
n
0
2
4
Num
ber
ValueNumber
- 0.9 - - - - - 12.7 - - - - - 14.5 - 12.8 - -- 2 - - - - 1 1 - - 1 - 1 - 3 - -
1994 1995 1996 1997 1998 1999 2000 2001 2002 2003 2004 2005 2006 2007 2008 2009 2010
Largest cross-border M&A deals, 1994-2010
Acquired company Industry Ult. acquiring company Ult. home economy Value YearBhote Koshi Power Co Private Ltd Electric services Himal Intl Energy Ltd Nepal 15 2006Elder Universal Pharmaceuticals Pharmaceutical preparations Elder Pharmaceuticals India 13 2008Himal International Power Corp Electric services Kraft Norway 13 2001Nepal Arab Bank Ltd Banks National Bank of Bangldsh Bangladesh 12 1995Bottlers Nepal Ltd Bottled & canned soft drinks Fraser & Neave Ltd Singapore 1 1995
Jenson & Nicholson LtdPaints, varnishes & allied products
Berger Paints India Ltd India 0 2000
Coca-Cola Co Bottled & canned soft drinks Coca-Cola Sabco South Africa - 2004
Himtal Hydropower LtdCogeneration, alternative energy
GMR Holdings Pvt India - 2008
Colgate-Palmolive Pvt Ltd Soap & other detergents Everest Hygiene Prod Nepal - 2008

Foreign Direct Investment in LDCs: Lessons Learned from the Decade 2001-2010 and the Way Forward170
Greenfield FDI projects, announced in 2003-2010(Millions of dollars and number)
-
100
200
300
400
$m
illio
n
-
2
4
6
8
Num
ber
ValueNumber
2 60 - 3 3 376 259 3031 1 - 2 1 7 4 4
2003 2004 2005 2006 2007 2008 2009 2010
Greenfield FDI projects, announced in 2003-2010
Name of companyEstimated investment ($ million)
Estimated jobs
createdYear Home country Sector Key business function
Teliasonera 250 395 2009 Sweden CommunicationsICT and Internet infrastructure
Kamdhenu Ispat 203.5 258 2008 India Metals ManufacturingSinohydro 189.6 27 2010 China Alternative/renewable energy Electricity
Air Arabia 127.2 116 2008 United Arab Emirates AerospaceLogistics, distribution and transport
Indian Railways 102.5 592 2010 India Non-automotive transportLogistics, distribution and transport
Cairn Energy 60 62 2004 United Kingdom Coal, oil and natural gas ExtractionDabur India 35.6 64 2008 India Pharmaceuticals Research and developmentMashreqbank 7.4 15 2010 United Arab Emirates Financial services Business servicesState Bank of India 7.4 15 2009 India Financial services Business servicesMalaysian Helicopter Services 3.8 13 2008 Malaysia Aerospace Business servicesSamsung 3.5 116 2010 Korea, Rep .of Consumer electronics RetailNokia 2.8 22 2008 Finland Communications Sales, marketing and supportBangkok International Hospital 2.6 11 2007 Thailand Healthcare Business servicesOmnicom Group 2.6 11 2008 United States Business services Business servicesElder 2.24 3 2006 India Pharmaceuticals ManufacturingBeta Group 2 15 2003 India Food and tobacco ManufacturingGati 1 8 2006 India Transportation Sales, marketing and supportBahrain Air 0.9 9 2009 Bahrain Aerospace Sales, marketing and supportDiethelm Keller Holding 0.8 7 2009 Switzerland Hotels and tourism Sales, marketing and support
BITs, as of December 2010
Economy Date of signatureFrance 2-May-1983Germany 20-Oct-1986United Kingdom 2-Mar-1993Mauritius 3-Aug-1999
DTTs, as of December 2010
Economy Treaty Date of signatureIndia Income and Capital 18-Jan-1987Norway Income and Capital 13-May-1996Thailand Income and Capital 2-Feb-1998Mauritius Income and Capital 3-Aug-1999Sri Lanka Income and Capital 6-Jul-1999Korea, Republic of Income 5-Oct-2001

Nepal 171
Other relevant information
Membership of relevant international agreements as of January 2011: MIGA, ICSID, CREFAA, TRIMS, GATS and TRIPS•Address of investment agency: Government of Nepal Ministry of Industry, Singhadurbar, Kathmandu, NEPAL•
Contact: Tel: +977-1-4211579, Fax: +977-1-4211619, Email : [email protected] Globe 500 investors: A.P. Moller - Marsk A/S, American Express Company, Hindustan Unilever Limited, Mitsui & Co. •Ltd., Sanofi-AventisMember of WAIPA as of January 2011: YES•
Data on foreign affiliates of the United States in Nepal, 1995-2008(Millions of dollars in assets, wages and salaries, value added and sales; thousands in employees)
Variable 1995 1996 1997 1998 1999 2000 2001 2002 2003 2004 2005 2006 2007 2008Number - - 1 1 2 2 2 1 - 1 1 2 3 3Assets - - .. .. .. .. .. .. 6 20 .. 62 117 128Employees - - - .. .. .. .. .. - 0.2 .. 0.2 0.3 0.3Wages and salaries - - - .. .. .. .. .. - 3 .. 3 4 4Value added - - 2 10 .. .. .. .. - 3 .. 5 13 13Sales - - - .. .. .. .. 1 5 23 .. 59 86 93
Data of foreign affiliates of Nepal in the United States, 1995-2008(Millions of dollars in assets, value added and sales)
Variable 1995 1996 1997 1998 1999 2000 2001 2002 2003 2004 2005 2006 2007 2008Number 1 1 - - - - - - - - - - - -Assets 29 28 - - - - - - - - - - - -Value added 17 17 - - - - - - - - - - - -Sales 1 1 - - - - - - - - - - - -
Selected foreign affiliates in Nepal, 2010
Company Home economy Industry Sales EmploymentYear of
est.Dabur Nepal Private Limited India Pharmaceutical preparations .. 1 000 1989Surya Nepal Private Limited India Cigarettes .. 800 2002Mahendra Sugar & General Industries Pte United Kingdom Cane sugar, except refining .. 330 ..Hoechst Nepal Private Ltd France Pharmaceutical preparations .. 304 1986Hotel Himalaya Pte Limited Japan Hotels and motels .. 200 1987Unilever Nepal Limited India Soap & other detergents, except specialty cleaners .. 150 ..Ac Nielsen Nepal Luxembourg .. .. .. ..American Express Bank Limited United States Services, nec .. .. ..American West Airlines United States .. .. .. ..Aramex International Jordan .. .. .. ..
Asian Paint Nepal Private Limited IndiaPaints, varnishes, lacquers, & allied products
.. .. ..
Csc & Co United States Accounting, auditing, and bookkeeping services .. .. ..Hyatt Regency Kathmandu United States Hotels and motels .. .. ..Interactive Group (P) Ltd United States Newspapers: publishing, or publishing & printing .. .. ..Japan Airlines Japan .. .. .. ..Korean Airlines Korea Rep Of .. .. .. ..Maccaferri Nepal Private Limited Italy Construction machinery and equipment .. .. ..Maersk Nepal Private Limited Denmark Business associations .. .. ..Mccann-Erickson Nepal United States .. .. .. ..Mitsui And Co., Ltd Japan Chemicals and allied products, nec .. .. ..Miyama Company Limited Japan .. .. .. ..Sita World Travel Nepal Private Limited Switzerland Hotels and motels .. .. ..Thompson Nepal Private Lmited Ireland Advertising agencies .. .. ..

Foreign Direct Investment in LDCs: Lessons Learned from the Decade 2001-2010 and the Way Forward172
Area (‘000 km2): 2008 1 267.0 Population (millions): 2010 15.9 Capital city: NiameyOfficial language: French Currency: CFA francExchange rate (period average): 2009 CFAfr 447.805 =$1 GDP in current prices (millions of dollars): 2009 5 081 Exports of goods and services (millions of dollars): 2009 956 Imports of goods and services (millions of dollars): 2009 2 007 Official development assistance (millions of dollars): 2009 257 External debt (millions of dollars): 2009 991
FDI inflows, 1992-2010 (Millions of dollars)
FDI inflows as a percentage of gross fixed capital formation, 1992-2010
Note: Data for 2010 are estimates.
Note: Data for 2010 are estimates.
NigerAlgeria
Libyan ArabJamahiriya
Chad
Mali
NigeriaBurkinaFaso
Niamey
Benin
Inward FDI: geographical breakdown, by source, 2003-2009(Millions of dollars)
Region/economy Inward flows Inward stock2003 2004 2005 2006 2007 2008 2009 2003 2004 2005 2006 2007 2008 2009
Cyprus - - - - - - - - - - - - - - France 4.5 - 8.7 - 5.0 - 5.0 - - - - - - - - - - Sweden - - - - - - - - - - - - - - United States - 1.0 2.0 - 2.0 - - - - - 16.0 2.0 - - - - - Japan - - 0.6 - 0.1 - 0.9 - 0.2 3.0 - - - - - - - China - 1.5 5.8 7.9 100.8 - 0.0 - 12.5 14.0 20.4 33.0 134.5 136.5 -
- 250
0
250
500
750
1 000
56 - 34 - 11 14 2 17 - 1 - 8 23 2 11 20 30 51 129 566 739 9471992 1993 1994 1995 1996 1997 1998 1999 2000 2001 2002 2003 2004 2005 2006 2007 2008 2009 2010
- 20
0
20
40
60
23.7 -12.9 -6.1 7.3 1.0 7.5 -0.5 0.1 3.8 8.8 0.8 2.9 4.2 4.2 6.1 13.1 42.7 44.7 43.1
1992 1993 1994 1995 1996 1997 1998 1999 2000 2001 2002 2003 2004 2005 2006 2007 2008 2009 2010

Niger 173
There are no cross-border M&A sales, 1994-2010
Income on FDI, 1992-2009 (Millions of dollars)
FDI inward stock, 1992-2009 (Millions of dollars)
Note: Data for 2010 are estimates.
Greenfield FDI projects, announced in 2003-2010(Millions of dollars and number)
0
500
1 000
1 500
2 000
2 500
358 324 312 327 329 346 345 38 45 61 70 79 115 100 161 277 624 1 363 2 3101992 1993 1994 1995 1996 1997 1998 1999 2000 2001 2002 2003 2004 2005 2006 2007 2008 2009 2010
-20
0
20
40
60
15.4 - 6.2 7.8 3.8 4.6 3.7 - 0.9 4.0 4.4 3.6 6.6 10.2 15.1 20.9 28.8 40.5 51.2 49.91992 1993 1994 1995 1996 1997 1998 1999 2000 2001 2002 2003 2004 2005 2006 2007 2008 2009
-
1 000
2 000
3 000
4 000
$m
illio
n
-
2
4Nu
mbe
r
ValueNumber
481 - - 1 - 3 087 - 1001 - - 1 - 2 - 1
2003 2004 2005 2006 2007 2008 2009 2010
Greenfield FDI projects, announced in 2003-2010
Name of companyEstimated investment ($ million)
Estimated jobs
createdYear Home country Sector Key business function
China National Petroleum 1 586.6 171 2008 China Coal, oil and natural gas ManufacturingAreva Group 1500 1 400 2008 France Metals ExtractionChina National Petroleum 480.9 289 2003 China Coal, oil and natural gas Extraction
Bharti Group 100 144 2010 India CommunicationsICT and Internet infrastructure
Orezone Resources 0.9 1 2006 Canada Metals Extraction

Foreign Direct Investment in LDCs: Lessons Learned from the Decade 2001-2010 and the Way Forward174
BITs, as of December 2010
Economy Date of signatureSwitzerland 28-Mar-1962Germany 29-Oct-1964Tunisia 5-Jun-1992Algeria 16-Mar-1998Egypt 4-Mar-1998
DTTs, as of December 2010
Economy Treaty Date of signatureFrance Income and Capital 1-Jun-1965
Data on foreign affiliates of the United States in Niger, 1995-2008(Millions of dollars in assets, value added and sales)
Variable 1995 1996 1997 1998 1999 2000 2001 2002 2003 2004 2005 2006 2007 2008Number 2 2 2 2 2 2 2 2 2 1 1 1 1 1Assets 16 18 19 19 .. .. .. .. .. .. .. .. .. ..Value added - - - 1 .. .. .. .. .. 4 5 5 .. ..Sales - - - 13 .. .. .. .. .. .. .. .. .. ..
Selected foreign affiliates in Niger, 2010
Company Home economy Industry Sales EmploymentYear of
est.Societe Des Mines De L Air Sa France Uranium-radium-vanadium ores 861 1 000 1968Compagnie Miniere D Akouta Sa France Uranium-radium-vanadium ores 819 1 214 1974
Total Niger S A FrancePetroleum and petroleum products wholesalers, nec
248 55 1976
Societe Maersk Niger Sa DenmarkArrangement of transportation of freight and cargo
1 4 1997
Industrial Gases Plc Germany Industrial gases .. 120 1959Connecteo Niger United Kingdom Services, nec .. .. ..Edocement Ltd Germany Coal mining services .. .. ..Impresit Bakolori Plc Italy Services, nec .. .. ..Niger Afrique Sa Netherlands Piece goods, notions, and other dry goods .. .. ..Societe Nigerienne De CimenterieGermany Brick, stone, and related construction materials .. .. ..
Other relevant information
Membership of relevant international agreements as of January 2011: MIGA, ICSID, CREFAA, TRIMS, GATS and TRIPS•Address of investment agency: Centre de Promotion des Investissements (CPI) Sis à la Chambre de Commerce d’Agriculture, •d’Industrie et d’Atisanat du Niger, Place de la Concertation, BP 209 Niamey-Niger
Contact: Tel: +227 20 73 25 73, Fax : +227 20 73 46 68, E-mail : [email protected], [email protected] Website: http://www.investir-au-niger.org
Fortune Globe 500 investors: A.P. Moller - Marsk A/S, Total Sa•Member of WAIPA as of January 2011: YES•

Rwanda 175
Uganda
Dem. Republicof the Congo
United Republicof Tanzania
Burundi
Area (‘000 km2): 2008 26.3 Population (millions): 2010 10.1 Capital city: KigaliOfficial language: Kinyarwanda, French and EnglishCurrency: Rwanda francExchange rate (period average): 2009 Rwfr 546.849 =$1 GDP in current prices (millions of dollars): 2009 4 981 Exports of goods and services (millions of dollars): 2009 458 Imports of goods and services (millions of dollars): 2009 1 463 Official development assistance (millions of dollars): 2009 523 External debt (millions of dollars): 2009 747
FDI inflows, 1992-2010 (Millions of dollars)
FDI inflows as a percentage of gross fixed capital formation, 1992-2010
Note: Data for 2010 are estimates.
Note: Data for 2010 are estimates.
Rwanda
Inward FDI: geographical breakdown, by source, 2003-2009(Millions of dollars)
Region/economy Inward flows Inward stock2003 2004 2005 2006 2007 2008 2009 2003 2004 2005 2006 2007 2008 2009
Germany 2.3 1.2 - 1.2 - 5.5 2.9 - 2.8 - - - - - - - Sweden - 0.2 - 0.1 - 0.3 - 0.2 - 0.1 - 0.3 - 0.4 - - - - - - - United States - 1.0 1.0 1.0 1.0 1.0 1.0 - 1.0 1.0 1.0 1.0 1.0 1.0 China - - 1.4 3.0 - 0.4 12.9 - 3.3 3.3 4.7 7.7 7.3 20.2 -
0
50
100
150
6 6 - 2 2 3 7 2 8 19 2 3 11 14 31 82 103 119 861992 1993 1994 1995 1996 1997 1998 1999 2000 2001 2002 2003 2004 2005 2006 2007 2008 2009 2010
0
5
10
15
1.7 1.8 0.0 1.2 1.1 1.0 2.4 0.5 2.6 6.4 0.5 1.0 3.7 3.7 6.7 13.4 10.2 11.6 6.7
1992 1993 1994 1995 1996 1997 1998 1999 2000 2001 2002 2003 2004 2005 2006 2007 2008 2009 2010
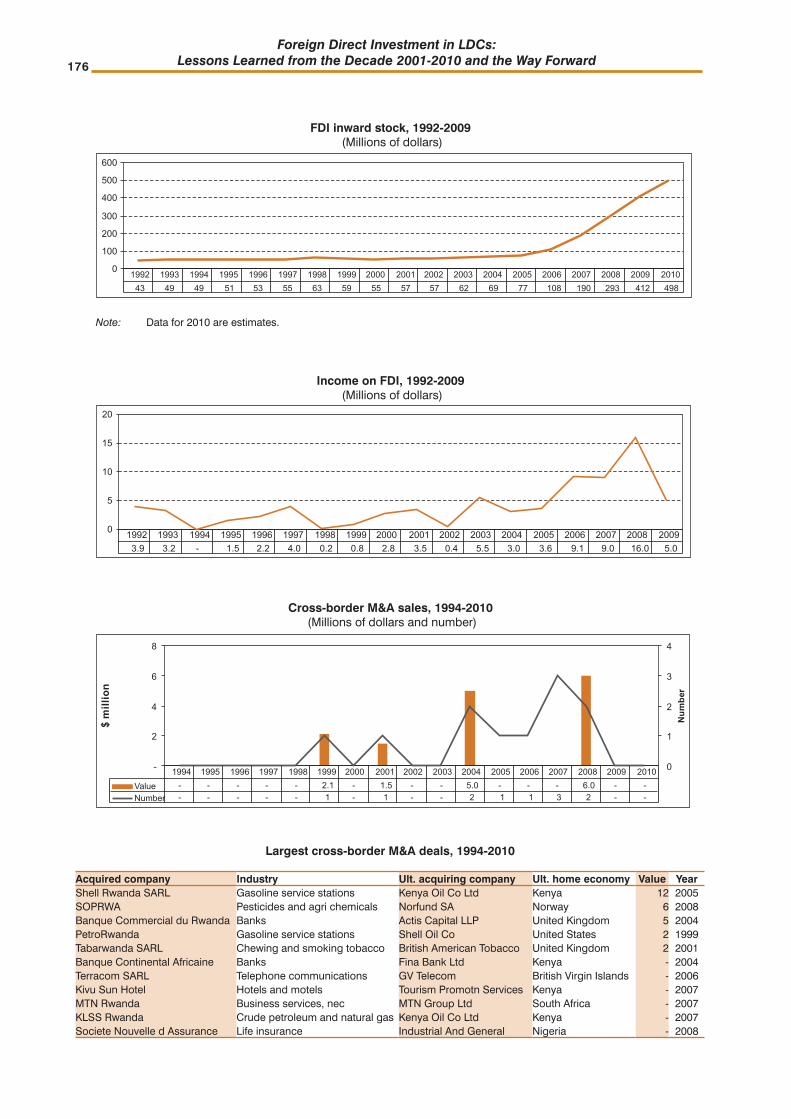
Foreign Direct Investment in LDCs: Lessons Learned from the Decade 2001-2010 and the Way Forward176
Cross-border M&A sales, 1994-2010 (Millions of dollars and number)
Income on FDI, 1992-2009 (Millions of dollars)
FDI inward stock, 1992-2009 (Millions of dollars)
Note: Data for 2010 are estimates.
0
100
200
300
400
500
600
43 49 49 51 53 55 63 59 55 57 57 62 69 77 108 190 293 412 4981992 1993 1994 1995 1996 1997 1998 1999 2000 2001 2002 2003 2004 2005 2006 2007 2008 2009 2010
0
5
10
15
20
3.9 3.2 - 1.5 2.2 4.0 0.2 0.8 2.8 3.5 0.4 5.5 3.0 3.6 9.1 9.0 16.0 5.01992 1993 1994 1995 1996 1997 1998 1999 2000 2001 2002 2003 2004 2005 2006 2007 2008 2009
-
2
4
6
8
$m
illio
n
0
1
2
3
4
Num
ber
ValueNumber
- - - - - 2.1 - 1.5 - - 5.0 - - - 6.0 - -- - - - - 1 - 1 - - 2 1 1 3 2 - -
1994 1995 1996 1997 1998 1999 2000 2001 2002 2003 2004 2005 2006 2007 2008 2009 2010
Largest cross-border M&A deals, 1994-2010
Acquired company Industry Ult. acquiring company Ult. home economy Value YearShell Rwanda SARL Gasoline service stations Kenya Oil Co Ltd Kenya 12 2005SOPRWA Pesticides and agri chemicals Norfund SA Norway 6 2008Banque Commercial du Rwanda Banks Actis Capital LLP United Kingdom 5 2004PetroRwanda Gasoline service stations Shell Oil Co United States 2 1999Tabarwanda SARL Chewing and smoking tobacco British American Tobacco United Kingdom 2 2001Banque Continental Africaine Banks Fina Bank Ltd Kenya - 2004Terracom SARL Telephone communications GV Telecom British Virgin Islands - 2006Kivu Sun Hotel Hotels and motels Tourism Promotn Services Kenya - 2007MTN Rwanda Business services, nec MTN Group Ltd South Africa - 2007KLSS Rwanda Crude petroleum and natural gas Kenya Oil Co Ltd Kenya - 2007Societe Nouvelle d Assurance Life insurance Industrial And General Nigeria - 2008
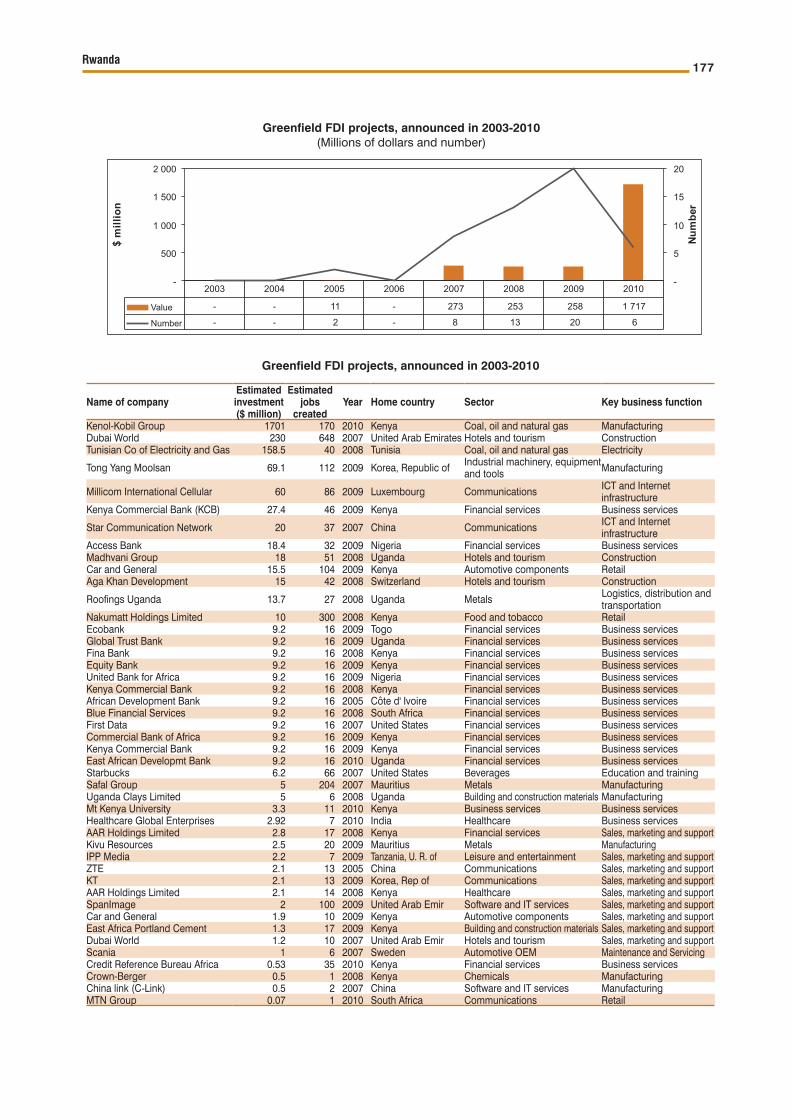
Rwanda 177
Greenfield FDI projects, announced in 2003-2010(Millions of dollars and number)
-
500
1 000
1 500
2 000
$m
illio
n
-
5
10
15
20
Num
ber
Value
Number
- - 11 - 273 253 258 1 717- - 2 - 8 13 20 6
2003 2004 2005 2006 2007 2008 2009 2010
Greenfield FDI projects, announced in 2003-2010
Name of companyEstimated investment ($ million)
Estimated jobs
createdYear Home country Sector Key business function
Kenol-Kobil Group 1701 170 2010 Kenya Coal, oil and natural gas ManufacturingDubai World 230 648 2007 United Arab Emirates Hotels and tourism ConstructionTunisian Co of Electricity and Gas 158.5 40 2008 Tunisia Coal, oil and natural gas Electricity
Tong Yang Moolsan 69.1 112 2009 Korea, Republic of Industrial machinery, equipment and tools Manufacturing
Millicom International Cellular 60 86 2009 Luxembourg Communications ICT and Internet infrastructure
Kenya Commercial Bank (KCB) 27.4 46 2009 Kenya Financial services Business services
Star Communication Network 20 37 2007 China Communications ICT and Internet infrastructure
Access Bank 18.4 32 2009 Nigeria Financial services Business servicesMadhvani Group 18 51 2008 Uganda Hotels and tourism ConstructionCar and General 15.5 104 2009 Kenya Automotive components RetailAga Khan Development 15 42 2008 Switzerland Hotels and tourism Construction
Roofings Uganda 13.7 27 2008 Uganda Metals Logistics, distribution and transportation
Nakumatt Holdings Limited 10 300 2008 Kenya Food and tobacco RetailEcobank 9.2 16 2009 Togo Financial services Business servicesGlobal Trust Bank 9.2 16 2009 Uganda Financial services Business servicesFina Bank 9.2 16 2008 Kenya Financial services Business servicesEquity Bank 9.2 16 2009 Kenya Financial services Business servicesUnited Bank for Africa 9.2 16 2009 Nigeria Financial services Business servicesKenya Commercial Bank 9.2 16 2008 Kenya Financial services Business servicesAfrican Development Bank 9.2 16 2005 Côte d' Ivoire Financial services Business servicesBlue Financial Services 9.2 16 2008 South Africa Financial services Business servicesFirst Data 9.2 16 2007 United States Financial services Business servicesCommercial Bank of Africa 9.2 16 2009 Kenya Financial services Business servicesKenya Commercial Bank 9.2 16 2009 Kenya Financial services Business servicesEast African Developmt Bank 9.2 16 2010 Uganda Financial services Business servicesStarbucks 6.2 66 2007 United States Beverages Education and trainingSafal Group 5 204 2007 Mauritius Metals ManufacturingUganda Clays Limited 5 6 2008 Uganda Building and construction materials ManufacturingMt Kenya University 3.3 11 2010 Kenya Business services Business servicesHealthcare Global Enterprises 2.92 7 2010 India Healthcare Business servicesAAR Holdings Limited 2.8 17 2008 Kenya Financial services Sales, marketing and supportKivu Resources 2.5 20 2009 Mauritius Metals ManufacturingIPP Media 2.2 7 2009 Tanzania, U. R. of Leisure and entertainment Sales, marketing and supportZTE 2.1 13 2005 China Communications Sales, marketing and supportKT 2.1 13 2009 Korea, Rep of Communications Sales, marketing and supportAAR Holdings Limited 2.1 14 2008 Kenya Healthcare Sales, marketing and supportSpanImage 2 100 2009 United Arab Emir Software and IT services Sales, marketing and supportCar and General 1.9 10 2009 Kenya Automotive components Sales, marketing and supportEast Africa Portland Cement 1.3 17 2009 Kenya Building and construction materials Sales, marketing and supportDubai World 1.2 10 2007 United Arab Emir Hotels and tourism Sales, marketing and supportScania 1 6 2007 Sweden Automotive OEM Maintenance and ServicingCredit Reference Bureau Africa 0.53 35 2010 Kenya Financial services Business servicesCrown-Berger 0.5 1 2008 Kenya Chemicals ManufacturingChina link (C-Link) 0.5 2 2007 China Software and IT services ManufacturingMTN Group 0.07 1 2010 South Africa Communications Retail
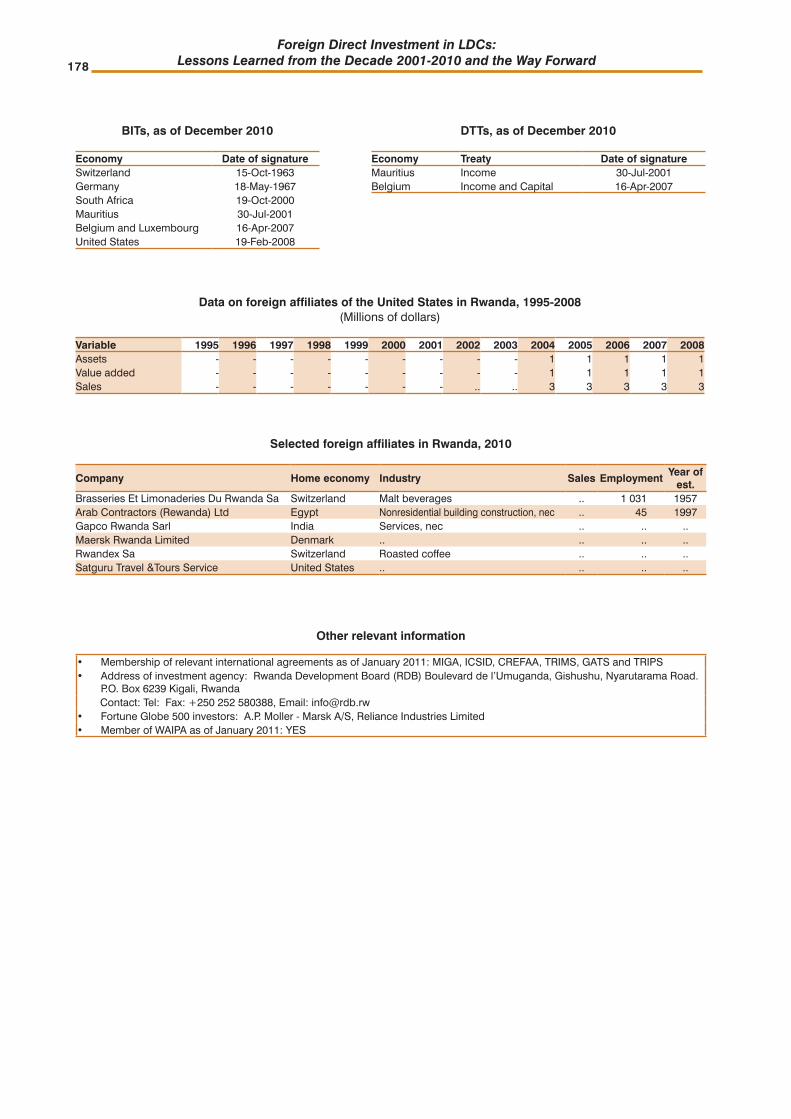
Foreign Direct Investment in LDCs: Lessons Learned from the Decade 2001-2010 and the Way Forward178
Other relevant information
Membership of relevant international agreements as of January 2011: MIGA, ICSID, CREFAA, TRIMS, GATS and TRIPS•Address of investment agency: Rwanda Development Board (RDB) Boulevard de l’Umuganda, Gishushu, Nyarutarama Road. •P.O. Box 6239 Kigali, Rwanda
Contact: Tel: Fax: +250 252 580388, Email: [email protected] Globe 500 investors: A.P. Moller - Marsk A/S, Reliance Industries Limited•Member of WAIPA as of January 2011: YES•
BITs, as of December 2010
Economy Date of signatureSwitzerland 15-Oct-1963Germany 18-May-1967South Africa 19-Oct-2000Mauritius 30-Jul-2001Belgium and Luxembourg 16-Apr-2007United States 19-Feb-2008
DTTs, as of December 2010
Economy Treaty Date of signatureMauritius Income 30-Jul-2001Belgium Income and Capital 16-Apr-2007
Data on foreign affiliates of the United States in Rwanda, 1995-2008(Millions of dollars)
Variable 1995 1996 1997 1998 1999 2000 2001 2002 2003 2004 2005 2006 2007 2008Assets - - - - - - - - - 1 1 1 1 1Value added - - - - - - - - - 1 1 1 1 1Sales - - - - - - - .. .. 3 3 3 3 3
Selected foreign affiliates in Rwanda, 2010
Company Home economy Industry Sales EmploymentYear of
est.Brasseries Et Limonaderies Du Rwanda Sa Switzerland Malt beverages .. 1 031 1957Arab Contractors (Rewanda) Ltd Egypt Nonresidential building construction, nec .. 45 1997Gapco Rwanda Sarl India Services, nec .. .. ..Maersk Rwanda Limited Denmark .. .. .. ..Rwandex Sa Switzerland Roasted coffee .. .. ..Satguru Travel &Tours Service United States .. .. .. ..

Samoa 179
Area (‘000 km2): 2008 2.8 Population (millions): 2010 0.2 Capital city: ApiaOfficial language: Samoan and English Currency: TalaExchange rate (period average): 2009 WST 2.64418 =$1 GDP in current prices (millions of dollars): 2009 558 Exports of goods and services (millions of dollars): 2009 174 Imports of goods and services (millions of dollars): 2009 301 Official development assistance (millions of dollars): 2009 47 External debt (millions of dollars): 2009 235
FDI inflows, 1992-2010 (Millions of dollars)
FDI inflows as a percentage of gross fixed capital formation, 1992-2010
Note: Data for 2010 are estimates.
Note: Data for 2010 are estimates.
SamoaApia
Pacific Ocean
Inward FDI: geographical breakdown, by source, 2003-2009(Millions of dollars)
Region/economy Inward flows Inward stock2003 2004 2005 2006 2007 2008 2009 2003 2004 2005 2006 2007 2008 2009
Sweden - - - - - - - - - - - - - - United States - - - - - - - - 1.0 1.0 1.0 1.0 1.0 1.0 Australia - - - - 10.9 - - 45.0 53.8 - - - 62.4 - Japan - - 0.4 2.3 - 15.5 29.6 4.6 - - - - - - - Brazil - - - - - - - - - - 1.1 - 2.0 - China 0.4 - - - - 0.1 - - 0.9 0.9 0.9 0.9 0.8 0.8 - Korea, Republic of - - - 0.9 4.9 1.3 0.4 0.7 0.7 0.7 1.6 6.6 7.1 7.6
- 10
0
10
20
30
5 5 3 3 1 20 3 2 - 2 1 - 1 2 - 4 12 1 13 1 51992 1993 1994 1995 1996 1997 1998 1999 2000 2001 2002 2003 2004 2005 2006 2007 2008 2009 2010
- 50
0
50
100
16.7 19.0 6.1 8.8 2.7 90.9 9.7 6.3 -4.7 3.5 -0.2 1.3 5.2 -8.0 27.2 2.0 28.0 2.7 10.5
1992 1993 1994 1995 1996 1997 1998 1999 2000 2001 2002 2003 2004 2005 2006 2007 2008 2009 2010
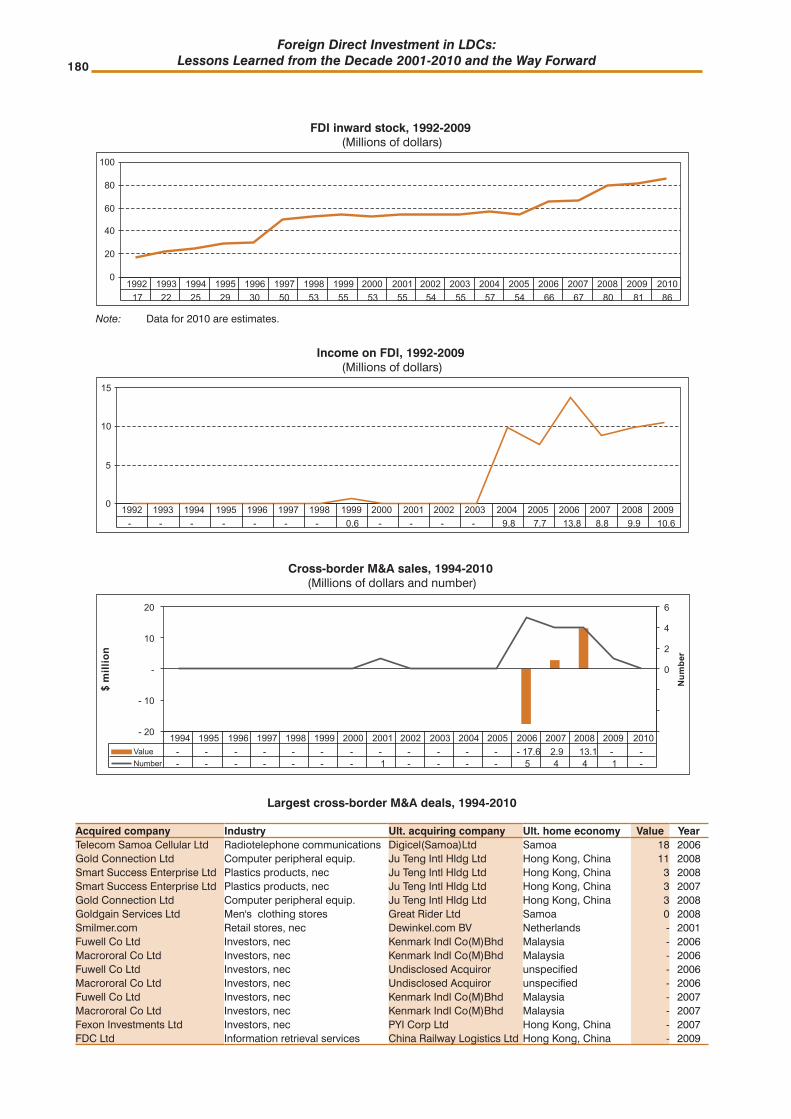
Foreign Direct Investment in LDCs: Lessons Learned from the Decade 2001-2010 and the Way Forward180
Cross-border M&A sales, 1994-2010 (Millions of dollars and number)
Income on FDI, 1992-2009 (Millions of dollars)
FDI inward stock, 1992-2009 (Millions of dollars)
Note: Data for 2010 are estimates.
0
20
40
60
80
100
17 22 25 29 30 50 53 55 53 55 54 55 57 54 66 67 80 81 861992 1993 1994 1995 1996 1997 1998 1999 2000 2001 2002 2003 2004 2005 2006 2007 2008 2009 2010
0
5
10
15
- - - - - - - 0.6 - - - - 9.8 7.7 13.8 8.8 9.9 10.61992 1993 1994 1995 1996 1997 1998 1999 2000 2001 2002 2003 2004 2005 2006 2007 2008 2009
- 20
- 10
-
10
20
$m
illio
n
0
2
4
6
Num
ber
ValueNumber
- - - - - - - - - - - - - 17.6 2.9 13.1 - -- - - - - - - 1 - - - - 5 4 4 1 -
1994 1995 1996 1997 1998 1999 2000 2001 2002 2003 2004 2005 2006 2007 2008 2009 2010
Largest cross-border M&A deals, 1994-2010
Acquired company Industry Ult. acquiring company Ult. home economy Value YearTelecom Samoa Cellular Ltd Radiotelephone communications Digicel(Samoa)Ltd Samoa 18 2006Gold Connection Ltd Computer peripheral equip. Ju Teng Intl Hldg Ltd Hong Kong, China 11 2008Smart Success Enterprise Ltd Plastics products, nec Ju Teng Intl Hldg Ltd Hong Kong, China 3 2008Smart Success Enterprise Ltd Plastics products, nec Ju Teng Intl Hldg Ltd Hong Kong, China 3 2007Gold Connection Ltd Computer peripheral equip. Ju Teng Intl Hldg Ltd Hong Kong, China 3 2008Goldgain Services Ltd Men's clothing stores Great Rider Ltd Samoa 0 2008Smilmer.com Retail stores, nec Dewinkel.com BV Netherlands - 2001Fuwell Co Ltd Investors, nec Kenmark Indl Co(M)Bhd Malaysia - 2006Macrororal Co Ltd Investors, nec Kenmark Indl Co(M)Bhd Malaysia - 2006Fuwell Co Ltd Investors, nec Undisclosed Acquiror unspecified - 2006Macrororal Co Ltd Investors, nec Undisclosed Acquiror unspecified - 2006Fuwell Co Ltd Investors, nec Kenmark Indl Co(M)Bhd Malaysia - 2007Macrororal Co Ltd Investors, nec Kenmark Indl Co(M)Bhd Malaysia - 2007Fexon Investments Ltd Investors, nec PYI Corp Ltd Hong Kong, China - 2007FDC Ltd Information retrieval services China Railway Logistics Ltd Hong Kong, China - 2009

Samoa 181
Greenfield FDI projects, announced in 2003-2010(Millions of dollars and number)
-
200
400
600
$m
illio
n
-
1
2
Num
ber
Value
Number
- - - - - 500 - -- - - - - 1 - -
2003 2004 2005 2006 2007 2008 2009 2010
Greenfield FDI projects, announced in 2003-2010
Name of companyEstimated investment ($million)
Estimated jobs
createdYear Home country Sector Key business function
South Pacific Development Group 500 755 2008 United States Hotels and tourism Construction
BITs, as of December 2010
Economy Date of signature.. .
DTTs, as of December 2010
Economy Treaty Date of signatureUnited States (Tax Implementation) Agreement 1-Jan-1988Australia Income 16-Dec-2009New Zealand Income 24-Aug-2010
Data on foreign affiliates of the United States in Samoa, 1995-2008(Millions of dollars)
Variable 1995 1996 1997 1998 1999 2000 2001 2002 2003 2004 2005 2006 2007 2008Assets - - - - - - - - - 3 3 3 3 3Sales - - - - .. - - 270 .. 2 2 2 2 2
Data on foreign affiliates of Samoa in the United States, 1995-2008(Millions of dollars in assets, value added and sales)
Variable 1995 1996 1997 1998 1999 2000 2001 2002 2003 2004 2005 2006 2007 2008Number - - - - - - - - - - - - 10 -Assets - - - - - - - - - - - - 7 -Value added - - - - - - - - - - - - 1 -Sales - - - - - - - - - - - - 1 -
Other relevant information
Membership of relevant international agreements as of January 2011: MIGA, ICSID•Address of investment agency: Ministry of Commerce, Industry and Labour, Level 4, ACC House, Apia•
Contact: Tel: +685 20441, Fax: +685 20443Fortune Globe 500 investors: None•Member of WAIPA as of January 2011: YES•

Foreign Direct Investment in LDCs: Lessons Learned from the Past Decade and the Way Forward182
Inward FDI: geographical breakdown, by source, 2003-2009(Millions of dollars)
Region/economy Inward flows Inward stock2003 2004 2005 2006 2007 2008 2009 2003 2004 2005 2006 2007 2008 2009
Portugal - 2.4 2.7 0.9 0.9 - 12.4 - 1.1 - 0.4 16.4 4.1 4.7 6.6 5.9 43.1 - Sweden - - - - - - - - - - - - - - United States - - - - - - 1.0 - - - - - 85.0 86.0
Area (‘000 km2): 2008 1.0 Population (millions): 2010 0.2 Capital city: Sao TomeOfficial language: Portuguese Currency: DobraExchange rate (period average): 2009 Db 14 695.2 =$1 GDP in current prices (millions of dollars): 2009 194 Exports of goods and services (millions of dollars): 2009 47 Imports of goods and services (millions of dollars): 2009 191 Official development assistance (millions of dollars): 2009 20 External debt (millions of dollars): 2009 186
FDI inflows, 1992-2010 (Millions of dollars)
FDI inflows as a percentage of gross fixed capital formation, 1992-2010
Note: Data for 2010 are estimates.
Note: Data for 2010 are estimates.
São Tomé and Principe Sao Tome
Atlantic Ocean
- 10
0
10
20
30
40
50
- - 0 - 0 0 0 4 3 4 3 4 3 4 16 38 35 33 36 401992 1993 1994 1995 1996 1997 1998 1999 2000 2001 2002 2003 2004 2005 2006 2007 2008 2009 2010
- 10
0
10
20
30
40
50
0.0 -2.9 0.0 0.0 0.4 0.3 16.2 9.8 13.8 10.9 12.1 9.6 9.3 40.4 47.2 38.0 28.0 28.3 35.3
1992 1993 1994 1995 1996 1997 1998 1999 2000 2001 2002 2003 2004 2005 2006 2007 2008 2009 2010

São Tomé and Principe 183
There are no cross-border M&A sales, 1994-2010
There is no data for income on FDI, 1992-2009
FDI inward stock, 1992-2009 (Millions of dollars)
Note: Data for 2010 are estimates.
Greenfield FDI projects, announced in 2003-2010(Millions of dollars and number)
BITs, as of December 2010
Economy Date of signaturePortugal 18-Jul-1997
DTTs, as of December 2010
Economy Treaty Date of signature..
-50
0
50
100
150
200
250
0 - 0 - 0 - 0 0 0 5 8 11 14 18 21 25 41 78 113 146 182 2211992 1993 1994 1995 1996 1997 1998 1999 2000 2001 2002 2003 2004 2005 2006 2007 2008 2009 2010
-
2
4
6
8
10
$m
illio
n
-
1
2
Num
ber
ValueNumber
- - 9 - 2 - - -- - 1 - 1 - - -
2003 2004 2005 2006 2007 2008 2009 2010
Greenfield FDI projects, announced in 2003-2010
Name of companyEstimated investment ($ million)
Estimated jobs
createdYear Home country Sector Key business function
Commercial bank of Cameroon 9.2 16 2005 Cameroon Financial services Business servicesEcobank 1.5 2 2007 Togo Financial services Business services
Data on foreign affiliates of the United States in São Tomé and Principe, 1995-2008(Millions of dollars in value added)
Variable 1995 1996 1997 1998 1999 2000 2001 2002 2003 2004 2005 2006 2007 2008Number - - - - - - - - - 3 6 6 6 6Value added - - - - - - - - - - 1 3 3 5 125
Other relevant information
Membership of relevant international agreements as of January 2011: ICSID•Address of investment agency: None•
Contact: Not availableFortune Globe 500 investors: None•Member of WAIPA as of January 2011: No•

Foreign Direct Investment in LDCs: Lessons Learned from the Decade 2001-2010 and the Way Forward184
Area (‘000 km2): 2008 196.7 Population (millions): 2010 12.9 Capital city: DakarOfficial language: French Currency: CFA francExchange rate (period average): 2009 CFAfr 447.805 =$1 GDP in current prices (millions of dollars): 2009 12 711 Exports of goods and services (millions of dollars): 2009 2 794 Imports of goods and services (millions of dollars): 2009 4 919 Official development assistance (millions of dollars): 2009 519 External debt (millions of dollars): 2009 3 503
FDI inflows, 1992-2010 (Millions of dollars)
FDI inflows as a percentage of gross fixed capital formation, 1992-2010
Note: Data for 2010 are estimates.
Note: Data for 2010 are estimates.
Senegal Mali
Mauritania
Guinea
Guinea-Bissau
Dakar
Gambia
Inward FDI: geographical breakdown, by source, 2003-2009(Millions of dollars)
Region/economy Inward flows Inward stock2003 2004 2005 2006 2007 2008 2009 2003 2004 2005 2006 2007 2008 2009
Denmark - - 1.3 - 0.3 - - - - 5.5 4.6 5.7 6.7 - - France 65.5 21.1 46.0 25.1 120.4 90.8 144.5 338.5 400.5 307.9 342.4 702.2 716.7 865.8 Germany 1.1 8.7 - 5.0 - 11.3 - 1.5 - - - - - - - - Portugal 0.1 0.1 - - - - - 2.6 - - - - - - Sweden - 0.1 - - 0.1 - - - - - - - - - - - Canada - - - - - - - - 13.3 - - - - - United States - 11.0 - 6.0 - 14.0 1.0 - 3.0 - 6.0 - 17.0 38.0 30.0 17.0 19.0 18.0 18.0 - Japan - - - - - - - - - - - - - - Morocco - - - - - - - 12.5 16.1 14.1 26.8 38.1 114.4 - Tunisia - - - - - - - - - - - - - - Turkey - - - - - - - - - - - - 1.0 - China 0.7 - - - 0.2 3.6 11.0 2.5 2.6 2.4 4.2 4.4 10.6 26.1 Korea, Republic of - - - - - - 0.3 0.5 0.5 0.5 0.5 0.5 0.0 0.3
- 100
0
100
200
300
22 - 1 67 35 5 177 60 153 63 32 78 52 64 52 210 273 272 208 2371992 1993 1994 1995 1996 1997 1998 1999 2000 2001 2002 2003 2004 2005 2006 2007 2008 2009 2010
- 5
0
5
10
15
20
25
1.9 -0.1 9.5 3.8 0.5 19.4 5.2 13.3 6.0 2.9 5.9 3.6 3.6 2.6 8.5 9.0 6.7 6.2 6.6
1992 1993 1994 1995 1996 1997 1998 1999 2000 2001 2002 2003 2004 2005 2006 2007 2008 2009 2010
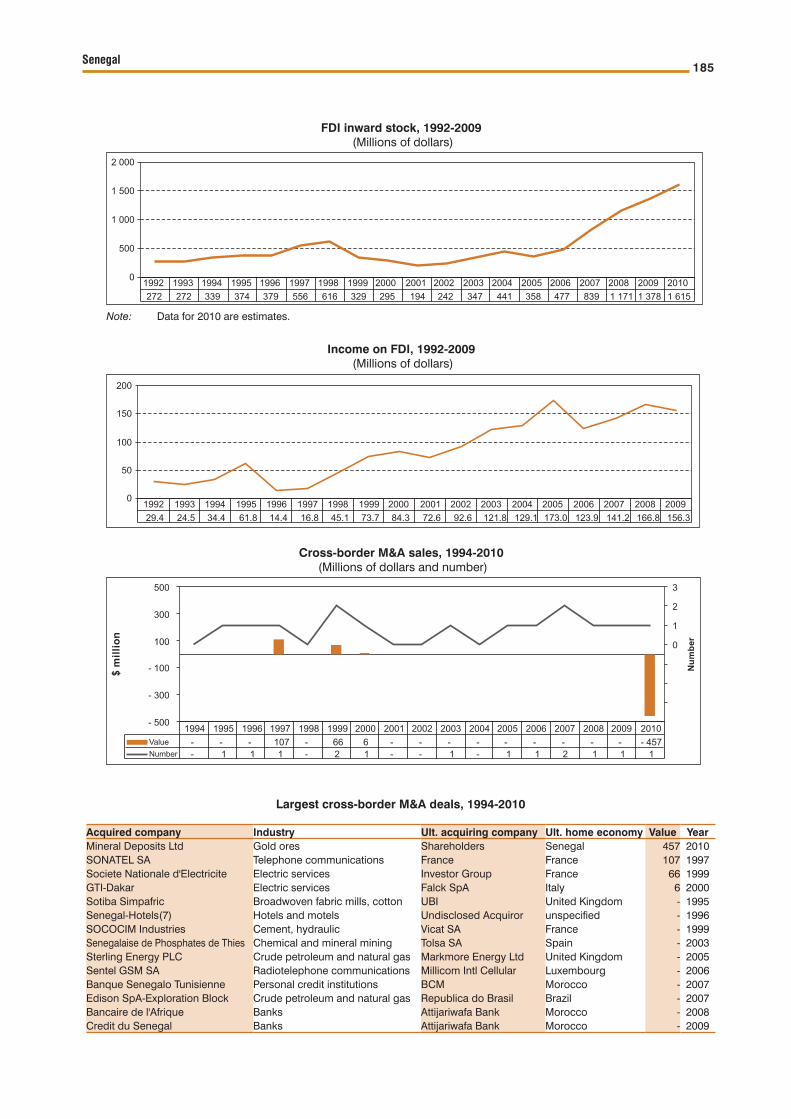
Senegal 185
Cross-border M&A sales, 1994-2010 (Millions of dollars and number)
Income on FDI, 1992-2009 (Millions of dollars)
FDI inward stock, 1992-2009 (Millions of dollars)
Note: Data for 2010 are estimates.
0
500
1 000
1 500
2 000
272 272 339 374 379 556 616 329 295 194 242 347 441 358 477 839 1 171 1 378 1 6151992 1993 1994 1995 1996 1997 1998 1999 2000 2001 2002 2003 2004 2005 2006 2007 2008 2009 2010
0
50
100
150
200
29.4 24.5 34.4 61.8 14.4 16.8 45.1 73.7 84.3 72.6 92.6 121.8 129.1 173.0 123.9 141.2 166.8 156.31992 1993 1994 1995 1996 1997 1998 1999 2000 2001 2002 2003 2004 2005 2006 2007 2008 2009
- 500
- 300
- 100
100
300
500
$m
illio
n
0
1
2
3
Num
ber
ValueNumber
- - - 107 - 66 6 - - - - - - - - - - 457- 1 1 1 - 2 1 - - 1 - 1 1 2 1 1 1
1994 1995 1996 1997 1998 1999 2000 2001 2002 2003 2004 2005 2006 2007 2008 2009 2010
Largest cross-border M&A deals, 1994-2010
Acquired company Industry Ult. acquiring company Ult. home economy Value YearMineral Deposits Ltd Gold ores Shareholders Senegal 457 2010SONATEL SA Telephone communications France France 107 1997Societe Nationale d'Electricite Electric services Investor Group France 66 1999GTI-Dakar Electric services Falck SpA Italy 6 2000Sotiba Simpafric Broadwoven fabric mills, cotton UBI United Kingdom - 1995Senegal-Hotels(7) Hotels and motels Undisclosed Acquiror unspecified - 1996SOCOCIM Industries Cement, hydraulic Vicat SA France - 1999Senegalaise de Phosphates de Thies Chemical and mineral mining Tolsa SA Spain - 2003Sterling Energy PLC Crude petroleum and natural gas Markmore Energy Ltd United Kingdom - 2005Sentel GSM SA Radiotelephone communications Millicom Intl Cellular Luxembourg - 2006Banque Senegalo Tunisienne Personal credit institutions BCM Morocco - 2007Edison SpA-Exploration Block Crude petroleum and natural gas Republica do Brasil Brazil - 2007Bancaire de l'Afrique Banks Attijariwafa Bank Morocco - 2008Credit du Senegal Banks Attijariwafa Bank Morocco - 2009

Foreign Direct Investment in LDCs: Lessons Learned from the Decade 2001-2010 and the Way Forward186
Greenfield FDI projects, announced in 2003-2010(Millions of dollars and number)
-
1 000
2 000
3 000
4 000
$m
illio
n
-
2
4
6
8
10
Num
ber
ValueNumber
575 285 13 1 243 2 979 1 168 328 9273 3 3 5 4 8 10 8
2003 2004 2005 2006 2007 2008 2009 2010
Greenfield FDI projects, announced in 2003-2010
Name of companyEstimated investment ($ million)
Estimated jobs
createdYear Home country Sector Key business function
ArcelorMittal 2200 3583 2007 Luxembourg Metals ExtractionDubai World 800 3000 2008 United Arab Emirates Real estate ConstructionChina Metallurgical Group Corp 727.7 131 2006 China Coal, oil and natural gas Electricity
DP World 534 2256 2007 United Arab Emirates TransportationLogistics, distribution and transportation
Tullow Oil 521.9 215 2003 United Kingdom Coal, oil and natural gas ExtractionAmitelo Communications 400 123 2006 Switzerland Communications ICT and Internet infrastructureJuwi 398.7 93 2010 Germany Alternative/renewable energy ElectricityRandgold Resources 300 585 2010 United Kingdom Metals ExtractionDubai World 255.4 422 2008 United Arab Emirates Hotels and tourism ConstructionArcelorMittal 242.3 1667 2007 Luxembourg Metals ExtractionKumba Resources 242.3 1667 2004 South Africa Metals ExtractionVicat Group 151.2 382 2009 France Building and construction ManufacturingInterContinental Hotels Group 127.7 209 2009 United Kingdom Hotels and tourism ConstructionMineral Deposits 80 156 2010 Australia Metals ExtractionGreat Wall Motors (GWM) 76.3 1043 2010 China Automotive OEM ManufacturingTata Group 72.9 1047 2008 India Automotive OEM ManufacturingIran Khodro Industrial Group 60 593 2010 Iran, Islamic Rep. of Automotive OEM ManufacturingIran Khodro Industrial Group 60 584 2006 Iran, Islamic Rep. of Automotive OEM ManufacturingLam Hoa 51.4 434 2003 VietNam Non-automotive transport ManufacturingEuropean Investment Bank 40.6 106 2004 Luxembourg Financial services HeadquartersAttijariwafa Bank 30.5 50 2006 Morocco Financial services Business servicesProcter & Gamble 25.7 71 2008 United States Consumer products HeadquartersAltria 25 300 2006 United States Food and tobacco ManufacturingSanir Company 17.6 116 2009 Iran, Islamic Rep. of Electronic components ManufacturingNestle 10.38 57 2009 Switzerland Food and tobacco ManufacturingAfrican Development Bank 9.2 16 2005 Côte d' Ivoire Financial services Business servicesBordeaux Management School 9.2 36 2010 France Business services Education and trainingUnited Bank for Africa 9.2 16 2008 Nigeria Financial services Business servicesAlcatel-Lucent 6.6 66 2009 France Communications Education and trainingRegus 4.7 9 2009 United Kingdom Real estate Business servicesGulf Pharmaceutical Industries 4.2 13 2009 United Arab Emir Pharmaceuticals Sales, marketing and supportMaarch 3.3 11 2009 France Business services Business servicesStudi Group 3.3 11 2008 Tunisia Business services Business servicesMicrosoft 2.6 8 2007 United States Software and IT services Sales, marketing and supportRadio France Internationale 2.1 13 2004 France Communications Sales, marketing and supportProtek 1.9 11 2003 United Kingdom Software and IT services Sales, marketing and supportSwapcom 1.9 11 2005 France Software and IT services Sales, marketing and supportIBM 1.9 11 2010 United States Software and IT services Sales, marketing and supportWorld Wide Web Consortium 1.9 11 2009 United States Software and IT services Sales, marketing and supportNuxeo 1.9 11 2005 France Software and IT services Sales, marketing and supportVIVEO Group 1.9 11 2008 France Software and IT services Sales, marketing and supportAtlas Copco 1 8 2010 Sweden Industrial machinery Sales, marketing and supportPPR SA 0.72 3 2009 France Automotive OEM Retail

Senegal 187
BITs, as of December 2010
Economy Date of signatureSwitzerland 16-Aug-1962Germany 24-Jan-1964Sweden 24-Feb-1967Syrian Arab Republic 14-Nov-1975Netherlands 3-Aug-1979Romania 19-Jun-1980United Kingdom 7-May-1980United States 6-Dec-1983Korea, Republic of 12-Jul-1984Tunisia 17-May-1984Argentina 6-Apr-1993Taiwan Province of China 24-Oct-1997Egypt 5-Mar-1998Qatar 10-Jun-1998South Africa 5-Jun-1998Malaysia 11-Feb-1999Italy 13-Oct-2000Mauritius 14-Mar-2002Mali 12-Apr-2005Morocco 15-Nov-2006Spain 22-Nov-2007India 3-Jul-2008
DTTs, as of December 2010
Economy Treaty Date of signatureMauritania Income and Capital 9-Jan-1971France Income and Capital 29-Mar-1974Tunisia Income and Capital 5-May-1984Belgium Income and Capital 29-Sep-1987Norway Income and Capital 4-Jul-1994Qatar Income 10-Jun-1998Taiwan Province of China Income and Capital 10-Jun-1999Canada Income and Capital 2-Aug-2001Egypt Income and Capital 14-Aug-2001Lebanon Income and Capital 19-Oct-2002Mauritius Income and Capital 17-Apr-2002Morocco Income and Capital 1-Mar-2002Kuwait Income 10-Apr-2007Malaysia Income 17-Feb-2010
Data on foreign affiliates of the United States in Senegal, 1995-2008(Millions of dollars in assets, wages and salaries, value added and sales; thousands in employees)
Variable 1995 1996 1997 1998 1999 2000 2001 2002 2003 2004 2005 2006 2007 2008Number 5 4 4 4 4 4 4 4 4 2 3 2 2 3Assets 80 43 89 95 104 114 118 115 110 .. 217 .. .. 218Employees 0.6 0.3 0.5 0.5 0.5 0.5 0.5 0.5 0.5 0.4 0.4 0.3 .. 0.5Wages and salaries 6 4 9 9 8 9 9 9 5 10 9 6 .. 11Value added 29 22 29 31 37 39 38 38 32 33 54 32 .. 66Sales - - - 96 114 156 161 158 146 .. .. .. .. ..

Foreign Direct Investment in LDCs: Lessons Learned from the Decade 2001-2010 and the Way Forward188
Other relevant information
Membership of relevant international agreements as of January 2011: MIGA, ICSID, CREFAA, TRIMS, GATS and TRIPS•Address of investment agency: Agence Nationale Chargée de la Promotion de l’Investissement et des Grands Travaux, 52 - 54 •Rue Mohamed V - BP 430 CP 18524, Dakar RP Sénégal
Contact: Tel: (221) 33 849 05 55, Fax: (221) 33 823 94 89, Email: [email protected] Globe 500 investors: Abb Ltd, Air France - Klm, Allianz Se, Bnp Paribas, Citigroup Inc., Eiffage, Michelin Et Cie, •Mitsubishi Corporation, Novartis Ag, Royal Dutch Shell Plc, Sanofi-Aventis, Siemens Ag, Sumitomo Corporation, VinciMember of WAIPA as of January 2011: YES•
Selected foreign affiliates in Senegal, 2010
Company Home economy Industry Sales EmploymentYear of
est.
Shell Senegal Sa United KingdomPetroleum and petroleum products wholesalers, nec
2 555 142 1961
Compagnie Francaise De L Afrique Occid. France Automobiles and other motor vehicles 262 158 1976Societe De Manutention De Carburant United Kingdom Petroleum and petroleum products wholesalers, nec 14 32 1966Siemens Sarl Germany Communications services, nec 5 6 2004Connecteo Senegal United Kingdom Communications services, nec 4 9 2003Societe Radio Nostalgie Senegal France Business services, nec 3 .. 1995Cfao Technologies Senegal France Computers and peripheral equipment and software 1 80 2002Dakar Catering Sa France Eating places .. 215 1991Africasoins Productions Groupe Sanofi Aventis France Pharmaceutical preparations .. 150 2007A B B Herlicq S A India Electrical work .. 90 1948Societe Tropicale De Dist. De Produits Pharm.
France Drugs, drug proprietaries, and druggists' sundries .. 80 1974
Societe Africaine De Sondage Injections France Special trade contractors, nec .. 79 1943Dakar Metallurgie S A Belgium Metal mining services .. 50 1993Societe De Developement De La Industrie France Construction materials, nec .. 50 1986Citibank Sn United States Commercial banks, nec .. 47 2006Mccann Erickson Senegal United States Advertising agencies .. 36 ..Equant Integration Service France Computer programming services .. 30 1972La Seigneurie D'Afrique France Paints, varnishes, lacquers, & allied products .. 30 1952Getma Senegal France Transportation services, nec .. 28 1998Europcar Senegal France Passenger car rental .. 25 ..Enterprise Business Solutions Morocco Hardware .. 10 2002Nord Electricite S A France Electric services .. 9 1991Tullow Oil Senegal United Kingdom Products of petroleum and coal, nec .. 3 1988Sumitomo Corporation Japan Automobiles and other motor vehicles .. .. 2005Voest-Alpine Intertrading Austria Business services, nec .. .. 2005Gecamines France Crushed and broken granite .. .. 2004Societe Generale De Banques Au Senegal France Commercial banks, nec .. .. 1962Abb Technologies S.A. Switzerland Metal mining services .. .. ..Afrique Ascenseurs Switzerland Elevators and moving stairways .. .. ..Agf Senegal Assurances Germany Life insurance .. .. ..Allianz Senegal Assurances Vie Germany Life insurance .. .. ..Banque International Du Commerce France Commercial banks, nec .. .. ..Bt Senegal Limited United Kingdom Communications services, nec .. .. ..Cabinet Pierre Michaux Fidafrica United States Drilling oil and gas wells .. .. ..Colgate-Palmolive Senegal N.S.O.A. United States Nursing&personal care facils .. .. ..Egl, Inc Cayman Islands Marinas .. .. ..Geodis Senegal France Durable goods, nec .. .. ..Grimaldi Senegal Sa Italy Services, nec .. .. ..Interfood West Africa Netherlands Grocery stores .. .. ..L Entente Senegalaise France Services, nec .. .. ..Mitsubishi Corporation Bureau De Liaison Japan Petroleum and petroleum products wholesalers, nec .. .. ..
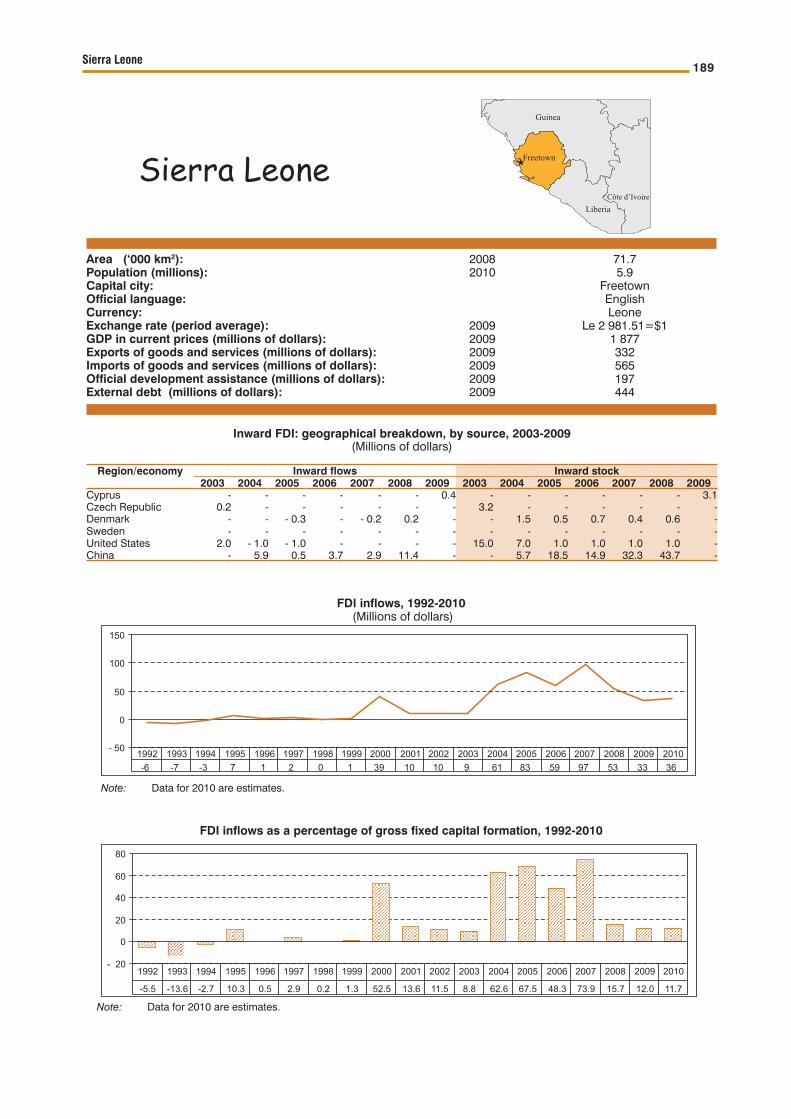
Sierra Leone 189
Guinea
Liberia
Freetown
Côte d’Ivoire
Area (‘000 km2): 2008 71.7 Population (millions): 2010 5.9 Capital city: FreetownOfficial language: English Currency: LeoneExchange rate (period average): 2009 Le 2 981.51=$1 GDP in current prices (millions of dollars): 2009 1 877 Exports of goods and services (millions of dollars): 2009 332 Imports of goods and services (millions of dollars): 2009 565 Official development assistance (millions of dollars): 2009 197 External debt (millions of dollars): 2009 444
FDI inflows, 1992-2010 (Millions of dollars)
FDI inflows as a percentage of gross fixed capital formation, 1992-2010
Note: Data for 2010 are estimates.
Note: Data for 2010 are estimates.
Sierra Leone
Inward FDI: geographical breakdown, by source, 2003-2009(Millions of dollars)
Region/economy Inward flows Inward stock2003 2004 2005 2006 2007 2008 2009 2003 2004 2005 2006 2007 2008 2009
Cyprus - - - - - - 0.4 - - - - - - 3.1 Czech Republic 0.2 - - - - - - 3.2 - - - - - - Denmark - - - 0.3 - - 0.2 0.2 - - 1.5 0.5 0.7 0.4 0.6 - Sweden - - - - - - - - - - - - - - United States 2.0 - 1.0 - 1.0 - - - - 15.0 7.0 1.0 1.0 1.0 1.0 - China - 5.9 0.5 3.7 2.9 11.4 - - 5.7 18.5 14.9 32.3 43.7 -
- 50
0
50
100
150
-6 -7 -3 7 1 2 0 1 39 10 10 9 61 83 59 97 53 33 361992 1993 1994 1995 1996 1997 1998 1999 2000 2001 2002 2003 2004 2005 2006 2007 2008 2009 2010
- 20
0
20
40
60
80
-5.5 -13.6 -2.7 10.3 0.5 2.9 0.2 1.3 52.5 13.6 11.5 8.8 62.6 67.5 48.3 73.9 15.7 12.0 11.7
1992 1993 1994 1995 1996 1997 1998 1999 2000 2001 2002 2003 2004 2005 2006 2007 2008 2009 2010

Foreign Direct Investment in LDCs: Lessons Learned from the Decade 2001-2010 and the Way Forward190
Cross-border M&A sales, 1994-2010 (Millions of dollars)
Income on FDI, 1992-2009 (Millions of dollars)
FDI inward stock, 1992-2009 (Millions of dollars)
Note: Data for 2010 are estimates.
0
200
400
600
800
245 238 235 242 243 244 245 245 284 294 304 313 374 300 453 612 426 460 495
1992 1993 1994 1995 1996 1997 1998 1999 2000 2001 2002 2003 2004 2005 2006 2007 2008 2009 2010
-50
0
50
100
150
1.3 - 0.8 - 0.2 11.3 4.4 2.6 3.3 6.1 1.8 0.6 2.0 9.4 32.4 41.2 27.3 121.9 76.0 81.91992 1993 1994 1995 1996 1997 1998 1999 2000 2001 2002 2003 2004 2005 2006 2007 2008 2009
-
10.0
20.0
30.0
40.0
50.0
$m
illio
n
0
1
2
3
4
5
Num
ber
ValueNumber
- - 0.1 - - - - - - - 1.7 - - 31.1 40.0 - 13.2- - 2 - - - 1 1 - - 2 - 3 1 4 1 1
1994 1995 1996 1997 1998 1999 2000 2001 2002 2003 2004 2005 2006 2007 2008 2009 2010
Largest cross-border M&A deals, 1994-2010
Acquired company Industry Ult. acquiring company Ult. home economy Value YearGlobal Aluminum Ltd Primary production of aluminum Romal Holdings NV Netherlands 40 2008Titanium Resources Group PLC Miscellaneous metal ores, nec Ospraie Management United States 31 2007Baomahun Project Gold ores Cluff Gold PLC United Kingdom 27 2008Sierra Rutile Ltd Kaolin and ball clay Titanium & MIL Inv United States 13 2001Millennium Mining LLC Misc nonmetallic minerals Dolat Ventures Inc Canada 13 2010Sierra Leone Diamond Ltd Misc nonmetallic minerals Timis Diamond Corp Canada 2 2004Panguma Diamond Co Ltd Misc nonmetallic minerals Vatukoula Gold Mines United Kingdom 1 2006Northwest Diamond Co Misc nonmetallic minerals Sierra Leone Diamond Sierra Leone - 2004Bennimix Food Co Food preparations, nec Marz Chemicals Lebanon - 1996Sierra Rutile Ltd Kaolin and ball clay Renison Gold Corp Australia - 1996
Sierra Leone Ore & Metal Co Miscellaneous metal ores, necSierra Leone government
Sierra Leone - 2000
Millicom(Sierra Leone)Ltd Telephone communications Millicom Intl Cellular Luxembourg - 2006Northern Star Resources Ltd Gold ores Sierra Gold Corp United States - 2006Block SL-4 Crude petroleum and natural gas Elixir Petroleum Ltd Australia - 2008Block SL-4 Crude petroleum and natural gas Elixir Petroleum Ltd Australia - 2008Millicom(Sierra Leone)Ltd Telephone communications Lintel Group Lebanon - 2009

Sierra Leone 191
Greenfield FDI projects, announced in 2003-2010(Millions of dollars and number)
BITs, as of December 2010
Economy Date of signatureGermany 8-Apr-1965United Kingdom 13-Jan-2000China 16-May-2001
DTTs, as of December 2010
Economy Treaty Date of signatureUnited Kingdom Income and Capital 19-Dec-1947Denmark Income and Capital 22-Dec-1954Norway Income and Capital 18-May-1955India Income and Capital 23-June-1956
-
200
400
600
800
$m
illio
n
-
2
4
6
Num
ber
ValueNumber
491 242 727 247 - 68 - 2304 1 2 2 - 5 - 2
2003 2004 2005 2006 2007 2008 2009 2010
Greenfield FDI projects, announced in 2003-2010
Name of companyEstimated investment ($ million)
Estimated jobs
createdYear Home country Sector
Key business function
Gondwana 680.9 1 000 2005 Canada Metals ExtractionTitanium Resources Group 242.3 1 667 2006 United Kingdom Metals ExtractionMoydow Mines International 242.3 1 667 2004 Canada Metals ExtractionMano River Resources 233.7 1 524 2003 Canada Metals ExtractionCaldera Resources 233.7 1 524 2003 Canada Metals ExtractionABG Shipyard 150 292 2010 India Metals ExtractionLondon Mining 80 156 2010 United Kingdom Metals ExtractionThe Lang Mining Group 46.3 497 2005 Canada Minerals ExtractionAccess Bank 40.6 106 2008 Nigeria Financial services HeadquartersEnergem Resources 14.5 260 2003 Canada Metals ManufacturingProCredit Holding 9.2 16 2008 Germany Financial services Business servicesZenith Bank 9.2 16 2008 Nigeria Financial services Business servicesInternational Commercial Bank 9.2 16 2003 Malaysia Financial services Business servicesEcobank 9.2 16 2008 Togo Financial services Business servicesZain (MTC) 4.2 156 2006 Kuwait Communications RetailMexivada Mining Corporation 0.03 - 2008 Canada Minerals Extraction
Data of foreign affiliates of the United States in Sierra Leone, 1995-2008(Millions of dollars in assets, wages and salaries, value added and sales; thousands in employees)
Variable 1995 1996 1997 1998 1999 2000 2001 2002 2003 2004 2005 2006 2007 2008Number 1 1 1 1 - - - - 1 1 - - - -Assets 4 5 5 5 .. 5 6 6 .. 21 .. .. .. ..Employees - - - .. .. - - - .. 0.4 0.3 0.3 0.3 0.3Wages and salaries - - - .. .. 1 1 1 .. 4 4 4 4 4Value added 7 8 9 7 .. 1 1 1 .. 17 4 4 4 4Sales - - - 8 .. 7 7 7 .. 52 .. .. .. ..

Foreign Direct Investment in LDCs: Lessons Learned from the Decade 2001-2010 and the Way Forward192
Selected foreign affiliates in Sierra Leone, 2010
Company Home economy Industry Sales EmploymentYear of
est.
Marz Chemicals (Sl) Ltd United KingdomDrugs, drug proprietaries, and druggists' sundries
.. 20 1985
Interwest Trading Ltd United Arab EmiratesArrangement of transportation of freight and cargo
.. 5 2000
Maersk Sierra Leone Ltd Denmark Services, nec .. .. 2003Bt (Sl) Limited United Kingdom Communications services, nec .. .. ..Ipc Travel Limited United States Tour operators .. .. ..
Peterson Zochonis Sierra Leone Ltd United Kingdom .. .. .. ..
Sierra Leone Plastics Ltd United Kingdom .. .. .. ..Standard Chartered Bank United Kingdom Commercial banks, nec .. .. ..Standard Chartered Bank United Kingdom Commercial banks, nec .. .. ..
Other relevant information
Membership of relevant international agreements as of January 2011: MIGA, ICSID, TRIMS, GATS and TRIPS•Address of investment agency: Ministry of Trade, Industry and State Enterprises, 6th Floor, Youyi Building, Brookfields, •Freetown, Sierra Leone
Contact: Tel: + 232 22 222706, Fax: +232 22 235129, Website: www.mtisl.orgFortune Globe 500 investors: A.P. Moller - Marsk A/S, Astrazeneca Plc•Member of WAIPA as of January 2011: YES•

Solomon Islands 193
Area (‘000 km2): 2008 28.9 Population (millions): 2010 0.5 Capital city: HoniaraOfficial language: English Currency: Solomon Islands dollarExchange rate (period average): 2009 SI$ 7.74792=$1 GDP in current prices (millions of dollars): 2009 657 Exports of goods and services (millions of dollars): 2009 296 Imports of goods and services (millions of dollars): 2009 345 Official development assistance (millions of dollars): 2009 202 External debt (millions of dollars): 2009 156
FDI inflows, 1992-2010 (Millions of dollars)
FDI inflows as a percentage of gross fixed capital formation, 1992-2010
Note: Data for 2010 are estimates.
Note: Data for 2010 are estimates.
Solomon Islands Honiara
Pacific Ocean
Inward FDI: geographical breakdown, by source, 2003-2009(Millions of dollars)
Region/economy Inward flows Inward stock2003 2004 2005 2006 2007 2008 2009 2003 2004 2005 2006 2007 2008 2009
Estonia - - - - - - - - - - - - - - Sweden - - - - - - - - - - - - - - Australia 2.6 10.3 9.2 6.0 - 37.7 - - - - - 46.7 27.7 - New Zealand - - - - - - 0.6 - - - 0.7 - - - China - - - - - - - 0.1 - - - - - - Korea, Republic of - 1.0 - 0.1 1.0 1.6 - - 5.1 6.1 6.0 7.0 8.6 7.6 7.6
- 50
0
50
100
150
200
14 23 2 2 6 34 2 - 19 1 - 9 - 4 - 2 6 19 34 67 76 173 1621992 1993 1994 1995 1996 1997 1998 1999 2000 2001 2002 2003 2004 2005 2006 2007 2008 2009 2010
- 100
0
100
200
300
34.8 50.4 3.3 3.2 8.1 44.5 2.8 -26.9 2.2 -15.3 -7.4 -5.9 15.1 35.9 55.8 95.4 91.3 190.6 81.9
1992 1993 1994 1995 1996 1997 1998 1999 2000 2001 2002 2003 2004 2005 2006 2007 2008 2009 2010

Foreign Direct Investment in LDCs: Lessons Learned from the Decade 2001-2010 and the Way Forward194
Cross-border M&A sales, 1994-2010 (Millions of dollars)
Income on FDI, 1992-2009 (Millions of dollars)
FDI inward stock, 1992-2009 (Millions of dollars)
Note: Data for 2010 are estimates.
0
200
400
600
800
1 000
1 200
330 353 355 357 363 397 399 381 382 373 369 367 372 391 425 544 700 873 1 0351992 1993 1994 1995 1996 1997 1998 1999 2000 2001 2002 2003 2004 2005 2006 2007 2008 2009 2010
0
50
100
150
4 3 3 7 8 9 8 11 8 3 7 5 7 5 24 47 128 1411992 1993 1994 1995 1996 1997 1998 1999 2000 2001 2002 2003 2004 2005 2006 2007 2008 2009
-
5
10
15
$m
illio
n
0
1
2
3
Num
ber
ValueNumber
1 - - - - - - - - - - - - 14 - - -2 - - - - - - - 2 - - - - 1 - - -
1994 1995 1996 1997 1998 1999 2000 2001 2002 2003 2004 2005 2006 2007 2008 2009 2010
Largest cross-border M&A deals, 1994-2010
Acquired company Industry Ult. acquiring company Ult. home economy Value YearNational Bank of Solomon Isl Banks BSP Holdings Ltd Papua New Guinea 14 2007Star Harbour Timber Co Ltd Sawmills and planing mills Berjaya Corp Bhd Malaysia 1 1994National Bank of Solomon Isl Banks Pacific Century Financial Corp United States - 1994Exxon Mobil Corp Natural gas transmission Marwarth Oil Ltd Solomon Islands - 2002National Bank of Solomon Isl Banks Solomon Islands gov. Solomon Islands - 2002
Solomon Islands has no bilateral or double taxation treaties
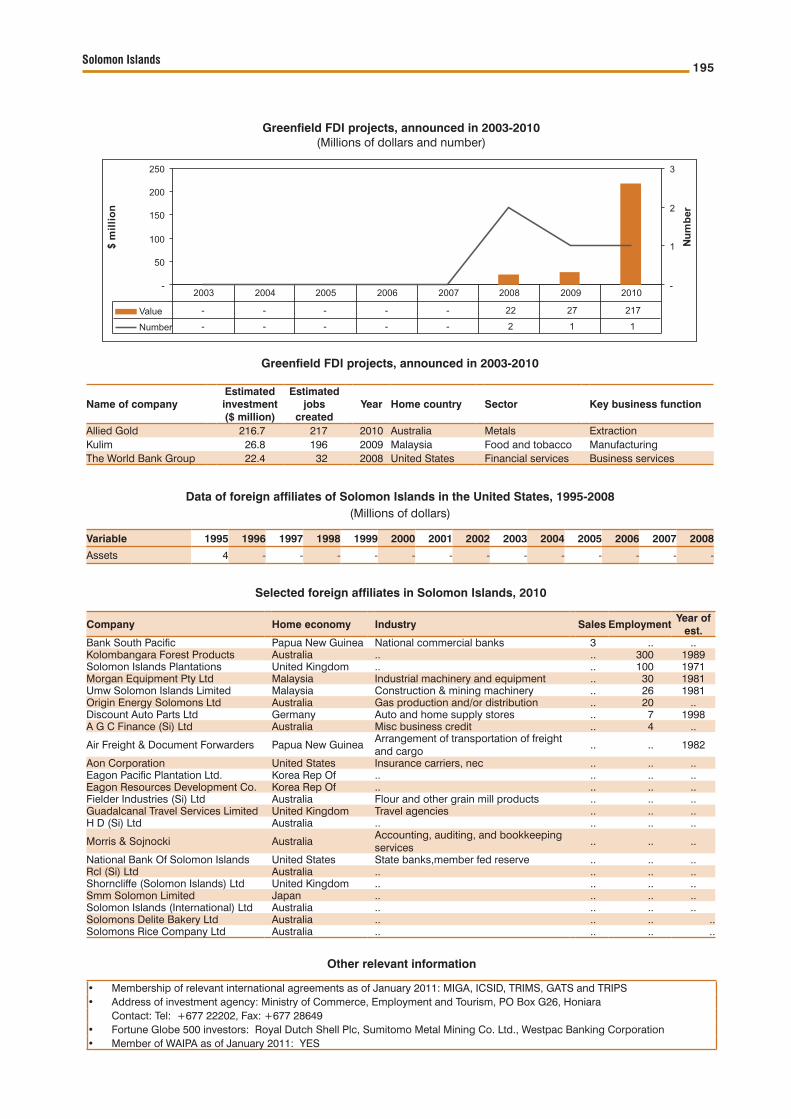
Solomon Islands 195
Greenfield FDI projects, announced in 2003-2010(Millions of dollars and number)
-
50
100
150
200
250
$m
illio
n
-
1
2
3
Num
ber
ValueNumber
- - - - - 22 27 217- - - - - 2 1 1
2003 2004 2005 2006 2007 2008 2009 2010
Greenfield FDI projects, announced in 2003-2010
Name of companyEstimated investment ($ million)
Estimated jobs
createdYear Home country Sector Key business function
Allied Gold 216.7 217 2010 Australia Metals ExtractionKulim 26.8 196 2009 Malaysia Food and tobacco ManufacturingThe World Bank Group 22.4 32 2008 United States Financial services Business services
Data of foreign affiliates of Solomon Islands in the United States, 1995-2008(Millions of dollars)
Variable 1995 1996 1997 1998 1999 2000 2001 2002 2003 2004 2005 2006 2007 2008
Assets 4 - - - - - - - - - - - - -
Selected foreign affiliates in Solomon Islands, 2010
Company Home economy Industry Sales EmploymentYear of
est.Bank South Pacific Papua New Guinea National commercial banks 3 .. ..Kolombangara Forest Products Australia .. .. 300 1989Solomon Islands Plantations United Kingdom .. .. 100 1971Morgan Equipment Pty Ltd Malaysia Industrial machinery and equipment .. 30 1981Umw Solomon Islands Limited Malaysia Construction & mining machinery .. 26 1981Origin Energy Solomons Ltd Australia Gas production and/or distribution .. 20 ..Discount Auto Parts Ltd Germany Auto and home supply stores .. 7 1998A G C Finance (Si) Ltd Australia Misc business credit .. 4 ..
Air Freight & Document Forwarders Papua New GuineaArrangement of transportation of freight and cargo
.. .. 1982
Aon Corporation United States Insurance carriers, nec .. .. ..Eagon Pacific Plantation Ltd. Korea Rep Of .. .. .. ..Eagon Resources Development Co. Korea Rep Of .. .. .. ..Fielder Industries (Si) Ltd Australia Flour and other grain mill products .. .. ..Guadalcanal Travel Services Limited United Kingdom Travel agencies .. .. ..H D (Si) Ltd Australia .. .. .. ..
Morris & Sojnocki AustraliaAccounting, auditing, and bookkeeping services
.. .. ..
National Bank Of Solomon Islands United States State banks,member fed reserve .. .. ..Rcl (Si) Ltd Australia .. .. .. ..Shorncliffe (Solomon Islands) Ltd United Kingdom .. .. .. ..Smm Solomon Limited Japan .. .. .. ..Solomon Islands (International) Ltd Australia .. .. .. ..Solomons Delite Bakery Ltd Australia .. .. .. ..Solomons Rice Company Ltd Australia .. .. .. ..
Other relevant information
Membership of relevant international agreements as of January 2011: MIGA, ICSID, TRIMS, GATS and TRIPS•Address of investment agency: Ministry of Commerce, Employment and Tourism, PO Box G26, Honiara•Contact: Tel: +677 22202, Fax: +677 28649 Fortune Globe 500 investors: Royal Dutch Shell Plc, Sumitomo Metal Mining Co. Ltd., Westpac Banking Corporation•Member of WAIPA as of January 2011: YES•

Foreign Direct Investment in LDCs: Lessons Learned from the Decade 2001-2010 and the Way Forward196
Area (‘000 km2): 2008 637.7Population (millions): 2010 9.4 Capital city: MogadishuOfficial language: Somali and Arabic Currency: Somali shillingExchange rate (period average): 2009 SOS 1 520=$1 GDP in current prices (millions of dollars): 2009 2 518 Exports of goods and services (millions of dollars): 2009 8 Imports of goods and services (millions of dollars): 2009 43 Official development assistance (millions of dollars): 2009 509 External debt (millions of dollars): 2009 2 973
FDI inflows, 1992-2010 (Millions of dollars)
FDI inflows as a percentage of gross fixed capital formation, 1992-2010
Note: Data for 2010 are estimates.
Note: Data for 2010 are estimates.
SomaliaEthiopia
Kenya
Yemen
Mogadishu
Inward FDI: geographical breakdown, by source, 2003-2009(Millions of dollars)
Region/economy Inward flows Inward stock2003 2004 2005 2006 2007 2008 2009 2003 2004 2005 2006 2007 2008 2009
Sweden - - - - - - - 0.1 - - - - - - - United States - - - - - - - 29.0 - - - - - -
- 50
0
50
100
150
- 0 2 1 1 1 1 0 - 1 0 0 0 - 1 - 5 24 96 141 87 108 1121992 1993 1994 1995 1996 1997 1998 1999 2000 2001 2002 2003 2004 2005 2006 2007 2008 2009 2010
- 10
0
10
20
30
-0.1 0.9 0.4 0.4 0.5 0.4 0.0 -0.2 0.1 0.0 0.0 -0.2 -1.1 5.1 18.7 25.9 16.1 21.2 21.1
1992 1993 1994 1995 1996 1997 1998 1999 2000 2001 2002 2003 2004 2005 2006 2007 2008 2009 2010
FDI inward stock, 1992-2009 (Millions of dollars)
Note: Data for 2010 are estimates.
-200
0
200
400
600
- 2 - 0 1 2 3 4 4 3 4 4 4 3 - 2 22 118 259 346 454 5661992 1993 1994 1995 1996 1997 1998 1999 2000 2001 2002 2003 2004 2005 2006 2007 2008 2009 2010

Somalia 197
There are no cross-border M&A sales, 1994-2010
There is no data for income on FDI, 1992-2009
Greenfield FDI projects, announced in 2003-2010(Millions of dollars and number)
BITs, as of December 2010
Economy Date of signatureGermany 27-Nov-1981Egypt 29-May-1982
DTTs, as of December 2010
Economy Treaty Date of signature..
-
200
400
600
$m
illio
n
-
1
2
3
Num
ber
ValueNumber
- 8 - 400 - 409 - 52- 1 - 1 - 2 - 1
2003 2004 2005 2006 2007 2008 2009 2010
Greenfield FDI projects, announced in 2003-2010
Name of companyEstimated investment ($ million)
Estimated jobs
createdYear Home country Sector Key business function
Aquentium 400 123 2006 United States Communications ICT and Internet infrastructureBTC Networks 400 123 2008 Saudi Arabia Communications ICT and Internet infrastructureCoca-Cola 52 345 2010 United States Food and tobacco ManufacturingCommercial Bank of Ethiopia 9.2 16 2008 Ethiopia Financial services Business servicesCoca-Cola 8.3 120 2004 United States Beverages Manufacturing
Data of foreign affiliates of the United States in Somalia, 1995-2008(Millions of dollars in assets)
Variable 1995 1996 1997 1998 1999 2000 2001 2002 2003 2004 2005 2006 2007 2008
Number 1 1 1 1 - - - - - - - - - -
Assets 5 6 6 - - 8 8 9 10 - - - - -
Selected foreign affiliates in Somalia, 2010
Company Home economy Industry Sales EmploymentYear of
est.German Agro Action Office Germany .. 20 ..
Other relevant information
Membership of relevant international agreements as of January 2011: ICSID•Address of investment agency: None•Contact: Not available•Fortune Globe 500 investors: None•Member of WAIPA as of January 2011: No•

Foreign Direct Investment in LDCs: Lessons Learned from the Decade 2001-2010 and the Way Forward198
Chad
Central AfricanRepublic
Khartoum
Libyan ArabJamahiriya Egypt Saudi
Arabia
Eritrea
Ethiopia
Area (‘000 km2): 2008 2 505.8 Population (millions): 2010 43.1 Capital city: KhartoumOfficial language: Arabic Currency: Sudanese dinarExchange rate (period average): 2009 SD 2.09016=$1 GDP in current prices (millions of dollars): 2009 66 218 Exports of goods and services (millions of dollars): 2009 9 980 Imports of goods and services (millions of dollars): 2009 14 036 Official development assistance (millions of dollars): 2009 1 972 External debt (millions of dollars): 2009 20 139
FDI inflows, 1992-2010 (Millions of dollars)
FDI inflows as a percentage of gross fixed capital formation, 1992-2010
Note: Data for 2010 are estimates.
Note: Data for 2010 are estimates.
Sudan
Inward FDI: geographical breakdown, by source, 2003-2009(Millions of dollars)
Region/economy Inward flows Inward stock2003 2004 2005 2006 2007 2008 2009 2003 2004 2005 2006 2007 2008 2009
Germany 14.7 1.2 2.5 1.3 1.4 2.9 - - - - - - - - Sweden - 1.0 - 0.9 - 1.6 - 0.9 - 0.5 - 1.8 - 2.5 - - - - - - - United States - 2.0 1.0 1.0 1.0 - - - 3.0 3.0 3.0 3.0 - - - Turkey - - - 2.0 4.0 4.0 - 1.0 - - - - 13.0 - China - 146.7 91.1 50.8 65.4 - 63.1 19.3 0.6 171.6 351.5 497.1 574.9 528.3 563.9 Korea, Republic of - - 0.0 1.0 - - - 3.6 100.3 100.3 100.3 101.3 101.3 101.0 97.5 Malaysia 157.8 65.6 140.4 114.3 38.7 88.7 - 255.2 320.8 463.2 614.6 696.7 750.5 - Pakistan - - - - - - - - - - 9.8 22.9 - -
-1 000
0
1 000
2 000
3 000
4 000
0 - 0 99 12 0 98 371 371 392 574 713 1 349 1 511 2 305 3 541 2 436 2 601 3 034 2 6721992 1993 1994 1995 1996 1997 1998 1999 2000 2001 2002 2003 2004 2005 2006 2007 2008 2009 2010
- 100
1020
3040
50
0.0 0.0 7.0 0.9 0.0 7.5 33.2 33.5 24.7 32.9 29.9 43.2 33.0 36.8 39.5 21.4 21.2 27.6 20.0
1992 1993 1994 1995 1996 1997 1998 1999 2000 2001 2002 2003 2004 2005 2006 2007 2008 2009 2010
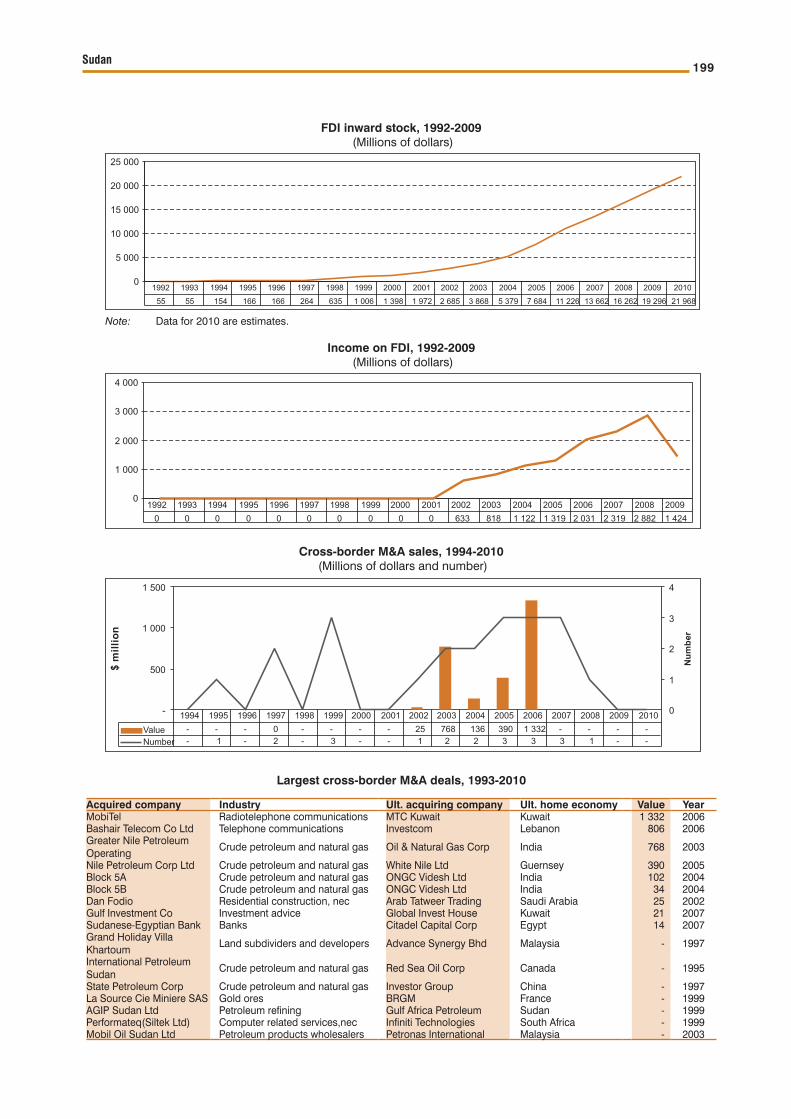
Sudan 199
Cross-border M&A sales, 1994-2010 (Millions of dollars and number)
Income on FDI, 1992-2009 (Millions of dollars)
FDI inward stock, 1992-2009 (Millions of dollars)
Note: Data for 2010 are estimates.
0
5 000
10 000
15 000
20 000
25 000
55 55 154 166 166 264 635 1 006 1 398 1 972 2 685 3 868 5 379 7 684 11 226 13 662 16 262 19 296 21 9681992 1993 1994 1995 1996 1997 1998 1999 2000 2001 2002 2003 2004 2005 2006 2007 2008 2009 2010
0
1 000
2 000
3 000
4 000
0 0 0 0 0 0 0 0 0 0 633 818 1 122 1 319 2 031 2 319 2 882 1 4241992 1993 1994 1995 1996 1997 1998 1999 2000 2001 2002 2003 2004 2005 2006 2007 2008 2009
-
500
1 000
1 500
$m
illio
n
0
1
2
3
4
Num
ber
ValueNumber
- - - 0 - - - - 25 768 136 390 1 332 - - - -- 1 - 2 - 3 - - 1 2 2 3 3 3 1 - -
1994 1995 1996 1997 1998 1999 2000 2001 2002 2003 2004 2005 2006 2007 2008 2009 2010
Largest cross-border M&A deals, 1993-2010
Acquired company Industry Ult. acquiring company Ult. home economy Value YearMobiTel Radiotelephone communications MTC Kuwait Kuwait 1 332 2006Bashair Telecom Co Ltd Telephone communications Investcom Lebanon 806 2006Greater Nile Petroleum Operating
Crude petroleum and natural gas Oil & Natural Gas Corp India 768 2003
Nile Petroleum Corp Ltd Crude petroleum and natural gas White Nile Ltd Guernsey 390 2005Block 5A Crude petroleum and natural gas ONGC Videsh Ltd India 102 2004Block 5B Crude petroleum and natural gas ONGC Videsh Ltd India 34 2004Dan Fodio Residential construction, nec Arab Tatweer Trading Saudi Arabia 25 2002Gulf Investment Co Investment advice Global Invest House Kuwait 21 2007Sudanese-Egyptian Bank Banks Citadel Capital Corp Egypt 14 2007Grand Holiday Villa Khartoum
Land subdividers and developers Advance Synergy Bhd Malaysia - 1997
International Petroleum Sudan
Crude petroleum and natural gas Red Sea Oil Corp Canada - 1995
State Petroleum Corp Crude petroleum and natural gas Investor Group China - 1997La Source Cie Miniere SAS Gold ores BRGM France - 1999AGIP Sudan Ltd Petroleum refining Gulf Africa Petroleum Sudan - 1999Performateq(Siltek Ltd) Computer related services,nec Infiniti Technologies South Africa - 1999Mobil Oil Sudan Ltd Petroleum products wholesalers Petronas International Malaysia - 2003
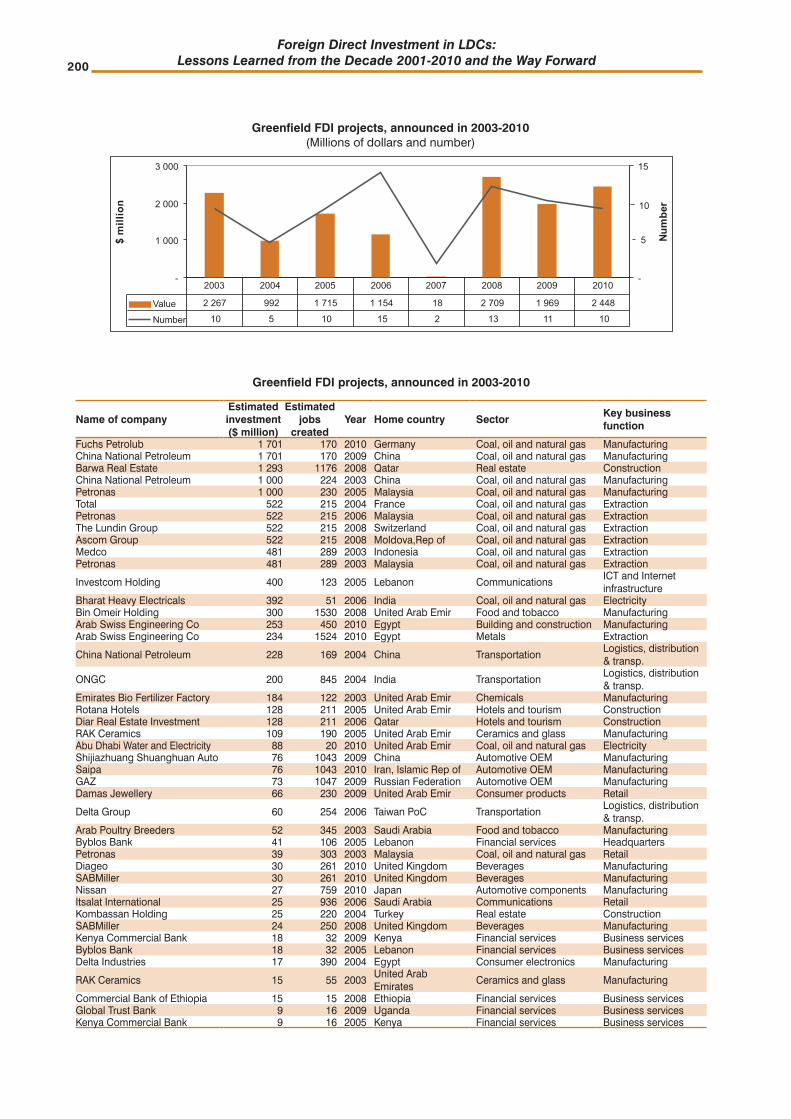
Foreign Direct Investment in LDCs: Lessons Learned from the Decade 2001-2010 and the Way Forward200
Greenfield FDI projects, announced in 2003-2010(Millions of dollars and number)
Greenfield FDI projects, announced in 2003-2010
Name of companyEstimated investment ($ million)
Estimated jobs
createdYear Home country Sector
Key business function
Fuchs Petrolub 1 701 170 2010 Germany Coal, oil and natural gas ManufacturingChina National Petroleum 1 701 170 2009 China Coal, oil and natural gas ManufacturingBarwa Real Estate 1 293 1176 2008 Qatar Real estate ConstructionChina National Petroleum 1 000 224 2003 China Coal, oil and natural gas ManufacturingPetronas 1 000 230 2005 Malaysia Coal, oil and natural gas ManufacturingTotal 522 215 2004 France Coal, oil and natural gas ExtractionPetronas 522 215 2006 Malaysia Coal, oil and natural gas ExtractionThe Lundin Group 522 215 2008 Switzerland Coal, oil and natural gas ExtractionAscom Group 522 215 2008 Moldova,Rep of Coal, oil and natural gas ExtractionMedco 481 289 2003 Indonesia Coal, oil and natural gas ExtractionPetronas 481 289 2003 Malaysia Coal, oil and natural gas Extraction
Investcom Holding 400 123 2005 Lebanon CommunicationsICT and Internet infrastructure
Bharat Heavy Electricals 392 51 2006 India Coal, oil and natural gas ElectricityBin Omeir Holding 300 1530 2008 United Arab Emir Food and tobacco ManufacturingArab Swiss Engineering Co 253 450 2010 Egypt Building and construction ManufacturingArab Swiss Engineering Co 234 1524 2010 Egypt Metals Extraction
China National Petroleum 228 169 2004 China TransportationLogistics, distribution & transp.
ONGC 200 845 2004 India TransportationLogistics, distribution & transp.
Emirates Bio Fertilizer Factory 184 122 2003 United Arab Emir Chemicals ManufacturingRotana Hotels 128 211 2005 United Arab Emir Hotels and tourism ConstructionDiar Real Estate Investment 128 211 2006 Qatar Hotels and tourism ConstructionRAK Ceramics 109 190 2005 United Arab Emir Ceramics and glass ManufacturingAbu Dhabi Water and Electricity 88 20 2010 United Arab Emir Coal, oil and natural gas ElectricityShijiazhuang Shuanghuan Auto 76 1043 2009 China Automotive OEM ManufacturingSaipa 76 1043 2010 Iran, Islamic Rep of Automotive OEM ManufacturingGAZ 73 1047 2009 Russian Federation Automotive OEM ManufacturingDamas Jewellery 66 230 2009 United Arab Emir Consumer products Retail
Delta Group 60 254 2006 Taiwan PoC TransportationLogistics, distribution & transp.
Arab Poultry Breeders 52 345 2003 Saudi Arabia Food and tobacco ManufacturingByblos Bank 41 106 2005 Lebanon Financial services HeadquartersPetronas 39 303 2003 Malaysia Coal, oil and natural gas RetailDiageo 30 261 2010 United Kingdom Beverages ManufacturingSABMiller 30 261 2010 United Kingdom Beverages ManufacturingNissan 27 759 2010 Japan Automotive components ManufacturingItsalat International 25 936 2006 Saudi Arabia Communications RetailKombassan Holding 25 220 2004 Turkey Real estate ConstructionSABMiller 24 250 2008 United Kingdom Beverages ManufacturingKenya Commercial Bank 18 32 2009 Kenya Financial services Business servicesByblos Bank 18 32 2005 Lebanon Financial services Business servicesDelta Industries 17 390 2004 Egypt Consumer electronics Manufacturing
RAK Ceramics 15 55 2003United Arab Emirates
Ceramics and glass Manufacturing
Commercial Bank of Ethiopia 15 15 2008 Ethiopia Financial services Business servicesGlobal Trust Bank 9 16 2009 Uganda Financial services Business servicesKenya Commercial Bank 9 16 2005 Kenya Financial services Business services
-
1 000
2 000
3 000
$m
illio
n
-
5
10
15
Num
ber
ValueNumber
2 267 992 1 715 1 154 18 2 709 1 969 2 44810 5 10 15 2 13 11 10
2003 2004 2005 2006 2007 2008 2009 2010

Sudan 201
BITs, as of December 2010
Economy Date of signatureGermany 7-Feb-1963Netherlands 22-Aug-1970France 31-Jul-1978Romania 8-Dec-1978China 30-May-1997Indonesia 10-Feb-1998Malaysia 2-Aug-1998Qatar 3-Jun-1998Iran, Islamic Republic of 7-Sep-1999Morocco 23-Feb-1999Oman 25-Oct-1999Turkey 19-Dec-1999Yemen 10-Aug-1999Bahrain 17-Jan-2000Ethiopia 7-Mar-2000Jordan 30-Mar-2000Syrian Arab Republic 7-Jan-2000Algeria 24-Oct-2001Egypt 8-Jul-2001United Arab Emirates 18-Feb-2001Bulgaria 3-Apr-2002Switzerland 24-Oct-2002India 22-Oct-2003Tunisia 8-Oct-2003Lebanon 9-Mar-2004Belgium and Luxembourg 7-Nov-2005Italy 19-Nov-2005
DTTs, as of December 2010
Economy Treaty Date of signatureEgypt Income and Capital 9-Dec-1970United Kingdom Income and Capital 8-Mar-1975Malaysia Income and Capital 7-Oct-1993China Income 30-May-1997Syrian Arab Republic Income and Capital 31-May-2001Turkey Income 26-Aug-2001United Arab Emirates Income 15-Mar-2001Tunisia Income 8-Oct-2003Korea, Republic of Income 10-Oct-2004Lebanon Income and Capital 9-Mar-2004Bahrain Income 23-Mar-2006
Data on foreign affiliates of the United States in Sudan, 1995-2008(Millions of dollars in assets, value added and sales; thousands in employees)
Variable 1995 1996 1997 1998 1999 2000 2001 2002 2003 2004 2005 2006 2007 2008Number 2 2 1 1 1 1 1 1 - - - - - -Assets .. .. .. .. .. .. .. .. 4 - - - - -Employees 0.1 0.1 - 0.1 .. .. .. .. - - - - - -Value added - 1 2 2 3 .. .. .. .. - - .. .. .. -Sales - - - .. .. .. .. .. 2 .. .. - .. -
Selected foreign affiliates in Sudan, 2010
Company Home economy Industry Sales EmploymentYear of
est.
House Of Medicine And Investment ItalyDrugs, drug proprietaries, and druggists' sundries
9 74 1972
Daihatsu Motors Ltd Saudi Arabia Automobiles and other motor vehicles .. 6 000 1991Saudi Sudanese Bank Saudi Arabia Commercial banks, nec .. 300 1984Sudapak Corporation Limited Pakistan Oil and gas field exploration services .. 100 2003
Shell Company Of Sudan Ltd United KingdomPetroleum and petroleum products wholesalers
.. 100 1924
The Atlas Trading Company Limited GermanyDrugs, drug proprietaries, and druggists' sundries
.. 50 1954
Maersk Shipping Company Limited Denmark Transportation services, nec .. 25 1998China Petroleum Engineering China Oil and gas field exploration services .. 20 1998
Afristar International Co LtdUnited Arab Emirates
Durable goods, nec .. 5 ..
Aramex International Jordan .. .. .. ..Arm Engineering Enterprise Switzerland Engineering services .. .. ..Bauer Contractor Co. Ltd. Germany Special trade contractors, nec .. .. ..Syngenta Agro Services Ag Switzerland Chemicals and allied products, nec .. .. ..
Other relevant information
Membership of relevant international agreements as of January 2011: MIGA, ICSID•Address of investment agency: Ministry of Investment, Khartoum-West Hilton•Contact: Tel: +(249) (183) 7171 98/7871 97/7871 96, Fax : +249 (183) 7871 92/ 7871 99, Email : [email protected], Web site : www.sudaninvest.orgFortune Globe 500 investors: A.P. Moller - Marsk A/S, Merck Kg Auf Aktien, Royal Dutch Shell Plc•Member of WAIPA as of January 2011: YES•

Foreign Direct Investment in LDCs: Lessons Learned from the Decade 2001-2010 and the Way Forward202
Indonesia
Dili
Banda Sea
Timor Sea
Area (‘000 km2): 2008 14.9 Population (millions): 2010 1.2 Capital city: DiliOfficial language: Tetum, Fataluku, Kemak, Makassae and GaloliCurrency: U.S. dollarExchange rate (period average): 2009 1=$1 GDP in current prices (millions of dollars): 2009 673 Exports of goods and services (millions of dollars): 2009 65 Imports of goods and services (millions of dollars): 2009 562 Official development assistance (millions of dollars): 2009 183 External debt (millions of dollars): 2009 ..
FDI inflows, 1992-2010 (Millions of dollars)
FDI inflows as a percentage of gross fixed capital formation, 1992-2010
Note: Data for 2010 are estimates.
Note: Data for 2010 are estimates.
Timor-Leste
Inward FDI: geographical breakdown, by source, 2003-2009(Millions of dollars)
Region/economy Inward flows Inward stock2003 2004 2005 2006 2007 2008 2009 2003 2004 2005 2006 2007 2008 2009
Germany 4.5 - - - - - - - - - - - - - Portugal - - - - - - - 6.4 - - - - - - Sweden - - - - - - - - - - - - - - United States - - - - - - - 5.0 - - - 2.0 2.0 2.0 - 3.0 Japan - - 0.7 - - - 0.5 - - - - - - - China - 0.1 - - - - - - 0.1 0.1 0.5 0.5 0.5 7.5 Korea, Republic of - - 1.3 0.3 2.2 2.1 13.0 - - 1.3 1.5 3.8 5.9 18.9
0
20
40
60
80
100
62 - - 9 - - - - - 84 1 5 3 0 8 9 38 18 221992 1993 1994 1995 1996 1997 1998 1999 2000 2001 2002 2003 2004 2005 2006 2007 2008 2009 2010
0
20
40
60
80
100
81.9 0.0 0.0 13.5 0.0 0.0 0.0 0.0 0.0 70.9 0.9 3.2 4.2 0.1 11.6 6.8 28.7 11.8 15.9
1992 1993 1994 1995 1996 1997 1998 1999 2000 2001 2002 2003 2004 2005 2006 2007 2008 2009 2010
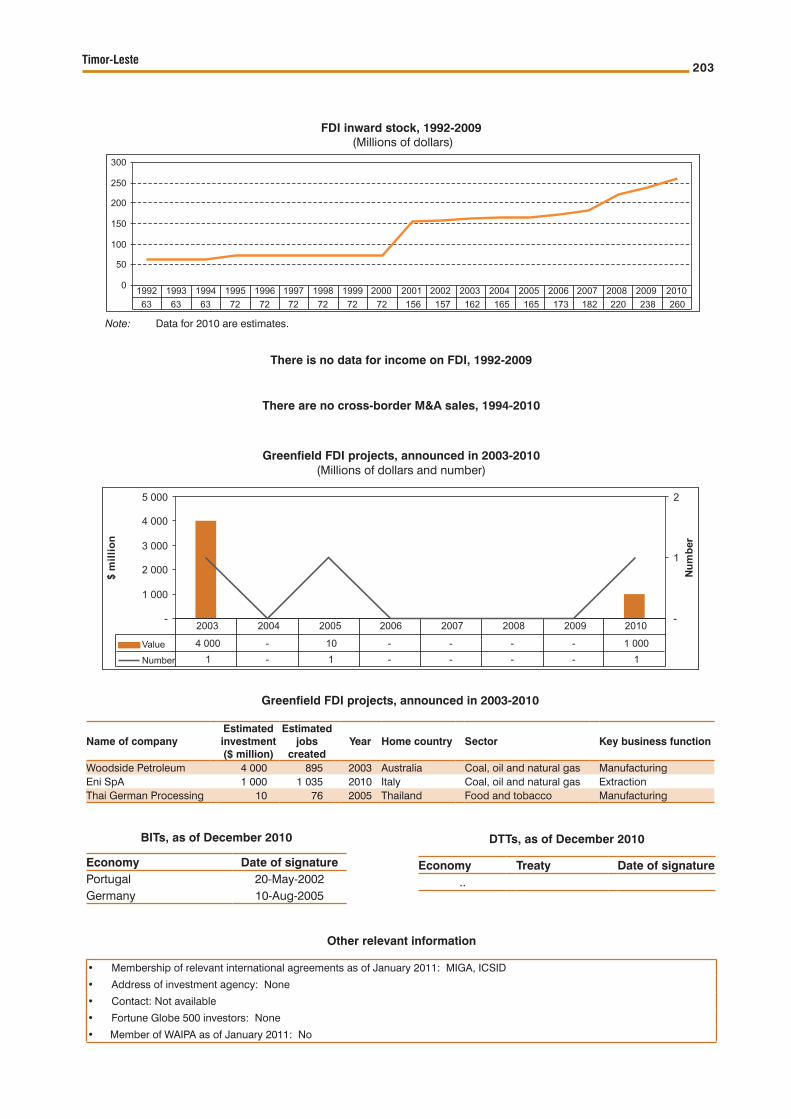
Timor-Leste 203
There are no cross-border M&A sales, 1994-2010
There is no data for income on FDI, 1992-2009
FDI inward stock, 1992-2009 (Millions of dollars)
Note: Data for 2010 are estimates.
Greenfield FDI projects, announced in 2003-2010(Millions of dollars and number)
BITs, as of December 2010
Economy Date of signaturePortugal 20-May-2002Germany 10-Aug-2005
DTTs, as of December 2010
Economy Treaty Date of signature..
0
50
100
150
200
250
300
63 63 63 72 72 72 72 72 72 156 157 162 165 165 173 182 220 238 2601992 1993 1994 1995 1996 1997 1998 1999 2000 2001 2002 2003 2004 2005 2006 2007 2008 2009 2010
-
1 000
2 000
3 000
4 000
5 000
$m
illio
n
-
1
2
Num
ber
ValueNumber
4 000 - 10 - - - - 1 0001 - 1 - - - - 1
2003 2004 2005 2006 2007 2008 2009 2010
Greenfield FDI projects, announced in 2003-2010
Name of companyEstimated investment ($ million)
Estimated jobs
createdYear Home country Sector Key business function
Woodside Petroleum 4 000 895 2003 Australia Coal, oil and natural gas ManufacturingEni SpA 1 000 1 035 2010 Italy Coal, oil and natural gas ExtractionThai German Processing 10 76 2005 Thailand Food and tobacco Manufacturing
Other relevant information
Membership of relevant international agreements as of January 2011: MIGA, ICSID•
Address of investment agency: None•
Contact: Not available•
Fortune Globe 500 investors: None•
Member of WAIPA as of January 2011: No•
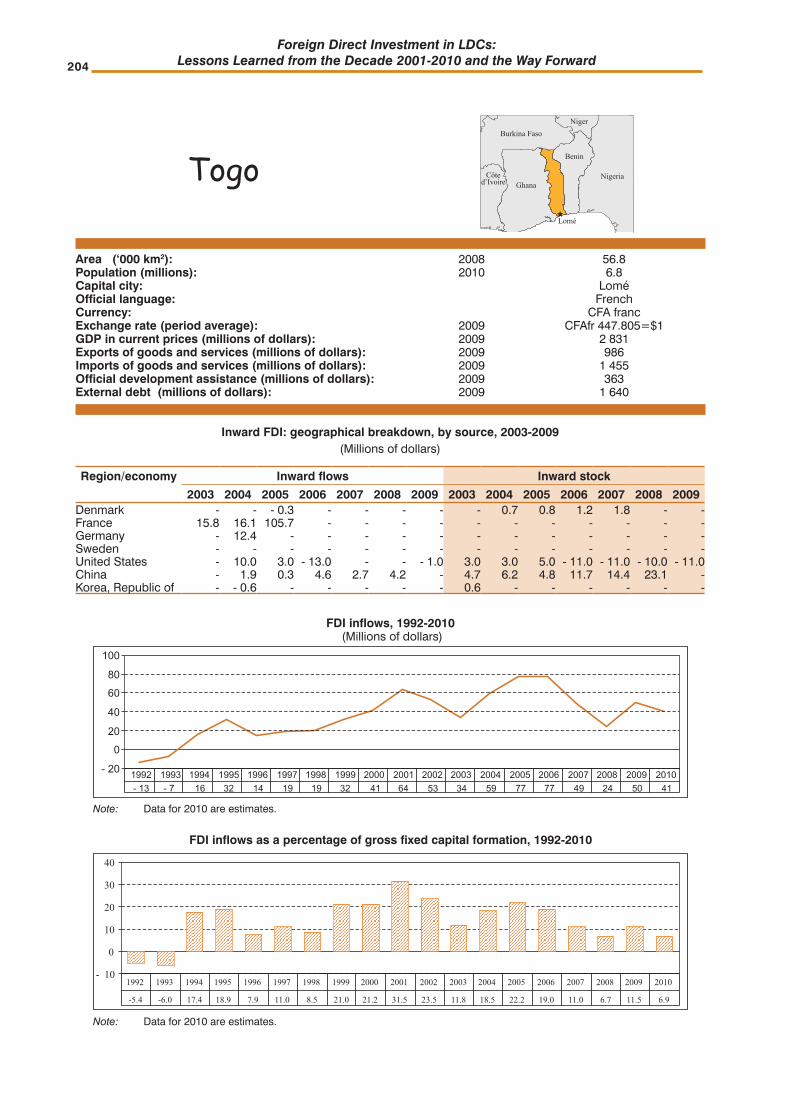
Foreign Direct Investment in LDCs: Lessons Learned from the Decade 2001-2010 and the Way Forward204
Area (‘000 km2): 2008 56.8 Population (millions): 2010 6.8 Capital city: LoméOfficial language: French Currency: CFA francExchange rate (period average): 2009 CFAfr 447.805=$1 GDP in current prices (millions of dollars): 2009 2 831 Exports of goods and services (millions of dollars): 2009 986 Imports of goods and services (millions of dollars): 2009 1 455 Official development assistance (millions of dollars): 2009 363 External debt (millions of dollars): 2009 1 640
FDI inflows, 1992-2010 (Millions of dollars)
FDI inflows as a percentage of gross fixed capital formation, 1992-2010
Note: Data for 2010 are estimates.
Note: Data for 2010 are estimates.
Togo
Niger
NigeriaCôted’Ivoire
Burkina Faso
Benin
Ghana
Lomé
Inward FDI: geographical breakdown, by source, 2003-2009(Millions of dollars)
Region/economy Inward flows Inward stock
2003 2004 2005 2006 2007 2008 2009 2003 2004 2005 2006 2007 2008 2009Denmark - - - 0.3 - - - - - 0.7 0.8 1.2 1.8 - - France 15.8 16.1 105.7 - - - - - - - - - - - Germany - 12.4 - - - - - - - - - - - - Sweden - - - - - - - - - - - - - - United States - 10.0 3.0 - 13.0 - - - 1.0 3.0 3.0 5.0 - 11.0 - 11.0 - 10.0 - 11.0 China - 1.9 0.3 4.6 2.7 4.2 - 4.7 6.2 4.8 11.7 14.4 23.1 - Korea, Republic of - - 0.6 - - - - - 0.6 - - - - - -
- 20
020
40
6080
100
- 13 - 7 16 32 14 19 19 32 41 64 53 34 59 77 77 49 24 50 411992 1993 1994 1995 1996 1997 1998 1999 2000 2001 2002 2003 2004 2005 2006 2007 2008 2009 2010
- 10
0
10
20
30
40
-5.4 -6.0 17.4 18.9 7.9 11.0 8.5 21.0 21.2 31.5 23.5 11.8 18.5 22.2 19.0 11.0 6.7 11.5 6.9
1992 1993 1994 1995 1996 1997 1998 1999 2000 2001 2002 2003 2004 2005 2006 2007 2008 2009 2010
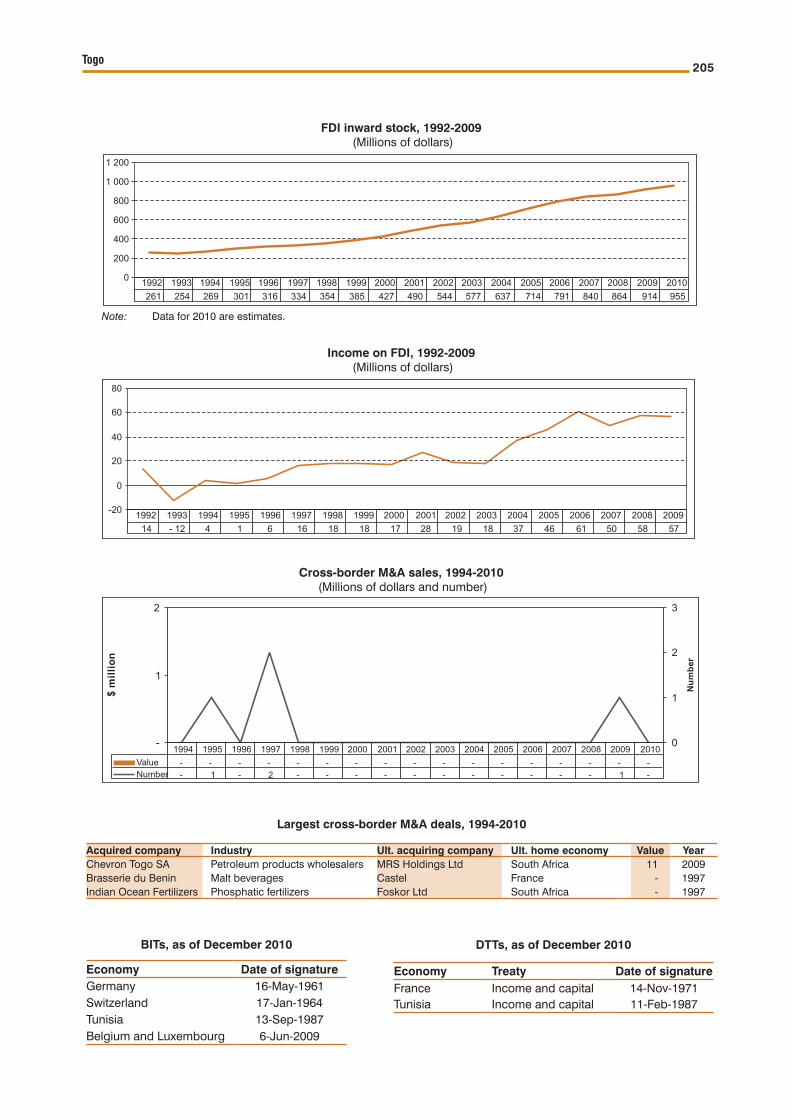
Togo 205
Cross-border M&A sales, 1994-2010 (Millions of dollars and number)
Income on FDI, 1992-2009 (Millions of dollars)
FDI inward stock, 1992-2009 (Millions of dollars)
Note: Data for 2010 are estimates.
BITs, as of December 2010
Economy Date of signatureGermany 16-May-1961Switzerland 17-Jan-1964Tunisia 13-Sep-1987Belgium and Luxembourg 6-Jun-2009
DTTs, as of December 2010
Economy Treaty Date of signatureFrance Income and capital 14-Nov-1971Tunisia Income and capital 11-Feb-1987
0
200
400
600
800
1 000
1 200
261 254 269 301 316 334 354 385 427 490 544 577 637 714 791 840 864 914 9551992 1993 1994 1995 1996 1997 1998 1999 2000 2001 2002 2003 2004 2005 2006 2007 2008 2009 2010
-20
0
20
40
60
80
14 - 12 4 1 6 16 18 18 17 28 19 18 37 46 61 50 58 571992 1993 1994 1995 1996 1997 1998 1999 2000 2001 2002 2003 2004 2005 2006 2007 2008 2009
Largest cross-border M&A deals, 1994-2010
Acquired company Industry Ult. acquiring company Ult. home economy Value YearChevron Togo SA Petroleum products wholesalers MRS Holdings Ltd South Africa 11 2009Brasserie du Benin Malt beverages Castel France - 1997Indian Ocean Fertilizers Phosphatic fertilizers Foskor Ltd South Africa - 1997
$m
illio
n
Num
ber
-
1
2
0
1
2
3
ValueNumber
- - - - - - - - - - - - - - - - -- 1 - 2 - - - - - - - - - - - 1 -
1994 1995 1996 1997 1998 1999 2000 2001 2002 2003 2004 2005 2006 2007 2008 2009 2010

Foreign Direct Investment in LDCs: Lessons Learned from the Decade 2001-2010 and the Way Forward206
Greenfield FDI projects, announced in 2003-2010 (Millions of dollars and number)
-
100
200
300
400
500
$m
illio
n
-
1
2
Num
ber
ValueNumber
- - - 421 400 - 1 -- - - 1 1 - 1 -
2003 2004 2005 2006 2007 2008 2009 2010
Data of foreign affiliates of the United States in Togo, 1995-2008(Millions of dollars in assets, wages and salaries, value added and sales; thousands in employees)
Variable 1995 1996 1997 1998 1999 2000 2001 2002 2003 2004 2005 2006 2007 2008Number 2 2 2 2 2 2 2 2 2 2 2 1 1 1Assets 17 19 20 20 .. .. .. .. .. .. .. .. .. ..Employees - - - .. .. .. .. .. .. 0.1 0.1 - .. ..Wages and salaries - - - .. .. .. .. .. .. 2 2 1 .. ..Value added 8 9 9 8 .. .. .. .. .. 21 23 17 .. ..Sales 22 23 25 22 .. .. .. .. .. .. .. .. .. ..
Selected foreign affiliates in Togo, 2010
Company Home economy Industry Sales EmploymentYear of
est.Societe Des Ciments Du Togo Sa Germany Cement, hydraulic 369 3 000 1969Compagnie Francaise De L Afrique De L Ouest France Automobiles and other motor vehicles 117 99 1924Togo Representation India Beer and ale .. 25 1984
Saga Togo FranceArrangement of transportation of freight and cargo
.. 20 2000
Embassy of The United States Of America United States .. .. 20 ..Togolaise Des Gaz Industriels France Crude petroleum and natural gas .. 18 1961The Uniqueness Of Christ International Ministries United States .. .. 3 ..Agf Togo Assurances Germany Life insurance .. .. ..Bt Togo United Kingdom Communications services, nec .. .. ..Grimaldi Togo S.A. Italy Services, nec .. .. ..Lome Catering France Air transportation, scheduled .. .. ..Maersk Togo Sa Denmark Transportation services, nec .. .. ..Nouvelles Frontieres Togo France .. .. .. ..Satguru Travel & Tours Services United States Tour operators .. .. ..Sgs Togo S.A. Switzerland Testing laboratories .. .. ..
Uac - Togo Sa NetherlandsPiece goods, notions, and other dry goods
.. .. ..
Other relevant information
Membership of relevant international agreements as of January 2011: MIGA, ICSID, TRIMS, GATS and TRIPS•Address of investment agency: None•
Contact: Not availableFortune Globe 500 investors: A.P. Moller - Marsk A/S, Air France - Klm, Allianz Se•Member of WAIPA as of January 2011: No•
Greenfield FDI projects, announced in 2003-2010
Name of companyEstimated investment ($ million)
Estimated jobs
createdYear Home country Sector Key business function
Nykomb 420.5 89 2006 Sweden Alternative/renewable energy ElectricityRadio France Internationale 400 123 2007 France Communications ICT and Internet infrastructureMedview Group 1.4 11 2009 Nigeria Aerospace Sales, marketing and support

Tuvalu 207
Area (‘000 km2): 2008 0.03 Population (millions): 2010 0.01 Capital city: FunafutiOfficial language: Tuvaluan and EnglishCurrency: Tuvaluan dollar and Australian dollarExchange rate (period average): 2009 A$ 1.28=$1 GDP in current prices (millions of dollars): 2009 33 Exports of goods and services (millions of dollars): 2009 4 Imports of goods and services (millions of dollars): 2009 37 Official development assistance (millions of dollars): 2009 15 External debt (millions of dollars): 2009 ..
FDI inflows, 1992-2010 (Millions of dollars)
FDI inflows as a percentage of gross fixed capital formation, 1992-2010
Note: Data for 2010 are estimates.
Note: Data for 2010 are estimates.
Tuvalu
- 10
0
10
20
30
- - 0.2 - 0.0 - 0.1 0.0 - 0.9 0.6 25.0 0.0 0.0 - 0.0 4.7 0.1 1.7 2.2 1.51992 1993 1994 1995 1996 1997 1998 1999 2000 2001 2002 2003 2004 2005 2006 2007 2008 2009 2010
- 100
0
100
200
300
400
0.0 0.0 3.7 0.0 0.5 0.0 0.7 0.3 -13.2 8.3 312.5 0.1 0.3 -0.1 32.7 0.8 9.3 12.2 8.5
1992 1993 1994 1995 1996 1997 1998 1999 2000 2001 2002 2003 2004 2005 2006 2007 2008 2009 2010
FDI inward stock, 1992-2009 (Millions of dollars)
Note: Data for 2010 are estimates.
-10
0
10
20
30
40
- - 0 0 0 0 0 0 - 1 0 25 25 25 25 30 30 32 34 351992 1993 1994 1995 1996 1997 1998 1999 2000 2001 2002 2003 2004 2005 2006 2007 2008 2009 2010
Pacific Ocean

Foreign Direct Investment in LDCs: Lessons Learned from the Decade 2001-2010 and the Way Forward208
There is no data for income on FDI, 1992-2009
BITs, as of December 2010
Economy Date of signature..
DTTs, as of December 2010
Economy Treaty Date of signatureUnited Kingdom Income and capital 10-May-1950Denmark Income and capital 18-Nov-1954Norway Income and capital 18-May-1955Sweden Income and capital 19-Jan-1972
There are no cross-border M&A sales, 1994-2010
There are no greenfield FDI projects, announced in 2003-2010
Data of foreign affiliates of the United States in Tuvalu, 1995-2008(Millions of dollars)
Variable 1995 1996 1997 1998 1999 2000 2001 2002 2003 2004 2005 2006 2007 2008Assets - - - - - - - - - 1 1 1 1 1Sales - - - - - - - .. .. 1 1 1 1 1
Other relevant information
Membership of relevant international agreements as of January 2011: None•
Address of investment agency: None•
Contact: Not available
Fortune Globe 500 investors: None•
Member of WAIPA as of January 2011: No•
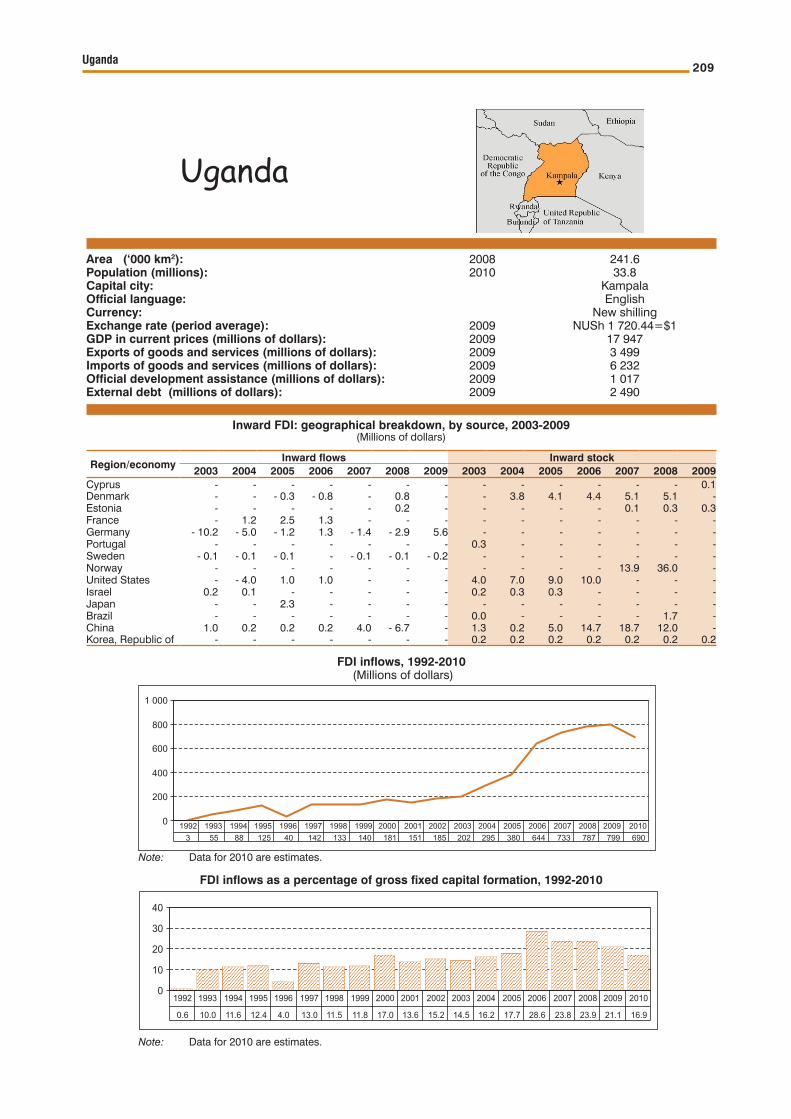
Uganda 209
Area (‘000 km2): 2008 241.6 Population (millions): 2010 33.8 Capital city: KampalaOfficial language: English Currency: New shillingExchange rate (period average): 2009 NUSh 1 720.44=$1 GDP in current prices (millions of dollars): 2009 17 947 Exports of goods and services (millions of dollars): 2009 3 499 Imports of goods and services (millions of dollars): 2009 6 232 Official development assistance (millions of dollars): 2009 1 017 External debt (millions of dollars): 2009 2 490
Uganda
FDI inflows, 1992-2010 (Millions of dollars)
Inward FDI: geographical breakdown, by source, 2003-2009(Millions of dollars)
Region/economyInward flows Inward stock
2003 2004 2005 2006 2007 2008 2009 2003 2004 2005 2006 2007 2008 2009Cyprus - - - - - - - - - - - - - 0.1 Denmark - - - 0.3 - 0.8 - 0.8 - - 3.8 4.1 4.4 5.1 5.1 - Estonia - - - - - 0.2 - - - - - 0.1 0.3 0.3 France - 1.2 2.5 1.3 - - - - - - - - - - Germany - 10.2 - 5.0 - 1.2 1.3 - 1.4 - 2.9 5.6 - - - - - - - Portugal - - - - - - - 0.3 - - - - - - Sweden - 0.1 - 0.1 - 0.1 - - 0.1 - 0.1 - 0.2 - - - - - - - Norway - - - - - - - - - - - 13.9 36.0 - United States - - 4.0 1.0 1.0 - - - 4.0 7.0 9.0 10.0 - - - Israel 0.2 0.1 - - - - - 0.2 0.3 0.3 - - - - Japan - - 2.3 - - - - - - - - - - - Brazil - - - - - - - 0.0 - - - - 1.7 - China 1.0 0.2 0.2 0.2 4.0 - 6.7 - 1.3 0.2 5.0 14.7 18.7 12.0 - Korea, Republic of - - - - - - - 0.2 0.2 0.2 0.2 0.2 0.2 0.2
0
200
400
600
800
1 000
3 55 88 125 40 142 133 140 181 151 185 202 295 380 644 733 787 799 6901992 1993 1994 1995 1996 1997 1998 1999 2000 2001 2002 2003 2004 2005 2006 2007 2008 2009 2010
FDI inflows as a percentage of gross fixed capital formation, 1992-2010
0
10
20
30
40
0.6 10.0 11.6 12.4 4.0 13.0 11.5 11.8 17.0 13.6 15.2 14.5 16.2 17.7 28.6 23.8 23.9 21.1 16.9
1992 1993 1994 1995 1996 1997 1998 1999 2000 2001 2002 2003 2004 2005 2006 2007 2008 2009 2010
Note: Data for 2010 are estimates.
Note: Data for 2010 are estimates.

Foreign Direct Investment in LDCs: Lessons Learned from the Decade 2001-2010 and the Way Forward210
Cross-border M&A sales and purchases, 1994-2010 (Millions of dollars and number)
Income on FDI, 1992-2009 (Millions of dollars)
0
100
200
300
400
0 18 10 35 10 7 16 17 17 66 63 83 219 202 249 268 293 3291992 1993 1994 1995 1996 1997 1998 1999 2000 2001 2002 2003 2004 2005 2006 2007 2008 2009
-
10
20
30
40
50
60
$m
illio
n
012345678
Num
ber
ValueNumber
- 1 54 29 11 - 33 - 20 - - - - - 1 - -- 1 3 1 2 3 7 2 1 2 2 2 7 5 6 2 3
1994 1995 1996 1997 1998 1999 2000 2001 2002 2003 2004 2005 2006 2007 2008 2009 2010
Largest cross-border M&A deals, 1993-2010
Acquired company Industry Ult. acquiring companyUlt. home economy
Value Year
Heritage Oil Ltd Crude petroleum and natural gas Tullow Oil PLC United Kingdom 1 500 2010MTN Uganda Ltd Radiotelephone communications Johnnic Holdings Ltd South Africa 167 2006MTN Uganda Ltd Radiotelephone communications MTN Group Ltd South Africa 166 2006Infocom Ltd Information retrieval services Altron South Africa 85 2008La Source Group Investors, nec Banff Resources Ltd Canada 49 1996Uganda Telecom. Ltd Communications services, nec Investor Group Germany 33 2000Rwenzori Tea Investments Food preparations, nec McLeod Russel India India 30 2010Nile Breweries Malt beverages South African Breweries United Kingdom 29 1997Uganda Commercial Bank Ltd Banks Standard Bank Inv. South Africa 20 2002Uganda Commercial Bank Ltd Banks Westmont Land Malaysia 11 1998Celtel Uganda Telephone communications Celtel International BV Netherlands 7 2000Stanbic Bank Uganda Ltd Banks Standard Bank Group South Africa 7 1996Kampala Pharmaceutical Ind. Pharmaceutical preparations Investor Group India 5 1996Uganda-Fish Canning Plant Canned and cured fish and seafoods Undisclosed Acquiror unspecified 1 1995Alam Group Investors, nec China Everbright Hldg Co Hong Kong, China 1 2008United Garment Industries Ltd Textile goods, nec Kasiwada Japan 1 2000
FDI inward stock, 1992-2010 (Millions of dollars)
0
1 000
2 000
3 000
4 000
5 000
6 000
10 65 153 277 317 459 591 667 807 962 1 147 1 349 1 645 2 024 2 669 3 402 4 189 4 988 5 6771992 1993 1994 1995 1996 1997 1998 1999 2000 2001 2002 2003 2004 2005 2006 2007 2008 2009 2010

Uganda 211
Selected Greenfield FDI projects, announced in 2003-2010
Name of companyEstimated investment ($ million)
Estimated jobs
createdYear Home country Sector
Key business function
Tullow Oil 5 000 1 119 2010 United Kingdom Coal, oil and natural gas ManufacturingKenol-Kobil Group 1 701 170 2010 Kenya Coal, oil and natural gas ManufacturingHeritage Oil 1 044 430 2008 United Kingdom Coal, oil and natural gas ExtractionAlbatros Energy 749 120 2010 Mauritius Coal, oil and natural gas ElectricitySOMAF 700 166 2009 Luxembourg Coal, oil and natural gas ExtractionHeritage Oil 522 215 2008 United Kingdom Coal, oil and natural gas Extraction
Dimension Data Holdings 468 131 2010 South Africa CommunicationsICT and Internet infrastructure
Seacom 468 131 2009 Mauritius CommunicationsICT and Internet infrastructure
France Telecom 400 123 2009 France CommunicationsICT and Internet infrastructure
Zain (MTC) 400 123 2003 Kuwait CommunicationsICT and Internet infrastructure
MTN Group 382 718 2009 South Africa CommunicationsICT and Internet infrastructure
Tamoil (Oilinvest B.V. Group) 250 415 2009 Netherlands Coal, oil and natural gasLogistics, distribution and transportation
Deutsche Rohstoff AG 223 448 2008 Germany Metals ManufacturingTullow Oil 200 47 2008 United Kingdom Coal, oil and natural gas Extraction
France Telecom 200 316 2008 France CommunicationsICT and Internet infrastructure
Reliance Communications 200 316 2007 India CommunicationsICT and Internet infrastructure
Tullow Oil 175 49 2010 United Kingdom Coal, oil and natural gas ExtractionLafarge 108 139 2008 France Minerals Extraction
Lafarge 108 133 2008 FranceBuilding and construction
Manufacturing
Bharti Group 100 144 2010 India CommunicationsICT and Internet infrastructure
Lafarge 93 114 2006 FranceBuilding and construction
Manufacturing
Kingdom Hotel Investments 60 169 2008 United Arab Emirates Hotels and tourism ConstructionKingdom Hotel Investments 60 169 2006 United Arab Emirates Hotels and tourism ConstructionDooka Industrial and Training
60 306 2006 Iran, Islamic Rep of Food and tobacco Manufacturing
Leicester Paper Company 60 155 2008 United Kingdom Wood Products Manufacturing
BITs, as of December 2010
Economy Date of signatureGermany 29-Nov-1966Switzerland 23-Aug-1971Egypt 4-Nov-1995Italy 12-Dec-1997United Kingdom 24-Apr-1998Netherlands 30-May-2000South Africa 8-May-2000Denmark 26-Nov-2001Eritrea 30-Jun-2001Cuba 1-Jan-2002France 3-Jan-2003Nigeria 15-Jan-2003Zimbabwe 1-Jul-2003China 27-May-2004Belgium and Luxembourg 1-Feb-2005
DTTs, as of December 2010
Economy Treaty Date of signatureSouth Africa Income and Capital 7-Dec-1959Zambia Income and Capital 24-Aug-1968United Kingdom Income and Capital 23-Dec-1992Norway Income and Capital 7-Sep-1999Denmark Income and Capital 14-Jan-2000Italy Income 6-Oct-2000Netherlands Income and Capital 3-May-2000Mauritius Air Transport 19-Sep-2003Mauritius Income 29-Sep-2003Mauritius Income and Capital 19-Sep-2003India Income 30-Apr-2004Netherlands Income 31-Aug-2004Belgium Income and Capital 26-Jul-2007
Greenfield FDI projects, announced in 2003-2010 (Millions of dollars and number)
-
2 500
5 000
7 500
10 000
$m
illio
n
-
10
20
30
40
Num
ber
Value
Number
471 32 67 325 289 2 927 2 306 8 339
5 5 6 15 7 37 16 21
2003 2004 2005 2006 2007 2008 2009 2010

Foreign Direct Investment in LDCs: Lessons Learned from the Decade 2001-2010 and the Way Forward212
Data on foreign affiliates of the United States in Uganda, 1995-2008(Millions of dollars in wages and salaries and value added; thousands in employees)
Variable 1995 1996 1997 1998 1999 2000 2001 2002 2003 2004 2005 2006 2007 2008Number 1 1 1 1 2 2 1 1 1 1 1 1 1 1Employees 0.1 - 0.1 0.1 .. .. .. .. .. 0.1 .. 0.1 .. ..Wages and salaries 1 1 1 1 .. .. .. .. .. 2 - 2 .. ..Value added 10 32 34 32 .. .. .. .. .. 30 44 38 .. ..
Selected foreign affiliates in Uganda, 2010
Company Home economy Industry Sales EmploymentYear of
est.Interfreight Forwarders ( U ) Ltd Switzerland Arrangement of transportation of freight and cargo .. 8 000 1990Nile Breweries Ltd United Kingdom Malt beverages .. 634 1954Uganda Grain Milling Co Ltd Kenya Wet corn milling .. 500 1956Uganda Breweries Ltd Kenya Malt beverages .. 350 1999Monitor Publications Ltd Kenya Newspapers: publishing, or publishing & printing .. 300 1992Dhl International Uganda Limited Germany Courier services, except by air .. 200 1986Unilever Uganda Limited United Kingdom Soap & other detergents, except specialty cleaners .. 200 1960Toyota Uganda Ltd Japan Auto and home supply stores .. 148 ..The Coopers Motors Corporation Kenya Automobiles and other motor vehicles .. 80 1960Achelis (Uganda) Ltd Germany Industrial machinery and equipment .. 60 1961Transpaper (U) Ltd Kenya Stationery and office supplies .. 40 1988Anupam Global Soft Ltd India Computer integrated systems design .. 28 ..Agro Machinery (Uganda) Ltd India Industrial machinery and equipment .. 24 1988Uniworld Uganda Ltd United Arab Emirates Drugs, drug proprietaries, and druggists' sundries .. 15 1997Henkel Uganda Ltd Germany Chemicals and allied products, nec .. 3 1995Fuji Technologies Limited Japan Computers and peripheral equipment and software .. .. 2007Kaweri Coffee Plantation Limited Germany .. .. .. 2001Aes Nile Power United States Heavy construction, nec .. .. 1995Hima Cement 1994 Limited France Cement, hydraulic .. .. 1994Energo Uganda Company Limited Serbia & Montenegro Residential construction, nec .. .. 1992Barclays Bank Uganda Limited United Kingdom Commercial banks, nec .. .. 1927Abb Ltd Switzerland Communications services, nec .. .. ..Acnielsen Uganda Ltd Luxembourg Business services, nec .. .. ..Alarm Protection Services Ltd United Kingdom Services, nec .. .. ..Boc Uganda Ltd Germany Crude petroleum and natural gas .. .. ..Carl Bro Uganda Ltd Netherlands Management consulting services .. .. ..Coleus Crowns (Uganda) Ltd United Kingdom Manufacturing industries, nec .. .. ..Cropscience Uganda Limited Germany Services, nec .. .. ..Dhl Global Forwarding (Uganda) Limited Germany Arrangement of transportation of freight and cargo .. .. ..Egl, Inc Cayman Islands Marinas .. .. ..
Other relevant information
Membership of relevant international agreements as of January 2011: MIGA, ICSID, CREFAA, TRIMS, GATS •and TRIPSAddress of investment agency: Uganda Investment Authority, The Investment Centre, Plot 22B Lumumba •Avenue, TWED Plaza P.O. Box 7418 Kampala, Uganda
Contact: Tel: +256 413 010 00, Fax : + 256 413 429 03, Email : [email protected], Web site : www.ugandainvest.com
Fortune Globe 500 investors: Abb Ltd, Astrazeneca Plc, Barclays Plc, Bayer Ag, Deutsche Post Ag, Henkel •Ag & Co. Kgaa, Henkel Polymer Company Limited, Société Lafarge, Toyota Tsusho Corporation, Unilever PlcMember of WAIPA as of January 2011: YES•

United Republic of Tanzania 213
Area (‘000 km2): 2008 945.1 Population (millions): 2010 45.0 Capital city: Dar es SalaamOfficial language: Swahili and English Currency: Tanzania shillingExchange rate (period average): 2009 TZS 1 196.31=$1 GDP in current prices (millions of dollars): 2009 23 074 Exports of goods and services (millions of dollars): 2009 5 602 Imports of goods and services (millions of dollars): 2009 9 067 Official development assistance (millions of dollars): 2009 1 407 External debt (millions of dollars): 2009 7 325
FDI inflows, 1992-2010 (Millions of dollars)
FDI inflows as a percentage of gross fixed capital formation, 1992-2010
United Republicof Tanzania
DemocraticRepublicof theCongo
Zambia
Burundi
Rwanda
UgandaKenya
Dar es Salaam
Mozambique
Inward FDI: geographical breakdown, by source, 2003-2009(Millions of dollars)
Region/economy Inward flows Inward stock2003 2004 2005 2006 2007 2008 2009 2003 2004 2005 2006 2007 2008 2009
Cyprus - - - - - - 0.1 - - - - - - 0.2 Denmark - - 0.3 1.0 - 0.6 - - 1.1 1.4 2.3 4.5 4.4 - Estonia 0.0 - - - - - - - - - - - - - France - - - 1.3 - - - - - - - - - - Germany - 6.8 7.5 - 8.7 23.8 - 5.5 29.3 - 20.8 - - - - - - - Sweden - 0.4 - - - - - - - - - - - - - Norway - - - - - - - 1.3 8.8 13.0 23.6 49.9 79.7 - Canada - - - - - - - - - - - - - 37.3 United States - 7.0 - 3.0 - 6.0 - - - - 18.0 22.0 21.0 - - - - Japan - - - - - - 0.4 1.0 - - - - - - - China - 1.6 1.0 12.5 - 3.8 18.2 - 7.5 53.8 62.0 111.9 110.9 190.2 - Korea, Republic of - 0.1 0.2 0.3 1.5 1.0 1.0 2.1 2.2 2.3 2.5 4.0 4.9 5.9 Malaysia 0.3 - - - - - - 3.9 3.9 4.0 4.2 4.5 4.3 -
0
200
400
600
800
12 20 50 150 149 158 172 497 282 467 388 308 331 494 597 647 679 645 700
1992 1993 1994 1995 1996 1997 1998 1999 2000 2001 2002 2003 2004 2005 2006 2007 2008 2009 2010
Note: Data for 2010 are estimates.
0
10
20
30
40
0.7 1.3 3.3 10.4 9.9 9.9 9.2 29.3 16.6 26.0 21.0 13.8 11.4 13.9 15.0 12.9 10.3 9.8 10.4
1992 1993 1994 1995 1996 1997 1998 1999 2000 2001 2002 2003 2004 2005 2006 2007 2008 2009 2010
Note: Data for 2010 are estimates.

Foreign Direct Investment in LDCs: Lessons Learned from the Decade 2001-2010 and the Way Forward214
Cross-border M&As, sales and purchases, 1994-2010 (Millions of dollars and number)
Income on FDI, 1992-2009 (Millions of dollars)
Note: Data for 2010 are estimates.
0
20
40
60
80
- - - 2 2 0 8 17 13 73 59 60 58 66 66 68 68 72
1992 1993 1994 1995 1996 1997 1998 1999 2000 2001 2002 2003 2004 2005 2006 2007 2008 2009
FDI inward stock, 1992-2009 (Millions of dollars)
0
2000
4000
6000
8000
10000
400 420 470 620 681 760 1 715 1 989 2 778 2 960 3 243 4 139 4 759 4 390 5 342 5 942 6 621 7 266 7 966
1992 1993 1994 1995 1996 1997 1998 1999 2000 2001 2002 2003 2004 2005 2006 2007 2008 2009 2010
Note: Data for 2010 are estimates.
-
50
100
150
$m
illio
n
0
2
4
6
Num
ber
Value 11 - - 1 23 - 19 120 21 2 - - - - - 2 60
Number 5 4 1 3 4 3 4 1 4 2 - 2 6 2 4 6 6
1994 1995 1996 1997 1998 1999 2000 2001 2002 2003 2004 2005 2006 2007 2008 2009 2010
Note: Data for 2010 are estimates.
Largest cross-border M&A deals, 1994-2010
Acquired company Industry Ult. acquiring company Ult. home economy Value YearGeita Mine Gold ores Anglo American PLC United Kingdom 270 2000Tanzania Telecommunication Telephone communications Investor Group Germany 120 2001Serengeti Breweries Ltd Malt beverages Diageo PLC United Kingdom 60 2010Sekab Bioenergy Tanzania Ltd Industrial organic chemicals Ecodevelopment in Europe Sweden 58 2009Kilombero Sugar Co Cane sugar, except refining Investor Group South Africa 22 1998Air Tanzania Corp Air transportation South African Airways South Africa 20 2002National Bank of Commerce Banks Absa Group Ltd South Africa 19 2000Golden Pride Gold Project Gold ores Resolute Resources Australia 17 1996
Zanzibar Telecommunications Telephone communications Etisalat United Arab Emirates 16 2010
Kabanga Nickel Co Ferroalloy ores Falconbridge Ltd Canada 15 2005Tanzania Diamond Mines Gold ores Bakertalc Inc Canada 8 1994Kagera Nickel Sulphide Project Ferroalloy ores Innovance Ltd Australia 7 2010Nyakafuru Project Gold ores Resolute Mining Ltd Australia 6 2008Dar es Salaam Airport Handling Airports and airport terminal services Swissair Switzerland 5 2000Tanzanian Diamond Mines Gold ores Bakertalc Inc Canada 4 1994Renewable Energy Corp Gold ores Triennex South Africa 3 2000Indago Resources Ltd Uranium-radium-vanadium ores Uranium Resources United Kingdom 3 2010Thorntree Minerals Ltd Gold ores Helio Resource Corp Canada 2 2009Precision Air Air transportation, scheduled Kenya Airways Ltd Kenya 2 2003

United Republic of Tanzania 215
Greenfield FDI projects, announced in 2003-2010 (Millions of dollars and numbers)
-
500
1 000
1 500
2 000
2 500$
mill
ion
-
5
10
15
20
25
Num
ber
ValueNumber
1 188 1 406 1 520 263 315 2 090 728 9947 6 11 7 6 17 12 23
2003 2004 2005 2006 2007 2008 2009 2010
Greenfield FDI projects, announced in 2003-2010
Name of companyEstimated investment ($ million)
Estimated jobs
createdYear Home country Sector
Key business function
Globeleq 728 131 2004 United States Coal, oil and natural gas ElectricityEnerGulf Resources 522 215 2005 Canada Coal, oil and natural gas ExtractionHeritage Oil 522 215 2008 United Kingdom Coal, oil and natural gas Extraction
CAMS Group 500 502 2008 United KingdomAlternative/renewable energy
Manufacturing
Aminex 481 289 2003 United Kingdom Coal, oil and natural gas Extraction
Dimension Data Holdings 468 131 2010 South Africa CommunicationsICT and Internet infrastructure
Seacom 468 131 2009 Mauritius CommunicationsICT and Internet infrastructure
Telkom 400 123 2003 South Africa CommunicationsICT and Internet infrastructure
Athi River Mining 284 453 2008 Kenya Building and construction ManufacturingBarrick Gold 284 1 621 2003 Canada Metals Extraction
Svensk Etanolkemi 250 251 2008 SwedenAlternative/renewable energy
Manufacturing
Lakota Resources 242 1 667 2004 Canada Metals ExtractionGallery Gold 242 1 667 2005 Australia Metals ExtractionNorthern Mining Explorations 242 1 667 2005 Canada Metals ExtractionBarrick Gold 242 1 667 2005 Canada Metals ExtractionGoldstream Mining 242 1 667 2005 Australia Metals ExtractionSub-Sahara Resources 242 1 667 2004 Australia Metals ExtractionShanta Gold 234 1 524 2010 United Kingdom Metals ExtractionLiming Chemical Industrial 190 138 2004 China Chemicals ManufacturingDangote Group 164 306 2008 Nigeria Building and construction ManufacturingDe Beers 150 950 2006 South Africa Minerals Manufacturing
Dubai World 150 423 2007United Arab Emirates
Hotels and tourism Construction
Sobha Developers 128 211 2008 India Hotels and tourism ConstructionFairmont Raffles Hotels Internat'l 128 211 2007 Canada Hotels and tourism ConstructionInterContinental Hotels Group 128 209 2009 United Kingdom Hotels and tourism Construction
BITs, as of December 2010
Economy Date of signatureGermany 30-Jan-1965United Kingdom 7-Jan-1994Egypt 30-Apr-1997Korea, Republic of 18-Dec-1998Denmark 22-Apr-1999Sweden 1-Sep-1999Finland 19-Jun-2001Italy 21-Aug-2001Netherlands 31-Jul-2001Zimbabwe 3-Jul-2003Switzerland 8-Apr-2004South Africa 22-Sep-2005Jordan 8-Oct-2009Mauritius 4-May-2009
DTTs, as of December 2010
Economy Treaty Date of signatureSouth Africa Income and Capital 7-Dec-1959Zambia Income and Capital 2-Mar-1968Italy Income and Capital 7-Mar-1973Denmark Income and Capital 6-May-1976Finland Income and Capital 12-May-1976Norway Income and Capital 28-Apr-1976Sweden Income and Capital 2-May-1976India Income and Capital 5-Sep-1979Canada Income and Capital 15-Dec-1995South Africa Income 22-Sep-2005

Foreign Direct Investment in LDCs: Lessons Learned from the Decade 2001-2010 and the Way Forward216
Data of foreign affiliates of the United States in United Republic of Tanzania, 1995-2008(Millions of dollars in assets, wages and salaries, value added and sales; thousands in employees)
Variable 1995 1996 1997 1998 1999 2000 2001 2002 2003 2004 2005 2006 2007 2008
Number 3 4 4 4 3 3 3 4 4 2 2 2 2 2
Assets 21 142 152 .. .. 90 53 74 77 70 .. 81 .. ..
Employees 0.1 1.2 1.1 0.8 .. 0.3 0.3 0.5 0.5 0.7 .. 0.6 .. ..
Wages and salaries 1 7 8 5 .. 3 2 3 4 4 .. 7 .. ..
Value added - 75 72 64 .. - 2 6 5 8 .. 10 .. ..
Sales - - - .. 24 34 31 75 83 .. .. .. .. ..
Selected foreign affiliates in United Republic of Tanzania, 2010
Company Home economy Industry Sales EmploymentYear of
est.Unilever Tea Tanzania Ltd United Kingdom Food preparations, nec 14 5 500 1984Citibank Tanzania Ltd United States Commercial banks, nec 13 104 1995Achelis (Tanganyika) Limited Germany Automotive parts, supplies 10 250 1961Tanzania Breweries Ltd United Kingdom Malt beverages .. 1 500 1960
Body Care Ltd United StatesSoap & other detergents, except specialty cleaners
.. 1 000 1993
Barclays Bank (T) Ltd United Kingdom Commercial banks, nec .. 750 2000City Water Services Ltd United Kingdom Water supply .. 750 1984Karibu Textile Mills Limited Mauritius Textile goods, nec .. 600 1998Vodacom Tanzania Ltd United Kingdom Radiotelephone communications .. 300 1999Resolute Tanzania Limited Australia Gold ores .. 300 1996Kibo Breweries Ltd Kenya Malt beverages .. 250 1998
Tri Telecommunications Ltd MalaysiaTelephone communications, except radiotelephone
.. 215 1994
Tanzania Distillers Limited South Africa Distilled and blended liquors .. 180 1983Dominion Tanzania Limited Bermuda Oil and gas field exploration services .. 160 ..D T Dobie & Company (Tanzania) Ltd France Automobiles and other motor vehicles .. 150 1984Brooke Bond Tanzania Ltd United Kingdom Food preparations, nec .. 150 1961Pricewaterhousecoopers United States Legal services .. 150 1950Treadsetters Tyres (T) Ltd Kenya Tires and inner tubes .. 125 1994
Tri Clover Industries ( T ) Limited KenyaPerfumes, cosmetics, and other toilet preparations
.. 65 2000
Sadolin Paints Tanzania Limited OmanPaints, varnishes, lacquers, & allied products
.. 65 1994
Other relevant information
Membership of relevant international agreements as of January 2011: MIGA, ICSID, TRIMS, GATS and TRIPS•Address of investment agency: Tanzania Investment Centre, Shaaban Robert Street, P.O. Box 938, Dar es Salaam, Tanzania •
Contact: Tel: (+255)-22-2116328 - 32, Fax: (+255)-22-2118253, Email:[email protected] Fortune Globe 500 investors: Barclays Plc, Bayer Ag, Citigroup Inc., Deutsche Post Ag, Glaxosmithkline Plc, Henkel Ag & Co. •Kgaa, Mitsubishi Corporation, Pfizer Inc., Reliance Industries Limited, Société Lafarge, Unilever Plc, Vodafone Group PlcMember of WAIPA as of January 2011: YES•
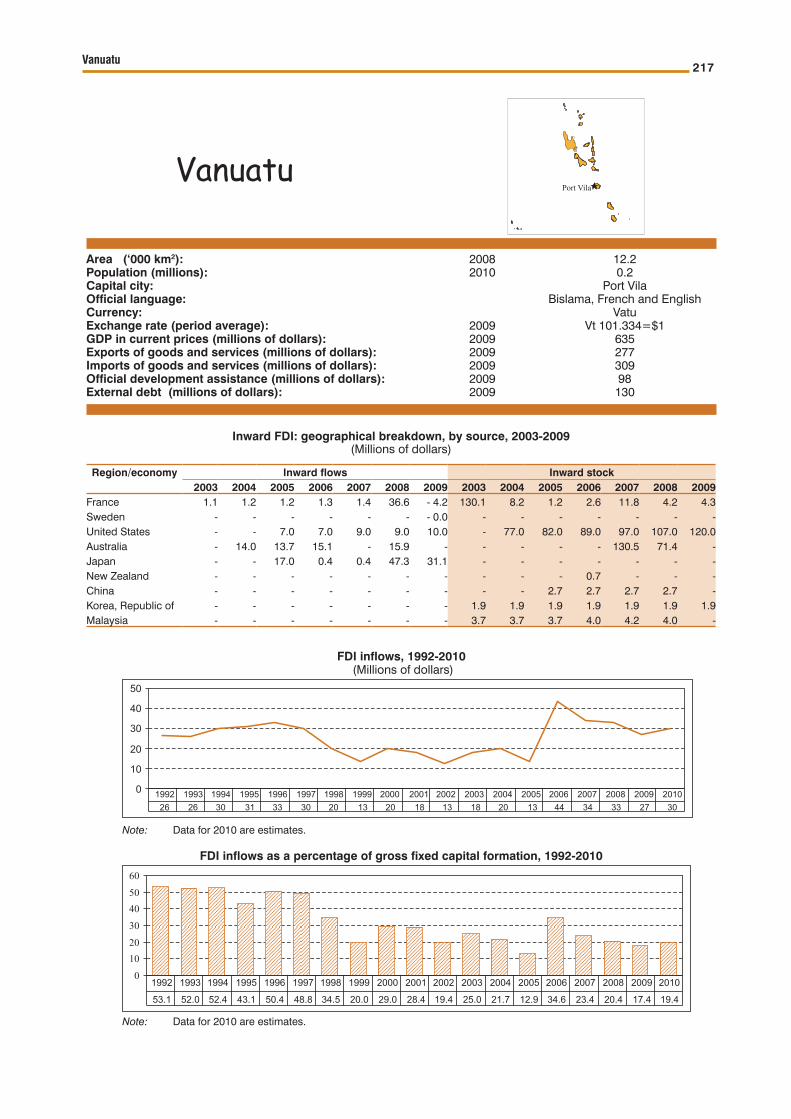
Vanuatu 217
Area (‘000 km2): 2008 12.2 Population (millions): 2010 0.2 Capital city: Port VilaOfficial language: Bislama, French and English Currency: VatuExchange rate (period average): 2009 Vt 101.334=$1 GDP in current prices (millions of dollars): 2009 635 Exports of goods and services (millions of dollars): 2009 277 Imports of goods and services (millions of dollars): 2009 309 Official development assistance (millions of dollars): 2009 98 External debt (millions of dollars): 2009 130
FDI inflows, 1992-2010 (Millions of dollars)
FDI inflows as a percentage of gross fixed capital formation, 1992-2010
Note: Data for 2010 are estimates.
Note: Data for 2010 are estimates.
VanuatuPort Vila
Inward FDI: geographical breakdown, by source, 2003-2009(Millions of dollars)
Region/economy Inward flows Inward stock2003 2004 2005 2006 2007 2008 2009 2003 2004 2005 2006 2007 2008 2009
France 1.1 1.2 1.2 1.3 1.4 36.6 - 4.2 130.1 8.2 1.2 2.6 11.8 4.2 4.3 Sweden - - - - - - - 0.0 - - - - - - - United States - - 7.0 7.0 9.0 9.0 10.0 - 77.0 82.0 89.0 97.0 107.0 120.0 Australia - 14.0 13.7 15.1 - 15.9 - - - - - 130.5 71.4 - Japan - - 17.0 0.4 0.4 47.3 31.1 - - - - - - - New Zealand - - - - - - - - - - 0.7 - - - China - - - - - - - - - 2.7 2.7 2.7 2.7 - Korea, Republic of - - - - - - - 1.9 1.9 1.9 1.9 1.9 1.9 1.9 Malaysia - - - - - - - 3.7 3.7 3.7 4.0 4.2 4.0 -
0
10
20
30
40
50
26 26 30 31 33 30 20 13 20 18 13 18 20 13 44 34 33 27 301992 1993 1994 1995 1996 1997 1998 1999 2000 2001 2002 2003 2004 2005 2006 2007 2008 2009 2010
0102030405060
53.1 52.0 52.4 43.1 50.4 48.8 34.5 20.0 29.0 28.4 19.4 25.0 21.7 12.9 34.6 23.4 20.4 17.4 19.4
1992 1993 1994 1995 1996 1997 1998 1999 2000 2001 2002 2003 2004 2005 2006 2007 2008 2009 2010

Foreign Direct Investment in LDCs: Lessons Learned from the Decade 2001-2010 and the Way Forward218
Cross-border M&A sales, 1994-2010 (Millions of dollars and number)
Income on FDI, 1992-2009 (Millions of dollars)
FDI inward stock, 1992-2009 (Millions of dollars)
Note: Data for 2010 are estimates.
0
200
400
600
800
1000
1200
253 279 309 340 373 403 423 437 457 475 488 506 592 578 756 928 1 019 1 046 1 0761992 1993 1994 1995 1996 1997 1998 1999 2000 2001 2002 2003 2004 2005 2006 2007 2008 2009 2010
0
10
20
30
40
50
60
30 30 35 36 31 29 21 14 22 14 18 21 27 35 34 46 52 501992 1993 1994 1995 1996 1997 1998 1999 2000 2001 2002 2003 2004 2005 2006 2007 2008 2009
-
1
2
3
4
$m
illio
n
0
1
2
Num
ber
ValueNumber
- - - - - - - - - - - - 3 - - 4 -- - - - - - 1 - - - - - 1 - - 1 -
1994 1995 1996 1997 1998 1999 2000 2001 2002 2003 2004 2005 2006 2007 2008 2009 2010
Largest cross-border M&A deals, 1994-2010
Acquired company Industry Ult. acquiring company Ult. home economy Value YearInternational Data Process, Netcom Information retrieval
servicesMy Casino Ltd Australia 5 2000
Carpenters Vanuatu Holding Real estate investment trusts
Impact Action Sdn Malaysia 4 2009
Nautilus XPO Ltd Copper ores Nautilus Minerals Inc Canada 3 2006
There are no greenfield FDI projects, announced in 2003-2010

Vanuatu 219
BITs, as of December 2010
Economy Date of signatureUnited Kingdom 22-Dec-2003China 7-Apr-2006
DTTs, as of December 2010
Economy Treaty Date of signature..
Data of foreign affiliates of the United States in Vanuatu, 1995-2008(Millions of dollars in assets, wages and salaries and value added)
Variable 1995 1996 1997 1998 1999 2000 2001 2002 2003 2004 2005 2006 2007 2008
Number 1 1 1 1 1 1 1 1 1 1 1 1 1 1
Assets .. .. .. .. .. .. .. .. .. 87 .. .. .. ..
Wages and salaries - - - - .. .. .. .. .. 1 1 1 .. ..
Value Added 2 10 14 15 .. .. .. .. .. 10 13 12 .. ..
Data of foreign affiliates of Vanuatu in the United States, 1995-2008(Millions of dollars in assets and sales)
Variable 1995 1996 1997 1998 1999 2000 2001 2002 2003 2004 2005 2006 2007 2008
Number 1 1 1 1 1 1 1 - - - - - 1 -
Assets 4 4 .. .. - - - - .. .. .. .. - -
Sales 1 1 .. 1 1 - - - .. .. .. .. - -
Selected foreign affiliates in Vanuatu, 2010
Company Home economy Industry Sales EmploymentYear of
est.
Toyota Tsusho (Vanuatu) Limited AustraliaMotor vehicle dealers (new and used)
2 70 1947
Anz Bank (Vanuatu) Limited Australia State banks,member fed reserve .. 103 1970Batt Limited Germany Hardware stores .. 86 2003New Era Foods Pty Ltd Australia Confectionery .. 27 1988A G C Finance (Vanuatu) Limited Australia Personal credit institutions .. .. 1987International Leasing (Vanuatu) Ltd United Kingdom .. .. .. 1987Van Plaza Limited Japan Real estate agents and managers .. .. 198299 Bishopgate Ltd United Kingdom .. .. .. 1976
Origin Energy (Vanuatu) Ltd AustraliaLiquefied petroleum gas (bottled gas) dealers
.. .. 1973
Union Electrique Du Vanuatu Limited
France Electric services .. .. 1939
Austpac Resources (Vanuatu) Ltd Australia Metal mining services .. .. ..Barclays Nominees Beneficial United Kingdom .. .. .. ..Conocophillips United States .. .. .. ..Delta Gold Vanuatu Ltd Australia .. .. .. ..Fubon Bank Vanuatu Limited Taiwan Province of China .. .. .. ..Hertz Corporation United States .. .. .. ..Holiday Villages Vanuatu France .. .. .. ..Kpmg Vanuatu United States .. .. .. ..Metenesel Estates Ltd United Kingdom .. .. .. ..Qbe Insurance Australia Insurance carriers, nec .. .. ..Surata-Tamaso Travel United States .. .. .. ..Vanuatu Travel Services Ltd Australia .. .. .. ..Victoria Investments Ltd Cayman Islands .. .. .. ..Wallem (Overseas) Holdings Ltd Cayman Islands .. .. .. ..
Other relevant information
Membership of relevant international agreements as of January 2011: MIGA•Address of investment agency: Vanautu Investment Promotion Authority, Laguna Building, Port Vila, Vanuatu. Mailing Address: •Private Mailbag 9011 Port Vila, Vanuatu Contact: Tel: +678 24096 / +678 24441, Fax: +678 25216, Web: www.InvestVanuatu.org, Email: [email protected] Globe 500 investors: Australia And New Zealand Banking Group Limited, Barclays Plc, Conocophillips, Gdf Suez, Ge •Capital Mortgage Insurance Corporation (Australia) Pty Ltd, Hsbc Holdings Plc, Toyota Tsusho South Pacific Holdings Pty LtdMember of WAIPA as of January 2011: YES•

Foreign Direct Investment in LDCs: Lessons Learned from the Decade 2001-2010 and the Way Forward220
YemenEthiopia
Eritrea
Somalia
Djibouti
Sana’a
Saudi Arabia
Area (‘000 km2): 2008 528.0 Population (millions): 2010 24.3 Capital city: Sana’aOfficial language: Arabic Currency: Yemeni rialExchange rate (period average): 2009 Rials 199.764=$1 GDP in current prices (millions of dollars): 2009 29 017 Exports of goods and services (millions of dollars): 2009 6 585 Imports of goods and services (millions of dollars): 2009 8 066 Official development assistance (millions of dollars): 2009 378 External debt (millions of dollars): 2009 6 356
FDI inflows, 1992-2010 (Millions of dollars)
FDI inflows as a percentage of gross fixed capital formation, 1992-2010
Note: Data for 2010 are estimates.
Note: Data for 2010 are estimates.
Inward FDI: geographical breakdown, by source, 2003-2009(Millions of dollars)
Region/economy Inward flows Inward stock2003 2004 2005 2006 2007 2008 2009 2003 2004 2005 2006 2007 2008 2009
Cyprus 0.5 - - - - - - - 6.6 5.8 6.4 7.0 6.7 - France 5.6 7.5 182.8 323.7 112.2 128.9 251.4 181.9 55.8 212.3 846.8 1 506.0 1 343.0 1 473.7 Germany 3.4 3.7 - - - - - - - - - - - - Sweden - 0.3 - 0.2 - 0.4 - 0.3 - 0.2 - 0.5 - 0.7 - - - - - - - Norway - - - - - - - - - - - 9.6 - 23.7 - - Canada - - - - - - - - - 156.3 160.5 214.6 - - United States 66.0 - 20.0 - 90.0 497.0 35.0 47.0 69.0 618.0 640.0 497.0 779.0 814.0 862.0 931.0 China 0.0 3.4 35.2 7.6 43.5 18.8 - 12.8 31.0 77.8 63.8 107.2 140.5 - Korea, Republic of 3.7 6.3 13.3 0.5 0.5 0.1 1.2 162.9 169.9 257.8 486.5 695.8 425.2 426.4 Pakistan - - - - - - - - - - 17.2 23.6 - -
- 500
0
500
1 000
1 500
2 000
718 903 16 - 218 - 60 - 139 - 219 - 308 6 136 102 6 144 - 302 1 121 917 1 555 129 - 3291992 1993 1994 1995 1996 1997 1998 1999 2000 2001 2002 2003 2004 2005 2006 2007 2008 2009 2010
- 50
0
50
100
150
91.8 123.3 1.9 -20.3 -4.4 -9.5 -15.3 -22.9 0.4 8.0 4.8 0.2 4.9 -9.5 30.6 20.3 27.9 2.8 -7.3
1992 1993 1994 1995 1996 1997 1998 1999 2000 2001 2002 2003 2004 2005 2006 2007 2008 2009 2010

Yemen 221
Cross-border M&A sales, 1994-2010 (Millions of dollars and number)
Income on FDI, 1992-2009 (Millions of dollars)
FDI inward stock, 1992-2009 (Millions of dollars)
0
1 000
2 000
3 000
4 000
5 000
4 1961 181 2 084 2 099 1 882 1 822 1 683 1 457 1 129 1 336 1 271 1 336 1 011 1 249 803 1 924 2 842 4 396 4 5251992 1993 1994 1995 1996 1997 1998 1999 2000 2001 2002 2003 2004 2005 2006 2007 2008 2009 2010
0
500
1 000
1 500
2 000
236 244 378 433 541 554 321 662 855 800 840 945 1 289 1 603 1 403 1 390 1 875 9271992 1993 1994 1995 1996 1997 1998 1999 2000 2001 2002 2003 2004 2005 2006 2007 2008 2009
-
200
400
600
800
$m
illio
n
0
1
2
3
Num
ber
ValueNumber
- - - - - - - - - - - - 716 144 - - 20- - - - 1 - - 2 - - - - 1 1 1 - 1
1994 1995 1996 1997 1998 1999 2000 2001 2002 2003 2004 2005 2006 2007 2008 2009 2010
Largest cross-border M&A deals, 1994-2010
Acquired company Industry Ult. acquiring companyUlt. home economy
Value Year
Spacetel Yemen Radiotelephone communications Investcom Lebanon 716 2006Oil Search(MENA)Ltd Crude petroleum and natural gas Kuwait Energy Co Kuwait 200 2008SabaFon Radiotelephone communications Bahrain Telecommunications Bahrain 144 2007Yemen Saudi Cement Co Adhesives and sealants Qassim Cement Co Saudi Arabia 20 2010Pecten Yemen Co Crude petroleum and natural gas Occidental Petro Corp United States - 1998Agip SpA-Al Shabwah Al Maber
Crude petroleum and natural gasSociete Nationale Recherch Exploration Commercialisation Hydrocarbures
Algeria - 2001
National Beverage Co Bottled & canned soft drinks Investors unspecified - 2001
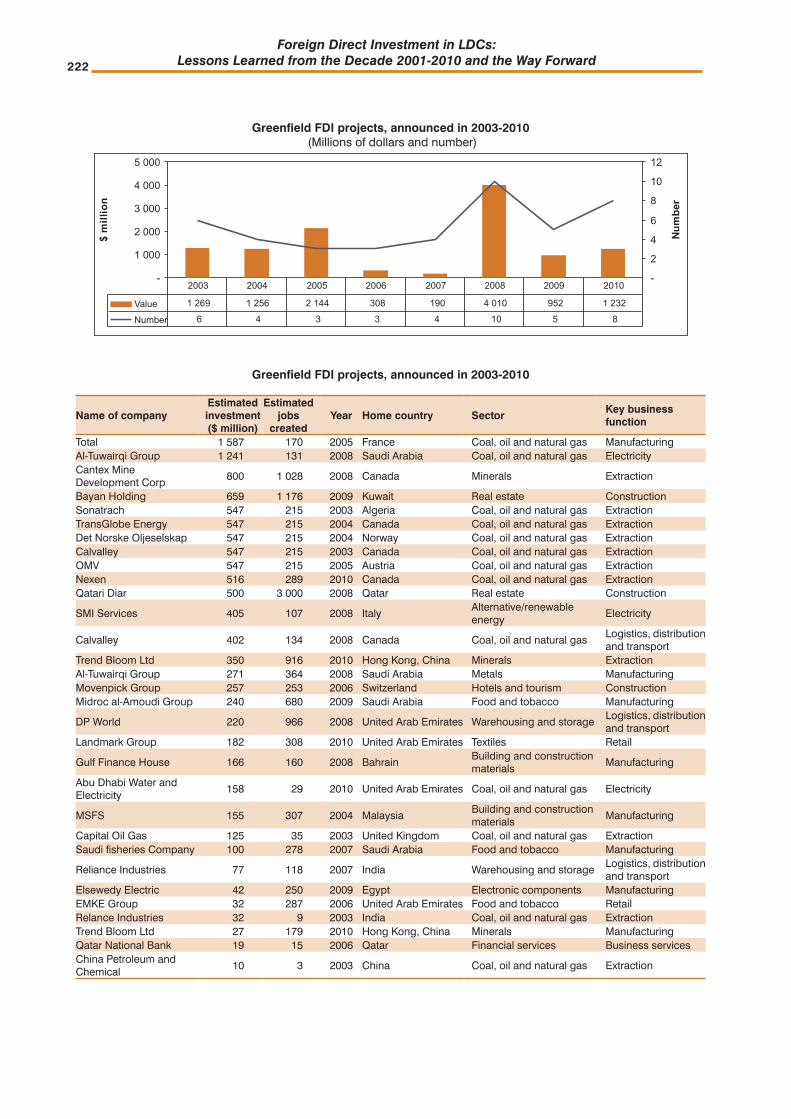
Foreign Direct Investment in LDCs: Lessons Learned from the Decade 2001-2010 and the Way Forward222
Greenfield FDI projects, announced in 2003-2010 (Millions of dollars and number)
-
1 000
2 000
3 000
4 000
5 000
$m
illio
n
-
2
4
6
8
10
12
Num
ber
ValueNumber
1 269 1 256 2 144 308 190 4 010 952 1 2326 4 3 3 4 10 5 8
2003 2004 2005 2006 2007 2008 2009 2010
Greenfield FDI projects, announced in 2003-2010
Name of companyEstimated investment ($ million)
Estimated jobs
createdYear Home country Sector
Key business function
Total 1 587 170 2005 France Coal, oil and natural gas ManufacturingAl-Tuwairqi Group 1 241 131 2008 Saudi Arabia Coal, oil and natural gas ElectricityCantex Mine Development Corp
800 1 028 2008 Canada Minerals Extraction
Bayan Holding 659 1 176 2009 Kuwait Real estate ConstructionSonatrach 547 215 2003 Algeria Coal, oil and natural gas ExtractionTransGlobe Energy 547 215 2004 Canada Coal, oil and natural gas ExtractionDet Norske Oljeselskap 547 215 2004 Norway Coal, oil and natural gas ExtractionCalvalley 547 215 2003 Canada Coal, oil and natural gas ExtractionOMV 547 215 2005 Austria Coal, oil and natural gas ExtractionNexen 516 289 2010 Canada Coal, oil and natural gas ExtractionQatari Diar 500 3 000 2008 Qatar Real estate Construction
SMI Services 405 107 2008 ItalyAlternative/renewable energy
Electricity
Calvalley 402 134 2008 Canada Coal, oil and natural gasLogistics, distribution and transport
Trend Bloom Ltd 350 916 2010 Hong Kong, China Minerals ExtractionAl-Tuwairqi Group 271 364 2008 Saudi Arabia Metals ManufacturingMovenpick Group 257 253 2006 Switzerland Hotels and tourism ConstructionMidroc al-Amoudi Group 240 680 2009 Saudi Arabia Food and tobacco Manufacturing
DP World 220 966 2008 United Arab Emirates Warehousing and storageLogistics, distribution and transport
Landmark Group 182 308 2010 United Arab Emirates Textiles Retail
Gulf Finance House 166 160 2008 BahrainBuilding and construction materials
Manufacturing
Abu Dhabi Water and Electricity
158 29 2010 United Arab Emirates Coal, oil and natural gas Electricity
MSFS 155 307 2004 MalaysiaBuilding and construction materials
Manufacturing
Capital Oil Gas 125 35 2003 United Kingdom Coal, oil and natural gas ExtractionSaudi fisheries Company 100 278 2007 Saudi Arabia Food and tobacco Manufacturing
Reliance Industries 77 118 2007 India Warehousing and storageLogistics, distribution and transport
Elsewedy Electric 42 250 2009 Egypt Electronic components ManufacturingEMKE Group 32 287 2006 United Arab Emirates Food and tobacco RetailRelance Industries 32 9 2003 India Coal, oil and natural gas ExtractionTrend Bloom Ltd 27 179 2010 Hong Kong, China Minerals ManufacturingQatar National Bank 19 15 2006 Qatar Financial services Business servicesChina Petroleum and Chemical
10 3 2003 China Coal, oil and natural gas Extraction

Yemen 223
DTTs, as of December 2010
Economy Treaty Date of signatureDenmark Income and Capital 22-Dec-1954Tunisia Income and Capital 8-Mar-1998Syrian Arab Republic Income and Capital 23-Jul-2001United Arab Emirates Income 13-Feb-2001Algeria Income and Capital 29-Jan-2002Lebanon Income and Capital 29-Sep-2002Oman Income 8-May-2002Turkey Income 26-Oct-2005Morocco Income 8-Feb-2006
Data of foreign affiliates of the United States in Yemen, 1995-2008(Millions of dollars in assets, wages and salaries, value added and sales; thousands in employees)
Variable 1995 1996 1997 1998 1999 2000 2001 2002 2003 2004 2005 2006 2007 2008Number 13 15 15 12 8 8 8 8 8 7 7 6 6 6Assets 1 097 1 091 1 076 775 712 1 199 1 262 1 096 991 1 107 1 318 .. .. ..Employees 2 2 .. .. 2 2 2 2 2 .. .. 0.4 1.5 1.5Wages and salaries 32 31 .. .. 41 35 36 37 42 .. .. 18 22 27Value added 470 580 .. .. 393 999 837 818 759 .. .. 836 1 134 1 220Sales - - - 352 492 1 167 965 975 1 079 1 247 1 314 869 1 107 1 296
Data of foreign affiliates of Yemen in the United States, 1995-2008(Millions of dollars in assets and value added)
Variable 1995 1996 1997 1998 1999 2000 2001 2002 2003 2004 2005 2006 2007 2008Number 1 - .. .. - - - - - - - - - -Assets 5 - .. .. - - - .. .. .. .. .. - -Value added - 1 - .. .. - .. - - - - - - - -
BITs, as of December 2010
Economy Date of signatureUnited Kingdom 25-Feb-1982Sweden 29-Oct-1983France 27-Apr-1984Netherlands 18-Mar-1985Jordan 18-Jun-1995Egypt 6-Jun-1996Iran, Islamic Republic of 29-Feb-1996Syrian Arab Republic 9-Oct-1996China 16-Feb-1998Indonesia 20-Feb-1998Malaysia 11-Feb-1998Oman 20-Sep-1998Tunisia 8-Mar-1998Algeria 25-Nov-1999Ethiopia 15-Apr-1999Lebanon 25-Nov-1999Pakistan 11-May-1999Sudan 10-Aug-1999Belgium and Luxembourg 20-Nov-2000Qatar 7-Aug-2000Turkey 7-Sep-2000Kuwait 20-Feb-2001Morocco 24-Feb-2001Ukraine 1-Feb-2001United Arab Emirates 13-Feb-2001Austria 1-Jul-2002Bahrain 1-Dec-2002Bulgaria 12-Apr-2002India 1-Oct-2002Russian Federation 1-Dec-2002South Africa 1-Aug-2002Belarus 18-Jul-2003Hungary 18-Jan-2004Italy 25-Nov-2004Germany 2-Feb-2005Czech Republic 20-May-2008

Foreign Direct Investment in LDCs: Lessons Learned from the Decade 2001-2010 and the Way Forward224
Selected foreign affiliates in Yemen, 2010
Company Home economy Industry Sales EmploymentYear of
est.Tasweeq Entertrade Saudi Arabia Confectionery 2 31 1996G4S Security Services Yemen Llc United Kingdom Security systems services .. 2 700 ..Yemen Hunt Oil United States Oil and gas field exploration services .. 2 000 1964Aramex International Couriers Jordan Business services, nec .. 25 ..Griffin Co Ltd United States Electronic parts and equipment, nec .. 16 1998Marubeni Corporation Japan Commodity contracts brokers and dealers .. 1 ..Canadian Nexen Petroleum Canada Petroleum refining .. .. ..Cgg France .. .. .. ..Clorox Company, The United States Soap & other detergents, except specialty cleaners .. .. ..Egl, Inc Cayman Islands Arrangement of transportation of freight and cargo .. .. ..Encana (Yemen) Limited Canada Oil and gas field services, nec .. .. ..Intergraph Corporation United States Electronic parts and equipment, nec .. .. ..Milestone Holding One, Inc United Kingdom Durable goods, nec .. .. ..Miol Yemen United States Oil and gas field services, nec .. .. ..
Social Security Administration United StatesAdministration of social and manpower programs
.. .. ..
Sojitz Corporation Japan Nondurable goods, nec .. .. ..Synovate United Kingdom .. .. .. ..
Other relevant information
Membership of relevant international agreements as of January 2011: MIGA, ICSID•
Address of investment agency: General Investment Authority (GIA), P.O Box: 19022, 26 Al-Quds Street, Southern Al-Safia, •Sanaa, Republic of Yemen
Contact: Tel: (+967) 1 262 962, Fax: (+967) 1 262-964, E-mail: [email protected]
Fortune Globe 500 investors: Cie Gen De Geophysique - Veritas, Marubeni Corporation•
Member of WAIPA as of January 2011: YES•

Zambia 225
Zambia Angola
BotswanaZimbabwe
Lusaka
Mozambique
Malawi
United Republicof Tanzania
Democratic Republicof the Congo
Area (‘000 km2): 2008 752.6 Population (millions): 2010 13.2 Capital city: LusakaOfficial language: English Currency: Zambia kwachaExchange rate (period average): 2009 Zmk 3 745.86=$1 GDP in current prices (millions of dollars): 2009 12 768 Exports of goods and services (millions of dollars): 2009 4 589 Imports of goods and services (millions of dollars): 2009 4 727 Official development assistance (millions of dollars): 2009 703 External debt (millions of dollars): 2009 3 049
FDI inflows, 1992-2010 (Millions of dollars)
FDI inflows as a percentage of gross fixed capital formation, 1992-2010
Note: Data for 2010 are estimates.
Note: Data for 2010 are estimates.
Inward FDI: geographical breakdown, by source, 2003-2009(Millions of dollars)
Region/economy Inward flows Inward stock2003 2004 2005 2006 2007 2008 2009 2003 2004 2005 2006 2007 2008 2009
Cyprus 0.4 - - - 0.2 - - - 0.5 0.4 0.5 0.8 0.7 0.2 Denmark - - - 0.7 - - - - 0.2 - 0.2 0.9 - - 19.3 Germany - 11.2 1.2 - - 17.6 - - - - - - - - Norway - - - - - - - 0.4 - 0.3 0.3 - 1.0 - - - United States - 4.0 - 3.0 - 15.0 5.0 - 1.0 6.0 45.0 36.0 35.0 74.0 76.0 79.0 95.0 Japan - - - 0.3 - - - - - - - - - - South Africa - - - - - - - 62.5 73.2 92.6 59.3 51.2 81.0 - Brazil - - - - - - - - - - - - 5.5 - China 5.5 2.2 10.1 87.4 119.3 214.0 111.8 143.7 147.8 160.3 267.9 429.4 651.3 844.0 Korea, Republic of - - - - 0.1 0.2 0.2 - - - - 0.1 0.3 0.5
0
500
1 000
1 500
45 314 40 97 117 217 238 86 122 72 303 347 364 357 616 1 324 939 959 7341992 1993 1994 1995 1996 1997 1998 1999 2000 2001 2002 2003 2004 2005 2006 2007 2008 2009 2010
0
20
40
60
80
100
12.9 83.7 10.6 22.5 31.8 42.5 49.6 17.2 21.8 10.5 37.9 32.5 23.6 18.0 23.5 43.2 25.9 26.3 20.3
1992 1993 1994 1995 1996 1997 1998 1999 2000 2001 2002 2003 2004 2005 2006 2007 2008 2009 2010

Foreign Direct Investment in LDCs: Lessons Learned from the Decade 2001-2010 and the Way Forward226
Cross-border M&A sales, 1994-2010 (Millions of dollars and number)
Income on FDI, 1992-2009 (Millions of dollars)
FDI inward stock, 1992-2009 (Millions of dollars)
0
2 000
4 000
6 000
8 000
10 000
12 000
2 735 3 049 3 089 3 186 3 303 3 520 3 758 3 844 3 966 4 038 4 341 4 688 5 052 5 409 6 025 7 604 8 545 9 504 10 2381992 1993 1994 1995 1996 1997 1998 1999 2000 2001 2002 2003 2004 2005 2006 2007 2008 2009 2010
0
400
800
1 200
1 600
- - 21 7 - - - - - - - 24 238 461 1 107 1 475 1 345 1 1891992 1993 1994 1995 1996 1997 1998 1999 2000 2001 2002 2003 2004 2005 2006 2007 2008 2009
-
50
100
150
200
250
300
$m
illio
n
0
2
4
6
8
10
Num
ber
ValueNumber
- 18 31 173 72 2 133 - 22 - - 8 4 - 1 11 2722 3 9 8 5 4 4 3 1 - 2 6 3 2 7 6 8
1994 1995 1996 1997 1998 1999 2000 2001 2002 2003 2004 2005 2006 2007 2008 2009 2010
Note: Data for 2010 are estimates.
Largest cross-border M&A deals, 1994-2010
Acquired company Industry Ult. acquiring company Ult. home economy Value YearZambia Telecommunications Radiotelephone communications Libya Africa Investment Uganda 257 2010Konkola Copper Mines PLC Copper ores Volcan Investments Ltd Bahamas 213 2008Zambia Consolidated Copper Mines Copper ores Investor Group Bermuda 90 2000Zambia Oxygen Business services, nec BOC Group PLC United Kingdom 60 1997Cyprus Amax Kansanshi Hldgs Gold ores First Quantum Minerals Canada 53 2001Zambia Consolidated Copper Mines Motors and generators Copperbelt Energy Consortium United Kingdom 50 1997Zambia Consolidated Copper Mines Ferroalloy ores, except vanadium Anglovaal Ltd South Africa 50 1998Konkola Copper Mines PLC Copper ores Volcan Investments Ltd Bahamas 48 2004Zambia Consolidated Copper Mines Copper ores Glencore International Switzerland 43 2000Zambia Consolidated Copper Mines Copper ores Cyprus Amax Minerals United States 28 1997
Maamba Collieries LtdBituminous coal and lignite surface mining
Nava Bharat Ventures Ltd India 26 2010
Zambia Bottlers LtdBottled & canned soft drinks & carbonated waters
Zambian Breweries PLC United Kingdom 22 2002
NFC Africa Mining PLC Copper ores Foreign Engineering & Constr. China 20 1998Maamba Collieries Ltd Coal and other minerals and ores Benicon Mining Ltd South Africa 18 1997Zambia Consolidated Copper Mines Copper ores Investor Group South Africa 18 1997Zambia Sugar Co Cane sugar, except refining Tate & Lyle PLC United Kingdom 14 1995Zambezi Joint Venture Copper ores Equinox Minerals Ltd Australia 13 2005

Zambia 227
Greenfield FDI projects, announced in 2003-2010 (Millions of dollars and number)
-
1 000
2 000
3 000
4 000
5 000
$m
illio
n
-24681012141618
Num
ber
ValueNumber
788 662 2 148 1 926 436 4 613 2 359 1 2285 4 14 14 6 17 16 13
2003 2004 2005 2006 2007 2008 2009 2010
Selected Greenfield FDI projects, announced in 2003-2010
Name of companyEstimated investment ($ million)
Estimated jobs
createdYear Home country Sector Key business
function
Era Group 1 800 236 2008 India Coal, oil and natural gas ElectricityGlencore International 1 500 395 2008 Switzerland Alternative/renewable energy ElectricityEquinox Resources 822 1 207 2005 Australia Metals ExtractionVedanta Resources 600 881 2005 United Kingdom Metals ExtractionMAN 500 453 2009 Germany Alternative/renewable energy Manufacturing
Fraunhofer-Gesellschaft 468 131 2009 Germany Communications ICT and Internet infrastructure
Equinox Resources 450 661 2003 Australia Metals ExtractionCompanhia Vale do Rio Doce 400 780 2010 Brazil Metals ExtractionSinohydro 400 105 2008 China Alternative/renewable energy ElectricityChina Nonferrous Metals Mining 400 780 2009 China Metals ExtractionNava Bharat Ventures 399 93 2010 India Alternative/renewable energy ElectricityFurnace Fabrica 380 276 2006 India Chemicals ManufacturingFirst Quantum Minerals 224 329 2004 Canada Metals ExtractionXstrata PLC 223 448 2004 Switzerland Metals ManufacturingFirst Quantum Minerals 223 448 2006 Canada Metals ManufacturingChina Nonferrous Metals Mining 223 448 2006 China Metals ManufacturingFirst Quantum Minerals 223 448 2006 Canada Metals ManufacturingVedanta Resources 223 448 2008 United Kingdom Metals ManufacturingTriple Plate Junction 223 448 2006 United Kingdom Metals ManufacturingTeal Exploration & Mining 215 316 2008 Canada Metals ExtractionChina Nonferrous Metals Mining 204 447 2009 China Metals ManufacturingTotal 200 46 2005 France Coal, oil and natural gas ManufacturingLiberty Group 200 1 758 2008 South Africa Real estate ConstructionChina Nonferrous Metals Mining 200 1 000 2006 China Metals ManufacturingChina Nonferrous Metals Mining 179 1 524 2009 China Metals ExtractionGlencore International 179 1 524 2009 Switzerland Metals ExtractionVedanta Resources 170 1 350 2010 United Kingdom Metals ManufacturingMetorex Group 165 1 667 2003 South Africa Metals ExtractionFirst Quantum Minerals 165 1 667 2004 Canada Metals ExtractionTeal Exploration & Mining 165 1 667 2006 Canada Metals ExtractionZambezi Resources Ltd 165 1 667 2008 Australia Metals ExtractionTata Group 150 40 2007 India Alternative/renewable energy ElectricityChina Nonferrous Metals Mining 150 220 2003 China Metals ExtractionRezidor Hotel Group 129 219 2009 Belgium Hotels and tourism ConstructionWilderness Safaris 128 211 2006 South Africa Hotels and tourism ConstructionVedanta Resources 125 993 2005 United Kingdom Metals ManufacturingDenison Mines 118 384 2009 Canada Metals ExtractionTata Group 118 263 2006 India Engines and turbines ManufacturingNava Bharat Ventures 108 24 2010 India Coal, oil and natural gas ManufacturingLafarge 100 123 2005 France Building and construction ManufacturingChina Nonferrous Metals Mining 100 147 2007 China Metals ExtractionMetorex Group 100 794 2005 South Africa Metals Manufacturing
MTN Group 95 150 2009 South Africa Communications ICT and Internet infrastructure
D1 Oils 90 166 2005 United Kingdom Alternative/renewable energy ManufacturingAssociated British Foods 74 615 2007 United Kingdom Food and tobacco Manufacturing
Hitachi Construction Machinery 69 112 2010 Japan Industrial machinery, equipment and tools Manufacturing

Foreign Direct Investment in LDCs: Lessons Learned from the Decade 2001-2010 and the Way Forward228
BITs, as of December 2010
Economy Date of signatureGermany 10-Dec-1966Switzerland 3-Aug-1994China 21-Jun-1996Cuba 22-Jan-2000Egypt 28-Apr-2000Belgium and Luxembourg 18-May-2001Ghana 18-May-2001France 1-Jan-2002Italy 20-Apr-2003Netherlands 30-Apr-2003Finland 7-Sep-2005
DTTs, as of December 2010
Economy Treaty Date of signatureSouth Africa Income and Capital 22-May-1956Switzerland Income and Capital 30-May-1961France Income and Capital 5-Nov-1963Kenya Income and Capital 27-Aug-1968Uganda Income and Capital 24-Aug-1968Tanzania, United Republic of Income and Capital 2-Mar-1968Japan Income and Capital 19-Feb-1970Ireland Income and Capital 29-Mar-1971Norway Income and Capital 14-Jul-1971Italy Income and Capital 27-Oct-1972United Kingdom Income and Capital 22-Mar-1972Denmark Income and Capital 13-Sep-1973Germany Income and Capital 13-May-1973Sweden Income and Capital 18-Mar-1974Netherlands Income and Capital 19-Dec-1977Finland Income and Capital 3-Nov-1978India Income and Capital 5-Jun-1981Canada Income and Capital 16-Feb-1984Poland Income and Capital 19-May-1995
Data of foreign affiliates of the United States in Zambia, 1995-2008(Millions of dollars in assets, wages and salaries, value added and sales; thousands in employees)
Variable 1995 1996 1997 1998 1999 2000 2001 2002 2003 2004 2005 2006 2007 2008Number 6 6 6 6 4 4 4 5 5 4 3 3 2 3Assets 28 30 28 24 69 73 71 205 208 96 113 140 .. 155Employees 0.5 0.5 0.5 0.5 1.5 1.5 1.4 1.7 1.6 1.2 1.3 1.6 .. 1.1Wages and salaries 4 4 4 5 13 12 13 18 16 8 10 12 .. 11Value added 20 17 19 13 15 20 13 19 18 46 44 52 .. 54Sales - - - 77 119 161 154 201 195 210 228 367 .. 446
Selected foreign affiliates in Zambia, 2010
Company Home economy Industry Sales Employment Year of est.
Caltex Oil Zambia Ltd United States Petroleum and petroleum products wholesalers, nec 104 000 60 1955
Tata Zambia Limited India Automobiles and other motor vehicles 15 000 70 1980Northern Breweries 1995 Plc South Africa Malt beverages 3 717 150 1997British American Tobacco United Kingdom Chewing and smoking tobacco and snuff 47 200 1960Amiran Ltd United Kingdom Farm and garden machinery and equipment 26 50 1963Cfao Zambia Limited France Automobiles and other motor vehicles 26 100 2000Mpongwe Development Company Ltd United Kingdom .. 24 4 000 1983National Breweries P L C United Kingdom Malt beverages 14 400 1999Hitachi Construction Machinery Japan Industrial machinery and equipment 12 38 1992Crown Cork Company (Zambia) Ltd United States Business services, nec 2 70 1965Norconsult Z Ltd Norway Business consulting services, nec 1 15 1992Commins Diesel Services Zambia Ltd United Kingdom Electronic parts and equipment, nec 1 165 1964Barloworld Plascon Zambia Limited South Africa Paints, varnishes, lacquers, & allied products 0 50 1997Philips Electrical Zambia Ltd Netherlands Electronic parts and equipment, nec 0 135 1968Khal Amazi Ltd United Kingdom .. 0 1 000 1997Zambia Sugar Plc Ireland Cane sugar refining .. 6 500 1964Securicor (Zambia) Ltd United Kingdom Detective, guard, and armored car services .. 2 300 1969Galaun Holdings Ltd India Offices of holding companies, nec .. 2 000 1995Sandvik Tamrock Zambia Ltd Netherlands Industrial machinery and equipment .. 500 1993National Milling Corporation Limited United States Flour and other grain mill products .. 400 2000Consolidated Contractors Company Kuwait Highway and street construction .. 200 2002
Reckitt And Colman United Kingdom Perfumes, cosmetics, and other toilet preparations .. 200 1964
Tredcor Zambia Limited Mauritius Tires and tubes .. 170 1996Toyota Zambia Limited Japan Automobiles and other motor vehicles .. 120 1971
Other relevant information
Membership of relevant international agreements as of January 2011: MIGA, ICSID, CREFAA, TRIMS, GATS and TRIPS•Address of investment agency: Zambia Development Agency, Privatization House, Nasser Road, P. O. Box 30819, Lusaka, Zambia•Contact: Tel: +260-211-222858 / 220177, Fax: +260-211-225270, Email: [email protected] Globe 500 investors: Astrazeneca Plc, Barclays Plc, British American Tobacco P.L.C., Chevron Corporation, Citigroup Inc., •Deutsche Post Ag, Hitachi Ltd., Pfizer Inc., T & D Colours & Commodities B.V., Tata International Limited, Toyota Tsusho Co.Member of WAIPA as of January 2011: YES•
Selected UNCTAD Publications on Transnational Corporations and Foreign Direct Investment229
SELECTED UNCTAD PUBLICATIONS ON TRANSNATIONAL CORPORATIONS AND FOREIGN DIRECT INVESTMENT
(For more information, please visit www.unctad.org/en/pub)
World Investment Reports(For more information visit www.unctad.org/wir)
World Investment Report 2010. Investing in a Low-Carbon Economy. Sales No. E.10.II.D.1. $80. http://www.unctad.org/en/docs//wir2010_en.pdf.
World Investment Report 2009. Transnational Corporations, Agricultural Production and Development. Sales No. E.09.II.D.15. $80. http://www.unctad.org/en/docs/wir2009_en.pdf.
World Investment Report 2008. Transnational Corporations and the Infrastructure Challenge. Sales No. E.08.II.D.23. $80. http://www.unctad.org/en/docs//wir2008_en.pdf.
World Investment Report 2007. Transnational Corporations, Extractive Industries and Development. Sales No. E.07.II.D.9. $75. http://www.unctad.org/ en/docs//wir2007_en.pdf.
World Investment Report 2006. FDI from Developing and Transition Economies: Implications for Development. Sales No. E.06.II.D.11. $75. http://www.unctad.org/ en/docs//wir2006_en.pdf.
World Investment Report 2005. Transnational Corporations and the Internationalization of R&D. Sales No. E.05.II.D.10. $75. http://www.unctad.org/ en/docs//wir2005_en.pdf.
World Investment Report 2004. The Shift Towards Services. Sales No. E.04.II.D.36. $75. http://www.unctad.org/en/docs//wir2004_en.pdf.
World Investment Report 2003. FDI Policies for Development: National and International Perspectives. Sales No. E.03.II.D.8. $49. http://www.unctad.org/ en/docs//wir2003_en.pdf.
World Investment Report 2002: Transnational Corporations and Export Competitiveness. 352 p. Sales No. E.02.II.D.4. $49. http://www.unctad.org/ en/docs//wir2002_en.pdf.
World Investment Report 2001: Promoting Linkages. 356 p. Sales No. E.01.II.D.12 $49. http://www.unctad.org/wir/contents/wir01content.en.htm.
World Investment Report 2000: Cross-border Mergers and Acquisitions and Development. 368 p. Sales No. E.99.II.D.20. $49. http://www.unctad.org/wir/ contents/wir00content.en.htm.
Ten Years of World Investment Reports: The Challenges Ahead. Proceedings of an UNCTAD special event on future challenges in the area of FDI. UNCTAD/ITE/Misc.45. http://www.unctad.org/wir.
International Investment Policies for Development(For more information visit http://www.unctad.org/iia)
Investor-State Disputes: Prevention and Alternatives to Arbitration, 129 p. Sales No. E.10.II.D.11. $20.
The Role of International Investment Agreements in Attracting Foreign Direct Investment to Developing Countries. 161 p. Sales No. E.09.II.D.20. $22.
The Protection of National Security in IIAs. 170 p. Sales No. E.09.II.D.12. $15.
Identifying Core Elements in Investment Agreements in the APEC Regions. 134 p. Sales No. E.08.II.D.27. $15.
International Investment Rule-Making: Stocktaking, Challenges and the Way Forward. 124 p. Sales No. E.08.II.D.1. $15.
Investment Promotion Provisions in International Investment Agreements. 103 p. Sales No. E.08.II.D.5. $15.
Investor-State Dispute Settlement and Impact on Investment Rulemaking. 110 p. Sales No. E.07.II.D.10. $30.
Foreign Direct Investment in LDCs: Lessons Learned from the Decade 2001–2010 and the Way Forward230
Bilateral Investment Treaties 1995—2006: Trends in Investment Rulemaking. 172 p. Sales No. E.06.II.D.16. $30.
Investment Provisions in Economic Integration Agreements. 174 p. UNCTAD/ITE/IIT/2005/10.
Preserving Flexibility in IIAs: The Use of Reservations. 104 p. Sales No. E.06.II.D.14. $15.
International Investment Arrangements: Trends and Emerging Issues. 110 p. Sales No. E.06.II.D.03. $15.
Investor-State Disputes Arising from Investment Treaties: A Review. 106 p. Sales No. E.06.II.D.1 $15
South-South Cooperation in Investment Arrangements. 108 p. Sales No. E.05.II.D.26 $15.
International Investment Agreements in Services. 119 p. Sales No. E.05.II.D.15. $15.
The REIO Exception in MFN Treatment Clauses. 92 p. Sales No. E.05.II.D.1. $15.
Issues in International Investment Agreements(For more information visit http://www.unctad.org/iia)
Most-Favoured-Nation Treatment: A Sequel. 141 p. Sales No. E.10.II.D.19. $25
International Investment Agreements: Key Issues, Volumes I, II and III. Sales no.: E.05.II.D.6. $65.
State Contracts. 84 p. Sales No. E.05.II.D.5. $15.
Competition. 112 p. Sales No. E.04.II.D.44. $ 15.
Key Terms and Concepts in IIAs: a Glossary. 232 p. Sales No. E.04.II.D.31. $15.
Incentives. 108 p. Sales No. E.04.II.D.6. $15.
Transparency. 118 p. Sales No. E.04.II.D.7. $15.
Dispute Settlement: State-State. 101 p. Sales No. E.03.II.D.6. $15.
Dispute Settlement: Investor-State. 125 p. Sales No. E.03.II.D.5. $15.
Transfer of Technology. 138 p. Sales No. E.01.II.D.33. $18.
Illicit Payments. 108 p. Sales No. E.01.II.D.20. $13.
Home Country Measures. 96 p. Sales No.E.01.II.D.19. $12.
Host Country Operational Measures. 109 p. Sales No E.01.II.D.18. $15.
Social Responsibility. 91 p. Sales No. E.01.II.D.4. $15.
Environment. 105 p. Sales No. E.01.II.D.3. $15.
Transfer of Funds. 68 p. Sales No. E.00.II.D.27. $12.
Flexibility for Development. 185 p. Sales No. E.00.II.D.6. $15.
Employment. 69 p. Sales No. E.00.II.D.15. $12.
Taxation. 111 p. Sales No. E.00.II.D.5. $12.
Taking of Property. 83 p. Sales No. E.00.II.D.4. $12.
National Treatment.. 94 p. Sales No. E.99.II.D.16. $12.
Admission and Establishment.. 69 p. Sales No. E.99.II.D.10. $12.

QUESTIONNAIRE233
In order to improve the quality and relevance of the work of the UNCTAD Division on Investment, Technology and Enterprise Development, it would be useful to receive the views of readers on this and other similar publications. It would therefore be greatly appreciated if you could complete the following questionnaire and return it to:
Readership SurveyUNCTAD, Division on Investment and EnterprisePalais des NationsRoom E-10052CH-1211 Geneva 10SwitzerlandOr by Fax to: (+41 22) 917.04.98
1. Name and professional address of respondent (optional):
2. Which of the following best describes your area of work?
Government Public enterprise Private enterprise institution Academic or research International organization Media Other (specify) Not-for-profit organization
3. In which country do you work?
4. What is your assessment of the contents of this publication?
Excellent Adequate Good Poor
5. How useful is this publication to your work?
Very useful Of some use Irrelevant
6. Please indicate the three things you liked best about this publication and how are they useful for your work:
7. Please indicate the three things you liked least about this publication:
QUESTIONNAIRE
FOREIGN DIRECT INVESTMENT IN LDCs: LESSONS LEARNED FROM THE DECADE 2001–2010 AND THE WAY FORWARD
UNCTAD/DIAE/IA/2011/1
This questionnaire is also available to be filled out on line at: www.unctad.org/wir.

Selected UNCTAD Publications on Transnational Corporations and Foreign Direct Investment231
Trends in International Investment Agreements: An Overview. 133 p. Sales No. E.99.II.D.23. $12.
Lessons from the MAI. 52 p. Sales No. E.99.II.D.26. $10.
Fair and Equitable Treatment.. 85 p. Sales No. E.99.II.D.15. $12.
Transfer Pricing.. 71 p. Sales No. E.99.II.D.8. $12.
Scope and Definition. 93 p. Sales No. E.99.II.D.9. $12.
Most-Favoured Nation Treatment.. 57 p. Sales No. E.99.II.D.11. $12.
Investment-Related Trade Measures. 57 p. Sales No. E.99.II.D.12. $12.
Foreign Direct Investment and Development.. 74 p. Sales No. E.98.II.D.15. $12.
Investment Policy Monitors
Investment Policy Monitor. A Periodic Report by the UNCTAD Secretariat. No. 3, 7 October 2010. http://www.unctad.org/en/docs/webdiaeia20105_en.pdfInvestment Policy Monitor. A Periodic Report by the UNCTAD Secretariat. No. 2, 20 April 2010. http://www.unctad.org/en/docs/webdiaeia20102_en.pdf
Investment Policy Monitor. A Periodic Report by the UNCTAD Secretariat. No. 1, 4 December 2009. http://www.unctad.org/en/docs/webdiaeia200911_en.pdf
IIA Monitors and Issues Notes
IIA Issues Note No. 1 (2010): Latest Developments in Investor–State Dispute Settlement.http://www.unctad.org/en/docs/webdiaeia20103_en.pdf
IIA Monitor No. 3 (2009): Recent developments in international investment agreements (2008–June 2009). http://www.unctad.org/en/docs/webdiaeia20098_en.pdf
IIA Monitor No. 2 (2009): Selected Recent Developments in IIA Arbitration and Human Rights.http://www.unctad.org/en/docs/webdiaeia20097_en.pdf
IIA Monitor No. 1 (2009): Latest Developments in Investor-State Dispute Settlement. http://www.unctad.org/en/docs/webdiaeia20096_en.pdf
IIA Monitor No. 2 (2008): Recent developments in international investment agreements (2007–June 2008). http://www.unctad.org/en/docs/webdiaeia20081_en.pdf
IIA Monitor No. 1 (2008): Latest Developments in Investor– State Dispute Settlement. http://www.unctad.org/en/docs/iteiia20083_en.pdf
IIA Monitor No. 3 (2007): Recent developments in international investment agreements (2006 – June 2007). http://www.unctad.org/en/docs/webiteiia20076_en.pdf
IIA Monitor No. 2 (2007): Development implications of international investment agreements. http://www.unctad.org/en/docs/webiteiia20072_en.pdf
IIA Monitor No. 1 (2007): Intellectual Property Provisions in International Investment Arrangements. http://www.unctad.org/en/docs/webiteiia20071_en.pdf
IIA Monitor No. 4 (2006): Latest Developments in Investor-State Dispute Settlement. http://www.unctad.org/sections/dite_pcbb/docs/webiteiia200611_en.pdf
IIA Monitor No. 3 (2006): The Entry into Force of Bilateral Investment Treaties (BITs).http://www.unctad.org/en/docs/webiteiia20069_en.pdf
IIA Monitor No. 2 (2006): Developments in international investment agreements in 2005.
Foreign Direct Investment in LDCs: Lessons Learned from the Decade 2001–2010 and the Way Forward232
http://www.unctad.org/en/docs/webiteiia20067_en.pdf
IIA Monitor No. 1 (2006): Systemic Issues in International Investment Agreements (IIAs).http://www.unctad.org/en/docs/webiteiia20062_en.pdf
IIA Monitor No. 4 (2005): Latest Developments in Investor-State Dispute Settlement.http://www.unctad.org/en/docs/webiteiit20052_en.pdf
IIA Monitor No. 2 (2005): Recent Developments in International Investment Agreements.http://www.unctad.org/en/docs/webiteiit20051_en.pdf
IIA Monitor No. 1 (2005): South-South Investment Agreements Proliferating.http://www.unctad.org/en/docs/webiteiit20061_en.pdf
United Nations publications may be obtained from bookstores and distributors throughout the world. Please consult your bookstore or write:
For Africa, Asia and Europe to:
Sales SectionUnited Nations Office at Geneva
Palais des NationsCH-1211 Geneva 10
SwitzerlandTel: (41-22) 917-1234Fax: (41-22) 917-0123
E-mail: [email protected]
For Asia and the Pacific, the Caribbean, Latin America and North America to:
Sales SectionRoom DC2-0853
United Nations SecretariatNew York, NY 10017
United StatesTel: (1-212) 963-8302 or (800) 253-9646
Fax: (1-212) 963-3489E-mail: [email protected]
All prices are quoted in United States dollars.
For further information on the work of the Division on Investment and Enterprise, UNCTAD, please address inquiries to:
United Nations Conference on Trade and DevelopmentDivision on Investment and Enterprise
Palais des Nations, Room E-10054CH-1211 Geneva 10, Switzerland
Telephone: (41-22) 917-5651Telefax: (41-22) 917-0498
http://www.unctad.org

QUESTIONNAIRE233
In order to improve the quality and relevance of the work of the UNCTAD Division on Investment, Technology and Enterprise Development, it would be useful to receive the views of readers on this and other similar publications. It would therefore be greatly appreciated if you could complete the following questionnaire and return it to:
Readership SurveyUNCTAD, Division on Investment and EnterprisePalais des NationsRoom E-10052CH-1211 Geneva 10SwitzerlandOr by Fax to: (+41 22) 917.04.98
1. Name and professional address of respondent (optional):
2. Which of the following best describes your area of work?
Government Public enterprise Private enterprise institution Academic or research International organization Media Other (specify) Not-for-profit organization
3. In which country do you work?
4. What is your assessment of the contents of this publication?
Excellent Adequate Good Poor
5. How useful is this publication to your work?
Very useful Of some use Irrelevant
6. Please indicate the three things you liked best about this publication and how are they useful for your work:
7. Please indicate the three things you liked least about this publication:
QUESTIONNAIRE
FOREIGN DIRECT INVESTMENT IN LDCs: LESSONS LEARNED FROM THE DECADE 2001–2010 AND THE WAY FORWARD
UNCTAD/DIAE/IA/2011/1
This questionnaire is also available to be filled out on line at: www.unctad.org/wir.

Foreign Direct Investment in LDCs: Lessons Learned from the Decade 2001–2010 and the Way Forward234
8. On the average, how useful are these publications to you in your work?
Very useful Of some use Irrelevant
9. Are you a regular recipient of Transnational Corporations, UNCTAD’s tri-annual refereed journal?
Yes No
If not, please check here if you would like to receive a sample copy sent to the name and address you have given above. Other title you would like to receive instead (see list of publications):
10. How and where did you obtain this publication:
I bought it In a seminar/workshop I requested a courtesy copy Direct mailing Other
11. Would you like to receive information on UNCTAD’s work in the area of Investment Technology and Enterprise Development through e-mail? If yes, please provide us with your e-mail address:


