MOZAMBIQUE AGRICULTURAL VALUE CHAIN ANALYSIS …€¦ · Mozambique Agricultural Value Chain...
81
MOZAMBIQUE AGRICULTURAL VALUE CHAIN ANALYSIS LEO REPORT # 31 June 2016 This paper was produced for United States Agency for International Development review. It was prepared by ACDI/VOCA with funding from USAID/E3’s Leveraging Economic Opportunities (LEO) project.
Transcript of MOZAMBIQUE AGRICULTURAL VALUE CHAIN ANALYSIS …€¦ · Mozambique Agricultural Value Chain...
MOZAMBIQUE AGRICULTURAL
VALUE CHAIN ANALYSIS
LEO REPORT # 31
June 2016
This paper was produced for United States Agency for International Development review. It was prepared by
ACDI/VOCA with funding from USAID/E3’s Leveraging Economic Opportunities (LEO) project.
MOZAMBIQUE AGRICULTURAL
VALUE CHAIN ANALYSIS
LEO REPORT # 31
DISCLAIMER
The authors’ views expressed in this publication do not necessarily reflect the views of the United States Agency for In-
ternational Development or the United States Government.
Mozambique Agricultural Value Chain Analysis ii
TABLE OF CONTENTS
TABLE OF CONTENTS ............................................................................. II
ABBREVIATIONS AND ACRONYMS .................................................... VI
EXECUTIVE SUMMARY ............................................................................ 1
INTRODUCTION ....................................................................................... 4
METHODOLOGY ....................................................................................... 5
BACKGROUND .......................................................................................... 8
FARM SIZE AND STRUCTURE ...................................................................................... 8
FARM-LEVEL CONSTRAINTS ....................................................................................... 8
POST-FARM GATE CONSTRAINTS ........................................................................... 10
GENDER ........................................................................................................................... 12
NUTRITION .................................................................................................................... 12
VALUE CHAIN INTERVENTION CONSIDERATIONS ....................... 13
SOYBEAN .................................................................................................. 16
Relevance to USAID Objectives .................................................................................... 16
Value chain structure and functions .............................................................................. 16
End Markets...................................................................................................................... 17
End Market Priorities and Constraints ......................................................................... 19
Upgrading Strategies ....................................................................................................... 19
SESAME ...................................................................................................... 21
Mozambique Agricultural Value Chain Analysis iii
Relevance to USAID objectives ..................................................................................... 21
Value chain Structure and Functions ............................................................................ 21
End Markets...................................................................................................................... 22
End Market Priorities and Constraints ......................................................................... 23
Upgrading Strategies ....................................................................................................... 23
GROUNDNUT .......................................................................................... 25
Relevance to USAID Objectives .................................................................................... 25
Value Chain Structure and Functions ........................................................................... 26
End markets ..................................................................................................................... 26
End Market Priorities and Constraints ......................................................................... 28
Upgrading Strategies ....................................................................................................... 28
COMMON BEAN ...................................................................................... 30
Relevance to USAID Objectives .................................................................................... 30
Value Chain Structure and Functions ........................................................................... 30
End markets ..................................................................................................................... 31
End Market Priorities and Constraints ......................................................................... 32
Upgrading Strategies ....................................................................................................... 32
PIGEON PEA ............................................................................................. 34
Relevance to USAID Objectives .................................................................................... 34
Value Chain Structure and Functions ........................................................................... 34
End markets ..................................................................................................................... 34
End Market Priorities and Constraints ......................................................................... 36
Mozambique Agricultural Value Chain Analysis iv
Upgrading Strategies ....................................................................................................... 36
COWPEA ................................................................................................... 38
Relevance to USAID Objectives .................................................................................... 38
Value Chain Structure and Functions ........................................................................... 38
End Markets...................................................................................................................... 38
End Market Priorities and Constraints ......................................................................... 39
Upgrading Strategies ....................................................................................................... 39
CASHEW ................................................................................................... 40
Relevance to USAID Objectives .................................................................................... 40
Value Chain Structure and Functions ........................................................................... 40
End Market Priorities and Constraints ......................................................................... 42
Upgrading Strategies ....................................................................................................... 44
BANANA.................................................................................................... 46
Relevance to USAID Objectives .................................................................................... 46
Value Chain Structure and Functions ........................................................................... 46
EndMarket Priorities and Constraints........................................................................... 48
Upgrading Strategies ....................................................................................................... 48
VEGETABLES ............................................................................................ 50
Relevance to USAID Objectives .................................................................................... 50
Value chain Structure and Functions ............................................................................ 50
End Markets -Traditional Vegetables ............................................................................ 51
End Markets - High Value Vegetables ........................................................................... 52
Mozambique Agricultural Value Chain Analysis v
End Market Priorities and Constraints ......................................................................... 53
Upgrading Strategies ....................................................................................................... 54
CITATIONS ............................................................................................... 56
APPENDIX 1: VALUE CHAIN COMMODITY PRODUCTION
STATISTICS ................................................................................................ 1
Table 1: Common bean production in Mozambique ..................................................... 1
Table 2: Pigeon pea production in Mozambique ............................................................ 3
Table 3: Cowpea production in Mozambique ................................................................ 4
Table 4: Soy production in Mozambique (2014/15) ....................................................... 5
Table 5: Sesame production in Mozambique ................................................................. 6
Table 6: Groundnut production in Mozambique ........................................................... 7
Table 7: Cashew production in Mozambique ............................................................... 10
Table 8: Vegetable production in Mozambique ...................................................................... 11
APPENDIX II MEETING LIST ................................................................. 13

Mozambique Agricultural Value Chain Analysis vi
ABBREVIATIONS AND ACRONYMS ACB American Cotton Bollworm
ACI African Cashew Initiative
AIMS Agricultural Input Markets Strengthening, USAID Project
ASC Agribusiness Service Center
CEPAGRI Centro de Promoção da Agricultura
CFF Namialo Fruit Training Centre
DFAP Development Food Assistance Program
ETG Export Trading Group
EuroGAP European Good Agricultural Practice
FAO Food and Agriculture Organization
FO Farmer Organization
FOSC Farmer Owned Service Center
FTF Feed the Future
HACCP Hazard Analysis Critical Control Point
IIAM National Agricultural Research Institute
IITA International Institute of Tropical Agriculture
ITC International Trade Centre
MASA Ministério da Agricultura e Segurança Alimentar
MT Metric Ton
MZN Mozambican Metical
NGO Nongovernmental Organization
OPV Open-Pollinated Variety
PAPA Food Production Support Program
RCN Raw Cashew Nut
SDAE District Services for Economic Activities
SPEED Support Program for Economic and Enterprise Development
SPS Sanitary and Phytosanitary Measures
Mozambique Agricultural Value Chain Analysis vii
TIA Trabalho de Inquerito Agricola (Work of Agricultural Survey)
UAE United Arab Emirates
U.S. United States
USD United States Dollar
USDA United States Department of Agriculture
USG United States Government
VAT Value-Added Tax
VCA Value Chain Analysis
ZOI Zone of Influence
Mozambique Agricultural Value Chain Analysis 1
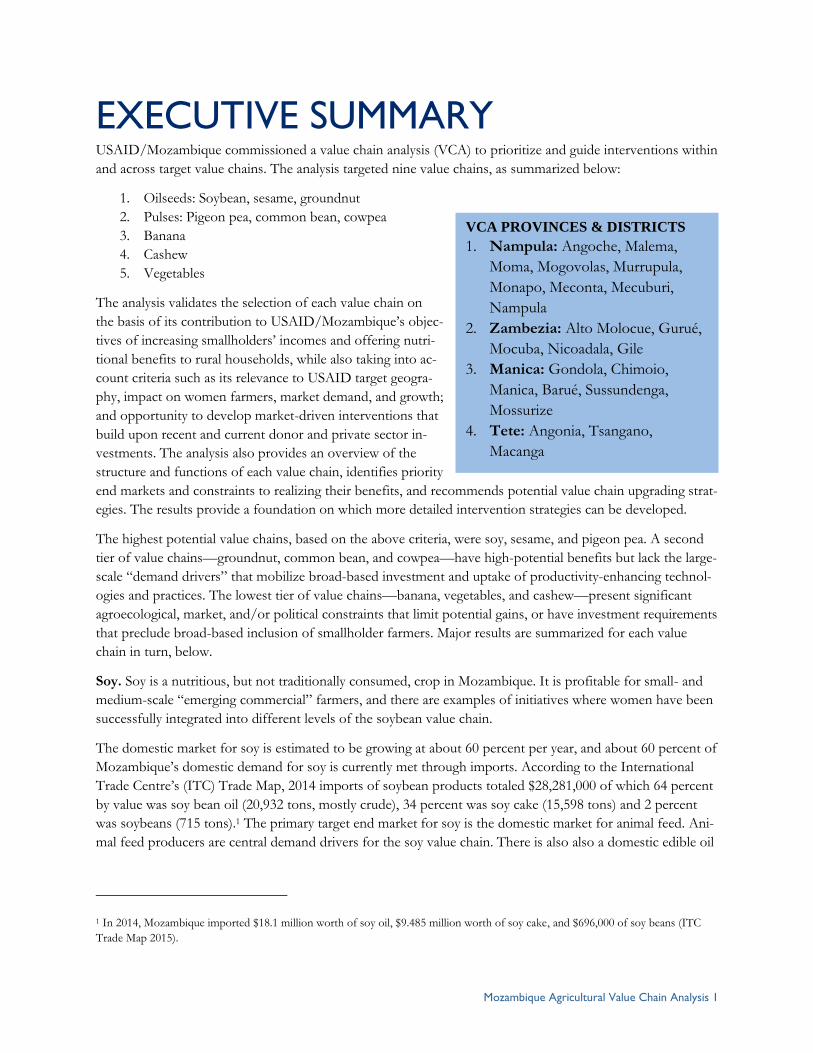
EXECUTIVE SUMMARY USAID/Mozambique commissioned a value chain analysis (VCA) to prioritize and guide interventions within
and across target value chains. The analysis targeted nine value chains, as summarized below:
1. Oilseeds: Soybean, sesame, groundnut
2. Pulses: Pigeon pea, common bean, cowpea
3. Banana
4. Cashew
5. Vegetables
The analysis validates the selection of each value chain on
the basis of its contribution to USAID/Mozambique’s objec-
tives of increasing smallholders’ incomes and offering nutri-
tional benefits to rural households, while also taking into ac-
count criteria such as its relevance to USAID target geogra-
phy, impact on women farmers, market demand, and growth;
and opportunity to develop market-driven interventions that
build upon recent and current donor and private sector in-
vestments. The analysis also provides an overview of the
structure and functions of each value chain, identifies priority
end markets and constraints to realizing their benefits, and recommends potential value chain upgrading strat-
egies. The results provide a foundation on which more detailed intervention strategies can be developed.
The highest potential value chains, based on the above criteria, were soy, sesame, and pigeon pea. A second
tier of value chains—groundnut, common bean, and cowpea—have high-potential benefits but lack the large-
scale “demand drivers” that mobilize broad-based investment and uptake of productivity-enhancing technol-
ogies and practices. The lowest tier of value chains—banana, vegetables, and cashew—present significant
agroecological, market, and/or political constraints that limit potential gains, or have investment requirements
that preclude broad-based inclusion of smallholder farmers. Major results are summarized for each value
chain in turn, below.
Soy. Soy is a nutritious, but not traditionally consumed, crop in Mozambique. It is profitable for small- and
medium-scale “emerging commercial” farmers, and there are examples of initiatives where women have been
successfully integrated into different levels of the soybean value chain.
The domestic market for soy is estimated to be growing at about 60 percent per year, and about 60 percent of
Mozambique’s domestic demand for soy is currently met through imports. According to the International
Trade Centre’s (ITC) Trade Map, 2014 imports of soybean products totaled $28,281,000 of which 64 percent
by value was soy bean oil (20,932 tons, mostly crude), 34 percent was soy cake (15,598 tons) and 2 percent
was soybeans (715 tons).1 The primary target end market for soy is the domestic market for animal feed. Ani-
mal feed producers are central demand drivers for the soy value chain. There is also also a domestic edible oil
1 In 2014, Mozambique imported $18.1 million worth of soy oil, $9.485 million worth of soy cake, and $696,000 of soy beans (ITC
Trade Map 2015).
VCA PROVINCES & DISTRICTS
1. Nampula: Angoche, Malema,
Moma, Mogovolas, Murrupula,
Monapo, Meconta, Mecuburi,
Nampula
2. Zambezia: Alto Molocue, Gurué,
Mocuba, Nicoadala, Gile
3. Manica: Gondola, Chimoio,
Manica, Barué, Sussundenga,
Mossurize
4. Tete: Angonia, Tsangano,
Macanga
Mozambique Agricultural Value Chain Analysis 2
processing industry that utilizes the oil produced as a byproduct to feed production. More market research is
needed, but there is a reported strong domestic market demand for edible soy oil.
Constraints include the relatively limited area of the country that is agroecologically suited for soy production,
limited availability of quality seed, limited use of inputs such as inoculants, and weak farm management prac-
tices, which limit yields. Strategies to develop the value chain should focus on linking farmers (via their pro-
ducer organizations) to large commercial buyers, and evaluating and promoting (based on the results) small-
and medium-scale production models that will allow a large base of suppliers to operate profitably and sus-
tainably in the market.
Groundnuts. Groundnut production in Mozambique is dominated by smallholders, with women being very
active in the value chain, including production. Groundnuts have high financial margins and are also highly
nutritious, though high aflatoxin levels undermine their nutritional value. Despite the existence of unmet de-
mand in export markets, high levels of aflatoxins mean that most of Mozambique’s groundnut crop is con-
sumed domestically. In addition to aflatoxins, poor domestic quality and weak sanitary and phytosanitary
measures (SPS) certification capacity within Mozambique limit exports, as does inadequate domestic supply
due to low yields and high post-harvest losses. Addressing the aflatoxin problem is key to increasing the com-
petiveness of the groundnut value chain. Additional upgrades include intensifying production and reducing
post-harvest losses, promoting alternative shelling options, and facilitating aggregation models.
Pigeon pea. Development of the pigeon pea value chain offers strong potential for improving smallholders’
incomes and nutrition, particularly among women smallholders. The primary end market opportunity for pi-
geon peas is seasonal (October–December) sales to India, as there are high seasonal price premiums during
this market window. Indian demand for pigeon pea imports is expected to increase six fold by 2025. A two-
pronged value chain development strategy is recommended, focused on increasing production of pigeon pea
and farmers’ access to markets. It will also be important to ensure a supportive policy environment that pro-
motes pigeon pea exports through the removal of tax and administrative barriers.
Common bean. Common beans are a profitable smallholder crop and a good source of protein and nutri-
ents, and women are heavily involved in the value chain as producers, intermediaries, retailers, and end buy-
ers. There is unmet demand for common beans to be sold domestically and to regional and overseas export
markets. Constraints include the fragmented and informal nature of the value chain, which limits incentives
for farmers to invest in yield-enhancing technologies and management practices. The intervention focus
should be on a dual-pronged strategy aimed at increasing farm-level production while enhancing farmers’ ac-
cess to markets.
Cowpea. Cowpeas are centrally important to smallholder nutrition and food security, and more than half of
households planting cowpea are headed by women. The crop is largely used for household consumption, with
fewer than one farmer in 10 selling any of their cowpea production.
Overall, cowpea is not perceived as having dynamic market demand, and the private sector is generally luke-
warm about investment in the sector given low demand and a weak and fragmented production base. While
there are examples of donor-supported interventions (such as AgriFUTURO) that have engaged in the cow-
pea market, the multitude of constraints combined with the lack of dynamic market demand and catalytic de-
mand drivers argue for the exclusion or de-emphasis of cowpea as a priority value chain for any future mar-
ket-driven initiatives.
Mozambique Agricultural Value Chain Analysis 3
Cashew. Cashew is a smallholder crop that plays a critical role in poor households’ livelihood strategies in
Nampula and Zambezia where its production is concentrated. There are opportunities to increase farmer in-
comes from cashew production by addressing key constraints along the value chain; nonetheless, there are
significant financial and political challenges to realization of these potential gains.
There is unmet demand for both unshelled and shelled cashew in overseas export markets; however, sales are
limited by an unfavorable policy environment, inadequate production to meet demand, and difficulty meeting
international market standards for shelled cashews. Other constraints include a lack of finance, particularly at
the farm level; high costs along the value chain; and poor processing efficiency and quality.
A strategy to strengthen the cashew value chain should focus on improving the policy environment as well as
increasing farm production of cashew by increasing smallholder access and utilization of inputs and services,
and promoting medium-scale, block-style plantations. Complementary activities can be used to improve the
availability of finance and upgrade industrial processors’ ability to comply with importing market require-
ments.
Banana. Banana is a nutritious crop frequently produced by smallholders throughout Mozambique for home
consumption or sales at local markets. Commercial activity in banana markets offers limited income potential
for smallholder farmers. Domestic markets are easily glutted and have high price variability given the high
perishability of bananas. Smallholder banana farmers are concentrated in Zambezia and Nampula where there
is little irrigation and soils tend to be infertile. Banana plants extract high volumes of nutrients from the soil,
making fertilization critical. Export markets—both regional and overseas—have quality standards that small-
holders would have difficulty meeting without extensive and costly technology transfer.
Vegetables. Vegetables are a nutritious product that offers significant income potential to smallholder farm-
ers; however, barriers to entry to profitable market channels are high. Vegetables are produced by a signifi-
cant share of Mozambican farmers, though they typically sell relatively small shares of what they produce. Fe-
male producers are under-represented in vegetable markets.
The most promising end-market opportunities are for fresh vegetables to substitute for imports in domestic
markets and off-season production of traditional vegetables. Constraints to supplying these markets include
limited availability of finance and farmers’ constrained liquidity given the capital-intensive nature of invest-
ment to enter these markets; the need for irrigation; limited availability of quality seed; limited technical and
management capacity among farmers; and lack of post-harvest facilities.
Interventions to develop the vegetable value chain should be directed to higher-capacity farmers who are lo-
cated in proximity to their target markets, have access to water, and have the capacity to bear the significant
financial risk and investment requirements entailed in producing for these markets. Interventions should be
made in coordination with large-scale buyers of vegetables for the target markets and should be based on
careful analysis of local market conditions and requirements. It is be critical that production increases are
tightly coordinated to respond to demand in order to avoid local gluts that depress prices and exacerbate
price fluctuations. Working through producer organizations can help to facilitate effective technology transfer
as well as coordinating supply to avoid market gluts.
Mozambique Agricultural Value Chain Analysis 4
INTRODUCTION To guide USAID/Mozambique’s agricultural and economic development programming, a VCA was commis-
sioned to prioritize interventions and identify intervention points that provide leverage for competitive up-
grades. Data collection took place October 4–November 7, 2015, with supplemental field research conducted
during the first two quarters of 2016.
The analysis targeted nine value chains, as summarized below:
1. Oilseeds: Soybean, sesame, groundnut
2. Pulses: Common bean, cowpea, pigeon pea
3. Banana
4. Cashew
5. Vegetables
Following a discussion of the research methodology employed, the report addresses cross-cutting considera-
tions that are common across each of the value chains. These include the structure of Mozambique’s farming
sector, broad-based constraints affecting development of the agricultural sector in general, and characteriza-
tion of major supply- and demand-oriented approaches to promoting smallholder-inclusive value chains.
The individual value chain analysis chapters are organized in five parts. First, the report validates the selection
of each value chain on the basis of its contribution to critical Feed the Future (USAID) objectives. These ob-
jectives include a value chain’s potential to increase smallholders’ incomes; potential to bring nutritional bene-
fits to rural households; relevance to the target geography; impact on women farmers; strong market demand
and potential for growth; and potential to develop market-driven interventions that build upon recent and
current investments by U.S. government (USG) agencies, other donors, and the private sector
Second, the value chain structure and function section provides an overview of how each value chain is pre-
sented, addressing the overarching characteristics of farm production, structure and organization of the value
chain, and current end markets. Of critical importance to this aspect of the analysis is the degree to which
smallholders in general, and women in particular, participate in production and marketing of the product; the
predominant channels by which the product flows to market and the presence of alternative market channels
that may offer improved prospects for smallholders; and the presence of major demand drivers (in particular,
large-scale industrial buyers) whose activity in the market can help to motivate investment at scale by other
market participants.
Third, the analysis identifies promising end markets for each value chain and identifies their specific require-
ments, for example varieties sought, seasonal market windows, grades, and other product attributes.
Fourth, this analysis identifies fundamental constraints to smallholder and value chain performance in prom-
ising end markets.
Fifth, overarching upgrading strategies for each value chain are presented, and current and recent initiatives
that can be leveraged in carrying out these strategies are presented. Additionally, there are productivity-related
statistics for each value chain located in the appendices section.
Mozambique Agricultural Value Chain Analysis 5
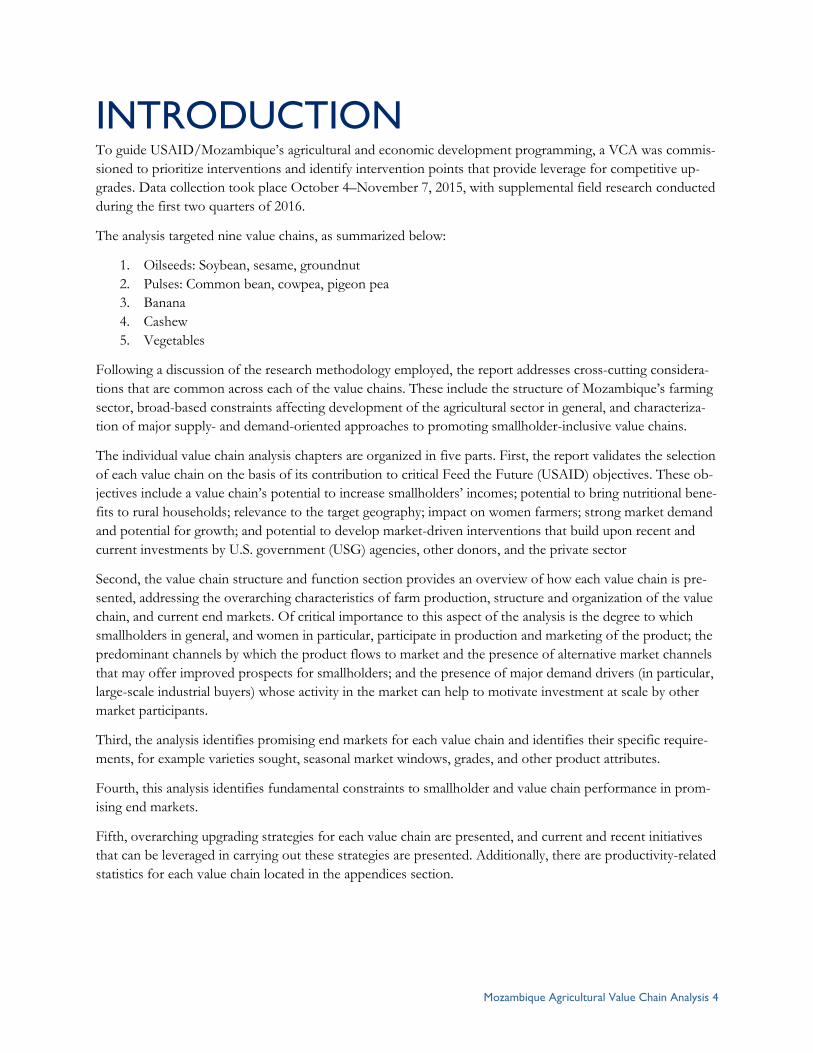
METHODOLOGY This value chain analysis considered the
individual stages from production to end
market of the target commodities in the
Nampula, Zambezia, Manica, and Tete
provinces and their respective districts. The
team traced production from the target
districts to in-country end markets (including
exporters), and consumption from in-country
sources (production and imports) to the
target districts. Additionally, the team
assessed cross-cutting services, both sector-
specific (inputs, extension) and cross-sector
specific (finance); cross-cutting issues (gender
and climate); and the enabling environment
(policies and norms).
Figure 1 depicts the USAID value chain
analysis framework that the research team
followed. The analysis combined secondary
and primary (individual interviews and focus
groups) research and used both qualitative
and quantitative data. For a full list of
organizations interviewed, see the meeting list
in Appendix II.
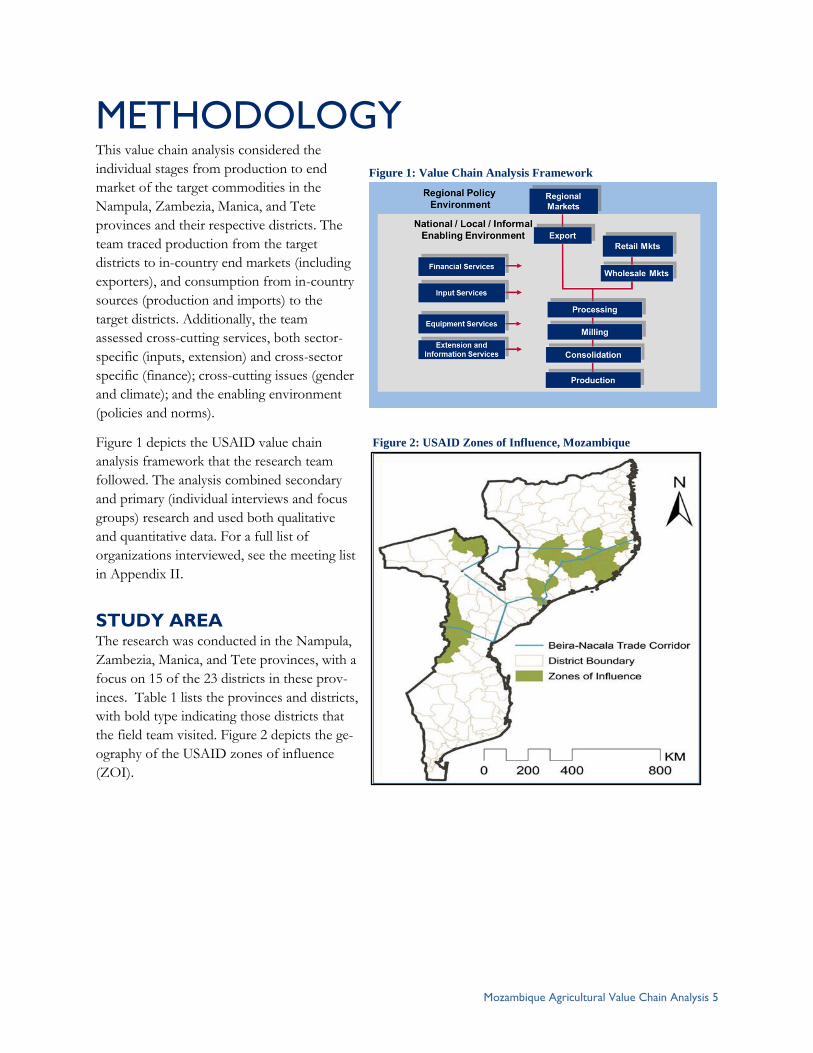
STUDY AREA The research was conducted in the Nampula,
Zambezia, Manica, and Tete provinces, with a
focus on 15 of the 23 districts in these prov-
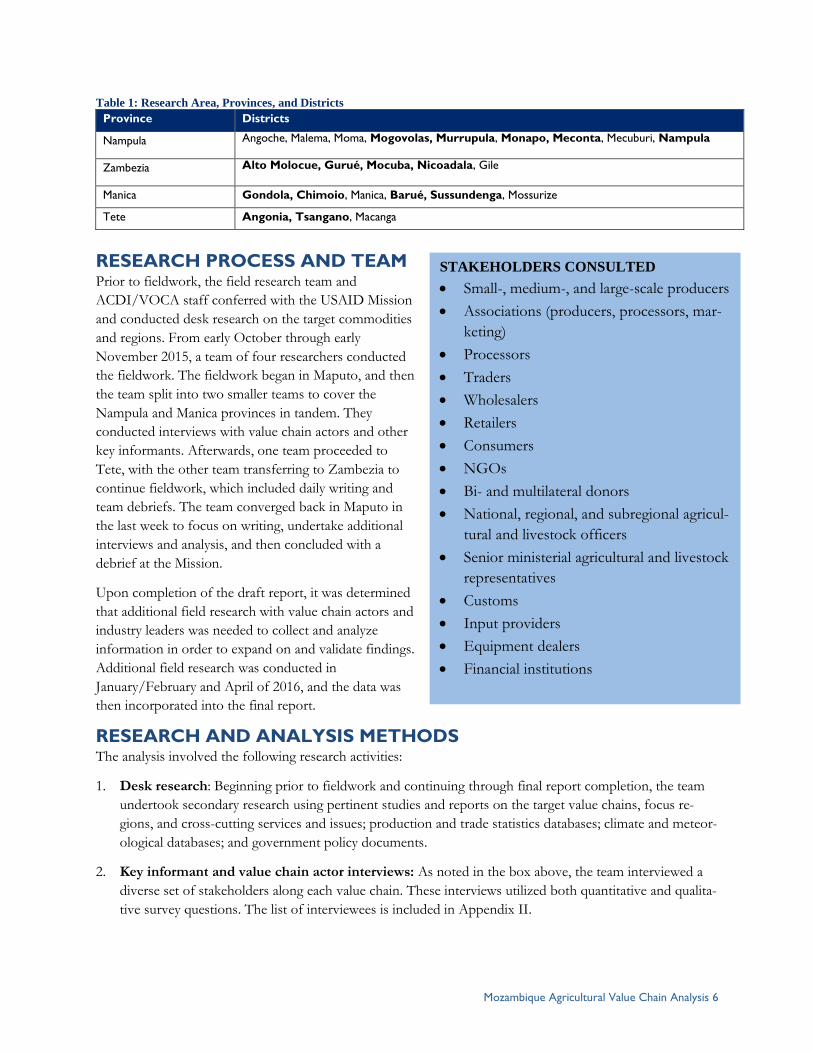
inces. Table 1 lists the provinces and districts,
with bold type indicating those districts that
the field team visited. Figure 2 depicts the ge-
ography of the USAID zones of influence
(ZOI).
Figure 1: Value Chain Analysis Framework
Figure 2: USAID Zones of Influence, Mozambique
Mozambique Agricultural Value Chain Analysis 6
Table 1: Research Area, Provinces, and Districts
Province Districts
Nampula Angoche, Malema, Moma, Mogovolas, Murrupula, Monapo, Meconta, Mecuburi, Nampula
Zambezia Alto Molocue, Gurué, Mocuba, Nicoadala, Gile
Manica Gondola, Chimoio, Manica, Barué, Sussundenga, Mossurize
Tete Angonia, Tsangano, Macanga
RESEARCH PROCESS AND TEAM Prior to fieldwork, the field research team and
ACDI/VOCA staff conferred with the USAID Mission
and conducted desk research on the target commodities
and regions. From early October through early
November 2015, a team of four researchers conducted
the fieldwork. The fieldwork began in Maputo, and then
the team split into two smaller teams to cover the
Nampula and Manica provinces in tandem. They
conducted interviews with value chain actors and other
key informants. Afterwards, one team proceeded to
Tete, with the other team transferring to Zambezia to
continue fieldwork, which included daily writing and
team debriefs. The team converged back in Maputo in
the last week to focus on writing, undertake additional
interviews and analysis, and then concluded with a
debrief at the Mission.
Upon completion of the draft report, it was determined
that additional field research with value chain actors and
industry leaders was needed to collect and analyze
information in order to expand on and validate findings.
Additional field research was conducted in
January/February and April of 2016, and the data was
then incorporated into the final report.
RESEARCH AND ANALYSIS METHODS The analysis involved the following research activities:
1. Desk research: Beginning prior to fieldwork and continuing through final report completion, the team
undertook secondary research using pertinent studies and reports on the target value chains, focus re-
gions, and cross-cutting services and issues; production and trade statistics databases; climate and meteor-
ological databases; and government policy documents.
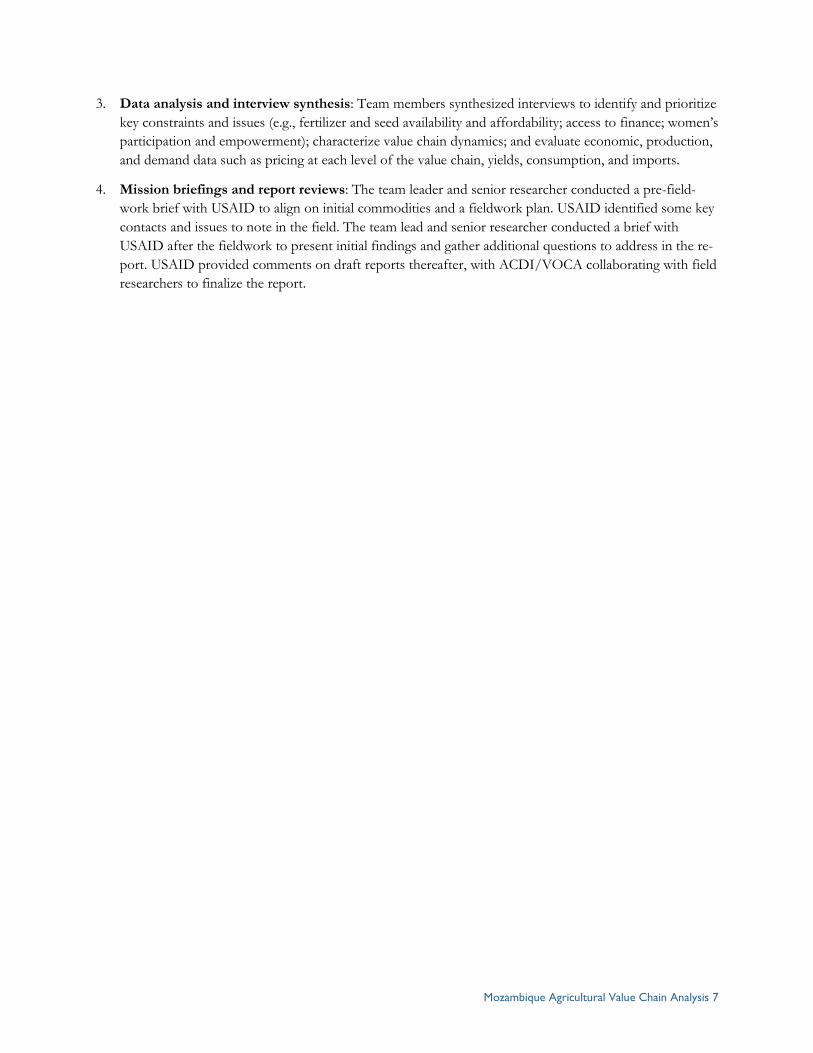
2. Key informant and value chain actor interviews: As noted in the box above, the team interviewed a
diverse set of stakeholders along each value chain. These interviews utilized both quantitative and qualita-
tive survey questions. The list of interviewees is included in Appendix II.
STAKEHOLDERS CONSULTED
Small-, medium-, and large-scale producers
Associations (producers, processors, mar-
keting)
Processors
Traders
Wholesalers
Retailers
Consumers
NGOs
Bi- and multilateral donors
National, regional, and subregional agricul-
tural and livestock officers
Senior ministerial agricultural and livestock
representatives
Customs
Input providers
Equipment dealers
Financial institutions
Mozambique Agricultural Value Chain Analysis 7
3. Data analysis and interview synthesis: Team members synthesized interviews to identify and prioritize
key constraints and issues (e.g., fertilizer and seed availability and affordability; access to finance; women’s
participation and empowerment); characterize value chain dynamics; and evaluate economic, production,
and demand data such as pricing at each level of the value chain, yields, consumption, and imports.
4. Mission briefings and report reviews: The team leader and senior researcher conducted a pre-field-
work brief with USAID to align on initial commodities and a fieldwork plan. USAID identified some key
contacts and issues to note in the field. The team lead and senior researcher conducted a brief with
USAID after the fieldwork to present initial findings and gather additional questions to address in the re-
port. USAID provided comments on draft reports thereafter, with ACDI/VOCA collaborating with field
researchers to finalize the report.
Mozambique Agricultural Value Chain Analysis 8
BACKGROUND In this section, relevant background on Mozambique’s agricultural sector is presented, beginning with an
overview of farm size and structure in Mozambique, and followed by an overview of farm- and market-level
constraints in the development of market-oriented agricultural value chains with a brief summary of gender
and nutrition issues.
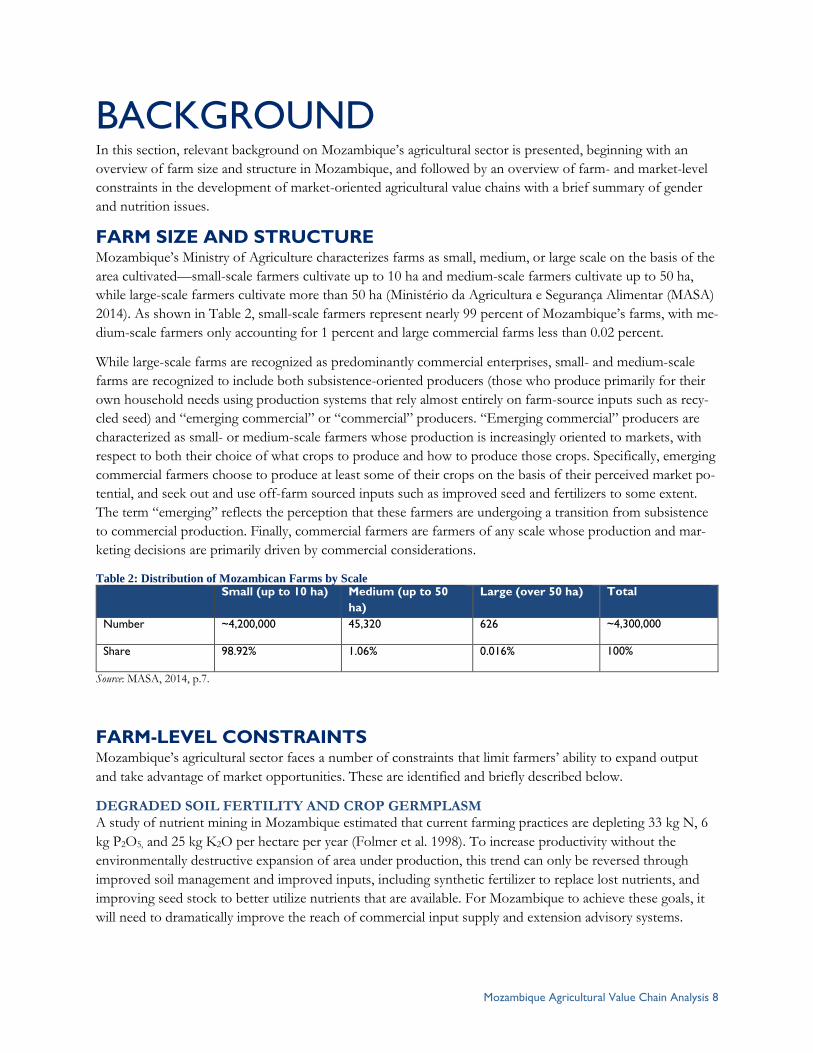
FARM SIZE AND STRUCTURE Mozambique’s Ministry of Agriculture characterizes farms as small, medium, or large scale on the basis of the
area cultivated—small-scale farmers cultivate up to 10 ha and medium-scale farmers cultivate up to 50 ha,
while large-scale farmers cultivate more than 50 ha (Ministério da Agricultura e Segurança Alimentar (MASA)
2014). As shown in Table 2, small-scale farmers represent nearly 99 percent of Mozambique’s farms, with me-
dium-scale farmers only accounting for 1 percent and large commercial farms less than 0.02 percent.
While large-scale farms are recognized as predominantly commercial enterprises, small- and medium-scale
farms are recognized to include both subsistence-oriented producers (those who produce primarily for their
own household needs using production systems that rely almost entirely on farm-source inputs such as recy-
cled seed) and “emerging commercial” or “commercial” producers. “Emerging commercial” producers are
characterized as small- or medium-scale farmers whose production is increasingly oriented to markets, with
respect to both their choice of what crops to produce and how to produce those crops. Specifically, emerging
commercial farmers choose to produce at least some of their crops on the basis of their perceived market po-
tential, and seek out and use off-farm sourced inputs such as improved seed and fertilizers to some extent.
The term “emerging” reflects the perception that these farmers are undergoing a transition from subsistence
to commercial production. Finally, commercial farmers are farmers of any scale whose production and mar-
keting decisions are primarily driven by commercial considerations.
Table 2: Distribution of Mozambican Farms by Scale Small (up to 10 ha) Medium (up to 50
ha)
Large (over 50 ha) Total
Number ~4,200,000 45,320 626 ~4,300,000
Share 98.92% 1.06% 0.016% 100%
Source: MASA, 2014, p.7.
FARM-LEVEL CONSTRAINTS Mozambique’s agricultural sector faces a number of constraints that limit farmers’ ability to expand output
and take advantage of market opportunities. These are identified and briefly described below.
DEGRADED SOIL FERTILITY AND CROP GERMPLASM A study of nutrient mining in Mozambique estimated that current farming practices are depleting 33 kg N, 6
kg P2O5, and 25 kg K2O per hectare per year (Folmer et al. 1998). To increase productivity without the
environmentally destructive expansion of area under production, this trend can only be reversed through
improved soil management and improved inputs, including synthetic fertilizer to replace lost nutrients, and
improving seed stock to better utilize nutrients that are available. For Mozambique to achieve these goals, it
will need to dramatically improve the reach of commercial input supply and extension advisory systems.
Mozambique Agricultural Value Chain Analysis 9
LACK OF APPROPRIATE VARIETIES AND QUALITY SEED Most studies estimate that only one out of 10 food crop producers utilize improved seed, with the remaining
using landrace seed recycled at the farm or village level (International Fertilizer Development Center 2015).
Most farmers using recycled seed are not using effective phenotypic selection or seed storage practices,
leading to continuous decline in germination and yields season after season.
Most foundation seed originates from the National Agricultural Research Institute’s (IIAM) Basic Seed Pro-
duction Unit; volumes from these seeds are typically too low for sufficient multiplication and wide-scale dis-
tribution. Private sector companies are slowly expanding their own foundation seed development programs,
though they complain of a lack of basic seed, capacity constraints, and delays in getting new varieties ap-
proved for commercial sale. New varieties (or foreign varieties seeking entry into the Mozambican market)
require two years of field trials to be submitted to the National Directorate of Agricultural Services (DSNA)
for review and approval. Many seed producers are sourcing basic seed from Zimbabwe (SeedCo and Cymmit)
or South Africa (Pannar), though regulatory hurdles for introduction of new varieties are steep (SDC 2011;
interviews).
There are also problems with the quality of seed that is sold through commercial channels, hurting farmer
demand for commercial seed. This perception is driven by two factors. First, the weak breeding and
multiplication capacity at IIAM and commercial companies leads to quality for even basic seed being often no
better than landrace seed—respondents interviewed stated that it was common for basic seed from IIAM
research facilities to achieve 40–60 percent germination rates at the multiplication stage. Second, most
smallholder farmers’ only experience with improved varieties of any kind has been through the Ministry of
Agriculture’s Food Production Support Program (PAPA), the primary seed subsidy and distribution scheme.
Seed distributed through PAPA has consistently been poor quality and is often distributed without
explanation of variety or with respect to farmers’ unique agroecological requirements or consumer taste
preferences (SDC 2011). As a result, many interviewed respondents stated that demand for improved seed
across value chains is very limited.
LIMITED USE OF FERTILIZER OR OTHER PRODUCTIVITY-ENHANCING INPUTS Less than 4 percent of Mozambican farmers use fertilizer, and this use is virtually nonexistent outside of the
context of commercial outgrower schemes. In 2010, total fertilizer consumption nationwide was 51,400
metric tons (MT), with 90 percent of that total applied to tobacco and sugarcane (International Food Policy
Research Institute (IFPRI2012). Limited use of fertilizer is attributed to its high cost, limited availability, and
limited awareness among farmers. There is also extremely limited use of other productivity-enhancing inputs
such as biological inoculants or pesticides.
LIMITED AND WEAK EXTENSION SERVICES Farmer access to public sector extension services declined from 13.5 percent in 2002 to 8.3 percent in 2014
due to reductions in funding. Most funding for extension site visits is paid through donor-supported
programming. NGO and other donor-funded programming provide a large percentage of public sector
extension services by default, though objectives, crop focus, and quality of extension advice varies, and most
programs have poor coordination in overlapping beneficiary groups.
Farmers also have limited access to private sector extension. Two types of private sector extension services
exist—extension embedded in outgrower schemes and through input supply providers. In practice, most
farmers seek out the nearest agroinput retail shop for extension advice related to input utilization, whether for
Mozambique Agricultural Value Chain Analysis 10
fertilizer or crop protection. Nonetheless, the quality of private sector extension from retailers tends to be
poor, with many retailers providing counterfeit products or inaccurate application information.
WEAK AGROINPUT SYSTEM There is currently one agrodealer for every 20,000–25,000 farmers, as compared to one agrodealer to 2,800 in
Tanzania; one to 1,500 in Malawi; and one to 1,400 in Zambia (USAID AIMS III Impact Assessment). While
the total number of agroinput retail shops remains small relative to population, the numbers of shops has
increased over the past decade from 150 in 2006 to between 750 and 1,000 in 2015 (USAID AIMS III Impact
Assessment). This has been driven primarily by donor investment in expanding the agroinput sector, mainly
through technical assistance and material support to strengthen existing dealers and establish new dealers.
LIMITED ACCESS TO MECHANIZATION SERVICES Smallholders lack access to mechanized services, making planting and post-harvest processing very labor in-
tensive. Mechanized tillage is utilized by only 1.55 percent of small and medium farms in the Beira and Nacala
corridors. John Deere and several other mechanization companies have established distributor operations in
the greater Maputo area, primarily focused on commercial farmers in southern provinces. Due to the
challenges of north-south transportation logistics, the majority of commercial operations have sourced
tractors from the closest border, either Zimbabwe or Malawi in the Beira and Nacala corridors, respectively.
Commercial operations, particularly in Nampula and Zambezia, reported significant challenges in tractor
service and repair, with delays of up to 60 days between ordering a part and its arrival. This lack of a local
support system for mechanization leads to significant risk from costs due to transport and production delays
for any scheme.
Limited availability of mechanization services also limits expansion of agricultural land. Mozambique has ex-
tensive unused land that can only be farmed with mechanization, and some regions have a hard pan under the
soils that must be broken with a mechanized plow to allow roots to penetrate (Abt Associates 2015).
POST-FARM GATE CONSTRAINTS A number of post-farm gate constraints affect the development of demand-driven value chains. Several of these are addressed below.
WEAK INFRASTRUCTURE Support to infrastructure, particularly all-weather roads, is an ongoing need across all value chains and must
underpin any “extensification” strategy aimed at developing a value chain by increasing the number of pro-
ducers or areas produced of a commodity.
Mozambican farmers, particularly in northern provinces, have limited access to major transportation routes
compared to farmers in neighboring countries. This limits their access to markets for inputs, goods, and
services, and curtails the reach of commodity buyers. Only 27 percent of Mozambicans live within 2 km of a
year-round passable roadway, compared with 38 percent in Malawi and Tanzania; 64 percent in Zambia; and
65 percent in Zimbabwe.2 Several respondents cited transportation costs and limited knowledge of what
farmers in their areas would purchase in terms of inputs as key reasons they do not actively attempt to expand
their market catchment.
2 World Bank Rural Access Index data.
Mozambique Agricultural Value Chain Analysis 11
Port inefficiency is also a major issue, as described in the section on bananas and as detailed in the Nacala and
Beira port efficiency studies commissioned by AgriFUTURO (Abt Associates 2015).
LACK OF TESTING AND CERTIFICATION CAPABILITIES Sales to relatively demanding export markets are curtailed by the limited availability and high cost of SPS test-
ing and certification. For example, groundnuts must be tested for Salmonella and E. coli before export to the
European Union or the United States. In order to complete these tests, exporters must incur the cost of send-
ing (and obtaining export approval for) a 30 kg sample to South Africa for testing and certification (Reynosa,
personal communication 2016).
Testing and certification is also a critical issue for addressing aflatoxins. AgriFUTURO funded a lab capable
of testing for aflatoxins at the Lurio University in Nampula. At the time of project closeout, the laboratory
was beginning the process of obtaining certification of its testing capabilities (Abt Associates 2015). Further
development of these capabilities will be critical to effectively address aflatoxins as a critical constraint to do-
mestic health and exports.
FINANCE Finance is a constraint throughout the Mozambican economy, including in the target value chains. Various
projects, including AgriFUTURO and FINAGRO, for example, have attempted to facilitate agricultural value
chain players’ access to finance, with mixed results. AgriFUTURO had limited success working with USAID’s
Development Credit Authority to increase smallholder producers’ and processors access to financial services.
While the initiative did increase access to working capital and increase liquidity of small and intermediate
value chain players, it failed to make inroads on smallholder lending due to “excessive delinquency.” This fur-
ther led the participating banks, Banco de Oportunidade de Moçambique and Banco Terra, to try to protect
themselves through increasingly cumbersome bureaucratic checks (Abt Associates 2015).
The AgroCredito program was a separate AgriFUTURO initiative that worked to increase the liquidity of pri-
mary buyers for commercial and emerging smallholders (small and medium traders; cooperatives and pro-
ducer associations; retailers, and large “anchor” farms) and banks through activities to develop mutual trust
that would provide a foundation for sustainable lending relationships. This program leveraged these value
chain players’ critical roles as intermediaries between banks (from which they were able to obtain financing to
buy produce from farmers) and producers (who were able to obtain some financing for inputs and have a se-
cure market). AgriFUTURO reflects, in its final report, that “the project did find a viable short-term alterna-
tive in getting buyers to provide advances so that FOSCs [farmer owned service centers] could purchase and
agglomerate members’ production. It also encouraged short-term financing for agricultural inputs by agribusi-
ness service centers and vendors, but even these were somewhat constrained during the first quarter of FY
2015 due to producer delinquency in previous years.” (Abt Associates 2015). USAID’s FinAgro program
complemented the AgriFUTURO grants program and is scheduled for completion in late 2016.
Likewise, input suppliers and wholesalers as well as retail agrodealers cited high repayment failure rates as the
primary reason they do not offer credit to their customers (retailers or farmers, respectively).
POLICY A number of policy and enabling-environment issues affect development of demand-driven value chains. Sali-
ent issues identified during key informant interviews include lobbying by some large industrial players for ex-
port taxes on unprocessed pigeon peas and the application of value-added tax (VAT) to domestic sales made
along agricultural value chains; competing imported agricultural commodities are exempt from these taxes.
Mozambique Agricultural Value Chain Analysis 12
GENDER Women are an important focus of agricultural development initiatives due to their central roles in the produc-
tion and consumption ends of the household economy, as well as their generally disadvantaged status in soci-
ety.
Women are heavily involved as producers in agriculture in Mozambique: they account for the majority (up to
95.3 percent) of unskilled laborers in agriculture and the informal economy (Tvedten 2011). In female-headed
households in particular, which comprise 24 percent of Mozambican households, (MASA 2012), women are
more likely to undertake all relevant agricultural tasks—from clearing and preparing land for planting, to
seeding, weeding, harvest, and post-harvest activities (Tvedten 2011). In general, regardless of the household
structure, women typically have a heavier workload than men. In addition to agriculture activities, they also
cook, fetch water, collect firewood, clean, process food, and care for children as well as sick and elderly family
members.
Recent analysis shows that gender-integrated, household-based approaches to behavior change are critical to
bringing about lasting change in gender relationships (Abt Associates 2015). Women—whether in female- or
male-headed households—tend to dedicate their agricultural production to household consumption and so
tend to have lower participation in markets than men do. There are opportunities to improve women’s well-
being through value chain interventions that introduce technologies and practices that reduce women’s labor:
for example, mechanized peanut shellers (Abt Associates 2015). Likewise, there are opportunities for women
to benefit through participation in member-based organizations such as farmer associations. An assessment
of gender-oriented results of USAID-funded agribusiness programming in Mozambique showed that farmer
organizations (FO) were a particularly effective means to incorporate women into value chains and facilitate
their access to credit. The assessment also showed that women-only groups are more beneficial to women
than mixed-gender groups (Hackenberg et al. 2013).
NUTRITION Smallholders and their families are not consuming sufficient micronutrients. Mozambique has a dietary diver-
sity index score of 21 percent: nearly 48 percent of women are anemic, and 69 percent of preschool children
are vitamin A deficient (Food and Agriculture Organization (FAO) 2011). Improving and increasing house-
hold production and local sale and consumption of traditional vegetables, as well as protein- and nutrient-rich
pulses and oilseeds has significant potential to increase incomes and reduce nutritional deficiencies. Given the
prevalence of groundnuts in traditional Mozambican diets and high aflatoxin levels in Mozambican ground-
nuts, aflatoxin is a pressing nutritional issue facing Mozambique.
Mozambique Agricultural Value Chain Analysis 13
VALUE CHAIN INTERVENTION
CONSIDERATIONS Benefica et al. (2014) finds strong correlation between market participation and productivity—that is, greater
market access is associated with higher farm-level productivity. Nonetheless, they point out that, in most re-
spects, uptake of productivity-enhancing, farm-level inputs (such as improved seed, fertilizer, and mechaniza-
tion, and with the noted exception of hired labor) is still low. The study emphasized that it is important to
also promote productivity improvements at the farm level along with improved market access.
For most of the value chains analyzed in this document, the movement of product from smallholder farmer
to industrial buyers or end users traditionally begins with sales to a local trader at the farm gate. Movement
continues through successive aggregations until a large-scale trader delivers the product to a wholesale market
for retail distribution or to a large industrial buyer that will process or export it. This traditional value chain
structure tends to be fragmented and informal, and it dampens the transmission of incentives and infor-
mation that allows farmers to confidently respond to market opportunities. Thus, development of demand-
driven value chains requires alternative organizational approaches that emphasize direct communication be-
tween buyers and suppliers. Due to their scales of operation, large-scale industrial buyers can play a critical
role in the development of such “demand-driven” value chains. FOs are an important but under-utilized plat-
form for interventions aiming to reach many smallholder beneficiaries in an effective manner. FOs could help
facilitate the economies of scale and the aggregation needed for price bargaining.
Three major models are used to enable smallholder-inclusive, demand-driven value chain development in
Mozambique: contract farming, agribusiness service centers, and FOs.
CONTRACT FARMING Under contract farming, buyers and farmers enter into an agreement for farmers to provide their output to
the buyer. Typically the buyer then provides financing (monetary or in-kind) to enable farmers to access in-
puts (improved seed, fertilizers, etc.) and services (mechanization). In some cases, such as with AgriFU-
TURO, project support can also enable these buyers to provide services such as mechanized land preparation
or extension to contracted farmers.
Heavy competition for output at harvest, combined with farmers’ limited liquidity and the presence of inde-
pendent traders in major production areas at harvest, commonly give rise to “side-selling” in which farmers
sell their output to local traders who are offering cash payments at attractive prices. Farmers sometimes en-
gage in side-selling rather than adhering to their contracts, which may involve lower cash payments (either
because the value of production financing is to be subtracted or because negotiated prices are lower) or de-
layed payments.
The prevalence of side-selling has undermined numerous contract farming arrangements. As a result, it is
common for buyers to argue that there is a need for “concessions” in which a buyer is authorized as the sole
authorized buyer in a geographically defined area, thereby precluding opportunities for farmers to sell to com-
peting buyers. Historically, the tobacco and cotton value chains have operated on a concessionary basis, and
this arrangement is broadly seen as advantageous to many buyers.

Mozambique Agricultural Value Chain Analysis 14
There are also opportunities for organizational structures to be tweaked to reduce the prevalence of side-sell-
ing, as well as for development projects to play a role in reducing side-selling. For example, a report by Kleijn
et al. discusses how a SNV/Export Trading Group (ETG) contract farming initiative in the sesame value
chain was able to mitigate side-selling by organizing farmers in “trust groups”; these groups leveraged peer
pressure as a means of reducing individual farmers from acting against the group’s interests. Likewise, allow-
ing FOs to serve as intermediating players can reduce side-selling if the organizations are better able to moni-
tor and influence member farmers than the buyers would be. Finally, development projects have had some
success in reducing side-selling through activities such as helping to mediate contracts so that farmers feel
more empowered and thus have greater commitment to their agreements, as well as through trainings and
communications that emphasize the long-term gains of successful contracts.
AGRIBUSINESS SERVICE CENTERS Agribusiness service centers (ASC) leverage outgrower relationships between large commercial farmers and
nearby smallholder farmers that serve as outgrowers to increase the availability of inputs and services to the
smallholders. ASCs were used under AgriFUTURO as a means of increasing the availability of services to
“emerging commercial” farmers by targeting anchor farms as recipients of project grants and services that
enable it to provide services (such as machinery services for land preparation) and inputs (such as improved
seed and fertilizers) to farmers.
FARMER ORGANIZATIONS FOs are a means of organizing smallholder farmers and enabling them to collectively access markets (through
joint sales), inputs, and services. FOs were largely set up as extension delivery mechanisms under previous
NGO-led programs, and they continue to be a leading source of extension knowledge for a large minority of
farmers. As of 2008, 7.2 percent of all producers were members of producer groups (MASA 2012).
Under AgriFUTURO, for example, FOs (called FOSCs under AgriFUTURO) became the locus of purchase
contracts with large industrial buyers. These contracts detailed stipulations such as price, delivery date, quality
parameters, and volumes, and they enabled compliance with the traceability requirements of more demanding
export markets. They also served as conduits for value chain financing that enabled farmers to access the in-
puts and services that allowed them to respond to the contracts.
Overall, in discussing lessons learned in its final project report, AgriFUTURO reflected on the central role
that project-supported FOSCs played in linking smallholder farmers to markets and enabling their success in
these markets. They also reflected on the tendency for FOSCs to successfully integrate women into commer-
cial farming arrangements.
Both AgriFUTURO and an independent evaluation, however, emphasize that the leadership and management
capacity of FOSCs tends to be low; they also noted the importance of ongoing investments to develop this
capacity and to enable transparency and accountability in management, if gains achieved by FOSCs are to be
sustained (Easterling et al. 2013; Abt Associates 2015).
The following two additional models are oriented to farm-level productivity enhancement and do not rely on
market opportunities to drive uptake of yield-enhancing inputs and management practices.
TOBACCO AND COTTON CONCESSION COMPANIES As part of their social responsibility, tobacco and cotton concession companies provide farmers with pack-
ages allowing for production of grain and pulses. This way, rainfed and some near-to-floodplain production
Mozambique Agricultural Value Chain Analysis 15
plots in upper Tete, lower Nampula, and upper Zambezi, as well as intensive production plots in Cabo Del-
gado and Niassa, benefit from improved seeds and fertilizers, which could improve the quality of soil and
transform these areas into very productive land for smallholder farmers. These activities are associated with
increases in use of yield-enhancing inputs on some crops, such as application of fertilizer to cowpeas, in some
areas.
DEVELOPMENT FOOD ASSISTANCE PROGRAMS USAID-funded Development Food Assistance Programs (DFAP) (formerly known as Multi-Year Assistance
Programs) are implemented by nongovernmental organizations (NGO) in specific geographic areas of Mozam-
bique. They undertake farm-level interventions aimed at improving uptake of beneficial agricultural practices,
strengthening nutrition practices, and improving integration between agriculture and nutrition. DFAP activity
has been instrumental in increasing use of productivity-enhancing inputs in many of the target value chains,
particularly those with important food security and nutritional roles.
Mozambique Agricultural Value Chain Analysis 16
SOYBEAN RELEVANCE TO USAID OBJECTIVES Soy is a nutritious, but not traditionally consumed, crop in Mozambique. It is profitable for small- and me-
dium-scale “emerging commercial” farmers with gross margins averaging from $306 to $371 (Payongayong
2012). Additionally, women have been successfully increasing their involvement in different levels of the soy-
bean value chain. The domestic market for soy is estimated to be growing at about 60 percent per year, and
about 60 percent of Mozambique’s domestic demand for soy is currently met through imports. There is a rel-
atively limited geographic area suitable for soy production—this area is largely limited to highlands in central
and northern Mozambique, with only 5–10 districts perceived to have “high potential” for sustainable and
profitable production given current and anticipated world prices that mediate local competitiveness (Walker
2016b). Several current and recent donor-funded initiatives offer rich examples of promising interventions
and opportunities to develop the supply base and expand the competitiveness of the value chain.
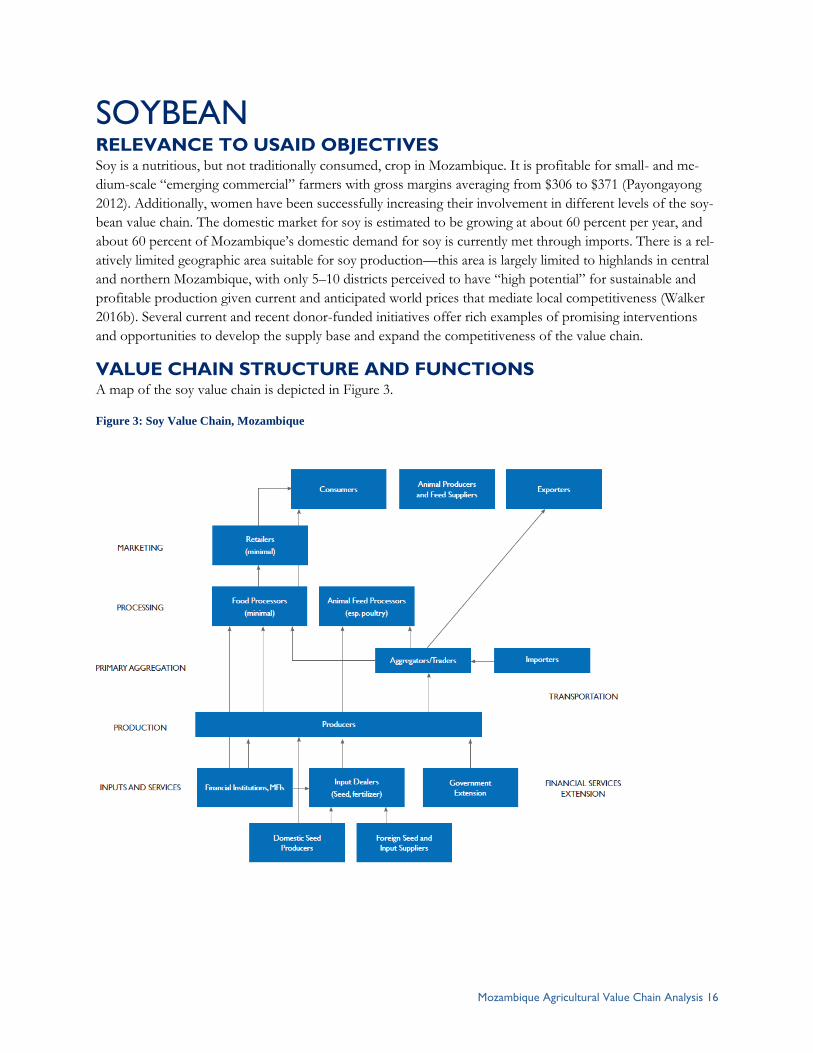
VALUE CHAIN STRUCTURE AND FUNCTIONS A map of the soy value chain is depicted in Figure 3.
Figure 3: Soy Value Chain, Mozambique
Mozambique Agricultural Value Chain Analysis 17
End Markets The major end markets for soy are animal (primarily poultry) feed companies as well as exports to Malawi.
Domestic demand for soy for processing into feed is estimated at 75,000 MT/year. Currently, Manica is re-
ported to be responsible for about 30 percent of feed demand in the country in large part due to the activities
of Abilio Antunes. In Nampula, Frango King/Novos Horizontes and Proalimentar are prominent feed com-
panies.
Edible oil is a byproduct of processing soy cake for animal feed. It has a market in both Mozambique and
nearby markets such as Malawi. Several processing plants in the major cities and corridors concentrate on re-
fining palm oil imported from Asia for sale in domestic and regional markets. These plants have the capacity
(and in some cases interest) in also refining and marketing edible soy oil, although few currently work with
soy. More research is needed to investigate the opportunities for developing the soy oil value chain.
There is limited domestic value-addition for soy into foods for human consumption such as soy milk and soy
bread. This value addition is often related to NGO- and donor-funded initiatives; an example is the USAID
beneficiary Agropecuaria de Manica, which processes and markets soy flour. There are also limited exports of
the highest quality soy to highly demanding export markets such as Japan. Finally, there are also some exports
of soy (as grain) to regional markets such as Malawi. Regional exports typically are dominated by informal
traders who place themselves in production areas during harvest time. These traders are often accused of mo-
tivating side-selling on the part of farmers who have otherwise committed their production to larger buyers
(and often received inputs to support that production). Development organizations such as NCBA CLUSA
and TechnoServe are working to mitigate side-selling by strengthening farmer-buyer linkages and reducing
incentives for side-selling.
MARKETING AND VALUE ADDITION From the farm, soy typically moves through structured supply chains to processing plants where it is con-
verted to animal feed, with soy oil as a byproduct. Often producer associations serve as intermediaries and
also may support producers with provision of seed, mechanical services, post-harvest handling, and in-kind
finance for inputs. Generally, large-scale buyers buy directly from farmers or farmer associations under con-
tracts of varying intensity. Donor-funded projects such as AgriFUTURO and NGOs such as TechnoServe
and NCBA CLUSA typically play an important role in the creation and maintenance of these buyer-supplier
relationships, providing technical assistance and training and other forms of assistance to help ensure the suc-
cess of the relationship, in particular adherence of both parties to agreed-upon contract terms. While there is
demand for soy (for animal feed) in southern Mozambique (Maputo area), transport from the center-north
where it is produced is prohibitively expensive, and southern buyers most commonly import from South Af-
rica, Brazil, or Latin America. These sources also offer consistent quality, which is important for efficient pro-
cessing. In the center and north of the country, the growing market for animal, particularly poultry, feed
translates to an expanding market for soy.
The quality of soy meal that is used for animal feed is determined in large part by its protein content, which is
largely an outcome of the variety3 and/or processing method. There are only four plants in Mozambique that
3 “Safari” and “TGX” were mentioned by one processor as having higher protein contents; however, they were also mentioned as
being lower yielding by other actors interviewed.
Mozambique Agricultural Value Chain Analysis 18
have the solvent-based extraction capability required to produce top-quality (Grade A1) soy cake with 47 per-
cent protein. Other plants use less-expensive expresser extraction processes, which lead to a lower-protein
soy cake with a higher oil content (Grade A2 and below) (TechnoServe 2009). Only two of these plants—
Abilio Antunes in Manica and Alfa Quimica in Nampula—are currently working with soy. The largest poultry
producers tend to have their own feed production facilities and constitute an important end market for do-
mestic soy production.
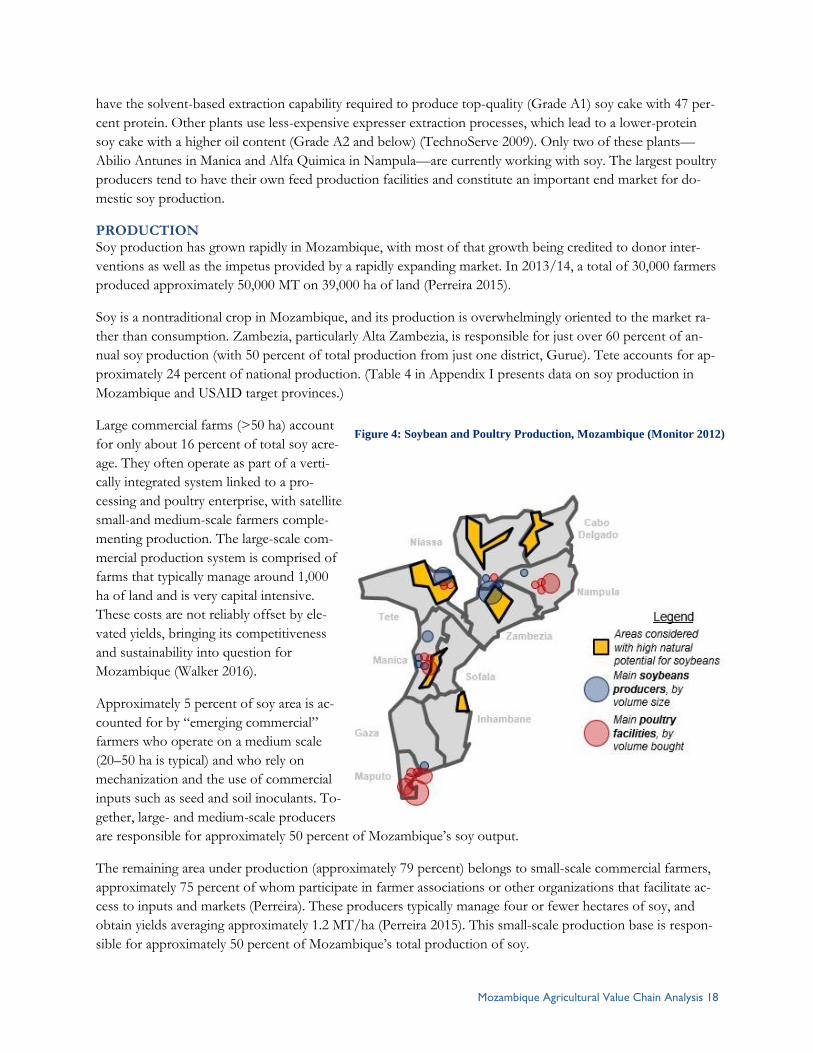
PRODUCTION Soy production has grown rapidly in Mozambique, with most of that growth being credited to donor inter-
ventions as well as the impetus provided by a rapidly expanding market. In 2013/14, a total of 30,000 farmers
produced approximately 50,000 MT on 39,000 ha of land (Perreira 2015).
Soy is a nontraditional crop in Mozambique, and its production is overwhelmingly oriented to the market ra-
ther than consumption. Zambezia, particularly Alta Zambezia, is responsible for just over 60 percent of an-
nual soy production (with 50 percent of total production from just one district, Gurue). Tete accounts for ap-
proximately 24 percent of national production. (Table 4 in Appendix I presents data on soy production in
Mozambique and USAID target provinces.)
Large commercial farms (>50 ha) account
for only about 16 percent of total soy acre-
age. They often operate as part of a verti-
cally integrated system linked to a pro-
cessing and poultry enterprise, with satellite
small-and medium-scale farmers comple-
menting production. The large-scale com-
mercial production system is comprised of
farms that typically manage around 1,000
ha of land and is very capital intensive.
These costs are not reliably offset by ele-
vated yields, bringing its competitiveness
and sustainability into question for
Mozambique (Walker 2016).
Approximately 5 percent of soy area is ac-
counted for by “emerging commercial”
farmers who operate on a medium scale
(20–50 ha is typical) and who rely on
mechanization and the use of commercial
inputs such as seed and soil inoculants. To-
gether, large- and medium-scale producers
are responsible for approximately 50 percent of Mozambique’s soy output.
The remaining area under production (approximately 79 percent) belongs to small-scale commercial farmers,
approximately 75 percent of whom participate in farmer associations or other organizations that facilitate ac-
cess to inputs and markets (Perreira). These producers typically manage four or fewer hectares of soy, and
obtain yields averaging approximately 1.2 MT/ha (Perreira 2015). This small-scale production base is respon-
sible for approximately 50 percent of Mozambique’s total production of soy.
Figure 4: Soybean and Poultry Production, Mozambique (Monitor 2012)
Mozambique Agricultural Value Chain Analysis 19
END MARKET PRIORITIES AND CONSTRAINTS The most prominent end market opportunity for soy in Mozambique is the domestic market for animal feed
in the center-north of the country. Offshoot markets for exports to regional markets (e.g., Malawi) also exist,
as does the market for edible oils. The market for soy for industrial processing seeks a consistent and stand-
ardized quality product that is high in protein and free of stones and impurities.
The primary constraint to realization of gains in these priority end markets is inadequate production to meet
demand. There are several issues that underlie this constraint.
Limited agroecological area that is well suited for production: From a production standpoint, a
relatively limited area of the country, including five to 10 of USAID’s 35 target districts, has agroeco-
logical conditions that are well suited for soy production (Walker 2016b). Soybeans are most produc-
tive when grown from 700 m of altitude with annual rainfall above 800 mm. According to these pa-
rameters, the highlands in Manica, Tete, Zambezia, and Niassa are most suitable for the cultivation of
soy. Walker (2016b) posits that only areas able to produce yields of at least 2 MT/ha will be able to
competitively produce soy, given anticipated market conditions.
Limited availability of quality seed, either hybrid or open-pollinated variety (OPV), is a critical
factor limiting productivity and the expansion of production. Large commercial farms typically im-
port soy seed from abroad, but these imports are impeded by bureaucratic constraints, exchange rate
fluctuations, and cost; and there is no assurance that the seed will be well suited to local production
systems. Several large associations (such as IKURU) are expanding their production of certified soy
seed, for re-sale to their own local association members. Local varieties of soy used by smaller pro-
ducers do not typically yield well, and there is a need to expand domestic capacity to multiply high-
quality certified seed of appropriate varieties.
Limited use of improved inputs and suboptimal farm-level management practices also reduce
yields and profitability, particularly of small-scale farms. Timely planting is essential to high yields
(each day of delayed planting is linked to a 65 kg/ha decrease in yield), and yields are also highly re-
sponsive to the use of soil inoculants (Walker 2016b), though awareness and availability of quality
inoculants is limited.
Inadequate mechanization services curtail medium-scale production of soy and lead to significant
shortfalls in yields when planting is delayed.
Inconsistently successful linkages between buyers and suppliers are also an issue, particularly
given tendencies toward side-selling by farmers who are offered more attractive cash prices for their
product by itinerant traders at harvest; these buyers are often seeking soy to sell to processors in Ma-
lawi.
UPGRADING STRATEGIES Develop locally adapted improved seed varieties. This could be done by building on the work of
the Tropical Legumes project, which focuses on identification of locally adapted, high-yielding varie-
ties that also meet feed processors’ demand for minimum protein content. The International Institute
of Tropical Agriculture (IITA) and IIAM have worked to develop five new high-yielding and locally
adapted soy varieties that are in the latter stages of development as of 2014 (Walker 2016). These va-
rieties should be promoted through lead firm-driven production schemes and commercially oriented
farmer associations.

Mozambique Agricultural Value Chain Analysis 20
Expand soy production by targeting emerging commercial farmers (both small and medium
scale) in high-potential areas. Through recent initiatives such as AgriFUTURO, TechnoServe and
NCBA CLUSA have identified and created sustainable relationships between demand drivers (partic-
ularly poultry feed processors) and farmer associations to ensure production, marketing, and finance.
Another example was USAID/Mozambique’s $30-million 2014 public-private partnerships (involv-
ing NGOs, FOs, financial service companies, and mechanization suppliers, for example) aimed at
increasing market availability and access to inputs in USAID’s ZOIs. Farmer associations played a
key facilitation and aggregation role for small- and medium-scale soy production in such schemes.
Promote adherence to contracts and sales agreements to limit side-selling and encourage devel-
opment of sustainable linkages between buyers and producers.
Evaluate profitability of alternative smallholder models under different price and production
scenarios. For instance, analysing smallholder farmer models with a variety of input systems (e.g.,
quality OPV seed and inoculants and good management practices) to determine the most appropriate
input regime for smallholders.
Evaluate alternative means to mitigate mechanization constraints to medium-scale production,
such as minimum tillage (Walker 2016).
Mozambique Agricultural Value Chain Analysis 21
SESAME RELEVANCE TO USAID OBJECTIVES Sesame is highly relevant to USAID’s interest in creating income-earning opportunities for smallholder farm-
ers, with 85 percent of sesame farmers located in USAID target provinces. It is uniquely suited to diversified
smallholder production systems. While labor intensive in its principal phases of production (land preparation
though germination, then harvest), once germinated, crop maintenance needs are low until harvest. Financial
margins are also high at $261/ha (Payongayong 2012). Increases in production are largely attributable to in-
creasing numbers of smallholders participating in the market rather than increased average areas cultivated or
higher yields.
Sesame is nutritious with a high oil content and unsaturated fats, as well as antioxidants (Jasse 2013); it also
preserves well in storage. There is little evidence on the relevance of sesame to women, although its high
commercial value could potentially lend it to dominance by males while its labor-intensive nature could lead
to it creating a heavy burden on women.
Sesame has a vibrant and growing international market, as well as a number of strong demand drivers within
Mozambique that are seeking to expand their export sales of sesame. There are several current and recent do-
nor-funded initiatives that can be learned from and leveraged in the sesame value chain.
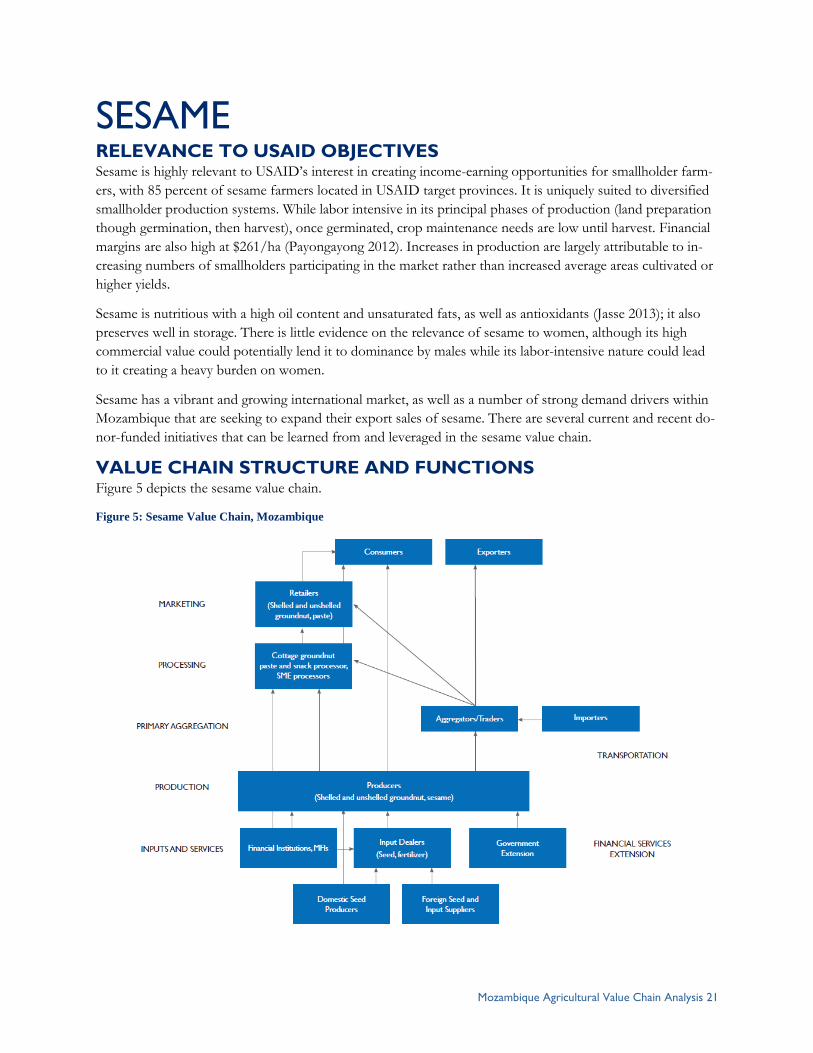
VALUE CHAIN STRUCTURE AND FUNCTIONS Figure 5 depicts the sesame value chain.
Figure 5: Sesame Value Chain, Mozambique
Mozambique Agricultural Value Chain Analysis 22
END MARKETS Mozambique’s sesame crop is overwhelmingly exported (98 percent) as graded but undifferentiated grain.4
Major importing markets are in Asia: China imported 61 percent of total sesame imports while Japan, the
largest importer of sesame internationally, imported 13.5 percent of Mozambique’s sesame exports in 2015.
Other importing countries include Turkey (8 percent), South Africa (3.3 percent), and Canada (3.1 percent).
The national sesame crop is exported by industrial traders; ETG is the dominant player in the market with an
estimated 65 percent market share. Other major traders include OLAM, Indo Africa, GANI, and Casa Modi.
In recent years, there has been an increased presence of medium-scale traders representing Chinese importers
buying directly from farmers’ fields, presenting competition to the larger industrial buyers that are established
in Mozambique. While SNV estimates that 77 percent of the sesame produced is sold on an individual basis,
there are also farmers’ organizations such as IKURU, which aggregates for their constituent farmers before
selling to major traders. This collectively marketed product is estimated to represent about 23 percent of total
production, according to SNV.
While there are market opportunities for sesame of the quality that is currently produced, price premiums are
available for higher-quality sesame. Export markets grade sesame on the basis of color, oil content, and or-
ganoleptic attributes like purity, cleanliness, and humidity. With respect to color, white or black, not mixed,
sesame is preferred. High oil content (greater than 52 percent) is also preferred.
There is a limited domestic market for sesame to be used as an input in oil production or as snack food. For
example, San-Oil uses sesame as a cleaning agent in its production of cotton seed oil; Irmãos Semedo in
Nacala processes sesame oil; and the NGO ADPP sells roasted sesame and cashew locally as a snack food.
Overall, local value-added markets represent a small share (less than 2 percent) of total production.
MARKETING AND VALUE ADDITION
Following harvest, farmers typically market their crops—on average less than 100 kg—on an individual basis
to local traders who then transmit them to large-scale buyers. Consistent with their small areas cultivated,
farmers tend to sell small quantities of seed—on average less than 100 kg (2014, Kleijn et al.). There tend to
be large numbers of local traders, and they often operate on behalf of the large traders who provide finance
to support purchases. Small-scale traders often conduct limited value addition in addition to their role as ag-
gregators—in particular they may undertake basic cleaning of the crops to remove impurities and off-color
(black) seeds. In addition to local traders, the major buyers also often set up buying points along major road-
ways where they aggregate from local traders or larger producers before sending 30 MT-ton trucks to their
central facilities in Nampula, Nacala, or Beira where the sesame will undergo additional processing prior to
export. Processing is again limited to cleaning, with the exception of ETG which has a dehulling machine.
PRODUCTION
Sesame is produced by smallholder farmers, primarily in the USAID provinces of Nampula, Zambezia, and
Manica, which are collectively responsible for 54 percent of the national area under production and 85 per-
cent of sesame producers. Production areas are small, averaging only 0.39 ha in the USAID provinces (MASA
2012, 2014). Although sesame can be intercropped with maize or beans, it is often produced as a monocul-
ture. Farmers typically rely on local seed recycled from their harvest or purchased in the local market; there is
4 There are niche export markets as well for “bald varieties” and safari variety, which is sesame and black sesame; this second variety
has a higher oil content and is exported to Japan. However, Mozambique is not known to be currently participating in these markets.
Mozambique Agricultural Value Chain Analysis 23
virtually no use of other productivity-enhancing inputs such as improved varieties or fertilizer. Yields are
low—averaging 300 kg/ha compared to potential yields of 650 kg/ha (SNV). Rainfed production makes the
crop vulnerable to climatic anomalies, which can cause wide fluctuations in output and even crop failure.
Pests, particularly the flea beetle, are also an important factor in production although they can be mitigated
through use of resistant varieties, insecticide-treated seeds, or in-field treatments (Jasse 2013). Harvest prac-
tices are particularly important for maintaining yields—delayed harvests can lead to pods opening in the fields
and shedding sesame seed. (Table 5 in Appendix I presents data on sesame production in Mozambique and
USAID target provinces.)
END MARKET PRIORITIES AND CONSTRAINTS Primary constraints to realization of end-market opportunities in the sesame value chain include inadequate
volume of production, low yields, poor quality of output, and poor linkages between buyers and producers.
Inadequate volumes of production to meet demand – Key interview respondents among large traders
report having unmet demand for sesame, such that they are able to absorb larger volumes of production.
ETG, for example, reports it could procure significantly more sesame if it were available.
Low yields – Low productivity is a result of poor quality seed and suboptimal management practices. The
flea beetle is also a factor in low yields. Additionally, suboptimal harvest practices—in particular, delayed har-
vests—cause substantial losses of the product in the field.
Low quality sesame crop – A major issue in sesame growing is that varieties are degraded and mixed. This
results in low-quality, mixed-color sesame (white mixed with dark), which leads to price discounts in export
markets. Mixed varieties also result in variable grain sizes, which affects product quality. Mozambican sesame
is also often discounted on the basis of excess humidity, which is a result of poor post-harvest practices; in
addition, Mozambican sesame is not cleaned and sorted due to poor post-harvesting handling practices such
as farm-level threshing against the ground, which introduces extraneous material.
Poor linkages between producers and buyers – Weak linkages between producers and buyers limit farm-
ers’ incentives and ability to invest in increasing productivity and yields. The weak linkages also lead to dis-
trust among market actors, with large traders complaining that some growers add sand to their bags to in-
crease weight.
UPGRADING STRATEGIES Increase area of production (via number of producers) and yields – Facilitate access for farmers to re-
sistant varieties, treated seed, and spraying services. As part of one productivity-enhancing technology, seed is
pelletized with insecticide to help control the leaf beetle (besouro). This technology reduces the human health
hazards associated with distributing seed and insecticide separately.
Strengthen market linkages between exporters and producers – Work through FOs as an entry point to
strengthen linkages between farmers and buyers in order to closely manage harvests to ensure timeliness. This
will prevent pods from opening unexpectedly in the fields and will facilitate access to appropriate varieties
such as white or black sesame, which has a high oil content. Additionally, productivity-enhancing practices,
particularly harvest and post-harvest, should be promoted and marketed to farmer groups..
Promote niche varieties with higher-capacity producers – Interviews with main aggregators (IKURU,
OLAM, and Export Trading Group) indicated the existence of niche markets that would pay higher premi-
ums. These include markets for safari sesame in Japan; hulled grain or “bald” varieties; white seed; and black
Mozambique Agricultural Value Chain Analysis 24
sesame, which is valued by Japan due to its higher oil content. However, value chain actors are not yet invest-
ing in on-farm grading or other efforts to develop such niche markets.
Build off of previous value chain interventions – Leverage experience and initiatives of organizations such
as SNV (which partnered with ETG), AgriFUTURO, and others to strengthen the sesame supply base
through market-driven initiatives.

Mozambique Agricultural Value Chain Analysis 25
GROUNDNUT RELEVANCE TO USAID OBJECTIVES Groundnuts are a traditional crop in Mozambique, whose production is dominated by smallholders. Ground-
nuts are a profitable crop for smallholders, with gross margins averaging $280/ha5. Groundnuts are drought
resistant, and their short-season production cycle of approximately 95 days fits well into smallholder produc-
tion systems. Women are very active in groundnut production, post-harvest management, and local transport
and sales; this implies opportunities to improve women’s livelihoods through interventions to strengthen
market opportunities and increase efficiency and productivity.
Nutritionally, groundnuts are high in vitamins, protein, and digestible fats, and they factor into traditional
Mozambican cuisine. Unfortunately, groundnuts are marked by high aflatoxin levels, which reduce groundnut
digestibility, prevent absorption of nutrients, and cause negative long-term consequences such as stunting and
other adverse health impacts.
There is strong domestic market demand for groundnuts as well as strong international demand in countries
such as South Africa, Europe, and the United States. Unfortunately, current aflatoxin levels in Mozambican
groundnuts have seriously impeded producers' access to higher-value markets, and they are also severely det-
rimental to the health of Mozambican consumers.
5 AgriFUTURO (USAID 2012).
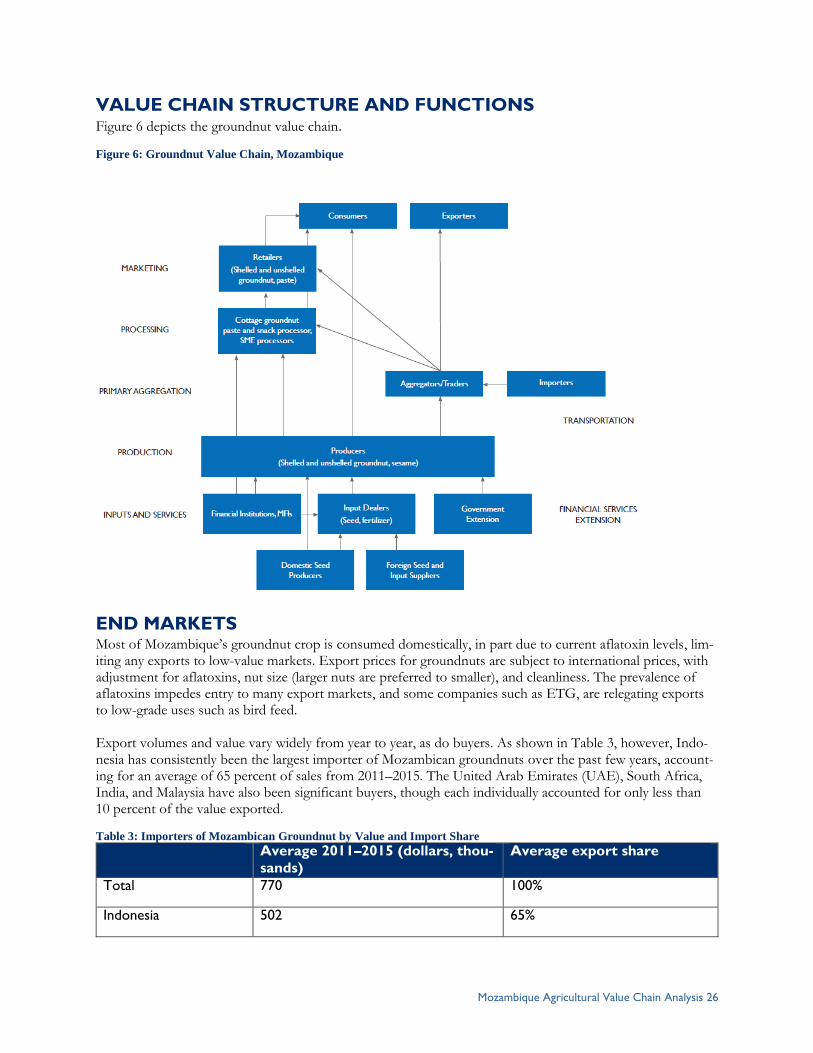
Mozambique Agricultural Value Chain Analysis 26
VALUE CHAIN STRUCTURE AND FUNCTIONS Figure 6 depicts the groundnut value chain.
Figure 6: Groundnut Value Chain, Mozambique
END MARKETS Most of Mozambique’s groundnut crop is consumed domestically, in part due to current aflatoxin levels, lim-iting any exports to low-value markets. Export prices for groundnuts are subject to international prices, with adjustment for aflatoxins, nut size (larger nuts are preferred to smaller), and cleanliness. The prevalence of aflatoxins impedes entry to many export markets, and some companies such as ETG, are relegating exports to low-grade uses such as bird feed. Export volumes and value vary widely from year to year, as do buyers. As shown in Table 3, however, Indo-nesia has consistently been the largest importer of Mozambican groundnuts over the past few years, account-ing for an average of 65 percent of sales from 2011–2015. The United Arab Emirates (UAE), South Africa, India, and Malaysia have also been significant buyers, though each individually accounted for only less than 10 percent of the value exported.
Table 3: Importers of Mozambican Groundnut by Value and Import Share
Average 2011–2015 (dollars, thou-
sands)
Average export share
Total 770 100%
Indonesia 502 65%
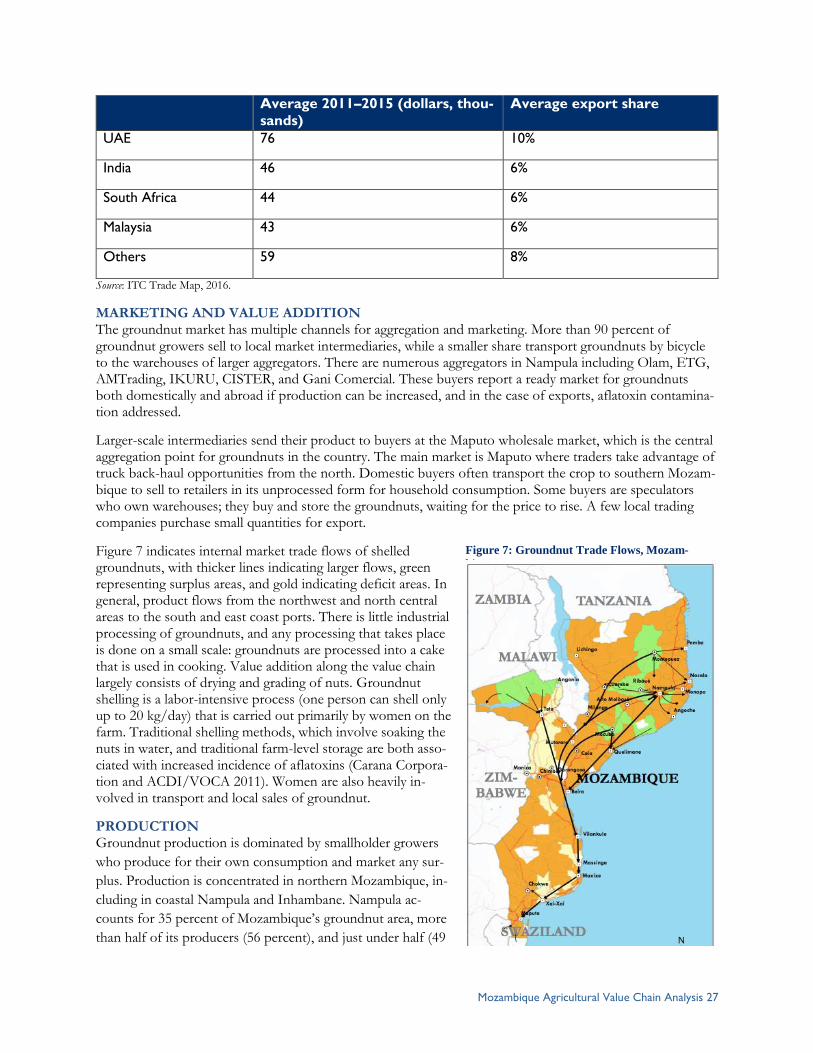
Mozambique Agricultural Value Chain Analysis 27
Average 2011–2015 (dollars, thou-
sands)
Average export share
UAE 76 10%
India 46 6%
South Africa 44 6%
Malaysia 43 6%
Others 59 8%
Source: ITC Trade Map, 2016.
MARKETING AND VALUE ADDITION The groundnut market has multiple channels for aggregation and marketing. More than 90 percent of groundnut growers sell to local market intermediaries, while a smaller share transport groundnuts by bicycle to the warehouses of larger aggregators. There are numerous aggregators in Nampula including Olam, ETG, AMTrading, IKURU, CISTER, and Gani Comercial. These buyers report a ready market for groundnuts both domestically and abroad if production can be increased, and in the case of exports, aflatoxin contamina-tion addressed.
Larger-scale intermediaries send their product to buyers at the Maputo wholesale market, which is the central aggregation point for groundnuts in the country. The main market is Maputo where traders take advantage of truck back-haul opportunities from the north. Domestic buyers often transport the crop to southern Mozam-bique to sell to retailers in its unprocessed form for household consumption. Some buyers are speculators who own warehouses; they buy and store the groundnuts, waiting for the price to rise. A few local trading companies purchase small quantities for export.
Figure 7 indicates internal market trade flows of shelled groundnuts, with thicker lines indicating larger flows, green representing surplus areas, and gold indicating deficit areas. In general, product flows from the northwest and north central areas to the south and east coast ports. There is little industrial processing of groundnuts, and any processing that takes place is done on a small scale: groundnuts are processed into a cake that is used in cooking. Value addition along the value chain largely consists of drying and grading of nuts. Groundnut shelling is a labor-intensive process (one person can shell only up to 20 kg/day) that is carried out primarily by women on the farm. Traditional shelling methods, which involve soaking the nuts in water, and traditional farm-level storage are both asso-ciated with increased incidence of aflatoxins (Carana Corpora-tion and ACDI/VOCA 2011). Women are also heavily in-volved in transport and local sales of groundnut.
PRODUCTION Groundnut production is dominated by smallholder growers
who produce for their own consumption and market any sur-
plus. Production is concentrated in northern Mozambique, in-
cluding in coastal Nampula and Inhambane. Nampula ac-
counts for 35 percent of Mozambique’s groundnut area, more
than half of its producers (56 percent), and just under half (49
Figure 7: Groundnut Trade Flows, Mozam-
bique
Mozambique Agricultural Value Chain Analysis 28
percent) of its production. Nationally, the average area cultivated is less than a third of a hectare. Low yields
predominate—nationally, average yields are less than 350 kg/ha. Most farmers use recycled seed of traditional
varieties, and groundnuts are generally grown as part of a low-input production system. (Table 6 in Appendix
I presents data on groundnut production in Mozambique and the USAID target provinces.) Women are very
involved in groundnut production and marketing, and women head 25–45 percent of groundnut-producing
households (USG 2011).
END MARKET PRIORITIES AND CONSTRAINTS
There are ample opportunities to export groundnuts; however, realization of these opportunities is heavily
dependent on addressing aflatoxin contamination. Export market opportunities for aflatoxin-free groundnuts
include the United States, the European Union, Europe, and South Africa. There are also strong domestic
markets for groundnuts. Groundnuts should be clean and graded. Large groundnuts generally receive higher
prices, while the smaller groundnuts that are most commonly produced in Mozambique are valued for con-
fectionary uses.
In addition to high levels of aflatoxins, realization of potential sales in priority end markets is constrained by
inadequate volume of production to meet demand and a domestic inability to meet the SPS requirements of
major importers.
Lack of domestic quality and SPS certification capacity – The overriding constraint affecting the realiza-
tion of livelihood and nutritional gains from groundnuts is aflatoxin. Current aflatoxin levels affect both mar-
ket outcomes for groundnuts (particularly exports) and the health of domestic groundnut consumers.
Groundnuts must be tested for Salmonella, E. coli, aflatoxins, and other contaminants before export to more
demanding countries like the European Union and the United States. These tests are not available in Mozam-
bique; instead, samples (30 kg) must be sent to South Africa, which is very costly. There is also the added bu-
reaucratic cost of preparing SPS documentation, which must be in order for the samples to be “exported” to
South Africa. Current aflatoxin levels are above acceptable levels due to the agroecological conditions in
which groundnuts are produced. Poor post-harvest management conditions further exacerbate them. Mean-
while, the highly fragmented and largely informal value chain combined with limited capacity to detect or en-
force legislated aflatoxin limits impedes the production of aflatoxin-free groundnuts.
Inadequate volume to meet demand – Low yields are due to a lack of access to appropriate varieties (high
yielding and adapted to local agroecological conditions) and quality certified seed for groundnuts, which re-
sults in farmers relying on recycled seeds of low-yielding varieties. While Mozambique imports seed from
South Africa and Malawi, these seeds represent only about 10 percent of the national seed requirement.
Sub-optimal PHH methods – Groundnut shelling is a labour-intensive process—a single laborer can only
shell about 20 kg of groundnuts per day—that is primarily the responsibility of women. Suboptimal shelling
methods are associated with high post-harvest losses and increased aflatoxin levels, along with increased time
and labor burdens for women.
UPGRADING STRATEGIES
Establish aflatoxin testing capacity – Investigate needs and advisability of supporting Lurio University in
Nampula in its efforts to obtain certification of its aflatoxin-testing capacity. Additionally, partnership with
IITA, to scale up means of drastically reducing aflatoxin during the production process should be explored.
Mozambique Agricultural Value Chain Analysis 29
Work with export buyers to establish premium markets for aflatoxin-free groundnuts – Facilitate mul-
tiple aggregation models that link farmers to buyers and have the potential to motivate intensification of afla-
toxin-free production of groundnuts.
Promote intensification of production by improving access to quality seed and appropriate varieties. While
developing a domestic certified seed system is critical toward this effort, there are companies currently in
Nampula producing certified seed (Pannar and ORUWERA). Additionally, there is a need for more support
to producers through buyers or input dealers to help reduce post-harvest losses and improve grain quality by
promoting appropriate practices for cultivation, harvest, and post-harvest management of groundnuts.
Promote alternative shelling options such as mechanical harvesters and shellers, which reduce women’s
labor burdens and maintain grain quality without exacerbating aflatoxins. Investigate and build on the experi-
ences of AgriFUTURO in this area, particularly the challenge of finding cost-effective mechanization options
for these purposes.

Mozambique Agricultural Value Chain Analysis 30
COMMON BEAN RELEVANCE TO USAID OBJECTIVES Common beans are produced by smallholder farmers throughout the USAID ZOI. From a nutrition stand-
point, they are well established in Mozambican food culture and are a good source of protein and nutrients.
Women are estimated to be responsible for 80 percent of common bean production (CIAT 2004); however,
survey data (MASA 2008) show that female-headed households produce substantially less than those headed
by males (52 percent of male-headed household production). Women also market a lower proportion of their
crop, producing mainly for household consumption—only 3 percent of women sell compared to 32 percent
of men (MASA 2008 in Kiala 2012). Thus, there are opportunities to enhance economic opportunities for
women and nutritional outcomes by improving their productivity and sales of common bean by women. The
nutritional and gender-differentiated benefits of common bean could be strengthened through targeted inter-
ventions to increase production for consumption and/or sale.
There are strong markets and unmet demand for common bean. Large industrial buyers, who could act as
demand drivers, rely largely on traditional value chain structures for their procurement. However, buyers have
recently collaborated with initiatives such as AgriFUTURO to develop more structured procurement; this has
helped to motivate uptake of productivity-enhancing technologies and practices such as improved seed and
fertilizer. Improvements to common bean production and marketing offer opportunities for broad-based in-
creases in productivity, incomes, and nutrition, with particular potential benefits for women.
VALUE CHAIN STRUCTURE AND FUNCTIONS Figure 8 shows a map of the value chains for common beans, pigeon pea, and cowpea in Mozambique.
Figure 8: Pulses (Common beans, pigeon pea, and cowpea) Value Chain, Mozambique
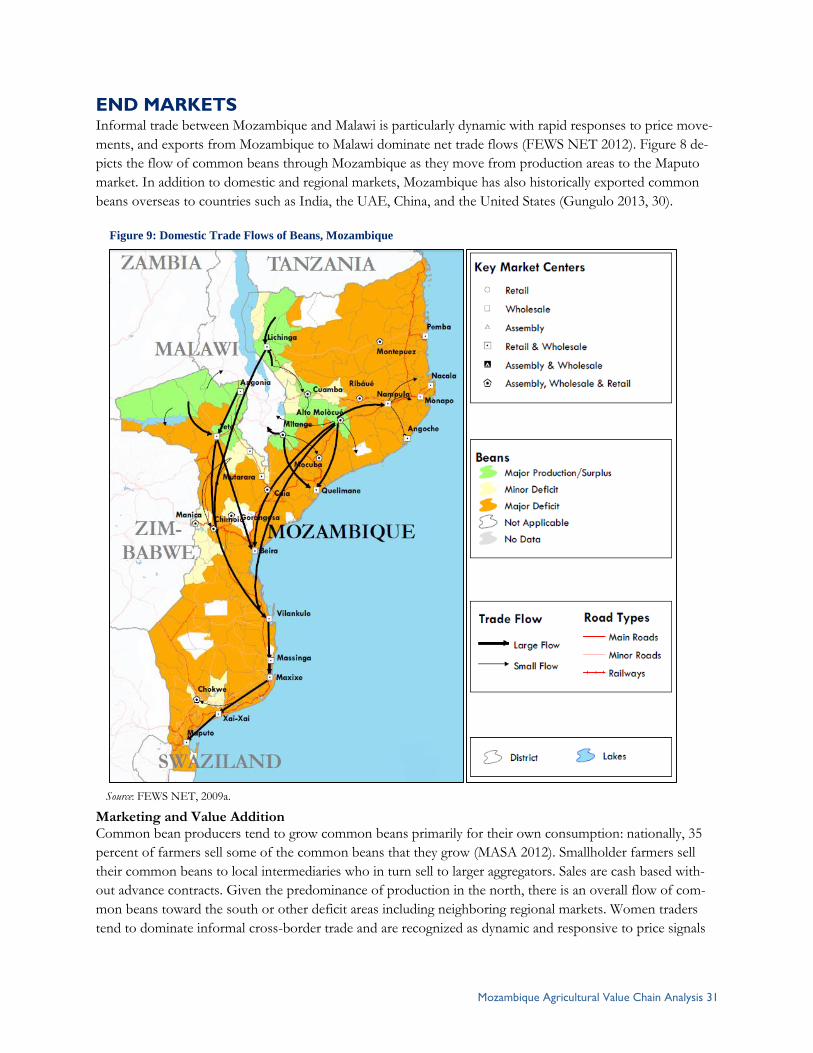
Mozambique Agricultural Value Chain Analysis 31
END MARKETS Informal trade between Mozambique and Malawi is particularly dynamic with rapid responses to price move-
ments, and exports from Mozambique to Malawi dominate net trade flows (FEWS NET 2012). Figure 8 de-
picts the flow of common beans through Mozambique as they move from production areas to the Maputo
market. In addition to domestic and regional markets, Mozambique has also historically exported common
beans overseas to countries such as India, the UAE, China, and the United States (Gungulo 2013, 30).
Marketing and Value Addition Common bean producers tend to grow common beans primarily for their own consumption: nationally, 35
percent of farmers sell some of the common beans that they grow (MASA 2012). Smallholder farmers sell
their common beans to local intermediaries who in turn sell to larger aggregators. Sales are cash based with-
out advance contracts. Given the predominance of production in the north, there is an overall flow of com-
mon beans toward the south or other deficit areas including neighboring regional markets. Women traders
tend to dominate informal cross-border trade and are recognized as dynamic and responsive to price signals
Source: FEWS NET, 2009a.
Figure 9: Domestic Trade Flows of Beans, Mozambique
Mozambique Agricultural Value Chain Analysis 32
in the market. Large buyers involved in the value chain include OLAM, Patel Trading, ETG, GANI Com-
mercial, and CISTER.
PRODUCTION
Common beans are produced primarily by smallholder farmers on small plots in intermediate and high-alti-
tude growing regions (Niassa, Tete, and Manica together are responsible for approximately 96 percent of na-
tional production). Nationally, about 9 percent of farmers grow common beans, and 13 percent in the
USAID provinces. Among the USAID provinces, production of common bean is most common in Tete,
where 31 percent of farmers grow it, accounting for 35 percent of national area cultivated with common bean
and 29 percent of production. Zambezia is the second major producing area in the USAID ZOI with 14 per-
cent of national area cultivated. (Table 1 in Appendix I presents data on common bean production in
Mozambique and the USAID target provinces.)
Common bean production systems are rainfed, use recycled seed, and use little to no external inputs (2012,
Cachomba, nd). About 15–20 percent of common bean producers receive extension advice (Walker 2015),
and about 12.5 percent of farmers use improved seed (MASA 2012, 2014). Use of improved seed and other
inputs is highest in cotton and tobacco concession areas where seeds and some inputs are distributed to con-
cession smallholders as part of companies’ corporate “social responsibility” programs. Farmers typically culti-
vate common bean on small areas—averaging 0.3 ha nationally and less than .25 ha in the USAID provinces.
Nationally, yields range widely from under 200 kg/ha in Gaza to over 700 kg/ha in Niassa. Yields in the
USAID target provinces cluster around the national average of 535kg/ha, ranging from 379kg/ha in Nam-
pula to 548kg/ha in Manica (MASA 2012, 2014).
END MARKET PRIORITIES AND CONSTRAINTS
There are strong markets and unmet demand for common beans for informal/domestic regional trade and
for export to countries such as India. For example, the large industrial trader ETG reports unmet domestic
demand of about 10,000 MT/year. Large buyers seek common beans that are clean, graded by size, and of
consistent (not mixed) varieties in order to facilitate targeting of the product to market demand. Southern
markets (e.g., Maputo) prefer khaki and khaki-speckled beans; while Malawian markets prefer darker, small
red beans (2012, Cachomba).
Constraints include the fragmented and informal nature of the value chain, which limits the transmission of
incentives to motivate farmers to invest in yield-enhancing technologies and management practices. The frag-
mented nature of the value chain limits farmers’ access to and information about markets. There is also inade-
quate domestic production to meet demand due in part to a lack of quality seed.
UPGRADING STRATEGIES
There are opportunities to promote the USAID objectives of improving smallholder incomes and nutrition
and gender outcomes through interventions in the common bean sector. Trade is largely informal, but there
are some large-scale demand drivers that have the potential to catalyze uptake of productivity-enhancing in-
puts, as shown in the example of AgriFUTURO’s work with CISTER, below. Specific strategies include:
Intensification of production through increased availability and uptake of improved seed offers the po-
tential to increase farm-level productivity.
Mozambique Agricultural Value Chain Analysis 33
Target female-headed households/female producers who dominate common bean production but
who tend to be less productive and less involved in common bean markets. Targeting women has the po-
tential to decrease gender differentials in productivity and sales, while also helping to increase the availa-
bility of nutritious common bean for household consumption.
Link farmers to markets through producer associations and learn from and leverage organizational
approaches discussed in the Value Chain Considerations section to leverage contract farming arrange-
ments to link common bean producers to large buyers. Learn from and leverage AgriFUTURO’s work
with companies like CISTER to link smallholder producers to markets via FOs.
Mozambique Agricultural Value Chain Analysis 34
PIGEON PEA RELEVANCE TO USAID OBJECTIVES Development of the pigeon pea value chain offers strong potential for improving smallholder incomes and
nutrition. Pigeon pea has a long history in Mozambique, including in traditional cuisine (for example, dishes
such as mukapata), and is produced by 30 percent of smallholders in USAID target provinces.
Pigeon pea production is uniquely suited to smallholders, and they dominate production in Mozambique. It is
well suited to intercropping; has low input requirements, including a low seed-production ratio; and performs
well with stable yields in smallholder systems (Walker 2015).
Pigeon pea production is for both consumption and sale, and pigeon pea is a healthy source of proteins and
other nutrients from both the beans and leafy greens, which are harvested during the production season.
Women are strong potential beneficiaries of pigeon pea production and sales: the small areas cultivated on a
per-household basis, the low labor requirements for production following planting, and profitability under
low-input systems can favor participation by women who tend to be constrained by time, land, and cash.
Pigeon pea has a robust export market, with particularly strong demand from India, whose market offers
strong seasonal price premiums that are aligned with Mozambique’s harvest window. Despite this, there have
not been major development initiatives engaged with pigeon pea. Indeed, its expansion over the past decade
is credited as benefitting from “benign neglect”: it emerged as an increasingly important crop despite the lack
of major attention given to it by the Mozambican government or the development community. Future activi-
ties could be built around the experiences of several smaller-scale interventions, including public-private part-
nerships.
VALUE CHAIN STRUCTURE AND FUNCTIONS Figure 8 (on page 30) shows a map of the pigeon pea value chain in Mozambique.
END MARKETS India is the primary market for Mozambican pigeon pea, importing an estimated 60,000 MT valued at $40
million in 2014 (Walker 2015). There is also informal cross-border trade to Malawi. Nearly all exports (95 per-
cent) are of whole peas. An analysis by Walker (2015) shows that the biggest factor affecting prices, histori-
cally, is the month in which pigeon peas are exported to India: prices rise as India’s harvest approaches, peak-
ing in October and staying high through December. Recent analysis showed a seasonal price differential of
approximately $200/ton between February and October (Walker 2015). In contrast, there is relatively little
price variation on the basis of quality and country of origin, and only about a 20 percent price premium for
split compared to whole pigeon peas (implying a negative return on splitting peas for export to India, given a
conversion ratio of about 0.7). Mozambique, with its harvest beginning in August and trade concentrated be-
tween September and November, is well positioned to benefit from seasonal price premiums in its exports to
India. Most imports to India from Mozambique are graded “Fair-to-Average Quality” (FAQ), and there is
little impetus to focus on improving quality to increase price premiums given unmet demand for large vol-
umes of pigeon pea during market windows offering large seasonal price premiums.
MARKETING AND VALUE ADDITION Only 24 percent of smallholder farmers market any output (Trabalho de Inquerito Agricola/Work of
Agricultural Survey (TIA) 2012, 39). These farmers rely primarily on cash sales to local intermediaries. Indus-
trial exporters, such as ETG and Olam, also purchase from FOs in addition to sourcing from independent

Mozambique Agricultural Value Chain Analysis 35
traders who source from farms and local markets. There is little contracting of production, though in some
cases industrial buyers will advance funds to trusted traders to finance purchases on their behalf. There are
also reports of a growing presence of small-scale intermediaries buying directly from the production regions
on behalf of importers in South Asia, with these small-scale players presenting some competition to the larger
industrial buyers.
There is little processing of pigeon pea beyond cleaning and drying. A recent analysis shows that there is little
benefit to splitting pigeon peas prior to export to India (the main international market) as large-scale indus-
trial processors can undertake the same operation more cost effectively (Walker 2015). Nonetheless, there is
limited processing of pigeon pea in Mozambique, particularly by ETG, which has a plant (with 7,000
MT/year capacity) in Gurue, Alta Zambezia. ETG is also in the process of investing in two larger processing
facilities—one in Nacala and one in Beira; these new plants will have a combined capacity of 60,000
MT/year. These plants are intended to add value (dehulling and splitting) to pigeon peas for export to Eu-
rope and the Middle East.
PRODUCTION
Pigeon pea has not received a strong emphasis in Mozambique’s development arena over the past decade, yet
production increased an average of 8 percent annually from 2002 through 2012, largely as a result of increases
in area cultivated. This increase in production is credited to growing demand for pigeon pea, particularly in
the Indian market, and Mozambique was estimated to be the third largest exporter of pigeon pea worldwide
in 2012 (Walker 2015).
Pigeon pea is credited as offering smallholder farmers stable yields, low production costs, and a ready and
growing market, and has relatively low labor demands. By far, the top production area is Zambezia with two
thirds of the production area, 70 percent of total production, and 45 percent of the producers; Nampula is a
distant second with only 15 percent of the production area and production volume and 27 percent of produc-
ers.
More than a million smallholders cultivate pigeon pea across Mozambique, and approximately 850,000 of
these are in USAID target provinces. Areas cultivated are small, averaging only .21 ha in USAID provinces
(MASA 2012, 2014). Very few producers cultivate more than one hectare of pigeon pea, and there are no
large-scale producers (MASA 2012). Approximately 10 percent of producers used improved seed; the use of
yield-enhancing inputs is otherwise negligible (Walker 2015). While extension service coverage is limited in
Mozambique overall, pigeon peas have a considerably higher rate of coverage (60 percent compared to only
15–20 percent for cowpea or common bean, for example) due to the concentration of production in Zambe-
zia; promotion through private sector players such as ETG; the active presence of donor-funded implement-
ers such as World Vision and DAI; and public sector extension services. (Table 2 in Appendix I presents data
on pigeon pea production in Mozambique and in the USAID target provinces.)
Globally, pigeon pea is highly sensitive and susceptible to the American cotton bollworm (ACB), although its
effects have not been pronounced to date in southern Africa due to the relatively cooler seasonal tempera-
tures that prevail when the crop flowers and matures. Given the relatively low prevalence of ACB in Mozam-
bique, and difficulty and cost of combatting it with pesticides or other means, producers commonly use non-
intervention and acceptance of minor associated losses as their most economical strategy to mitigate its ef-
fects (Walker 2015). Pigeon pea yields average only 350 kg/ha (Integrated Agricultural Survey), although do-
nor-funded projects such as AgriFUTURO are associated with increases in yields up to 483 kg/ha and corre-
sponding gross margins of $147/ha (Payongayong 2012).
Mozambique Agricultural Value Chain Analysis 36
END MARKET PRIORITIES AND CONSTRAINTS The highest potential end market for Mozambican pigeon pea is the Indian market, specifically targeting sea-
sonal exports timed to hit October–December price peaks. India’s demand for pigeon pea imports is ex-
pected to rise from its current level of 500,000 MT to 3 million MT annually by 2025 (Walker 2015, 18).
The primary constraints to expansion of exports to this market are inadequate volumes of production to meet
demand and limited awareness among farmers of pigeon pea’s market potential and conditions.
Inadequate production to meet demand
Inappropriate varieties: Hitting India’s seasonal window requires use of short- or medium-cycle
varieties (five months). With respect to varieties, there is a need to continue to develop appropriate
short- and medium-cycle varieties that are suited to the production conditions (700–900 meters
above sea level) that are common in Mozambique’s primary production areas. Current varieties, such
as the International Crops Research Institute in the Semi-Arid Tropics’ ICEAP 00040, were devel-
oped for the lowland conditions prevalent in Malawi and Tanzania. Development of appropriate va-
rieties and production of adequate foundation seed has been proposed as a key area of intervention
for the Tropical Legumes II project’s next phase (Walker 2015).
Poor farmer access to quality seed: Along with adequate foundation and breeder seeds, strategies
for the commercialization of improved seed need to be developed, with market actors leading the
way to promote and market these improved seeds to farmers.
Limited awareness of market potential and conditions
Most farmers who sell pigeon pea market to intermediaries at the farm gate. Given the broad supply
base for pigeon pea production and the recommended strategy (discussed below) of “extensifica-
tion,” increasing farm-level investment in pigeon pea production will require increasing awareness
among a large number of smallholder farmers on the potential and conditions of the pigeon pea mar-
ket. For example, awareness could be raised on the timing of seasonal price windows and require-
ments to reach them.
UPGRADING STRATEGIES Extensification – Focus on increasing smallholder production through extensification, particularly in the
Nacala and Beira corridors, which are well positioned for product aggregation and export. Extensification
means a focus on increasing the number of farmers producing pigeon peas, as well as the number of hectares
under production by current farmers. Successful extensification also requires investment to improve roads
and infrastructure. Walker (2015) highlights the fact that expansion of pigeon pea production in Mozambique
has been a result of increasing numbers of farmers producing pigeon pea and increasing areas of production
devoted to pigeon pea, rather than to increasing pigeon pea yields. He also points out that pigeon pea produc-
tion is relatively stable under smallholder conditions, despite the use of otherwise yield-enhancing inputs such
as fertilizer. Thus, he encourages an “extensification strategy” of increasing the number of producers growing
pigeon pea and the area under pigeon pea cultivation, rather than promoting intensification of production
aimed at increasing yields.
Improve seed supply – Focus on the medium-duration (150–180 days) varieties ICEAP 00554 and 00557 to
ensure that production reaches the market window among other benefits. Leverage international agricultural
research centers and USAID partners’ activities to partner with market actors working to strengthen the avail-
ability of quality seed, including linking farmers with buyers and input dealers to increase access to seeds and
Mozambique Agricultural Value Chain Analysis 37
markets. Leverage donor initiatives such as SNV that have worked with private sector players such as ETG
and Olam to strengthen the pigeon pea value chains.
Mozambique Agricultural Value Chain Analysis 38
COWPEA RELEVANCE TO USAID OBJECTIVES Smallholders are extensively involved in cowpea production, largely as a crop for their own household con-
sumption. Nearly half of the small- and medium-scale farmers in the USAID target provinces cultivate cow-
pea on a yearly basis. Cowpeas are a particularly important crop for women-headed households—54 percent
of households planting cowpea are women-headed, despite the fact that only 24 percent of households are
woman-headed nationally. Nationally, only about 9 percent of smallholders sell any of the cowpea that they
produce (TIA 2012, 39). It is unclear, and merits investigation, as to what extent women-headed households
sell or consume cowpeas or their leaves.
Cowpeas are important to nutrition and food security: the legumes provide protein, and their leaves are often
harvested for fresh consumption during the growing season (in some locales, cowpeas are more valued for
their greens than their legumes). Cowpeas are drought tolerant and nitrogen fixing. Furthermore, their short-
duration production and early-maturing properties lend them well to integration in smallholder farmer inter-
cropping systems as their production can be timed to when labor is less constrained and when vulnerability to
climatic variation is reduced.
Market-driven interventions in the cowpea value chain have limited potential to promote USAID objectives.
Overall, cowpeas are considered to be a “food security” or subsistence crop and are not perceived by either
large private sector actors or industry expert key informants to have dynamic market demand. Although the
market is expanding, there are no easily identifiable market players ready to exert a “demand pull” that could
help to drive emergence of a more efficient market or uptake of productivity-improving inputs.
VALUE CHAIN STRUCTURE AND FUNCTIONS Figure 8 (on page 30) shows a map of the pigeon pea value chain in Mozambique.
END MARKETS There is a lack of data available on cowpea markets, and cowpea exports are not tracked separately from
beans. However, major buyers report small volumes of exports to Asia (e.g., India, Indonesia, Philippines,
Malaysia) as well as some recent sales to the World Food Programme for food aid programs in Angola and
Sudan.
MARKETING AND VALUE ADDITION Cowpeas are sold at the farm gate to small-scale market intermediaries. It then passes through informal mar-
ket channels and is aggregated by medium- and large-scale buyers with buying centers and/or warehouses in
rural areas, district centers, and urban areas. Cowpea is sold shelled, as grain, with little value added. Traders
interviewed expressed the opinion that the quality of Mozambican cowpeas was inferior to that of neighbor-
ing countries as it is not uniform, exhibits pest damage, and contains contaminants. Major industrial buyers
that have limited operations with cowpea include ETG, Olam, Sunsmile, V&M, and Dengo Commercial.
PRODUCTION
Cowpea production increased by about 30,000 MT (about 40 percent) between 2006 and 2014 (Walker
2016a). These increases have been attributed to improved productivity as the area cultivated has largely re-
mained stable. Approximately half of small- and medium-scale farmers produce cowpea on an annual basis,
though areas cultivated tend to be very low at only one-fifth of a hectare and yields are likewise low averaging
only 275 kg/ha. The average household only produces about 56 kg of cowpea and only about 10 percent of
Mozambique Agricultural Value Chain Analysis 39
the product is marketed. (Table 3 in Appendix I presents data on cowpea production in Mozambique and the
USAID target provinces.)
While cowpea production is widespread throughout Mozambique, Nampula province is responsible for about
25 percent of production and 33 percent of output and is also the location that has seen the most rapid
productivity gains over the past decade; this is attributed to Nampula being the central location for cowpea
research and extension (Walker 2016a). Cowpeas are mainly grown in sandy coastal areas and lowlands, and
they do well on poor marginal soils such as seen in the northern coastal provinces. In 2009, only 11 percent
of Mozambique’s cowpea area was planted with improved varieties. IT 18, developed by IITA, was the lead-
ing variety responsible for 8 percent of area planted to cowpea (Walker 2016a). Meanwhile, only 15–20 per-
cent of farmers receive extension services relating to cowpea (Walker 2015). Pests are a major issue affecting
cowpea: it is more heavily attacked by pests than any other food crop in the country (Walker 2016a). Overall,
yields are low, averaging only 275 kg/ha nationally, just over 300 kg/ha in USAID (AgriFUTURO and
DFAP) intervention areas (Payongayong 2012) and barely surpassing 400 kg/ha in Nampula, the most pro-
ductive cowpea-producing area of Mozambique (Walker 2016a). Low yields, combined with low prices (about
50 percent of common bean prices), imply relatively low profitability for cowpeas, with gross margins esti-
mated at only about $90/ha (Payongayong 2012).
END MARKET PRIORITIES AND CONSTRAINTS Overall, cowpea is not perceived as having dynamic market demand. “Arguably, the private sector is less in-
terested in cowpea than in any other food crop in the USAID Feed the Future (FTF) portfolio,” noted report
authors Walker, Cunguara, and Donovan (Walker 2016). End markets include both domestic and export mar-
kets; however, there is a lack of dynamism in the market to motivate large-scale industrial buyers who could
act as demand drivers.
From a markets/demand-driven perspective, the primary constraint to expanded production and trade in
cowpea is the lack of private sector engagement due to weak overall demand, which limits incentives for
farmers and other value chain players to invest in productivity-enhancing inputs and practices.
From a production standpoint, cowpea faces three primary constraints: lack of appropriate varieties, limited
availability of quality planting material, and pest losses. Possible solutions to these constraints are discussed
below.
UPGRADING STRATEGIES While not a strong candidate for a market-driven development initiative, cowpea is an important subsistence
crop with nutritional benefits as well as nitrogen-fixing properties. Cowpea may be considered as an inte-
grated complementary crop to more commercially oriented ones.
Upgrading strategies for cowpeas could look to develop and expand existing investments in the value chain.
For instance, IITA has led several donor-funded initiatives focused on the development of appropriate varie-
ties and increasing the availability of quality seed. These include the Soybean and Cowpea project and the
Tropical Legumes project, which targeted cowpeas (among other legumes) and led to the selection and release
of several high-yielding, drought-tolerant varieties; multiplication and distribution of these varieties; and the
development of alternative seed delivery models, such as village seed banks.
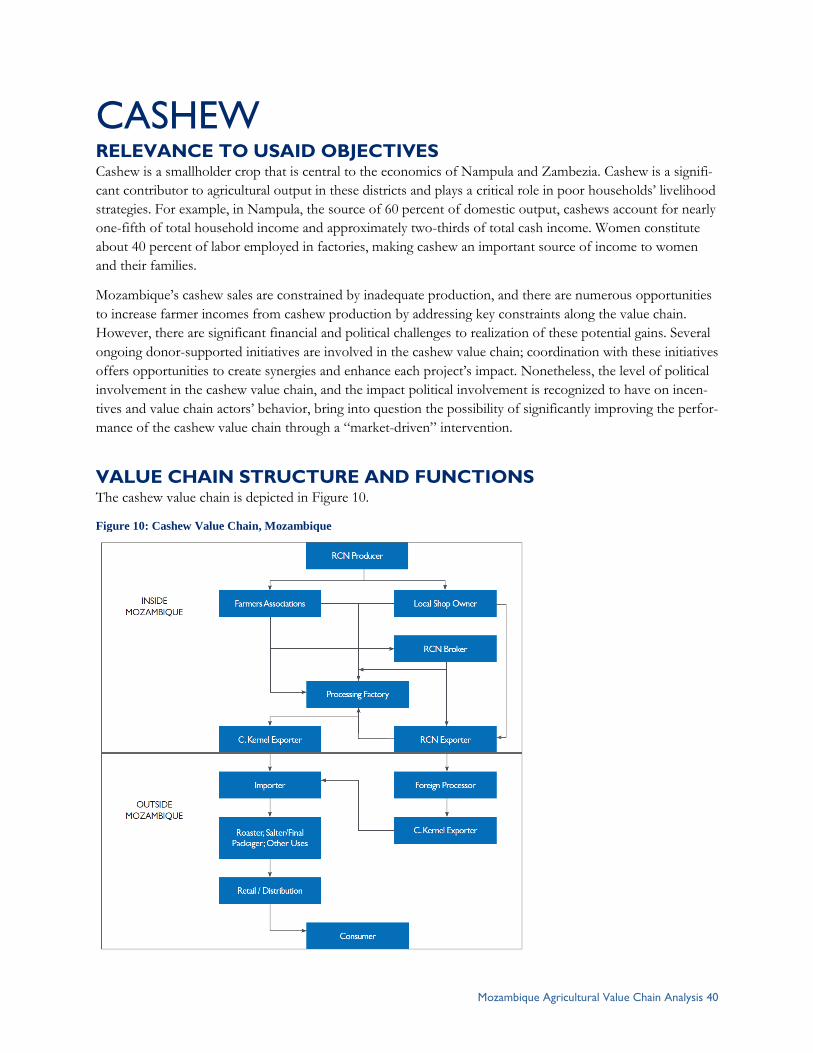
Mozambique Agricultural Value Chain Analysis 40
CASHEW RELEVANCE TO USAID OBJECTIVES Cashew is a smallholder crop that is central to the economics of Nampula and Zambezia. Cashew is a signifi-
cant contributor to agricultural output in these districts and plays a critical role in poor households’ livelihood
strategies. For example, in Nampula, the source of 60 percent of domestic output, cashews account for nearly
one-fifth of total household income and approximately two-thirds of total cash income. Women constitute
about 40 percent of labor employed in factories, making cashew an important source of income to women
and their families.
Mozambique’s cashew sales are constrained by inadequate production, and there are numerous opportunities
to increase farmer incomes from cashew production by addressing key constraints along the value chain.
However, there are significant financial and political challenges to realization of these potential gains. Several
ongoing donor-supported initiatives are involved in the cashew value chain; coordination with these initiatives
offers opportunities to create synergies and enhance each project’s impact. Nonetheless, the level of political
involvement in the cashew value chain, and the impact political involvement is recognized to have on incen-
tives and value chain actors’ behavior, bring into question the possibility of significantly improving the perfor-
mance of the cashew value chain through a “market-driven” intervention.
VALUE CHAIN STRUCTURE AND FUNCTIONS The cashew value chain is depicted in Figure 10.
Figure 10: Cashew Value Chain, Mozambique
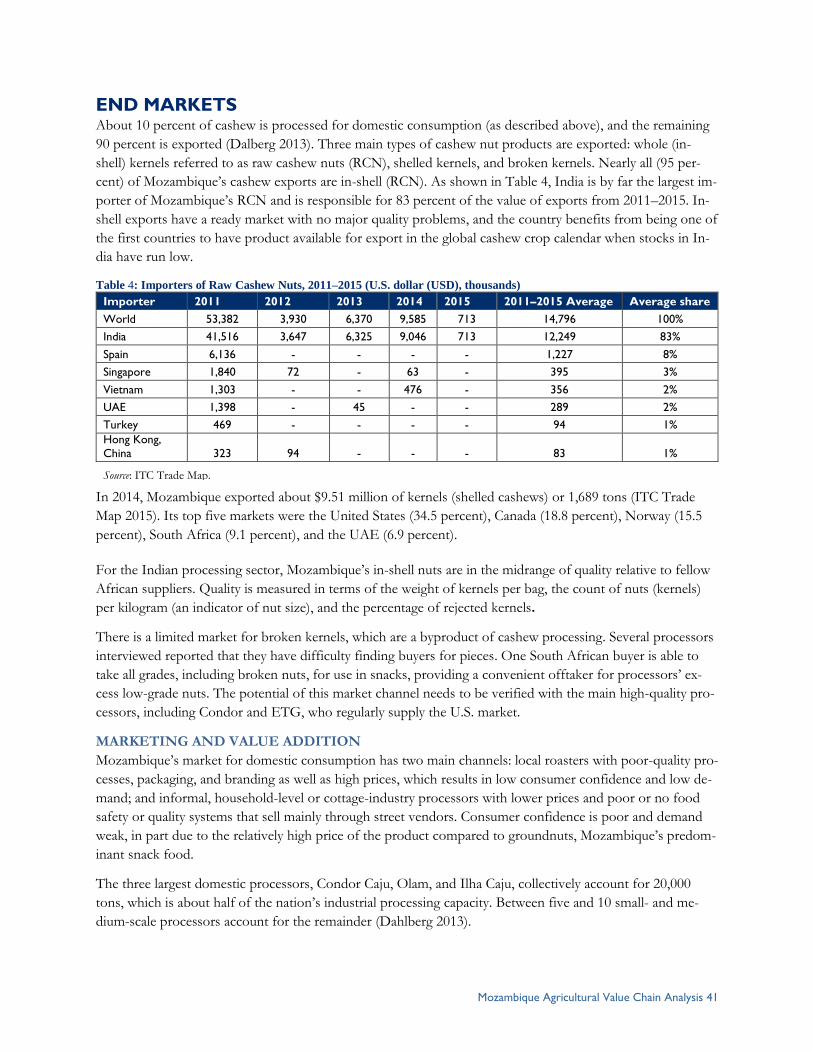
Mozambique Agricultural Value Chain Analysis 41
END MARKETS About 10 percent of cashew is processed for domestic consumption (as described above), and the remaining
90 percent is exported (Dalberg 2013). Three main types of cashew nut products are exported: whole (in-
shell) kernels referred to as raw cashew nuts (RCN), shelled kernels, and broken kernels. Nearly all (95 per-
cent) of Mozambique’s cashew exports are in-shell (RCN). As shown in Table 4, India is by far the largest im-
porter of Mozambique’s RCN and is responsible for 83 percent of the value of exports from 2011–2015. In-
shell exports have a ready market with no major quality problems, and the country benefits from being one of
the first countries to have product available for export in the global cashew crop calendar when stocks in In-
dia have run low.
Table 4: Importers of Raw Cashew Nuts, 2011–2015 (U.S. dollar (USD), thousands)
Importer 2011 2012 2013 2014 2015 2011–2015 Average Average share
World 53,382 3,930 6,370 9,585 713 14,796 100%
India 41,516 3,647 6,325 9,046 713 12,249 83%
Spain 6,136 - - - - 1,227 8%
Singapore 1,840 72 - 63 - 395 3%
Vietnam 1,303 - - 476 - 356 2%
UAE 1,398 - 45 - - 289 2%
Turkey 469 - - - - 94 1%
Hong Kong,
China 323 94 - - - 83 1%
In 2014, Mozambique exported about $9.51 million of kernels (shelled cashews) or 1,689 tons (ITC Trade
Map 2015). Its top five markets were the United States (34.5 percent), Canada (18.8 percent), Norway (15.5
percent), South Africa (9.1 percent), and the UAE (6.9 percent).
For the Indian processing sector, Mozambique’s in-shell nuts are in the midrange of quality relative to fellow
African suppliers. Quality is measured in terms of the weight of kernels per bag, the count of nuts (kernels)
per kilogram (an indicator of nut size), and the percentage of rejected kernels.
There is a limited market for broken kernels, which are a byproduct of cashew processing. Several processors
interviewed reported that they have difficulty finding buyers for pieces. One South African buyer is able to
take all grades, including broken nuts, for use in snacks, providing a convenient offtaker for processors’ ex-
cess low-grade nuts. The potential of this market channel needs to be verified with the main high-quality pro-
cessors, including Condor and ETG, who regularly supply the U.S. market.
MARKETING AND VALUE ADDITION
Mozambique’s market for domestic consumption has two main channels: local roasters with poor-quality pro-
cesses, packaging, and branding as well as high prices, which results in low consumer confidence and low de-
mand; and informal, household-level or cottage-industry processors with lower prices and poor or no food
safety or quality systems that sell mainly through street vendors. Consumer confidence is poor and demand
weak, in part due to the relatively high price of the product compared to groundnuts, Mozambique’s predom-
inant snack food.
The three largest domestic processors, Condor Caju, Olam, and Ilha Caju, collectively account for 20,000
tons, which is about half of the nation’s industrial processing capacity. Between five and 10 small- and me-
dium-scale processors account for the remainder (Dahlberg 2013).
Source: ITC Trade Map.
Mozambique Agricultural Value Chain Analysis 42
Domestic processors vary in terms of the quality of processed cashew that they produce, with implications
for their access to more demanding export markets. Donor-funded initiatives (such as AgriFUTURO) have
aimed to help cashew processors achieve export certifications that are required to access more demanding
and profitable export markets. The top seven northern Mozambican processors have been able to adjust their
processes to respond to quality, food safety, and certification (e.g., Hazard Analysis Critical Control Point
(HACCP)) demands and are also aiming for organic certification.
Farmers harvest cashew over a three-month period, selling it to itinerant traders or bringing it to collection
stations that serve as area processors.
PRODUCTION
Nearly 1.4 million farmers, 95 percent of whom are smallholders, produce cashews in Mozambique (Tech-
noServe 2013). Nampula and northern Zambezia are the two most important production areas: 60 percent of
farmers living in Nampula produce cashews, accounting for 33 percent of the country’s producers and 33
percent of the trees in production; while 35 percent of the farmers in Zambezia produce cashew and account
for 21 percent of trees in production (MASA 2012, 2014). Nampula is the most productive province, ac-
counting for half of sales of raw cashew nut recorded in the country and an even larger share of processed
cashew nuts (Große-Rüschkamp et al. 2010).
Smallholders often intercrop low-density cashew stands with legume crops, including beans, sesame, and
groundnuts, that return nitrogen and other nutrients to the soil. Domestic cashew output is well below its po-
tential due to the predominance of orchards with low numbers of old and neglected trees that have poor
yields and produce lower-quality output. The average productivity per tree is about 3 kg, with a median of
only 1.6 kg/tree. This low productivity is the result of limited renewal (replanting or pruning) of trees and
minimal use of fertilizer, spraying, or other yield-enhancing management options. Farmers that do apply ferti-
lizer and spray their trees have average yields of 4.5 kg/tree.
The government cashew institution INCAJU is funded through a tax on exports of unprocessed cashew and
is deeply involved in the provision of inputs and support services to cashew producers, including the produc-
tion and distribution of seedlings and spraying services at no cost to farmers. Institutional capacity to meet
demand for these services is limited, however, and only a small proportion of farmers actually receive them.
Meanwhile, the subsidized nature of these services depresses farmers’ willingness to pay for them on a com-
mercial basis, inhibiting the commercial sector to supply these needs.
END MARKET PRIORITIES AND CONSTRAINTS Efforts to strengthen the competitiveness of the cashew value chain should focus on increasing exports of
quality RCN, as well as continuing to support the industrial processing industry’s ability to meet international
market requirements for shelled cashew.
There is strong and growing global demand for good-quality cashew in several markets, including the United
States, Europe, Vietnam, and India. These markets are demanding in terms of product quality and hygiene,
and they increasingly seek and are willing to pay a premium for product traceability. Large-scale exporters in-
terviewed during fieldwork were largely aware of buyers’ demands in these markets. They also perceived the
United States to offer a more attractive market than the European Union, with better payment terms, slightly
higher prices, and a pragmatic approach to business. In their opinion, European Union-based buyers tend to
be very process oriented. Norway was cited as an exception to this rule and is an active and collaborative part-
ner of a major processor in Nampula with a strong quality and compliance focus.
Mozambique Agricultural Value Chain Analysis 43
Red River Foods, the largest U.S. nut, dried fruit, and snack firm, as well as the largest U.S. importer of cash-
ews, purchases kernels from Mozambique. They are seeking to source more from Africa as a result of buyer
pressure from retailers such as Costco. Red River expects to increase their supplies from Mozambique as a
result of new factories and improved processes at ETG and Condor, resting on several preconditions:
Whole kernels only (no “brokens”)
Prices need to be competitive with Vietnam and India, currently their main suppliers
Shipments need to be compliant with U.S. Food and Drug Administration requirements
Shipments must be of the same quality as the samples sent by the supplier (this has not always been the case)
There are a number of important constraints in realizing these opportunities, chief among them being a policy
environment that is unfavorable in many respects and inadequate production to meet demand. Other con-
straints include a lack of finance, particularly at the farm level; high costs along the value chain; and poor pro-
cessing efficiency and quality.
Policy
The cashew industry is heavily politicized, a factor that is perceived to have impeded some improve-
ments in industry performance by inhibiting farmers’ willingness to pay for productivity-enhancing
inputs and services, raising costs, and depressing farm-level prices.
Market distortions such as free cashew seedlings and subsidized spraying have reduced producers’
inclination to invest in upgrades and hindered the success of private sector input providers.
Government subsidies are funded by an 18 percent ad valorem levy on in-shell exports, representing
an added burden on domestic producers upon sale. Increased domestic processing and decreased in-
shell exports have reduced this revenue, creating a gap in input purchasing funds since farmers are
currently not inclined to pay for them.
The 18 percent tax on in-shell exports is sometimes cited as an example of a policy intervention that
skews incentives in the cashew market and reduces overall sector performance.
Inadequate Production to Meet Demand
Low yields and inadequate investment severely constrain national production of cashew: yields aver-
age 3kg/tree compared to a potential yield of up to 10–15 kg/tree during prime producing periods
(Dalberg 2013).
Subsidized provision of inputs (such as seedlings) and services (such as spraying) by INCAJU inhibits
development of a commercial sector to supply these services. Meanwhile, INCAJU does not have the
capacity to meet needs for these services, so that demand is underserved by available supply.
Cashew farmers typically invest little in their cashew plantations and are more accurately referred to
as “collectors” of cashew rather than “farmers.” Most trees are large and overgrown as they are not
pruned, and there is a large incidence of disease (34 percent of trees nationally are affected by the
most severe tree disease, oidium), causing large yield losses. Few farmers—only 5 percent nationally
and less than 10 percent in any one province—spray against oidium, a fungus that damages cashew
flowers and reduces yields. This lack of investment is attributed to heavy government involvement in
the industry, depressing farmers’ willingness to pay commercial rates for these same inputs and ser-
vices while failing to reach a significant proportion of farmers who need these services. The
Mozacaju project (see TechnoServe and U.S. Department of Agriculture (USDA)), which works in
Mozambique Agricultural Value Chain Analysis 44
Nampula, Cabo Delgado, and Zambezia, estimates that farmers could double their net incomes
through application of a basic technology package of fertilizer and spraying.
Low output and yields are also referred to as a “socioeconomic” issue as high levels of poverty and
food insecurity and low levels of literacy limit the effectiveness of interventions aimed at promoting
production practices and inputs. These interventions have the potential to increase yields, while also
inhibiting investments (such as replanting of trees, which takes five to seven years to produce) that
offer longer-term payoffs in favor of more short term-oriented investments with more immediate
(though lower over the life of the investment) payoffs.
High Costs along the Value Chain
Processors face supply constraints, and available product may fall below installed capacity and de-
mand for larger processors at times. This negatively impacts processors’ economies of scale and bar-
gaining power. The processing industry faces a shortage of raw material for processing.
Low output at the farm level leads to high costs for harvesting, aggregation, bulking, and sorting.
There is a lack of finance, particularly for investment in production at the smallholder level.
Processing Efficiency and Quality
Low yields and continued exports of in-shell nuts have resulted in a chronic shortage of raw material
for domestic processing, which limits economies of scale.
Mozambique’s cashew processors have mixed results in terms of quality of output. Recent initiatives,
such as AgriFUTURO, have sought to address these issues by facilitating the upgrades needed to im-
prove quality and obtain industrial practice certifications such as HACCP.
UPGRADING STRATEGIES A strategy to strengthen the cashew value chain should be focused on improving the policy environment and
increasing farm production of cashew by increasing smallholder access and utilization of inputs and services
and promoting medium-scale, block-style plantations. Complementary activities can be used to improve the
availability of finance and upgrade industrial processors’ ability to comply with importing market require-
ments.
Policy – Support should focus on privatization of cashew inputs and support services; the development of
policy; and capacity-supporting, market-based provision of these inputs and services. These initiatives could
build on the recent experiences of NGOs and donor programs in developing private sector provision of in-
secticide spraying services, an industry which has relatively low entry costs and high potential returns (see
MEDA 2011).
Production
Investigate options and the feasibility of medium-scale plantation schemes such as block-style planta-
tions (30 hectares minimum). These plantations, proposed by MEDA, can incorporate multiple
smallholder plots while improving the efficiency of service delivery and coordination with buyers and
other value chain players. Results of an African Cashew Initiative (ACI) analysis (Große-Rüschkamp
et al. 2010) demonstrated that new plantations have a high rate of return for smallholders (68 per-
cent).
Evaluate the financial profitability of basic input and service packages for smallholders compared to
alternative investments. An ACI analysis (Große-Rüschkamp et al. 2010) posits that a basic input and
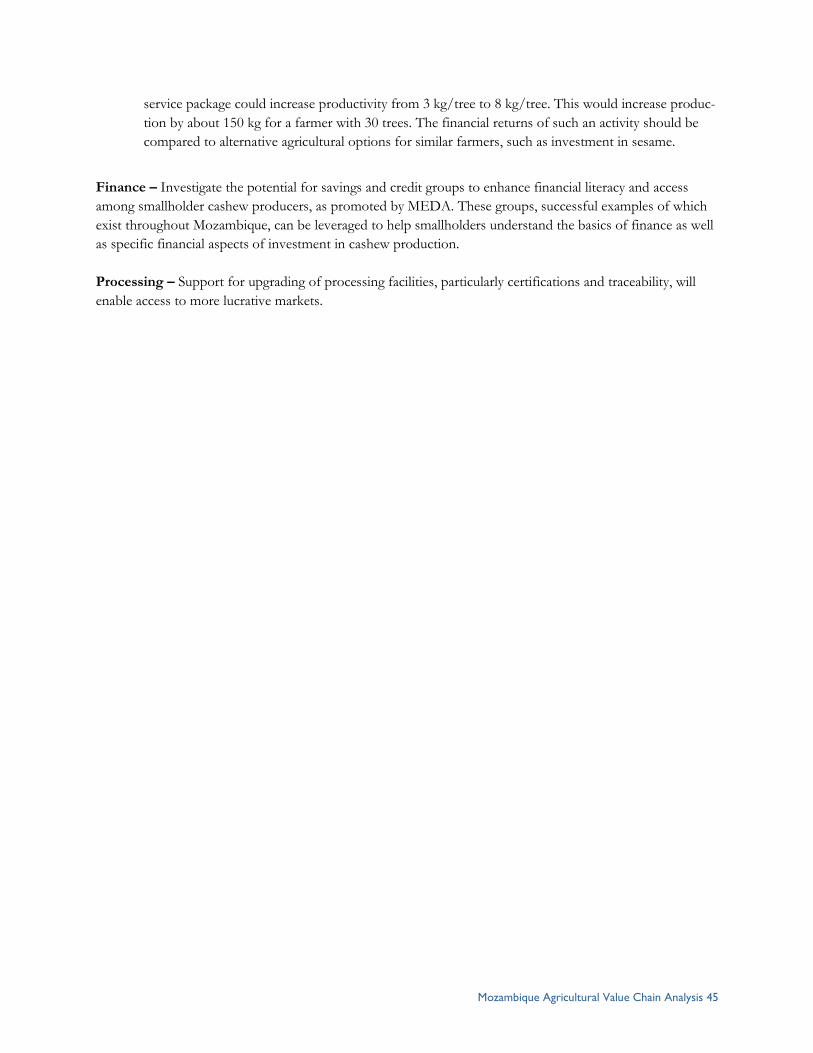
Mozambique Agricultural Value Chain Analysis 45
service package could increase productivity from 3 kg/tree to 8 kg/tree. This would increase produc-
tion by about 150 kg for a farmer with 30 trees. The financial returns of such an activity should be
compared to alternative agricultural options for similar farmers, such as investment in sesame.
Finance – Investigate the potential for savings and credit groups to enhance financial literacy and access
among smallholder cashew producers, as promoted by MEDA. These groups, successful examples of which
exist throughout Mozambique, can be leveraged to help smallholders understand the basics of finance as well
as specific financial aspects of investment in cashew production.
Processing – Support for upgrading of processing facilities, particularly certifications and traceability, will
enable access to more lucrative markets.

Mozambique Agricultural Value Chain Analysis 46
BANANA RELEVANCE TO USAID OBJECTIVES Banana is a crop frequently produced by smallholders throughout Mozambique for home consumption or
sale in local markets. Although it is not a staple food, as it is in other southern and East African countries, it
does provide important nutrients and micronutrients. Continuous production throughout the year makes ba-
nana important to food security as they can grow when other crops are not in season.
Commercial activity in banana markets offers limited income potential for smallholder farmers and is not rec-
ommended as a priority value chain for a smallholder-oriented development intervention. Domestic markets
are easily glutted and have high price variability given the high perishability of bananas. Smallholder banana
farmers are concentrated in Zambezia and Nampula where there is little irrigation, and soils tend to be infer-
tile. Banana plants extract high volumes of nutrients from the soil, making fertilization critical. Export mar-
kets—both regional and overseas—have quality standards that smallholders would have difficulty meeting
without extensive and costly technology transfer including irrigation, improved planting materials, and ferti-
lizer (particularly in areas where soils are at risk of or are already exhausted). Minimum commercial scale of
production for bananas is estimated at 5 ha, and the industry is afflicted with diseases such as Fusarium wilt,
black Sigatoka, and Panama disease.
There is a common consensus that smallholders do not have high potential to benefit from investment in ba-
nana markets. In addition to production-side constraints, the market themselves are not attractive. Local do-
mestic markets are relatively low value, and the high perishability of banana can lead to large price move-
ments when there are supply gluts. Export markets are better able to absorb large volumes of bananas, but
smallholders are poorly equipped to meet their quality standards in a cost-effective manner. “Mozambique is
building a commercial scale sector oriented at export markets, but this presents little short-medium term op-
portunity for smallholder farmers.” (BMGF 2007, 8)
VALUE CHAIN STRUCTURE AND FUNCTIONS Figure 11 depicts the banana value chain.
Mozambique Agricultural Value Chain Analysis 47
Figure 11: Banana Value Chain (adapted from Dalberg 2013)
END MARKETS
Mozambique’s most important export markets are South Africa (69 percent of export value), followed by the
Middle East: Saudi Arabia with 17 percent of export value while the UAE, Iran, Kuwait, and Qatar also im-
porting Mozambican bananas, as shown in Table 5.
Table 5: Mozambican Exports of Banana and Plantain, 2012–2015
Importers Average value 2012-2015 Average export share
World 29,764 100%
South Africa 20,526 69%
Saudi Arabia 5,185 17%
UAE 1,294 4%
Iran 1,285 4%
Kuwait 784 3%
Qatar 279 1%
MARKETING AND VALUE ADDITION
Traders collect bananas from smallholders at the farm and handle storage, ripening, and packing for sale. Ba-
nana ripening is the main post-farm-gate value-added activity. While small-scale producers can provide out-
grower services to large plantations, only a few large firms are developing contract farming initiatives. These
initiatives typically facilitate smallholder access to inputs, aggregation, and transport costs, and accruing at-
tendant economics of scale as a result (Dalberg 2013). Larger farms market directly for export and retail.
PRODUCTION
The commercial banana industry is anchored around large-scale plantations in Nampula, Metuchira, and
southern Mozambique, the largest of which is Matanuska in Nampula. Other large banana companies include
Source: ITC Trade Map.
Mozambique Agricultural Value Chain Analysis 48
Jacaranda in Nampula and ENICA. These plantations average 100 ha but can be as large as 6,000 ha (BMGF
2007). They are situated for easy access to ports and rely on input-intensive production methods, including
irrigation, yielding 40–60 MT/ha of export-quality bananas. Plantations expand into fertile, level land that is
uncultivated.
In contrast to large-scale plantations, smallholder banana production is labor intensive, uses few inputs, and is
often intercropped with other crops. Yields are only about 20–30 percent of their potential (11 MT/ha versus
a potential of 30–50 MT/ha).
In addition to their low productivity, smallholder-produced bananas do not typically meet export standards.
For smallholders, the current cost of post-harvest methods required to meet such standards is prohibitive.
Start-up costs are also high, representing a barrier to entry. As such, many smallholders cannot access higher-
value markets. Large commercial farms have realized more competitive prices and can invest in quality up-
grades, helping them sell into high-value markets.
ENDMARKET PRIORITIES AND CONSTRAINTS While smallholders are not considered to have high potential to compete or thrive in mainstream export mar-
kets for banana, they may have some potential to participate in domestic and global niche markets, such as
small finger bananas and plantains (Harris 2010). Supporting farmer group investments in packhouses, stor-
age, ripening, and marketing also stands to improve smallholder returns, as the majority of value addition oc-
curs past the farm (Global Development Solutions 2005).
The following issues constrain smallholder participation:
Inappropriate production systems to support low-cost production of high-quality banana – Small-
holder banana farmers are concentrated in Zambezia and Nampula where there is little irrigation, and soils
tend to be infertile. Banana plants extract high volumes of nutrients from the soil, making fertilization critical.
Export markets—both regional and overseas—have quality standards that smallholders would have difficulty
meeting without extensive and costly technology transfer including irrigation, improved planting materials,
and fertilizer (particularly in areas where soils are at risk of or are already exhausted). Minimum commercial
scale of production for bananas is estimated at 5 ha.
Disease and consequent high risk of financial loss – The most common diseases include Panama disease,
Fusarium wilt, and black Sigatoka.
Low yields and inconsistent quality
Need for improved varieties, irrigation, fertilizer
Poor post-harvest management in bananas leads to low quality and low market prices. Proper infra-structure has a high cost and is prohibitive for smallholders.
Weak infrastructure increases costs and reduces competitiveness of Mozambican banana sector –
Port inefficiencies lead to delays and increase the costs of banana exports. For example, Matanuska exports
5,000 containers of bananas a year through the Nacala port; however, the port lacks refrigeration so they have
to send refrigerated containers to the farms where they sit loaded until it is time to ship. This entails an extra
round trip for the refrigerated containers, substantially increasing costs.
UPGRADING STRATEGIES
Mozambique Agricultural Value Chain Analysis 49
Although some USAID-funded initiatives, such as AgriFUTURO, have worked to incorporate smallholder
farmers into the banana value chain, the multitude of issues constraining their entry into and competitiveness
in export markets for banana, as well as the low-value and highly variable nature of the domestic market, ar-
gue for exclusion of banana as a priority USAID value chain.

Mozambique Agricultural Value Chain Analysis 50
VEGETABLES RELEVANCE TO USAID OBJECTIVES Vegetables are produced by a significant share of Mozambican farmers, though they typically (and with some
exceptions) sell relatively small shares of what they produce. Vegetables offer significant income potential to
smallholder farmers, with gross margins of MZN 85,000 per hectare reported by ACDI/VOCA (2016), par-
ticularly for those that can access more demanding markets. However, barriers to entry to those markets tend
to be high. Vegetables also offer a rich array of major and micronutrients and thus have potential to help miti-
gate the high incidence of malnutrition in Mozambique.
Mozambique imports more than $1 million in vegetables monthly, largely from South Africa, and domestic
demand for vegetables is expected to grow from four- to six fold between 2000 and 2030 (Cairn 2012), offer-
ing a significant market opportunity. Smallholders can benefit economically from participating in vegetable
markets, although their engagement in these markets must be carefully structured and coordinated if these
potential gains are to be realized. There are opportunities to leverage recent and current development initia-
tives to develop smallholder-inclusive vegetable value chains, specifically targeting higher-value domestic mar-
kets. Women are under-represented in the vegetable value chain, particularly from a marketing standpoint:
while women head 24 percent of households nationally and 25 percent of households producing vegetables,
only 16 percent of vegetable-selling households are female-headed (Cairns 2012). Tete and Manica are among
the most important vegetable-producing provinces in Mozambique.
VALUE CHAIN STRUCTURE AND FUNCTIONS The Mozambican vegetable value chain comprises two largely distinct market segments: the domestic tradi-
tional vegetable market driven by localized production and consumption of mostly amaranth, cowpea, kale,
pumpkin, and cabbage; and the high-value “exotic” vegetable market (including tomato, onion, potato, green
beans, and others), which is focused on production for domestic high-value markets such as restaurants, tour-
ist establishments, and supermarkets. The value chains for these two segments have different market prefer-
ences and requirements, operate on different spatial scales, and have different potential advantages for small-
holder producers.
Nationally, 36 percent of farmers produce vegetables and 8 percent of farmers sell vegetables (Cairns 2012)
but only 16 percent of producers grow fresh produce crops exclusively. Smallholders constitute 83 percent of
vegetable producers. “Emerging commercial,” medium-scale farmers are responsible for only 3 percent of
vegetable areas, while large-scale farmers are responsible for the remainder.
Most vegetables are produced alongside maize crops either as an intercrop, perimeter crop, or short season
crop. The vast majority of producers cultivate .25 ha of vegetables and water it by hand or use manually-man-
aged flood irrigation. Land is tilled manually with a hoe, leading to significant soil depletion and erosion. Most
growers use limited or no organic or synthetic fertilizers or crop protection products, although commercially
oriented producers, in contrast, sometimes apply excessive amounts of pesticides to the point of raising con-
cerns about the environmental and human health impacts (Cairns 2012). Tete and Manica are among the
most important vegetable-producing provinces in Mozambique, with 26 percent and 21 percent of land under
vegetable production, respectively (ACDI/VOCA).
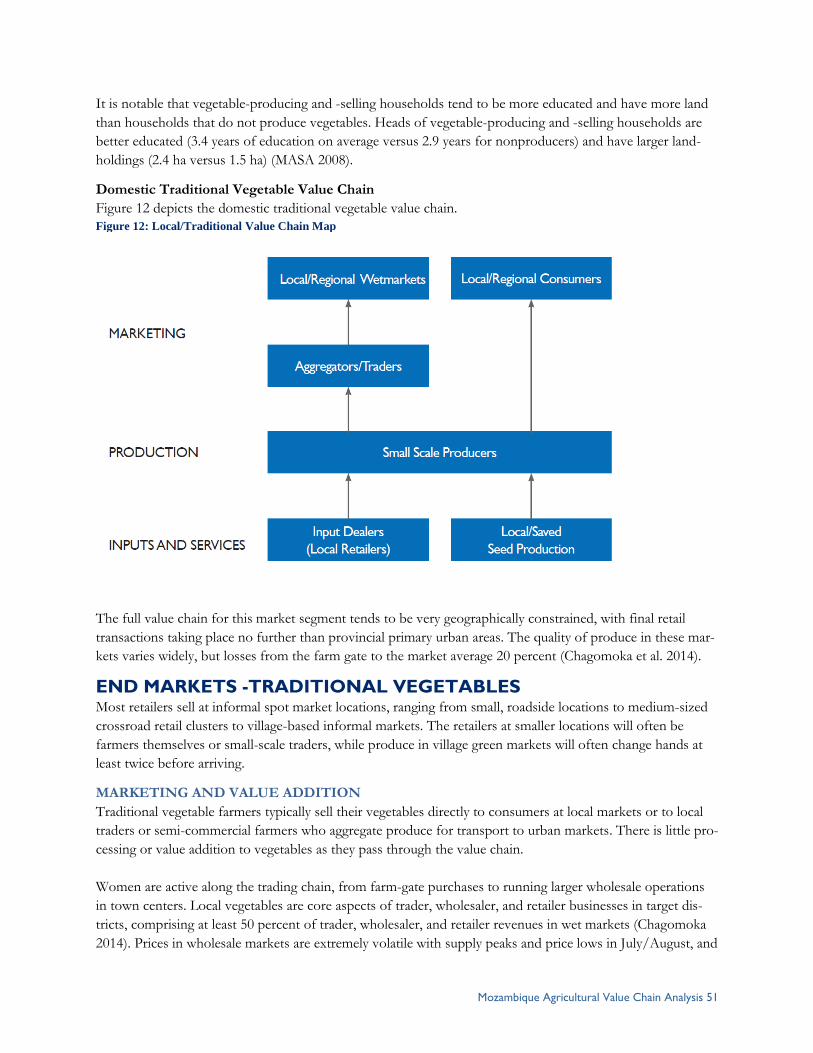
Mozambique Agricultural Value Chain Analysis 51
It is notable that vegetable-producing and -selling households tend to be more educated and have more land
than households that do not produce vegetables. Heads of vegetable-producing and -selling households are
better educated (3.4 years of education on average versus 2.9 years for nonproducers) and have larger land-
holdings (2.4 ha versus 1.5 ha) (MASA 2008).
Domestic Traditional Vegetable Value Chain
Figure 12 depicts the domestic traditional vegetable value chain.
Figure 12: Local/Traditional Value Chain Map
The full value chain for this market segment tends to be very geographically constrained, with final retail
transactions taking place no further than provincial primary urban areas. The quality of produce in these mar-
kets varies widely, but losses from the farm gate to the market average 20 percent (Chagomoka et al. 2014).
END MARKETS -TRADITIONAL VEGETABLES Most retailers sell at informal spot market locations, ranging from small, roadside locations to medium-sized
crossroad retail clusters to village-based informal markets. The retailers at smaller locations will often be
farmers themselves or small-scale traders, while produce in village green markets will often change hands at
least twice before arriving.
MARKETING AND VALUE ADDITION
Traditional vegetable farmers typically sell their vegetables directly to consumers at local markets or to local
traders or semi-commercial farmers who aggregate produce for transport to urban markets. There is little pro-
cessing or value addition to vegetables as they pass through the value chain.
Women are active along the trading chain, from farm-gate purchases to running larger wholesale operations
in town centers. Local vegetables are core aspects of trader, wholesaler, and retailer businesses in target dis-
tricts, comprising at least 50 percent of trader, wholesaler, and retailer revenues in wet markets (Chagomoka
2014). Prices in wholesale markets are extremely volatile with supply peaks and price lows in July/August, and
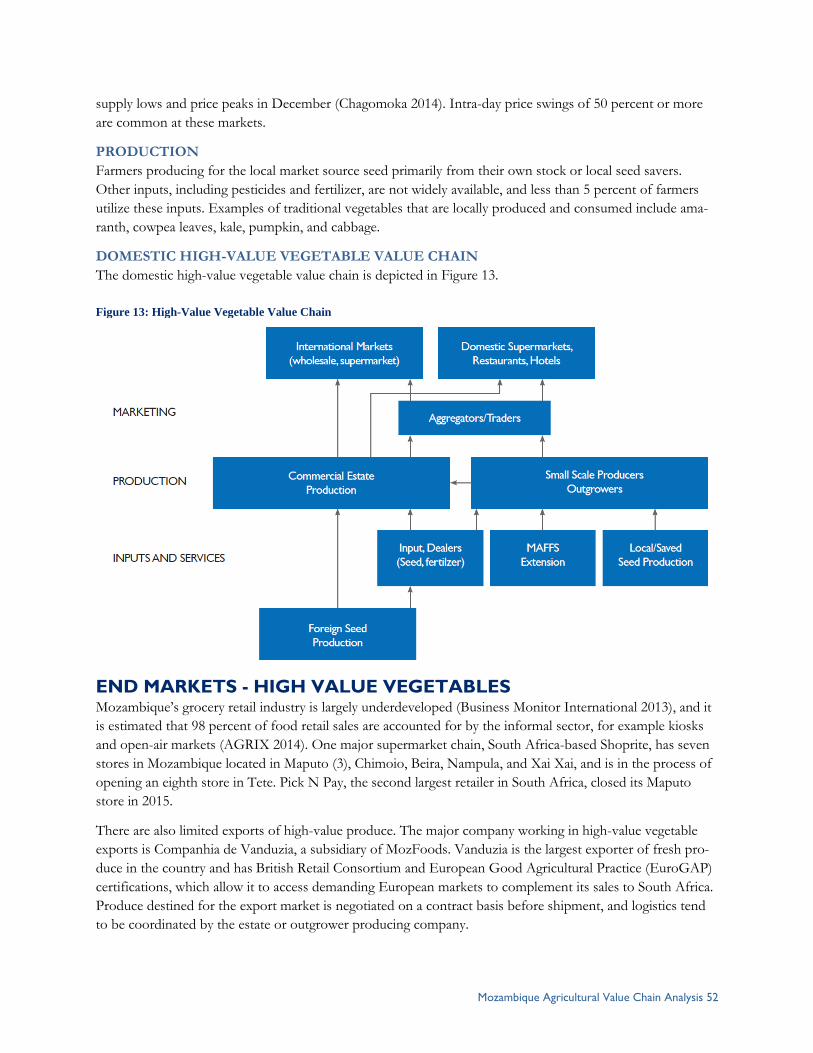
Mozambique Agricultural Value Chain Analysis 52
supply lows and price peaks in December (Chagomoka 2014). Intra-day price swings of 50 percent or more
are common at these markets.
PRODUCTION
Farmers producing for the local market source seed primarily from their own stock or local seed savers.
Other inputs, including pesticides and fertilizer, are not widely available, and less than 5 percent of farmers
utilize these inputs. Examples of traditional vegetables that are locally produced and consumed include ama-
ranth, cowpea leaves, kale, pumpkin, and cabbage.
DOMESTIC HIGH-VALUE VEGETABLE VALUE CHAIN
The domestic high-value vegetable value chain is depicted in Figure 13.
Figure 13: High-Value Vegetable Value Chain
END MARKETS - HIGH VALUE VEGETABLES Mozambique’s grocery retail industry is largely underdeveloped (Business Monitor International 2013), and it
is estimated that 98 percent of food retail sales are accounted for by the informal sector, for example kiosks
and open-air markets (AGRIX 2014). One major supermarket chain, South Africa-based Shoprite, has seven
stores in Mozambique located in Maputo (3), Chimoio, Beira, Nampula, and Xai Xai, and is in the process of
opening an eighth store in Tete. Pick N Pay, the second largest retailer in South Africa, closed its Maputo
store in 2015.
There are also limited exports of high-value produce. The major company working in high-value vegetable
exports is Companhia de Vanduzia, a subsidiary of MozFoods. Vanduzia is the largest exporter of fresh pro-
duce in the country and has British Retail Consortium and European Good Agricultural Practice (EuroGAP)
certifications, which allow it to access demanding European markets to complement its sales to South Africa.
Produce destined for the export market is negotiated on a contract basis before shipment, and logistics tend
to be coordinated by the estate or outgrower producing company.

Mozambique Agricultural Value Chain Analysis 53
MARKETING AND VALUE ADDITION High-value vegetable producers vary in size, but they tend to have access to irrigation systems that allow them
to produce a more consistent-quality product and target higher-value seasonal price windows. The high-value
vegetable chain tends to operate on formal contracts, with most production on estate commercial farms or
through outgrower schemes of relatively high-capacity smallholders. This production is then sold onward
through traders or directly by commercial estate growers to pre-identified buyers in high-end domestic or in-
ternational markets. The high-value segment accounts for an extremely small percentage of the total horticul-
ture production chain.
High-value vegetables consumed in Mozambique are primarily imported. In 2012, Mozambique imported
$12.1 million of vegetables, including tomatoes, onions, cabbage, green beans, peppers, and potatoes, which
satisfied 90 percent of domestic high-value demand. Table 6 shows the values of vegetable imports to
Mozambique for 2014 and 2015 as well as average values for 2011–2015. It also shows the relative share of
each vegetable out of the total value of vegetable imports. As shown, potatoes account for just over half of
imports. With the exception of garlic, which is imported almost entirely from China, South Africa is a major
source for vegetable imports to Mozambique.
Table 6: Vegetable Imports to Mozambique, 2011–2015 (USD, thousands)
Average value 2011–2015 Average share of imports
Total 19,493 102.0%
Potatoes 9,942 51.0%
Onions and shallots 4,031 20.7%
Tomatoes 1,942 10.0%
Garlic 1,759 9.0%
Vegetables, fresh or chilled 1,153 5.9%
Carrotts, Turnips, & Salad beetroot 455 2.3%
Cabbages & Cauliflower 211 1.1%
Peppers and capsicum 130 0.7%
Leguminous Vegetables 121 0.6%
Lettuce 77 0.4%
Cucumbers & Gherkins 64 0.3%
Production
High-value vegetable production often relies on commercial seed imported from countries such as South Af-
rica, Zimbabwe, Brazil, China, and France. Commercial input suppliers are limited in reach, but some certi-
fied vegetable seed is available in local retail shops.
END MARKET PRIORITIES AND CONSTRAINTS The most promising end-market opportunities involve producing high-value fresh vegetables to substitute for
imports in domestic markets. Target markets include supermarkets, tourist establishments, and restaurants, as
well as urban markets that are frequented by middle-class urban consumers.
Another promising market opportunity to pursue is that of traditional vegetables in mainstream urban mar-
kets. It is critical that these market opportunities are demand driven and that production increases tightly re-
spond to demand; otherwise, increases in production that are not marketed may create local gluts that depress
Source: ITC Trade Map, 2016.
Mozambique Agricultural Value Chain Analysis 54
prices and exacerbate price fluctuations. This production should be targeted to off-season windows (peak
production and price troughs occur in July/August and December), which implies the need for irrigation
among these producers as well.
There are a number of constraints that will influence the ability of producers to reach these target end mar-kets:
Proximity to market – Given the highly perishable nature of fresh vegetables and Mozambique’s weak
transport infrastructure and limited cold chain, high-value vegetable production will need to be proximate to
the markets where it will be sold and consumed. Analysis by Cairns demonstrated that the closer producers
were to cities with populations of 10,000 or more, the more likely they were to produce vegetables for mar-
ket.
Water access – Access to water, including irrigation, is critical to reducing production risks, ensuring a high
quality product, and timing production to take advantage of off-season market windows. As opposed to
shelf-stabilized crops, the water intensiveness and high perishability of vegetables make proximity to a water
source and to a profitable end market the biggest limiting geographic factor for production. Irrigation infra-
structure is also severely underdeveloped. Most irrigation is manual or manually managed flooding.
Capital and liquidity constraints – Commercial production of vegetables is a relatively capital-intensive en-
deavor. It requires that farmers have adequate liquidity to access inputs, as well as capital resources so that
they can invest in critical equipment such as irrigation infrastructure. Given the substantial financial invest-
ments that are involved in vegetable production, producers also need to have the capacity to manage financial
risks—a factor that can exclude poorer and more risk-averse producers.
Seed quality – High-quality commercial seed is of limited availability; landrace seed stocks for local vegeta-
bles are undifferentiated and range in quality, vigor, yield, and disease resistance. For potato, farmers are hold-
ing back the smallest potatoes as seed for the subsequent season, in effect selecting for inferior size character-
istics. Imported seed is extremely expensive and hard to find.
Technical and management capacity – Vegetable production requires more skilled labor and management
than other crops, like maize (Cairns 2012). In addition to affecting economic outcomes, a lack of technical
knowledge is associated with problems such as excessive application of pesticides by commercial vegetable
producers and the environmental and human health consequences associated with this (ACDI/VOCA 2014
and Cairns 2012). ACDI/VOCA reports that less sophisticated producers use twice the rate of active ingredi-
ents than more sophisticated producers.
Lack of post-harvest facilities – Post-harvest facilities for cooling, cleaning, sorting, and packing produce
are limited, and there is no cold chain infrastructure for domestic markets (ACDI/VOCA).
Food safety – Lack of food safety knowledge leads to current harvest, post-harvest handling, and food prep-
aration practices that make vegetables a vector for food-borne illness. Food safety is likely to become an in-
creasingly important issue for urban consumers, and the ability to respond to these concerns may become an
important factor affecting market access.
UPGRADING STRATEGIES Target higher-value domestic vegetable markets for import substitution and off-season production of
local/traditional vegetables.

Mozambique Agricultural Value Chain Analysis 55
Identify and coordinate with large-scale buyers of vegetables for the target markets. Local demand for
specific vegetables should be analyzed to address varieties, volumes, price movements, and product attributes;
this analysis should be used in the development of a strategy to serve specific vegetable markets. Coordinate
supply for these market opportunities by working with farmers through producer associations to facilitate de-
livery of training and technical assistance, and enable greater coordination of supply to avoid losses associated
with excessive production for local markets.
Investments in developing the high-value and off-season traditional vegetable value chain should be
directed to higher-capacity farmers who are located in proximity to their target markets and access to wa-
ter; these farmers should have the capacity to bear significant financial risk and meet the investment require-
ments entailed in producing for these markets.

Mozambique Agricultural Value Chain Analysis 56
CITATIONS Abt Associates. “USAID AgriFUTURO Project End of Project Report: 1 May 2009 – 28 February 2015.”
Contract/Program NO.: EDH-1-00-05-00005-00 Task Order No.: 10. 2015.
AGRIX. “Investment Opportunities for Dutch Agrifood Companies in Mozambique: A Challenge for Pa-
tient Money.” The Netherlands: Deventer, 2014.
Cachomba, I. and C. Donovan. “Value Chain Analysis of Common Beans In Mozambique.” Mozambique:
Agricultural Research Institute of Mozambique.
Cairns, J.E. “Does Selling Fruits or Vegetables Provide a Strategic Advantage to Selling Maize for Small-
Holders in Mozambique? A Double-Hurdle Correlated Random Effects Approach to Evaluating Farmer
Market Decisions.” Mozambique: Agricultural Research Institute of Mozambique, 2012.
Chagomoka, T. “Value Chain Analysis of Traditional Vegetables from Malawi and Mozambique.” International
Food and Agribusiness Management Review (IFAMA)17, 4 (2014): 59-85.
Dalberg. “Ghana, Burkina Faso, Tanzania and Mozambique Value Chain Assessments: Banana and Cashew.”
Washington, D.C.: International Finance Corporation, 2013.
Easterling, T., T. Mata, T. Camba, C. Creva, and J. Tinga. “Performance Evaluation of the
USAID/Mozambique Agriculture Portfolio.” Bethesda, MD: Mendez England & Associates, 2013. Prepared
under Task Order No: AID-656-TO-12-00003.
FEWS NET. Southern Africa Informal Cross-Border Food Trade Bulletin 78 (2012).
Folmer, E.C.R., P.M.H. Guerts, and J.R. Francisco. “Assessment of soil fertility depletion in Mozambique.”
Agriculture, Ecosystems and Environment 71 (1998): 159–167.
Food and Agriculture Organization of the United Nations (FAO). “Nutrition Country Profile: Republic of
Mozambique.” Rome, Italy: FAO, 2011.
Große-Rüschkamp, A. and K. Seelige. Analysis of the Cashew Value Chain in Mozambique. African Cashew Initiative
(ACI). Mozambique: GTZ, 2010.
Gungulo, A.L. “Expanding Pulse Production in Mozambique: Identifying Constraints and New Strategies.”
Unpublished master’s dissertation. South Africa: University of Pretoria, 2013.
Hackenberg, I., R. Majumdar, and H. Zefanias. “AgriFUTURO Gender Assessment.” Mozambique: USAID,
2013.
Hanlon, J. and T. Smart. "Small Farmers or Big Investors? The Choice for Mozambique.” Research report,
updated in 2013.
Harris, S. “Revisiting the Fruit Industry Development Strategy for Mozambique.” Washington, D.C.: USAID,
2010.
USAID AIMS III Project. “Impact Assessment of the Effectiveness of Agro-Dealer Development Activi-ties.” Mozambique: USAID, 2015.
Mozambique Agricultural Value Chain Analysis 57
International Food Policy Research Institute (IFPRI). Southern Africa and Climate Change: A Comprehensive Analy-
sis: Mozambique. Washington, D.C.: IFPRI, 2012.
Jasse, A. “Cadeias de Valor de Cerais e Oleaginosas.” Promoção do Desenvolvimento das Fieiras de Cereais e
Oleaginosas Distrito de Nhamatanda. Mozambique: 2013.
Kleijn, W., W. Heemskerk, and M. Wongtschowski. “Pluralistic service systems: Sesame in Nampula, Mozam-
bique.” KIT Case Study. The Netherlands: Royal Tropical Institute.
Mennonite Economic Development Associates (MEDA). “Value Chain Finance Assessment of the Cashew
Nuts Sector in the Province of Nampula, Mozambique.” Canada: GIZ and African Cashew initiative, 2011.
Ministério da Agricultura e Segurança Alimentar (MASA). Anuário de Estatísticas Agrárias 2002–2011.
Mozambique: MASA, 2012.
Payongayong, E. “Report on the Implementation of the Gross Margins Survey of 2012.” Mozambique: Mich-
igan State University, 2012.
Perreira, L. “Field Situation for Soy in Mozambique.” Washington, D.C.: TechnoServe, 2015.
TechnoServe ISP. “Soybeans in Mozambique.” Mozambique: TechnoServe, 2009.
Tropical Legumes II. Bulletin of Tropical Legumes 18 (2013).
Tvetden, I. “Mozambique Case Study: Gender Equality and Development.” Washington, D.C.: World Bank,
2011.
USAID AIMS III Project. “Impact Assessment of the Effectiveness of Agro-Dealer Development Activi-
ties.” Mozambique: USAID, 2015.
Walker, T. and B. Cunguara. “Taking Stock of Soybean R&D and USAID's Feed the Future Program in
Mozambique.” Washington, D.C.: MEAS and USAID, 2016b.
Walker, T., S. Silim, B. Cunguara, C. Donovan, P. P. Rao, and M. Amane. “Pigeon pea in Mozambique: An
Emerging Success Story of Crop Expansion in Smallholder Agriculture.” Washington, D.C.: USAID, 2015.
Walker, T., B. Cunguara, and C. Donovan. “Assessing Directions for Cowpea R&D in USAID's Feed the Fu-
ture Program in Mozambique.” Washington, D.C.: MEAS and USAID, 2016a.
World Bank. Climate Change Portal. Accessed at sdwebx.worldbank.org/climateportal.
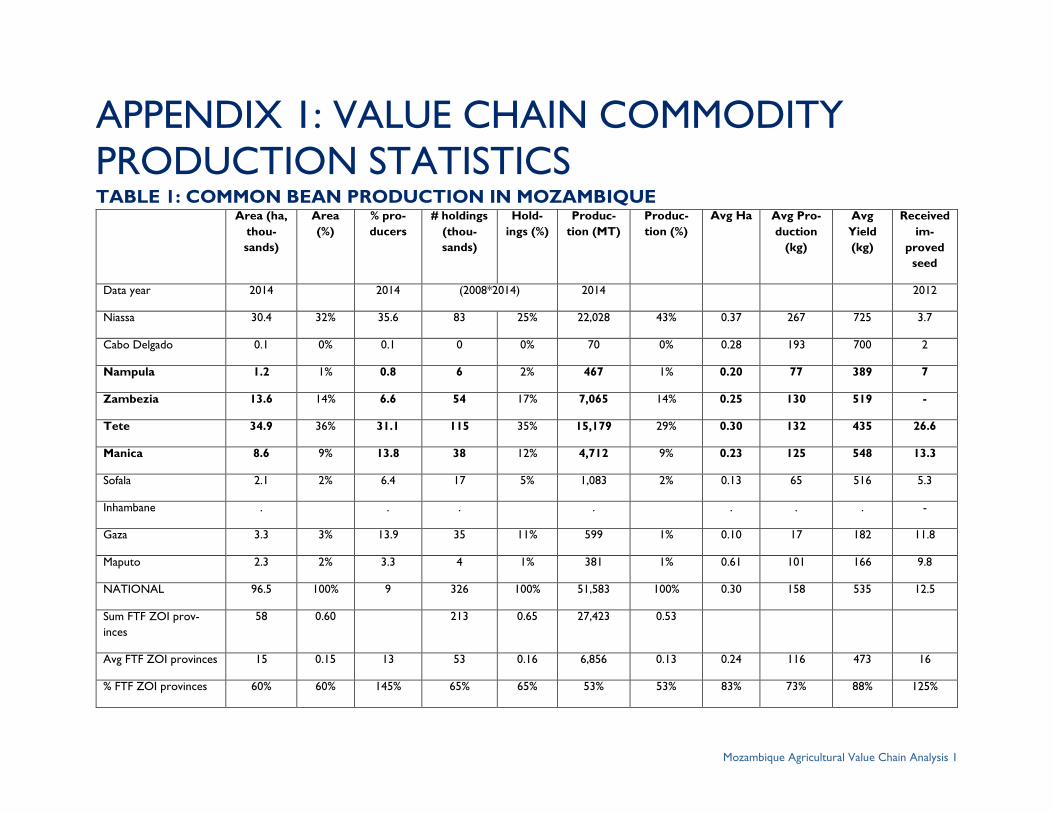
Mozambique Agricultural Value Chain Analysis 1
APPENDIX 1: VALUE CHAIN COMMODITY
PRODUCTION STATISTICS TABLE 1: COMMON BEAN PRODUCTION IN MOZAMBIQUE
Area (ha,
thou-
sands)
Area
(%)
% pro-
ducers
# holdings
(thou-
sands)
Hold-
ings (%)
Produc-
tion (MT)
Produc-
tion (%)
Avg Ha Avg Pro-
duction
(kg)
Avg
Yield
(kg)
Received
im-
proved
seed
Data year 2014 2014 (2008*2014) 2014 2012
Niassa 30.4 32% 35.6 83 25% 22,028 43% 0.37 267 725 3.7
Cabo Delgado 0.1 0% 0.1 0 0% 70 0% 0.28 193 700 2
Nampula 1.2 1% 0.8 6 2% 467 1% 0.20 77 389 7
Zambezia 13.6 14% 6.6 54 17% 7,065 14% 0.25 130 519 -
Tete 34.9 36% 31.1 115 35% 15,179 29% 0.30 132 435 26.6
Manica 8.6 9% 13.8 38 12% 4,712 9% 0.23 125 548 13.3
Sofala 2.1 2% 6.4 17 5% 1,083 2% 0.13 65 516 5.3
Inhambane . . . . . . . -
Gaza 3.3 3% 13.9 35 11% 599 1% 0.10 17 182 11.8
Maputo 2.3 2% 3.3 4 1% 381 1% 0.61 101 166 9.8
NATIONAL 96.5 100% 9 326 100% 51,583 100% 0.30 158 535 12.5
Sum FTF ZOI prov-
inces
58 0.60 213 0.65 27,423 0.53
Avg FTF ZOI provinces 15 0.15 13 53 0.16 6,856 0.13 0.24 116 473 16
% FTF ZOI provinces 60% 60% 145% 65% 65% 53% 53% 83% 73% 88% 125%
Mozambique Agricultural Value Chain Analysis 2
Sources: MASA 2012, MASA 2014.
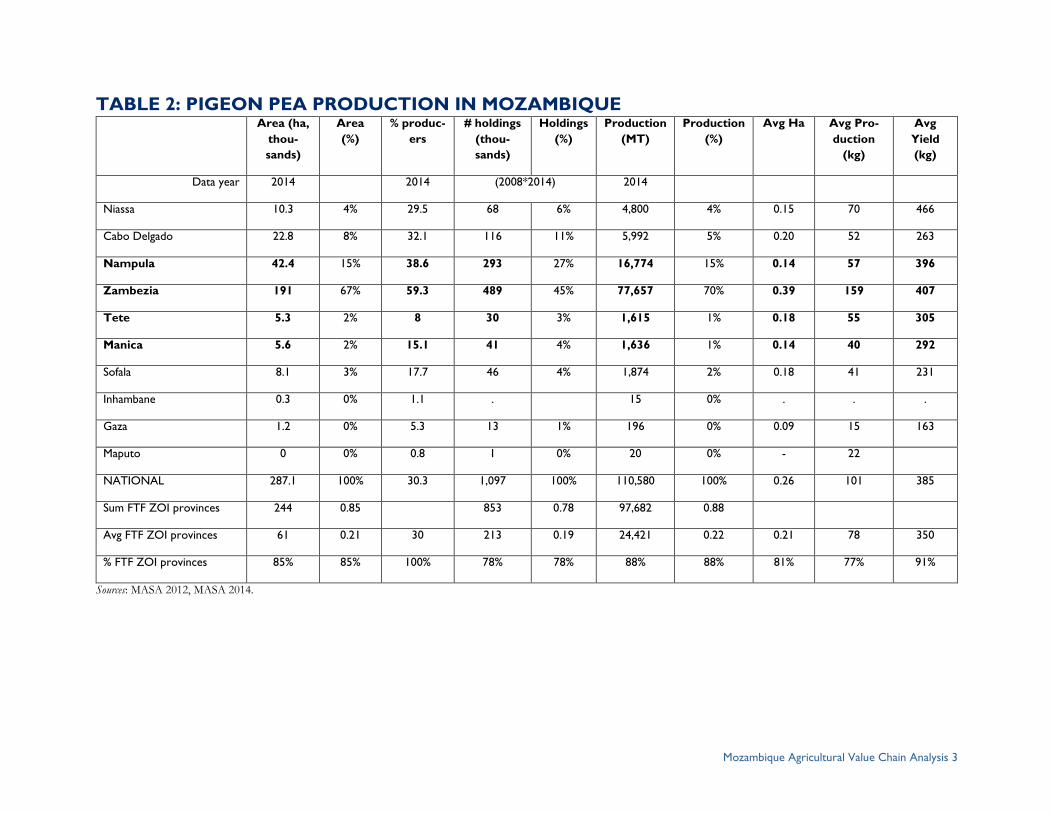
Mozambique Agricultural Value Chain Analysis 3
TABLE 2: PIGEON PEA PRODUCTION IN MOZAMBIQUE Area (ha,
thou-
sands)
Area
(%)
% produc-
ers
# holdings
(thou-
sands)
Holdings
(%)
Production
(MT)
Production
(%)
Avg Ha Avg Pro-
duction
(kg)
Avg
Yield
(kg)
Data year 2014 2014 (2008*2014) 2014
Niassa 10.3 4% 29.5 68 6% 4,800 4% 0.15 70 466
Cabo Delgado 22.8 8% 32.1 116 11% 5,992 5% 0.20 52 263
Nampula 42.4 15% 38.6 293 27% 16,774 15% 0.14 57 396
Zambezia 191 67% 59.3 489 45% 77,657 70% 0.39 159 407
Tete 5.3 2% 8 30 3% 1,615 1% 0.18 55 305
Manica 5.6 2% 15.1 41 4% 1,636 1% 0.14 40 292
Sofala 8.1 3% 17.7 46 4% 1,874 2% 0.18 41 231
Inhambane 0.3 0% 1.1 . 15 0% . . .
Gaza 1.2 0% 5.3 13 1% 196 0% 0.09 15 163
Maputo 0 0% 0.8 1 0% 20 0% - 22
NATIONAL 287.1 100% 30.3 1,097 100% 110,580 100% 0.26 101 385
Sum FTF ZOI provinces 244 0.85 853 0.78 97,682 0.88
Avg FTF ZOI provinces 61 0.21 30 213 0.19 24,421 0.22 0.21 78 350
% FTF ZOI provinces 85% 85% 100% 78% 78% 88% 88% 81% 77% 91%
Sources: MASA 2012, MASA 2014.
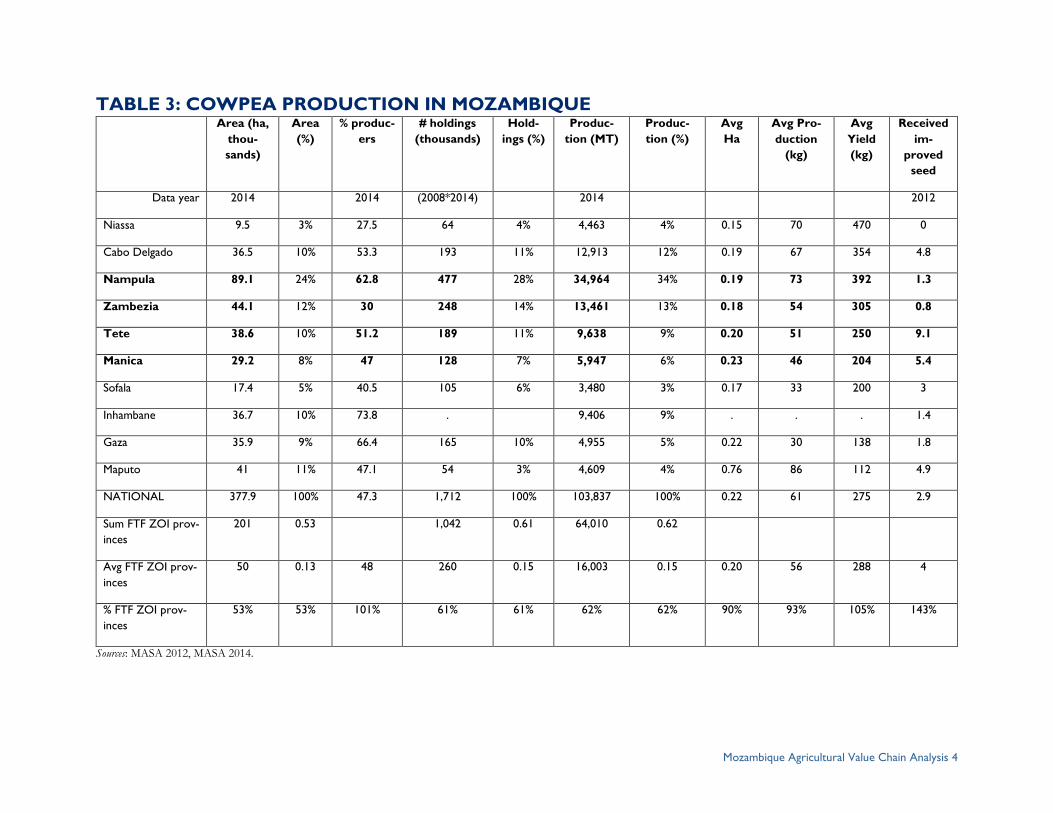
Mozambique Agricultural Value Chain Analysis 4
TABLE 3: COWPEA PRODUCTION IN MOZAMBIQUE Area (ha,
thou-
sands)
Area
(%)
% produc-
ers
# holdings
(thousands)
Hold-
ings (%)
Produc-
tion (MT)
Produc-
tion (%)
Avg
Ha
Avg Pro-
duction
(kg)
Avg
Yield
(kg)
Received
im-
proved
seed
Data year 2014 2014 (2008*2014) 2014 2012
Niassa 9.5 3% 27.5 64 4% 4,463 4% 0.15 70 470 0
Cabo Delgado 36.5 10% 53.3 193 11% 12,913 12% 0.19 67 354 4.8
Nampula 89.1 24% 62.8 477 28% 34,964 34% 0.19 73 392 1.3
Zambezia 44.1 12% 30 248 14% 13,461 13% 0.18 54 305 0.8
Tete 38.6 10% 51.2 189 11% 9,638 9% 0.20 51 250 9.1
Manica 29.2 8% 47 128 7% 5,947 6% 0.23 46 204 5.4
Sofala 17.4 5% 40.5 105 6% 3,480 3% 0.17 33 200 3
Inhambane 36.7 10% 73.8 . 9,406 9% . . . 1.4
Gaza 35.9 9% 66.4 165 10% 4,955 5% 0.22 30 138 1.8
Maputo 41 11% 47.1 54 3% 4,609 4% 0.76 86 112 4.9
NATIONAL 377.9 100% 47.3 1,712 100% 103,837 100% 0.22 61 275 2.9
Sum FTF ZOI prov-
inces
201 0.53 1,042 0.61 64,010 0.62
Avg FTF ZOI prov-
inces
50 0.13 48 260 0.15 16,003 0.15 0.20 56 288 4
% FTF ZOI prov-
inces
53% 53% 101% 61% 61% 62% 62% 90% 93% 105% 143%
Sources: MASA 2012, MASA 2014.
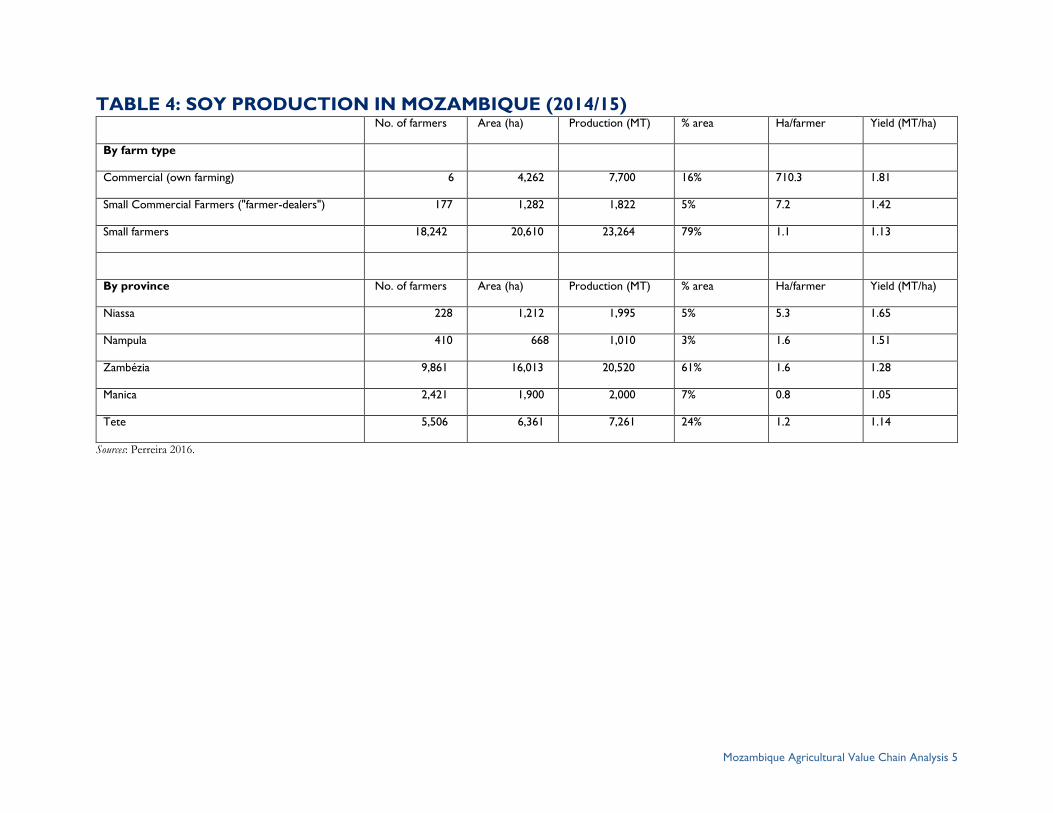
Mozambique Agricultural Value Chain Analysis 5
TABLE 4: SOY PRODUCTION IN MOZAMBIQUE (2014/15) No. of farmers Area (ha) Production (MT) % area Ha/farmer Yield (MT/ha)
By farm type
Commercial (own farming) 6 4,262 7,700 16% 710.3 1.81
Small Commercial Farmers ("farmer-dealers") 177 1,282 1,822 5% 7.2 1.42
Small farmers 18,242 20,610 23,264 79% 1.1 1.13
By province No. of farmers Area (ha) Production (MT) % area Ha/farmer Yield (MT/ha)
Niassa 228 1,212 1,995 5% 5.3 1.65
Nampula 410 668 1,010 3% 1.6 1.51
Zambézia 9,861 16,013 20,520 61% 1.6 1.28
Manica 2,421 1,900 2,000 7% 0.8 1.05
Tete 5,506 6,361 7,261 24% 1.2 1.14
Sources: Perreira 2016.
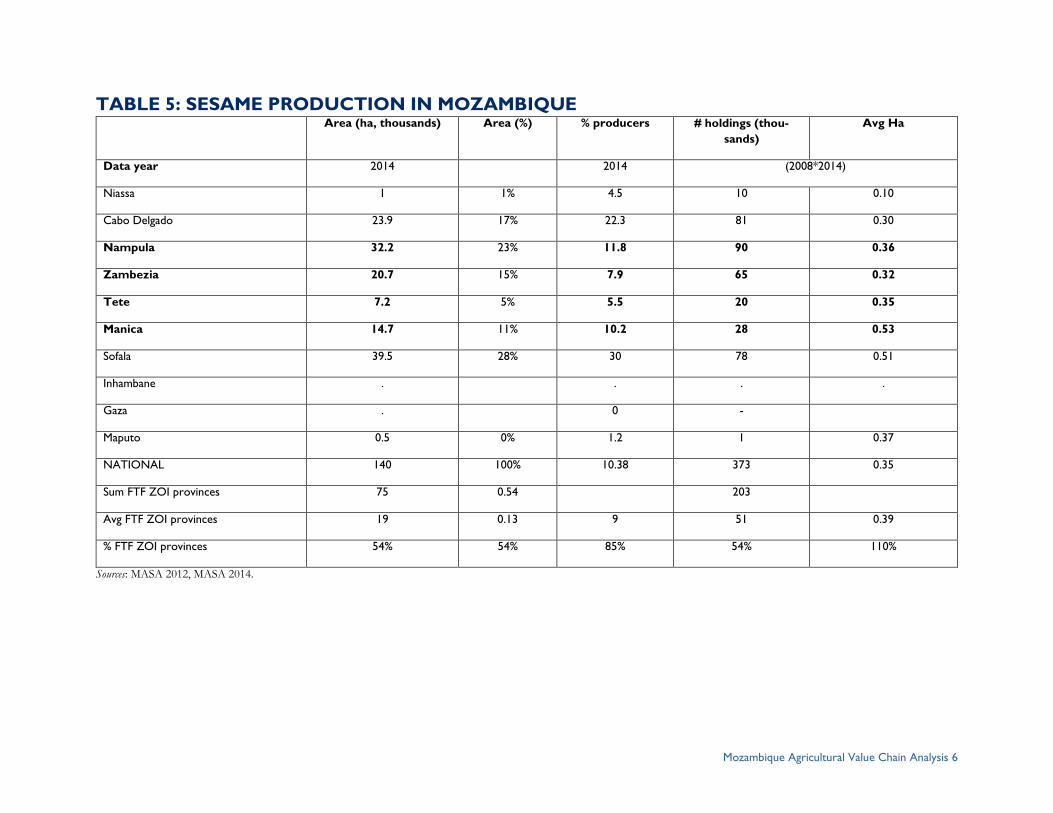
Mozambique Agricultural Value Chain Analysis 6
TABLE 5: SESAME PRODUCTION IN MOZAMBIQUE Area (ha, thousands) Area (%) % producers # holdings (thou-
sands)
Avg Ha
Data year 2014 2014 (2008*2014)
Niassa 1 1% 4.5 10 0.10
Cabo Delgado 23.9 17% 22.3 81 0.30
Nampula 32.2 23% 11.8 90 0.36
Zambezia 20.7 15% 7.9 65 0.32
Tete 7.2 5% 5.5 20 0.35
Manica 14.7 11% 10.2 28 0.53
Sofala 39.5 28% 30 78 0.51
Inhambane . . . .
Gaza . 0 -
Maputo 0.5 0% 1.2 1 0.37
NATIONAL 140 100% 10.38 373 0.35
Sum FTF ZOI provinces 75 0.54 203
Avg FTF ZOI provinces 19 0.13 9 51 0.39
% FTF ZOI provinces 54% 54% 85% 54% 110%
Sources: MASA 2012, MASA 2014.
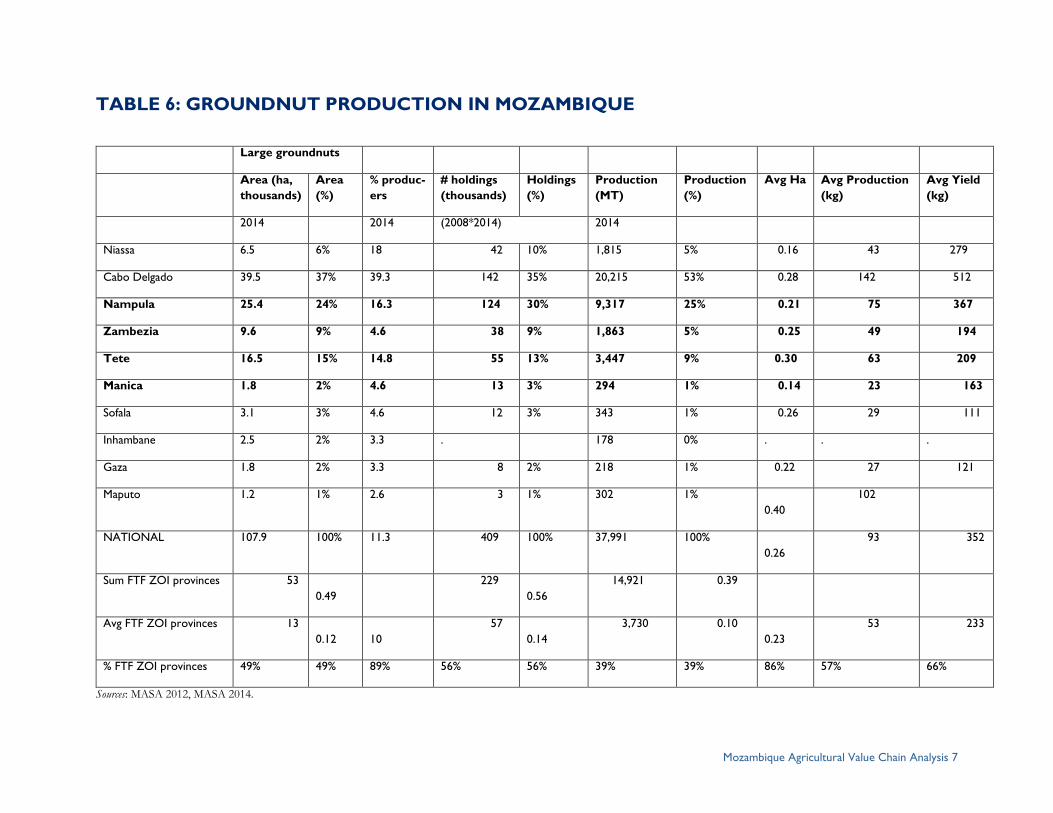
Mozambique Agricultural Value Chain Analysis 7
TABLE 6: GROUNDNUT PRODUCTION IN MOZAMBIQUE
Large groundnuts
Area (ha,
thousands)
Area
(%)
% produc-
ers
# holdings
(thousands)
Holdings
(%)
Production
(MT)
Production
(%)
Avg Ha Avg Production
(kg)
Avg Yield
(kg)
2014 2014 (2008*2014) 2014
Niassa 6.5 6% 18 42 10% 1,815 5% 0.16 43 279
Cabo Delgado 39.5 37% 39.3 142 35% 20,215 53% 0.28 142 512
Nampula 25.4 24% 16.3 124 30% 9,317 25% 0.21 75 367
Zambezia 9.6 9% 4.6 38 9% 1,863 5% 0.25 49 194
Tete 16.5 15% 14.8 55 13% 3,447 9% 0.30 63 209
Manica 1.8 2% 4.6 13 3% 294 1% 0.14 23 163
Sofala 3.1 3% 4.6 12 3% 343 1% 0.26 29 111
Inhambane 2.5 2% 3.3 . 178 0% . . .
Gaza 1.8 2% 3.3 8 2% 218 1% 0.22 27 121
Maputo 1.2 1% 2.6 3 1% 302 1%
0.40
102
NATIONAL 107.9 100% 11.3 409 100% 37,991 100%
0.26
93 352
Sum FTF ZOI provinces 53
0.49
229
0.56
14,921 0.39
Avg FTF ZOI provinces 13
0.12
10
57
0.14
3,730 0.10
0.23
53 233
% FTF ZOI provinces 49% 49% 89% 56% 56% 39% 39% 86% 57% 66%
Sources: MASA 2012, MASA 2014.

Mozambique Agricultural Value Chain Analysis 8
Small groundnuts
Area (ha,
thousands)
Area
(%)
% pro-
ducers
# holdings
(thousands)
Holdings
(%)
Production
(MT)
Production
(%)
Avg
Ha
Avg Produc-
tion (kg)
Avg
Yield
(kg)
2014 2014 (2008*2014) 2014
Niassa 2.3 1% 6.1 14 1% 558 1% 0.16 39 243
Cabo Delgado 10.5 3% 10.5 38 4% 6,212 6% 0.28 163
592
Nampula 107.2 35% 56.4 428 41% 50,448 49% 0.25 118 471
Zambezia 50.6 16% 17.2 142 14% 13,046 13% 0.36 92
258
Tete 18 6% 24 89 9% 4,927 5% 0.20 55 274
Manica 13.5 4% 18.4 50 5% 2,839 3%
0.27
57
210
Sofala 7.4 2% 10.6 28 3% 1,981 2%
0.27
72
268
Inhambane 34.3 11% 57.4 . 6,689 7% . . .
Gaza 28.9 9% 55.4 138 13% 6,945 7%
0.21
50
240
Maputo 35.8 12% 37.2 42 4% 8,488 8%
0.84
200
NATIONAL 308.6 100% 28.7 1,039 100% 102,133 100%
0.30
98
331
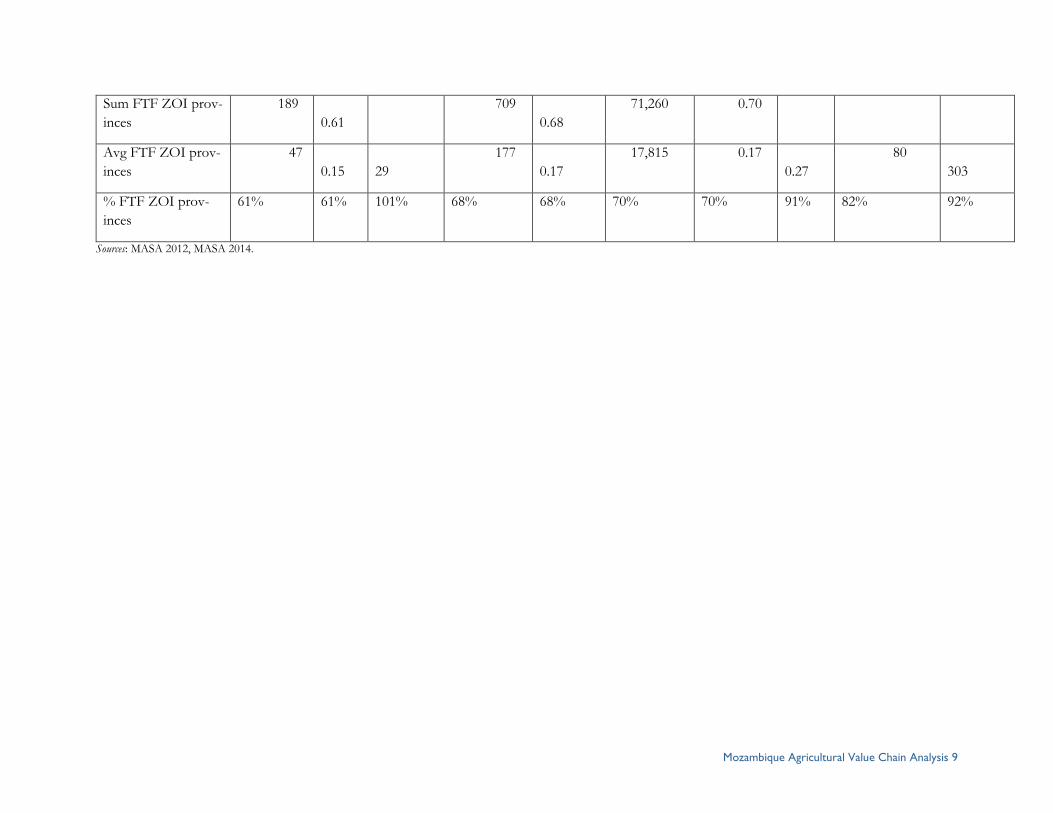
Mozambique Agricultural Value Chain Analysis 9
Sum FTF ZOI prov-
inces
189
0.61
709
0.68
71,260 0.70
Avg FTF ZOI prov-
inces
47
0.15
29
177
0.17
17,815 0.17
0.27
80
303
% FTF ZOI prov-
inces
61% 61% 101% 68% 68% 70% 70% 91% 82% 92%
Sources: MASA 2012, MASA 2014.
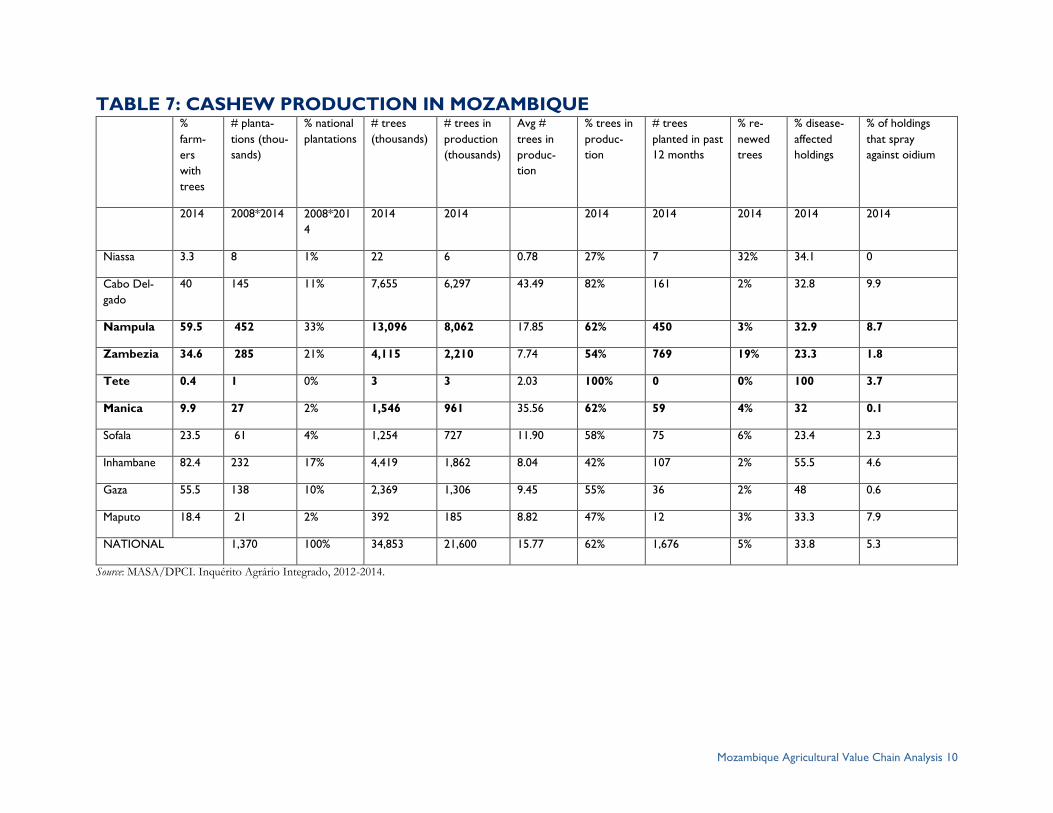
Mozambique Agricultural Value Chain Analysis 10
TABLE 7: CASHEW PRODUCTION IN MOZAMBIQUE %
farm-
ers
with
trees
# planta-
tions (thou-
sands)
% national
plantations
# trees
(thousands)
# trees in
production
(thousands)
Avg #
trees in
produc-
tion
% trees in
produc-
tion
# trees
planted in past
12 months
% re-
newed
trees
% disease-
affected
holdings
% of holdings
that spray
against oidium
2014 2008*2014 2008*201
4
2014 2014 2014 2014 2014 2014 2014
Niassa 3.3 8 1% 22 6 0.78 27% 7 32% 34.1 0
Cabo Del-
gado
40 145 11% 7,655 6,297 43.49 82% 161 2% 32.8 9.9
Nampula 59.5 452 33% 13,096 8,062 17.85 62% 450 3% 32.9 8.7
Zambezia 34.6 285 21% 4,115 2,210 7.74 54% 769 19% 23.3 1.8
Tete 0.4 1 0% 3 3 2.03 100% 0 0% 100 3.7
Manica 9.9 27 2% 1,546 961 35.56 62% 59 4% 32 0.1
Sofala 23.5 61 4% 1,254 727 11.90 58% 75 6% 23.4 2.3
Inhambane 82.4 232 17% 4,419 1,862 8.04 42% 107 2% 55.5 4.6
Gaza 55.5 138 10% 2,369 1,306 9.45 55% 36 2% 48 0.6
Maputo 18.4 21 2% 392 185 8.82 47% 12 3% 33.3 7.9
NATIONAL 1,370 100% 34,853 21,600 15.77 62% 1,676 5% 33.8 5.3
Source: MASA/DPCI. Inquérito Agrário Integrado, 2012-2014.

Mozambique Agricultural Value Chain Analysis 11
Table 8: Vegetable production in Mozambique Potato Squash Onion Kale
% farmers
producing
% farm-
ers sell-
ing
% farmers
producing
% farmers
producing
% farm-
ers sell-
ing
% farmers
producing
% farmers
producing
% farm-
ers sell-
ing
% farmers
producing
% farmers
producing
% farm-
ers sell-
ing
% farmers
producing
Year 2008 2008 2014 2008 2008 2014 2008 2008 2014 2008 2008 2014
Niassa 7 36.9 7.2 27.6 3 17.2 2.1 25.4 3 2.5 54.2 4.4
Cabo Delgado 0 . 0 23.2 8.9 21.8 1.1 66.6 1.2 1.3 64.3 0.4
Nampula 0 . 0.1 5.4 10.2 14.8 3.1 45.6 2.2 1.3 39.4 0.6
Zambezia 0.8 10.3 0.9 13.8 10.4 12.2 2.7 46 0.9 2.5 44.4 3
Tete 13.1 63.5 10.4 66.1 . 40.3 5.9 32.6 5 10.3 45.1 6.4
Manica 1.5 5.9 0.5 46.1 4 55.9 5.5 41.9 3.2 9.5 56.5 9.8
Sofala 0.5 26 0.4 29.6 2.8 25.7 8.9 27.8 3.5 9.4 30.3 5.5
Inhambane 0.7 13.7 0.1 24.8 1.6 14.6 15.5 21.8 7.3 21.7 22.1 10
Gaza 0 0 0.9 51.2 4.8 57.9 11.3 18.8 10.4 12.2 27.2 14.4
Maputo 0.7 46.6 1.3 39.1 4.1 36.8 13 29.5 14.5 12.8 30.4 20.6
NATIONAL 2.1 48.7 1.8 26.6 4.4 25 5.4 31.7 3.9 6.3 36 5.7
Sources: Trabalho de Inquérito Agrícola, 2002-2008; Trabalho de Inquérito Agrícola, 2014.
Cucumber Okra Tomato Green bean Lettuce
% farmers
producing
% farm-
ers sell-
ing
% farmers
producing
% farmers
producing
% farm-
ers sell-
ing
% farmers
producing
% farmers
producing
% farm-
ers sell-
ing
% farmers
producing
% farmers
producing
% farmers
producing
Year 2008 2008 2014 2008 2008 2014 2008 2008 2014 2014 2014
Niassa 2.2 17.8 1 5.3 10.4 4.1 6.1 42.7 8.9 0.2 2.7
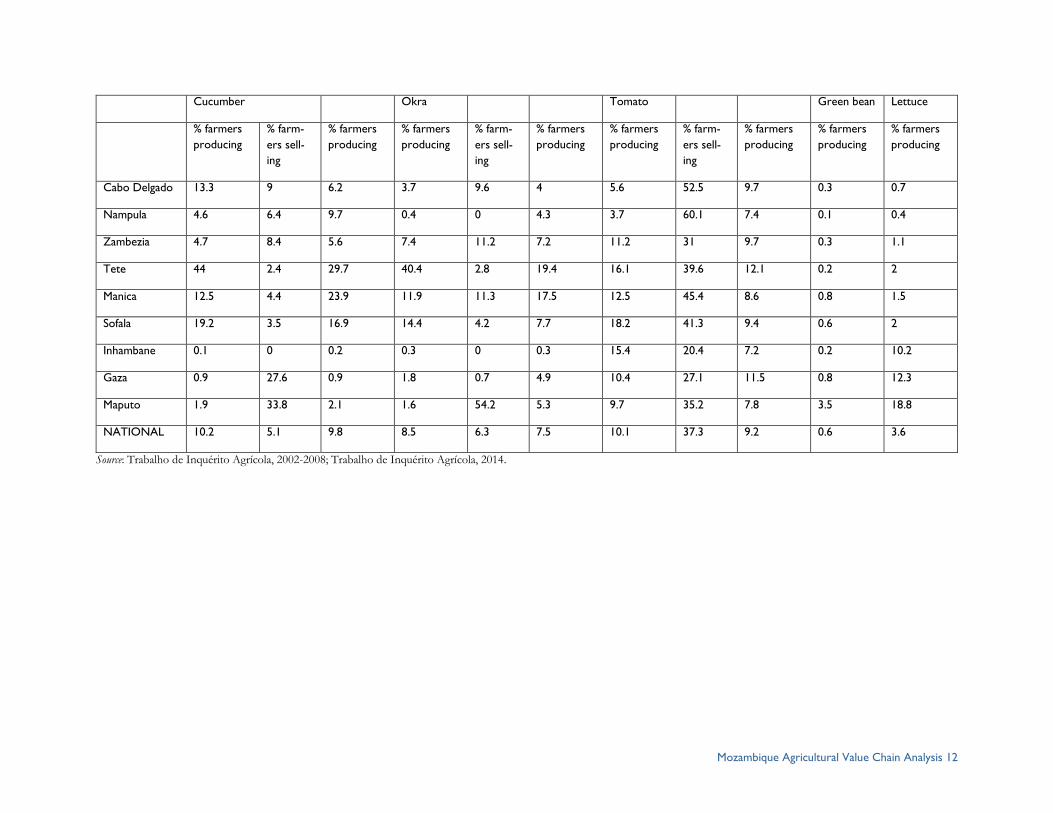
Mozambique Agricultural Value Chain Analysis 12
Cucumber Okra Tomato Green bean Lettuce
% farmers
producing
% farm-
ers sell-
ing
% farmers
producing
% farmers
producing
% farm-
ers sell-
ing
% farmers
producing
% farmers
producing
% farm-
ers sell-
ing
% farmers
producing
% farmers
producing
% farmers
producing
Cabo Delgado 13.3 9 6.2 3.7 9.6 4 5.6 52.5 9.7 0.3 0.7
Nampula 4.6 6.4 9.7 0.4 0 4.3 3.7 60.1 7.4 0.1 0.4
Zambezia 4.7 8.4 5.6 7.4 11.2 7.2 11.2 31 9.7 0.3 1.1
Tete 44 2.4 29.7 40.4 2.8 19.4 16.1 39.6 12.1 0.2 2
Manica 12.5 4.4 23.9 11.9 11.3 17.5 12.5 45.4 8.6 0.8 1.5
Sofala 19.2 3.5 16.9 14.4 4.2 7.7 18.2 41.3 9.4 0.6 2
Inhambane 0.1 0 0.2 0.3 0 0.3 15.4 20.4 7.2 0.2 10.2
Gaza 0.9 27.6 0.9 1.8 0.7 4.9 10.4 27.1 11.5 0.8 12.3
Maputo 1.9 33.8 2.1 1.6 54.2 5.3 9.7 35.2 7.8 3.5 18.8
NATIONAL 10.2 5.1 9.8 8.5 6.3 7.5 10.1 37.3 9.2 0.6 3.6
Source: Trabalho de Inquérito Agrícola, 2002-2008; Trabalho de Inquérito Agrícola, 2014.
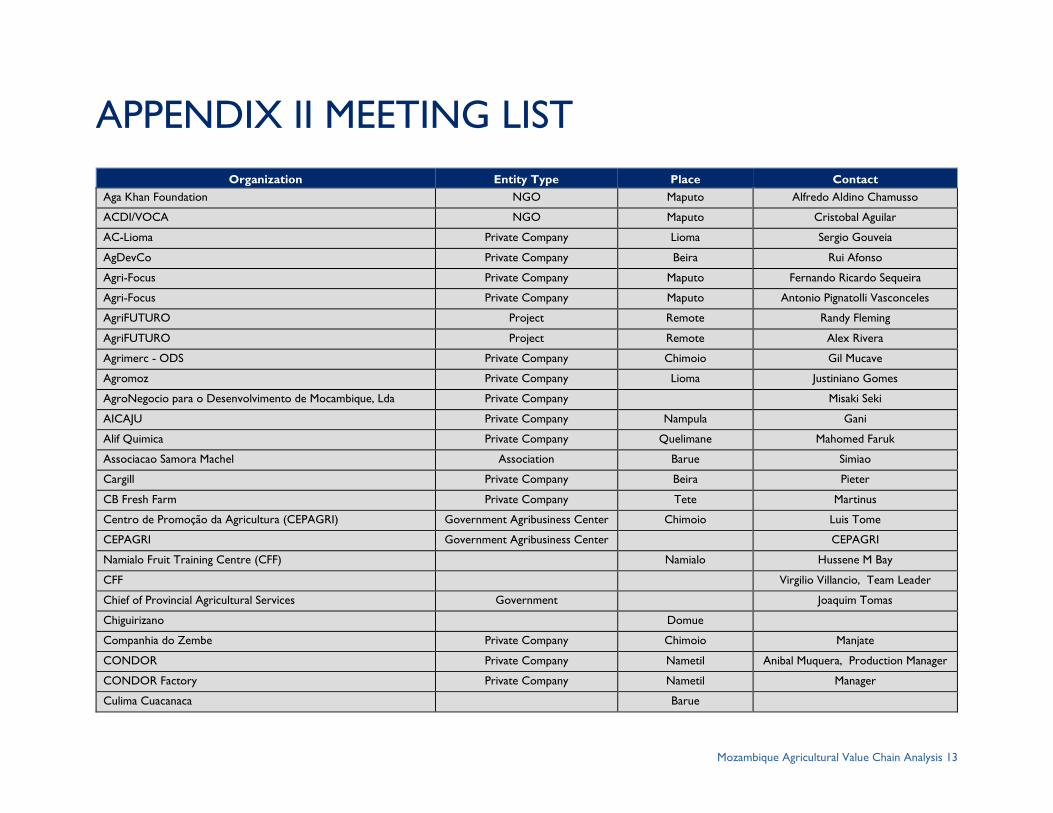
Mozambique Agricultural Value Chain Analysis 13
APPENDIX II MEETING LIST
Organization Entity Type Place Contact
Aga Khan Foundation NGO Maputo Alfredo Aldino Chamusso
ACDI/VOCA NGO Maputo Cristobal Aguilar
AC-Lioma Private Company Lioma Sergio Gouveia
AgDevCo Private Company Beira Rui Afonso
Agri-Focus Private Company Maputo Fernando Ricardo Sequeira
Agri-Focus Private Company Maputo Antonio Pignatolli Vasconceles
AgriFUTURO Project Remote Randy Fleming
AgriFUTURO Project Remote Alex Rivera
Agrimerc - ODS Private Company Chimoio Gil Mucave
Agromoz Private Company Lioma Justiniano Gomes
AgroNegocio para o Desenvolvimento de Mocambique, Lda Private Company Misaki Seki
AICAJU Private Company Nampula Gani
Alif Quimica Private Company Quelimane Mahomed Faruk
Associacao Samora Machel Association Barue Simiao
Cargill Private Company Beira Pieter
CB Fresh Farm Private Company Tete Martinus
Centro de Promoção da Agricultura (CEPAGRI) Government Agribusiness Center Chimoio Luis Tome
CEPAGRI Government Agribusiness Center CEPAGRI
Namialo Fruit Training Centre (CFF) Namialo Hussene M Bay
CFF Virgilio Villancio, Team Leader
Chief of Provincial Agricultural Services Government Joaquim Tomas
Chiguirizano Domue
Companhia do Zembe Private Company Chimoio Manjate
CONDOR Private Company Nametil Anibal Muquera, Production Manager
CONDOR Factory Private Company Nametil Manager
Culima Cuacanaca Barue
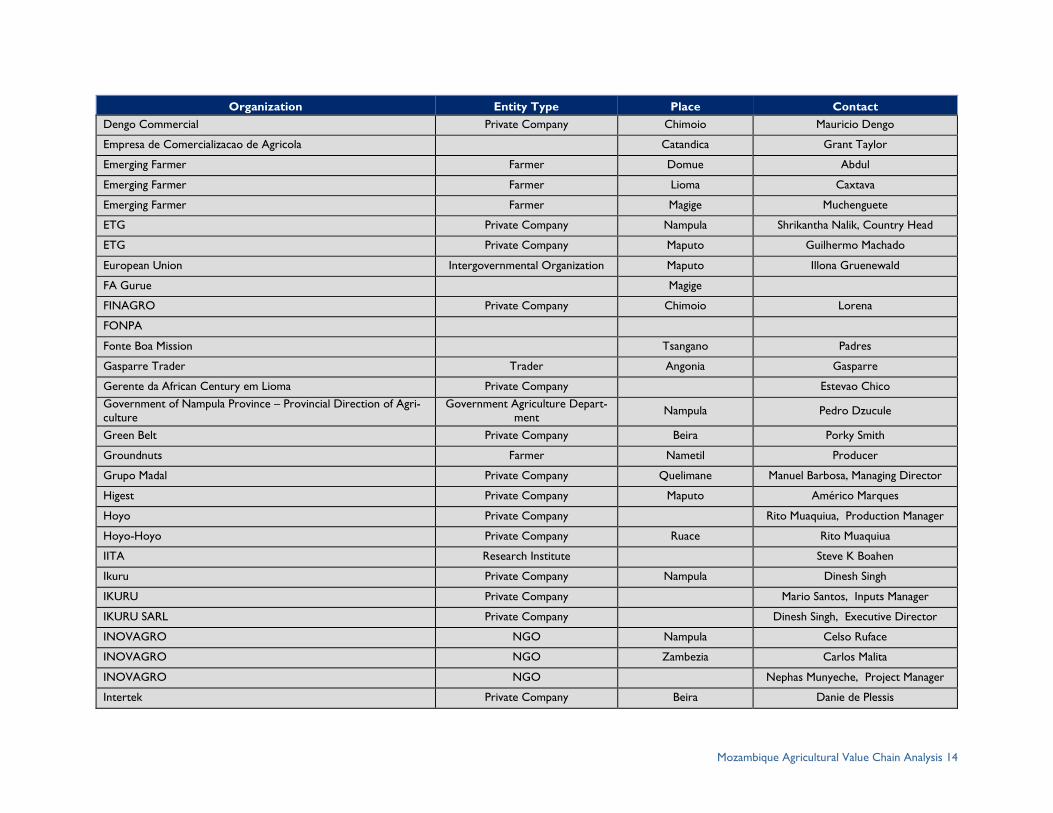
Mozambique Agricultural Value Chain Analysis 14
Organization Entity Type Place Contact
Dengo Commercial Private Company Chimoio Mauricio Dengo
Empresa de Comercializacao de Agricola Catandica Grant Taylor
Emerging Farmer Farmer Domue Abdul
Emerging Farmer Farmer Lioma Caxtava
Emerging Farmer Farmer Magige Muchenguete
ETG Private Company Nampula Shrikantha Nalik, Country Head
ETG Private Company Maputo Guilhermo Machado
European Union Intergovernmental Organization Maputo Illona Gruenewald
FA Gurue Magige
FINAGRO Private Company Chimoio Lorena
FONPA
Fonte Boa Mission Tsangano Padres
Gasparre Trader Trader Angonia Gasparre
Gerente da African Century em Lioma Private Company Estevao Chico
Government of Nampula Province – Provincial Direction of Agri-
culture
Government Agriculture Depart-
ment Nampula Pedro Dzucule
Green Belt Private Company Beira Porky Smith
Groundnuts Farmer Nametil Producer
Grupo Madal Private Company Quelimane Manuel Barbosa, Managing Director
Higest Private Company Maputo Américo Marques
Hoyo Private Company Rito Muaquiua, Production Manager
Hoyo-Hoyo Private Company Ruace Rito Muaquiua
IITA Research Institute Steve K Boahen
Ikuru Private Company Nampula Dinesh Singh
IKURU Private Company Mario Santos, Inputs Manager
IKURU SARL Private Company Dinesh Singh, Executive Director
INOVAGRO NGO Nampula Celso Ruface
INOVAGRO NGO Zambezia Carlos Malita
INOVAGRO NGO Nephas Munyeche, Project Manager
Intertek Private Company Beira Danie de Plessis
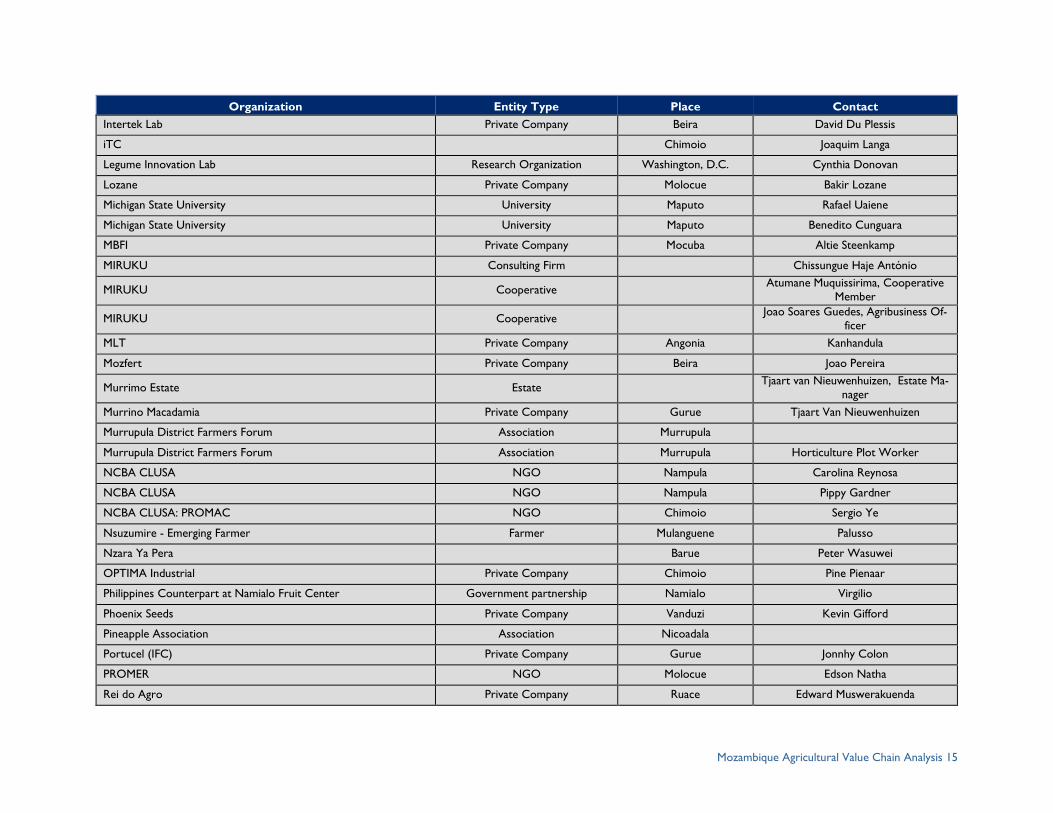
Mozambique Agricultural Value Chain Analysis 15
Organization Entity Type Place Contact
Intertek Lab Private Company Beira David Du Plessis
iTC Chimoio Joaquim Langa
Legume Innovation Lab Research Organization Washington, D.C. Cynthia Donovan
Lozane Private Company Molocue Bakir Lozane
Michigan State University University Maputo Rafael Uaiene
Michigan State University University Maputo Benedito Cunguara
MBFI Private Company Mocuba Altie Steenkamp
MIRUKU Consulting Firm Chissungue Haje António
MIRUKU Cooperative Atumane Muquissirima, Cooperative
Member
MIRUKU Cooperative Joao Soares Guedes, Agribusiness Of-
ficer
MLT Private Company Angonia Kanhandula
Mozfert Private Company Beira Joao Pereira
Murrimo Estate Estate Tjaart van Nieuwenhuizen, Estate Ma-
nager
Murrino Macadamia Private Company Gurue Tjaart Van Nieuwenhuizen
Murrupula District Farmers Forum Association Murrupula
Murrupula District Farmers Forum Association Murrupula Horticulture Plot Worker
NCBA CLUSA NGO Nampula Carolina Reynosa
NCBA CLUSA NGO Nampula Pippy Gardner
NCBA CLUSA: PROMAC NGO Chimoio Sergio Ye
Nsuzumire - Emerging Farmer Farmer Mulanguene Palusso
Nzara Ya Pera Barue Peter Wasuwei
OPTIMA Industrial Private Company Chimoio Pine Pienaar
Philippines Counterpart at Namialo Fruit Center Government partnership Namialo Virgilio
Phoenix Seeds Private Company Vanduzi Kevin Gifford
Pineapple Association Association Nicoadala
Portucel (IFC) Private Company Gurue Jonnhy Colon
PROMER NGO Molocue Edson Natha
Rei do Agro Private Company Ruace Edward Muswerakuenda
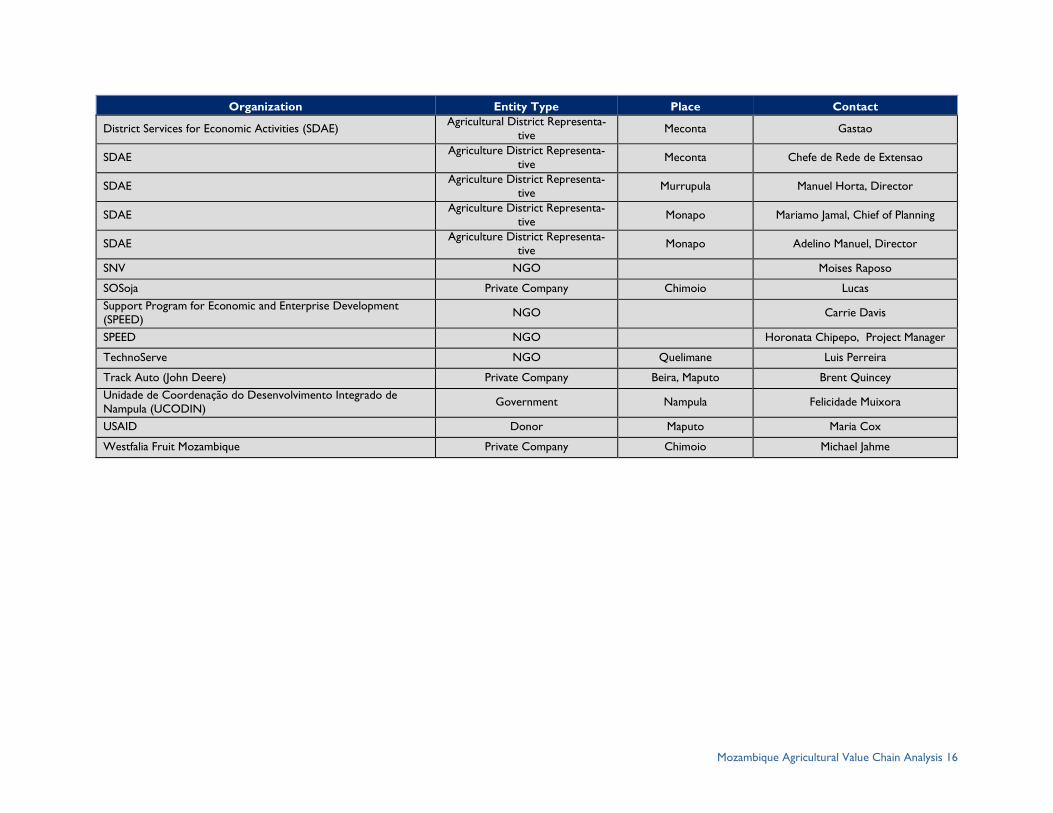
Mozambique Agricultural Value Chain Analysis 16
Organization Entity Type Place Contact
District Services for Economic Activities (SDAE) Agricultural District Representa-
tive Meconta Gastao
SDAE Agriculture District Representa-
tive Meconta Chefe de Rede de Extensao
SDAE Agriculture District Representa-
tive Murrupula Manuel Horta, Director
SDAE Agriculture District Representa-
tive Monapo Mariamo Jamal, Chief of Planning
SDAE Agriculture District Representa-
tive Monapo Adelino Manuel, Director
SNV NGO Moises Raposo
SOSoja Private Company Chimoio Lucas
Support Program for Economic and Enterprise Development
(SPEED) NGO Carrie Davis
SPEED NGO Horonata Chipepo, Project Manager
TechnoServe NGO Quelimane Luis Perreira
Track Auto (John Deere) Private Company Beira, Maputo Brent Quincey
Unidade de Coordenação do Desenvolvimento Integrado de
Nampula (UCODIN) Government Nampula Felicidade Muixora
USAID Donor Maputo Maria Cox
Westfalia Fruit Mozambique Private Company Chimoio Michael Jahme