
MotorcycleBanandTrafficSafety:Evidencefroma Quasi ...
13
Research Article Motorcycle Ban and Traffic Safety: Evidence from a Quasi-Experiment at Zhejiang, China Jingjing Chen , 1 Qian Wang , 1 and Jie Huang 2 1 School of Economics, Hangzhou Normal University, Hangzhou 311121, China 2 School of Public Affairs, Zhejiang University, Hangzhou 310012, China Correspondence should be addressed to Jingjing Chen; [email protected] Received 29 May 2021; Revised 5 August 2021; Accepted 2 September 2021; Published 27 September 2021 Academic Editor: Xinqiang Chen Copyright © 2021 Jingjing Chen et al. is is an open access article distributed under the Creative Commons Attribution License, which permits unrestricted use, distribution, and reproduction in any medium, provided the original work is properly cited. Motorcycle bans have been implemented in many cities across China for long time, one of the main reasons for which is the high death rate of the traffic accidents related to motorcycles’ fast speed and weak safety. is study applies a quasi-experiment on whether or not and when motorcycle bans are implemented in the 11 prefecture cities in Zhejiang Province, taking the prefecture- level cities with motorcycle bans as the experimental group and the others as the control group, so as to identify whether such bans can effectively reduce the number of traffic accidents and deaths, as well as the related internal mechanism. is study concludes that the effect of the motorcycle bans on reducing the number of traffic accident deaths is significant, and their impact does not decrease over time due to the diversity of policies. Further, the mechanism analysis shows that the motorcycle bans have not only reduced the number of motorcycles and thus may improve the traffic safety but also diminished the traffic accidents by reducing the fatality rate. Finally, this study proposes to optimize the motorcycle bans by planning special lanes and strengthening motorcycle management. 1.Introduction Under a series of traffic safety regulations enacted by the state, the level of road traffic safety has been continuously improved, as shown in the continuous decline of road traffic accidents over recent years. By 2019, the number of road traffic accidents had dropped to 247,646 from 773,137 in 2002, decreased by 67.96%; the casualties had fallen by 52.51% from 671,455 to 318,864; and direct economic losses had fallen from 3,088 to 1,346 million yuan, decreased by 56.40%. However, it is clear that traffic accidents still cause a large number of casualties and huge property losses, so road traffic accidents are an important public safety issue and a main cause of deaths and injuries worldwide [1]. e risk of personnel, vehicles, and road environment has become the most important factors for deaths in China [2]. As a transport tool with the convenient, fast, and low- cost characteristics, motorcycles have entered tens of mil- lions of families in China. Although motorcycles bring convenience for people to travel, a series of problems related to motorcycles are becoming more and more serious, for example: illegally operating motorcycles, soliciting passen- gers at will, ignoring traffic orders to compete for business, and disrupting the normal operation of public transport and the road traffic order. As a result, the safety problems caused by motorcycles are on debate frequently since the increasing traffic accidents and high death rates are related to mo- torcycles. e proportion of motorcycle-related traffic ac- cidents in all traffic accidents (in terms of times, deaths, injuries, and property losses) had been on the rise until 2000, and the motorcycle-related deaths rate per 100 accidents reached 35 persons in 1996, which is much higher than the average. With the implementation of the motorcycle bans since early 1990s, the proportion of motorcycle-related accidents and the deaths per 100 accidents began to decrease. erefore, in order to alleviate the traffic safety problems caused by motorcycles, some local governments have for- mulated relevant regulations to restrict or prohibit motor- cycles from being registered with license plates and running in certain prescribed areas or the whole urban roads. As the Hindawi Journal of Advanced Transportation Volume 2021, Article ID 7552180, 13 pages https://doi.org/10.1155/2021/7552180
Transcript of MotorcycleBanandTrafficSafety:Evidencefroma Quasi ...

Research ArticleMotorcycle Ban and Traffic Safety: Evidence from aQuasi-Experiment at Zhejiang, China
Jingjing Chen ,1 Qian Wang ,1 and Jie Huang 2
1School of Economics, Hangzhou Normal University, Hangzhou 311121, China2School of Public Affairs, Zhejiang University, Hangzhou 310012, China
Correspondence should be addressed to Jingjing Chen; [email protected]
Received 29 May 2021; Revised 5 August 2021; Accepted 2 September 2021; Published 27 September 2021
Academic Editor: Xinqiang Chen
Copyright © 2021 Jingjing Chen et al. *is is an open access article distributed under the Creative Commons Attribution License,which permits unrestricted use, distribution, and reproduction in any medium, provided the original work is properly cited.
Motorcycle bans have been implemented in many cities across China for long time, one of the main reasons for which is the highdeath rate of the traffic accidents related to motorcycles’ fast speed and weak safety. *is study applies a quasi-experiment onwhether or not and when motorcycle bans are implemented in the 11 prefecture cities in Zhejiang Province, taking the prefecture-level cities with motorcycle bans as the experimental group and the others as the control group, so as to identify whether such banscan effectively reduce the number of traffic accidents and deaths, as well as the related internal mechanism. *is study concludesthat the effect of the motorcycle bans on reducing the number of traffic accident deaths is significant, and their impact does notdecrease over time due to the diversity of policies. Further, the mechanism analysis shows that the motorcycle bans have not onlyreduced the number of motorcycles and thus may improve the traffic safety but also diminished the traffic accidents by reducingthe fatality rate. Finally, this study proposes to optimize the motorcycle bans by planning special lanes and strengtheningmotorcycle management.
1. Introduction
Under a series of traffic safety regulations enacted by thestate, the level of road traffic safety has been continuouslyimproved, as shown in the continuous decline of road trafficaccidents over recent years. By 2019, the number of roadtraffic accidents had dropped to 247,646 from 773,137 in2002, decreased by 67.96%; the casualties had fallen by52.51% from 671,455 to 318,864; and direct economic losseshad fallen from 3,088 to 1,346 million yuan, decreased by56.40%. However, it is clear that traffic accidents still cause alarge number of casualties and huge property losses, so roadtraffic accidents are an important public safety issue and amain cause of deaths and injuries worldwide [1]. *e risk ofpersonnel, vehicles, and road environment has become themost important factors for deaths in China [2].
As a transport tool with the convenient, fast, and low-cost characteristics, motorcycles have entered tens of mil-lions of families in China. Although motorcycles bringconvenience for people to travel, a series of problems related
to motorcycles are becoming more and more serious, forexample: illegally operating motorcycles, soliciting passen-gers at will, ignoring traffic orders to compete for business,and disrupting the normal operation of public transport andthe road traffic order. As a result, the safety problems causedby motorcycles are on debate frequently since the increasingtraffic accidents and high death rates are related to mo-torcycles. *e proportion of motorcycle-related traffic ac-cidents in all traffic accidents (in terms of times, deaths,injuries, and property losses) had been on the rise until 2000,and the motorcycle-related deaths rate per 100 accidentsreached 35 persons in 1996, which is much higher than theaverage. With the implementation of the motorcycle banssince early 1990s, the proportion of motorcycle-relatedaccidents and the deaths per 100 accidents began to decrease.
*erefore, in order to alleviate the traffic safety problemscaused by motorcycles, some local governments have for-mulated relevant regulations to restrict or prohibit motor-cycles from being registered with license plates and runningin certain prescribed areas or the whole urban roads. As the
HindawiJournal of Advanced TransportationVolume 2021, Article ID 7552180, 13 pageshttps://doi.org/10.1155/2021/7552180

motorcycle bans impair part of the road rights of motorcycleowners to some extent, there are many studies on suchregulations’ legitimacy [3]; meanwhile, there are statistics onthe improvement of traffic safety after implementation of themotorcycle bans, as shown in many local governments’reports. However, there is still a lack of research on thecausal relationship between such bans and traffic safety. *isstudy intends to use a quasi-natural experiment in ZhejiangProvince to discuss their impact on traffic accidents andmake an in-depth analysis of its internal mechanism, bytaking the 4 prefecture-level cities with motorcycle bans(Hangzhou, Ningbo, Shaoxing, and Wenzhou) as the ex-perimental group and the others as the control group. It mayprovide a theoretical basis for the formulation of relevanttraffic safety laws and regulations in the future.
2. Literature Review
It has long attracted the attention of the government andacademia, and the study on the impact factors of trafficaccidents is the focus of many research studies.
One of the branches is about how to assess the direst lossof traffic accidents. It is well known that people are mostrelated to the direct property loss in traffic accidents.Oyetubo et al. [4] found that road traffic accidents are themost important cause of death, leading to many prematuredeaths and delivering great losses. But traffic accident lossesare not caused by a single factor, and such accidents are oftenthe result of a combination of multiple factors [5].
Based on the data from 1997 to 2016 and the VARmodel,Sun and Yang [6] found that the total national income has aninhibitory effect on the number of traffic accident relateddeaths, while the increase in the grade highway mileage andthe number of motor vehicle drivers would boost the deathrate of traffic accidents. By using panel data of traffic-relatedindicators from 2004 to 2015, Sun et al. [7] discovered asignificant correlation among car ownership, traffic accidentdeaths, traffic investment, urban population, and directproperty losses of traffic accidents in China; especially, carownership and urban population are positively correlatedwith direct property losses. *is finding is consistent withsome former literatures, such as research studies byWu et al.[8], Dai [9], and Gao [10]. Furthermore, Ma et al. [11] made aregression analysis on the correlation between motorizationlevel and traffic safety indicators in China from 1952 to 2009,finding that, with the improved motorization level, the deathrate per 10,000 vehicles in China had continued to decline,but the rate of decline slowed down gradually. Huang et al.[12] demonstrates that the increased motor vehicle own-ership is positively correlated with the number of trafficdeaths, i.e., the increase in car ownership will lead to a highernumber of traffic deaths, thus affecting the direct propertylosses from traffic accidents. Some scholars have found thatmore income will inevitably lead to an increase in carownership, which will result in higher traffic accidentmortality and affect the long-term stable development ofChina’s economy [13]. *ere are also some literatures thatdiscussed the evolution of the intelligent traffic and theireffect on traffic accidents [14, 15].
*e above research is of great significance for analyzingthe current situation of road traffic safety and improving thelevel of social governance in China. On the contrary, somestudies on the motorcycle bans have discussed the rationalityand legitimacy of policy formulation [3], as well as theinterpretation of equality and property rights [16]. However,few studies have explored the impact of relevant laws andregulations on traffic safety. *is study intends to discuss theoverall impact, not just the obvious motorcycle-relatedaccidents, and the internal mechanism of the bans in di-minishing traffic accidents, especially in reducing casualties,in order to provide theoretical support for formulatingtraffic safety regulations in the future.
3. Background of Motorcycle Bans
3.1. Motorcycle Bans in China. Cities in China began to takemeasures to ban motorcycles in the early 1990s, and the firstcity to implement such a ban was Beijing, which began to banmotorcycles in 1985. Because of Beijing’s special status as wellas its political and cultural influence, many cities have followedBeijing’s model. So far, a total of 185 cities across the countryhave joined the camp of banning motorcycles. *e imple-mentation of bans on motorcycles has covered a vast majorityof large- and medium-sized cities in the country.
Primary evidence shows that the bans have improved thetraffic safety. From the second half of the curve in Figure 1, itcan be seen that the proportion of motorcycle-related trafficaccidents has slightly decreased since 2002; but due to thetime difference in the implementation of motorcycle bans bydifferent cities, the downward trend was reversed once.However, since 2005, the numbers of both accidents anddeaths/injuries have entered a stable downward channel.Furthermore, besides bans on motorcycles in cities, newrequirements have been imposed on production, sales, andsafety; therefore, the motorcycle-related death rate per 100accidents has also reached a turning point. Since 2005, thenumber of single accident deaths related to motorcycles hasbecome lower than that of other accidents.
On the contrary, the right-of-way of freeways, which aremainly used to connect interregional traffic, is formulated byprovincial administrations. Although nationally, the “Reg-ulation on the Implementation of the Road Traffic SafetyLaw of the People’s Republic of China” does not explicitlyprohibit motorcycles from driving on freeways, there areprovisions on the speed limit for all locomotives on freeways.According to the information collected in this study, thereare 19 provinces restricting or prohibiting motorcycles fromdriving on freeways by means of administrative norms, suchas regulations or management methods, with distinct se-verities detailed listed in Table 1.
3.2. (e Motorcycle Bans in Zhejiang Province. *ere aregreat differences in the time of banning motorcycles onurban roads, and only four prefecture-level cities in ZhejiangProvince have announced such bans, namely, Hangzhou,Ningbo, Shaoxing, and Wenzhou. *e time and content oftheir bans are shown in Table 2.
2 Journal of Advanced Transportation

1995 2000 2005 2010 2015 2020Year
Proportion ofCounts (%)Proportion ofInjured (%)
Proportion ofDeaths (%)Proportion of PropertyLoss (%)
0.3
0.25
0.2
0.15
0.1
0.05
(a)
35
30
25
20
15
1995 2000 2005 2010Year
2015 2020
Average DeathsMotorcycle Related Deaths
(b)
Figure 1: *e trends of motorcycle-related traffic accidents. (a) Proportions of motorcycle-related. (b) Comparation between motorcycle-related and traffic accident average death rate per 100 accidents.
Table 1: Different provinces’ regulations concerning motorcycles on freeways.
ProvinceRegulations
Year Name Details and severity
Guangdong 1989 Interim Measures on Expressway TrafficManagement of Guangdong Province
Do not clearly ban motorcycles on freeways inthe documents, but make statements about thelowest designed maximum speed of the vehiclesthat are forbidden on freeways; the limitation varies
across provinces
60 kmper hour
Hebei 1991 Administrative Measures on Expressways ofHebei Province (for Trial Implementation)
70 kmper hour
Yunnan 1998 Measures on Traffic Management of High-GradeHighways of Yunnan Province
50 kmper hour
Anhui 2004 Regulations on Expressway Management ofAnhui Province
70 kmper hour
Guizhou 2007 Regulations on Road Traffic Safety of GuizhouProvince
60 kmper hour
Heilongjiang 2018 Regulations on Expressway Management ofHeilongjiang Province
70 kmper hour
Shandong 2000 Regulations on Expressways of ShandongProvince
Make clear statement that motorcycles are prohibited onfreeways
Fujian 2003 Regulations on Expressway Management ofFujian Province
Qinghai 2003 Measures for the Administration of High-GradeHighways in Qinghai Province
Shanxi 2003 Interim Measures on Expressway Managementof Shanxi Province
Henan 2004 Regulations on Expressways of Henan Province
Jiangxi 2009Measures on the Implementation of the Law of“*e People’s Republic of China on Road Traffic
Safety” in Jiangxi Province
Ningxia 2013 Regulations on Road Traffic Safety of NingxiaHui Autonomous Region
Jiangsu 2014 Regulations on Expressways of Jiangsu Province
Chongqing 2015 Regulations on Highway Management ofChongqing Municipality
Shanghai 2016 Regulations on the Administration of RoadTraffic of Shanghai Municipality
Hainan 2017 Measures for Traffic Safety Management ofExpressways in Hainan Province
Zhejiang 2005 Measures for Operation and Management ofExpressways in Zhejiang Province Not only banmotorcycles on freeways, but also on expressways
Sichuan 2015 Regulations on Expressways of Sichuan Province
Journal of Advanced Transportation 3

4. The Characteristics and Evolution of theTraffic Safety in Zhejiang Province
4.1. (e Evolution and Current Status of Traffic Safety inZhejiangProvince. Traffic accidents in Zhejiang Province haveexperienced a reversed U-shape trend, where the peak showsup in 2002 or so (Figure 2(a)). In terms of the absolute number,from 1996 to 2002, traffic accidents increased by 179% from22,266 to 62,085; deaths by 22.14% and injuries and propertylosses by more than 1.5 times. After that, accident times, deathnumber, injury number, and property loss were all steadily andcontinuously declining till 2019, at decline rates of 80.82%,57.13%, 79.19%, and 92.94%.*e proportion of property lossesof Zhejiang Province in the whole country exhibits the similartrend in Figure 2(b). However, the proportions of times, deathnumber, and injury number are different, and they basicallyfluctuated in a small range of 7%–9% before 2015, except for afew abnormal years. After 2015, there was a sustained decline,and the proportion of all indicators had decreased to about 5%by 2019 (Figure 2(b)).
*e corresponding changes can also be verified fromthe growth rate of Zhejiang’s traffic accidents. *e growthrate of Zhejiang’s property loss had been higher than thenational average until 2003 (Figure 3(d)), reaching thehighest of 16.11% in 2003. And, the growth rates of times,deaths, and injuries in Zhejiang Province were almost
higher than the national average level before 2005(Figures 3(a)–3(c)).
In terms of deaths and property loss per accident, thereare differences between Zhejiang and the whole country.*edeath per accident in Zhejiang Province was almost all lowerthan the national average for the whole period, as shown inFigure 4, but the property loss per accident was higher thanthe national average before 2005; and, after maintaining theaverage level for five years, it has begun to decrease sig-nificantly since 2011.
4.2. (e Differences in Traffic Safety among Cities in ZhejiangProvince. *e evolution of Zhejiang’s traffic accidents iscomplicated. As mentioned above, the trends of deaths andproperty loss are different at the provincial level. *e situ-ation at the prefectural city level is described as follows. Asshown in Figure 5, Hangzhou delivered the highest pro-portion of property loss in 2019, while Ningbo delivered thehighest proportion of death in that year. Almost all the cities(except Zhoushan) have experienced sustained declines interms of deaths, and the three prefectural cities with thehighest decreasing degrees are Wenzhou, Quzhou, andTaizhou (at −4.87%, −4.44%, and −3.48%, respectively).
Furthermore, when the cities are divided into two groupsbased on the year they began to implement the motorcycle
Table 2: Regulations of motorcycles on urban roads in prefectural cities in Zhejiang Province.
CityFirst announcement Latest renewal
Year Content Year Regulations Content
Hangzhou 2002
No new motorcycles will bepermitted to be registered in themain urban area of Hangzhou, norwill motorcycles be allowed to pass
2016Administrative Regulations on Road
Traffic Safety of HangzhouMunicipality
Motorcycles are not permitted to beregistered in the main districts inHangzhou. *e passage of three-wheeled motorcycles, manpower
tricycles, and other vehiclesprescribed by the Municipal
People’s Government is prohibitedon the roads of the main districts of
Hangzhou
2017
Notice of the People’s Government ofHangzhou Municipality onProhibiting the Passage of
Motorcycles and Manpower Tricycleson the Roads in the Urban Areas of
Hangzhou
All kinds of motorcycles areprohibited on the roads of main
districts
Ningbo 2010Restricting the passage of
motorcycles in some sections of theurban area
2012
Notice of Ningbo Municipal People’sGovernment on Implementing theNew Four Prohibitions of Traffic in
the Central District of Ningbo
Motorcycles (except official vehiclesof law enforcement departmentsand otherwise specified) are
prohibited from passing on theroads in the central area
Wenzhou 2011Restricting the passage of
motorcycles in some sections of theurban area
2013 Notice on Further StrengtheningUrban Traffic Management
No motorcycles are allowed to enterthe urban area, and the license
plates for motorcycles aresuspended at the same time
Shaoxing 2001(1) Motorcycles are prohibited in the first ring of the main urban area; the time and scope vary according to the
registration places for motorcycle license plates(2) Motorcycle license plate registration service will no longer be provided within the main urban area
4 Journal of Advanced Transportation

0
1000
2000
3000
4000
5000
6000
7000
8000
0
10000
20000
30000
40000
50000
60000
70000
80000
1996
1997
1998
1999
2000
2001
2002
2003
2004
2005
2006
2007
2008
2009
2010
2011
2012
2013
2014
2015
2016
2017
2018
2019
Num
ber o
f Dea
th (P
erso
n)
Counts (times)
Property Loss(10 �ousand Yuan)
Number of Injury(Person)Number of Death(Person)
(a)
Proportion of Counts (%)Proportion of PropertyLoss (%)
Proportion of Injury (%)Proportion of Death (%)
0
2
4
6
8
10
12
14
16
18
1996
1997
1998
1999
2000
2001
2002
2003
2004
2005
2006
2007
2008
2009
2010
2011
2012
2013
2014
2015
2016
2017
2018
2019
Prop
ortio
n of
the w
hole
coun
try
(%)
(b)
Figure 2: *e number and proportions of traffic accidents in Zhejiang Province (1996–2019). (a) *e number of traffic accidents. (b) *eproportions of traffic accidents.
-30-20-10
010203040506070
1997
1998
1999
2000
2001
2002
2003
2004
2005
2006
2007
2008
2009
2010
2011
2012
2013
2014
2015
2016
2017
2018
2019
Gro
wth
Rat
e (%
)
Zhejiang's Growth Rate of Counts (%)National Growth Rate of Counts (%)
(a)
Zhejiang's Growth Rate of Death (%)National Growth Rate of Death (%)
-20
-10
0
10
20
30
40
5019
9719
9819
9920
0020
0120
0220
0320
0420
0520
0620
0720
0820
0920
1020
1120
1220
1320
1420
1520
1620
1720
1820
19
Gro
wth
Rat
e (%
)
(b)
Zhejiang's Growth Rate of Injury (%)National Growth Rate of Injury (%)
-30
-20
-10
0
10
20
30
40
50
60
1997
1998
1999
2000
2001
2002
2003
2004
2005
2006
2007
2008
2009
2010
2011
2012
2013
2014
2015
2016
2017
2018
2019
Gro
wth
Rat
e (%
)
(c)
Zhejiang's Growth Rate of Property Loss (%)National Growth Rate of Property Loss (%)
-60-50-40-30-20-10
010203040
1997
1998
1999
2000
2001
2002
2003
2004
2005
2006
2007
2008
2009
2010
2011
2012
2013
2014
2015
2016
2017
2018
2019
Gro
wth
Rat
e (%
)
(d)
Figure 3: Comparison of the growth rate between the national average and Zhejiang Province (1997–2019). (a) Growth rate of counts.(b) Growth rate of deaths. (c) Growth rate of injuries. (d) Growth rate of property loss.
Journal of Advanced Transportation 5

bans, it can be found that there is a clear decline after theimplementation of such bans. As shown in Figure 6(a), forthe same city, all the range of the death numbers after thebans were enacted are lower than that before, intuitivelyindicating the effectiveness of motorcycle bans. Figure 6(b)compares the property loss across the prefectural cities, butthe amounts between 2002 and 2004 for all the cities aremissing due to the data limit, which lead to themissing of theexhibition of Hangzhou’s status before the bans. Averagely,it can be identified that the property losses after the mo-torcycle bans are also less than before.
5. Analysis of the Effect of Motorcycle Bans onthe Traffic Safety in Zhejiang Province byUsing the DID Method
5.1. (e Empirical Strategy. As shown in the above sections,there is a correlation between the decrease in death numberand property loss and the implementation of motorcyclebans. *is section will apply the DID (difference in differ-ence) method to explore the casualty between the motor-cycle bans and the reduction of traffic accidents. *e basicempirical model is set as follows:
Traffic Accidenti,t � α + βPolicyi,t + cZi,t + λi + λt + εi,t,
(1)
where Traffic Accidenti,t implies the death number orproperty loss from traffic accidents in city “i” in year “t,” theindependent variable Policyi,t implies whether or not city “i”applied a motorcycle ban in year “t,” and Zi,t are the controlvariables included. *is study also controls the year (λt) andcity (λi) fixed effect to reduce the possible influences ofunobserved factors.
5.2. (e Variables and Statistics
5.2.1. (e Independent and Dependent Variables. *e keyindependent variable (Policyi,t) is constructed according tothe releasing years of motorcycle bans in 11 prefectural citiesin Zhejiang Province, which are demonstrated clearly inSection 3.2. On the other side, this study constructs twodependent variables (NDi,t and PLi,t) according to the deathnumbers and property loss of the 11 prefectural cities inZhejiang Province during 2002–2019.*e detail statistics arelisted in Table 3.
5.2.2. Control Variables. Besides the main variables, thisstudy also includes control variables that may influence thetraffic safety as follows:
(1) Gross value per person: measured by the natural logof the city’s gross value, represented by symbollnGDPPi,t
(2) Population: measured by the natural log of the city’spopulation, represented by symbol lnPopi,t
(3) Mileage of the graded highway: measured by thenatural log of the mileage of the graded highways in acity, represented by symbol lnHighwayi,t
(4) Number of cars owned by individuals: measured bythe natural log of the number of cars registered in acity by individuals, represented by symbol lnCari,t
(5) Area of the urban roads: measured by the natural logof the area of the urban roads, represented by symbollnURoadi,t
(6) Freight volume on highways: measured by the nat-ural log of freight volume divided by mileages ofhighways, represented by symbol lnFVHi,t
0
0.05
0.1
0.15
0.2
0.25
0.3
0.35
0
0.2
0.4
0.6
0.8
1
1.2
1996
1997
1998
1999
2000
2001
2002
2003
2004
2005
2006
2007
2008
2009
2010
2011
2012
2013
2014
2015
2016
2017
2018
2019
Dea
th p
er A
ccid
ent
Prop
erty
Los
s per
Acc
iden
t
Zhejiang's Property Loss per Accidents (10 thousand yuan)National Property Loss per Accidents (10 thousand yuan)Zhejiang's Death per Accidents (person)National Death per Accidents (person)
Figure 4: Comparison of death number and property loss per accident between the national average and Zhejiang Province.
6 Journal of Advanced Transportation

(7) Passenger volume on highways: measured by thenatural log of passenger volume divided by mileagesof highways, represented by symbol lnPVHi,t
(8) Passenger volume on urban roads: measured by thenatural log of passenger volume divided by the roadarea, represented by symbol lnPVUi,t
*e statistics of control variables are listed in Table 4.
5.3. (e Main Results. *e basic model can be created withtwo equations:
NDi,t � α + βPolicyi,t + cZi,t + λi + λt + εi,t, (2)
lnPLi,t � α + βPolicyi,t + cZi,t + λi + λt + εi,t. (3)
*e results are listed in Table 5. As can be seen, columns(1)–(3) are estimated according to equation (2). It is clearlyshown that, after controlling the year and city fixed effect, themotorcycle bans are found to have delivered significantlynegative effect on the death number. According to column(3), after the motorcycle bans were implemented, the deathnumber decreased by about 137 persons on average per year.However, these bans have no significant effect on property
-6
-5
-4
-3
-2
-1
0
1
2
0
5
10
15
20
25
30
Ave
rage
Gro
wth
Rat
e (20
02-2
019)
Prop
ortio
n in
201
9 (%
)
Average Growth Rate of DeathProportion of DeathProportion of Property Loss
Han
gzho
u
Huz
hou
Jiaxi
ng
Jinhu
a
Lish
ui
Nin
gbo
Shao
Taiz
hou
Zhou
shan
Wen
zhou
Quz
hou
Figure 5: *e proportion of death and property loss, as well as the average growth rate of deaths for 11 cities in Zhejiang Province (2019).
0 500 1,000 1,500Number of Deaths (person)
HangzhouNingbo
WenzhouTaizhou
JinhuaHuzhou
JiaxingLishui
QuzhouZhoushanShaoxing
Before PolicyA�er Policy
(a)
Before PolicyA�er Policy
0 500 1,000 1,500 2,000Property Loss (10 thousand yuan)
TaizhouNingboJiaxing
WenzhouQuzhou
JinhuaHuzhou
LishuiZhoushanShaoxing
Hangzhou
(b)
Figure 6: Comparison of the death number and property loss before and after the motorcycle bans in 11 cities in Zhejiang Province(2002–2019). (a) Number of deaths. (b) Property loss.
Journal of Advanced Transportation 7

loss. *is is understandable from the details of the motor-cycle bans. As mentioned in Section 3, the regulations re-lated to motorcycle bans are generally safety-guided. Forexample, the sales with helmets, compulsory annual in-spection, and limited-service years would all improve theperformance of motorcycles on the road to a certain extendand provide more protection to drivers when an accidenthappens. However, these regulations have no direct effect onpreventing property loss, so it is expected that the regressionresults are insignificant.
As is known, motorcycle bans will be renewed before theexpired date of the current versions, which may lead toweakened executive power during the periods before andafter the expired date.*is study includes twomore variablesto explore whether and how the renewal will influence theeffectiveness of the bans. First, it includes another policyvariable Policy2i,t, which is set to 1 if year “t” equals to or islarger than the year when the motorcycle bans is renewed incity “i;” otherwise, it is set to 0. *e results are listed incolumns (1) and (2) of Table 6. It is clearly shown that thesignificance will decrease a lot when the policy variable ischanged to Policy2i,t; furthermore, the coefficient ofPolicy2i,t becomes insignificant when both policy variablesare included. It suggests that once the motorcycle bans areimplemented, they will be carried out in the same mannerduring the whole covering period, no matter whether or notthey are renewed in the middle of the period. Second, thisstudy constructs variable Gapi,t, which is measured by theyears since implementation, so as to analyze whether theeffect will be weakened over time. *e results, as listed incolumn (3), show that, instead of weakening, the bans en-hance the effect over time. *e negative coefficient of Gapi,t
in column (3) means that the death number will reduce by 13more persons on average for each additional year from thedate of implementation. It maybe due to the limited serviceyears for each motorcycle. After the implementation of thepolicies, a certain number of motorcycles will be scrappedevery year because they had been used for a long time, withmajor problems in performance and safety. *erefore, withthe increase in the number of mandatory scrap of thesemotorcycles, the decrease of death number over time can beexpected. On the contrary, neither the renewal dates nor the
implementation years have significant effect on the propertylosses from traffic accidents (columns (4)–(6)), which isconsistent with the results before.
5.4. Analysis of the Mechanism
5.4.1. (e Role of Motorcycle Numbers. According to Section3.2, in addition to prohibiting or restricting motorcyclesfrom driving within the corresponding areas, the motorcyclebans also stipulate the compulsory scrapping years of mo-torcycles and terminate the registration and licensing ofmotorcycles within certain ranges. *ese mixed policies willcurb the utilization of motorcycles in the short run andfinally reduce the number of motorcycles, while improvingthe performance of motorcycles on road in the long run.*ereduction both in the use and the number of motorcyclesmay have an impact on traffic safety. In order to distinguishthe main channel of motorcycle bans’ effect, this study in-cludes the number of motorcycles (expressed by symbolRMotori,t or UMotori,t) in use to explore the mechanism.First, this study tests whether the motorcycle bans will in-fluence the number of motorcycles in use with the followingequations:
lnRMotori,t � α + βPolicyi,t + cZi,t + λi + λt + εi,t, (4)
lnUMotori,t � α + βPolicyi,t + cZi,t + λi + λt + εi,t, (5)
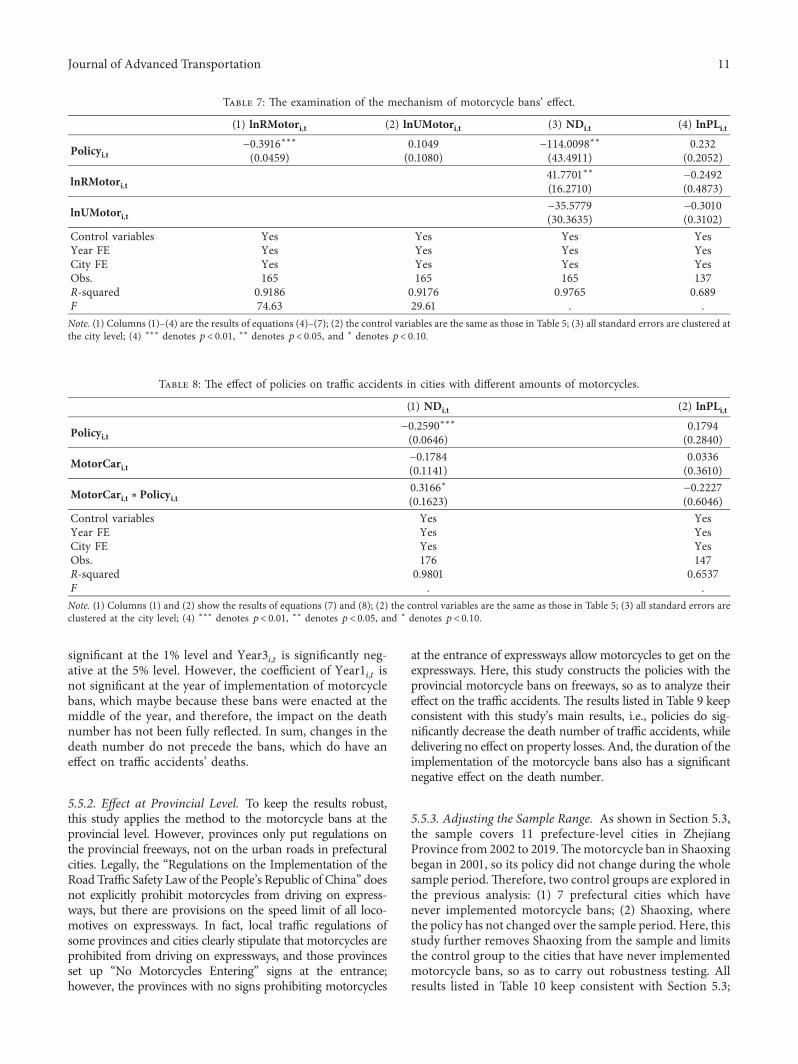
where lnRMotori,t is the natural log of the number ofmotorcycles owned per 100 households in the rural area ofcity “i” in year “t” and lnUMotori,t is the corresponding partin the urban area. *is study finds that the bans have sig-nificantly reduced the number of motorcycles in rural areasby 39.16% on average per year, but not in urban areas(column (1) in Table 7). *is may be due to the fact that, asincomes rise, more people in rural areas have replaced theirmotorcycles with cars since the bans’ implementation, atrend that has not been observed in urban areas. Next, thisstudy includes the number of motorcycles in the basic re-gression equations to explore the exact effect of the bans onthe traffic safety. *e equations are as follows:
NDi,t � α + βPolicyi,t + δ1lnRMotori,t + δ2lnUMotori,t + cZi,t + λi + λt + εi,t, (6)
lnPLi,t � α + βPolicyi,t + δ1lnRMotori,t + δ2lnUMotori,t + cZi,t + λi + λt + εi,t. (7)
As expected, there is no significant effect of the numberof urban motorcycles on either the death number or theproperty loss (columns (4) and (5) in Table 7). However, inrural areas, the number of motorcycles does have positiveeffect on the deaths, which means that the more the mo-torcycles are registered in rural areas, the more the deathsappear in traffic accidents. Furthermore, even when thenumber of motorcycles is controlled, the bans still
significantly reduce the number of deaths in traffic accidents.Compared to the results in column (3) of Table 5, it can beobserved that the number of deaths has been reduced froman average of 131 per year to 114. It is clear that there are twochannels for the motorcycle bans to reduce the number ofdeaths from traffic accidents: one is by reducing the numberof motorcycles, and the other is by diminishing the fatalityrate of motorcycle-related accidents.
8 Journal of Advanced Transportation

5.4.2. (e Heterogeneity Analysis. Given that the number ofmotorcycles is a channel through which the policy works, wefurther explore whether the dependence on motorcycles hasa heterogeneous impact on the effectiveness of the policy. Avariable “MotorCari,t” is included to represent the degree of
the dependence on motorcycles. It will be set to 1 if the ratioof the number of motorcycles to that of cars in city “i” ishigher than the city level average ratio; otherwise, 0. *ebasic models are modified as follows:
NDi,t � α + βPolicyi,t + MotorCari,t + MotorCari,t ∗Policyi,t + cZi,t + λi + λt + εi,t, (8)
lnPLi,t � α + βPolicyi,t + MotorCari,t + MotorCari,t ∗Policyi,t + cZi,t + λi + λt + εi,t. (9)
*e results listed in Table 8 demonstrate that theenforcement of the ban will drive up traffic accidents if thelocal dependence on motorcycles is high, which maybebecause the cities that rely heavily on motorcycles cannotadjust their travel patterns quickly. *erefore, the ban willresult in more speeding and driving violations, thus in-creasing traffic accidents.
5.5. (e Robust Test
5.5.1. (e Parallel Trend Test. Motorcycle bans wereimplemented in different years by these four prefecturecities, so the parallel trend test of multiperiod DID is needed.*is study includes dummy variables “Year ni,t” and“Yearni,t” to represent the intercross term of each time pointand the experimental group, which will be set to 1 if the city
“i” is among the four cities with motorcycle bans in year “t.”Due to different dates of implementation of the bans in thefour cities, the dummy variables are set in the way of relativetime, such as “Year 1i,t” representing 1 year before theimplementing year and “Year1i,t” representing the imple-menting year. *is study considers a 6-year window,spanning from 3 years before motorcycle bans until 2 yearsafter. *ere are 6 dummy variables, including Year 3i,t,Year 2i,t, Year 1i,t, Year1i,t, Year2i,t, and Year3i,t. Take thedummy variable Year 3i,t as an example: it will be set to 1 if“i” equals to Hangzhou, and “t” equals to or is larger than2002 (the implementing year of Hangzhou is 2005); or it willbe set to 1 if “i” equals to Wenzhou, and “t” equals to or islarger than 2008 (the implementing year of Hangzhou is2011). Specifically, this study reports the estimated coeffi-cients from the following regression:
NDi,t � α + β1Year 3i,t + β2Year 2i,t + β3Year_1i,t + β4Year1i,t + β5Year2i,t + β6Year3i,t + cZi,t + λi + λt + εi,t. (10)
Figure 7 plots the results at the 95% confidence intervals(β1 − β6), which are adjusted for prefectural city-levelclustering. As shown, the coefficients of the dummy variablesare insignificantly different from zero for all the years before
motorcycle bans are implemented, with no trends shown intraffic accident deaths prior to the bans. Next, it should benoted that the death number falls down immediately sincethe implementing year; e.g., Year2i,t is negative and
Table 4: *e statistics of the control variables.
Symbols Obs. Mean S. D. p1 p50 p99lnGDPPi,t 198 17.0564 0.7794 15.0855 17.2001 18.3787lnPopi,t 198 6.0399 0.6341 4.6396 6.2037 6.9327lnHighwayi,t 198 8.8816 0.7895 6.7105 9.0031 11.1365lnCari,t 198 12.7334 1.2803 9.4676 12.8027 14.8256lnURoadi,t 177 7.6779 0.8809 5.4596 7.6672 9.1193lnFVHi,t 198 0.1385 0.6402 −1.3180 0.1930 1.6859lnPVHi,t 198 0.3878 0.9776 −2.6574 0.5662 2.3016lnPVUi,t 176 1.9172 0.6569 0.6299 1.8578 3.2883
Table 3: *e statistics of the main variables.
Variables Symbols Obs. Mean S. D. p1 p50 p99Number of deaths NDi,t 198 453.1768 253.1750 42 426.5 1195Property loss PLi,t 158 565.1606 420.1011 106.48 463.55 1780Motorcycle ban Policyi,t 198 0.2626 0.4412 0 0 1
Journal of Advanced Transportation 9

Table 5: *e effect of the motorcycle bans on traffic accidents.
(1) NDi,t (2) NDi,t (3) NDi,t (4) lnPLi,t (5) lnPLi,t (6) lnPLi,t
Policyi,t174.4186∗ −199.9656∗∗∗ −131.4144∗∗∗ 0.3852 −0.15 0.1284(92.9615) (43.3514) (34.1162) (0.3598) (0.1532) (0.2420)
lnGDPPi,t266.2070∗∗∗ 0.2654(75.9064) (0.5088)
lnPopi,t−35.7707 −0.5261(100.8729) (2.0302)
lnHighwayi,t−18.2751 0.4167(57.5881) (0.6762)
lnCari,t227.4016∗∗∗ 0.7366(57.4283) (0.6774)
lnURoadi,t22.9828 −0.3879(26.5765) (0.3335)
lnFVHi,t37.3149 0.215(27.7563) (0.2288)
lnPVHi,t−57.0696 0.1579(31.9788) (0.3724)
lnPVUi,t2.6891 0.0941
(19.6725) (0.1346)Year FE No Yes Yes No Yes YesCity FE No Yes Yes No Yes YesObs. 198 198 176 158 158 147R-squared 0.0924 0.9491 0.9747 0.0283 0.6391 0.6533F 3.52 21.28 85.47 1.146 0.958 1.115Note. (1) Columns (1)–(3) are the results of equation (2) with different regression methods and control variables, and columns (4)–(6) are the correspondingresults of equation (3); (2) all standard errors are clustered at the city level; (3) ∗∗∗ denotes p< 0.01, ∗∗ denotes p< 0.05, and ∗ denotes p< 0.10.
Table 6: *e effect of renewal years and implementation years on traffic accidents.
(1) NDi,t (2) NDi,t (3) NDi,t (4) lnPLi,t (5) lnPLi,t (6) lnPLi,t
Policyi,t−130.8445∗∗ −111.8730∗∗∗ 0.1953 0.1574(52.4445) (31.3434) (0.3258) (0.2756)
Policy2i,t−64.5441 −1.3176 −0.0578 −0.142(40.6017) (50.0523) (0.1346) (0.2282)
Gapi,t−15.0095∗∗∗ −0.0844(4.6574) (0.0594)
lnGDPPi,t281.0779∗∗∗ 265.7261∗∗∗ 216.7671∗∗∗ 0.187 0.2038 −0.0912(74.4448) (73.7577) (57.9715) (0.5456) (0.5535) (0.6546)
lnPopi,t−127.5788 −34.8656 108.8926 −0.3502 −0.434 0.3312(134.1255) (111.9098) (93.6053) (1.8430) (1.9409) (1.5544)
lnHighwayi,t21.0308 −18.1351 −57.2551 0.367 0.4332 0.1895(56.9588) (57.0968) (39.9508) (0.6011) (0.7004) (0.5001)
lnCari,t216.4848∗∗∗ 226.1850∗∗ 76.7828 0.6321 0.5781 −0.2137(56.0718) (80.9098) (70.7397) (0.7461) (0.7737) (0.9407)
lnURoadi,t26.5967 22.9216 2.1885 −0.3927 −0.4006 −0.5439(37.5375) (28.6471) (20.6673) (0.3327) (0.3429) (0.3933)
lnFVHi,t58.5326∗∗ 37.3814 23.1232 0.19 0.2242 0.1735(24.0273) (27.8033) (20.4322) (0.1954) (0.2422) (0.1995)
lnPVHi,t−45.8735 −56.9836 −75.0113∗∗ 0.1402 0.1649 0.0133(37.2978) (31.5081) (25.7593) (0.3467) (0.3828) (0.2561)
lnPVUi,t22.964 2.4711 -12.2346 0.0501 0.0721 0.0106
(22.2077) (17.0063) (15.2524) (0.1523) (0.1386) (0.1808)Year FE Yes Yes Yes Yes Yes YesCity FE Yes Yes Yes Yes Yes YesObs. 176 176 176 147 147 147R-squared 0.9681 0.9747 0.9815 0.653 0.6537 0.663F 848.7 466.7 832.20 1.125 2.526 268.1Note. (1) Columns (1)–(3) are the results of equation (2), including the renewal years and implementation years, and columns (4)–(6) are the correspondingresults of equation (3); (2) all standard errors are clustered at the city level; (3) ∗∗∗ denotes p< 0.01, ∗∗ denotes p< 0.05, and ∗ denotes p< 0.10.
10 Journal of Advanced Transportation
significant at the 1% level and Year3i,t is significantly neg-ative at the 5% level. However, the coefficient of Year1i,t isnot significant at the year of implementation of motorcyclebans, which maybe because these bans were enacted at themiddle of the year, and therefore, the impact on the deathnumber has not been fully reflected. In sum, changes in thedeath number do not precede the bans, which do have aneffect on traffic accidents’ deaths.
5.5.2. Effect at Provincial Level. To keep the results robust,this study applies the method to the motorcycle bans at theprovincial level. However, provinces only put regulations onthe provincial freeways, not on the urban roads in prefecturalcities. Legally, the “Regulations on the Implementation of theRoad Traffic Safety Law of the People’s Republic of China” doesnot explicitly prohibit motorcycles from driving on express-ways, but there are provisions on the speed limit of all loco-motives on expressways. In fact, local traffic regulations ofsome provinces and cities clearly stipulate that motorcycles areprohibited from driving on expressways, and those provincesset up “No Motorcycles Entering” signs at the entrance;however, the provinces with no signs prohibiting motorcycles
at the entrance of expressways allow motorcycles to get on theexpressways. Here, this study constructs the policies with theprovincial motorcycle bans on freeways, so as to analyze theireffect on the traffic accidents. *e results listed in Table 9 keepconsistent with this study’s main results, i.e., policies do sig-nificantly decrease the death number of traffic accidents, whiledelivering no effect on property losses. And, the duration of theimplementation of the motorcycle bans also has a significantnegative effect on the death number.
5.5.3. Adjusting the Sample Range. As shown in Section 5.3,the sample covers 11 prefecture-level cities in ZhejiangProvince from 2002 to 2019.*emotorcycle ban in Shaoxingbegan in 2001, so its policy did not change during the wholesample period.*erefore, two control groups are explored inthe previous analysis: (1) 7 prefectural cities which havenever implemented motorcycle bans; (2) Shaoxing, wherethe policy has not changed over the sample period. Here, thisstudy further removes Shaoxing from the sample and limitsthe control group to the cities that have never implementedmotorcycle bans, so as to carry out robustness testing. Allresults listed in Table 10 keep consistent with Section 5.3;
Table 7: *e examination of the mechanism of motorcycle bans’ effect.
(1) lnRMotori,t (2) lnUMotori,t (3) NDi,t (4) lnPLi,t
Policyi,t−0.3916∗∗∗ 0.1049 −114.0098∗∗ 0.232(0.0459) (0.1080) (43.4911) (0.2052)
lnRMotori,t41.7701∗∗ −0.2492(16.2710) (0.4873)
lnUMotori,t−35.5779 −0.3010(30.3635) (0.3102)
Control variables Yes Yes Yes YesYear FE Yes Yes Yes YesCity FE Yes Yes Yes YesObs. 165 165 165 137R-squared 0.9186 0.9176 0.9765 0.689F 74.63 29.61 . .Note. (1) Columns (1)–(4) are the results of equations (4)–(7); (2) the control variables are the same as those in Table 5; (3) all standard errors are clustered atthe city level; (4) ∗∗∗ denotes p< 0.01, ∗∗ denotes p< 0.05, and ∗ denotes p< 0.10.
Table 8: *e effect of policies on traffic accidents in cities with different amounts of motorcycles.
(1) NDi,t (2) lnPLi,t
Policyi,t−0.2590∗∗∗ 0.1794(0.0646) (0.2840)
MotorCari,t−0.1784 0.0336(0.1141) (0.3610)
MotorCari,t ∗Policyi,t0.3166∗ −0.2227(0.1623) (0.6046)
Control variables Yes YesYear FE Yes YesCity FE Yes YesObs. 176 147R-squared 0.9801 0.6537F . .Note. (1) Columns (1) and (2) show the results of equations (7) and (8); (2) the control variables are the same as those in Table 5; (3) all standard errors areclustered at the city level; (4) ∗∗∗ denotes p< 0.01, ∗∗ denotes p< 0.05, and ∗ denotes p< 0.10.
Journal of Advanced Transportation 11

motorcycle bans have reduced the deaths of traffic accidents,but not the property loss since the year they were releasedand the renewal points have no significant effect on trafficsafety; as more motorcycles are scrapped mandatorily overtime and no new ones are registered, the longer the durationfrom the implementation of bans, the more they will reducethe deaths of traffic accidents.
6. Conclusion
First, the overall effect of motorcycle ban on death numbersis significant negative. And, once the motorcycle ban beginsto be implemented, its effect on traffic safety will remain thesame during the whole covering period, whether it isrenewed in the middle of the period or not. Furthermore,
Table 9: *e effect of provincial motorcycle bans on freeways on traffic accidents.
(1) NDi,t (2) lnPLi,t (3) NDi,t (4) lnPLi,t (5) RMotori,t (6) UMotori,t (7) NDi,t (8) lnPLi,t
Policyi,t−716.8821∗∗∗ −0.3246∗∗∗ −684.8416∗∗∗ −0.3205∗∗∗ −10.3402∗∗∗ 1.2193 −432.5405∗ −0.3021∗∗∗
(186.9944) (0.1151) (170.7719) (0.1075) (2.5857) (1.6112) (226.2643) (0.0666)
Gapi,t−86.6197∗∗ −0.0109(38.5853) (0.0189)
RMotori,t374.5581∗ 0.0855(195.7929) (0.0792)
Obs. 496 496 496 496 279 279 279 279F 7.625 2.413 13 2.215 45.71 1.857 9.641 20.42Note. (1) Columns (1)-(2) are the results of equation (2) at the provincial level, columns (3)-(4) are the results of equation (3) at the provincial level, columns(5)-(6) are the results of equations (4) and (5) at the provincial level, and columns (7)-(8) are the corresponding ones of equations (6) and (7); (2) all controlvariables, year fixed effect, and city fixed effect, are included; (3) all standard errors are clustered at the city level; (4) ∗∗∗ denotes p< 0.01, ∗∗ denotes p< 0.05,and ∗ denotes p< 0.10.
−200
−100
0
100
200
Dyn
amic
Impa
ct o
f Mot
orcy
cle B
ans o
nTr
affic A
ccid
ents
Dea
ths
−3 −2 −1 1 2 3Years relative to motorcycle ban
Figure 7: *e dynamic impact of motorcycle bans on traffic accident deaths.
Table 10: *e regression results of equations (2) and (3) (except for Shaoxing).
(1) NDi,t (2) NDi,t (3) NDi,t (4) NDi,t (5) lnPLi,t (6) lnPLi,t (7) lnPLi,t (8) lnPLi,t
Policyi,t−90.1799∗∗ −144.9302∗∗ −147.8498∗∗∗ 0.2522 0.1553 0.079(35.1041) (48.8175) (28.7343) (0.3609) (0.3033) (0.2258)
Policy2i,t−72.0655 −6.9643 −0.1084 −0.1702(45.2899) (50.7945) (0.1612) (0.2429)
Gapi,t−20.0872∗∗ −0.1091(7.7929) (0.0784)
Obs. 161 161 161 161 134 134 134 134F . 6797 . 81.55 . 1275 . 14.14Note. (1) Columns (1) and (5) are the corresponding ones of columns (3) and (6) in Table 5 excluding observations of Shaoxing, and columns (2)–(4) and(6)–(8) are the corresponding ones of Table 6 excluding observations of Shaoxing; (2) all control variables, year fixed effect, and city fixed effect, are included;(3) all standard errors are clustered at the city level; (4) ∗∗∗ denotes p< 0.01, ∗∗ denotes p< 0.05, and ∗ denotes p< 0.10.
12 Journal of Advanced Transportation

due to more motorcycles subject to mandatory scrap, thedeath number will be more reduced for each additional yearfrom the date of implementation, meaning that the banwould enhance its effect over time.*is study’s results can bereferenced by policy makers for achieving the expected goalof their policies more effectively. For instance, if high speedsand poor performance of motorcycles are the main reasonsfor the high accident rate and fatality rate when they aredriven in the same lanes with cars, a more reasonable andeffective way to diminish such traffic accidents may be todesign a special lane for motorcycles, instead of totallybanning them.
Second, it is suggested that the motorcycle ban be ca-pable of affecting traffic safety via twomechanisms: to cut thefatality rate of motorcycle-related accidents and to reducethe number of motorcycles. As revealed from the results, theimpact of the dwindled number of motorcycles is moresignificant, and the role of the former mechanism is de-livered mainly through mandatory retirement of the mo-torcycles with poor performance. Furthermore, themotorcycle ban and the mandatory retirement can com-plement each other to further suppress traffic accidents. In aword, diversified policies should be formulated to enhancetheir effectiveness (e.g., different limitations in lifetime andspeed for different motorcycles).
Data Availability
No data were used to support this study.
Conflicts of Interest
*e authors declare that they have no conflicts of interest.
Acknowledgments
Chen acknowledges the financial support of research grantsfrom the National Natural Science Foundation of China(71904038, c) and Humanities and Social Sciences Foun-dation of the Ministry of Education of China(17YJC790009).
References
[1] C. Wangdi, M. S. Gurung, T. Duba, E. Wilkinson, Z. M. Tun,and J. P. Tripathy, “Burden, pattern and causes of road trafficaccidents in Bhutan, 2013-2014: a police record review,” In-ternational Journal of Injury Control and Safety Promotion,vol. 25, no. 1, pp. 65–69, 2018.
[2] T. T. Lv, Y. S. Qian, and J. W. Zeng, “Comparison and study ofroad traffic accident in USA and China,” Urban Roads Bridges& Flood Control, vol. 2015, no. 10, 160+191+21 pages, 2015.
[3] F. Deng, City Public Analysis about Motorcycle Ban, South-Central University for Nationalities, Wuhan, China, 2013.
[4] A. O. Oyetubo, O. J. Afolabi, and M. E. Ohida, “Analysis ofroad traffic safety in Minna Niger State, Nigeria,” Logistics &Sustainable Transport, vol. 9, no. 1, pp. 23–38, 2018.
[5] E. Amoros, J. L. Martin, and B. Laumon, “Comparison of roadcrashes incidence and severity between some French
counties,” Accident Analysis & Prevention, vol. 35, no. 4,pp. 537–547, 2003.
[6] H. Sun and G. Y. Yang, “*e combined measurement andcorrelation analysis of deaths in traffic accidents,” Journal ofYanbian University, vol. 44, no. 3, pp. 239–245, 2018.
[7] L. L. Sun, T. Chen, J. Zhao, Q. Wu, and H. Zhao, “Analysis ofthe influencing factors of traffic accident losses and theirregional features in China-a study based on the panel data of31 provinces from 2004 to 2015,” Journal of Southwest Uni-versity (Natural Science Edition), vol. 41, no. 8, pp. 114–123,2019.
[8] L. R. Wu, F. F. Liang, and Z. K. Shi, “China’s trans-logproduction function model of losses of traffic accidents,”Mathematics in Practice and(eory, vol. 40, no. 22, pp. 56–61,2010.
[9] Y. A. Dai, “Spatial econometric analysis on occurrencemechanism of traffic accident in China,” Statistics & Infor-mation Forum, vol. 27, no. 1, pp. 38–43, 2012.
[10] B. Gao, “Construction of the predictive model of traffic ac-cidents based on PLS,” Journal of Liaoning Police College,vol. 19, no. 2, pp. 59–63, 2017.
[11] S. Q. Ma, L. M. Ding, D. Liu, and D. Zhao, “Status andchallenge of road traffic safety in China,” Journal of People’sPublic Security University of China (Science and Technology),vol. 26, no. 4, pp. 35–41, 2020.
[12] J. Huang, H. Y. Ye, and J. Yun, “Laws of traffic accidents ineight provinces and cities of China based on the macro-econometric panel data model,” Safety and EnvironmentalEngineering, vol. 24, no. 4, pp. 105–111, 2017.
[13] J. L. Wang, X. D. Sun, Y. L. He, and T. Xu, “Traffic accidentsmacro model based on panel data,” Journal of Beijing Uni-versity of Technology, vol. 38, no. 4, pp. 575–580, 2012.
[14] X. Chen, L. Qi, Y. Yang et al., “Video-based detection in-frastructure enhancement for automated ship recognition andbehavior analysis,” Journal of Advanced Transportation,vol. 202012 pages, 2020.
[15] X. Chen, Z. Li, Y. Yang, L. Qi, and R. Ke, “High-resolutionvehicle trajectory extraction and denoising from aerialvideos,” IEEE Transactions on Intelligent TransportationSystems, vol. 22, no. 5, pp. 3190–3202, 2021.
[16] X. Qiu, “Legal thinking on the issue of banning motorcycle-examining government behavior from the perspective ofequality right and property right,” Sun Yatsen UniversityForum, vol. 25, no. 6, pp. 375–378, 2005.
Journal of Advanced Transportation 13