
Motivation, expectations and the gender pay gap for UK...
33
Motivation, expectations and the gender pay gap for UK graduates Arnaud Chevalier * (UCD, LSE) Draft 1.0. 10 October 2002 Preliminary and incomplete: Comments welcome Abstract: The gender wage gap has long interested social scientists. Various theories have been put forward to explain the lower wages for women. Due to the richness of the data available, we can test whether employers discriminate against women or whether the gender gap stems from socialisation, differences in educational choice, occupational choice, or labour market attachment. Focussing on recent UK graduates, a wage gap of 12% is found as well as significant gender differences in the subject of graduation, sector of employment and feminisation of the job. Women also tend to be more altruistic and less career oriented than men, character traits that are less rewarded by employers. The unexplained component of the gap is small and a large fraction of the gap can be explained by subject choice, job characteristics, motivation and expectation variables. Two third of women agree that they expect to take career breaks for family reasons and more than 1/3 rd of men expect their partner to sacrifice her career for childrearing responsibilities. These conservative attitudes affect women’s wages even at an early stage of their career and are the single most important determinants of the gender wage gap. Key words: gender wage gap, attitude JEL codes: J16, J13, J29, J70 Acknowledgment: I am grateful to Augustin de-Coulon, Kevin Denny and Tarja Viitanen for comments that improved earlier versions of this paper. All remaining errors are solely mine. * Corresponding author: Arnaud Chevalier, Institute for the Study of Social Change, University College Dublin, Dublin 4, Ireland. Tel: +353 (1) 716 4616, Fax: +353 (1) 716 1108, email: [email protected] and Centre for the Economics of Education, London School of Economics, London WC2A 2AE, [email protected].
Transcript of Motivation, expectations and the gender pay gap for UK...
Motivation, expectations and the gender pay gap
for UK graduates
Arnaud Chevalier* (UCD, LSE)
Draft 1.0. 10 October 2002
Preliminary and incomplete: Comments welcome
Abstract:
The gender wage gap has long interested social scientists. Various theories have been put forward to explain the lower wages for women. Due to the richness of the data available, we can test whether employers discriminate against women or whether the gender gap stems from socialisation, differences in educational choice, occupational choice, or labour market attachment. Focussing on recent UK graduates, a wage gap of 12% is found as well as significant gender differences in the subject of graduation, sector of employment and feminisation of the job. Women also tend to be more altruistic and less career oriented than men, character traits that are less rewarded by employers. The unexplained component of the gap is small and a large fraction of the gap can be explained by subject choice, job characteristics, motivation and expectation variables. Two third of women agree that they expect to take career breaks for family reasons and more than 1/3rd of men expect their partner to sacrifice her career for childrearing responsibilities. These conservative attitudes affect women’s wages even at an early stage of their career and are the single most important determinants of the gender wage gap.
Key words: gender wage gap, attitude
JEL codes: J16, J13, J29, J70
Acknowledgment: I am grateful to Augustin de-Coulon, Kevin Denny and Tarja Viitanen for comments that improved earlier versions of this paper. All remaining errors are solely mine.
* Corresponding author: Arnaud Chevalier, Institute for the Study of Social Change, University College Dublin, Dublin 4, Ireland. Tel: +353 (1) 716 4616, Fax: +353 (1) 716 1108, email: [email protected] and Centre for the Economics of Education, London School of Economics, London WC2A 2AE, [email protected].

I. Introduction
A large literature on the gender wage gap exists (see Altonji and Blank, 1999 or Blau and
Kahn, 2000, for recent surveys or Weichselbaumer and Winter-Ebmer, 2001, for a meta-
analysis). Typically despite the introduction of equal opportunity legislations in the sixties
and seventies, women are still paid between 20% and 40% less then men. Recent estimates
for the UK are in the magnitude of a 20% gender wage gap (Harkness, 1996; Blackaby et al.
1997; Lissenburgh, 2000, Swaffield, 2000). Part of the gap can be explained by differences in
the observed characteristics of both genders, such as education and experience but even
accounting for these factors affecting productivity a substantial gap is left unexplained. This
unexplained gap stems from either non-observed productivity differential or employer
discrimination.
Becker (1971) articulates a model in which the employer’s utility is a function of the
workforce composition rather than purely due to profit maximisation. Employers with a taste
for discrimination would pay men a premium in order to avoid hiring women. Similarly,
employers with a taste for discrimination may not promote women to more senior positions1.
This glass ceiling for women means that discriminating employers would not maximise
employees’ output and thus forgo profits. In a competitive market, discriminating employers
would be driven out of business by profit maximising employers but empirically, the sex ratio
of the firm is not linked to profit nor survival (Hellerstein et al, 2002) even so discriminatory
behaviours in hiring exist (Goldin and Rouse, 2000)2.
1 The lower promotion of women may not follow from employers’ discrimination but from gender differences in non-market opportunities causing women to invest less in the specific human capital required to be promoted (Lazear and Rosen, 1990). 2 Discriminatory behaviours are typically difficult to observe. Using a unique panel of applicants to jobs at 11 symphonic orchestras in the US and detailed information on the hiring process, the authors find that “blind” auditions, in which the gender of the candidate is not revealed to the jury, result in an increased probability of women obtaining the job.
2

Discrimination can also stem from fellow workers and customers. Women may then select
themselves in less discriminating occupations therefore depressing wages in these specific
occupations. Occupational crowding may also generate from social pressure, with women
participating in the labour force being or feeling obliged to work in typically female
occupations.
Alternative hypotheses competing to explain the gender wage gap are numerous. As women
traditionally take career breaks for child rearing reasons, they may choose occupations with
flatter wage profile (Polachek, 1981). As, the wage gap does not increase through time for
full-time individuals permanently employed, the wage gap may stem from lower starting
wage and/or career breaks, which prevent women from climbing the job ladder (Manning and
Robinson, 1999). Also women may also be more likely to work in the public sector for beliefs
that equal opportunity policies would be better implemented (Dickens, 1993) or due to a
belief that public sector offers better family friendly policies. More generally, women may
trade off wages for characteristics of the job improving their family life (shorter commuting,
hours flexibility), thus the gender wage gap can be seen as a compensating differential
(Killingsworth, 1987). Additionally, women may be constrained in their job search by their
partner’s decision and thus not reach the optimal match.
To summarise, men and women are not perfect substitute, this unobserved heterogeneity
accounts for as much as 50% of the gender wage gap (Polachek and Kim, 1994). The
heterogeneity of workers of both genders can be traced in differences in educational choice
(Polachek and Kim, 1994, Chevalier, 2002) and career expectations (Swaffield, 2000, Vella,
1997).
This empirical analysis uses a unique dataset that allows controlling for a large set of
characteristics usually unobserved such as motivation. This data set of young UK graduates;
a homogenous population that has been on the labour market for a maximum of 42 months,
3

limits participation selection, career interruption, glass ceiling and discouragement workers
phenomena. Furthermore, the dataset includes detailed education variables such as grade and
subject as well as career history. The main advantage of this dataset is to include twenty
variables on career and life expectations, thus offering a unique opportunity to unveil some
other components of gender’s heterogeneity. The gender wage gap is then decomposed
including subject of degree, occupational choice and motivations to estimate the relative
effects of these variables at explaining the pay gap.
The paper is organised as follow: the next section explains the reviews various decomposition
techniques. Section 3 reviews the literature on the effect of subject choices, occupational
choices and character traits on wages, and when possible relates it to gender differences in
these variables. The data used for the decomposition is described in section 4 and the results
of the decomposition are presented in section 5.
II methodology
As in the bulk of the literature, we estimate separately for both genders a log wage equation.
iggigig Xw εβ +=ln g = m, f (1)
The left-hand side of (1) is the log wage of individual i of gender g, the determinants of which
are included in a vector Xig. βg is the estimated vector of the returns to gender mean
characteristics and εig is an individual error term. The average gender gap in earning is
decomposed between the mean difference in observed characteristics and the difference in the
returns to these characteristics.
gfmgfmfm XXXww −−+−=−=∆ 1)()(lnln βββ (2)
(2) can be expressed at the mean characteristics of men (m) or women (f). The first term of
(2) is the part of the gender pay gap that can be explained by the differences in the observed
4
characteristics of both groups. The second part, the unexplained component, is the portion of
the gap that is due to differences in the returns to characteristics between the two groups. If
all the determinants of earnings were observed in (2) this will be equivalent to a
discrimination effect. As typically not all the determinants of (2) are observable, we will refer
to this term as the unexplained component of the gender wage gap. The choice of a reference
group to decompose (2) is not innocuous but since neither wage function ( gβ ) would exist in
the absence of discrimination, both choices lead to biased estimates of the explained wage
gap. Rather than giving a weight of one to the wage function of one group and zero to the
other, Cotton (1988) advocated the use of population weight. The wage function that would
prevail in a post-discrimination world ( ) can be approximated as a weighted average of the
one currently faced by both genders. Thus, the gap can be expressed into three components:
*β
m
mf
f
ffmmfm
Nn
Nn
XXXX
βββ
βββββ
+=
−+−+−=∆
*
***
where,
)()()( (3)
The first term in (3) is the explained wage gap measured at the non-discrimination wage
function. The unexplained component is divided into two parts: the advantage of the men
(extra returns compared to what should be observed in a non-discriminatory world) and the
disadvantage of women. Neumark (1988) refutes that the wage function in the absence of
discrimination would simply be the weighted average of the men and women current
functions. Instead, he advocates the use of pooled estimates to approximate . The final
decomposition remains similar to the one presented in (3). Neumark’s decomposition is used
throughout this paper.
*β
The decomposition of the gap between explained and unexplained component is
complemented by an analysis of the fraction of the wage gap that can be attributed to
differences in returns. Starting from the first term in (2):
5

gfmg XX β)( −=∆ (4)
g∆ reflects the increase in female wages estimated at the price of gender g if the endowment
differential were eliminated. However, Brown and Corcoran (1997) point out that such a
measure would not be independent of the metrics used. For example, a dummy variable such
as ethnicity would have opposite effect on the wage differential when the base category is
fixed at white rather than non-white. To avoid these metric problems, Brown and Corcoran
advocates the use of an alternative defined as:
(5) fm ∆−∆=∆
The interpretation of is simply that an elimination of the endowment differential for
variable X, would lead to a pay increase of if estimated at the male prices rather than the
female prices. is small if either the difference in endowment is small or the differences in
the returns are small, thus provides a measure of the contribution of a specific variable to
the wage gap, incorporating differences in endowment and returns.
∆
∆
∆
∆
III literature
3.1 Subject effects
The human capital theory suggests that individuals invest in their education until the current
value of the future earnings associated with the level s of education equals the cost of that
year of education. The cost can be split between the direct cost of education (fees) and the
forgone earnings (wages that could have been obtained during that extra year of education).
Formally, the optimal schooling decision is the value of S for which the net present value of
the steam of income (w) associated with educational level S equals the total cost of an extra
year of education (cost of education, C plus forgone earnings, w(S-1)):
6

)()1())(1(
)1()(1
scswsrswswT
stt
+−=+
−−∑+=
(6)
where r(s) is the discount rate of an individual with education level S and T is the expected
working life of the individual. This simple model can be modified to explain the choice of a
university major, where the probability of success in each subject is included (Montmarquette
et al, 2002). These authors note that for men but not for women, the choice of subject is
based on the financial returns of this decision. Men take more risks of failing for higher
returns while women are more risk adverse, and chose the subject with the greatest prospects
of success and possibly for which they have the highest affinity. These behaviours are
consistent with higher earnings for men but also more educational regret when accounting for
wages (Chevalier, 2002).
While participation to higher education is nearly at parity for the cohort of interest, there are
marked differences in the choice of subjects (see Table 1). Based on the university records,
students segregate themselves by gender with scientific subjects being male dominated while
Arts/Humanities based subjects have a higher female participation. A measure of segregation,
such as the Duncan index suggests that around 30% of women would have to change their
subjects to make the distribution of majors identical between both genders3. Despite large
changes in attendance to higher education and to the gender mix, there is no evidence that
subject segregation by gender has been reduced over the 1985-95 period, as the indices of
segregation are of similar magnitude. Subjects most popular with women are associated with
lower grades (McNabb et al., 2002), higher risk of unemployment and over-education and
lower average pay in general (Chevalier, 2002).
3 The Duncan index (Duncan and Duncan, 1955) is simply defined as ∑
=−=
k
ifimi ppD
1*2/1 , where pmi
(pfi) is the share of the male (female) sample observed in subject i, and k is the number of subjects.
7

[Table 1 around here]
Subject choice impacts on earnings directly and indirectly. A small literature on the returns to
higher education by subject exists. For the UK specifically, large variation in the returns by
subjects is found with scientific majors usually at the top of the distribution and Arts,
Languages and Social Sciences towards the bottom (Chevalier et al., 2002, for a review). For
all majors, the returns are higher for women than for men and the differences are the largest
for Arts and Education graduates. This does not indicate that female graduates earn more
than their male counterparts, but mostly reflects that higher education reduces the gender
wage gap.
Brown and Corcoran (1997) for the US, Baraka (1999) for Taiwan and Machin and Puhani
(2002) for the UK and Germany have specifically estimated the effect of university major on
the gender wage gap. Including subject of graduation typically increases the explained
component of the gender wage gap by 6 to 17 percentage points and a staggering 35% for
Brown and Corcoran using the NLS72. Machin and Puhani also test whether subject
aggregation matters. With the most detailed subject specification (124 and 71 subjects
respectively for the UK and Germany), the increased in the part of the explained wage gap
due to subject dummies doubles for the UK while the increase is less substantial in Germany4.
3.2 Occupation effects
For discrimination, socialisation or taste reasons, women choose different type of occupation
and sector of activity. Figure 1 plots the proportion of graduates employed in the public
4 The high disaggregation of subjects may bias the results of the decomposition. For subjects with a large gender imbalance and a small number of observations, the subject estimates in the wage equation for the “minority” gender are imprecise and are multiply by the mean gender difference in participation (which is large) in order to calculate the explained component of the differential.
8

sector, six months after graduation, in 19935. Almost all graduates from Medicine and to a
lower extent from Education work in the public sector. What is more remarkable is the
statistically significant difference in the proportion working in the public sector by gender;
37% of female graduates work in the public sector 6 months after graduations but only 23%
of males do so. This gender gap in public sector employment is observed for most subjects
and the highest differences are found for graduates from studies allied to Medicine,
Education, Librarianship and Social Sciences. The preference for working in the public
sector and thus encountering a pay penalty between 7% and 12% (Chevalier et al., 2002) may
be due to character traits, or in the case of women, a belief that the public sector provides a
more equal and family friendly environment (Dickens, 1993).
Socialisation affects occupational behaviour in three ways (Corcoran and Courant, 1985).
First, socialisation may affect character traits directly, so that women are more caring and
altruistic than men. Second, children may internalised sex-roles and reproduce them in their
occupational choices; third, socialisation influences the values attached to activities. Hence it
is observed that women’s participation to the labour force is concentrated in a limited number
of occupations. This concentration, which could also be due to discrimination, has a negative
effect on wages (Backer and Fortin, 1999). The penalty for working in a female dominated
occupation is larger for women than men (Brown and Corcoran, 1997) but this finding is not
universal and others reckon that wages are lower for the minority gender in a given
occupation.
3.3 character choice
Recently, economists have integrated character traits to determinants of wages. Leadership,
motivation and self-esteem but also aggression, beauty and cleanness are among the traits
5 This graph is based on the First Destination Survey, a survey of the universe of students conducted 6 months after graduation.
9

positively correlated with wages (see Bowles et al., 2001, for a survey). Even for traits that
appear trivial, the effect on wages can be quite large. For example, increasing beauty from
below average to above average increases the hourly wage of male American lawyers by 14%
(Hamermesh and Biddle, 1994). The impact of these characteristics also differ by gender; in
high occupation status, Osborne (2001) using the UK National Child Development Study
estimates that a one standard deviation change in aggression increases the earnings of men by
20% but reduces those of females by 14%. Due to socialisation, character traits differ by
gender, with women being more altruistic and men selfish and competitive. However, the
main attitudinal difference between men and women concern the childrearing role.
Most of the literature on the gender wage gap has stressed the importance of career
interruptions and family responsibilities, but only a few have incorporated a measure of the
attachment to the labour force. Vella (1994) use an attitude index to divide the population of
young Australian between modern and traditional relative to the role of women and report a
large effect of modernity on female educational attainment (moderns are 10 percentage points
more likely to attend university). Furthermore, it is the nature of the investment and not its
quantity that generates lower returns for individuals with traditional attitudes. Swaffield
(2000) builds a similar index for the British working population and conclude that work
motivation is a significant determinant of wages and since women are less career oriented, the
omission of motivation reduces the explained gender wage gap
IV Data
The empirical evidence is based on a recent cohort of UK graduates thus limiting the effect of
selection in the labour market, disappointment due to discrimination and glass ceiling. The
data originates from a postal survey of individuals who graduated in June 1996 from a sample
of 33 UK tertiary education institutions (Ellias et al., 1998). The individuals were contacted
10

by their university Alumni and the survey includes a complete history of the 42 months
elapsed since graduating. Mature students and individuals with disabilities are excluded and
only individuals graduating with a first degree are kept, leaving a sample of 7,640 graduates.
The survey includes a wealth of information on university attainment and current
employment. One of the drawbacks of the survey is that the annual gross wage is reported in
category, and more importantly, the number of hours worked per week is not reported. Since,
women work on average less than men, the gender wage gap using annual wage is biased
upward. To limit this bias, only full-time employees are kept; this proportion is identical for
men and women (85%) limiting the effect of selection on estimated wages. Finally, we drop
individuals who did not report their current wage or occupation, not living in the UK and with
missing values on the variables of interest; this leaves us with a sample of 5187 graduates.
This dataset is unique as it includes 20 questions on character traits, motivation and
expectations, divided into two sets, with answers coded on a 5 points scale from very
important (1) to unimportant (5)6. The first set deals with job values while the second set
contains career expectations. The distributions of answers to these questions are reported
separately by gender in Tables 2A and 2B. Apart from the importance of status and respect,
leisure and concern with current affair, the long-term values of graduates are gender
differentiated. Men are more likely to state that career development and financial are very
important long-term values, while women put forwards, personal development, job
satisfaction, being valued by employer and doing a socially useful job. On the latter the
gender difference is large, 50% of women agree that a socially useful job is important or very
important, but only 33% of men make the same statement and 35% of them think that it is not
important or unimportant. This difference in the type of jobs wanted explains the high
feminisation of jobs such as teacher and nurse. Women are also more likely to be concerned
6 In order to avoid dropping another 9% of the sample, we recoded individuals with a missing statement to not sure. Xxx redo analysis with and without, does it make any change
11

by local issues and ecology. The gender differences in long-term values are rather consistent
with stereotypes with men being less altruistic than women.
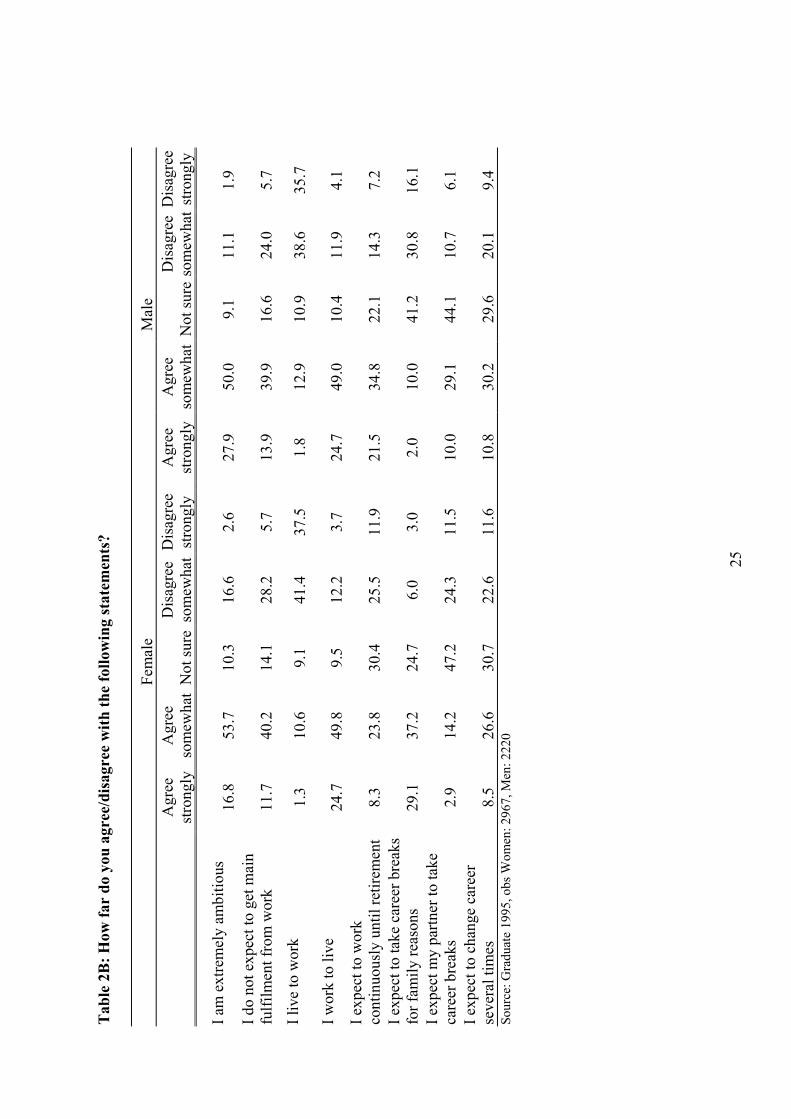
This is backed up with the findings on career expectations, with men being 10 percentage
points more likely to strongly agree that they are extremely ambitious. The only other gender
differences in career expectations concern career breaks. Despite improvements in family
friendly policies, 66% of women still expect to take breaks for family reasons (agree
somewhat or strongly) and only 17% expect their partner to do so. Men favours this
repartition of tasks with 40% of them expecting their partner to take a career break for family
reasons and only 12% of them expecting to do it themselves. Furthermore, the reintegration
to the labour market may not be a priority with a third of women not expecting to work until
retirement. Indices summarising the information on these statements are also constructed7.
The two indices are then normalised. Surprisingly, the two indices are not correlated (-0.05).
All other relevant variables are reported in Table 3. The distribution of wages is reported in
Figure 2. The mean pay in 1998 is £18,500 for women and £21,200 for men, but these mean
characteristics hide differences in the distribution of pay between genders. The distribution is
shifted to the left for women
V results
Traditionally, the pay gap is decomposed between the differences in observed characteristics
between men and women and the differences in the returns to characteristics by gender; the
latter terms reflecting the unexplained part of the differential. A large share of the wage gap
is usually left unexplained. We argue that gender differences in the educational choices
(majors) career choices (occupation) and expectations (character traits), typically not included
7 The indices are constructed by allocating points to the answers, 5 for strongly agree to 1 for strongly disagree, after adjusting the questions for career orientations, thus personal development, job satisfaction, socially useful job, concern in local issue, ecology and current affairs were inverted. Similarly, the statements concerning fulfilment from work, I work to live and expect to take career breaks, that are negative values as far as career are concerned were inverted to calculate the career expectations index.
12

in the decomposition, should account for differences in taste and socialization, therefore
identifying the unexplained component of the wage gap. The remaining unexplained
component may then be interpreted as resulting from some form of discrimination, if we
believe that all relevant controls have been included. However, educational and occupational
choices as well as character traits may themselves be the results of discrimination and
socialisation, so it is more appropriate to keep the terminology of explained and unexplained
components.
Various variables determine the wages of individuals independently from their gender; these
variables are typically age, work experience, education and other personal or job
characteristics. Since, the population of interest in this study is rather homogenous, the
variation in wages is limited and the raw gender gap in yearly gross wage is “only” 12.4%.
This gap can be decomposed between a component due to gender differences in the mean
observed characteristics and two components reflecting the disadvantage of women and the
advantage of men compared to an “average” individual in a non-discriminating world.
The base model is estimated with a parsimonious specification including a quadratic in labour
market experience, and dummies for graduating after the age of 24, being white and region of
residence. Due to the specificity of the population, this base model explains only 10% of the
wage gap suggesting that in the early months of graduates’ careers, the variation in the
endowment in these observed variables is limited.
As reported in Table 4, the second specification includes various measures of educational
achievement such as A-level score, degree results, institution type and post-graduate
achievements which broadly speaking are correlated with ability. These variables account for
60% of the explained wage gap and their inclusion double the proportion of the gender wage
gap that can be explained by differences in endowment to 20%. However, the inclusion of
controls for the subject of graduations (model 2’) eliminates the explanatory powers of these
13

educational variables. Thus, the wage gap for graduates does not originate in differences in
educational attainment but from subject segregation with women graduating from subjects
with lower financial returns. Model 2 findings stems from the differences in A-level
achievements, probability of gaining first honours and institution type by subjects, rather than
gender differences in these characteristics. Subject of graduations alone account for almost
90% of the explained wage gap, raising concern on the conclusions of other empirical work
where these variables were not included. The origin of this segregation can be found in
socialisation, discrimination and character differences.
In order to test for discrimination at the work place, the base model is enriched with
characteristics of the work place (size, sector), type of contract and feminisation8 of the
occupation. These variables account for 90% of the explained wage gap, which rises to 56%
of the raw gap. Typically, differences in firm type, contracts and feminisation by gender are
large. It can be argued that these variations stem from employers discrimination or social
pressure and therefore does not allow any conclusion on employers’ discrimination.
Specification 3’ also adds dummies for occupational group. This follows from arguments on
the glass ceiling and the concentration of women in jobs at the bottom of the socio-economic
ladder and their lower promotions to high paying jobs. Since, the observed graduates have
been in the labour market for 42 months, differences in promotions are likely to be reduced
and the current positions occupied mostly reflects the point of entry. The inclusion of these
variables has no (even negative) effect on the explained wage gap, suggesting that early on in
their career, there is no gender difference in the occupational attainment of graduates. This
result could also stem from the broad definition of social group used here (Kidd and Shannon,
1996).
8 This is constructed at the 2-digit occupational code level from the 1996 Labour Force Survey, quarter 3, for all employees aged 16-59. Backer and Fortin (1999) state that results on the effect of feminisation on the gender wage gap are sensitive to the level of aggregation of the feminisation variable. Two-digit level is the most detailed level of aggregation attainable with the graduate dataset.
14

Models 4 and 4’ extend the base model by adding information on the character of the
individuals, respectively, the character scores or the 20 individuals character traits.
Surprisingly, these two models lead to different conclusions. Normalised scores have no
effect on the model and do not reduce the gender wage gap, while the model including all
character traits explains 64% of the raw gap; job expectations account for 52% of the
explained gap and career expectations for another 39%. Thus, character traits and
expectations differences between genders are a main determinant of the wage gap. The origin
of these differences are difficult to determine, but as stated by Corcoran and Courant (1985)
“socialization may directly affect workers’ skills and personality traits (p275)”, thus policies
reducing the gender wage gap could only be effective in the long-run after attitudes have been
adjusted, which is consistent with the observations that after the rapid reduction of the wage
gap when equal opportunity laws were introduced, progress have been much slower.
Model 5 and 5’ include all the covariates. Model 5 explains 58% of the wage gap; most come
from the job specific characteristics. The effect of the education variables, which in model 2
accounted for 60% of the explained wage gap, is halved. The full model (5’) explains 84% of
the wage gap, with the advantage of men and disadvantage of women being almost equal.
Differences in job and career expectations account for the bulk of the explained gap but the
introduction of these expectation variables does not eliminate the effect of subject segregation
and job characteristics. Socialisation affects the educational and occupational choices of
young graduates as well as their job and career expectations, but these variables are not
perfectly correlated and should all be included in a wage gap analysis.
In order to assess in more details the factors responsible for the wage gap, we now reports the
wage estimates for our preferred specification (5’). Due to the young age of the population the
experience profile is inverted for the first 18 months. Even accounting for labour market
experience, workers aged 26-29 earn 6% more than younger graduates. As expected graduates
15

living in the tighter and more costly labour markets are paid a premium and there is no ethnic
discrimination. For these base-model variables no gender variation in the returns is found, but
since the men have 8% more month of work experience than women (Table 3), an
equalisation would have some effect on the gender wage gap (Delta is reported in Table 5,
using (5). The sum of the for the base model is nil; these variables have no effect on the
gender wage gap of graduates.
∆
The type of institution attended has a substantial effect on returns for both genders, older
institutions providing either more able graduates or a network effect. The premium to
attending an older institution rather than a 60’s university is larger for men. Other signal of
ability also provide important returns; a first class honour increases wages by 5 to 12%
compare to other grades and the premium compared to an upper second honour is
significantly larger for women. Since women are also more likely to obtain a 2/1, a levelling
to the men’s standard would penalise women. Even if variations in the mean educational
characteristics and their returns are apparent, most education variables have insignificant or
negative thus their global impact on the gender wage gap is negative ( =-0.003). ∆ ∆
Arts graduates have the lowest returns to tertiary education, and are penalised by 19%
compared to female graduates in Maths or Medicine; the wage gap penalty for graduating
from arts rather than those subjects is even larger for men. Added to the gender variation in
the choice of degree, the gender differences in returns means that these variables contribute to
the gender wage gap; Maths, Medicine and Engineering all have ∆ around .005.
Women are more likely to work in small firms, possibly for convenience reasons, since as
small firms are more evenly spread, the commuting to work is smaller. Another view is that
women are constrained in their job search by the match realised by their partner. It is
however surprising that these differences are observed at an early career point. Alternatively,
16

differences in confidence and ambitions may explain the gender differences in firm choice. It
is well known that smaller firms pay lower wages, but the spread is less important for women.
Female graduates work in an occupation with 50% more female workers and the wage penalty
associated with working in a female occupation is twice as large as for men. Thus, the wage
penalty associated with working in a female dominated occupation is larger for women, as in
Brown and Corcoran, and the reaches –0.013. Women are as likely as men to get a
permanent contract (80%) but men’s returns to a permanent contract are 70% higher. In
contradiction with the double imbalance whereby pay in the public sector is higher at low
level of the occupational ladder but less at high level, we find that after accounting for
education and various career expectations, graduates in the public sector are better paid than
those in the private sector. This result could stem from differences in the earning profiles in
the two sectors, with flatter profiles and higher starting salaries being found in the public
sector. Women are twice as likely to work in the public sector than men, since typical female
graduate occupations, such as nurses and teachers, are almost exclusively found in the public
sector. Differences in the job characteristics and the returns to these characteristics by gender
are important, and the ∆ for these variables reaches (-0.007).
∆
At the large level of aggregation used, the distributions of occupations are rather similar for
both genders, but the returns do vary, thus these variables contribute to the gap. As seen in
Tables 2A and 2B, large variations in the expectations of men and women are observed.
These measures of motivations are also rewarded differently on the labour market. Women
who are motivated by financial rewards, status, international experience and claim to be
ambitious are rewarded while those favouring career development and surprisingly who
expect to work until retirement suffer from a pay penalty. Men concern with ecological issue
and doing a socially useful job, two female traits, are penalised, while these character traits
had no significant effect on female wages. This could reflect that men with non-traditional
17

motivation are discriminated against. Like women, men who are motivated by financial
rewards, international experience and claim to be ambitious are paid more, but the returns are
somewhat larger for men. Furthermore, those with a traditional attitude regarding the family
(expecting their partner to take a break in her career for family reasons) are also paid 3%
more. The data does not allow us to differentiate between a reward for being traditionalist
and reverse causality, where richer men can support their family and expect their partner to
have a traditional role. These results on attitude towards family roles are in contradiction with
Vella (1994) who reports that modern attitude affects women’s wages positively and has no
effect on male wages. Differences in attitudes towards family role are the main two
determinants of the gender wage gap.
Conclusion
Even looking at a homogenous population of recent UK graduates a wage gap of 12% is
found. The dataset is rich of covariates usually not available in this type of studies, which
allows us to control not only for typical human capital variables but also for the subject of
university study, occupation and character traits. These character traits also measure attitudes
towards childrearing. We found significant gender differences in the subject of graduation,
the sector of employment and feminisation of the job, but also conforming to the stereotypes,
women are more altruistic and men more selfish and career driven. Conform to socialisation
and self-selection models of the gender wage gap, women invest in a different type of human
capital, are more likely to work in the public sector and female dominated occupations. These
differences remain even when accounting for motivation and expectations. With this
extended specification, 84% of the gender wage gap can be explained, so it would appear that
discrimination is limited (at least for this population of recent graduates). However, the
18

differences in subject and occupation choice or characters may be due to some discrimination
and social pressure.
A large proportion of the wage gap originates from attitudes towards childrearing; 2/3rd of
women agree that they expect to take career breaks for family reasons while only 12% of men
do so. Men also expect their partner to sacrifice her career for childrearing responsibilities.
Since change in attitude may be slow, the gender wage gap is likely to persist. Policies to
eliminate it should reduce the disturbance of childrearing duties on women and improve
family friendliness of firms as well as access to childcare services. Such policies would have a
direct effect as well as a long-term effect on socialisation leading to a reduction in the gender
differences in educational, occupational choices, character traits and career expectations.
19

References:
Altonji J. and R. Blank, 1999, Race and Gender in the labor market, in Handbook of Labor
Economics, Vol 3C, O. Ashenfelter and D.Card (eds), North-Holland
Backer M. and N. Fortin, 1999, Occupational gender composition and wages in Canada:
1987-88, National Bureau of Economic Research, WP 7371
Baraka J., 1999, Does type of degree explains Taiwan’s gender gap, Research in
Development Studies, Princeton University, Mimeo
Becker G. (1971) Economics of discrimination, Chicago: The University of Chicago Press
Blackaby D., K. Clark, D. Leslie and P. Murphy, 1997, The distribution of male and female
earnings 1973-91: Evidence for Britain, Oxford Economic Papers, 49, 256-272
Blau F. and L. Kahn, 2000, Gender differences in pay, Journal of Economic Perspective, 14,
75-99
Bowles S., H. Gintis and M. Osborne, 2001, The determinants of earnings: A behavioural
approach, Journal of Economic Literature, 39, 1137-1176
Brown C. and M. Corcoran, 1997, Sex-based differences in school content and the male-
female wage gap, Journal of Human Resources, 15, 431-465
Chevalier A., 2002, Education, motivation and pay of UK graduates; Is it different for girls?,
Institute for the Study of Social Change, UCD, Mimeo
Chevalier A., G. Conlon, F. Galindo-Rueda and S.McNally, 2002a, The returns to higher
education teaching, Department for Education and Skill, Research Report
Chevalier A., P. Dolton, G. Makepeace and S. McIntosh, 2002b, Relative pay in the public
and private sector, Her Majesty Treasury, Research Report
Corcoran M and P. Courant, 1985, Sex role socialization and labor market outcomes,
American Economic Review, 75, 275-278
20
Cotton J., 1988, On the decomposition of wage differentials, Review of Economics and
Statistics, 70, 236-243
Dickens 93
Duncan O. and B. Duncan, 1955, A methodological analysis of segregation index, American
Sociological Review, 20, 210-217
Elias P., A. McKnight, J. Pitcher, K. Purcell and C. Simm, 1999, Moving on: Graduate
careers three years after graduation, CSU/DfEE
Goldin C. and C. Rouse (2000) Orchestrating impartiality: the impact of “blind” auditions on
female musicians, American Economics Review, 90, 715-740
Hamermesh D. and J. Biddle, 1994, Beauty and the labor market, American Economic
Review, 84, 1174-94
Harkness S., 1996, The gender earnings gap: evidence from the UK, Fiscal Studies, 17, 1-36
Hellerstein J., D. Neumark and K. Troske (2002) Market forces and discrimination, Journal of
Human Resources, 37, 353-380
Kidd M. and Shannon M., 1996, Does the level of occupational aggregation affect estimates
of the gender wage gap?, Industrial and labor relations review, 49, 317-329
Killingsworth M., 1987 Heterogeneous preferences, compensating differentials and
comparable worth, Quarterly Journal of Economics, 102, 727-742
Lazear E. and S. Rosen, 1990, Male-female wage differentials in job ladders, Journal of
Labor Economics, 8,S106-S123
Lissenburgh S., 2000, Gender discrimination in the labour market, Policy Studies Institute, RP
3, London
Machin S. and P. Puhani, 2002, Subject of degree and the gender wage differential: Evidence
from the UK and Germany, Department of Economics, IZA,
21

Manning A. and H. Robinson, 1999, “Something in the way she moves”, Centre for
Economic Performance, DP 389, LSE
McNabb R., S. Pal and P. Sloane, 2002, Gender differences in educational attainment: The
case of university students in England and Wales, Economica, 69, 481-503
Montmarquette C., K. Cannings and S. Mahseredjian, 2002, How do young people choose
college major? Economics of Education Review (forthcoming)
Neumark, D. (1988). Employers' Discriminatory Behavior and the Estimation of Wage
Discrimination, Journal of Human Resources, 23, 279-295
Osborne M., 2001, The economic significance of personality: differential rewards by sex and
status, Towson University, mimeo
Polachek S., 1981, Occupational self-selection: A human capital approach to sex differences
in occupational structure, Review of Economics and Statistics, 60-69
Polachek S. and Kim M.K., 1995, Panel estimates of the gender earnings gap, Journal of
Econometrics, 61, 23-42
Swaffield J., 2000, Gender Motivation, experience and wages, Centre for Economic
Performance, London School of Economics, DP 417
Vella F., 1994, Gender roles and human capital investment: The relationship between
traditional attitudes and female labour market performance, Economica, 61, 191-211
Weichselbaumer D. and R. Winter-Ebmer, 2001, The effects of markets, politics and society
on the gender wage differential: A meta-analysis, University of Linz, Mimeo
22
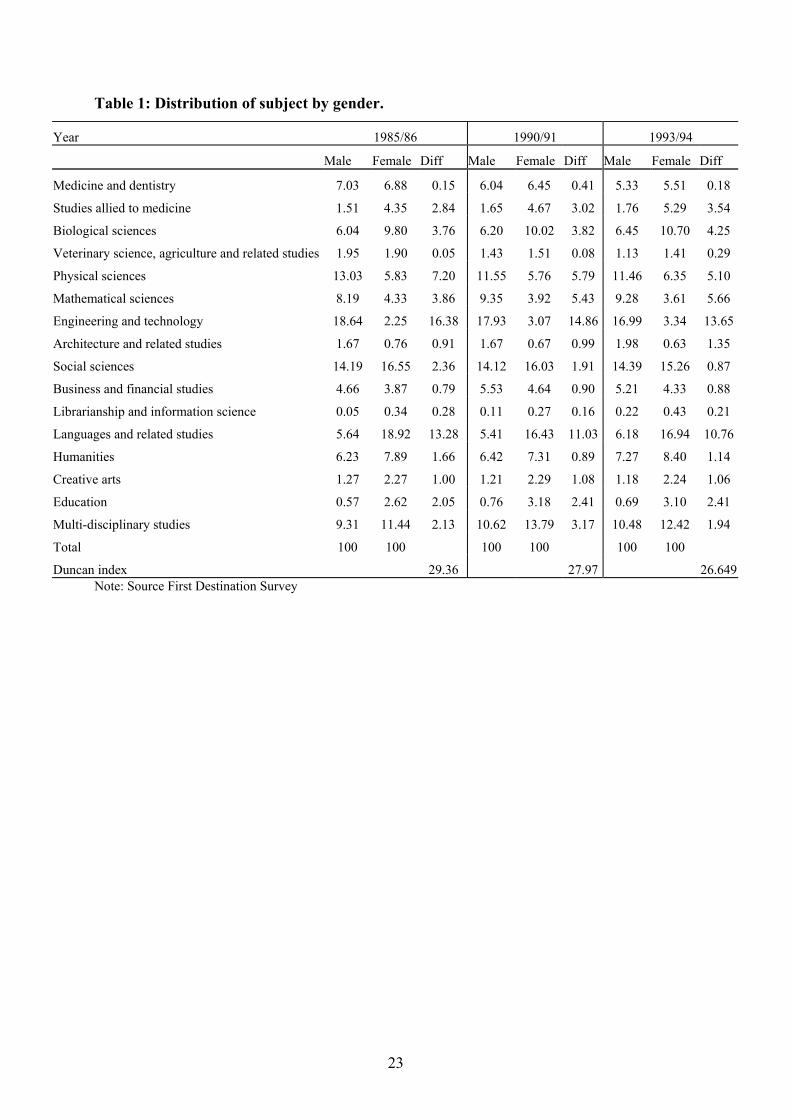
Table 1: Distribution of subject by gender.
Year 1985/86 1990/91 1993/94
Male Female Diff Male Female Diff Male Female Diff
Medicine and dentistry 7.03 6.88 0.15 6.04 6.45 0.41 5.33 5.51 0.18
Studies allied to medicine 1.51 4.35 2.84 1.65 4.67 3.02 1.76 5.29 3.54
Biological sciences 6.04 9.80 3.76 6.20 10.02 3.82 6.45 10.70 4.25
Veterinary science, agriculture and related studies 1.95 1.90 0.05 1.43 1.51 0.08 1.13 1.41 0.29
Physical sciences 13.03 5.83 7.20 11.55 5.76 5.79 11.46 6.35 5.10
Mathematical sciences 8.19 4.33 3.86 9.35 3.92 5.43 9.28 3.61 5.66
Engineering and technology 18.64 2.25 16.38 17.93 3.07 14.86 16.99 3.34 13.65
Architecture and related studies 1.67 0.76 0.91 1.67 0.67 0.99 1.98 0.63 1.35
Social sciences 14.19 16.55 2.36 14.12 16.03 1.91 14.39 15.26 0.87
Business and financial studies 4.66 3.87 0.79 5.53 4.64 0.90 5.21 4.33 0.88
Librarianship and information science 0.05 0.34 0.28 0.11 0.27 0.16 0.22 0.43 0.21
Languages and related studies 5.64 18.92 13.28 5.41 16.43 11.03 6.18 16.94 10.76
Humanities 6.23 7.89 1.66 6.42 7.31 0.89 7.27 8.40 1.14
Creative arts 1.27 2.27 1.00 1.21 2.29 1.08 1.18 2.24 1.06
Education 0.57 2.62 2.05 0.76 3.18 2.41 0.69 3.10 2.41
Multi-disciplinary studies 9.31 11.44 2.13 10.62 13.79 3.17 10.48 12.42 1.94
Total 100 100 100 100 100 100
Duncan index 29.36 27.97 26.649 Note: Source First Destination Survey
23

Tab
le 2
A: A
s far
as l
ong-
term
val
ues a
re c
once
rned
, how
impo
rtan
t are
the
follo
win
g?
Fem
ale
M
ale
V
ery
Impo
rtant
Im
porta
ntN
ot su
re
Not
im
porta
nt U
nim
-po
rtant
V
ery
Impo
rtant
Im
porta
ntN
ot su
reN
ot
impo
rtant
Uni
m-
porta
ntC
aree
r dev
elop
men
t
43
.048
.45.
72.
40.
5
51.8
41.9
4.4
1.7
0.3
Pers
onal
dev
elop
men
t
66.7
31.5
1.6
0.2
0.0
64
.132
.92.
70.
20.
1Jo
b sa
tisfa
ctio
n77
.022
.30.
50.
10.
0
68.2
30.0
1.4
0.2
0.1
Fina
ncia
l rew
ard
14.4
59.0
13.3
12.3
1.0
24
.555
.710
.38.
70.
8St
atus
and
resp
ect
15.8
53.9
17.5
11.7
1.2
16
.851
.317
.311
.82.
8V
alue
d by
em
ploy
er
55.7
41
.1
2.9
0.4
0.0
43
.549
.84.
71.
50.
5So
cial
ly u
sefu
l job
16
.5
35.3
29
.8
15.9
2.
5
7.5
24.8
32.5
25.0
10.2
Inte
rnat
iona
l exp
erie
nce
7.0
18.7
23.1
32.5
18.7
10
.123
.923
.926
.715
.3R
ewar
ding
leis
ure
22.5
35.0
18.4
16.5
7.7
20
.735
.918
.916
.87.
7In
volv
emen
t in
loca
l iss
ues
3.3
21.4
31
.2
32.8
11
.3
2.
211
.926
.035
.224
.6C
once
rn w
ith e
colo
gy5.
023
.729
.429
.912
.0
4.1
20.6
27.0
26.7
21.6
Con
cern
with
cur
rent
aff
airs
5.
5 34
.5
28.9
22
.6
8.4
8.
135
.824
.620
.011
.4So
urce
: Gra
duat
e 19
95, o
bs W
omen
: 296
7, M
en: 2
220
Tab
le 2
B: H
ow fa
r do
you
agr
ee/d
isag
ree
with
the
follo
win
g st
atem
ents
?
Fem
ale
M
ale
A
gree
st
rong
ly
Agr
ee
som
ewha
t N
ot su
re
Dis
agre
e so
mew
hat
Dis
agre
e st
rong
ly
A
gree
stro
ngly
A
gree
so
mew
hat
Not
sure
Dis
agre
e so
mew
hat D
isag
ree
stro
ngly
I am
ext
rem
ely
ambi
tious
16
.8
53
.710
.316
.62.
6
27.9
50.0
9.1
11.1
1.9
I do
not e
xpec
t to
get m
ain
fulfi
lmen
t fro
m w
ork
11.7
40
.2
14.1
28
.2
5.7
13
.9
39.9
16.6
24.0
5.7
I liv
e to
wor
k 1.
310
.69.
141
.437
.5
1.
812
.910
.938
.635
.7
I wor
k to
live
24
.749
.89.
512
.23.
7
24.7
49.0
10.4
11.9
4.1
I exp
ect t
o w
ork
cont
inuo
usly
unt
il re
tirem
ent
8.3
23.8
30.4
25.5
11.9
21
.534
.822
.114
.37.
2I e
xpec
t to
take
car
eer b
reak
s fo
r fam
ily re
ason
s 29
.1
37.2
24
.7
6.0
3.0
2.
010
.041
.230
.816
.1I e
xpec
t my
partn
er to
take
ca
reer
bre
aks
2.9
14.2
47.2
24.3
11.5
10
.029
.144
.110
.76.
1I e
xpec
t to
chan
ge c
aree
r se
vera
l tim
es
8.5
26.6
30.7
22.6
11.6
10
.830
.229
.620
.19.
4So
urce
: Gra
duat
e 19
95, o
bs W
omen
: 296
7, M
en: 2
220
25

Table 3: Summary statistics- Mean (standard deviation) Women Men All Women Men All
Gross pay 18477.93 (6112)
21210.59 (7668)
19647.49 (6953)
Education characteristics Job chracteristics
Alevel score 9.12 (3.81)
8.49 (4.38)
8.85 (4.08) Experience 16.39
(13.09) 18.2
(13.67)0 17.17
(13.37) No A level 0.11 0.17 0.13 Size <10 0.05 0.04 0.05 First-class honours 0.06 0.08 0.07 Size 10-24 0.11 0.06 0.09 Upper second 0.52 0.44 0.49 Size 25-49 0.10 0.07 0.09 Second honours 0.34 0.36 0.35 Size 50-249 0.19 0.19 0.19 Other honours 0.07 0.13 0.09 Size 250-499 0.07 0.08 0.07 Arts 0.15 0.08 0.12 Size 500+ 0.47 0.56 0.51 Humanities 0.10 0.06 0.08 Manager 0.23 0.24 0.23 Languages 0.07 0.02 0.05 Professional 0.38 0.35 0.36
Law 0.04 0.04 0.04 Associate professional 0.20 0.22 0.21
Social science 0.14 0.12 0.13 Clerical 0.14 0.09 0.12 Math & computing 0.04 0.10 0.07 Other occupation 0.06 0.10 0.07
Natural science 0.11 0.12 0.11 % female in occupation 50.23 34.63 43.55
Medicine 0.08 0.04 0.06 Permanent contract 0.81 0.83 0.82 Engineering 0.02 0.21 0.10 Public sector 0.27 0.13 0.21
Business 0.10 0.12 0.11 Personal characteristics
Education 0.10 0.02 0.06 Age 26-29 0.37 0.41 0.39 Other vocational 0.04 0.05 0.05 White 0.95 0.92 0.93 Interdisciplinary 0.02 0.02 0.02 Character traits Old university 0.41 0.41 0.41 Job value -0.02 0.02 0.00 60’s university 0.10 0.11 0.11 Career expectation -0.06 0.08 0.00 90’s university 0.38 0.43 0.40 College of HE 0.12 0.04 0.08 Observation 2967 2220 5187 Post Grad certificate 0.21 0.12 0.17 Professional qualification 0.15 0.15 0.15 Master 0.09 0.11 0.10 Ph.D 0.02 0.02 0.02
Source 1995 cohort

Tab
le 4
: Dec
ompo
sitio
n of
wag
e ga
p
Mod
el
1
22’
33’
44’
55’
Raw
gap
0.
124
Expl
aine
d ga
p
0.01
00.
024
0.06
00.
071
0.06
30.
001
0.08
00.
073
0.10
5
Dis
adva
ntag
e of
wom
en0.
049
0.04
30.
027
0.02
20.
026
0.04
90.
018
0.02
20.
008
Adv
anta
ge o
f men
0.06
50.
057
0.03
60.
023
0.03
50.
065
0.02
50.
029
0.01
1
% e
xpla
ined
by
educ
atio
n va
riabl
es
59
.6
1.7
10.1
1.
0
% e
xpla
ined
by
subj
ect
88.3
23.2
% e
xpla
ined
by
job
char
acte
ristic
s
91.5
94
.0
82.3
28
.2
% e
xpla
ined
by
occu
patio
n
-4
.6
-1
.2
% e
xpla
ined
by
job
valu
e
51
.9
26
.0
% e
xpla
ined
by
care
er e
xpec
tatio
ns
38.9
18.2
N
ote:
Neu
mar
k (1
988)
dec
ompo
sitio
n is
use
d M
odel
1: B
ase
mod
el, e
xper
ienc
e, e
xper
ienc
e sq
uare
d, a
ge d
umm
y 25
-29,
whi
te, r
egio
nal d
umm
ies
Mod
el 2
: Bas
e +
A-le
vel s
core
, typ
e of
inst
itutio
ns, d
egre
e gr
ade,
oth
er q
ualif
icat
ion
dum
mie
s M
odel
2’:
As 2
+ 1
3 su
bjec
t of d
egre
e du
mm
ies
Mod
el 3
: Bas
e +
firm
size
, pub
lic se
ctor
, typ
e of
con
tract
, fem
inis
atio
n M
odel
3’:
As 3
+ 8
dum
mie
s for
occ
upat
ion
Mod
el 4
: Bas
e +
indi
ces o
f job
val
ue a
nd c
aree
r exp
ecta
tion
Mod
el 4
’: B
ase
+ jo
b va
lue
and
care
er e
xpec
tatio
ns d
umm
ies
Mod
el 5
: Mod
el 2
+ m
odel
3 +
mod
el 4
M
odel
5’:
Mod
el 2
’ +m
odel
3’ +
mod
el 4
’


Table 5: Wage functions and Differences in coefficients * differences in means Women Men All Delta
Experience -0.005
-0.005 (2.95)
-0.008 (3.71)
-0.006 (3.68)
Experience2 0.005
0.000 (3.74)
0.000 (4.64)
0.000 (4.70)
Age 26-29 0.000
0.061 (5.99)
0.064 (4.41)
0.061 (7.68)
White 0.000
0.035 (1.57)
0.028 (1.41)
0.028 (1.74)
A-level -0.003
0.005 (1.77)
0.009 (1.92)
0.007 (2.25)
No A-level 0.002
0.035 (0.90)
0.065 (1.23)
0.046 (1.25)
60’s university 0.000
-0.028 (1.27)
-0.043 (2.34)
-0.034 (2.16)
90’s university 0.000
-0.066 (3.62)
-0.073 (2.69)
-0.073 (4.05)
college of HE 0.001
-0.088 (4.78)
-0.095 (2.59)
-0.095 (6.21)
Degree class 2/1 -0.003
-0.082 (4.02)
-0.052 (2.77)
-0.067 (5.14)
Degree class 2/2 0.000
-0.120 (6.24)
-0.121 (5.04)
-0.117 (8.71)
Degree class 3 0.000
-0.095 (2.71)
-0.108 (4.25)
-0.097 (4.14)
Diploma 0.001
-0.024 (1.63)
-0.039 (1.87)
-0.027 (2.67)
Professional qual 0.000
0.027 (1.51)
-0.024 (1.37)
0.001 (0.06)
Masters 0.000
-0.062 (3.58)
-0.035 (1.71)
-0.050 (3.63)
Ph.D 0.000
-0.039 (1.01)
-0.052 (1.80)
-0.049 (2.25)
Humanities -0.002
0.009 (0.59)
0.069 (1.90)
0.024 (1.67)
Languages 0.004
0.084 (4.01)
0.006 (0.13)
0.073 (5.19)
Law 0.000
0.061 (1.93)
0.140 (4.80)
0.098 (3.83)
Social sciences -0.001
0.047 (3.45)
0.105 (3.43)
0.064 (4.34)
Maths & computing 0.005
0.180 (7.84)
0.273 (7.20)
0.232 (8.90)
Natural science 0.001
0.020 (1.10)
0.067 (2.49)
0.040 (2.63)
Medicine & related -0.006
0.196 (6.52)
0.342 (5.02)
0.232 (7.16)
Engineering 0.006
0.139 (4.23)
0.168 (5.95)
0.148 (7.91)
Business studies 0.001
0.133 (7.99)
0.163 (5.19)
0.145 (8.74)
Education 0.000
0.059 (2.81)
0.051 (0.76)
0.068 (3.29)
Other vocational 0.000
0.072 (2.40)
0.094 (2.82)
0.072 (3.36)
Interdisciplinary 0.000
0.098 (2.96)
0.082 (1.67)
0.087 (3.03)
Firm size 10 - 24 -0.001
0.053 (1.97)
0.063 (1.31)
0.056 (2.24)

Firm size 25 - 49 0.002
0.063 (2.57)
0.020 (0.41)
0.046 (2.02)
Firm size 50 - 249 0.000
0.063 (2.63)
0.075 (1.84)
0.060 (2.42)
Firm size 250 - 499 0.001
0.067 (2.20)
0.123 (3.24)
0.091 (3.52)
Firm size 500 or more 0.004
0.129 (5.39)
0.173 (4.44)
0.147 (5.99)
% Female -0.013
-0.002 (5.71)
-0.001 (2.90)
-0.002 (7.05)
Permanent job 0.002
0.091 (5.31)
0.158 (7.19)
0.114 (7.64)
Public sector 0.001
0.078 (3.27)
0.100 (3.34)
0.090 (4.86)
Professional 0.001
0.024 (1.01)
-0.024 (1.21)
-0.000 (0.01)
Associate -0.001
-0.017 (0.74)
-0.042 (2.51)
-0.033 (2.29)
Clerical 0.004
-0.066 (2.09)
-0.145 (3.91)
-0.095 (4.33)
other -0.002
-0.089 (3.00)
-0.142 (6.57)
-0.117 (6.38)
Career development 0.004
-0.028 (3.00)
0.002 (0.13)
-0.017 (1.90)
Personal development 0.000
0.008 (0.68)
0.012 (0.80)
0.008 (0.75)
Job satisfaction 0.001
0.002 (0.13)
-0.004 (0.31)
-0.002 (0.20)
Financial reward 0.003
0.041 (6.87)
0.056 (6.12)
0.048 (8.66)
Status and respect 0.001
0.018 (2.97)
0.002 (0.38)
0.012 (2.85)
Valued by employer 0.000
0.000 (0.00)
-0.002 (0.10)
0.001 (0.07)
Socially useful job 0.006
-0.010 (1.55)
-0.021 (2.50)
-0.017 (3.40)
International experience
0.002
0.010 (1.96)
0.018 (2.43)
0.014 (4.07)
Rewarding leisure 0.000
0.004 (0.87)
0.012 (1.70)
0.006 (1.63)
Concern: local issues 0.000
-0.010 (1.49)
-0.007 (0.69)
-0.010 (2.02)
Concern: ecology 0.003
-0.008 (1.72)
-0.023 (2.65)
-0.017 (3.53)
Concern: c. affairs 0.000
0.004 (0.75)
0.009 (1.30)
0.009 (2.45)
Ambitious 0.001
0.036 (5.20)
0.041 (3.92)
0.037 (6.33)
Fulfilment from work -0.001
0.005 (1.12)
-0.009 (1.69)
-0.001 (0.34)
I live to work 0.001
0.000 (0.03)
0.007 (0.72)
0.004 (0.78)
I work to live 0.000
0.002 (0.30)
-0.001 (0.12)
0.002 (0.55)
Work til retirement 0.001
-0.027 (4.83)
-0.026 (4.62)
-0.028 (7.45)
Career breaks 0.008
-0.003 (0.58)
-0.009 (1.05)
-0.013 (2.97)
Partner take breaks -0.006 0.030 0.016 0.019
30

(1.64) (3.79) (4.71) Career change -0.001
0.000 (0.10)
-0.008 (1.49)
-0.004 (0.99)
Constant
9.686 (130.16)
9.703 (87.15)
9.701 (140.69)
Observations 2967 2220 5187 R-squared 0.37 0.41 0.39
Note: Also include dummies for region of residence. Standard error are corrected for clustering at the institution level
31

Figu
re 1
: Em
ploy
men
t in
Publ
ic S
ecto
r by
Sub
ject
of d
egre
e an
d G
ende
r
0
0.1
0.2
0.3
0.4
0.5
0.6
0.7
0.8
0.91
1. Medicineand dentistry
2. Studiesallied tomedicine
3. Biologicalsciences
4. Veterinaryscience,
agriculture
5. Physicalsciences
6.Mathematical
sciences
7.Engineering
and8.
Architectureand related
9. Socialsciences
10. Businessand financial
studies11.
Librarianshipand
12.Languagesand related
13.Humanities
14. Creativearts
15. Education
16. Multi-disciplinary
studiesGrand Total-all subjects
(UK
Mal
eFe
mal
e
Sour
ce: F
irst D
estin
atio
n Su
rvey
199
3/94

Figure 2: Yearly wage distribution by gender- Cohort 1995
05
101520253035
0-10 10 -12.
12. -15
15 -18
18 -21
21 -24
24 -27
27 -30
30 -33
33 -36
36 -40
> 40
wage in £ 000
%
male female


![untitled1 [repec.org]repec.org/esLATM04/up.9452.1081978301.pdf · Title: untitled1.dvi Author: Ciao Created Date: 4/14/2004 8:45:43 PM](https://static.fdocuments.net/doc/165x107/602a17426064ad493d2cf94a/untitled1-repecorgrepecorgeslatm04up9452-title-untitled1dvi-author.jpg)


