
Motilal Oswal Financial Services...
32
Motilal Oswal Financial Services Ltd Earnings Update | Q4 FY16 & FY16 | Apr 30, 2016 BSE: 532892 ● NSE: MOTILALOFS ● Bloomberg: MOFS:IN ● Reuters: MOFS.BO ● www.motilaloswal.com Efforts into building competencies & capabilities leading to tangible business results
-
Upload
nguyenphuc -
Category
Documents
-
view
217 -
download
0
Transcript of Motilal Oswal Financial Services...

Motilal Oswal Financial Services Ltd
Earnings Update | Q4 FY16 & FY16 | Apr 30, 2016
BSE: 532892 ● NSE: MOTILALOFS ● Bloomberg: MOFS:IN ● Reuters: MOFS.BO ● www.motilaloswal.com
Efforts into building competencies & capabilities leading to tangible business results

Highlights
Business Updates
FinSight
Presentation Plan
Industry Trends

Highlights
Business Updates
FinSight
Presentation Plan
Industry Trends
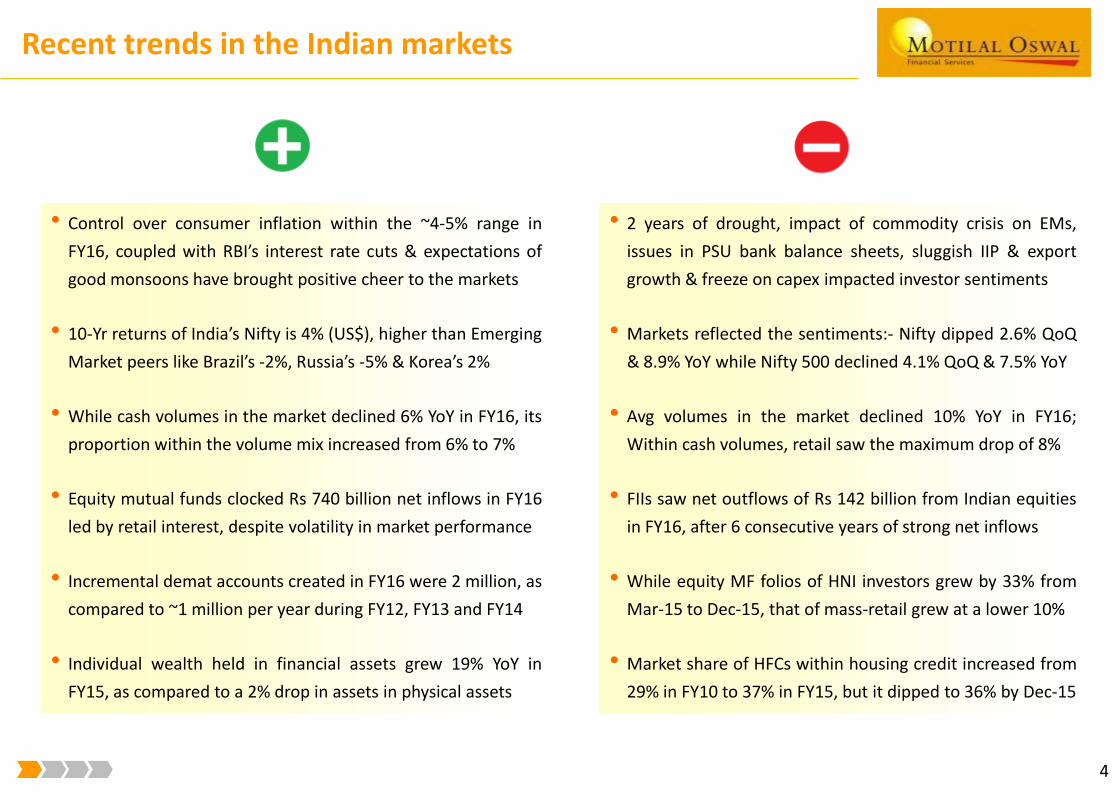
Recent trends in the Indian markets
• Control over consumer inflation within the ~4-5% range in
FY16, coupled with RBI’s interest rate cuts & expectations of
good monsoons have brought positive cheer to the markets
• 10-Yr returns of India’s Nifty is 4% (US$), higher than Emerging
Market peers like Brazil’s -2%, Russia’s -5% & Korea’s 2%
• While cash volumes in the market declined 6% YoY in FY16, its
proportion within the volume mix increased from 6% to 7%
• Equity mutual funds clocked Rs 740 billion net inflows in FY16
led by retail interest, despite volatility in market performance
• Incremental demat accounts created in FY16 were 2 million, as
compared to ~1 million per year during FY12, FY13 and FY14
• Individual wealth held in financial assets grew 19% YoY in
FY15, as compared to a 2% drop in assets in physical assets
4
• 2 years of drought, impact of commodity crisis on EMs,
issues in PSU bank balance sheets, sluggish IIP & export
growth & freeze on capex impacted investor sentiments
• Markets reflected the sentiments:- Nifty dipped 2.6% QoQ
& 8.9% YoY while Nifty 500 declined 4.1% QoQ & 7.5% YoY
• Avg volumes in the market declined 10% YoY in FY16;
Within cash volumes, retail saw the maximum drop of 8%
• FIIs saw net outflows of Rs 142 billion from Indian equities
in FY16, after 6 consecutive years of strong net inflows
• While equity MF folios of HNI investors grew by 33% from
Mar-15 to Dec-15, that of mass-retail grew at a lower 10%
• Market share of HFCs within housing credit increased from
29% in FY10 to 37% in FY15, but it dipped to 36% by Dec-15

Consolidated financials
5
● Revenues up 41% YoY in FY16 due to traction in asset management & housing finance topline
● Operating costs up 20% YoY in the year owing to higher asset management distribution fee
● Employee costs up 32% YoY in FY16 due to hiring in retail broking & housing finance businesses
● Other costs up 25% YoY in asset management & broking owing to branding costs & in housing finance due to branch expansion
Particulars Q4 FY16 Q4 FY15 Q4 FY16 Q3 FY16 FY16 FY15
Rs million Mar 31,
2016
Mar 31,
2015
Mar 31,
2016
Dec 31,
2015
Mar 31,
2016
Mar 31,
2015
Total Revenues 3,159 2,429 30% 3,159 2,960 7% 10,927 7,750 41%
Operating expenses 589 604 -3% 589 606 -3% 2,325 1,945 20%
Personnel costs 714 632 13% 714 639 12% 2,510 1,902 32%
Other costs 432 370 17% 432 414 4% 1,629 1,308 25%
Total costs 1,735 1,606 8% 1,735 1,659 5% 6,464 5,155 25%
EBITDA 1,424 824 73% 1,424 1,300 10% 4,463 2,595 72%
Depreciation 94 94 0% 94 96 -2% 349 307 14%
Interest 654 165 296% 654 490 34% 1,738 309 462%
PBT 676 565 20% 676 715 -5% 2,376 1,979 20%
Tax 197 131 50% 197 206 -4% 657 523 26%
Minority Interest 8 4 119% 8 8 -6% 28 20 43%
Reported PAT 472 429 10% 472 501 -6% 1,691 1,436 18%
EPS - Basic 3.3 2.6 3.3 3.5 11.9 10.3
EPS - Diluted 3.3 2.6 3.3 3.5 11.7 10.1
No.of shares outstanding
(million) - FV Rs 1/share142 139 142 142 142 139
Change
(%)
Y-o-Y
Change
(%)
Y-o-Y
Change
(%)
Q-o-Q

AMC Rank (Equity AUM)
12 in Mar-2016
vs 18 in Mar-2014
Specific KPIs in FY16
Revenues
Rs 11 bn in FY16
41% YoY
PAT Margin
15% vs 19% YoY
Unrealized gains in MFs*
Rs 1.2 bn as of Mar
* Reported ROE does not include unrealised gains on investments in Motilal Oswal’s MF products** Declared Interim Dividends of Rs 2 and Rs 1.5 during the year FY16
Equity Market Share
2.0% in FY16
vs 1.5% in FY15
AUM (MF, PMS, PE)
Rs 133 bn, 61% YoY
Operational performance Financial performance
6
Net Worth Rs 14.4 bn
Gross Debt Rs 23.7 bn
PAT
Rs 1.7 bn in FY16
18% YoY
Net Sales (MF, PMS)
Rs 52 bn, 129% YoY
Dividend
14.1%* Aspire Loan book
Rs 21 bn, 6X YoY
Wealth AUM
Rs 64 bn, 52% YoY
Dividend per share
Rs 3.5 in FY16 **
vs Rs 3 in FY15
Retail Broking Clients
788,957, 7% YoY
ROE (annual)
12.4% vs 11.7% YoY
Aspire NIM
~389 bp in FY16
vs ~400 bp in FY15
Research Coverage
230 to 251 YoY

Key highlights of FY16
7
● PAT of Rs 1.7 bn is near the all-time high clocked by MOFSL Group
● Consolidated performance very robust with a Revenue growth of 41% YoY
● Asset Management and Home Finance businesses were the key drivers, with revenue growth of 77% YoY and
854% YoY respectively
● The revenue contribution of Traditional Capital Markets business (Broking, Wealth Management and
Investment Banking) below 50% in FY16 for first time since inception
● PAT growth lower at 18% due to large investments in manpower (consolidated manpower count up 44% YoY)
and brand-related spends (up 48% YoY) besides decline in market volumes in broking business by 10%
● Asset Management and Home Finance will continue to be meaningful drivers to FY17 performance
● Closure of the first growth capital fund in Private Equity business - IBEF1 in FY17 to be a meaningful contributor
in terms of share of carry and gains on sponsor commitments to IBEF1
● The benefit of upfront investments made in the Traditional Capital Markets business should come through in
coming years

7,750
10,927
FY15 Broking &
Related
IB
Fee
AMC Fee
(incl PE)
Fund
based Inc
HFC
related
Other
Income
FY16
193969
49
(12)
23
1,956
0%1%10%14%
20%3%
20%
16%
2%
2%
47%63%
FY16FY15
Broking & Related
IB Fee
AMC Fee (incl PE)
HFC related
Fund based
Others
Segment-wise revenues
Segment-wise attribution of incremental revenues on YoY basis
8
Change in the revenue mix to asset mgt & fund-based businesses
Particulars Q4 FY16 Q4 FY15 Q4 FY16 Q3 FY16 FY16 FY15
`million Mar 31,
2016
Mar 31,
2015
Mar 31,
2016
Dec 31,
2015
Mar 31,
2016
Mar 31,
2015 Brokerage & operating income 1,265 1,370 -8% 1,265 1,334 -5% 5,091 4,898 4%
Investment banking fees 84 92 -9% 84 36 131% 242 193 25%
Asset management fees 653 567 15% 653 604 8% 2,235 1,266 77%
Fund based Income 247 193 28% 247 345 -28% 1,124 1,102 2%
Housing finance related 899 158 470% 899 627 43% 2,185 229 854%
Other income 12 50 -76% 12 13 -6% 50 62 -20%
Total Revenues 3,159 2,429 30% 3,159 2,960 7% 10,927 7,750 41%
Change
(%)
Y-o-Y
Change
(%)
Y-o-Y
Change
(%)
Q-o-Q
193 49

Balance sheet
9
Rs million As on Mar 31,
2016
As on Mar 31,
2015
Sources of Funds
Networth 14,365 12,949
Loan funds 23,745 7,856
Minority interest 162 63
Deferred tax liability 62 120
Total 38,334 20,988
Application of Funds
Fixed assets (net block) 2,921 3,001
Investments 12,311 8,140
Deferred tax asset - -
Current Assets (A) 35,674 18,307
- Sundry debtors 7,099 5,900
- Cash & Bank Balances 2,867 2,719
- Loans & Advances 24,610 9,606
- Other Assets 1,098 82
Current liabilities (B) 12,572 8,461
Net current assets (A-B) 23,102 9,847
Total 38,334 20,988

Highlights
Business Updates
FinSight
Presentation Plan
Industry Trends

Aspire Home Finance (Affordable
Housing Finance)
Asset Management (PMS)
Asset Management (Mutual Funds)
Private Equity (Real Estate)
Private Wealth Management
Retail Broking & Distribution
Institutional Equities
Investment Banking (M&A Advisory)
Investment Banking (Equity Capital
Markets)
11
Pre-2007 vintage
Since2007
Fund-Based Business
Asset Management businesses
Capital markets businesses
Asset Management (Offshore)
Since2014
**LAS is run only as a support to the Broking business, not as a separate business vertical from operations perspective
Private Equity (Growth Capital)
LAS (NBFC Loan Book)**
Sponsor Commitments (to own MFs & PE funds)
Building a fair mix of capital markets, asset management and fund-based businesses, to drive ROE in the future
“Setting up the stage for the eventual performance”

Broad progress against strategic priorities this year
12
● Traditional Capital Markets businesses
o Broking & Distribution: Building scale by leveragingon advisory, reach, digitization & products
o Institutional Equities: Pitch research as the core USP;Use corporate access to deepen corporate relationships
o Wealth Management: Customized advisory mandatesfor holistic asset allocation
o Investment Banking: Participate in upcoming ECM &M&A mandates
• Market share picked up YoY in both cash & F&O
• Retail clients added per month in FY16 up 2X vs FY14
• Digital business gaining traction
• Asset-product distribution business gaining traction
• Ramped up research coverage & roadshows
• Research continues to win at award forums regularly
• Block execution capability ramped up
• Increase in AUM & client count YoY
• Ramp up of RM base without compromising throughput
• Deepening of client wallet-share
• Participation in IPOs gathering steam
• Worked on few M&A transactions
● Asset Management businesses
o Public Market Equities AMC: Pitch as equity specialistswith our time-tested QGLP investing philosophy
o Private Equity: Capture fundamentally-strong, high-quality & high-growth deal opportunities
• Built scale on the back of investment performance
• Growth of market share with large distributors
• 4 partial-exits & 1 full-exit from growth fund this year
• Real estate funds seen strong traction in fundraisings
● Housing Finance & Other Fund-based businesses
o Aspire Home Finance: Focusing on the niche affordable housing segment in the home finance space
o ROE enhancing sponsor commitments to own AMC & PE funds; and the NBFC LAS book
• Traction in book, reach & clients in small-ticket housing
• Adding bank credit lines to maintain funds flow
• Strong underwriting process in place
• Proven track-record of investing philosophy in AMC funds
• NBFC loan book run with borrowings as spread business

Broking & Fund based activities (MOSL + MOFSL Standalone)
13
● We have made strategic allocation of capital into long term RoE-enhancing opportunities like Aspire Home Finance and
sponsor commitments to our own mutual fund & private equity funds. MOSL and MOFSL Standalone are the primary
vehicles for these Investments
● As of Mar 2016, our investments in Motilal Oswal’s mutual fund products stood at Rs 5.9 billion (unrealised gain of Rs 1.2
billion) and in Motilal Oswal’s alternative investment products stood at Rs 2.0 billion (carried at cost). Our investments into
Aspire Home Finance was Rs 3 billion
● In order to understand the operating results better, it is necessary to have an aggregated view of these two entities as
reflected in table above
● Given the long-term nature of investments in Aspire and sponsor commitments to our asset management products, the
operating results do not fully reflect the intrinsic gains as profits are hardly booked regularly on these investments through
the quarters, which partly explains the drop in profits on QoQ and YoY basis
● Also, significant investments have been made in the Broking business in ramping up manpower, infrastructure, brand and
technology in FY16. The full benefit of these investments would be seen in coming years
● A combination of the above has resulted in drop in profits of 27% on a YoY basis
Above is a line by line consolidation of MOFSL and MOSL P&L adjusted for inter company dividend paid by MOSL to MOFSL
MOSL + MOFSL Standalone
Particulars Q4 FY16 Q4 FY15 Q4 FY16 Q3 FY16 FY16 FY15
Rs million Mar 31,
2016
Mar 31,
2015
Mar 31,
2016
Dec 31,
2015
Mar 31,
2016
Mar 31,
2015
Total Revenues 1,557 1,657 -6% 1,557 1,736 -10% 6,465 6,302 3%
PBT 178 318 -44% 178 396 -55% 1,189 1,731 -31%
PAT 156 229 -32% 156 309 -49% 931 1,271 -27%
Change
(%)
Y-o-Y
Change
(%)
Y-o-Y
Change
(%)
Q-o-Q

Broking Business – Investing for scale
14
Market Volumes:
● Cash equity ADTO at Rs 203 billion in Q4FY16 was down 11% YoY; It was Rs 202 billion in FY16, down 6% YoY
● Retail cash volumes were Rs 100 billion in Q4FY16, down 11% YoY; It was Rs 98 billion in FY16, down 8% YoY
● Institution cash volumes at Rs 60 billion in Q4FY16 was down 12% YoY; It was Rs 62 billion in FY16, up 1% YoY
● FIIs net sold in FY16 after 6 years, despite strong inflows in March month; DIIs net bought in FY16, after 5 years of outflows
MOSL Volumes:
● MOSL ADTO was Rs 67 billion in Q4FY16 (Rs 56 billion in Q4FY15); & Rs 59 billion in FY16 (Rs 51 billion in FY15)
● Overall equity market share was 2.1% in Q4FY16 (1.6% in Q4FY15); & 2.0% in FY16 (1.5% in FY15)
● Market share in both cash & F&O increased YoY, as a result of our investments & focus on both areas
● Due to continued shift of the volume mix towards F&O, the blended yield was 3.5 bp in FY16 vs 4 bp in FY15
MOSL ADTO
17% YoY
Manpower
42% YoY
Market ADTO
10% YoY
Eq. Market Share
2.0% in FY16
vs 1.5% in FY15

● Improvement in retail market share in both cash & F&O
● Avg monthly retail client added in FY16 was 2X of FY14
● Traction in Commodity, Currency & Interest rate futures
● Our digital business is gaining traction:
o 21% clients traded online in FY16, vs 14% last year
o Contribution of online business to total was 21% in
FY16, vs 15% in the previous year
o Mobile app downloads at ~70,000 within 5 months
o Contribution of mobile app to total brokerage crossed
6% in this quarters, vs 4% in the previous quarter
4,061
3,199
1,833
FY16FY15FY14
Monthly runrate in retail client addition
2.2X
1.3X
256227
133
FY16FY15FY14
DP Assets (Rs Bn)
1.9X
1.1X
● Continued investments into quality advisors across
dedicated advisory desks; Advisor count up 65% YoY
● Increased the sales-force across both own & franchisee
channels
● Focusing on advisory productivity & monitoring of
research-call quality
● Focus on distribution to develop an assets-based product
distribution approach vs just a broking approach
● Continuing with our digital-business efforts :-
o India’s 1st broker to launch the “Smart Watch App”,
providing access to market updates, portfolio, etc
o Launched India’s 1st and Fastest 15-Minute Trading &
Demat Account using Paperless-eKYC Aadhar-
Integrated account opening process
o Launched “Business Partner App” to enable them to
monitor their business across metrics on the move
Retail Broking - Advisory, Digital, Products & Reach are Core
15

Institutional equities – Research ideas form the core USP
16
FII/DII Clients
582 to 594 YoY
Manpower
13% YoY
Coverage
230 to 251 YoY
● Focus remains on expanding the market share across the offshore geographies
● Ramped up the research coverage during the year, to 251 companies under coverage
● Introduced new research products like research videos, Voices (reference for earnings calls) and thematic reports like Ind-AS
● Won 11 awards at the ‘Research Bytes Investor Communication Awards 2015’, including Favourite Research House, Head of
Research, Consumer Staples, Industrials, Utilities, Consumer Directory, Financial, Materials, Energy & Multi Sector
● Ranked the Best in Events/Conferences, ranked amongst Top-2 for Overall Sales Services and Best Roadshows/Company
Visits and amongst the Top-3 in Best Local Brokerage, Best Execution and Sales Trading Visits at the AsiaMoney Awards 2015
● During the year, corporate access conducted several roadshows, conferences and outreach events. It was ranked Best in
Events/Conferences at the AsiaMoney Awards 2015

Participating in emerging
ECM opportunities
Investment Banking – Robust pipeline and promising outlook
17
● Successfully concluded one cross-border M&A transaction for an Indian engineering company
● Advised two cement companies in raising structured credit of Rs 7.50+ billion to refinance part of debt &
fund the capex; thereby setting them up to capitalize on the improving fundamentals in the sector
M&A segment
● Received clearance from SEBI for the upcoming IPOs of Parag Milk Foods, Nihilent Technologies & SP
Apparels, wherein MOIAPL is a book running lead manager
● Mandated for a QIP placement by a PSU bank, which is expected in Q1 FY2017
● In advanced stage discussions for raising private equity for firms in IT, consumer & services sectors
ECM segment
M&A pipeline
remains robust
Particulars Q4 FY16 Q4 FY15 Q4 FY16 Q3 FY16 FY16 FY15
Rs million Mar 31,
2016
Mar 31,
2015
Mar 31,
2016
Dec 31,
2015
Mar 31,
2016
Mar 31,
2015
Total Revenues 85 94 -10% 85 38 127% 249 201 24%
EBITDA 22 43 -48% 22 (16) -237% 32 12 162%
PBT 19 39 -50% 19 (20) nm 19 (2) nm
PAT 9 27 -68% 9 (14) nm 8 (1) nm
Change
(%)
Y-o-Y
Change
(%)
Y-o-Y
Change
(%)
Q-o-Q

Private Wealth – Focus on client addition & wallet-share
18
Traction in large clients
& AUM-mandates
Client Families
59% YoY
Wealth AUM
Rs 64.4 bn, 52% YoY
RM-Advisory team
57% YoY
● Significant investment into manpower; 77-member RM & advisory team as of Mar 2016 (49 in Mar 2015)
● Traction in AUM despite challenging markets, largely owing to on-boarding of some large clients
● Lower margins in FY16 is on account of new investments made in manpower, technology and client
engagement activities which are yet to see full throughput; will see benefits of these in coming years
Hiring Quality
Talent
● Unique product offering, combining open-architecture with strong in-house manufacturing capabilities
● Sales continued to be strong in the new IREF III fund
● The Property Advisory team held the Real Estate Expo, showcasing projects of marquee developers
● A differentiated equity strategy was launched for clients with one of our equity partner AMCs, which will
benefit from the impending economic recovery
Holistic mix of
Products
Particulars Q4 FY16 Q4 FY15 Q4 FY16 Q3 FY16 FY16 FY15
Rs million Mar 31,
2016
Mar 31,
2015
Mar 31,
2016
Dec 31,
2015
Mar 31,
2016
Mar 31,
2015
Total Revenues 144 111 30% 144 109 32% 444 299 48%
EBITDA 47 38 24% 47 33 43% 139 98 42%
PBT 39 37 5% 39 22 77% 109 94 16%
PAT 26 27 -3% 26 14 84% 71 65 10%
Change
(%)
Y-o-Y
Change
(%)
Y-o-Y
Change
(%)
Q-o-Q

● Q4FY15 revenues include PMS performance fees of Rs 265 million which was negligible for Q4FY16
● Our industry rank based on Equity PMS + MF AuM improved to 12, from 14 in FY15 & 18 in FY14
● Amongst the fastest growing equity AMCs in India; AUM crossed the milestone of Rs 100 billion
● Building an Investment-focused B2B sales organization rather than Sales-focused investment
organization: Investing to Sales staff strength is ~1:2
● Deepening relationship with existing large distributors who showed results through increased
mobilizations; In early stages of roll-out with few more large distributors
● A highly focused and differentiated product offers healthy yield on assets managed
● Significant investments made recently in brand promotion to build a strong recall & positioning
● Updated the portal, www.motilaloswalmf.com, with useful features for B2B & B2C audience
Equity MF Net Sales Market Share*
3.8% in FY16
vs 2.1% in FY15
Equity MF Avg AUM Market Share*
0.9% in FY16
vs 0.3% in FY15
Asset Management – Adding scale backed by performance
19
AUM (MF/PMS)
72% YoY
Distributors
52% YoY
Equity MF New Folios Created
5X YoY in FY16
*Equity MF Net Sales Market Share includes only Open-Ended Equity Mutual Funds
23
52
FY15 FY16
129%
Net Inflows (Rs Bn)
Particulars Q4 FY16 Q4 FY15 Q4 FY16 Q3 FY16 FY16 FY15
Rs million Mar 31,
2016
Mar 31,
2015
Mar 31,
2016
Dec 31,
2015
Mar 31,
2016
Mar 31,
2015 Total Revenues 554 495 12% 554 511 8% 1,852 881 110%
EBITDA 108 105 3% 108 116 -6% 364 61 496%
PBT 108 101 6% 108 113 -5% 354 52 574%
PAT 70 101 -31% 70 75 -7% 264 52 404%
Change
(%)
Y-o-Y
Change
(%)
Y-o-Y
Change
(%)
Q-o-Q

Private Equity – Traction in fund-raising & investments
● IBEF I: $125 million invested in 13 deals. 3 full-exits & 6 partial exits in 4 companies till-date translate
into ~120% capital returned (INR terms). The fund is in advanced stages for 2 exits in the next few
months, which may allow it to return an additional ~50-55% capital. It expects to divest the balance
companies in FY17. We hope to earn a meaningful carry & profit on Sponsor commitment in FY17
● IREF I: Rs 2 billion AUA in 7 deals, of which full/partial exits have been done from 6 projects so far,
translating into ~86% capital returned to investors
Funds in
Exit mode
Funds in
Investing mode
● IBEF II: Rs 9.5 billion raised, including commitments from marquee institutions like IFC Washington,
Squadron Capital & Axiom. It has made 8 investments so far
● IREF II: Rs 4.9 billion assets raised, of which it has committed ~83% across established developers in 8
deals following stringent due diligence process
● IREF III: Launched in Q3FY16 with an AUM target of Rs 10 billion, it announced its 1st close within four
months in Feb 2016, raising commitments of ~ Rs 6 billion. It has made 1 investment so far
20Both IBEF I & IBEF II have an Offshore fund & Domestic Fund each, & MOPE manages and/or advises these funds
Particulars Q4 FY16 Q4 FY15 Q4 FY16 Q3 FY16 FY16 FY15
Rs million Mar 31,
2016
Mar 31,
2015
Mar 31,
2016
Dec 31,
2015
Mar 31,
2016
Mar 31,
2015
Total Revenues 56 62 -10% 56 57 -1% 249 255 -2%
EBITDA 20 25 -18% 20 26 -22% 104 119 -13%
PBT 20 23 -15% 20 25 -21% 98 113 -14%
PAT 7 16 -56% 7 17 -57% 59 74 -20%
Change
(%)
Y-o-Y
Change
(%)
Y-o-Y
Change
(%)
Q-o-Q

Banks given LOCs*
23 in FY16
vs 7 in FY15
Gross NPL
0.2% in Mar 2016
vs 0.0% in Mar 2015
Aspire – On course to build an affordable home finance entity
● Disbursed Rs 18.2 billion in FY16, up 5X YoY; QoQ traction strong
● Loan book stands at ~ Rs 20.9 billion across ~21,000 families
● Approx 50% of borrowings are from capital markets via NCDs
● Rs 3 billion cumulative capital infusion by sponsors till-date
● Investments in Branches (up 14 to 51 YoY) & Employees (~150
to ~500 YoY) should push traction in volumes, going forward
● For FY16, RoA was 3.3%, RoE was 16.0% and D/E ratio was 5.1X
● Crisil upgraded its rating to CRISIL A+/Stable, ICRA
upgraded its long-term rating to [ICRA]AA- (Stable))
● Won the Finnoviti 2016 award for the ‘MALA’ (Mahila
Awaas Loan) product from Banking Frontiers & Deloitte
● As a Primary Lending Institution, it has provided subsidy
to 78 clients under Credit Linked Subsidy Scheme of
Pradhan Mantri Awas Yojana. Total subsidy of Rs 16
million transferred to borrowers under CLSS
21
HFC Loan Book
6X YoY
* Term-loan drawdown from 22 banks and 1 NBFC, as of Mar 2016
Annual Disbursal
5X YoY
Aspire NIM
~389 bp in FY16
vs ~400 bp in FY15
Particulars Q4 FY16 Q4 FY15 Q4 FY16 Q3 FY16 FY16 FY15
Rs million Mar 31,
2016
Mar 31,
2015
Mar 31,
2016
Dec 31,
2015
Mar 31,
2016
Mar 31,
2015
Sanctioned For Period 9,291 3,156 194% 9,291 5,861 59% 23,599 5,227 351%
Disbursed For Period 7,324 2,232 228% 7,324 4,424 66% 18,183 3,586 407%
Loan Book 20,940 3,574 486% 20,940 14,055 49% 20,940 3,574 486%
Net Interest Income (NII) 204 38 437% 204 140 46% 476 71 567%
Other Income 250 84 198% 250 170 47% 633 124 409%
Total Income 454 122 272% 454 310 47% 1,109 196 467%
Operating Profit (Pre- Provisioning) 298 54 451% 298 182 64% 688 53 1198%
PBT 268 45 496% 268 163 65% 613 39 1486%
PAT 177 28 529% 177 94 88% 400 22 1731%
Change
(%)
Y-o-Y
Change
(%)
Y-o-Y
Change
(%)
Q-o-Q
137 49

Driving Social Responsibility – Motilal Oswal Foundation
22
Key CSR Areas: (a) Institutions: Hostels/Campus; (b) Education: School devp./Mid-day meal/English Lab, (c) Employee Volunteering
Inspiring Youth: As part of engagement with schools, 120
students of Bal Mohan High School had an interactive
session with Raamdeo Agrawal, who guided them on
their goal setting & tips for overall development. The
students also visited the dealing-room where advisors
oriented them on stock markets
English Language Lab: Sponsored the set-up of English-
Language Lab at Anjuman Khairul Islam Urdu High School
Mumbai, to create a better learning experience & equip
the students with essential skills. This lab would help
1000+ students learn conversational English through
interactive modules & in-built assessment tests

Highlights
Business Updates
FinSight
Presentation Plan
Industry Trends

19
50
19
68
19
71
19
74
19
77
19
80
19
83
19
86
19
89
19
92
19
95
19
98
20
01
20
04
20
07
20
10
20
13
Per Capita GDP (US$)
Consumer Inflation %
MF/AUM Penetration %43,443
9%
12,333
76%
13.5%3.5%
1,981 1,953 1,821 1,725 1,911
3,451
4,057
646 666 506
434 461
1,482 1,301
21 (131)
1 (146) (93)
710 700
FY10 FY11 FY12 FY13 FY14 FY15 9MFY16
Equity MF AUM (Rs Bn)
Equity MF Gross Sales (Rs Bn)
Equity MF Net Sales (Rs Bn)
24
Thematic Series
● Equity MF AUM, where maximum retail interest lies, grew at 54% CAGR from FY14 to 9MFY19
● After 9 successive quarters of outflows, the last 8 quarters saw equity MFs clock positive net flows
● Equity MF AUM grew 101% from Mar 2014 to Dec 2015 to Rs 3.4 tn vs 25% in Non-equity funds
● With ~34 mn individual folios in equity MFs, the penetration is still only ~3-4% of India’s population
● Headroom for growth exists and disposable incomes and discretionary allocations expand
Last 2 years witnessed rapid uptick in equity mutual funds in India; but headroom for further growth still exists
“Reasons for the surge in retail interest in equity mutual funds; & learnings from the evolution in USA”
Renewed interest in equity MFs since last 2 years
● In USA, economic stability came post-1950s & it took ~30 years till 1980s to reach the combination
of growing incomes and low inflation - which is when mutual fund penetration truly took off
● AUM/GDP ratio in USA reached 90% by 2014 from 9% in early 1980s, and ~89% of US MF assets are
held by retail. Median MF assets in a US household is $103,000, half of its $200,000 financial assets
● Assuming post-1990s to be economic stable years in India, we are now at a similar inflection point
Reasons for uptick in retail interest in equity mutual funds
Inflection-point in US took ~30 years after stability in 1950sRise in disposable incomes pushes discretionary allocations towards equities - the US example

25
Thematic Series
● 2014-onwards saw rising income and low inflation deepening penetration of mutual funds in India
● Equity AUM per folio of individuals reached Rs 98,100 in Dec 2015, up from Rs 58,000 in Mar 2014
● There is still immense opportunity to grow further, since AUM/GDP ratio in India was still 8%
● IMF estimates India’s per capital income to grow at 12% CAGR from FY15-FY20 (2X of present-level),
consumer inflation to be muted at ~5% and savings rate to hold at ~29% for the 5 years till 2020
● This augurs well for continued growth in incomes and allocation to equities, just like it did in USA
Combination of stable macros in India from 2014 onwards
● B-15 AUM (Beyond Top-15 towns) grew 52% from FY14-Dec 2015, due to push via investor seminars
● Of the ~Rs 750 billion net inflows into equity funds this year so far, ~40% are from B-15
● B-15 has a more favourable mix of equity in the AUM – B-15 has ~48% in equity MFs vs T-15’s ~27%
● But the spread of distributors has to expand to capture the B-15 opportunity further
Expansion into smaller towns across the hinterlandDespite uptick in AUM, B-15’s proportion remains flat
7 13
21
33
65
90 98
109
11% 10%
4%4%
10% 10%6% 5%
23% 24% 24%
33%
34%
31% 30% 29%
1990 1995 2000 2005 2010 2013 2014 2015
Per Capita GDP (Rs thousand)
Consumer Inflation %
Savings as % of GDP
0.7 0.9 0.9
1.4
1.9
2.1
23%28%
26%
35%
34% 34%
11% 13% 12%15% 15% 14%
B-15 AUM (Rs Tn)
B-15 to Individual AUM
B-15 to Overall AUM
Dec-15Mar-11 Mar-12 Mar-13 Mar-14 Mar-15
As incomes grew, younger generations in USA
started investing in MFs at an earlier age than
their parents. Hence, the investing lifetime also
expands, apart from widening the base
Role of Distributors has been critical for asset flows into mutual funds
● India is primarily distributor-driven, as direct channel accounted for only ~13% of individual assets
● Commission of AMFI-disclosed brokers was up 84% YoY to Rs 47 bn in FY15, higher than prior years
● Even USA is Advisor-driven, with 40% households buying solely with professionals & 13% only direct

3%-20%
0%
-34%-20%
48% 54%
-
400
800
1,200
1,600
FY10 FY11 FY12 FY13 FY14 FY15 9MFY16
Gross Sales (Rs Bn)
Redemption (Rs Bn)
Net Sales/Gross Sales %
18 19 24
26
47
50%55%
55% 57%
61%
FY11 FY12 FY13 FY14 FY15
Commission paid to Distributors (Rs Bn)
Percent of Commissions with Top-15 Distributors
Comm. per Distributor 0.04 0.05 0.07 0.08 0.10
26
Thematic Series
Uptick in AUM largely a result of distributor network
Investors have also matured in the way they now view equities for the long-term
Panic-induced redemptions reduced in last 2 years
● Despite lack of market performance in CY2015, there were no high redemptions unlike in the past
● Investors acted with maturity in holding their funds for the long-term, despite short-term volatilities
● Even AMCs have matured from pitching a product-push approach to a solution-based approach
Investor education improved peoples’ awareness about the very need for mutual funds
Efforts in the last 2 years equals that of prior 3 years
● Relentless education seminars by AMCs helped improve awareness & widen the retail base
● No. of programmes/participants in last 2 years is almost equal to those in the 3 years prior to that
31,283
60,000
May'10 - May'13 Nov'10 - Nov'15
Investor Education Programmes
0.94
1.80
May'10 - May'13 Nov'10 - Nov'15
Participants Attended (Mn)
● Inflows were driven by Top-15 distributors as their proportion rose from 50% in FY11 to 61% in FY15
● IFAs manage 66% of assets in US. Similar proliferation of IFAs in India can garner more inflows in B-15
New online platforms have enabled easy and convenient access to buy mutual funds
● Robo-advisors like Aditya Birla’s MyUniverse, Arthayantra and FundsIndia, which give financial
planning by recommending a basket of mutual funds, have seen rapid traction in recent years
● The shift to advisory fee on assets managed may help expand MF flows on such platforms further

2012 2013 2014 2015 2016
SBI FD Rate
Gold Returns
CNX 500 Returns
PPF Interest Rate
Returns rebased to Rs 100
155
89
140
137
27
Thematic Series
Equities have outperformed others in recent yearsRelative attractiveness of other savings products reduced vs. equity in recent years
● ~70% of household savings goes to gold & real estate, but gold returns were stagnant in recent years
● ~90% of financial savings goes to banks, PPF and life insurance. But FD rates have declined
● Many companies are not contributing to EPF. So, the relative attraction of other products has reduced
● Investors need inflation-adjusted long-term returns, and now accept an equity component is needed
Long-term retirement products can fuel maximum interest in equity MFs, just like in USA
● In USA, retirement has been the main goal why households save in equity MFs, esp. through employer-sponsored retirement plans or IRAs
● Long-term retirement planning also implies the demand is for growth (hence, equity) rather than income (debt). This enables AUM stability
● Long-term planning broadens the number of funds held for diversification (median no. of funds held in US is 4)
● With social security non-existent and life-tenures increasing, there is a need for retirement planning in India. This can push the demand for MFs
Large states which offer maximum opportunity for distributors
Click here to read the full article, and access previous FinSight articles:
http://www.motilaloswalgroup.com/Investor-Relations/Finsight

Highlights
Business Updates
FinSight
Presentation Plan
Industry Trends

40 65 61 69 55 5993 149 141 157 133 144325513 502 555 456 527
1,565
2,6142,304 2,689
1,832 2,540
FY14 FY15 FY16 Q4FY15 Q3FY16 Q4FY16
Options Futures Intraday Delivery
3,471
2,022
3,3403,007
2,476
3,270
Volumes dip during the year, but options pick up in Q4
Source: NSE, BSE
Source: NSE, BSE
29Source: NSE, BSE
Options dipped more than cash in FY16, hence it declined within the mix declined; But it grew in Q4 as options volumes picked up
Proportion of delivery within the cash volume mix has held constant this year, as compared to last year
Market ADTO declined this year owing to dips across all segments; But it was up this quarter on QoQ basis as options picked up (Rs Bn)
Retail saw a drop within the cash volume mix this year, while DII saw an uptick; Retail’s proportion also dropped on QoQ basis
Source: CDSL, SEBI
77% 78% 77% 77% 74% 78%
16%15% 17%
16%18% 16%
5% 4% 5%5%
5% 4%2% 2% 2% 2% 2% 2%
FY14 FY15 FY16 Q4FY15 Q3FY16 Q4FY16
Delivery Intraday Futures Options
47% 50% 49% 50% 51% 49%
22% 21% 20% 20% 20% 21%
22% 21% 22% 22% 20% 21%
9% 8% 9% 8% 9% 9%
FY14 FY15 FY16 Q4FY15 Q3FY16 Q4FY16
DII FII Prop Retail
30%
70% FY15
30%
70%FY16
Delivery to Cash Volumes Intraday to Cash Volumes

-542 -220
804
-60134 76
FY14 FY15 FY16 Q4FY15 Q3FY16 Q4FY16
Inflows by DIIs help counter the outflows by FIIs this year
Source: NSE
DIIs saw renewed inflows after five consecutive years of net outflows, especially into equity mutual funds (Rs Bn)
30
As IPOs picked up slightly since last two years, incremental demat accounts have been higher than the previous years
Source: CDSL, NSDL
Source: NSE, BSE
FIIs register net outflows this year after 6 years of net inflows; However, March month saw strong net inflows (Rs Bn)
YoY growth in individual wealth held in financial & physical assets (Rs Tn)
Source: Karvy Report 2014
797
1,113
-142
365
-32 45
FY14 FY15 FY16 Q4FY15 Q3FY16 Q4FY16
19.0 20.0 21.0 21.8 23.3
0.91.0 0.9 1.5
2.0
FY12 FY13 FY14 FY15 FY16
Existing Accounts (Mn) New Accounts (Mn)
FY2014 FY2015
Financial Assets
19.17%
160.55
134.72
FY2014 FY2015
Physical Assets
-2.35%
122.78
119.89

8.7
12.0
17.7
2.9 3.3 3.7 17.0
20.0
26.2
15.2
21.625.7
FY14 FY15 FY16 Q4FY15 Q3FY16 Q4FY16
Deal Value (US$ Bn) Avg Deal Size (US$ Mn)
6% 6% 5% 5% 3%14% 13% 16% 15% 16%
50% 56% 56%48% 46%
31% 25% 23%32% 31%
FY12 FY13 FY14 FY15 FY16
Equity Income Liquid / Money Market Others
5,872 7,014 8,252 10,828 12,328
Equity MF see AUM uptick due to continued strong inflows
Source: AMFI
The uptick in Equity MF AUM has been led by strong net inflows in last two years, apart from appreciation (Rs Bn)
Source: ICRA
Source: AMFI
Equity MFs helped push MF AUM to highs, as its proportion within the mix rose from 23% in FY14 to 31% in FY16 (Rs Bn)
YoY trend in housing credit in India (Rs Tn)
Source:: Venture Intelligence
PE deal values & avg size increased this year, led largely by high-value deals in E-Commerce & Renewables
31
(93
)
74
0
20
6
16
3
40
29
23
87
15
29
44
FY14 FY15 FY16 Q4FY15 Q3FY16 Q4FY16
Equity
Non-Gold ETF (Equity)
710
1.30 1.65 2.05 2.60 3.10 3.80 4.30
3.20 3.85 4.25
4.90 5.60
6.60 7.60
29%30%
33%
35%36%
37%36%
FY10 FY11 FY12 FY13 FY14 FY15 9MFY16
Banks
HFCs
Percent of HFC to Total
11.90
4.505.50
6.30
7.50
48.70
10.40

This report is for information purposes only and does not construe to be any investment, legal or taxation advice. It is not intended as an offer or
solicitation for the purchase or sale of any financial instrument. Any action taken by you on the basis of the information contained herein is your
responsibility alone and MOFSL and its subsidiaries or its employees or directors, associates will not be liable in any manner for the consequences
of such action taken by you. We have exercised due diligence in checking the correctness and authenticity of the information contained herein, but
do not represent that it is accurate or complete. MOFSL or any of its subsidiaries or associates or employees shall not be in any way responsible
for any loss or damage that may arise to any person from any inadvertent error in the information contained in this publication. The recipient of
this report should rely on their own investigations. MOFSL and/or its subsidiaries and/or directors, employees or associates may have interests or
positions, financial or otherwise in the securities mentioned in this report.
Thank You
32
Contact:
Sameer Kamath
Chief Financial Officer
Motilal Oswal Financial Services Limited
Tel: 91-22-3982-5500 / 91-22-39825554
Fax: 91-22-2282-3499
Email: [email protected]
Sourajit Aiyer
AVP–Investor Relations & Corporate Planning
Motilal Oswal Financial Services Limited
Tel: 91-22-3982-5500 / 91-22-39825510
Fax: 91-22-2282-3499
Email: [email protected] /


![[PPT]Microsoft PowerPoint - Investor Comm Q4FY16 Finalcontent.indiainfoline.com/company_upload/ppt/Dabur_India... · Web view•The category reported singledigitgrowth in Q4FY16 primarilyon](https://static.fdocuments.net/doc/165x107/5ad0b86d7f8b9aca598e0099/pptmicrosoft-powerpoint-investor-comm-q4fy16-viewthe-category-reported-singledigitgrowth.jpg)
