
Mortality, Summary List of Causes, 2009
125
Catalogue no. 84F0209X Mortality, Summary List of Causes 2009
Transcript of Mortality, Summary List of Causes, 2009

Catalogue no. 84F0209X
Mortality, SummaryList of Causes
2009

How to obtain more information
For information about this product or the wide range of services and data available from Statistics Canada, visit our website atwww.statcan.gc.ca, e-mail us at [email protected], or telephone us, Monday to Friday from 8:30 a.m. to 4:30 p.m., at thefollowing numbers:
Statistics Canada’s National Contact Centre
Toll-free telephone (Canada and the United States):Inquiries line 1-800-263-1136National telecommunications device for the hearing impaired 1-800-363-7629Fax line 1-877-287-4369
Local or international calls:Inquiries line 1-613-951-8116Fax line 1-613-951-0581
Depository Services ProgramInquiries line 1-800-635-7943Fax line 1-800-565-7757
To access this product
This product, Catalogue no. 84F0209X, is available free in electronic format. To obtain a single issue, visit our website atwww.statcan.gc.ca and browse by “Key resource” > “Publications.”
Standards of service to the public
Statistics Canada is committed to serving its clients in a prompt, reliable and courteous manner. To this end, Statistics Canadahas developed standards of service that its employees observe. To obtain a copy of these service standards, please contactStatistics Canada toll-free at 1-800-263-1136. The service standards are also published on www.statcan.gc.ca under “About us” >“The agency” > “Providing services to Canadians.”
Statistics CanadaHealth Statistics Division
Mortality, Summary List of Causes2009
Published by authority of the Minister responsible for Statistics Canada
© Minister of Industry, 2012
All rights reserved. Use of this publication is governed by the Statistics CanadaOpen License Agreement:
http://www.statcan.gc.ca/reference/copyright-droit-auteur-eng.htm
July 2012
Catalogue no. 84F0209X
ISSN 1701-2023
Frequency: Annual
Ottawa
Cette publication est également disponible en français.
Note of appreciation
Canada owes the success of its statistical system to a long-standing partnership betweenStatistics Canada, the citizens of Canada, its businesses, governments and otherinstitutions. Accurate and timely statistical information could not be produced withouttheir continued cooperation and goodwill.

User information
Symbols
The following standard symbols are used in Statistics Canada publications:
. not available for any reference period
.. not available for a specific reference period
... not applicable
0 true zero or a value rounded to zero
0s value rounded to 0 (zero) where there is a meaningful distinction between true zero and the value that wasrounded
p preliminary
r revised
x suppressed to meet the confidentiality requirements of the Statistics Act
E use with caution
F too unreliable to be published
* significantly different from reference category (p < 0.05)
Acknowledgements
The cooperation of provincial and territorial Vital Statistics registries who supply the mortality data in this report toStatistics Canada is gratefully acknowledged.
2 Statistics Canada – Catalogue no. 84F0209X

Introduction
This publication contains statistical tables showing the number of deaths by age, sex and grouped underlying causefor Canada, the provinces and territories. Also included are age-specific and age-standardized mortality rates bygrouped underlying cause of death.
Content note
Underlying cause of death is classified to the Tenth Revision of the International Classification of Diseases (ICD-10)from 2000 to the present. Underlying cause of death was classified to the Ninth Revision of the InternationalClassification of Diseases (ICD-9) from 1979 to 1999.
History note
This product replaces Mortality, summary list of causes, catalogue number 84F0209XPB (published for datayears 1997 to 1999) and catalogue number 84F0209XIB (published for data year 1997).
Publication, data year 2009 issue
This issue of the annual HTML/PDF publication contains tables for data year 2009 with the corresponding highlights.
CANSIM data for 2000 to 2009, available with the first issue of this publication
Free access to the 2000 to 2009 data is provided through a special CANSIM interface. The CANSIM tables can belinked directly from three different locations in the HTML product:
Tables section:
• Related CANSIM tables
• Individual tables, in the Source
Related products section:
• Selected CANSIM tables from Statistics Canada
Statistics Canada – Catalogue no. 84F0209X 3

Table of contents
Highlights 6
Trends for cancer and major cardiovascular diseases 6
Age-standardized mortality rates for cancer and cardiovascular diseases 6
Related products 8
Statistical tables
1 Deaths and mortality rate, by selected grouped causes, sex and geography 12
1-1 Canada 12
1-2 Newfoundland and Labrador 15
1-3 Prince Edward Island 18
1-4 Nova Scotia 21
1-5 New Brunswick 24
1-6 Quebec 27
1-7 Ontario 30
1-8 Manitoba 33
1-9 Saskatchewan 36
1-10 Alberta 39
1-11 British Columbia 42
1-12 Yukon 45
1-13 Northwest Territories 48
1-14 Nunavut 51
2 Deaths and mortality rate, by selected grouped causes, age group at time of death and sex, Canada 54
2-1 Under 1 year 54
2-2 1 to 4 years 57
2-3 5 to 9 years 60
2-4 10 to 14 years 63
2-5 15 to 19 years 66
2-6 20 to 24 years 69
2-7 25 to 29 years 72
2-8 30 to 34 years 75
2-9 35 to 39 years 78
2-10 40 to 44 years 81
2-11 45 to 49 years 84
2-12 50 to 54 years 87
4 Statistics Canada – Catalogue no. 84F0209X

Mortality, Summary List of Causes – 2009
Table of contents – continued
2-13 55 to 59 years 90
2-14 60 to 64 years 93
2-15 65 to 69 years 96
2-16 70 to 74 years 99
2-17 75 to 79 years 102
2-18 80 to 84 years 105
2-19 85 to 89 years 108
2-20 90 years and over 111
Data quality, concepts and methodology
Definitions 114
Explanatory notes for the tables 117
Appendix
I Summary list of causes of death 118
II Postcensal population estimates 121
Charts
1. Age-standardized mortality rates for cancer and major cardiovascular diseases (MCD),Canada, 2000 to 2009 7
Statistics Canada – Catalogue no. 84F0209X 5

Highlights
• In 2009, 71,125 deaths in Canada were attributable to cancer (malignant neoplasms), up 0.8% from 2008.
• There were 68,342 deaths attributable to major cardiovascular diseases1 , down 1.9% from the previous year.
• The two causes of death combined were responsible for 58% of all deaths in Canada in 2009, down from 64%in 2000.
Trends for cancer and major cardiovascular diseases
• From 2000 to 2009, deaths caused by major cardiovascular diseases have declined, while deaths caused bycancer have increased.
• Since 2007 cancer has surpassed major cardiovascular diseases for number of deaths and the gap betweenthese two causes of death has widened.
• For males, deaths caused by cancer have surpassed those caused by major cardiovascular diseases since 2005.
• For females, the gap between deaths caused by cancer and by major cardiovascular diseases has narrowedsince 2000.
Table 1Deaths due to cancer and to major cardiovascular diseases by sex, Canada, 2000 to 2009
Both sexes Males FemalesYear
Cancer Majorcardiovascular
diseases
Cancer Majorcardiovascular
diseases
Cancer Majorcardiovascular
diseases
2000 62,672 76,046 33,360 37,914 29,312 38,1322001 63,774 74,441 34,023 36,912 29,751 37,5292002 65,103 74,209 34,415 36,605 30,688 37,6042003 65,990 73,827 34,701 37,004 31,289 36,8232004 66,947 72,338 35,156 35,847 31,791 36,4912005 67,343 71,338 35,481 35,198 31,862 36,1402006 67,807 68,715 35,624 34,214 32,183 34,5012007 69,595 69,503 36,569 34,508 33,026 34,9952008 70,558 69,648 37,077 34,739 33,481 34,9092009 71,125 68,342 37,452 34,150 33,673 34,192
Source(s): Statistics Canada, CANSIM table 102-0551.
Age-standardized mortality rates2 for cancer and cardiovascular diseases
• From 2000 to 2004, the age-standardized mortality rates for major cardiovascular diseases and cancer haveconverged. Since 2005, the age-standardized mortality rate for cancer has surpassed the rate for majorcardiovascular diseases. This is mainly due to a significant decrease in the age-standardized rates for majorcardiovascular diseases since 2000.
1. Major cardiovascular diseases include diseases of heart, essential hypertension and hypertensive renal disease, cerebrovascular diseases, atherosclerosisand other diseases of circulatory system.
2. To control for the impact of population aging, comparisons over time are made using the "age-standardized mortality rate." This removes the effect ofdifferences in the age structure of populations among areas and over time.
6 Statistics Canada – Catalogue no. 84F0209X

Mortality, Summary List of Causes – 2009
• For males, the age-standardized mortality rate for cancer has surpassed the rate for major cardiovasculardiseases since 2006.
• For females, the age-standardized mortality rate for cancer has surpassed the rate for major cardiovasculardiseases since 2003. In 2009, the gap between the standardized rates for these two causes of death was widerfor females than males.
Chart 1Age-standardized mortality rates for cancer and major cardiovascular diseases (MCD), Canada, 2000 to 2009
100
150
200
250
300
2000 2001 2002 2003 2004 2005 2006 2007 2008 2009
CancerMCDMale CancerMale MCDFemale CancerFemale MCD
Source(s): Statistics Canada, CANSIM table 102-0552.
Note: Age-standardized mortality rates per 100,000 standard population (1991 Canadian population).
per 100,000 population
Statistics Canada – Catalogue no. 84F0209X 7

Related products
Selected publications from Statistics Canada
82-221-X Health Indicators
84-208-X Causes of Death
84-548-X Comparability of ICD-10 and ICD-9 for Mortality Statistics in Canada
84F0211X Deaths
Selected CANSIM tables from Statistics Canada
102-0521 Deaths, by cause, Chapter I: Certain infectious and parasitic diseases (A00 to B99), age groupand sex, Canada, annual
102-0522 Deaths, by cause, Chapter II: Neoplasms (C00 to D48), age group and sex, Canada, annual
102-0523 Deaths, by cause, Chapter III: Diseases of the blood and blood-forming organs and certaindisorders involving the immune mechanism (D50 to D89), age group and sex, Canada, annual
102-0524 Deaths, by cause, Chapter IV: Endocrine, nutritional and metabolic diseases (E00 to E90), agegroup and sex, Canada, annual
102-0525 Deaths, by cause, Chapter V: Mental and behavioural disorders (F00 to F99), age group andsex, Canada, annual
102-0526 Deaths, by cause, Chapter VI: Diseases of the nervous system (G00 to G99), age group andsex, Canada, annual
102-0527 Deaths, by cause, Chapter VII: Diseases of the eye and adnexa (H00 to H59), age group andsex, Canada, annual
102-0528 Deaths, by cause, Chapter VIII: Diseases of the ear and mastoid process (H60 to H95), agegroup and sex, Canada, annual
102-0529 Deaths, by cause, Chapter IX: Diseases of the circulatory system (I00 to I99), age group andsex, Canada, annual
102-0530 Deaths, by cause, Chapter X: Diseases of the respiratory system (J00 to J99), age group andsex, Canada, annual
102-0531 Deaths, by cause, Chapter XI: Diseases of the digestive system (K00 to K93), age group andsex, Canada, annual
8 Statistics Canada – Catalogue no. 84F0209X

Mortality, Summary List of Causes – 2009
102-0532 Deaths, by cause, Chapter XII: Diseases of the skin and subcutaneous tissue (L00 to L99), agegroup and sex, Canada, annual
102-0533 Deaths, by cause, Chapter XIII: Diseases of the musculoskeletal system and connective tissue(M00 to M99), age group and sex, Canada, annual
102-0534 Deaths, by cause, Chapter XIV: Diseases of the genitourinary system (N00 to N99), age groupand sex, Canada, annual
102-0535 Deaths, by cause, Chapter XV: Pregnancy, childbirth and the puerperium (O00 to O99), agegroup and sex, Canada, annual
102-0536 Deaths, by cause, Chapter XVI: Certain conditions originating in the perinatal period (P00 toP96), age group and sex, Canada, annual
102-0537 Deaths, by cause, Chapter XVII: Congenital malformations, deformations and chromosomalabnormalities (Q00 to Q99), age group and sex, Canada, annual
102-0538 Deaths, by cause, Chapter XVIII: Symptoms, signs and abnormal clinical and laboratory findings,not elsewhere classified (R00 to R99), age group and sex, Canada, annual
102-0540 Deaths, by cause, Chapter XX: External causes of morbidity and mortality (V01 to Y89), agegroup and sex, Canada, annual
102-0551 Deaths and mortality rate, by selected grouped causes, age group and sex, Canada, provincesand territories, annual
102-0552 Deaths and mortality rate, by selected grouped causes and sex, Canada, provinces andterritories, annual
Selected surveys from Statistics Canada
3231 Vital Statistics - Birth Database
3233 Vital Statistics - Death Database
3604 Estimates of Population by Age and Sex for Canada, Provinces and Territories
Statistics Canada – Catalogue no. 84F0209X 9

Mortality, Summary List of Causes – 2009
Selected summary tables from Statistics Canada
• Infant mortality rates, by province and territory
• Suicides, and suicide rate, by sex and by age group
• Life expectancy at birth, by sex, by province
• Life expectancy at birth and at age 65 by sex and by geography
• Age-standardized mortality rates by selected causes, by sex
• Leading causes of death, by sex
10 Statistics Canada – Catalogue no. 84F0209X

Statistical tables

Mortality, Summary List of Causes – 2009
Table 1-1Deaths and mortality rate, by selected grouped causes, sex and geography — Canada1
Number of deaths Crude mortality rateper 100,000 population 2
Age-standardized mortality rateper 100,000 population 2
Bothsexes
Males Females Bothsexes
Males Females Bothsexes
Males Females
Total, all causes of death (A00-Y89) 3 , 4 , 5 238,418 120,311 118,107 706.8 719.3 694.6 515.0 629.9 423.5
Salmonella infections (A01-A02) 5 1 4 0.0 0.0 0.0 0.0 0.0 0.0Shigellosis and amoebiasis (A03, A06) 2 1 1 0.0 0.0 0.0 0.0 0.0 0.0Certain other intestinal infections (A04, A07-A09) 1,377 561 816 4.1 3.4 4.8 2.7 3.0 2.6Tuberculosis (A16-A19) 61 41 20 0.2 0.2 0.1 0.1 0.2 0.1Respiratory tuberculosis (A16) 45 29 16 0.1 0.2 0.1 0.1 0.2 0.1Other tuberculosis (A17-A19) 16 12 4 0.0 0.1 0.0 0.0 0.1 0.0Whooping cough (A37) 1 0 1 0.0 0.0 0.0 0.0 0.0 0.0Scarlet fever and erysipelas (A38, A46) 0 0 0 0.0 0.0 0.0 0.0 0.0 0.0Meningococcal infection (A39) 12 5 7 0.0 0.0 0.0 0.0 0.0 0.0Septicaemia (A40-A41) 2,211 1,026 1,185 6.6 6.1 7.0 4.7 5.4 4.2Syphilis (A50-A53) 3 1 2 0.0 0.0 0.0 0.0 0.0 0.0Acute poliomyelitis (A80) 0 0 0 0.0 0.0 0.0 0.0 0.0 0.0Arthropod-borne viral encephalitis (A83-A84, A85.2) 0 0 0 0.0 0.0 0.0 0.0 0.0 0.0Measles (B05) 0 0 0 0.0 0.0 0.0 0.0 0.0 0.0Viral hepatitis (B15-B19) 451 295 156 1.3 1.8 0.9 1.0 1.3 0.7Human immunodeficiency virus [HIV] disease (B20-B24) 355 285 70 1.1 1.7 0.4 0.9 1.4 0.4Malaria (B50-B54) 2 2 0 0.0 0.0 0.0 0.0 0.0 0.0Other and unspecified infectious and parasitic diseases
and their sequelae 6 529 262 267 1.6 1.6 1.6 1.2 1.4 1.1Malignant neoplasms (C00-C97) 71,125 37,452 33,673 210.9 223.9 198.0 160.3 192.5 136.8Malignant neoplasms of lip, oral cavity and pharynx
(C00-C14) 1,065 721 344 3.2 4.3 2.0 2.4 3.6 1.4Malignant neoplasm of oesophagus (C15) 1,685 1,264 421 5.0 7.6 2.5 3.8 6.3 1.7Malignant neoplasm of stomach (C16) 1,911 1,177 734 5.7 7.0 4.3 4.3 6.0 2.9Malignant neoplasms of colon, rectum and anus
(C18-C21) 7,810 4,203 3,607 23.2 25.1 21.2 17.3 21.5 13.8Malignant neoplasm of liver and intrahepatic bile ducts
(C22) 1,950 1,256 694 5.8 7.5 4.1 4.5 6.4 2.8Malignant neoplasm of pancreas (C25) 3,981 1,985 1,996 11.8 11.9 11.7 9.0 10.1 7.9Malignant neoplasm of larynx (C32) 439 368 71 1.3 2.2 0.4 1.0 1.9 0.3Malignant neoplasms of trachea, bronchus and lung
(C33-C34) 19,112 10,572 8,540 56.7 63.2 50.2 43.9 54.3 36.1Malignant melanoma of skin (C43) 1,019 634 385 3.0 3.8 2.3 2.3 3.2 1.6Malignant neoplasm of breast (C50) 4,990 46 4,944 14.8 0.3 29.1 11.2 0.2 20.4Malignant neoplasm of cervix uteri (C53) ... ... 370 ... ... 2.2 ... ... 1.7Malignant neoplasms of corpus uteri and uterus, part
unspecified (C54-C55) ... ... 862 ... ... 5.1 ... ... 3.6Malignant neoplasm of ovary (C56) ... ... 1,597 ... ... 9.4 ... ... 6.7Malignant neoplasm of prostate (C61) ... 3,745 ... ... 22.4 ... ... 19.6 ...Malignant neoplasms of kidney and renal pelvis
(C64-C65) 1,547 974 573 4.6 5.8 3.4 3.5 4.9 2.3Malignant neoplasm of bladder (C67) 1,910 1,330 580 5.7 8.0 3.4 4.1 6.9 2.1Malignant neoplasms of meninges, brain and other parts
of central nervous system (C70-C72) 1,867 1,102 765 5.5 6.6 4.5 4.5 5.7 3.5Malignant neoplasms of lymphoid, haematopoietic
and related tissue (C81-C96) 6,558 3,629 2,929 19.4 21.7 17.2 14.9 18.9 11.8Hodgkin’s disease (C81) 126 71 55 0.4 0.4 0.3 0.3 0.4 0.3Non-Hodgkin’s lymphoma (C82-C85) 2,597 1,419 1,178 7.7 8.5 6.9 5.9 7.3 4.7Leukaemia (C91-C95) 2,463 1,390 1,073 7.3 8.3 6.3 5.6 7.3 4.3Multiple myeloma and immunoproliferative neoplasms
(C88, C90) 1,352 736 616 4.0 4.4 3.6 3.0 3.8 2.5Other and unspecified malignant neoplasms of lymphoid,
haematopoietic and related tissue (C96) 20 13 7 0.1 0.1 0.0 0.0 0.1 0.0All other and unspecified malignant neoplasms (C17,
C23-C24, C26-C31, C37-C41, C44-C49, C51-C52,C57-C60, C62-C63, C66, C68-C69, C73-C80, C97) 8,707 4,446 4,261 25.8 26.6 25.1 19.3 23.0 16.4
In situ neoplasms, benign neoplasms and neoplasms ofuncertain or unknown behaviour (D00-D48) 1,459 738 721 4.3 4.4 4.2 3.1 3.9 2.6
Anaemias (D50-D64) 524 235 289 1.6 1.4 1.7 1.0 1.3 0.9Diabetes mellitus (E10-E14) 6,923 3,616 3,307 20.5 21.6 19.5 14.9 18.7 11.9Nutritional deficiencies (E40-E64) 220 85 135 0.7 0.5 0.8 0.4 0.5 0.4Malnutrition (E40-E46) 185 69 116 0.5 0.4 0.7 0.4 0.4 0.4Other nutritional deficiencies (E50-E64) 35 16 19 0.1 0.1 0.1 0.1 0.1 0.1Meningitis (G00, G03) 75 38 37 0.2 0.2 0.2 0.2 0.2 0.2Parkinson’s disease (G20-G21) 1,901 1,116 785 5.6 6.7 4.6 3.9 5.8 2.6Alzheimer’s disease (G30) 6,281 1,932 4,349 18.6 11.6 25.6 11.8 10.2 12.6Major cardiovascular diseases (I00-I78) 68,342 34,150 34,192 202.6 204.2 201.1 139.9 177.2 109.5Diseases of heart (I00-I09, I11, I13, I20-I51) 49,271 25,950 23,321 146.1 155.1 137.2 101.4 134.2 74.9Acute rheumatic fever and chronic rheumatic heart
diseases (I00-I09) 411 139 272 1.2 0.8 1.6 0.9 0.7 1.0Hypertensive heart disease (I11) 755 304 451 2.2 1.8 2.7 1.5 1.5 1.4Hypertensive heart and renal disease (I13) 121 44 77 0.4 0.3 0.5 0.2 0.2 0.2Ischaemic heart diseases (I20-I25) 35,896 20,051 15,845 106.4 119.9 93.2 74.3 103.2 51.1
See notes at the end of the table.
12 Statistics Canada – Catalogue no. 84F0209X

Mortality, Summary List of Causes – 2009
Table 1-1 – continued
Deaths and mortality rate, by selected grouped causes, sex and geography — Canada1
Number of deaths Crude mortality rateper 100,000 population 2
Age-standardized mortality rateper 100,000 population 2
Bothsexes
Males Females Bothsexes
Males Females Bothsexes
Males Females
Acute myocardial infarction (I21-I22) 15,111 8,567 6,544 44.8 51.2 38.5 31.7 43.9 21.7Other acute ischaemic heart diseases (I24) 1,093 563 530 3.2 3.4 3.1 2.3 2.9 1.8Other forms of chronic ischaemic heart disease (I20,
I25) 19,692 10,921 8,771 58.4 65.3 51.6 40.4 56.4 27.7Atherosclerotic cardiovascular disease, so described
(I25.0) 1,641 1,019 622 4.9 6.1 3.7 3.6 5.2 2.2All other forms of chronic ischaemic heart disease (I20,
I25.1-I25.9) 18,051 9,902 8,149 53.5 59.2 47.9 36.8 51.2 25.5Other heart diseases (I26-I51) 12,088 5,412 6,676 35.8 32.4 39.3 24.5 28.5 21.2Acute and subacute endocarditis (I33) 113 74 39 0.3 0.4 0.2 0.3 0.4 0.2Diseases of pericardium and acute myocarditis (I30-I31,
I40) 85 40 45 0.3 0.2 0.3 0.2 0.2 0.2Heart failure (I50) 4,211 1,704 2,507 12.5 10.2 14.7 8.1 9.1 7.3All other forms of heart disease (I26-I28, I34-I38, I42-I49,
I51) 7,679 3,594 4,085 22.8 21.5 24.0 16.0 18.8 13.5Essential hypertension and hypertensive renal disease
(I10, I12, I15) 1,584 585 999 4.7 3.5 5.9 3.1 3.1 3.0Cerebrovascular diseases (I60-I69) 14,105 5,823 8,282 41.8 34.8 48.7 28.4 30.5 26.4Atherosclerosis (I70) 816 335 481 2.4 2.0 2.8 1.6 1.7 1.4Other diseases of circulatory system (I71-I78) 2,566 1,457 1,109 7.6 8.7 6.5 5.4 7.6 3.8Aortic aneurysm and dissection (I71) 1,564 993 571 4.6 5.9 3.4 3.4 5.2 2.0Other diseases of arteries, arterioles and capillaries
(I72-I78) 1,002 464 538 3.0 2.8 3.2 2.1 2.4 1.8Other disorders of circulatory system (I80-I99) 361 176 185 1.1 1.1 1.1 0.8 0.9 0.7Influenza and pneumonia (J09-J18) 5,826 2,694 3,132 17.3 16.1 18.4 11.7 14.3 10.0Influenza (J09-J11) 530 237 293 1.6 1.4 1.7 1.3 1.3 1.2Pneumonia (J12-J18) 5,296 2,457 2,839 15.7 14.7 16.7 10.4 13.0 8.7Other acute lower respiratory infections (J20-J22) 83 30 53 0.2 0.2 0.3 0.2 0.2 0.2Acute bronchitis and bronchiolitis (J20-J21) 57 25 32 0.2 0.1 0.2 0.1 0.1 0.1Unspecified acute lower respiratory infection (J22) 26 5 21 0.1 0.0 0.1 0.0 0.0 0.1Chronic lower respiratory diseases (J40-J47) 10,859 5,525 5,334 32.2 33.0 31.4 22.9 29.1 19.0Bronchitis, chronic and unspecified (J40-J42) 120 57 63 0.4 0.3 0.4 0.2 0.3 0.2Emphysema (J43) 623 359 264 1.8 2.1 1.6 1.4 1.9 1.0Asthma (J45-J46) 228 75 153 0.7 0.4 0.9 0.5 0.4 0.5Other chronic lower respiratory diseases (J44, J47) 9,888 5,034 4,854 29.3 30.1 28.5 20.8 26.5 17.2Pneumoconioses and chemical effects (J60-J66, J68) 84 74 10 0.2 0.4 0.1 0.2 0.4 0.0Pneumonitis due to solids and liquids (J69) 1,710 898 812 5.1 5.4 4.8 3.4 4.7 2.6Other diseases of respiratory system (J00-J06, J30-J39,
J67, J70-J98) 2,734 1,484 1,250 8.1 8.9 7.4 5.9 7.8 4.4Peptic ulcer (K25-K28) 420 213 207 1.2 1.3 1.2 0.9 1.1 0.7Diseases of appendix (K35-K38) 63 34 29 0.2 0.2 0.2 0.1 0.2 0.1Hernia (K40-K46) 312 146 166 0.9 0.9 1.0 0.6 0.8 0.6Chronic liver disease and cirrhosis (K70, K73-K74) 2,683 1,751 932 8.0 10.5 5.5 6.2 8.5 4.1Alcoholic liver disease (K70) 1,449 1,048 401 4.3 6.3 2.4 3.4 5.0 1.9Other chronic liver disease and cirrhosis (K73-K74) 1,234 703 531 3.7 4.2 3.1 2.8 3.5 2.2Cholelithiasis and other disorders of gallbladder
(K80-K82) 411 182 229 1.2 1.1 1.3 0.8 0.9 0.8Nephritis, nephrotic syndrome and nephrosis
(N00-N07, N17-N19, N25-N27) 3,609 1,775 1,834 10.7 10.6 10.8 7.2 9.3 5.9Acute and rapidly progressive nephritic and nephrotic
syndrome (N00-N01, N04) 15 8 7 0.0 0.0 0.0 0.0 0.0 0.0Chronic glomerulonephritis, nephritis and nephropathy
not specified as acute or chronic, and renal sclerosisunspecified (N02-N03, N05-N07, N26) 151 77 74 0.4 0.5 0.4 0.3 0.4 0.2
Renal failure (N17-N19) 3,438 1,689 1,749 10.2 10.1 10.3 6.9 8.8 5.7Other disorders of kidney (N25, N27) 5 1 4 0.0 0.0 0.0 0.0 0.0 0.0Infections of kidney (N10-N12, N13.6, N15.1) 106 32 74 0.3 0.2 0.4 0.2 0.2 0.2Hyperplasia of prostate (N40) ... 77 ... ... 0.5 ... ... 0.4 ...Inflammatory diseases of female pelvic organs (N70-N76) ... ... 12 ... ... 0.1 ... ... 0.0Pregnancy, childbirth and the puerperium (O00-O99) ... ... 29 ... ... 0.2 ... ... 0.2Pregnancy with abortive outcome (O00-O07) ... ... 3 ... ... 0.0 ... ... 0.0Other complications of pregnancy, childbirth and the
puerperium (O10-O99) ... ... 26 ... ... 0.2 ... ... 0.2Certain conditions originating in the perinatal period
(P00-P96) 1,076 564 512 3.2 3.4 3.0 4.0 4.1 4.0Congenital malformations, deformations and
chromosomal abnormalities (Q00-Q99) 896 473 423 2.7 2.8 2.5 2.9 3.0 2.7Symptoms, signs and abnormal clinical and laboratory
findings, not elsewhere classified (R00-R99) 2,230 1,042 1,188 6.6 6.2 7.0 5.1 5.8 4.4All other diseases (residual) 7 27,345 11,288 16,057 81.1 67.5 94.4 55.8 59.3 52.5Accidents (unintentional injuries) (V01-X59, Y85-Y86) 10,250 6,045 4,205 30.4 36.1 24.7 24.5 33.5 16.2Transport accidents (V01-V99, Y85) 2,689 1,956 733 8.0 11.7 4.3 7.6 11.3 4.0Motor vehicle accidents 8 2,406 1,717 689 7.1 10.3 4.1 6.8 10.0 3.8Other land transport accidents 9 63 51 12 0.2 0.3 0.1 0.2 0.3 0.1
See notes at the end of the table.
Statistics Canada – Catalogue no. 84F0209X 13
Mortality, Summary List of Causes – 2009
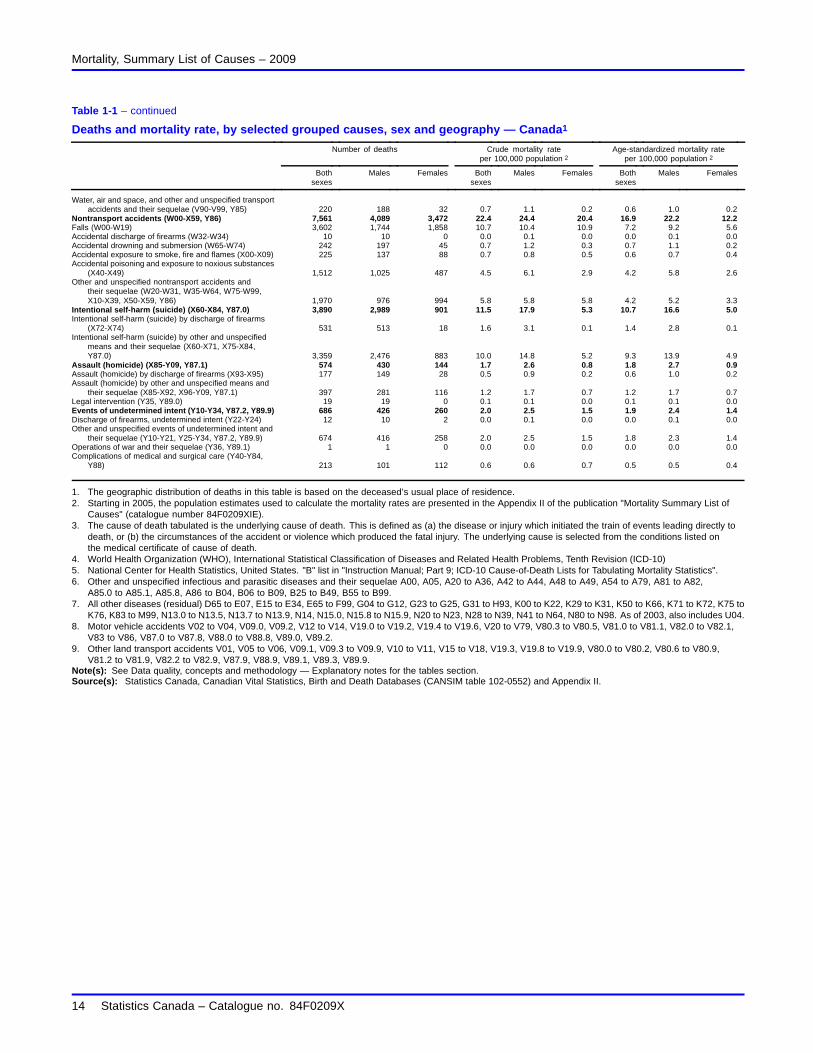
Table 1-1 – continued
Deaths and mortality rate, by selected grouped causes, sex and geography — Canada1
Number of deaths Crude mortality rateper 100,000 population 2
Age-standardized mortality rateper 100,000 population 2
Bothsexes
Males Females Bothsexes
Males Females Bothsexes
Males Females
Water, air and space, and other and unspecified transportaccidents and their sequelae (V90-V99, Y85) 220 188 32 0.7 1.1 0.2 0.6 1.0 0.2
Nontransport accidents (W00-X59, Y86) 7,561 4,089 3,472 22.4 24.4 20.4 16.9 22.2 12.2Falls (W00-W19) 3,602 1,744 1,858 10.7 10.4 10.9 7.2 9.2 5.6Accidental discharge of firearms (W32-W34) 10 10 0 0.0 0.1 0.0 0.0 0.1 0.0Accidental drowning and submersion (W65-W74) 242 197 45 0.7 1.2 0.3 0.7 1.1 0.2Accidental exposure to smoke, fire and flames (X00-X09) 225 137 88 0.7 0.8 0.5 0.6 0.7 0.4Accidental poisoning and exposure to noxious substances
(X40-X49) 1,512 1,025 487 4.5 6.1 2.9 4.2 5.8 2.6Other and unspecified nontransport accidents and
their sequelae (W20-W31, W35-W64, W75-W99,X10-X39, X50-X59, Y86) 1,970 976 994 5.8 5.8 5.8 4.2 5.2 3.3
Intentional self-harm (suicide) (X60-X84, Y87.0) 3,890 2,989 901 11.5 17.9 5.3 10.7 16.6 5.0Intentional self-harm (suicide) by discharge of firearms
(X72-X74) 531 513 18 1.6 3.1 0.1 1.4 2.8 0.1Intentional self-harm (suicide) by other and unspecified
means and their sequelae (X60-X71, X75-X84,Y87.0) 3,359 2,476 883 10.0 14.8 5.2 9.3 13.9 4.9
Assault (homicide) (X85-Y09, Y87.1) 574 430 144 1.7 2.6 0.8 1.8 2.7 0.9Assault (homicide) by discharge of firearms (X93-X95) 177 149 28 0.5 0.9 0.2 0.6 1.0 0.2Assault (homicide) by other and unspecified means and
their sequelae (X85-X92, X96-Y09, Y87.1) 397 281 116 1.2 1.7 0.7 1.2 1.7 0.7Legal intervention (Y35, Y89.0) 19 19 0 0.1 0.1 0.0 0.1 0.1 0.0Events of undetermined intent (Y10-Y34, Y87.2, Y89.9) 686 426 260 2.0 2.5 1.5 1.9 2.4 1.4Discharge of firearms, undetermined intent (Y22-Y24) 12 10 2 0.0 0.1 0.0 0.0 0.1 0.0Other and unspecified events of undetermined intent and
their sequelae (Y10-Y21, Y25-Y34, Y87.2, Y89.9) 674 416 258 2.0 2.5 1.5 1.8 2.3 1.4Operations of war and their sequelae (Y36, Y89.1) 1 1 0 0.0 0.0 0.0 0.0 0.0 0.0Complications of medical and surgical care (Y40-Y84,
Y88) 213 101 112 0.6 0.6 0.7 0.5 0.5 0.4
1. The geographic distribution of deaths in this table is based on the deceased’s usual place of residence.2. Starting in 2005, the population estimates used to calculate the mortality rates are presented in the Appendix II of the publication "Mortality Summary List of
Causes" (catalogue number 84F0209XIE).3. The cause of death tabulated is the underlying cause of death. This is defined as (a) the disease or injury which initiated the train of events leading directly to
death, or (b) the circumstances of the accident or violence which produced the fatal injury. The underlying cause is selected from the conditions listed onthe medical certificate of cause of death.
4. World Health Organization (WHO), International Statistical Classification of Diseases and Related Health Problems, Tenth Revision (ICD-10)5. National Center for Health Statistics, United States. "B" list in "Instruction Manual; Part 9; ICD-10 Cause-of-Death Lists for Tabulating Mortality Statistics".6. Other and unspecified infectious and parasitic diseases and their sequelae A00, A05, A20 to A36, A42 to A44, A48 to A49, A54 to A79, A81 to A82,
A85.0 to A85.1, A85.8, A86 to B04, B06 to B09, B25 to B49, B55 to B99.7. All other diseases (residual) D65 to E07, E15 to E34, E65 to F99, G04 to G12, G23 to G25, G31 to H93, K00 to K22, K29 to K31, K50 to K66, K71 to K72, K75 to
K76, K83 to M99, N13.0 to N13.5, N13.7 to N13.9, N14, N15.0, N15.8 to N15.9, N20 to N23, N28 to N39, N41 to N64, N80 to N98. As of 2003, also includes U04.8. Motor vehicle accidents V02 to V04, V09.0, V09.2, V12 to V14, V19.0 to V19.2, V19.4 to V19.6, V20 to V79, V80.3 to V80.5, V81.0 to V81.1, V82.0 to V82.1,
V83 to V86, V87.0 to V87.8, V88.0 to V88.8, V89.0, V89.2.9. Other land transport accidents V01, V05 to V06, V09.1, V09.3 to V09.9, V10 to V11, V15 to V18, V19.3, V19.8 to V19.9, V80.0 to V80.2, V80.6 to V80.9,
V81.2 to V81.9, V82.2 to V82.9, V87.9, V88.9, V89.1, V89.3, V89.9.Note(s): See Data quality, concepts and methodology — Explanatory notes for the tables section.Source(s): Statistics Canada, Canadian Vital Statistics, Birth and Death Databases (CANSIM table 102-0552) and Appendix II.
14 Statistics Canada – Catalogue no. 84F0209X

Mortality, Summary List of Causes – 2009
Table 1-2Deaths and mortality rate, by selected grouped causes, sex and geography — Newfoundland and Labrador1
Number of deaths Crude mortality rateper 100,000 population 2
Age-standardized mortality rateper 100,000 population 2
Bothsexes
Males Females Bothsexes
Males Females Bothsexes
Males Females
Total, all causes of death (A00-Y89) 3 , 4 , 5 4,391 2,316 2,075 862.9 927.7 800.5 630.9 785.5 503.7
Salmonella infections (A01-A02) 0 0 0 0.0 0.0 0.0 0.0 0.0 0.0Shigellosis and amoebiasis (A03, A06) 0 0 0 0.0 0.0 0.0 0.0 0.0 0.0Certain other intestinal infections (A04, A07-A09) 7 3 4 1.4 1.2 1.5 1.0 1.2 1.0Tuberculosis (A16-A19) 2 1 1 0.4 0.4 0.4 0.2 0.4 0.2Respiratory tuberculosis (A16) 2 1 1 0.4 0.4 0.4 0.2 0.4 0.2Other tuberculosis (A17-A19) 0 0 0 0.0 0.0 0.0 0.0 0.0 0.0Whooping cough (A37) 0 0 0 0.0 0.0 0.0 0.0 0.0 0.0Scarlet fever and erysipelas (A38, A46) 0 0 0 0.0 0.0 0.0 0.0 0.0 0.0Meningococcal infection (A39) 1 1 0 0.2 0.4 0.0 0.3 0.6 0.0Septicaemia (A40-A41) 26 13 13 5.1 5.2 5.0 3.8 3.9 3.5Syphilis (A50-A53) 0 0 0 0.0 0.0 0.0 0.0 0.0 0.0Acute poliomyelitis (A80) 0 0 0 0.0 0.0 0.0 0.0 0.0 0.0Arthropod-borne viral encephalitis (A83-A84, A85.2) 0 0 0 0.0 0.0 0.0 0.0 0.0 0.0Measles (B05) 0 0 0 0.0 0.0 0.0 0.0 0.0 0.0Viral hepatitis (B15-B19) 2 1 1 0.4 0.4 0.4 0.2 0.2 0.2Human immunodeficiency virus [HIV] disease (B20-B24) 1 1 0 0.2 0.4 0.0 0.2 0.5 0.0Malaria (B50-B54) 0 0 0 0.0 0.0 0.0 0.0 0.0 0.0Other and unspecified infectious and parasitic diseases and
their sequelae 6 4 3 1 0.8 1.2 0.4 0.6 1.0 0.2Malignant neoplasms (C00-C97) 1,380 767 613 271.2 307.2 236.5 196.6 243.8 160.4Malignant neoplasms of lip, oral cavity and pharynx
(C00-C14) 12 11 1 2.4 4.4 0.4 1.6 3.0 0.4Malignant neoplasm of oesophagus (C15) 30 21 9 5.9 8.4 3.5 4.1 6.9 2.1Malignant neoplasm of stomach (C16) 59 46 13 11.6 18.4 5.0 8.5 14.6 3.5Malignant neoplasms of colon, rectum and anus (C18-C21) 191 115 76 37.5 46.1 29.3 27.0 35.9 19.8Malignant neoplasm of liver and intrahepatic bile ducts (C22) 33 18 15 6.5 7.2 5.8 5.0 5.6 4.3Malignant neoplasm of pancreas (C25) 58 26 32 11.4 10.4 12.3 8.1 8.0 8.1Malignant neoplasm of larynx (C32) 15 14 1 2.9 5.6 0.4 2.1 4.7 0.2Malignant neoplasms of trachea, bronchus and lung
(C33-C34) 375 234 141 73.7 93.7 54.4 53.8 73.5 37.8Malignant melanoma of skin (C43) 22 14 8 4.3 5.6 3.1 3.3 4.6 2.1Malignant neoplasm of breast (C50) 76 0 76 14.9 0.0 29.3 10.6 0.0 19.3Malignant neoplasm of cervix uteri (C53) ... ... 8 ... ... 3.1 ... ... 2.2Malignant neoplasms of corpus uteri and uterus, part
unspecified (C54-C55) ... ... 12 ... ... 4.6 ... ... 3.4Malignant neoplasm of ovary (C56) ... ... 27 ... ... 10.4 ... ... 7.5Malignant neoplasm of prostate (C61) ... 64 ... ... 25.6 ... ... 21.9 ...Malignant neoplasms of kidney and renal pelvis (C64-C65) 40 25 15 7.9 10.0 5.8 5.8 8.0 4.3Malignant neoplasm of bladder (C67) 30 19 11 5.9 7.6 4.2 4.3 6.3 2.7Malignant neoplasms of meninges, brain and other parts of
central nervous system (C70-C72) 33 17 16 6.5 6.8 6.2 4.9 5.2 4.4Malignant neoplasms of lymphoid, haematopoietic and
related tissue (C81-C96) 87 45 42 17.1 18.0 16.2 12.6 13.9 11.0Hodgkin’s disease (C81) 0 0 0 0.0 0.0 0.0 0.0 0.0 0.0Non-Hodgkin’s lymphoma (C82-C85) 33 19 14 6.5 7.6 5.4 4.7 5.7 3.5Leukaemia (C91-C95) 29 12 17 5.7 4.8 6.6 4.3 3.6 4.7Multiple myeloma and immunoproliferative neoplasms (C88,
C90) 24 13 11 4.7 5.2 4.2 3.5 4.3 2.9Other and unspecified malignant neoplasms of lymphoid,
haematopoietic and related tissue (C96) 1 1 0 0.2 0.4 0.0 0.1 0.3 0.0All other and unspecified malignant neoplasms (C17,
C23-C24, C26-C31, C37-C41, C44-C49, C51-C52,C57-C60, C62-C63, C66, C68-C69, C73-C80, C97) 208 98 110 40.9 39.3 42.4 29.1 31.6 27.4
In situ neoplasms, benign neoplasms and neoplasms ofuncertain or unknown behaviour (D00-D48) 33 15 18 6.5 6.0 6.9 4.9 5.3 4.5
Anaemias (D50-D64) 7 3 4 1.4 1.2 1.5 0.9 1.4 0.9Diabetes mellitus (E10-E14) 199 94 105 39.1 37.7 40.5 27.8 32.5 25.7Nutritional deficiencies (E40-E64) 1 0 1 0.2 0.0 0.4 0.1 0.0 0.2Malnutrition (E40-E46) 0 0 0 0.0 0.0 0.0 0.0 0.0 0.0Other nutritional deficiencies (E50-E64) 1 0 1 0.2 0.0 0.4 0.1 0.0 0.2Meningitis (G00, G03) 1 1 0 0.2 0.4 0.0 0.3 0.6 0.0Parkinson’s disease (G20-G21) 28 14 14 5.5 5.6 5.4 4.2 5.2 3.7Alzheimer’s disease (G30) 89 24 65 17.5 9.6 25.1 12.1 8.7 13.6Major cardiovascular diseases (I00-I78) 1,392 718 674 273.6 287.6 260.0 193.3 243.5 150.8Diseases of heart (I00-I09, I11, I13, I20-I51) 987 529 458 194.0 211.9 176.7 137.3 177.0 103.4Acute rheumatic fever and chronic rheumatic heart diseases
(I00-I09) 3 0 3 0.6 0.0 1.2 0.5 0.0 0.9Hypertensive heart disease (I11) 28 8 20 5.5 3.2 7.7 3.7 2.8 4.0Hypertensive heart and renal disease (I13) 4 1 3 0.8 0.4 1.2 0.5 0.3 0.5Ischaemic heart diseases (I20-I25) 759 430 329 149.2 172.2 126.9 105.2 142.4 73.8Acute myocardial infarction (I21-I22) 254 140 114 49.9 56.1 44.0 35.4 44.7 27.1Other acute ischaemic heart diseases (I24) 19 14 5 3.7 5.6 1.9 2.8 4.8 1.0Other forms of chronic ischaemic heart disease (I20, I25) 486 276 210 95.5 110.6 81.0 67.0 92.9 45.7
See notes at the end of the table.
Statistics Canada – Catalogue no. 84F0209X 15

Mortality, Summary List of Causes – 2009
Table 1-2 – continued
Deaths and mortality rate, by selected grouped causes, sex and geography — Newfoundland and Labrador1
Number of deaths Crude mortality rateper 100,000 population 2
Age-standardized mortality rateper 100,000 population 2
Bothsexes
Males Females Bothsexes
Males Females Bothsexes
Males Females
Atherosclerotic cardiovascular disease, so described (I25.0) 120 73 47 23.6 29.2 18.1 16.1 22.7 10.5All other forms of chronic ischaemic heart disease (I20,
I25.1-I25.9) 366 203 163 71.9 81.3 62.9 50.9 70.2 35.3Other heart diseases (I26-I51) 193 90 103 37.9 36.1 39.7 27.3 31.5 24.3Acute and subacute endocarditis (I33) 2 2 0 0.4 0.8 0.0 0.3 0.5 0.0Diseases of pericardium and acute myocarditis (I30-I31, I40) 0 0 0 0.0 0.0 0.0 0.0 0.0 0.0Heart failure (I50) 68 27 41 13.4 10.8 15.8 9.2 10.5 9.0All other forms of heart disease (I26-I28, I34-I38, I42-I49,
I51) 123 61 62 24.2 24.4 23.9 17.8 20.4 15.2Essential hypertension and hypertensive renal disease (I10,
I12, I15) 56 21 35 11.0 8.4 13.5 7.6 8.5 7.2Cerebrovascular diseases (I60-I69) 305 143 162 59.9 57.3 62.5 42.4 49.5 36.0Atherosclerosis (I70) 8 4 4 1.6 1.6 1.5 1.1 1.6 0.7Other diseases of circulatory system (I71-I78) 36 21 15 7.1 8.4 5.8 5.0 6.9 3.6Aortic aneurysm and dissection (I71) 20 14 6 3.9 5.6 2.3 2.8 4.6 1.6Other diseases of arteries, arterioles and capillaries (I72-I78) 16 7 9 3.1 2.8 3.5 2.2 2.3 1.9Other disorders of circulatory system (I80-I99) 1 0 1 0.2 0.0 0.4 0.1 0.0 0.3Influenza and pneumonia (J09-J18) 75 30 45 14.7 12.0 17.4 10.6 10.4 10.6Influenza (J09-J11) 12 4 8 2.4 1.6 3.1 2.0 1.4 2.6Pneumonia (J12-J18) 63 26 37 12.4 10.4 14.3 8.7 9.0 8.0Other acute lower respiratory infections (J20-J22) 3 2 1 0.6 0.8 0.4 0.4 0.9 0.3Acute bronchitis and bronchiolitis (J20-J21) 1 0 1 0.2 0.0 0.4 0.2 0.0 0.3Unspecified acute lower respiratory infection (J22) 2 2 0 0.4 0.8 0.0 0.3 0.9 0.0Chronic lower respiratory diseases (J40-J47) 218 123 95 42.8 49.3 36.6 31.0 42.1 23.0Bronchitis, chronic and unspecified (J40-J42) 0 0 0 0.0 0.0 0.0 0.0 0.0 0.0Emphysema (J43) 10 8 2 2.0 3.2 0.8 1.4 2.6 0.4Asthma (J45-J46) 3 0 3 0.6 0.0 1.2 0.5 0.0 0.9Other chronic lower respiratory diseases (J44, J47) 205 115 90 40.3 46.1 34.7 29.1 39.5 21.7Pneumoconioses and chemical effects (J60-J66, J68) 1 0 1 0.2 0.0 0.4 0.1 0.0 0.2Pneumonitis due to solids and liquids (J69) 17 11 6 3.3 4.4 2.3 2.4 3.9 1.5Other diseases of respiratory system (J00-J06, J30-J39,
J67, J70-J98) 51 25 26 10.0 10.0 10.0 7.3 8.2 6.2Peptic ulcer (K25-K28) 3 3 0 0.6 1.2 0.0 0.4 1.1 0.0Diseases of appendix (K35-K38) 1 1 0 0.2 0.4 0.0 0.2 0.3 0.0Hernia (K40-K46) 8 6 2 1.6 2.4 0.8 1.2 2.4 0.4Chronic liver disease and cirrhosis (K70, K73-K74) 32 20 12 6.3 8.0 4.6 4.5 6.0 3.0Alcoholic liver disease (K70) 11 9 2 2.2 3.6 0.8 1.5 2.5 0.4Other chronic liver disease and cirrhosis (K73-K74) 21 11 10 4.1 4.4 3.9 3.1 3.5 2.5Cholelithiasis and other disorders of gallbladder (K80-K82) 10 7 3 2.0 2.8 1.2 1.4 2.3 0.6Nephritis, nephrotic syndrome and nephrosis (N00-N07,
N17-N19, N25-N27) 95 45 50 18.7 18.0 19.3 13.2 15.4 10.8Acute and rapidly progressive nephritic and nephrotic
syndrome (N00-N01, N04) 0 0 0 0.0 0.0 0.0 0.0 0.0 0.0Chronic glomerulonephritis, nephritis and nephropathy
not specified as acute or chronic, and renal sclerosisunspecified (N02-N03, N05-N07, N26) 6 2 4 1.2 0.8 1.5 0.8 0.7 0.8
Renal failure (N17-N19) 89 43 46 17.5 17.2 17.7 12.4 14.8 10.0Other disorders of kidney (N25, N27) 0 0 0 0.0 0.0 0.0 0.0 0.0 0.0Infections of kidney (N10-N12, N13.6, N15.1) 0 0 0 0.0 0.0 0.0 0.0 0.0 0.0Hyperplasia of prostate (N40) ... 2 ... ... 0.8 ... ... 0.9 ...Inflammatory diseases of female pelvic organs (N70-N76) ... ... 0 ... ... 0.0 ... ... 0.0Pregnancy, childbirth and the puerperium (O00-O99) ... ... 0 ... ... 0.0 ... ... 0.0Pregnancy with abortive outcome (O00-O07) ... ... 0 ... ... 0.0 ... ... 0.0Other complications of pregnancy, childbirth and the
puerperium (O10-O99) ... ... 0 ... ... 0.0 ... ... 0.0Certain conditions originating in the perinatal period
(P00-P96) 17 10 7 3.3 4.0 2.7 5.0 5.6 4.3Congenital malformations, deformations and chromosomal
abnormalities (Q00-Q99) 22 13 9 4.3 5.2 3.5 5.1 6.2 3.8Symptoms, signs and abnormal clinical and laboratory
findings, not elsewhere classified (R00-R99) 47 26 21 9.2 10.4 8.1 8.5 10.3 6.8All other diseases (residual) 7 416 187 229 81.8 74.9 88.3 59.3 65.1 52.6Accidents (unintentional injuries) (V01-X59, Y85-Y86) 145 99 46 28.5 39.7 17.7 23.8 37.8 12.5Transport accidents (V01-V99, Y85) 61 50 11 12.0 20.0 4.2 11.8 20.2 4.1Motor vehicle accidents 8 37 28 9 7.3 11.2 3.5 7.0 11.4 3.1Other land transport accidents 9 2 1 1 0.4 0.4 0.4 0.3 0.3 0.4Water, air and space, and other and unspecified transport
accidents and their sequelae (V90-V99, Y85) 22 21 1 4.3 8.4 0.4 4.5 8.6 0.6Nontransport accidents (W00-X59, Y86) 84 49 35 16.5 19.6 13.5 12.0 17.6 8.4Falls (W00-W19) 19 10 9 3.7 4.0 3.5 2.6 3.2 2.2Accidental discharge of firearms (W32-W34) 0 0 0 0.0 0.0 0.0 0.0 0.0 0.0Accidental drowning and submersion (W65-W74) 9 7 2 1.8 2.8 0.8 1.5 2.2 0.7Accidental exposure to smoke, fire and flames (X00-X09) 2 2 0 0.4 0.8 0.0 0.4 0.7 0.0Accidental poisoning and exposure to noxious substances
(X40-X49) 3 2 1 0.6 0.8 0.4 0.6 0.8 0.4
See notes at the end of the table.
16 Statistics Canada – Catalogue no. 84F0209X

Mortality, Summary List of Causes – 2009
Table 1-2 – continued
Deaths and mortality rate, by selected grouped causes, sex and geography — Newfoundland and Labrador1
Number of deaths Crude mortality rateper 100,000 population 2
Age-standardized mortality rateper 100,000 population 2
Bothsexes
Males Females Bothsexes
Males Females Bothsexes
Males Females
Other and unspecified nontransport accidents and theirsequelae (W20-W31, W35-W64, W75-W99, X10-X39,X50-X59, Y86) 51 28 23 10.0 11.2 8.9 7.0 10.8 5.1
Intentional self-harm (suicide) (X60-X84, Y87.0) 48 44 4 9.4 17.6 1.5 8.9 16.7 1.3Intentional self-harm (suicide) by discharge of firearms
(X72-X74) 11 11 0 2.2 4.4 0.0 2.0 4.0 0.0Intentional self-harm (suicide) by other and unspecified
means and their sequelae (X60-X71, X75-X84, Y87.0) 37 33 4 7.3 13.2 1.5 6.9 12.7 1.3Assault (homicide) (X85-Y09, Y87.1) 1 1 0 0.2 0.4 0.0 0.2 0.5 0.0Assault (homicide) by discharge of firearms (X93-X95) 1 1 0 0.2 0.4 0.0 0.2 0.5 0.0Assault (homicide) by other and unspecified means and
their sequelae (X85-X92, X96-Y09, Y87.1) 0 0 0 0.0 0.0 0.0 0.0 0.0 0.0Legal intervention (Y35, Y89.0) 0 0 0 0.0 0.0 0.0 0.0 0.0 0.0Events of undetermined intent (Y10-Y34, Y87.2, Y89.9) 2 1 1 0.4 0.4 0.4 0.3 0.3 0.2Discharge of firearms, undetermined intent (Y22-Y24) 1 1 0 0.2 0.4 0.0 0.2 0.3 0.0Other and unspecified events of undetermined intent and
their sequelae (Y10-Y21, Y25-Y34, Y87.2, Y89.9) 1 0 1 0.2 0.0 0.4 0.1 0.0 0.2Operations of war and their sequelae (Y36, Y89.1) 0 0 0 0.0 0.0 0.0 0.0 0.0 0.0Complications of medical and surgical care (Y40-Y84, Y88) 3 1 2 0.6 0.4 0.8 0.4 0.3 0.4
1. The geographic distribution of deaths in this table is based on the deceased’s usual place of residence.2. Starting in 2005, the population estimates used to calculate the mortality rates are presented in the Appendix II of the publication "Mortality Summary List of
Causes" (catalogue number 84F0209XIE).3. The cause of death tabulated is the underlying cause of death. This is defined as (a) the disease or injury which initiated the train of events leading directly to
death, or (b) the circumstances of the accident or violence which produced the fatal injury. The underlying cause is selected from the conditions listed onthe medical certificate of cause of death.
4. World Health Organization (WHO), International Statistical Classification of Diseases and Related Health Problems, Tenth Revision (ICD-10)5. National Center for Health Statistics, United States. "B" list in "Instruction Manual; Part 9; ICD-10 Cause-of-Death Lists for Tabulating Mortality Statistics".6. Other and unspecified infectious and parasitic diseases and their sequelae A00, A05, A20 to A36, A42 to A44, A48 to A49, A54 to A79, A81 to A82,
A85.0 to A85.1, A85.8, A86 to B04, B06 to B09, B25 to B49, B55 to B99.7. All other diseases (residual) D65 to E07, E15 to E34, E65 to F99, G04 to G12, G23 to G25, G31 to H93, K00 to K22, K29 to K31, K50 to K66, K71 to K72, K75 to
K76, K83 to M99, N13.0 to N13.5, N13.7 to N13.9, N14, N15.0, N15.8 to N15.9, N20 to N23, N28 to N39, N41 to N64, N80 to N98. As of 2003, also includes U04.8. Motor vehicle accidents V02 to V04, V09.0, V09.2, V12 to V14, V19.0 to V19.2, V19.4 to V19.6, V20 to V79, V80.3 to V80.5, V81.0 to V81.1, V82.0 to V82.1,
V83 to V86, V87.0 to V87.8, V88.0 to V88.8, V89.0, V89.2.9. Other land transport accidents V01, V05 to V06, V09.1, V09.3 to V09.9, V10 to V11, V15 to V18, V19.3, V19.8 to V19.9, V80.0 to V80.2, V80.6 to V80.9,
V81.2 to V81.9, V82.2 to V82.9, V87.9, V88.9, V89.1, V89.3, V89.9.Note(s): See Data quality, concepts and methodology — Explanatory notes for the tables section.Source(s): Statistics Canada, Canadian Vital Statistics, Birth and Death Databases (CANSIM table 102-0552) and Appendix II.
Statistics Canada – Catalogue no. 84F0209X 17

Mortality, Summary List of Causes – 2009
Table 1-3Deaths and mortality rate, by selected grouped causes, sex and geography — Prince Edward Island1
Number of deaths Crude mortality rateper 100,000 population 2
Age-standardized mortality rateper 100,000 population 2
Bothsexes
Males Females Bothsexes
Males Females Bothsexes
Males Females
Total, all causes of death (A00-Y89) 3 , 4 , 5 1,268 632 636 897.9 916.2 880.4 600.1 738.9 488.5
Salmonella infections (A01-A02) 0 0 0 0.0 0.0 0.0 0.0 0.0 0.0Shigellosis and amoebiasis (A03, A06) 0 0 0 0.0 0.0 0.0 0.0 0.0 0.0Certain other intestinal infections (A04, A07-A09) 2 2 0 1.4 2.9 0.0 1.1 2.8 0.0Tuberculosis (A16-A19) 0 0 0 0.0 0.0 0.0 0.0 0.0 0.0Respiratory tuberculosis (A16) 0 0 0 0.0 0.0 0.0 0.0 0.0 0.0Other tuberculosis (A17-A19) 0 0 0 0.0 0.0 0.0 0.0 0.0 0.0Whooping cough (A37) 0 0 0 0.0 0.0 0.0 0.0 0.0 0.0Scarlet fever and erysipelas (A38, A46) 0 0 0 0.0 0.0 0.0 0.0 0.0 0.0Meningococcal infection (A39) 0 0 0 0.0 0.0 0.0 0.0 0.0 0.0Septicaemia (A40-A41) 10 2 8 7.1 2.9 11.1 5.2 2.4 7.5Syphilis (A50-A53) 0 0 0 0.0 0.0 0.0 0.0 0.0 0.0Acute poliomyelitis (A80) 0 0 0 0.0 0.0 0.0 0.0 0.0 0.0Arthropod-borne viral encephalitis (A83-A84, A85.2) 0 0 0 0.0 0.0 0.0 0.0 0.0 0.0Measles (B05) 0 0 0 0.0 0.0 0.0 0.0 0.0 0.0Viral hepatitis (B15-B19) 0 0 0 0.0 0.0 0.0 0.0 0.0 0.0Human immunodeficiency virus [HIV] disease (B20-B24) 0 0 0 0.0 0.0 0.0 0.0 0.0 0.0Malaria (B50-B54) 0 0 0 0.0 0.0 0.0 0.0 0.0 0.0Other and unspecified infectious and parasitic diseases and
their sequelae 6 2 1 1 1.4 1.4 1.4 1.1 1.1 1.1Malignant neoplasms (C00-C97) 367 183 184 259.9 265.3 254.7 181.9 210.0 164.4Malignant neoplasms of lip, oral cavity and pharynx
(C00-C14) 7 6 1 5.0 8.7 1.4 3.6 7.0 1.0Malignant neoplasm of oesophagus (C15) 11 10 1 7.8 14.5 1.4 6.0 12.0 0.6Malignant neoplasm of stomach (C16) 7 6 1 5.0 8.7 1.4 3.6 6.7 1.0Malignant neoplasms of colon, rectum and anus (C18-C21) 30 16 14 21.2 23.2 19.4 14.8 17.9 12.4Malignant neoplasm of liver and intrahepatic bile ducts (C22) 9 8 1 6.4 11.6 1.4 4.4 8.8 1.1Malignant neoplasm of pancreas (C25) 19 11 8 13.5 15.9 11.1 9.4 13.0 6.3Malignant neoplasm of larynx (C32) 1 1 0 0.7 1.4 0.0 0.6 1.2 0.0Malignant neoplasms of trachea, bronchus and lung
(C33-C34) 91 40 51 64.4 58.0 70.6 46.1 45.1 48.2Malignant melanoma of skin (C43) 3 0 3 2.1 0.0 4.2 1.7 0.0 3.2Malignant neoplasm of breast (C50) 26 0 26 18.4 0.0 36.0 12.9 0.0 23.9Malignant neoplasm of cervix uteri (C53) ... ... 4 ... ... 5.5 ... ... 5.2Malignant neoplasms of corpus uteri and uterus, part
unspecified (C54-C55) ... ... 5 ... ... 6.9 ... ... 3.8Malignant neoplasm of ovary (C56) ... ... 7 ... ... 9.7 ... ... 5.3Malignant neoplasm of prostate (C61) ... 23 ... ... 33.3 ... ... 26.4 ...Malignant neoplasms of kidney and renal pelvis (C64-C65) 13 5 8 9.2 7.2 11.1 6.8 5.4 8.0Malignant neoplasm of bladder (C67) 15 9 6 10.6 13.0 8.3 6.2 10.3 3.7Malignant neoplasms of meninges, brain and other parts of
central nervous system (C70-C72) 10 6 4 7.1 8.7 5.5 5.0 6.3 3.5Malignant neoplasms of lymphoid, haematopoietic and
related tissue (C81-C96) 30 12 18 21.2 17.4 24.9 13.8 13.4 14.6Hodgkin’s disease (C81) 0 0 0 0.0 0.0 0.0 0.0 0.0 0.0Non-Hodgkin’s lymphoma (C82-C85) 10 4 6 7.1 5.8 8.3 4.5 4.7 5.0Leukaemia (C91-C95) 9 4 5 6.4 5.8 6.9 3.9 4.3 3.6Multiple myeloma and immunoproliferative neoplasms (C88,
C90) 11 4 7 7.8 5.8 9.7 5.3 4.4 6.1Other and unspecified malignant neoplasms of lymphoid,
haematopoietic and related tissue (C96) 0 0 0 0.0 0.0 0.0 0.0 0.0 0.0All other and unspecified malignant neoplasms (C17,
C23-C24, C26-C31, C37-C41, C44-C49, C51-C52,C57-C60, C62-C63, C66, C68-C69, C73-C80, C97) 56 30 26 39.7 43.5 36.0 28.8 36.2 22.6
In situ neoplasms, benign neoplasms and neoplasms ofuncertain or unknown behaviour (D00-D48) 8 5 3 5.7 7.2 4.2 3.6 5.8 1.8
Anaemias (D50-D64) 4 2 2 2.8 2.9 2.8 1.7 2.2 1.8Diabetes mellitus (E10-E14) 17 12 5 12.0 17.4 6.9 8.2 13.3 4.2Nutritional deficiencies (E40-E64) 2 0 2 1.4 0.0 2.8 0.8 0.0 1.4Malnutrition (E40-E46) 2 0 2 1.4 0.0 2.8 0.8 0.0 1.4Other nutritional deficiencies (E50-E64) 0 0 0 0.0 0.0 0.0 0.0 0.0 0.0Meningitis (G00, G03) 2 1 1 1.4 1.4 1.4 1.0 1.2 0.9Parkinson’s disease (G20-G21) 10 5 5 7.1 7.2 6.9 4.9 5.9 3.9Alzheimer’s disease (G30) 32 8 24 22.7 11.6 33.2 12.2 9.8 14.4Major cardiovascular diseases (I00-I78) 417 209 208 295.3 303.0 287.9 183.8 234.4 138.4Diseases of heart (I00-I09, I11, I13, I20-I51) 306 155 151 216.7 224.7 209.0 136.1 172.7 101.5Acute rheumatic fever and chronic rheumatic heart diseases
(I00-I09) 2 1 1 1.4 1.4 1.4 0.9 1.2 0.6Hypertensive heart disease (I11) 3 0 3 2.1 0.0 4.2 1.2 0.0 2.1Hypertensive heart and renal disease (I13) 0 0 0 0.0 0.0 0.0 0.0 0.0 0.0Ischaemic heart diseases (I20-I25) 233 125 108 165.0 181.2 149.5 104.3 137.7 73.9Acute myocardial infarction (I21-I22) 92 49 43 65.1 71.0 59.5 41.9 53.4 30.6Other acute ischaemic heart diseases (I24) 0 0 0 0.0 0.0 0.0 0.0 0.0 0.0Other forms of chronic ischaemic heart disease (I20, I25) 141 76 65 99.8 110.2 90.0 62.4 84.3 43.3
See notes at the end of the table.
18 Statistics Canada – Catalogue no. 84F0209X

Mortality, Summary List of Causes – 2009
Table 1-3 – continued
Deaths and mortality rate, by selected grouped causes, sex and geography — Prince Edward Island1
Number of deaths Crude mortality rateper 100,000 population 2
Age-standardized mortality rateper 100,000 population 2
Bothsexes
Males Females Bothsexes
Males Females Bothsexes
Males Females
Atherosclerotic cardiovascular disease, so described (I25.0) 0 0 0 0.0 0.0 0.0 0.0 0.0 0.0All other forms of chronic ischaemic heart disease (I20,
I25.1-I25.9) 141 76 65 99.8 110.2 90.0 62.4 84.3 43.3Other heart diseases (I26-I51) 68 29 39 48.2 42.0 54.0 29.6 33.7 25.0Acute and subacute endocarditis (I33) 0 0 0 0.0 0.0 0.0 0.0 0.0 0.0Diseases of pericardium and acute myocarditis (I30-I31, I40) 1 0 1 0.7 0.0 1.4 0.5 0.0 0.9Heart failure (I50) 21 5 16 14.9 7.2 22.1 8.2 5.6 9.2All other forms of heart disease (I26-I28, I34-I38, I42-I49,
I51) 46 24 22 32.6 34.8 30.5 21.0 28.1 14.9Essential hypertension and hypertensive renal disease (I10,
I12, I15) 4 4 0 2.8 5.8 0.0 1.8 4.6 0.0Cerebrovascular diseases (I60-I69) 81 34 47 57.4 49.3 65.1 33.5 39.3 27.5Atherosclerosis (I70) 6 5 1 4.2 7.2 1.4 2.7 5.6 1.1Other diseases of circulatory system (I71-I78) 20 11 9 14.2 15.9 12.5 9.8 12.2 8.2Aortic aneurysm and dissection (I71) 12 8 4 8.5 11.6 5.5 5.8 8.8 3.2Other diseases of arteries, arterioles and capillaries (I72-I78) 8 3 5 5.7 4.3 6.9 4.0 3.4 5.0Other disorders of circulatory system (I80-I99) 3 1 2 2.1 1.4 2.8 1.7 0.9 2.3Influenza and pneumonia (J09-J18) 48 13 35 34.0 18.8 48.5 20.6 15.5 23.8Influenza (J09-J11) 2 0 2 1.4 0.0 2.8 0.8 0.0 1.2Pneumonia (J12-J18) 46 13 33 32.6 18.8 45.7 19.8 15.5 22.6Other acute lower respiratory infections (J20-J22) 0 0 0 0.0 0.0 0.0 0.0 0.0 0.0Acute bronchitis and bronchiolitis (J20-J21) 0 0 0 0.0 0.0 0.0 0.0 0.0 0.0Unspecified acute lower respiratory infection (J22) 0 0 0 0.0 0.0 0.0 0.0 0.0 0.0Chronic lower respiratory diseases (J40-J47) 51 28 23 36.1 40.6 31.8 23.5 31.7 17.5Bronchitis, chronic and unspecified (J40-J42) 2 1 1 1.4 1.4 1.4 0.8 1.0 0.5Emphysema (J43) 4 2 2 2.8 2.9 2.8 1.7 2.2 1.6Asthma (J45-J46) 0 0 0 0.0 0.0 0.0 0.0 0.0 0.0Other chronic lower respiratory diseases (J44, J47) 45 25 20 31.9 36.2 27.7 20.9 28.4 15.4Pneumoconioses and chemical effects (J60-J66, J68) 0 0 0 0.0 0.0 0.0 0.0 0.0 0.0Pneumonitis due to solids and liquids (J69) 5 3 2 3.5 4.3 2.8 2.8 4.2 1.6Other diseases of respiratory system (J00-J06, J30-J39,
J67, J70-J98) 18 11 7 12.7 15.9 9.7 8.8 12.1 6.3Peptic ulcer (K25-K28) 2 0 2 1.4 0.0 2.8 1.0 0.0 1.9Diseases of appendix (K35-K38) 1 1 0 0.7 1.4 0.0 0.9 1.9 0.0Hernia (K40-K46) 0 0 0 0.0 0.0 0.0 0.0 0.0 0.0Chronic liver disease and cirrhosis (K70, K73-K74) 8 6 2 5.7 8.7 2.8 3.8 6.2 2.0Alcoholic liver disease (K70) 2 2 0 1.4 2.9 0.0 0.9 1.8 0.0Other chronic liver disease and cirrhosis (K73-K74) 6 4 2 4.2 5.8 2.8 2.9 4.4 2.0Cholelithiasis and other disorders of gallbladder (K80-K82) 3 3 0 2.1 4.3 0.0 1.2 3.5 0.0Nephritis, nephrotic syndrome and nephrosis (N00-N07,
N17-N19, N25-N27) 23 12 11 16.3 17.4 15.2 11.6 14.3 9.1Acute and rapidly progressive nephritic and nephrotic
syndrome (N00-N01, N04) 0 0 0 0.0 0.0 0.0 0.0 0.0 0.0Chronic glomerulonephritis, nephritis and nephropathy
not specified as acute or chronic, and renal sclerosisunspecified (N02-N03, N05-N07, N26) 0 0 0 0.0 0.0 0.0 0.0 0.0 0.0
Renal failure (N17-N19) 23 12 11 16.3 17.4 15.2 11.6 14.3 9.1Other disorders of kidney (N25, N27) 0 0 0 0.0 0.0 0.0 0.0 0.0 0.0Infections of kidney (N10-N12, N13.6, N15.1) 0 0 0 0.0 0.0 0.0 0.0 0.0 0.0Hyperplasia of prostate (N40) ... 1 ... ... 1.4 ... ... 1.1 ...Inflammatory diseases of female pelvic organs (N70-N76) ... ... 0 ... ... 0.0 ... ... 0.0Pregnancy, childbirth and the puerperium (O00-O99) ... ... 0 ... ... 0.0 ... ... 0.0Pregnancy with abortive outcome (O00-O07) ... ... 0 ... ... 0.0 ... ... 0.0Other complications of pregnancy, childbirth and the
puerperium (O10-O99) ... ... 0 ... ... 0.0 ... ... 0.0Certain conditions originating in the perinatal period
(P00-P96) 4 3 1 2.8 4.3 1.4 3.9 5.9 2.0Congenital malformations, deformations and chromosomal
abnormalities (Q00-Q99) 0 0 0 0.0 0.0 0.0 0.0 0.0 0.0Symptoms, signs and abnormal clinical and laboratory
findings, not elsewhere classified (R00-R99) 12 6 6 8.5 8.7 8.3 6.6 8.7 4.6All other diseases (residual) 7 129 52 77 91.3 75.4 106.6 57.9 60.0 58.0Accidents (unintentional injuries) (V01-X59, Y85-Y86) 64 40 24 45.3 58.0 33.2 34.8 53.6 18.7Transport accidents (V01-V99, Y85) 17 15 2 12.0 21.7 2.8 12.7 23.0 3.2Motor vehicle accidents 8 16 14 2 11.3 20.3 2.8 12.2 21.8 3.2Other land transport accidents 9 0 0 0 0.0 0.0 0.0 0.0 0.0 0.0Water, air and space, and other and unspecified transport
accidents and their sequelae (V90-V99, Y85) 1 1 0 0.7 1.4 0.0 0.6 1.2 0.0Nontransport accidents (W00-X59, Y86) 47 25 22 33.3 36.2 30.5 22.1 30.6 15.5Falls (W00-W19) 23 12 11 16.3 17.4 15.2 10.5 15.3 6.8Accidental discharge of firearms (W32-W34) 0 0 0 0.0 0.0 0.0 0.0 0.0 0.0Accidental drowning and submersion (W65-W74) 1 1 0 0.7 1.4 0.0 0.4 0.9 0.0Accidental exposure to smoke, fire and flames (X00-X09) 0 0 0 0.0 0.0 0.0 0.0 0.0 0.0Accidental poisoning and exposure to noxious substances
(X40-X49) 6 4 2 4.2 5.8 2.8 3.8 5.1 2.5
See notes at the end of the table.
Statistics Canada – Catalogue no. 84F0209X 19
Mortality, Summary List of Causes – 2009
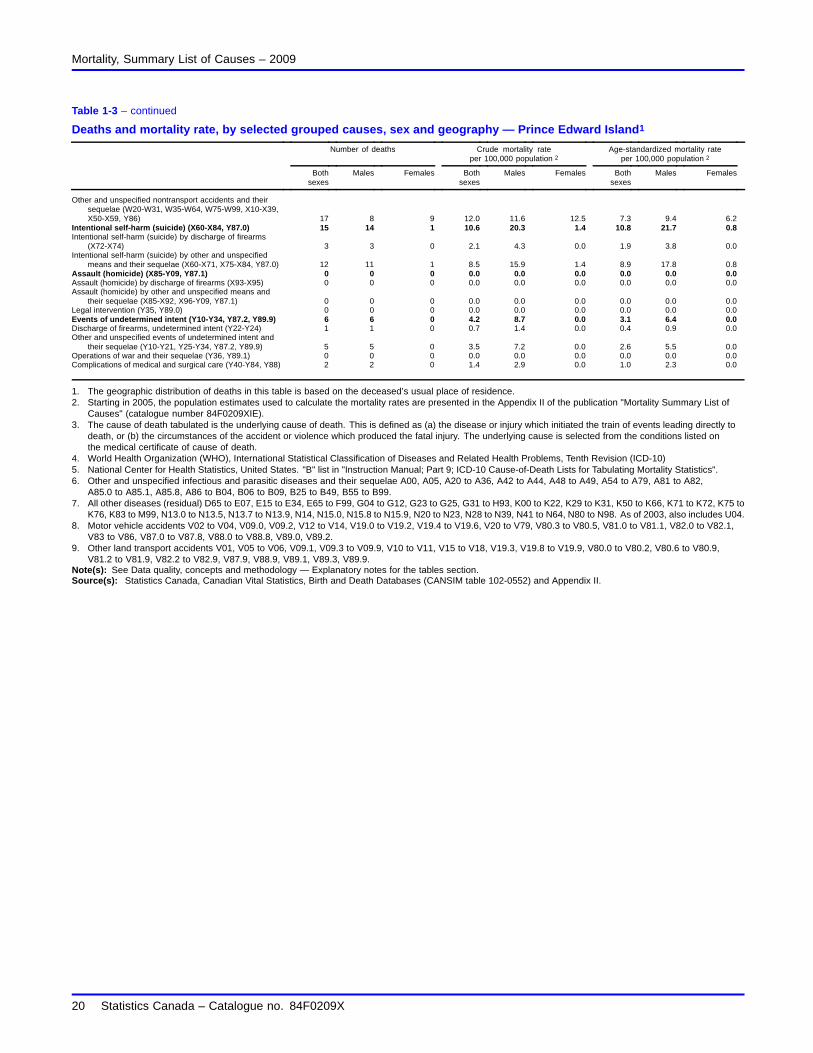
Table 1-3 – continued
Deaths and mortality rate, by selected grouped causes, sex and geography — Prince Edward Island1
Number of deaths Crude mortality rateper 100,000 population 2
Age-standardized mortality rateper 100,000 population 2
Bothsexes
Males Females Bothsexes
Males Females Bothsexes
Males Females
Other and unspecified nontransport accidents and theirsequelae (W20-W31, W35-W64, W75-W99, X10-X39,X50-X59, Y86) 17 8 9 12.0 11.6 12.5 7.3 9.4 6.2
Intentional self-harm (suicide) (X60-X84, Y87.0) 15 14 1 10.6 20.3 1.4 10.8 21.7 0.8Intentional self-harm (suicide) by discharge of firearms
(X72-X74) 3 3 0 2.1 4.3 0.0 1.9 3.8 0.0Intentional self-harm (suicide) by other and unspecified
means and their sequelae (X60-X71, X75-X84, Y87.0) 12 11 1 8.5 15.9 1.4 8.9 17.8 0.8Assault (homicide) (X85-Y09, Y87.1) 0 0 0 0.0 0.0 0.0 0.0 0.0 0.0Assault (homicide) by discharge of firearms (X93-X95) 0 0 0 0.0 0.0 0.0 0.0 0.0 0.0Assault (homicide) by other and unspecified means and
their sequelae (X85-X92, X96-Y09, Y87.1) 0 0 0 0.0 0.0 0.0 0.0 0.0 0.0Legal intervention (Y35, Y89.0) 0 0 0 0.0 0.0 0.0 0.0 0.0 0.0Events of undetermined intent (Y10-Y34, Y87.2, Y89.9) 6 6 0 4.2 8.7 0.0 3.1 6.4 0.0Discharge of firearms, undetermined intent (Y22-Y24) 1 1 0 0.7 1.4 0.0 0.4 0.9 0.0Other and unspecified events of undetermined intent and
their sequelae (Y10-Y21, Y25-Y34, Y87.2, Y89.9) 5 5 0 3.5 7.2 0.0 2.6 5.5 0.0Operations of war and their sequelae (Y36, Y89.1) 0 0 0 0.0 0.0 0.0 0.0 0.0 0.0Complications of medical and surgical care (Y40-Y84, Y88) 2 2 0 1.4 2.9 0.0 1.0 2.3 0.0
1. The geographic distribution of deaths in this table is based on the deceased’s usual place of residence.2. Starting in 2005, the population estimates used to calculate the mortality rates are presented in the Appendix II of the publication "Mortality Summary List of
Causes" (catalogue number 84F0209XIE).3. The cause of death tabulated is the underlying cause of death. This is defined as (a) the disease or injury which initiated the train of events leading directly to
death, or (b) the circumstances of the accident or violence which produced the fatal injury. The underlying cause is selected from the conditions listed onthe medical certificate of cause of death.
4. World Health Organization (WHO), International Statistical Classification of Diseases and Related Health Problems, Tenth Revision (ICD-10)5. National Center for Health Statistics, United States. "B" list in "Instruction Manual; Part 9; ICD-10 Cause-of-Death Lists for Tabulating Mortality Statistics".6. Other and unspecified infectious and parasitic diseases and their sequelae A00, A05, A20 to A36, A42 to A44, A48 to A49, A54 to A79, A81 to A82,
A85.0 to A85.1, A85.8, A86 to B04, B06 to B09, B25 to B49, B55 to B99.7. All other diseases (residual) D65 to E07, E15 to E34, E65 to F99, G04 to G12, G23 to G25, G31 to H93, K00 to K22, K29 to K31, K50 to K66, K71 to K72, K75 to
K76, K83 to M99, N13.0 to N13.5, N13.7 to N13.9, N14, N15.0, N15.8 to N15.9, N20 to N23, N28 to N39, N41 to N64, N80 to N98. As of 2003, also includes U04.8. Motor vehicle accidents V02 to V04, V09.0, V09.2, V12 to V14, V19.0 to V19.2, V19.4 to V19.6, V20 to V79, V80.3 to V80.5, V81.0 to V81.1, V82.0 to V82.1,
V83 to V86, V87.0 to V87.8, V88.0 to V88.8, V89.0, V89.2.9. Other land transport accidents V01, V05 to V06, V09.1, V09.3 to V09.9, V10 to V11, V15 to V18, V19.3, V19.8 to V19.9, V80.0 to V80.2, V80.6 to V80.9,
V81.2 to V81.9, V82.2 to V82.9, V87.9, V88.9, V89.1, V89.3, V89.9.Note(s): See Data quality, concepts and methodology — Explanatory notes for the tables section.Source(s): Statistics Canada, Canadian Vital Statistics, Birth and Death Databases (CANSIM table 102-0552) and Appendix II.
20 Statistics Canada – Catalogue no. 84F0209X

Mortality, Summary List of Causes – 2009
Table 1-4Deaths and mortality rate, by selected grouped causes, sex and geography — Nova Scotia1
Number of deaths Crude mortality rateper 100,000 population 2
Age-standardized mortality rateper 100,000 population 2
Bothsexes
Males Females Bothsexes
Males Females Bothsexes
Males Females
Total, all causes of death (A00-Y89) 3 , 4 , 5 8,227 4,117 4,110 874.9 901.9 849.5 566.2 705.2 456.1
Salmonella infections (A01-A02) 0 0 0 0.0 0.0 0.0 0.0 0.0 0.0Shigellosis and amoebiasis (A03, A06) 0 0 0 0.0 0.0 0.0 0.0 0.0 0.0Certain other intestinal infections (A04, A07-A09) 30 10 20 3.2 2.2 4.1 1.8 1.7 1.9Tuberculosis (A16-A19) 0 0 0 0.0 0.0 0.0 0.0 0.0 0.0Respiratory tuberculosis (A16) 0 0 0 0.0 0.0 0.0 0.0 0.0 0.0Other tuberculosis (A17-A19) 0 0 0 0.0 0.0 0.0 0.0 0.0 0.0Whooping cough (A37) 0 0 0 0.0 0.0 0.0 0.0 0.0 0.0Scarlet fever and erysipelas (A38, A46) 0 0 0 0.0 0.0 0.0 0.0 0.0 0.0Meningococcal infection (A39) 3 2 1 0.3 0.4 0.2 0.2 0.4 0.1Septicaemia (A40-A41) 66 34 32 7.0 7.4 6.6 4.7 5.9 3.8Syphilis (A50-A53) 0 0 0 0.0 0.0 0.0 0.0 0.0 0.0Acute poliomyelitis (A80) 0 0 0 0.0 0.0 0.0 0.0 0.0 0.0Arthropod-borne viral encephalitis (A83-A84, A85.2) 0 0 0 0.0 0.0 0.0 0.0 0.0 0.0Measles (B05) 0 0 0 0.0 0.0 0.0 0.0 0.0 0.0Viral hepatitis (B15-B19) 9 8 1 1.0 1.8 0.2 0.7 1.2 0.1Human immunodeficiency virus [HIV] disease (B20-B24) 5 4 1 0.5 0.9 0.2 0.5 0.9 0.1Malaria (B50-B54) 0 0 0 0.0 0.0 0.0 0.0 0.0 0.0Other and unspecified infectious and parasitic diseases and
their sequelae 6 17 9 8 1.8 2.0 1.7 1.0 1.5 0.7Malignant neoplasms (C00-C97) 2,466 1,278 1,188 262.3 280.0 245.5 177.5 213.6 151.3Malignant neoplasms of lip, oral cavity and pharynx
(C00-C14) 32 21 11 3.4 4.6 2.3 2.3 3.5 1.3Malignant neoplasm of oesophagus (C15) 78 51 27 8.3 11.2 5.6 5.5 8.2 3.1Malignant neoplasm of stomach (C16) 46 27 19 4.9 5.9 3.9 3.3 4.5 2.3Malignant neoplasms of colon, rectum and anus (C18-C21) 270 153 117 28.7 33.5 24.2 19.7 26.0 14.8Malignant neoplasm of liver and intrahepatic bile ducts (C22) 54 33 21 5.7 7.2 4.3 4.0 5.5 2.7Malignant neoplasm of pancreas (C25) 136 67 69 14.5 14.7 14.3 9.8 11.1 8.8Malignant neoplasm of larynx (C32) 11 10 1 1.2 2.2 0.2 0.9 1.7 0.1Malignant neoplasms of trachea, bronchus and lung
(C33-C34) 657 348 309 69.9 76.2 63.9 48.2 57.6 41.5Malignant melanoma of skin (C43) 42 30 12 4.5 6.6 2.5 3.3 5.0 1.9Malignant neoplasm of breast (C50) 155 1 154 16.5 0.2 31.8 11.1 0.2 20.0Malignant neoplasm of cervix uteri (C53) ... ... 10 ... ... 2.1 ... ... 1.3Malignant neoplasms of corpus uteri and uterus, part
unspecified (C54-C55) ... ... 39 ... ... 8.1 ... ... 5.1Malignant neoplasm of ovary (C56) ... ... 43 ... ... 8.9 ... ... 5.2Malignant neoplasm of prostate (C61) ... 124 ... ... 27.2 ... ... 21.0 ...Malignant neoplasms of kidney and renal pelvis (C64-C65) 46 27 19 4.9 5.9 3.9 3.0 4.2 2.0Malignant neoplasm of bladder (C67) 56 36 20 6.0 7.9 4.1 3.8 6.0 2.4Malignant neoplasms of meninges, brain and other parts of
central nervous system (C70-C72) 72 43 29 7.7 9.4 6.0 5.6 7.4 4.2Malignant neoplasms of lymphoid, haematopoietic and
related tissue (C81-C96) 218 132 86 23.2 28.9 17.8 15.8 22.4 10.4Hodgkin’s disease (C81) 7 4 3 0.7 0.9 0.6 0.5 0.6 0.4Non-Hodgkin’s lymphoma (C82-C85) 96 56 40 10.2 12.3 8.3 7.2 9.7 4.9Leukaemia (C91-C95) 77 43 34 8.2 9.4 7.0 5.4 7.2 4.0Multiple myeloma and immunoproliferative neoplasms (C88,
C90) 37 29 8 3.9 6.4 1.7 2.7 4.8 1.0Other and unspecified malignant neoplasms of lymphoid,
haematopoietic and related tissue (C96) 1 0 1 0.1 0.0 0.2 0.1 0.0 0.1All other and unspecified malignant neoplasms (C17,
C23-C24, C26-C31, C37-C41, C44-C49, C51-C52,C57-C60, C62-C63, C66, C68-C69, C73-C80, C97) 377 175 202 40.1 38.3 41.8 26.6 29.4 24.1
In situ neoplasms, benign neoplasms and neoplasms ofuncertain or unknown behaviour (D00-D48) 38 16 22 4.0 3.5 4.5 2.6 2.7 2.5
Anaemias (D50-D64) 10 3 7 1.1 0.7 1.4 0.6 0.5 0.7Diabetes mellitus (E10-E14) 220 117 103 23.4 25.6 21.3 15.5 19.7 12.4Nutritional deficiencies (E40-E64) 3 1 2 0.3 0.2 0.4 0.1 0.2 0.1Malnutrition (E40-E46) 2 1 1 0.2 0.2 0.2 0.1 0.2 0.1Other nutritional deficiencies (E50-E64) 1 0 1 0.1 0.0 0.2 0.0 0.0 0.1Meningitis (G00, G03) 6 4 2 0.6 0.9 0.4 0.7 0.9 0.5Parkinson’s disease (G20-G21) 57 32 25 6.1 7.0 5.2 3.9 5.4 2.7Alzheimer’s disease (G30) 275 77 198 29.2 16.9 40.9 16.0 13.1 17.3Major cardiovascular diseases (I00-I78) 2,376 1,171 1,205 252.7 256.5 249.1 153.3 196.4 119.4Diseases of heart (I00-I09, I11, I13, I20-I51) 1,676 887 789 178.2 194.3 163.1 108.7 148.0 78.5Acute rheumatic fever and chronic rheumatic heart diseases
(I00-I09) 15 5 10 1.6 1.1 2.1 0.9 0.9 0.9Hypertensive heart disease (I11) 63 22 41 6.7 4.8 8.5 4.1 3.7 4.2Hypertensive heart and renal disease (I13) 8 2 6 0.9 0.4 1.2 0.4 0.4 0.5Ischaemic heart diseases (I20-I25) 1,172 672 500 124.6 147.2 103.3 76.8 111.5 50.4Acute myocardial infarction (I21-I22) 459 257 202 48.8 56.3 41.8 29.9 42.7 20.0Other acute ischaemic heart diseases (I24) 22 13 9 2.3 2.8 1.9 1.4 2.2 1.1Other forms of chronic ischaemic heart disease (I20, I25) 691 402 289 73.5 88.1 59.7 45.5 66.6 29.3
See notes at the end of the table.
Statistics Canada – Catalogue no. 84F0209X 21

Mortality, Summary List of Causes – 2009
Table 1-4 – continued
Deaths and mortality rate, by selected grouped causes, sex and geography — Nova Scotia1
Number of deaths Crude mortality rateper 100,000 population 2
Age-standardized mortality rateper 100,000 population 2
Bothsexes
Males Females Bothsexes
Males Females Bothsexes
Males Females
Atherosclerotic cardiovascular disease, so described (I25.0) 36 24 12 3.8 5.3 2.5 2.5 3.9 1.4All other forms of chronic ischaemic heart disease (I20,
I25.1-I25.9) 655 378 277 69.7 82.8 57.3 43.1 62.7 27.9Other heart diseases (I26-I51) 418 186 232 44.5 40.7 48.0 26.4 31.6 22.5Acute and subacute endocarditis (I33) 2 1 1 0.2 0.2 0.2 0.2 0.2 0.1Diseases of pericardium and acute myocarditis (I30-I31, I40) 1 1 0 0.1 0.2 0.0 0.1 0.2 0.0Heart failure (I50) 150 67 83 16.0 14.7 17.2 9.1 11.3 7.8All other forms of heart disease (I26-I28, I34-I38, I42-I49,
I51) 265 117 148 28.2 25.6 30.6 17.1 19.8 14.6Essential hypertension and hypertensive renal disease (I10,
I12, I15) 82 26 56 8.7 5.7 11.6 4.7 4.3 4.9Cerebrovascular diseases (I60-I69) 507 204 303 53.9 44.7 62.6 32.5 34.7 30.4Atherosclerosis (I70) 22 4 18 2.3 0.9 3.7 1.2 0.7 1.4Other diseases of circulatory system (I71-I78) 89 50 39 9.5 11.0 8.1 6.3 8.7 4.3Aortic aneurysm and dissection (I71) 61 37 24 6.5 8.1 5.0 4.3 6.5 2.6Other diseases of arteries, arterioles and capillaries (I72-I78) 28 13 15 3.0 2.8 3.1 1.9 2.2 1.7Other disorders of circulatory system (I80-I99) 18 8 10 1.9 1.8 2.1 1.5 1.4 1.5Influenza and pneumonia (J09-J18) 183 87 96 19.5 19.1 19.8 11.5 14.9 9.6Influenza (J09-J11) 9 4 5 1.0 0.9 1.0 0.8 0.7 0.8Pneumonia (J12-J18) 174 83 91 18.5 18.2 18.8 10.8 14.1 8.8Other acute lower respiratory infections (J20-J22) 3 1 2 0.3 0.2 0.4 0.2 0.2 0.4Acute bronchitis and bronchiolitis (J20-J21) 1 0 1 0.1 0.0 0.2 0.1 0.0 0.3Unspecified acute lower respiratory infection (J22) 2 1 1 0.2 0.2 0.2 0.1 0.2 0.1Chronic lower respiratory diseases (J40-J47) 454 241 213 48.3 52.8 44.0 30.5 41.0 23.9Bronchitis, chronic and unspecified (J40-J42) 8 2 6 0.9 0.4 1.2 0.4 0.3 0.4Emphysema (J43) 26 20 6 2.8 4.4 1.2 1.9 3.4 0.8Asthma (J45-J46) 2 1 1 0.2 0.2 0.2 0.1 0.1 0.1Other chronic lower respiratory diseases (J44, J47) 418 218 200 44.5 47.8 41.3 28.1 37.1 22.6Pneumoconioses and chemical effects (J60-J66, J68) 3 3 0 0.3 0.7 0.0 0.2 0.5 0.0Pneumonitis due to solids and liquids (J69) 22 15 7 2.3 3.3 1.4 1.5 2.6 0.7Other diseases of respiratory system (J00-J06, J30-J39,
J67, J70-J98) 83 45 38 8.8 9.9 7.9 5.9 7.9 4.3Peptic ulcer (K25-K28) 14 5 9 1.5 1.1 1.9 1.0 0.9 1.0Diseases of appendix (K35-K38) 4 3 1 0.4 0.7 0.2 0.3 0.6 0.1Hernia (K40-K46) 12 8 4 1.3 1.8 0.8 0.8 1.3 0.4Chronic liver disease and cirrhosis (K70, K73-K74) 75 60 15 8.0 13.1 3.1 5.7 9.7 2.1Alcoholic liver disease (K70) 44 35 9 4.7 7.7 1.9 3.3 5.5 1.2Other chronic liver disease and cirrhosis (K73-K74) 31 25 6 3.3 5.5 1.2 2.4 4.2 0.9Cholelithiasis and other disorders of gallbladder (K80-K82) 16 11 5 1.7 2.4 1.0 1.1 1.8 0.6Nephritis, nephrotic syndrome and nephrosis (N00-N07,
N17-N19, N25-N27) 142 70 72 15.1 15.3 14.9 8.7 11.8 7.1Acute and rapidly progressive nephritic and nephrotic
syndrome (N00-N01, N04) 0 0 0 0.0 0.0 0.0 0.0 0.0 0.0Chronic glomerulonephritis, nephritis and nephropathy
not specified as acute or chronic, and renal sclerosisunspecified (N02-N03, N05-N07, N26) 3 1 2 0.3 0.2 0.4 0.1 0.2 0.1
Renal failure (N17-N19) 139 69 70 14.8 15.1 14.5 8.5 11.6 6.9Other disorders of kidney (N25, N27) 0 0 0 0.0 0.0 0.0 0.0 0.0 0.0Infections of kidney (N10-N12, N13.6, N15.1) 1 1 0 0.1 0.2 0.0 0.1 0.1 0.0Hyperplasia of prostate (N40) ... 2 ... ... 0.4 ... ... 0.4 ...Inflammatory diseases of female pelvic organs (N70-N76) ... ... 0 ... ... 0.0 ... ... 0.0Pregnancy, childbirth and the puerperium (O00-O99) ... ... 1 ... ... 0.2 ... ... 0.3Pregnancy with abortive outcome (O00-O07) ... ... 0 ... ... 0.0 ... ... 0.0Other complications of pregnancy, childbirth and the
puerperium (O10-O99) ... ... 1 ... ... 0.2 ... ... 0.3Certain conditions originating in the perinatal period
(P00-P96) 19 11 8 2.0 2.4 1.7 3.0 3.4 2.6Congenital malformations, deformations and chromosomal
abnormalities (Q00-Q99) 17 10 7 1.8 2.2 1.4 2.2 2.5 1.9Symptoms, signs and abnormal clinical and laboratory
findings, not elsewhere classified (R00-R99) 43 22 21 4.6 4.8 4.3 3.3 4.2 2.7All other diseases (residual) 7 929 375 554 98.8 82.2 114.5 59.7 63.7 54.2Accidents (unintentional injuries) (V01-X59, Y85-Y86) 436 247 189 46.4 54.1 39.1 33.1 46.4 21.0Transport accidents (V01-V99, Y85) 87 64 23 9.3 14.0 4.8 8.0 12.4 3.9Motor vehicle accidents 8 78 58 20 8.3 12.7 4.1 7.4 11.5 3.5Other land transport accidents 9 0 0 0 0.0 0.0 0.0 0.0 0.0 0.0Water, air and space, and other and unspecified transport
accidents and their sequelae (V90-V99, Y85) 9 6 3 1.0 1.3 0.6 0.6 0.9 0.4Nontransport accidents (W00-X59, Y86) 349 183 166 37.1 40.1 34.3 25.1 34.0 17.1Falls (W00-W19) 221 94 127 23.5 20.6 26.2 13.6 16.2 11.6Accidental discharge of firearms (W32-W34) 0 0 0 0.0 0.0 0.0 0.0 0.0 0.0Accidental drowning and submersion (W65-W74) 9 8 1 1.0 1.8 0.2 0.7 1.3 0.2Accidental exposure to smoke, fire and flames (X00-X09) 12 8 4 1.3 1.8 0.8 0.9 1.3 0.5Accidental poisoning and exposure to noxious substances
(X40-X49) 66 50 16 7.0 11.0 3.3 6.9 11.3 2.8
See notes at the end of the table.
22 Statistics Canada – Catalogue no. 84F0209X
Mortality, Summary List of Causes – 2009
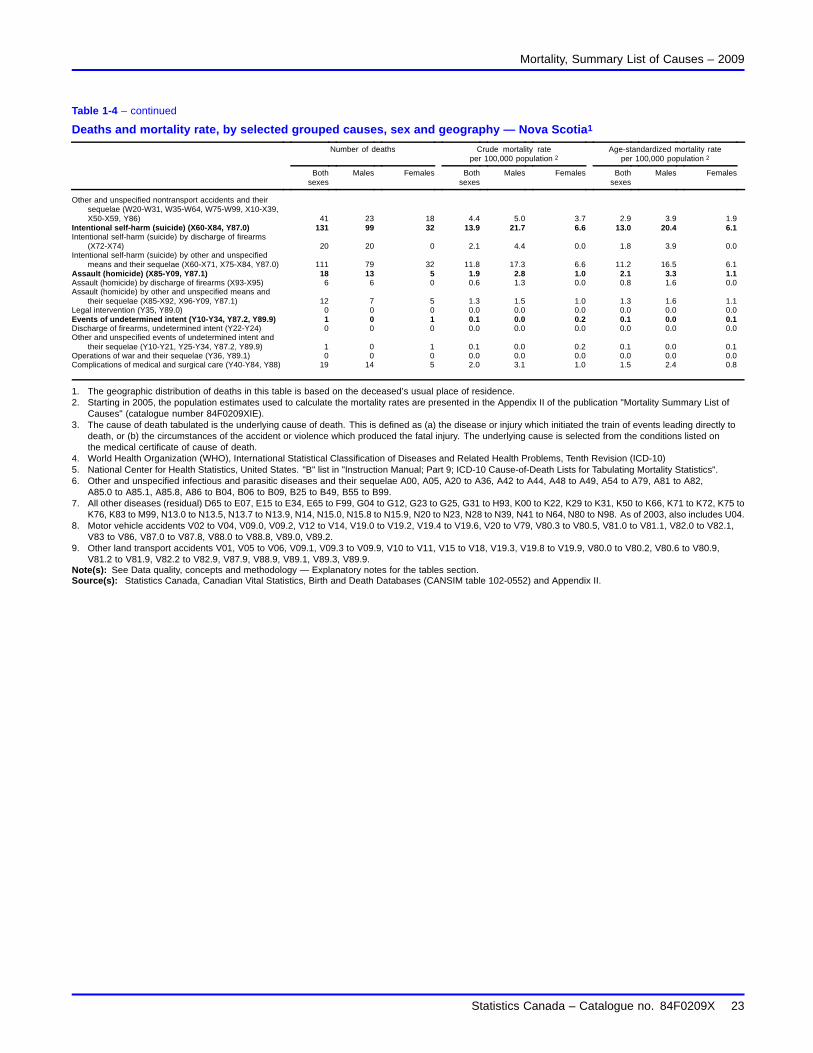
Table 1-4 – continued
Deaths and mortality rate, by selected grouped causes, sex and geography — Nova Scotia1
Number of deaths Crude mortality rateper 100,000 population 2
Age-standardized mortality rateper 100,000 population 2
Bothsexes
Males Females Bothsexes
Males Females Bothsexes
Males Females
Other and unspecified nontransport accidents and theirsequelae (W20-W31, W35-W64, W75-W99, X10-X39,X50-X59, Y86) 41 23 18 4.4 5.0 3.7 2.9 3.9 1.9
Intentional self-harm (suicide) (X60-X84, Y87.0) 131 99 32 13.9 21.7 6.6 13.0 20.4 6.1Intentional self-harm (suicide) by discharge of firearms
(X72-X74) 20 20 0 2.1 4.4 0.0 1.8 3.9 0.0Intentional self-harm (suicide) by other and unspecified
means and their sequelae (X60-X71, X75-X84, Y87.0) 111 79 32 11.8 17.3 6.6 11.2 16.5 6.1Assault (homicide) (X85-Y09, Y87.1) 18 13 5 1.9 2.8 1.0 2.1 3.3 1.1Assault (homicide) by discharge of firearms (X93-X95) 6 6 0 0.6 1.3 0.0 0.8 1.6 0.0Assault (homicide) by other and unspecified means and
their sequelae (X85-X92, X96-Y09, Y87.1) 12 7 5 1.3 1.5 1.0 1.3 1.6 1.1Legal intervention (Y35, Y89.0) 0 0 0 0.0 0.0 0.0 0.0 0.0 0.0Events of undetermined intent (Y10-Y34, Y87.2, Y89.9) 1 0 1 0.1 0.0 0.2 0.1 0.0 0.1Discharge of firearms, undetermined intent (Y22-Y24) 0 0 0 0.0 0.0 0.0 0.0 0.0 0.0Other and unspecified events of undetermined intent and
their sequelae (Y10-Y21, Y25-Y34, Y87.2, Y89.9) 1 0 1 0.1 0.0 0.2 0.1 0.0 0.1Operations of war and their sequelae (Y36, Y89.1) 0 0 0 0.0 0.0 0.0 0.0 0.0 0.0Complications of medical and surgical care (Y40-Y84, Y88) 19 14 5 2.0 3.1 1.0 1.5 2.4 0.8
1. The geographic distribution of deaths in this table is based on the deceased’s usual place of residence.2. Starting in 2005, the population estimates used to calculate the mortality rates are presented in the Appendix II of the publication "Mortality Summary List of
Causes" (catalogue number 84F0209XIE).3. The cause of death tabulated is the underlying cause of death. This is defined as (a) the disease or injury which initiated the train of events leading directly to
death, or (b) the circumstances of the accident or violence which produced the fatal injury. The underlying cause is selected from the conditions listed onthe medical certificate of cause of death.
4. World Health Organization (WHO), International Statistical Classification of Diseases and Related Health Problems, Tenth Revision (ICD-10)5. National Center for Health Statistics, United States. "B" list in "Instruction Manual; Part 9; ICD-10 Cause-of-Death Lists for Tabulating Mortality Statistics".6. Other and unspecified infectious and parasitic diseases and their sequelae A00, A05, A20 to A36, A42 to A44, A48 to A49, A54 to A79, A81 to A82,
A85.0 to A85.1, A85.8, A86 to B04, B06 to B09, B25 to B49, B55 to B99.7. All other diseases (residual) D65 to E07, E15 to E34, E65 to F99, G04 to G12, G23 to G25, G31 to H93, K00 to K22, K29 to K31, K50 to K66, K71 to K72, K75 to
K76, K83 to M99, N13.0 to N13.5, N13.7 to N13.9, N14, N15.0, N15.8 to N15.9, N20 to N23, N28 to N39, N41 to N64, N80 to N98. As of 2003, also includes U04.8. Motor vehicle accidents V02 to V04, V09.0, V09.2, V12 to V14, V19.0 to V19.2, V19.4 to V19.6, V20 to V79, V80.3 to V80.5, V81.0 to V81.1, V82.0 to V82.1,
V83 to V86, V87.0 to V87.8, V88.0 to V88.8, V89.0, V89.2.9. Other land transport accidents V01, V05 to V06, V09.1, V09.3 to V09.9, V10 to V11, V15 to V18, V19.3, V19.8 to V19.9, V80.0 to V80.2, V80.6 to V80.9,
V81.2 to V81.9, V82.2 to V82.9, V87.9, V88.9, V89.1, V89.3, V89.9.Note(s): See Data quality, concepts and methodology — Explanatory notes for the tables section.Source(s): Statistics Canada, Canadian Vital Statistics, Birth and Death Databases (CANSIM table 102-0552) and Appendix II.
Statistics Canada – Catalogue no. 84F0209X 23

Mortality, Summary List of Causes – 2009
Table 1-5Deaths and mortality rate, by selected grouped causes, sex and geography — New Brunswick1
Number of deaths Crude mortality rateper 100,000 population 2
Age-standardized mortality rateper 100,000 population 2
Bothsexes
Males Females Bothsexes
Males Females Bothsexes
Males Females
Total, all causes of death (A00-Y89) 3 , 4 , 5 6,366 3,188 3,178 848.8 865.9 832.3 561.4 695.8 453.8
Salmonella infections (A01-A02) 0 0 0 0.0 0.0 0.0 0.0 0.0 0.0Shigellosis and amoebiasis (A03, A06) 0 0 0 0.0 0.0 0.0 0.0 0.0 0.0Certain other intestinal infections (A04, A07-A09) 37 12 25 4.9 3.3 6.5 2.9 2.8 3.0Tuberculosis (A16-A19) 1 1 0 0.1 0.3 0.0 0.1 0.2 0.0Respiratory tuberculosis (A16) 1 1 0 0.1 0.3 0.0 0.1 0.2 0.0Other tuberculosis (A17-A19) 0 0 0 0.0 0.0 0.0 0.0 0.0 0.0Whooping cough (A37) 0 0 0 0.0 0.0 0.0 0.0 0.0 0.0Scarlet fever and erysipelas (A38, A46) 0 0 0 0.0 0.0 0.0 0.0 0.0 0.0Meningococcal infection (A39) 0 0 0 0.0 0.0 0.0 0.0 0.0 0.0Septicaemia (A40-A41) 55 33 22 7.3 9.0 5.8 5.2 7.4 3.5Syphilis (A50-A53) 0 0 0 0.0 0.0 0.0 0.0 0.0 0.0Acute poliomyelitis (A80) 0 0 0 0.0 0.0 0.0 0.0 0.0 0.0Arthropod-borne viral encephalitis (A83-A84, A85.2) 0 0 0 0.0 0.0 0.0 0.0 0.0 0.0Measles (B05) 0 0 0 0.0 0.0 0.0 0.0 0.0 0.0Viral hepatitis (B15-B19) 2 1 1 0.3 0.3 0.3 0.2 0.2 0.2Human immunodeficiency virus [HIV] disease (B20-B24) 1 1 0 0.1 0.3 0.0 0.1 0.2 0.0Malaria (B50-B54) 0 0 0 0.0 0.0 0.0 0.0 0.0 0.0Other and unspecified infectious and parasitic diseases and
their sequelae 6 13 4 9 1.7 1.1 2.4 1.3 0.9 1.6Malignant neoplasms (C00-C97) 1,927 1,006 921 256.9 273.2 241.2 177.0 213.7 151.3Malignant neoplasms of lip, oral cavity and pharynx
(C00-C14) 26 19 7 3.5 5.2 1.8 2.4 3.9 1.2Malignant neoplasm of oesophagus (C15) 44 33 11 5.9 9.0 2.9 3.9 6.8 1.6Malignant neoplasm of stomach (C16) 53 30 23 7.1 8.1 6.0 4.6 6.3 3.6Malignant neoplasms of colon, rectum and anus (C18-C21) 167 82 85 22.3 22.3 22.3 14.6 17.1 12.8Malignant neoplasm of liver and intrahepatic bile ducts (C22) 39 22 17 5.2 6.0 4.5 3.8 4.7 3.1Malignant neoplasm of pancreas (C25) 113 55 58 15.1 14.9 15.2 10.1 11.3 8.9Malignant neoplasm of larynx (C32) 8 7 1 1.1 1.9 0.3 0.8 1.5 0.2Malignant neoplasms of trachea, bronchus and lung
(C33-C34) 580 338 242 77.3 91.8 63.4 54.8 71.4 41.8Malignant melanoma of skin (C43) 26 16 10 3.5 4.3 2.6 2.4 3.3 1.5Malignant neoplasm of breast (C50) 133 1 132 17.7 0.3 34.6 12.1 0.2 22.0Malignant neoplasm of cervix uteri (C53) ... ... 12 ... ... 3.1 ... ... 2.1Malignant neoplasms of corpus uteri and uterus, part
unspecified (C54-C55) ... ... 11 ... ... 2.9 ... ... 1.9Malignant neoplasm of ovary (C56) ... ... 47 ... ... 12.3 ... ... 7.9Malignant neoplasm of prostate (C61) ... 92 ... ... 25.0 ... ... 19.9 ...Malignant neoplasms of kidney and renal pelvis (C64-C65) 44 30 14 5.9 8.1 3.7 3.9 6.0 2.4Malignant neoplasm of bladder (C67) 40 29 11 5.3 7.9 2.9 3.5 6.1 1.7Malignant neoplasms of meninges, brain and other parts of
central nervous system (C70-C72) 47 26 21 6.3 7.1 5.5 4.8 5.5 4.2Malignant neoplasms of lymphoid, haematopoietic and
related tissue (C81-C96) 166 87 79 22.1 23.6 20.7 15.6 19.2 12.7Hodgkin’s disease (C81) 3 2 1 0.4 0.5 0.3 0.3 0.5 0.2Non-Hodgkin’s lymphoma (C82-C85) 66 41 25 8.8 11.1 6.5 6.2 8.8 4.2Leukaemia (C91-C95) 62 26 36 8.3 7.1 9.4 5.9 6.0 5.8Multiple myeloma and immunoproliferative neoplasms (C88,
C90) 34 17 17 4.5 4.6 4.5 3.1 3.6 2.5Other and unspecified malignant neoplasms of lymphoid,
haematopoietic and related tissue (C96) 1 1 0 0.1 0.3 0.0 0.1 0.2 0.0All other and unspecified malignant neoplasms (C17,
C23-C24, C26-C31, C37-C41, C44-C49, C51-C52,C57-C60, C62-C63, C66, C68-C69, C73-C80, C97) 279 139 140 37.2 37.8 36.7 25.4 30.5 21.7
In situ neoplasms, benign neoplasms and neoplasms ofuncertain or unknown behaviour (D00-D48) 37 12 25 4.9 3.3 6.5 3.4 2.5 4.3
Anaemias (D50-D64) 18 5 13 2.4 1.4 3.4 1.4 1.3 1.5Diabetes mellitus (E10-E14) 191 96 95 25.5 26.1 24.9 16.5 20.5 13.1Nutritional deficiencies (E40-E64) 5 3 2 0.7 0.8 0.5 0.4 0.6 0.3Malnutrition (E40-E46) 3 2 1 0.4 0.5 0.3 0.2 0.4 0.2Other nutritional deficiencies (E50-E64) 2 1 1 0.3 0.3 0.3 0.1 0.2 0.1Meningitis (G00, G03) 3 1 2 0.4 0.3 0.5 0.6 0.4 0.8Parkinson’s disease (G20-G21) 43 27 16 5.7 7.3 4.2 3.6 5.8 2.1Alzheimer’s disease (G30) 163 53 110 21.7 14.4 28.8 12.1 11.3 12.1Major cardiovascular diseases (I00-I78) 1,790 896 894 238.7 243.4 234.1 148.1 190.0 112.0Diseases of heart (I00-I09, I11, I13, I20-I51) 1,303 690 613 173.7 187.4 160.5 108.5 145.5 76.8Acute rheumatic fever and chronic rheumatic heart diseases
(I00-I09) 6 1 5 0.8 0.3 1.3 0.6 0.3 0.7Hypertensive heart disease (I11) 11 3 8 1.5 0.8 2.1 0.8 0.7 1.0Hypertensive heart and renal disease (I13) 4 0 4 0.5 0.0 1.0 0.3 0.0 0.4Ischaemic heart diseases (I20-I25) 815 458 357 108.7 124.4 93.5 68.2 95.1 45.0Acute myocardial infarction (I21-I22) 398 252 146 53.1 68.4 38.2 34.6 52.0 19.9Other acute ischaemic heart diseases (I24) 21 10 11 2.8 2.7 2.9 1.6 2.1 1.2Other forms of chronic ischaemic heart disease (I20, I25) 396 196 200 52.8 53.2 52.4 32.0 41.0 23.9
See notes at the end of the table.
24 Statistics Canada – Catalogue no. 84F0209X

Mortality, Summary List of Causes – 2009
Table 1-5 – continued
Deaths and mortality rate, by selected grouped causes, sex and geography — New Brunswick1
Number of deaths Crude mortality rateper 100,000 population 2
Age-standardized mortality rateper 100,000 population 2
Bothsexes
Males Females Bothsexes
Males Females Bothsexes
Males Females
Atherosclerotic cardiovascular disease, so described (I25.0) 11 8 3 1.5 2.2 0.8 0.9 1.5 0.4All other forms of chronic ischaemic heart disease (I20,
I25.1-I25.9) 385 188 197 51.3 51.1 51.6 31.1 39.5 23.5Other heart diseases (I26-I51) 467 228 239 62.3 61.9 62.6 38.6 49.3 29.8Acute and subacute endocarditis (I33) 3 3 0 0.4 0.8 0.0 0.4 0.8 0.0Diseases of pericardium and acute myocarditis (I30-I31, I40) 8 5 3 1.1 1.4 0.8 0.8 1.1 0.4Heart failure (I50) 185 77 108 24.7 20.9 28.3 14.0 16.5 11.9All other forms of heart disease (I26-I28, I34-I38, I42-I49,
I51) 271 143 128 36.1 38.8 33.5 23.5 31.0 17.4Essential hypertension and hypertensive renal disease (I10,
I12, I15) 37 9 28 4.9 2.4 7.3 2.8 1.8 3.2Cerebrovascular diseases (I60-I69) 355 143 212 47.3 38.8 55.5 28.9 31.5 26.8Atherosclerosis (I70) 9 4 5 1.2 1.1 1.3 0.7 0.8 0.6Other diseases of circulatory system (I71-I78) 86 50 36 11.5 13.6 9.4 7.3 10.5 4.6Aortic aneurysm and dissection (I71) 57 33 24 7.6 9.0 6.3 5.0 7.1 3.3Other diseases of arteries, arterioles and capillaries (I72-I78) 29 17 12 3.9 4.6 3.1 2.2 3.4 1.3Other disorders of circulatory system (I80-I99) 8 4 4 1.1 1.1 1.0 0.7 0.9 0.6Influenza and pneumonia (J09-J18) 113 52 61 15.1 14.1 16.0 9.2 11.4 7.7Influenza (J09-J11) 15 8 7 2.0 2.2 1.8 1.3 1.8 0.9Pneumonia (J12-J18) 98 44 54 13.1 12.0 14.1 7.9 9.5 6.8Other acute lower respiratory infections (J20-J22) 0 0 0 0.0 0.0 0.0 0.0 0.0 0.0Acute bronchitis and bronchiolitis (J20-J21) 0 0 0 0.0 0.0 0.0 0.0 0.0 0.0Unspecified acute lower respiratory infection (J22) 0 0 0 0.0 0.0 0.0 0.0 0.0 0.0Chronic lower respiratory diseases (J40-J47) 345 189 156 46.0 51.3 40.9 29.7 41.4 22.5Bronchitis, chronic and unspecified (J40-J42) 3 3 0 0.4 0.8 0.0 0.2 0.7 0.0Emphysema (J43) 11 7 4 1.5 1.9 1.0 0.9 1.4 0.6Asthma (J45-J46) 8 3 5 1.1 0.8 1.3 0.5 0.7 0.6Other chronic lower respiratory diseases (J44, J47) 323 176 147 43.1 47.8 38.5 28.0 38.5 21.4Pneumoconioses and chemical effects (J60-J66, J68) 0 0 0 0.0 0.0 0.0 0.0 0.0 0.0Pneumonitis due to solids and liquids (J69) 19 10 9 2.5 2.7 2.4 1.5 2.1 1.0Other diseases of respiratory system (J00-J06, J30-J39,
J67, J70-J98) 83 37 46 11.1 10.0 12.0 7.2 8.1 6.7Peptic ulcer (K25-K28) 10 6 4 1.3 1.6 1.0 0.9 1.2 0.7Diseases of appendix (K35-K38) 1 1 0 0.1 0.3 0.0 0.1 0.2 0.0Hernia (K40-K46) 9 6 3 1.2 1.6 0.8 0.8 1.3 0.3Chronic liver disease and cirrhosis (K70, K73-K74) 51 35 16 6.8 9.5 4.2 4.8 6.8 2.7Alcoholic liver disease (K70) 20 17 3 2.7 4.6 0.8 2.0 3.4 0.7Other chronic liver disease and cirrhosis (K73-K74) 31 18 13 4.1 4.9 3.4 2.8 3.4 2.0Cholelithiasis and other disorders of gallbladder (K80-K82) 9 4 5 1.2 1.1 1.3 0.8 0.9 0.9Nephritis, nephrotic syndrome and nephrosis (N00-N07,
N17-N19, N25-N27) 102 49 53 13.6 13.3 13.9 8.4 10.4 7.2Acute and rapidly progressive nephritic and nephrotic
syndrome (N00-N01, N04) 0 0 0 0.0 0.0 0.0 0.0 0.0 0.0Chronic glomerulonephritis, nephritis and nephropathy
not specified as acute or chronic, and renal sclerosisunspecified (N02-N03, N05-N07, N26) 2 0 2 0.3 0.0 0.5 0.2 0.0 0.3
Renal failure (N17-N19) 100 49 51 13.3 13.3 13.4 8.3 10.4 6.9Other disorders of kidney (N25, N27) 0 0 0 0.0 0.0 0.0 0.0 0.0 0.0Infections of kidney (N10-N12, N13.6, N15.1) 1 1 0 0.1 0.3 0.0 0.1 0.2 0.0Hyperplasia of prostate (N40) ... 1 ... ... 0.3 ... ... 0.2 ...Inflammatory diseases of female pelvic organs (N70-N76) ... ... 2 ... ... 0.5 ... ... 0.4Pregnancy, childbirth and the puerperium (O00-O99) ... ... 0 ... ... 0.0 ... ... 0.0Pregnancy with abortive outcome (O00-O07) ... ... 0 ... ... 0.0 ... ... 0.0Other complications of pregnancy, childbirth and the
puerperium (O10-O99) ... ... 0 ... ... 0.0 ... ... 0.0Certain conditions originating in the perinatal period
(P00-P96) 16 10 6 2.1 2.7 1.6 3.1 3.9 2.3Congenital malformations, deformations and chromosomal
abnormalities (Q00-Q99) 30 15 15 4.0 4.1 3.9 4.6 4.6 4.6Symptoms, signs and abnormal clinical and laboratory
findings, not elsewhere classified (R00-R99) 206 77 129 27.5 20.9 33.8 17.0 17.6 15.5All other diseases (residual) 7 688 287 401 91.7 78.0 105.0 55.8 61.6 52.8Accidents (unintentional injuries) (V01-X59, Y85-Y86) 276 165 111 36.8 44.8 29.1 30.1 42.4 18.0Transport accidents (V01-V99, Y85) 92 69 23 12.3 18.7 6.0 12.2 18.6 5.9Motor vehicle accidents 8 83 62 21 11.1 16.8 5.5 11.1 17.0 5.3Other land transport accidents 9 6 5 1 0.8 1.4 0.3 0.7 1.2 0.3Water, air and space, and other and unspecified transport
accidents and their sequelae (V90-V99, Y85) 3 2 1 0.4 0.5 0.3 0.4 0.4 0.3Nontransport accidents (W00-X59, Y86) 184 96 88 24.5 26.1 23.0 17.9 23.8 12.0Falls (W00-W19) 82 33 49 10.9 9.0 12.8 6.4 7.2 5.8Accidental discharge of firearms (W32-W34) 0 0 0 0.0 0.0 0.0 0.0 0.0 0.0Accidental drowning and submersion (W65-W74) 5 3 2 0.7 0.8 0.5 0.6 0.8 0.3Accidental exposure to smoke, fire and flames (X00-X09) 6 4 2 0.8 1.1 0.5 0.7 0.9 0.5Accidental poisoning and exposure to noxious substances
(X40-X49) 36 29 7 4.8 7.9 1.8 4.9 8.4 1.4
See notes at the end of the table.
Statistics Canada – Catalogue no. 84F0209X 25

Mortality, Summary List of Causes – 2009
Table 1-5 – continued
Deaths and mortality rate, by selected grouped causes, sex and geography — New Brunswick1
Number of deaths Crude mortality rateper 100,000 population 2
Age-standardized mortality rateper 100,000 population 2
Bothsexes
Males Females Bothsexes
Males Females Bothsexes
Males Females
Other and unspecified nontransport accidents and theirsequelae (W20-W31, W35-W64, W75-W99, X10-X39,X50-X59, Y86) 55 27 28 7.3 7.3 7.3 5.4 6.5 4.1
Intentional self-harm (suicide) (X60-X84, Y87.0) 85 71 14 11.3 19.3 3.7 10.4 18.2 2.8Intentional self-harm (suicide) by discharge of firearms
(X72-X74) 19 18 1 2.5 4.9 0.3 2.1 4.2 0.2Intentional self-harm (suicide) by other and unspecified
means and their sequelae (X60-X71, X75-X84, Y87.0) 66 53 13 8.8 14.4 3.4 8.3 14.0 2.7Assault (homicide) (X85-Y09, Y87.1) 9 8 1 1.2 2.2 0.3 1.3 2.5 0.2Assault (homicide) by discharge of firearms (X93-X95) 1 1 0 0.1 0.3 0.0 0.2 0.4 0.0Assault (homicide) by other and unspecified means and
their sequelae (X85-X92, X96-Y09, Y87.1) 8 7 1 1.1 1.9 0.3 1.1 2.1 0.2Legal intervention (Y35, Y89.0) 1 1 0 0.1 0.3 0.0 0.2 0.4 0.0Events of undetermined intent (Y10-Y34, Y87.2, Y89.9) 1 1 0 0.1 0.3 0.0 0.2 0.3 0.0Discharge of firearms, undetermined intent (Y22-Y24) 0 0 0 0.0 0.0 0.0 0.0 0.0 0.0Other and unspecified events of undetermined intent and
their sequelae (Y10-Y21, Y25-Y34, Y87.2, Y89.9) 1 1 0 0.1 0.3 0.0 0.2 0.3 0.0Operations of war and their sequelae (Y36, Y89.1) 0 0 0 0.0 0.0 0.0 0.0 0.0 0.0Complications of medical and surgical care (Y40-Y84, Y88) 14 7 7 1.9 1.9 1.8 1.2 1.4 1.0
1. The geographic distribution of deaths in this table is based on the deceased’s usual place of residence.2. Starting in 2005, the population estimates used to calculate the mortality rates are presented in the Appendix II of the publication "Mortality Summary List of
Causes" (catalogue number 84F0209XIE).3. The cause of death tabulated is the underlying cause of death. This is defined as (a) the disease or injury which initiated the train of events leading directly to
death, or (b) the circumstances of the accident or violence which produced the fatal injury. The underlying cause is selected from the conditions listed onthe medical certificate of cause of death.
4. The population estimates used for the 2003 mortality rate calculations are July 1, 2003 updated postcensal estimates, adjusted for net census undercoverageand include non-permanent residents. These population estimates appear in the publication "Annual Demographic Statistics, 2004" (cataloguenumber 91-213-XIB/XPB).
5. National Center for Health Statistics, United States. "B" list in "Instruction Manual; Part 9; ICD-10 Cause-of-Death Lists for Tabulating Mortality Statistics".6. Other and unspecified infectious and parasitic diseases and their sequelae A00, A05, A20 to A36, A42 to A44, A48 to A49, A54 to A79, A81 to A82,
A85.0 to A85.1, A85.8, A86 to B04, B06 to B09, B25 to B49, B55 to B99.7. All other diseases (residual) D65 to E07, E15 to E34, E65 to F99, G04 to G12, G23 to G25, G31 to H93, K00 to K22, K29 to K31, K50 to K66, K71 to K72, K75 to
K76, K83 to M99, N13.0 to N13.5, N13.7 to N13.9, N14, N15.0, N15.8 to N15.9, N20 to N23, N28 to N39, N41 to N64, N80 to N98. As of 2003, also includes U04.8. Motor vehicle accidents V02 to V04, V09.0, V09.2, V12 to V14, V19.0 to V19.2, V19.4 to V19.6, V20 to V79, V80.3 to V80.5, V81.0 to V81.1, V82.0 to V82.1,
V83 to V86, V87.0 to V87.8, V88.0 to V88.8, V89.0, V89.2.9. Other land transport accidents V01, V05 to V06, V09.1, V09.3 to V09.9, V10 to V11, V15 to V18, V19.3, V19.8 to V19.9, V80.0 to V80.2, V80.6 to V80.9,
V81.2 to V81.9, V82.2 to V82.9, V87.9, V88.9, V89.1, V89.3, V89.9.Note(s): See Data quality, concepts and methodology — Explanatory notes for the tables section.Source(s): Statistics Canada, Canadian Vital Statistics, Birth and Death Databases (CANSIM table 102-0552) and Appendix II.
26 Statistics Canada – Catalogue no. 84F0209X

Mortality, Summary List of Causes – 2009
Table 1-6Deaths and mortality rate, by selected grouped causes, sex and geography — Quebec1
Number of deaths Crude mortality rateper 100,000 population 2
Age-standardized mortality rateper 100,000 population 2
Bothsexes
Males Females Bothsexes
Males Females Bothsexes
Males Females
Total, all causes of death (A00-Y89) 3 , 4 , 5 57,769 28,586 29,183 738.1 737.1 739.1 514.2 630.7 424.9
Salmonella infections (A01-A02) 2 0 2 0.0 0.0 0.1 0.0 0.0 0.0Shigellosis and amoebiasis (A03, A06) 0 0 0 0.0 0.0 0.0 0.0 0.0 0.0Certain other intestinal infections (A04, A07-A09) 445 182 263 5.7 4.7 6.7 3.6 4.1 3.4Tuberculosis (A16-A19) 6 3 3 0.1 0.1 0.1 0.1 0.1 0.0Respiratory tuberculosis (A16) 4 1 3 0.1 0.0 0.1 0.0 0.0 0.0Other tuberculosis (A17-A19) 2 2 0 0.0 0.1 0.0 0.0 0.0 0.0Whooping cough (A37) 0 0 0 0.0 0.0 0.0 0.0 0.0 0.0Scarlet fever and erysipelas (A38, A46) 0 0 0 0.0 0.0 0.0 0.0 0.0 0.0Meningococcal infection (A39) 4 1 3 0.1 0.0 0.1 0.1 0.0 0.1Septicaemia (A40-A41) 523 245 278 6.7 6.3 7.0 4.5 5.5 3.8Syphilis (A50-A53) 2 1 1 0.0 0.0 0.0 0.0 0.0 0.0Acute poliomyelitis (A80) 0 0 0 0.0 0.0 0.0 0.0 0.0 0.0Arthropod-borne viral encephalitis (A83-A84, A85.2) 0 0 0 0.0 0.0 0.0 0.0 0.0 0.0Measles (B05) 0 0 0 0.0 0.0 0.0 0.0 0.0 0.0Viral hepatitis (B15-B19) 71 45 26 0.9 1.2 0.7 0.6 0.9 0.4Human immunodeficiency virus [HIV] disease (B20-B24) 95 77 18 1.2 2.0 0.5 0.9 1.5 0.4Malaria (B50-B54) 0 0 0 0.0 0.0 0.0 0.0 0.0 0.0Other and unspecified infectious and parasitic diseases
and their sequelae 6 119 58 61 1.5 1.5 1.5 1.1 1.3 0.9Malignant neoplasms (C00-C97) 19,094 9,998 9,096 244.0 257.8 230.4 174.7 213.0 148.0Malignant neoplasms of lip, oral cavity and pharynx
(C00-C14) 261 173 88 3.3 4.5 2.2 2.4 3.5 1.4Malignant neoplasm of oesophagus (C15) 307 228 79 3.9 5.9 2.0 2.8 4.7 1.3Malignant neoplasm of stomach (C16) 523 308 215 6.7 7.9 5.4 4.7 6.4 3.2Malignant neoplasms of colon, rectum and anus (C18-C21) 2,191 1,156 1,035 28.0 29.8 26.2 19.8 24.6 15.9Malignant neoplasm of liver and intrahepatic bile ducts
(C22) 471 312 159 6.0 8.0 4.0 4.3 6.6 2.5Malignant neoplasm of pancreas (C25) 1,039 504 535 13.3 13.0 13.5 9.5 10.7 8.5Malignant neoplasm of larynx (C32) 150 123 27 1.9 3.2 0.7 1.4 2.6 0.4Malignant neoplasms of trachea, bronchus and lung
(C33-C34) 5,919 3,385 2,534 75.6 87.3 64.2 54.7 71.2 43.0Malignant melanoma of skin (C43) 212 132 80 2.7 3.4 2.0 2.0 2.7 1.4Malignant neoplasm of breast (C50) 1,360 16 1,344 17.4 0.4 34.0 12.4 0.3 22.3Malignant neoplasm of cervix uteri (C53) ... ... 78 ... ... 2.0 ... ... 1.4Malignant neoplasms of corpus uteri and uterus, part
unspecified (C54-C55) ... ... 224 ... ... 5.7 ... ... 3.6Malignant neoplasm of ovary (C56) ... ... 386 ... ... 9.8 ... ... 6.3Malignant neoplasm of prostate (C61) ... 776 ... ... 20.0 ... ... 17.3 ...Malignant neoplasms of kidney and renal pelvis (C64-C65) 392 242 150 5.0 6.2 3.8 3.5 5.0 2.4Malignant neoplasm of bladder (C67) 483 332 151 6.2 8.6 3.8 4.2 7.3 2.2Malignant neoplasms of meninges, brain and other parts
of central nervous system (C70-C72) 483 271 212 6.2 7.0 5.4 4.7 5.6 3.9Malignant neoplasms of lymphoid, haematopoietic and
related tissue (C81-C96) 1,669 919 750 21.3 23.7 19.0 15.5 19.9 12.1Hodgkin’s disease (C81) 36 20 16 0.5 0.5 0.4 0.4 0.5 0.3Non-Hodgkin’s lymphoma (C82-C85) 643 345 298 8.2 8.9 7.5 5.9 7.5 4.7Leukaemia (C91-C95) 635 366 269 8.1 9.4 6.8 5.9 8.0 4.4Multiple myeloma and immunoproliferative neoplasms
(C88, C90) 349 184 165 4.5 4.7 4.2 3.2 3.9 2.7Other and unspecified malignant neoplasms of lymphoid,
haematopoietic and related tissue (C96) 6 4 2 0.1 0.1 0.1 0.1 0.1 0.0All other and unspecified malignant neoplasms (C17,
C23-C24, C26-C31, C37-C41, C44-C49, C51-C52,C57-C60, C62-C63, C66, C68-C69, C73-C80, C97) 2,170 1,121 1,049 27.7 28.9 26.6 19.6 24.4 16.1
In situ neoplasms, benign neoplasms and neoplasms ofuncertain or unknown behaviour (D00-D48) 274 133 141 3.5 3.4 3.6 2.4 3.0 2.0
Anaemias (D50-D64) 166 78 88 2.1 2.0 2.2 1.4 1.8 1.1Diabetes mellitus (E10-E14) 1,415 707 708 18.1 18.2 17.9 12.4 15.3 10.2Nutritional deficiencies (E40-E64) 104 43 61 1.3 1.1 1.5 0.9 1.0 0.8Malnutrition (E40-E46) 93 37 56 1.2 1.0 1.4 0.8 0.8 0.7Other nutritional deficiencies (E50-E64) 11 6 5 0.1 0.2 0.1 0.1 0.1 0.1Meningitis (G00, G03) 17 8 9 0.2 0.2 0.2 0.2 0.2 0.2Parkinson’s disease (G20-G21) 473 265 208 6.0 6.8 5.3 4.0 5.9 2.7Alzheimer’s disease (G30) 2,078 602 1,476 26.5 15.5 37.4 16.4 14.0 17.5Major cardiovascular diseases (I00-I78) 14,698 7,278 7,420 187.8 187.7 187.9 125.4 160.0 98.3Diseases of heart (I00-I09, I11, I13, I20-I51) 10,974 5,639 5,335 140.2 145.4 135.1 93.7 123.4 70.3Acute rheumatic fever and chronic rheumatic heart
diseases (I00-I09) 126 32 94 1.6 0.8 2.4 1.1 0.7 1.4Hypertensive heart disease (I11) 51 23 28 0.7 0.6 0.7 0.4 0.5 0.3Hypertensive heart and renal disease (I13) 32 11 21 0.4 0.3 0.5 0.3 0.2 0.3Ischaemic heart diseases (I20-I25) 7,751 4,209 3,542 99.0 108.5 89.7 66.3 91.2 46.8Acute myocardial infarction (I21-I22) 4,428 2,514 1,914 56.6 64.8 48.5 38.4 53.6 26.0Other acute ischaemic heart diseases (I24) 432 217 215 5.5 5.6 5.4 3.7 4.8 2.9
See notes at the end of the table.
Statistics Canada – Catalogue no. 84F0209X 27
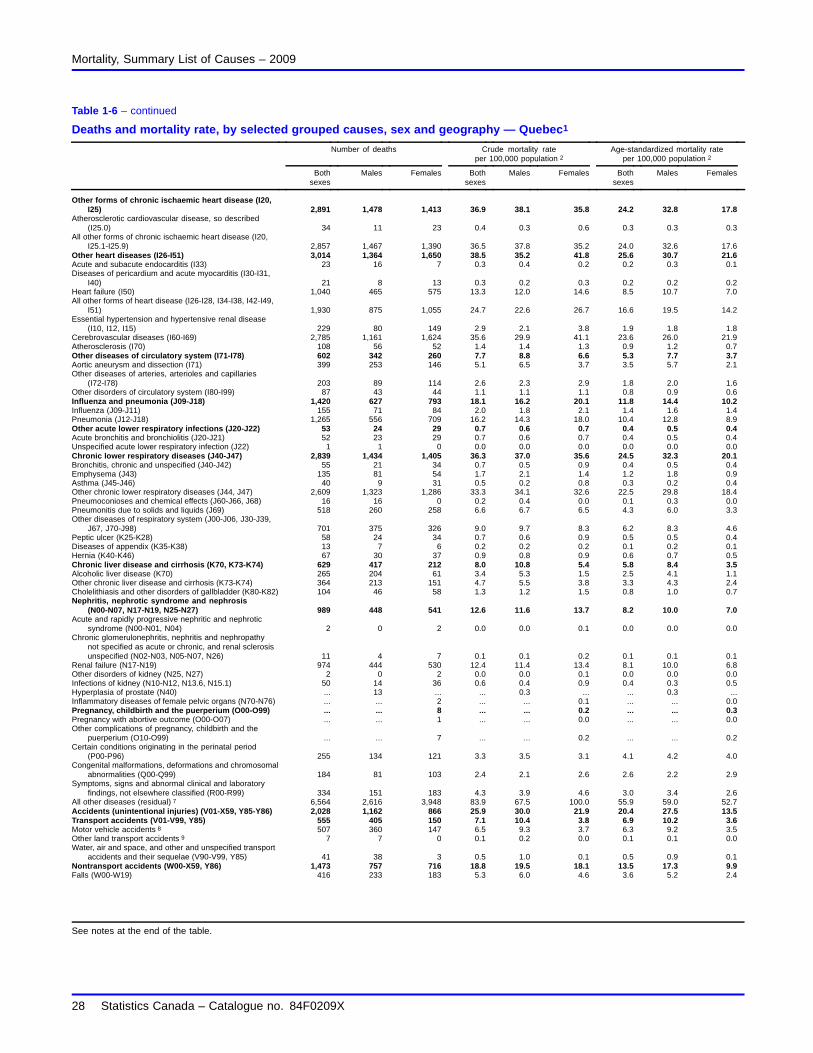
Mortality, Summary List of Causes – 2009
Table 1-6 – continued
Deaths and mortality rate, by selected grouped causes, sex and geography — Quebec1
Number of deaths Crude mortality rateper 100,000 population 2
Age-standardized mortality rateper 100,000 population 2
Bothsexes
Males Females Bothsexes
Males Females Bothsexes
Males Females
Other forms of chronic ischaemic heart disease (I20,I25) 2,891 1,478 1,413 36.9 38.1 35.8 24.2 32.8 17.8
Atherosclerotic cardiovascular disease, so described(I25.0) 34 11 23 0.4 0.3 0.6 0.3 0.3 0.3
All other forms of chronic ischaemic heart disease (I20,I25.1-I25.9) 2,857 1,467 1,390 36.5 37.8 35.2 24.0 32.6 17.6
Other heart diseases (I26-I51) 3,014 1,364 1,650 38.5 35.2 41.8 25.6 30.7 21.6Acute and subacute endocarditis (I33) 23 16 7 0.3 0.4 0.2 0.2 0.3 0.1Diseases of pericardium and acute myocarditis (I30-I31,
I40) 21 8 13 0.3 0.2 0.3 0.2 0.2 0.2Heart failure (I50) 1,040 465 575 13.3 12.0 14.6 8.5 10.7 7.0All other forms of heart disease (I26-I28, I34-I38, I42-I49,
I51) 1,930 875 1,055 24.7 22.6 26.7 16.6 19.5 14.2Essential hypertension and hypertensive renal disease
(I10, I12, I15) 229 80 149 2.9 2.1 3.8 1.9 1.8 1.8Cerebrovascular diseases (I60-I69) 2,785 1,161 1,624 35.6 29.9 41.1 23.6 26.0 21.9Atherosclerosis (I70) 108 56 52 1.4 1.4 1.3 0.9 1.2 0.7Other diseases of circulatory system (I71-I78) 602 342 260 7.7 8.8 6.6 5.3 7.7 3.7Aortic aneurysm and dissection (I71) 399 253 146 5.1 6.5 3.7 3.5 5.7 2.1Other diseases of arteries, arterioles and capillaries
(I72-I78) 203 89 114 2.6 2.3 2.9 1.8 2.0 1.6Other disorders of circulatory system (I80-I99) 87 43 44 1.1 1.1 1.1 0.8 0.9 0.6Influenza and pneumonia (J09-J18) 1,420 627 793 18.1 16.2 20.1 11.8 14.4 10.2Influenza (J09-J11) 155 71 84 2.0 1.8 2.1 1.4 1.6 1.4Pneumonia (J12-J18) 1,265 556 709 16.2 14.3 18.0 10.4 12.8 8.9Other acute lower respiratory infections (J20-J22) 53 24 29 0.7 0.6 0.7 0.4 0.5 0.4Acute bronchitis and bronchiolitis (J20-J21) 52 23 29 0.7 0.6 0.7 0.4 0.5 0.4Unspecified acute lower respiratory infection (J22) 1 1 0 0.0 0.0 0.0 0.0 0.0 0.0Chronic lower respiratory diseases (J40-J47) 2,839 1,434 1,405 36.3 37.0 35.6 24.5 32.3 20.1Bronchitis, chronic and unspecified (J40-J42) 55 21 34 0.7 0.5 0.9 0.4 0.5 0.4Emphysema (J43) 135 81 54 1.7 2.1 1.4 1.2 1.8 0.9Asthma (J45-J46) 40 9 31 0.5 0.2 0.8 0.3 0.2 0.4Other chronic lower respiratory diseases (J44, J47) 2,609 1,323 1,286 33.3 34.1 32.6 22.5 29.8 18.4Pneumoconioses and chemical effects (J60-J66, J68) 16 16 0 0.2 0.4 0.0 0.1 0.3 0.0Pneumonitis due to solids and liquids (J69) 518 260 258 6.6 6.7 6.5 4.3 6.0 3.3Other diseases of respiratory system (J00-J06, J30-J39,
J67, J70-J98) 701 375 326 9.0 9.7 8.3 6.2 8.3 4.6Peptic ulcer (K25-K28) 58 24 34 0.7 0.6 0.9 0.5 0.5 0.4Diseases of appendix (K35-K38) 13 7 6 0.2 0.2 0.2 0.1 0.2 0.1Hernia (K40-K46) 67 30 37 0.9 0.8 0.9 0.6 0.7 0.5Chronic liver disease and cirrhosis (K70, K73-K74) 629 417 212 8.0 10.8 5.4 5.8 8.4 3.5Alcoholic liver disease (K70) 265 204 61 3.4 5.3 1.5 2.5 4.1 1.1Other chronic liver disease and cirrhosis (K73-K74) 364 213 151 4.7 5.5 3.8 3.3 4.3 2.4Cholelithiasis and other disorders of gallbladder (K80-K82) 104 46 58 1.3 1.2 1.5 0.8 1.0 0.7Nephritis, nephrotic syndrome and nephrosis
(N00-N07, N17-N19, N25-N27) 989 448 541 12.6 11.6 13.7 8.2 10.0 7.0Acute and rapidly progressive nephritic and nephrotic
syndrome (N00-N01, N04) 2 0 2 0.0 0.0 0.1 0.0 0.0 0.0Chronic glomerulonephritis, nephritis and nephropathy
not specified as acute or chronic, and renal sclerosisunspecified (N02-N03, N05-N07, N26) 11 4 7 0.1 0.1 0.2 0.1 0.1 0.1
Renal failure (N17-N19) 974 444 530 12.4 11.4 13.4 8.1 10.0 6.8Other disorders of kidney (N25, N27) 2 0 2 0.0 0.0 0.1 0.0 0.0 0.0Infections of kidney (N10-N12, N13.6, N15.1) 50 14 36 0.6 0.4 0.9 0.4 0.3 0.5Hyperplasia of prostate (N40) ... 13 ... ... 0.3 ... ... 0.3 ...Inflammatory diseases of female pelvic organs (N70-N76) ... ... 2 ... ... 0.1 ... ... 0.0Pregnancy, childbirth and the puerperium (O00-O99) ... ... 8 ... ... 0.2 ... ... 0.3Pregnancy with abortive outcome (O00-O07) ... ... 1 ... ... 0.0 ... ... 0.0Other complications of pregnancy, childbirth and the
puerperium (O10-O99) ... ... 7 ... ... 0.2 ... ... 0.2Certain conditions originating in the perinatal period
(P00-P96) 255 134 121 3.3 3.5 3.1 4.1 4.2 4.0Congenital malformations, deformations and chromosomal
abnormalities (Q00-Q99) 184 81 103 2.4 2.1 2.6 2.6 2.2 2.9Symptoms, signs and abnormal clinical and laboratory
findings, not elsewhere classified (R00-R99) 334 151 183 4.3 3.9 4.6 3.0 3.4 2.6All other diseases (residual) 7 6,564 2,616 3,948 83.9 67.5 100.0 55.9 59.0 52.7Accidents (unintentional injuries) (V01-X59, Y85-Y86) 2,028 1,162 866 25.9 30.0 21.9 20.4 27.5 13.5Transport accidents (V01-V99, Y85) 555 405 150 7.1 10.4 3.8 6.9 10.2 3.6Motor vehicle accidents 8 507 360 147 6.5 9.3 3.7 6.3 9.2 3.5Other land transport accidents 9 7 7 0 0.1 0.2 0.0 0.1 0.1 0.0Water, air and space, and other and unspecified transport
accidents and their sequelae (V90-V99, Y85) 41 38 3 0.5 1.0 0.1 0.5 0.9 0.1Nontransport accidents (W00-X59, Y86) 1,473 757 716 18.8 19.5 18.1 13.5 17.3 9.9Falls (W00-W19) 416 233 183 5.3 6.0 4.6 3.6 5.2 2.4
See notes at the end of the table.
28 Statistics Canada – Catalogue no. 84F0209X

Mortality, Summary List of Causes – 2009
Table 1-6 – continued
Deaths and mortality rate, by selected grouped causes, sex and geography — Quebec1
Number of deaths Crude mortality rateper 100,000 population 2
Age-standardized mortality rateper 100,000 population 2
Bothsexes
Males Females Bothsexes
Males Females Bothsexes
Males Females
Accidental discharge of firearms (W32-W34) 4 4 0 0.1 0.1 0.0 0.0 0.1 0.0Accidental drowning and submersion (W65-W74) 52 45 7 0.7 1.2 0.2 0.6 1.1 0.2Accidental exposure to smoke, fire and flames (X00-X09) 36 24 12 0.5 0.6 0.3 0.4 0.5 0.2Accidental poisoning and exposure to noxious substances
(X40-X49) 226 158 68 2.9 4.1 1.7 2.6 3.6 1.5Other and unspecified nontransport accidents and their
sequelae (W20-W31, W35-W64, W75-W99, X10-X39,X50-X59, Y86) 739 293 446 9.4 7.6 11.3 6.3 6.9 5.6
Intentional self-harm (suicide) (X60-X84, Y87.0) 1,082 835 247 13.8 21.5 6.3 12.5 19.6 5.6Intentional self-harm (suicide) by discharge of firearms
(X72-X74) 131 125 6 1.7 3.2 0.2 1.5 2.9 0.1Intentional self-harm (suicide) by other and unspecified
means and their sequelae (X60-X71, X75-X84, Y87.0) 951 710 241 12.2 18.3 6.1 11.1 16.7 5.5Assault (homicide) (X85-Y09, Y87.1) 81 51 30 1.0 1.3 0.8 1.1 1.4 0.8Assault (homicide) by discharge of firearms (X93-X95) 24 19 5 0.3 0.5 0.1 0.3 0.5 0.1Assault (homicide) by other and unspecified means and
their sequelae (X85-X92, X96-Y09, Y87.1) 57 32 25 0.7 0.8 0.6 0.8 0.9 0.7Legal intervention (Y35, Y89.0) 6 6 0 0.1 0.2 0.0 0.1 0.2 0.0Events of undetermined intent (Y10-Y34, Y87.2, Y89.9) 67 42 25 0.9 1.1 0.6 0.8 1.1 0.5Discharge of firearms, undetermined intent (Y22-Y24) 2 1 1 0.0 0.0 0.0 0.0 0.0 0.0Other and unspecified events of undetermined intent and
their sequelae (Y10-Y21, Y25-Y34, Y87.2, Y89.9) 65 41 24 0.8 1.1 0.6 0.8 1.1 0.5Operations of war and their sequelae (Y36, Y89.1) 1 1 0 0.0 0.0 0.0 0.0 0.0 0.0Complications of medical and surgical care (Y40-Y84, Y88) 14 5 9 0.2 0.1 0.2 0.1 0.1 0.2
1. The geographic distribution of deaths in this table is based on the deceased’s usual place of residence.2. Starting in 2005, the population estimates used to calculate the mortality rates are presented in the Appendix II of the publication "Mortality Summary List of
Causes" (catalogue number 84F0209XIE).3. The cause of death tabulated is the underlying cause of death. This is defined as (a) the disease or injury which initiated the train of events leading directly to
death, or (b) the circumstances of the accident or violence which produced the fatal injury. The underlying cause is selected from the conditions listed onthe medical certificate of cause of death.
4. World Health Organization (WHO), International Statistical Classification of Diseases and Related Health Problems, Tenth Revision (ICD-10)5. National Center for Health Statistics, United States. "B" list in "Instruction Manual; Part 9; ICD-10 Cause-of-Death Lists for Tabulating Mortality Statistics".6. Other and unspecified infectious and parasitic diseases and their sequelae A00, A05, A20 to A36, A42 to A44, A48 to A49, A54 to A79, A81 to A82,
A85.0 to A85.1, A85.8, A86 to B04, B06 to B09, B25 to B49, B55 to B99.7. All other diseases (residual) D65 to E07, E15 to E34, E65 to F99, G04 to G12, G23 to G25, G31 to H93, K00 to K22, K29 to K31, K50 to K66, K71 to K72, K75 to
K76, K83 to M99, N13.0 to N13.5, N13.7 to N13.9, N14, N15.0, N15.8 to N15.9, N20 to N23, N28 to N39, N41 to N64, N80 to N98. As of 2003, also includes U04.8. Motor vehicle accidents V02 to V04, V09.0, V09.2, V12 to V14, V19.0 to V19.2, V19.4 to V19.6, V20 to V79, V80.3 to V80.5, V81.0 to V81.1, V82.0 to V82.1,
V83 to V86, V87.0 to V87.8, V88.0 to V88.8, V89.0, V89.2.9. Other land transport accidents V01, V05 to V06, V09.1, V09.3 to V09.9, V10 to V11, V15 to V18, V19.3, V19.8 to V19.9, V80.0 to V80.2, V80.6 to V80.9,
V81.2 to V81.9, V82.2 to V82.9, V87.9, V88.9, V89.1, V89.3, V89.9.Note(s): See Data quality, concepts and methodology — Explanatory notes for the tables section.Source(s): Statistics Canada, Canadian Vital Statistics, Birth and Death Databases (CANSIM table 102-0552) and Appendix II.
Statistics Canada – Catalogue no. 84F0209X 29

Mortality, Summary List of Causes – 2009
Table 1-7Deaths and mortality rate, by selected grouped causes, sex and geography — Ontario1
Number of deaths Crude mortality rateper 100,000 population 2
Age-standardized mortality rateper 100,000 population 2
Bothsexes
Males Females Bothsexes
Males Females Bothsexes
Males Females
Total, all causes of death (A00-Y89) 3 , 4 , 5 88,468 44,510 43,958 676.7 690.8 663.1 499.7 611.5 412.0
Salmonella infections (A01-A02) 2 0 2 0.0 0.0 0.0 0.0 0.0 0.0Shigellosis and amoebiasis (A03, A06) 0 0 0 0.0 0.0 0.0 0.0 0.0 0.0Certain other intestinal infections (A04, A07-A09) 543 228 315 4.2 3.5 4.8 2.8 3.2 2.7Tuberculosis (A16-A19) 27 18 9 0.2 0.3 0.1 0.1 0.2 0.1Respiratory tuberculosis (A16) 22 14 8 0.2 0.2 0.1 0.1 0.2 0.1Other tuberculosis (A17-A19) 5 4 1 0.0 0.1 0.0 0.0 0.1 0.0Whooping cough (A37) 0 0 0 0.0 0.0 0.0 0.0 0.0 0.0Scarlet fever and erysipelas (A38, A46) 0 0 0 0.0 0.0 0.0 0.0 0.0 0.0Meningococcal infection (A39) 2 0 2 0.0 0.0 0.0 0.0 0.0 0.0Septicaemia (A40-A41) 961 427 534 7.4 6.6 8.1 5.3 5.9 4.9Syphilis (A50-A53) 0 0 0 0.0 0.0 0.0 0.0 0.0 0.0Acute poliomyelitis (A80) 0 0 0 0.0 0.0 0.0 0.0 0.0 0.0Arthropod-borne viral encephalitis (A83-A84, A85.2) 0 0 0 0.0 0.0 0.0 0.0 0.0 0.0Measles (B05) 0 0 0 0.0 0.0 0.0 0.0 0.0 0.0Viral hepatitis (B15-B19) 219 142 77 1.7 2.2 1.2 1.3 1.7 0.9Human immunodeficiency virus [HIV] disease (B20-B24) 128 108 20 1.0 1.7 0.3 0.8 1.4 0.3Malaria (B50-B54) 2 2 0 0.0 0.0 0.0 0.0 0.0 0.0Other and unspecified infectious and parasitic diseases
and their sequelae 6 219 106 113 1.7 1.6 1.7 1.3 1.5 1.2Malignant neoplasms (C00-C97) 26,117 13,693 12,424 199.8 212.5 187.4 154.1 185.3 131.6Malignant neoplasms of lip, oral cavity and pharynx
(C00-C14) 407 281 126 3.1 4.4 1.9 2.4 3.7 1.4Malignant neoplasm of oesophagus (C15) 679 521 158 5.2 8.1 2.4 4.0 6.9 1.7Malignant neoplasm of stomach (C16) 751 480 271 5.7 7.4 4.1 4.5 6.5 2.8Malignant neoplasms of colon, rectum and anus (C18-C21) 2,852 1,535 1,317 21.8 23.8 19.9 16.4 20.6 13.0Malignant neoplasm of liver and intrahepatic bile ducts
(C22) 772 506 266 5.9 7.9 4.0 4.6 6.8 2.8Malignant neoplasm of pancreas (C25) 1,467 718 749 11.2 11.1 11.3 8.7 9.6 7.8Malignant neoplasm of larynx (C32) 172 144 28 1.3 2.2 0.4 1.0 1.9 0.3Malignant neoplasms of trachea, bronchus and lung
(C33-C34) 6,479 3,543 2,936 49.6 55.0 44.3 39.1 47.9 32.2Malignant melanoma of skin (C43) 452 287 165 3.5 4.5 2.5 2.7 3.9 1.7Malignant neoplasm of breast (C50) 1,902 18 1,884 14.5 0.3 28.4 11.2 0.3 20.3Malignant neoplasm of cervix uteri (C53) ... ... 136 ... ... 2.1 ... ... 1.6Malignant neoplasms of corpus uteri and uterus, part
unspecified (C54-C55) ... ... 367 ... ... 5.5 ... ... 4.0Malignant neoplasm of ovary (C56) ... ... 613 ... ... 9.2 ... ... 6.7Malignant neoplasm of prostate (C61) ... 1,399 ... ... 21.7 ... ... 19.2 ...Malignant neoplasms of kidney and renal pelvis (C64-C65) 537 333 204 4.1 5.2 3.1 3.2 4.5 2.1Malignant neoplasm of bladder (C67) 724 499 225 5.5 7.7 3.4 4.0 6.8 2.1Malignant neoplasms of meninges, brain and other parts
of central nervous system (C70-C72) 730 438 292 5.6 6.8 4.4 4.6 6.0 3.5Malignant neoplasms of lymphoid, haematopoietic and
related tissue (C81-C96) 2,554 1,401 1,153 19.5 21.7 17.4 15.3 19.1 12.3Hodgkin’s disease (C81) 55 30 25 0.4 0.5 0.4 0.4 0.4 0.3Non-Hodgkin’s lymphoma (C82-C85) 1,004 550 454 7.7 8.5 6.8 6.0 7.4 4.9Leukaemia (C91-C95) 968 540 428 7.4 8.4 6.5 5.8 7.5 4.5Multiple myeloma and immunoproliferative neoplasms
(C88, C90) 522 279 243 4.0 4.3 3.7 3.1 3.7 2.5Other and unspecified malignant neoplasms of lymphoid,
haematopoietic and related tissue (C96) 5 2 3 0.0 0.0 0.0 0.0 0.0 0.0All other and unspecified malignant neoplasms (C17,
C23-C24, C26-C31, C37-C41, C44-C49, C51-C52,C57-C60, C62-C63, C66, C68-C69, C73-C80, C97) 3,124 1,590 1,534 23.9 24.7 23.1 18.0 21.7 15.3
In situ neoplasms, benign neoplasms and neoplasms ofuncertain or unknown behaviour (D00-D48) 532 289 243 4.1 4.5 3.7 3.0 4.0 2.3
Anaemias (D50-D64) 181 70 111 1.4 1.1 1.7 0.9 1.0 0.9Diabetes mellitus (E10-E14) 2,866 1,527 1,339 21.9 23.7 20.2 16.3 20.7 12.7Nutritional deficiencies (E40-E64) 43 17 26 0.3 0.3 0.4 0.2 0.2 0.2Malnutrition (E40-E46) 35 15 20 0.3 0.2 0.3 0.2 0.2 0.2Other nutritional deficiencies (E50-E64) 8 2 6 0.1 0.0 0.1 0.0 0.0 0.1Meningitis (G00, G03) 24 13 11 0.2 0.2 0.2 0.2 0.2 0.1Parkinson’s disease (G20-G21) 775 459 316 5.9 7.1 4.8 4.1 6.3 2.6Alzheimer’s disease (G30) 2,179 693 1,486 16.7 10.8 22.4 10.7 9.5 11.2Major cardiovascular diseases (I00-I78) 25,961 12,982 12,979 198.6 201.5 195.8 139.9 176.9 110.0Diseases of heart (I00-I09, I11, I13, I20-I51) 18,494 9,837 8,657 141.5 152.7 130.6 100.3 133.6 73.7Acute rheumatic fever and chronic rheumatic heart
diseases (I00-I09) 142 53 89 1.1 0.8 1.3 0.8 0.7 0.8Hypertensive heart disease (I11) 297 127 170 2.3 2.0 2.6 1.6 1.6 1.5Hypertensive heart and renal disease (I13) 34 15 19 0.3 0.2 0.3 0.2 0.2 0.2Ischaemic heart diseases (I20-I25) 14,056 7,834 6,222 107.5 121.6 93.9 76.5 106.1 52.9Acute myocardial infarction (I21-I22) 5,312 3,009 2,303 40.6 46.7 34.7 29.3 40.6 20.2Other acute ischaemic heart diseases (I24) 408 210 198 3.1 3.3 3.0 2.2 2.8 1.8
See notes at the end of the table.
30 Statistics Canada – Catalogue no. 84F0209X

Mortality, Summary List of Causes – 2009
Table 1-7 – continued
Deaths and mortality rate, by selected grouped causes, sex and geography — Ontario1
Number of deaths Crude mortality rateper 100,000 population 2
Age-standardized mortality rateper 100,000 population 2
Bothsexes
Males Females Bothsexes
Males Females Bothsexes
Males Females
Other forms of chronic ischaemic heart disease (I20,I25) 8,336 4,615 3,721 63.8 71.6 56.1 44.9 62.7 30.9
Atherosclerotic cardiovascular disease, so described(I25.0) 178 102 76 1.4 1.6 1.1 1.0 1.4 0.7
All other forms of chronic ischaemic heart disease (I20,I25.1-I25.9) 8,158 4,513 3,645 62.4 70.0 55.0 43.9 61.3 30.2
Other heart diseases (I26-I51) 3,965 1,808 2,157 30.3 28.1 32.5 21.3 25.0 18.3Acute and subacute endocarditis (I33) 52 33 19 0.4 0.5 0.3 0.3 0.5 0.2Diseases of pericardium and acute myocarditis (I30-I31,
I40) 32 16 16 0.2 0.2 0.2 0.2 0.2 0.2Heart failure (I50) 1,220 504 716 9.3 7.8 10.8 6.2 7.0 5.5All other forms of heart disease (I26-I28, I34-I38, I42-I49,
I51) 2,661 1,255 1,406 20.4 19.5 21.2 14.6 17.3 12.4Essential hypertension and hypertensive renal disease
(I10, I12, I15) 607 222 385 4.6 3.4 5.8 3.1 3.1 3.1Cerebrovascular diseases (I60-I69) 5,451 2,187 3,264 41.7 33.9 49.2 28.8 30.0 27.5Atherosclerosis (I70) 365 156 209 2.8 2.4 3.2 1.8 2.1 1.6Other diseases of circulatory system (I71-I78) 1,044 580 464 8.0 9.0 7.0 5.8 8.0 4.2Aortic aneurysm and dissection (I71) 582 358 224 4.5 5.6 3.4 3.3 5.0 2.1Other diseases of arteries, arterioles and capillaries
(I72-I78) 462 222 240 3.5 3.4 3.6 2.5 3.1 2.1Other disorders of circulatory system (I80-I99) 145 69 76 1.1 1.1 1.1 0.8 0.9 0.8Influenza and pneumonia (J09-J18) 2,128 1,030 1,098 16.3 16.0 16.6 11.2 14.4 9.2Influenza (J09-J11) 169 84 85 1.3 1.3 1.3 1.0 1.2 1.0Pneumonia (J12-J18) 1,959 946 1,013 15.0 14.7 15.3 10.2 13.2 8.2Other acute lower respiratory infections (J20-J22) 7 1 6 0.1 0.0 0.1 0.0 0.0 0.0Acute bronchitis and bronchiolitis (J20-J21) 1 1 0 0.0 0.0 0.0 0.0 0.0 0.0Unspecified acute lower respiratory infection (J22) 6 0 6 0.0 0.0 0.1 0.0 0.0 0.0Chronic lower respiratory diseases (J40-J47) 3,718 1,860 1,858 28.4 28.9 28.0 20.4 25.7 17.1Bronchitis, chronic and unspecified (J40-J42) 33 19 14 0.3 0.3 0.2 0.2 0.3 0.1Emphysema (J43) 235 131 104 1.8 2.0 1.6 1.3 1.8 1.0Asthma (J45-J46) 91 31 60 0.7 0.5 0.9 0.5 0.4 0.5Other chronic lower respiratory diseases (J44, J47) 3,359 1,679 1,680 25.7 26.1 25.3 18.4 23.2 15.5Pneumoconioses and chemical effects (J60-J66, J68) 29 28 1 0.2 0.4 0.0 0.2 0.4 0.0Pneumonitis due to solids and liquids (J69) 568 300 268 4.3 4.7 4.0 3.0 4.2 2.2Other diseases of respiratory system (J00-J06, J30-J39,
J67, J70-J98) 999 530 469 7.6 8.2 7.1 5.5 7.3 4.3Peptic ulcer (K25-K28) 187 105 82 1.4 1.6 1.2 1.0 1.4 0.7Diseases of appendix (K35-K38) 31 14 17 0.2 0.2 0.3 0.2 0.2 0.2Hernia (K40-K46) 126 46 80 1.0 0.7 1.2 0.7 0.6 0.7Chronic liver disease and cirrhosis (K70, K73-K74) 1,110 722 388 8.5 11.2 5.9 6.7 9.2 4.5Alcoholic liver disease (K70) 642 456 186 4.9 7.1 2.8 3.9 5.7 2.3Other chronic liver disease and cirrhosis (K73-K74) 468 266 202 3.6 4.1 3.0 2.8 3.5 2.2Cholelithiasis and other disorders of gallbladder (K80-K82) 166 70 96 1.3 1.1 1.4 0.9 1.0 0.8Nephritis, nephrotic syndrome and nephrosis
(N00-N07, N17-N19, N25-N27) 1,238 625 613 9.5 9.7 9.2 6.6 8.6 5.3Acute and rapidly progressive nephritic and nephrotic
syndrome (N00-N01, N04) 7 5 2 0.1 0.1 0.0 0.0 0.1 0.0Chronic glomerulonephritis, nephritis and nephropathy
not specified as acute or chronic, and renal sclerosisunspecified (N02-N03, N05-N07, N26) 69 39 30 0.5 0.6 0.5 0.4 0.5 0.3
Renal failure (N17-N19) 1,160 580 580 8.9 9.0 8.7 6.1 8.0 5.0Other disorders of kidney (N25, N27) 2 1 1 0.0 0.0 0.0 0.0 0.0 0.0Infections of kidney (N10-N12, N13.6, N15.1) 26 6 20 0.2 0.1 0.3 0.1 0.1 0.2Hyperplasia of prostate (N40) ... 34 ... ... 0.5 ... ... 0.5 ...Inflammatory diseases of female pelvic organs (N70-N76) ... ... 4 ... ... 0.1 ... ... 0.0Pregnancy, childbirth and the puerperium (O00-O99) ... ... 11 ... ... 0.2 ... ... 0.2Pregnancy with abortive outcome (O00-O07) ... ... 1 ... ... 0.0 ... ... 0.0Other complications of pregnancy, childbirth and the
puerperium (O10-O99) ... ... 10 ... ... 0.2 ... ... 0.2Certain conditions originating in the perinatal period
(P00-P96) 412 216 196 3.2 3.4 3.0 4.2 4.3 4.1Congenital malformations, deformations and chromosomal
abnormalities (Q00-Q99) 351 206 145 2.7 3.2 2.2 3.0 3.6 2.5Symptoms, signs and abnormal clinical and laboratory
findings, not elsewhere classified (R00-R99) 650 296 354 5.0 4.6 5.3 4.0 4.4 3.6All other diseases (residual) 7 10,253 4,208 6,045 78.4 65.3 91.2 54.7 58.0 51.5Accidents (unintentional injuries) (V01-X59, Y85-Y86) 3,881 2,211 1,670 29.7 34.3 25.2 23.3 31.8 15.9Transport accidents (V01-V99, Y85) 750 534 216 5.7 8.3 3.3 5.3 8.0 2.8Motor vehicle accidents 8 662 460 202 5.1 7.1 3.0 4.7 6.9 2.7Other land transport accidents 9 23 17 6 0.2 0.3 0.1 0.2 0.2 0.1Water, air and space, and other and unspecified transport
accidents and their sequelae (V90-V99, Y85) 65 57 8 0.5 0.9 0.1 0.5 0.8 0.1Nontransport accidents (W00-X59, Y86) 3,131 1,677 1,454 24.0 26.0 21.9 18.0 23.8 13.0Falls (W00-W19) 1,866 872 994 14.3 13.5 15.0 9.6 12.1 7.9
See notes at the end of the table.
Statistics Canada – Catalogue no. 84F0209X 31

Mortality, Summary List of Causes – 2009
Table 1-7 – continued
Deaths and mortality rate, by selected grouped causes, sex and geography — Ontario1
Number of deaths Crude mortality rateper 100,000 population 2
Age-standardized mortality rateper 100,000 population 2
Bothsexes
Males Females Bothsexes
Males Females Bothsexes
Males Females
Accidental discharge of firearms (W32-W34) 0 0 0 0.0 0.0 0.0 0.0 0.0 0.0Accidental drowning and submersion (W65-W74) 89 70 19 0.7 1.1 0.3 0.7 1.1 0.3Accidental exposure to smoke, fire and flames (X00-X09) 82 51 31 0.6 0.8 0.5 0.5 0.7 0.4Accidental poisoning and exposure to noxious substances
(X40-X49) 609 422 187 4.7 6.5 2.8 4.4 6.3 2.5Other and unspecified nontransport accidents and their
sequelae (W20-W31, W35-W64, W75-W99, X10-X39,X50-X59, Y86) 485 262 223 3.7 4.1 3.4 2.8 3.7 2.0
Intentional self-harm (suicide) (X60-X84, Y87.0) 1,197 897 300 9.2 13.9 4.5 8.5 13.0 4.2Intentional self-harm (suicide) by discharge of firearms
(X72-X74) 134 133 1 1.0 2.1 0.0 0.9 1.9 0.0Intentional self-harm (suicide) by other and unspecified
means and their sequelae (X60-X71, X75-X84, Y87.0) 1,063 764 299 8.1 11.9 4.5 7.6 11.2 4.2Assault (homicide) (X85-Y09, Y87.1) 179 129 50 1.4 2.0 0.8 1.4 2.1 0.8Assault (homicide) by discharge of firearms (X93-X95) 57 51 6 0.4 0.8 0.1 0.5 0.9 0.1Assault (homicide) by other and unspecified means and
their sequelae (X85-X92, X96-Y09, Y87.1) 122 78 44 0.9 1.2 0.7 0.9 1.2 0.7Legal intervention (Y35, Y89.0) 5 5 0 0.0 0.1 0.0 0.0 0.1 0.0Events of undetermined intent (Y10-Y34, Y87.2, Y89.9) 178 106 72 1.4 1.6 1.1 1.2 1.5 0.9Discharge of firearms, undetermined intent (Y22-Y24) 4 4 0 0.0 0.1 0.0 0.0 0.1 0.0Other and unspecified events of undetermined intent and
their sequelae (Y10-Y21, Y25-Y34, Y87.2, Y89.9) 174 102 72 1.3 1.6 1.1 1.2 1.4 0.9Operations of war and their sequelae (Y36, Y89.1) 0 0 0 0.0 0.0 0.0 0.0 0.0 0.0Complications of medical and surgical care (Y40-Y84, Y88) 54 22 32 0.4 0.3 0.5 0.3 0.3 0.3
1. The geographic distribution of deaths in this table is based on the deceased’s usual place of residence.2. Starting in 2005, the population estimates used to calculate the mortality rates are presented in the Appendix II of the publication "Mortality Summary List of
Causes" (catalogue number 84F0209XIE).3. The cause of death tabulated is the underlying cause of death. This is defined as (a) the disease or injury which initiated the train of events leading directly to
death, or (b) the circumstances of the accident or violence which produced the fatal injury. The underlying cause is selected from the conditions listed onthe medical certificate of cause of death.
4. World Health Organization (WHO), International Statistical Classification of Diseases and Related Health Problems, Tenth Revision (ICD-10)5. National Center for Health Statistics, United States. "B" list in "Instruction Manual; Part 9; ICD-10 Cause-of-Death Lists for Tabulating Mortality Statistics".6. Other and unspecified infectious and parasitic diseases and their sequelae A00, A05, A20 to A36, A42 to A44, A48 to A49, A54 to A79, A81 to A82,
A85.0 to A85.1, A85.8, A86 to B04, B06 to B09, B25 to B49, B55 to B99.7. All other diseases (residual) D65 to E07, E15 to E34, E65 to F99, G04 to G12, G23 to G25, G31 to H93, K00 to K22, K29 to K31, K50 to K66, K71 to K72, K75 to
K76, K83 to M99, N13.0 to N13.5, N13.7 to N13.9, N14, N15.0, N15.8 to N15.9, N20 to N23, N28 to N39, N41 to N64, N80 to N98. As of 2003, also includes U04.8. Motor vehicle accidents V02 to V04, V09.0, V09.2, V12 to V14, V19.0 to V19.2, V19.4 to V19.6, V20 to V79, V80.3 to V80.5, V81.0 to V81.1, V82.0 to V82.1,
V83 to V86, V87.0 to V87.8, V88.0 to V88.8, V89.0, V89.2.9. Other land transport accidents V01, V05 to V06, V09.1, V09.3 to V09.9, V10 to V11, V15 to V18, V19.3, V19.8 to V19.9, V80.0 to V80.2, V80.6 to V80.9,
V81.2 to V81.9, V82.2 to V82.9, V87.9, V88.9, V89.1, V89.3, V89.9.Note(s): See Data quality, concepts and methodology — Explanatory notes for the tables section.Source(s): Statistics Canada, Canadian Vital Statistics, Birth and Death Databases (CANSIM table 102-0552) and Appendix II.
32 Statistics Canada – Catalogue no. 84F0209X

Mortality, Summary List of Causes – 2009
Table 1-8Deaths and mortality rate, by selected grouped causes, sex and geography — Manitoba1
Number of deaths Crude mortality rateper 100,000 population 2
Age-standardized mortality rateper 100,000 population 2
Bothsexes
Males Females Bothsexes
Males Females Bothsexes
Males Females
Total, all causes of death (A00-Y89) 3 , 4 , 5 9,972 4,959 5,013 817.9 817.3 818.5 575.5 702.0 477.7
Salmonella infections (A01-A02) 0 0 0 0.0 0.0 0.0 0.0 0.0 0.0Shigellosis and amoebiasis (A03, A06) 0 0 0 0.0 0.0 0.0 0.0 0.0 0.0Certain other intestinal infections (A04, A07-A09) 27 12 15 2.2 2.0 2.4 1.3 1.6 1.2Tuberculosis (A16-A19) 4 3 1 0.3 0.5 0.2 0.3 0.5 0.1Respiratory tuberculosis (A16) 2 2 0 0.2 0.3 0.0 0.1 0.3 0.0Other tuberculosis (A17-A19) 2 1 1 0.2 0.2 0.2 0.1 0.2 0.1Whooping cough (A37) 0 0 0 0.0 0.0 0.0 0.0 0.0 0.0Scarlet fever and erysipelas (A38, A46) 0 0 0 0.0 0.0 0.0 0.0 0.0 0.0Meningococcal infection (A39) 0 0 0 0.0 0.0 0.0 0.0 0.0 0.0Septicaemia (A40-A41) 81 32 49 6.6 5.3 8.0 4.8 4.6 5.0Syphilis (A50-A53) 0 0 0 0.0 0.0 0.0 0.0 0.0 0.0Acute poliomyelitis (A80) 0 0 0 0.0 0.0 0.0 0.0 0.0 0.0Arthropod-borne viral encephalitis (A83-A84, A85.2) 0 0 0 0.0 0.0 0.0 0.0 0.0 0.0Measles (B05) 0 0 0 0.0 0.0 0.0 0.0 0.0 0.0Viral hepatitis (B15-B19) 9 6 3 0.7 1.0 0.5 0.6 0.8 0.4Human immunodeficiency virus [HIV] disease (B20-B24) 8 7 1 0.7 1.2 0.2 0.6 1.0 0.2Malaria (B50-B54) 0 0 0 0.0 0.0 0.0 0.0 0.0 0.0Other and unspecified infectious and parasitic diseases
and their sequelae 6 23 12 11 1.9 2.0 1.8 1.5 1.8 1.4Malignant neoplasms (C00-C97) 2,678 1,364 1,314 219.7 224.8 214.6 166.3 192.5 150.0Malignant neoplasms of lip, oral cavity and pharynx
(C00-C14) 42 24 18 3.4 4.0 2.9 2.6 3.4 2.0Malignant neoplasm of oesophagus (C15) 71 54 17 5.8 8.9 2.8 4.4 7.5 1.8Malignant neoplasm of stomach (C16) 62 35 27 5.1 5.8 4.4 4.1 5.0 3.2Malignant neoplasms of colon, rectum and anus (C18-C21) 308 147 161 25.3 24.2 26.3 18.5 20.4 17.1Malignant neoplasm of liver and intrahepatic bile ducts
(C22) 58 30 28 4.8 4.9 4.6 3.8 4.4 3.1Malignant neoplasm of pancreas (C25) 126 58 68 10.3 9.6 11.1 7.9 8.3 7.4Malignant neoplasm of larynx (C32) 12 9 3 1.0 1.5 0.5 0.7 1.3 0.3Malignant neoplasms of trachea, bronchus and lung
(C33-C34) 702 392 310 57.6 64.6 50.6 44.4 55.4 36.9Malignant melanoma of skin (C43) 24 15 9 2.0 2.5 1.5 1.4 2.0 0.9Malignant neoplasm of breast (C50) 192 2 190 15.7 0.3 31.0 12.1 0.3 22.2Malignant neoplasm of cervix uteri (C53) ... ... 20 ... ... 3.3 ... ... 2.8Malignant neoplasms of corpus uteri and uterus, part
unspecified (C54-C55) ... ... 38 ... ... 6.2 ... ... 4.2Malignant neoplasm of ovary (C56) ... ... 59 ... ... 9.6 ... ... 7.3Malignant neoplasm of prostate (C61) ... 169 ... ... 27.9 ... ... 23.3 ...Malignant neoplasms of kidney and renal pelvis (C64-C65) 80 52 28 6.6 8.6 4.6 5.1 7.3 3.5Malignant neoplasm of bladder (C67) 73 50 23 6.0 8.2 3.8 4.2 7.1 2.2Malignant neoplasms of meninges, brain and other parts of
central nervous system (C70-C72) 46 27 19 3.8 4.4 3.1 3.3 3.9 2.8Malignant neoplasms of lymphoid, haematopoietic and
related tissue (C81-C96) 223 126 97 18.3 20.8 15.8 13.6 17.6 10.6Hodgkin’s disease (C81) 3 2 1 0.2 0.3 0.2 0.2 0.2 0.2Non-Hodgkin’s lymphoma (C82-C85) 83 39 44 6.8 6.4 7.2 5.0 5.6 4.6Leukaemia (C91-C95) 93 58 35 7.6 9.6 5.7 5.9 8.3 4.1Multiple myeloma and immunoproliferative neoplasms
(C88, C90) 43 26 17 3.5 4.3 2.8 2.3 3.4 1.6Other and unspecified malignant neoplasms of lymphoid,
haematopoietic and related tissue (C96) 1 1 0 0.1 0.2 0.0 0.1 0.1 0.0All other and unspecified malignant neoplasms (C17,
C23-C24, C26-C31, C37-C41, C44-C49, C51-C52,C57-C60, C62-C63, C66, C68-C69, C73-C80, C97) 373 174 199 30.6 28.7 32.5 23.1 25.2 21.7
In situ neoplasms, benign neoplasms and neoplasms ofuncertain or unknown behaviour (D00-D48) 92 38 54 7.5 6.3 8.8 5.1 5.3 4.9
Anaemias (D50-D64) 19 10 9 1.6 1.6 1.5 1.0 1.4 0.7Diabetes mellitus (E10-E14) 358 170 188 29.4 28.0 30.7 20.9 24.1 18.0Nutritional deficiencies (E40-E64) 10 3 7 0.8 0.5 1.1 0.6 0.4 0.8Malnutrition (E40-E46) 9 3 6 0.7 0.5 1.0 0.5 0.4 0.8Other nutritional deficiencies (E50-E64) 1 0 1 0.1 0.0 0.2 0.0 0.0 0.0Meningitis (G00, G03) 8 5 3 0.7 0.8 0.5 0.7 0.8 0.5Parkinson’s disease (G20-G21) 78 39 39 6.4 6.4 6.4 4.0 5.4 2.9Alzheimer’s disease (G30) 158 46 112 13.0 7.6 18.3 7.3 6.2 8.0Major cardiovascular diseases (I00-I78) 2,941 1,478 1,463 241.2 243.6 238.9 157.4 205.8 117.3Diseases of heart (I00-I09, I11, I13, I20-I51) 2,064 1,106 958 169.3 182.3 156.4 111.9 154.0 77.5Acute rheumatic fever and chronic rheumatic heart
diseases (I00-I09) 10 4 6 0.8 0.7 1.0 0.7 0.6 0.8Hypertensive heart disease (I11) 60 26 34 4.9 4.3 5.6 3.3 3.6 2.7Hypertensive heart and renal disease (I13) 8 6 2 0.7 1.0 0.3 0.3 0.8 0.1Ischaemic heart diseases (I20-I25) 1,488 850 638 122.0 140.1 104.2 81.8 118.8 51.6Acute myocardial infarction (I21-I22) 534 301 233 43.8 49.6 38.0 29.8 42.3 19.7Other acute ischaemic heart diseases (I24) 34 17 17 2.8 2.8 2.8 1.7 2.3 1.4
See notes at the end of the table.
Statistics Canada – Catalogue no. 84F0209X 33

Mortality, Summary List of Causes – 2009
Table 1-8 – continued
Deaths and mortality rate, by selected grouped causes, sex and geography — Manitoba1
Number of deaths Crude mortality rateper 100,000 population 2
Age-standardized mortality rateper 100,000 population 2
Bothsexes
Males Females Bothsexes
Males Females Bothsexes
Males Females
Other forms of chronic ischaemic heart disease (I20,I25) 920 532 388 75.5 87.7 63.4 50.3 74.1 30.5
Atherosclerotic cardiovascular disease, so described (I25.0) 35 17 18 2.9 2.8 2.9 2.1 2.5 1.7All other forms of chronic ischaemic heart disease (I20,
I25.1-I25.9) 885 515 370 72.6 84.9 60.4 48.2 71.7 28.8Other heart diseases (I26-I51) 498 220 278 40.8 36.3 45.4 25.8 30.2 22.3Acute and subacute endocarditis (I33) 2 1 1 0.2 0.2 0.2 0.1 0.1 0.1Diseases of pericardium and acute myocarditis (I30-I31,
I40) 2 0 2 0.2 0.0 0.3 0.2 0.0 0.3Heart failure (I50) 153 52 101 12.5 8.6 16.5 7.2 7.0 7.3All other forms of heart disease (I26-I28, I34-I38, I42-I49,
I51) 341 167 174 28.0 27.5 28.4 18.4 23.1 14.5Essential hypertension and hypertensive renal disease
(I10, I12, I15) 87 24 63 7.1 4.0 10.3 4.1 3.5 4.2Cerebrovascular diseases (I60-I69) 660 282 378 54.1 46.5 61.7 34.4 39.3 30.3Atherosclerosis (I70) 9 3 6 0.7 0.5 1.0 0.5 0.5 0.5Other diseases of circulatory system (I71-I78) 121 63 58 9.9 10.4 9.5 6.5 8.7 4.8Aortic aneurysm and dissection (I71) 77 45 32 6.3 7.4 5.2 4.3 6.2 3.0Other diseases of arteries, arterioles and capillaries
(I72-I78) 44 18 26 3.6 3.0 4.2 2.1 2.5 1.8Other disorders of circulatory system (I80-I99) 18 9 9 1.5 1.5 1.5 1.3 1.3 1.3Influenza and pneumonia (J09-J18) 223 108 115 18.3 17.8 18.8 11.4 14.9 9.0Influenza (J09-J11) 12 5 7 1.0 0.8 1.1 0.9 0.7 1.2Pneumonia (J12-J18) 211 103 108 17.3 17.0 17.6 10.4 14.1 7.8Other acute lower respiratory infections (J20-J22) 1 0 1 0.1 0.0 0.2 0.0 0.0 0.0Acute bronchitis and bronchiolitis (J20-J21) 0 0 0 0.0 0.0 0.0 0.0 0.0 0.0Unspecified acute lower respiratory infection (J22) 1 0 1 0.1 0.0 0.2 0.0 0.0 0.0Chronic lower respiratory diseases (J40-J47) 412 209 203 33.8 34.4 33.1 22.6 29.1 18.6Bronchitis, chronic and unspecified (J40-J42) 3 3 0 0.2 0.5 0.0 0.1 0.4 0.0Emphysema (J43) 24 13 11 2.0 2.1 1.8 1.3 1.8 0.9Asthma (J45-J46) 9 4 5 0.7 0.7 0.8 0.5 0.5 0.4Other chronic lower respiratory diseases (J44, J47) 376 189 187 30.8 31.1 30.5 20.7 26.3 17.2Pneumoconioses and chemical effects (J60-J66, J68) 3 2 1 0.2 0.3 0.2 0.2 0.3 0.1Pneumonitis due to solids and liquids (J69) 70 41 29 5.7 6.8 4.7 3.7 5.7 2.6Other diseases of respiratory system (J00-J06, J30-J39,
J67, J70-J98) 127 70 57 10.4 11.5 9.3 7.1 10.0 4.8Peptic ulcer (K25-K28) 27 12 15 2.2 2.0 2.4 1.8 1.8 1.8Diseases of appendix (K35-K38) 1 1 0 0.1 0.2 0.0 0.1 0.2 0.0Hernia (K40-K46) 17 8 9 1.4 1.3 1.5 0.9 1.1 0.8Chronic liver disease and cirrhosis (K70, K73-K74) 112 68 44 9.2 11.2 7.2 7.5 9.2 6.1Alcoholic liver disease (K70) 56 40 16 4.6 6.6 2.6 3.8 5.2 2.5Other chronic liver disease and cirrhosis (K73-K74) 56 28 28 4.6 4.6 4.6 3.8 4.0 3.6Cholelithiasis and other disorders of gallbladder (K80-K82) 11 7 4 0.9 1.2 0.7 0.5 1.0 0.3Nephritis, nephrotic syndrome and nephrosis (N00-N07,
N17-N19, N25-N27) 153 89 64 12.5 14.7 10.5 8.1 12.1 5.4Acute and rapidly progressive nephritic and nephrotic
syndrome (N00-N01, N04) 1 0 1 0.1 0.0 0.2 0.1 0.0 0.1Chronic glomerulonephritis, nephritis and nephropathy
not specified as acute or chronic, and renal sclerosisunspecified (N02-N03, N05-N07, N26) 3 0 3 0.2 0.0 0.5 0.1 0.0 0.2
Renal failure (N17-N19) 149 89 60 12.2 14.7 9.8 7.9 12.1 5.1Other disorders of kidney (N25, N27) 0 0 0 0.0 0.0 0.0 0.0 0.0 0.0Infections of kidney (N10-N12, N13.6, N15.1) 4 1 3 0.3 0.2 0.5 0.2 0.1 0.3Hyperplasia of prostate (N40) ... 4 ... ... 0.7 ... ... 0.6 ...Inflammatory diseases of female pelvic organs (N70-N76) ... ... 0 ... ... 0.0 ... ... 0.0Pregnancy, childbirth and the puerperium (O00-O99) ... ... 0 ... ... 0.0 ... ... 0.0Pregnancy with abortive outcome (O00-O07) ... ... 0 ... ... 0.0 ... ... 0.0Other complications of pregnancy, childbirth and the
puerperium (O10-O99) ... ... 0 ... ... 0.0 ... ... 0.0Certain conditions originating in the perinatal period
(P00-P96) 50 26 24 4.1 4.3 3.9 4.5 4.6 4.4Congenital malformations, deformations and chromosomal
abnormalities (Q00-Q99) 55 32 23 4.5 5.3 3.8 4.5 5.3 3.7Symptoms, signs and abnormal clinical and laboratory
findings, not elsewhere classified (R00-R99) 159 63 96 13.0 10.4 15.7 8.6 9.2 7.5All other diseases (residual) 7 1,219 495 724 100.0 81.6 118.2 63.2 68.4 59.9Accidents (unintentional injuries) (V01-X59, Y85-Y86) 529 292 237 43.4 48.1 38.7 34.6 44.1 25.9Transport accidents (V01-V99, Y85) 122 93 29 10.0 15.3 4.7 9.5 14.6 4.7Motor vehicle accidents 8 114 87 27 9.4 14.3 4.4 8.9 13.7 4.4Other land transport accidents 9 3 3 0 0.2 0.5 0.0 0.2 0.4 0.0Water, air and space, and other and unspecified transport
accidents and their sequelae (V90-V99, Y85) 5 3 2 0.4 0.5 0.3 0.4 0.5 0.3Nontransport accidents (W00-X59, Y86) 407 199 208 33.4 32.8 34.0 25.1 29.5 21.2Falls (W00-W19) 199 81 118 16.3 13.3 19.3 9.7 11.1 8.5Accidental discharge of firearms (W32-W34) 0 0 0 0.0 0.0 0.0 0.0 0.0 0.0
See notes at the end of the table.
34 Statistics Canada – Catalogue no. 84F0209X

Mortality, Summary List of Causes – 2009
Table 1-8 – continued
Deaths and mortality rate, by selected grouped causes, sex and geography — Manitoba1
Number of deaths Crude mortality rateper 100,000 population 2
Age-standardized mortality rateper 100,000 population 2
Bothsexes
Males Females Bothsexes
Males Females Bothsexes
Males Females
Accidental drowning and submersion (W65-W74) 16 14 2 1.3 2.3 0.3 1.5 2.6 0.3Accidental exposure to smoke, fire and flames (X00-X09) 14 7 7 1.1 1.2 1.1 1.0 1.1 0.9Accidental poisoning and exposure to noxious substances
(X40-X49) 104 56 48 8.5 9.2 7.8 8.7 9.0 8.5Other and unspecified nontransport accidents and their
sequelae (W20-W31, W35-W64, W75-W99, X10-X39,X50-X59, Y86) 74 41 33 6.1 6.8 5.4 4.3 5.7 3.0
Intentional self-harm (suicide) (X60-X84, Y87.0) 178 124 54 14.6 20.4 8.8 14.1 19.4 9.1Intentional self-harm (suicide) by discharge of firearms
(X72-X74) 28 28 0 2.3 4.6 0.0 2.1 4.4 0.0Intentional self-harm (suicide) by other and unspecified
means and their sequelae (X60-X71, X75-X84, Y87.0) 150 96 54 12.3 15.8 8.8 12.0 15.0 9.1Assault (homicide) (X85-Y09, Y87.1) 52 42 10 4.3 6.9 1.6 4.5 7.2 1.7Assault (homicide) by discharge of firearms (X93-X95) 8 7 1 0.7 1.2 0.2 0.7 1.3 0.1Assault (homicide) by other and unspecified means and
their sequelae (X85-X92, X96-Y09, Y87.1) 44 35 9 3.6 5.8 1.5 3.8 5.9 1.6Legal intervention (Y35, Y89.0) 0 0 0 0.0 0.0 0.0 0.0 0.0 0.0Events of undetermined intent (Y10-Y34, Y87.2, Y89.9) 36 22 14 3.0 3.6 2.3 2.6 3.3 2.1Discharge of firearms, undetermined intent (Y22-Y24) 2 1 1 0.2 0.2 0.2 0.2 0.2 0.2Other and unspecified events of undetermined intent and
their sequelae (Y10-Y21, Y25-Y34, Y87.2, Y89.9) 34 21 13 2.8 3.5 2.1 2.5 3.1 1.9Operations of war and their sequelae (Y36, Y89.1) 0 0 0 0.0 0.0 0.0 0.0 0.0 0.0Complications of medical and surgical care (Y40-Y84, Y88) 17 9 8 1.4 1.5 1.3 1.0 1.3 0.7
1. The geographic distribution of deaths in this table is based on the deceased’s usual place of residence.2. Starting in 2005, the population estimates used to calculate the mortality rates are presented in the Appendix II of the publication "Mortality Summary List of
Causes" (catalogue number 84F0209XIE).3. The cause of death tabulated is the underlying cause of death. This is defined as (a) the disease or injury which initiated the train of events leading directly to
death, or (b) the circumstances of the accident or violence which produced the fatal injury. The underlying cause is selected from the conditions listed onthe medical certificate of cause of death.
4. World Health Organization (WHO), International Statistical Classification of Diseases and Related Health Problems, Tenth Revision (ICD-10)5. National Center for Health Statistics, United States. "B" list in "Instruction Manual; Part 9; ICD-10 Cause-of-Death Lists for Tabulating Mortality Statistics".6. Other and unspecified infectious and parasitic diseases and their sequelae A00, A05, A20 to A36, A42 to A44, A48 to A49, A54 to A79, A81 to A82,
A85.0 to A85.1, A85.8, A86 to B04, B06 to B09, B25 to B49, B55 to B99.7. All other diseases (residual) D65 to E07, E15 to E34, E65 to F99, G04 to G12, G23 to G25, G31 to H93, K00 to K22, K29 to K31, K50 to K66, K71 to K72, K75 to
K76, K83 to M99, N13.0 to N13.5, N13.7 to N13.9, N14, N15.0, N15.8 to N15.9, N20 to N23, N28 to N39, N41 to N64, N80 to N98. As of 2003, also includes U04.8. Motor vehicle accidents V02 to V04, V09.0, V09.2, V12 to V14, V19.0 to V19.2, V19.4 to V19.6, V20 to V79, V80.3 to V80.5, V81.0 to V81.1, V82.0 to V82.1,
V83 to V86, V87.0 to V87.8, V88.0 to V88.8, V89.0, V89.2.9. Other land transport accidents V01, V05 to V06, V09.1, V09.3 to V09.9, V10 to V11, V15 to V18, V19.3, V19.8 to V19.9, V80.0 to V80.2, V80.6 to V80.9,
V81.2 to V81.9, V82.2 to V82.9, V87.9, V88.9, V89.1, V89.3, V89.9.Note(s): See Data quality, concepts and methodology — Explanatory notes for the tables section.Source(s): Statistics Canada, Canadian Vital Statistics, Birth and Death Databases (CANSIM table 102-0552) and Appendix II.
Statistics Canada – Catalogue no. 84F0209X 35

Mortality, Summary List of Causes – 2009
Table 1-9Deaths and mortality rate, by selected grouped causes, sex and geography — Saskatchewan1
Number of deaths Crude mortality rateper 100,000 population 2
Age-standardized mortality rateper 100,000 population 2
Bothsexes
Males Females Bothsexes
Males Females Bothsexes
Males Females
Total, all causes of death (A00-Y89) 3 , 4 , 5 8,972 4,577 4,395 871.6 895.0 848.6 573.9 712.8 460.1
Salmonella infections (A01-A02) 0 0 0 0.0 0.0 0.0 0.0 0.0 0.0Shigellosis and amoebiasis (A03, A06) 0 0 0 0.0 0.0 0.0 0.0 0.0 0.0Certain other intestinal infections (A04, A07-A09) 26 11 15 2.5 2.2 2.9 1.5 1.5 1.5Tuberculosis (A16-A19) 4 2 2 0.4 0.4 0.4 0.4 0.4 0.3Respiratory tuberculosis (A16) 3 1 2 0.3 0.2 0.4 0.2 0.1 0.3Other tuberculosis (A17-A19) 1 1 0 0.1 0.2 0.0 0.1 0.2 0.0Whooping cough (A37) 1 0 1 0.1 0.0 0.2 0.1 0.0 0.2Scarlet fever and erysipelas (A38, A46) 0 0 0 0.0 0.0 0.0 0.0 0.0 0.0Meningococcal infection (A39) 0 0 0 0.0 0.0 0.0 0.0 0.0 0.0Septicaemia (A40-A41) 79 37 42 7.7 7.2 8.1 5.3 5.8 5.2Syphilis (A50-A53) 0 0 0 0.0 0.0 0.0 0.0 0.0 0.0Acute poliomyelitis (A80) 0 0 0 0.0 0.0 0.0 0.0 0.0 0.0Arthropod-borne viral encephalitis (A83-A84, A85.2) 0 0 0 0.0 0.0 0.0 0.0 0.0 0.0Measles (B05) 0 0 0 0.0 0.0 0.0 0.0 0.0 0.0Viral hepatitis (B15-B19) 7 4 3 0.7 0.8 0.6 0.7 0.8 0.5Human immunodeficiency virus [HIV] disease (B20-B24) 20 10 10 1.9 2.0 1.9 2.0 2.1 1.9Malaria (B50-B54) 0 0 0 0.0 0.0 0.0 0.0 0.0 0.0Other and unspecified infectious and parasitic diseases and
their sequelae 6 22 13 9 2.1 2.5 1.7 1.8 2.4 1.3Malignant neoplasms (C00-C97) 2,214 1,191 1,023 215.1 232.9 197.5 155.9 188.0 131.2Malignant neoplasms of lip, oral cavity and pharynx
(C00-C14) 24 14 10 2.3 2.7 1.9 1.7 2.3 1.1Malignant neoplasm of oesophagus (C15) 55 40 15 5.3 7.8 2.9 4.3 6.7 2.0Malignant neoplasm of stomach (C16) 55 30 25 5.3 5.9 4.8 4.0 4.8 3.4Malignant neoplasms of colon, rectum and anus (C18-C21) 211 120 91 20.5 23.5 17.6 14.5 18.9 10.6Malignant neoplasm of liver and intrahepatic bile ducts (C22) 52 26 26 5.1 5.1 5.0 3.9 4.3 3.4Malignant neoplasm of pancreas (C25) 130 67 63 12.6 13.1 12.2 9.3 10.5 8.4Malignant neoplasm of larynx (C32) 9 9 0 0.9 1.8 0.0 0.7 1.5 0.0Malignant neoplasms of trachea, bronchus and lung
(C33-C34) 576 304 272 56.0 59.4 52.5 42.1 48.8 36.9Malignant melanoma of skin (C43) 24 14 10 2.3 2.7 1.9 1.7 2.2 1.3Malignant neoplasm of breast (C50) 139 1 138 13.5 0.2 26.6 9.5 0.1 17.7Malignant neoplasm of cervix uteri (C53) ... ... 27 ... ... 5.2 ... ... 4.1Malignant neoplasms of corpus uteri and uterus, part
unspecified (C54-C55) ... ... 18 ... ... 3.5 ... ... 2.6Malignant neoplasm of ovary (C56) ... ... 47 ... ... 9.1 ... ... 5.7Malignant neoplasm of prostate (C61) ... 176 ... ... 34.4 ... ... 26.3 ...Malignant neoplasms of kidney and renal pelvis (C64-C65) 54 36 18 5.2 7.0 3.5 4.0 5.6 2.6Malignant neoplasm of bladder (C67) 63 50 13 6.1 9.8 2.5 4.0 7.7 1.2Malignant neoplasms of meninges, brain and other parts of
central nervous system (C70-C72) 54 34 20 5.2 6.6 3.9 4.1 5.5 2.7Malignant neoplasms of lymphoid, haematopoietic and
related tissue (C81-C96) 217 122 95 21.1 23.9 18.3 15.5 19.7 11.9Hodgkin’s disease (C81) 1 1 0 0.1 0.2 0.0 0.1 0.2 0.0Non-Hodgkin’s lymphoma (C82-C85) 86 48 38 8.4 9.4 7.3 6.3 7.7 5.0Leukaemia (C91-C95) 81 49 32 7.9 9.6 6.2 5.8 8.0 3.9Multiple myeloma and immunoproliferative neoplasms (C88,
C90) 49 24 25 4.8 4.7 4.8 3.3 3.7 3.0Other and unspecified malignant neoplasms of lymphoid,
haematopoietic and related tissue (C96) 0 0 0 0.0 0.0 0.0 0.0 0.0 0.0All other and unspecified malignant neoplasms (C17,
C23-C24, C26-C31, C37-C41, C44-C49, C51-C52,C57-C60, C62-C63, C66, C68-C69, C73-C80, C97) 283 148 135 27.5 28.9 26.1 19.0 23.1 15.5
In situ neoplasms, benign neoplasms and neoplasms ofuncertain or unknown behaviour (D00-D48) 92 47 45 8.9 9.2 8.7 6.1 7.4 5.2
Anaemias (D50-D64) 25 13 12 2.4 2.5 2.3 1.4 1.9 1.1Diabetes mellitus (E10-E14) 329 175 154 32.0 34.2 29.7 20.7 26.9 15.8Nutritional deficiencies (E40-E64) 6 2 4 0.6 0.4 0.8 0.3 0.3 0.2Malnutrition (E40-E46) 5 1 4 0.5 0.2 0.8 0.2 0.2 0.2Other nutritional deficiencies (E50-E64) 1 1 0 0.1 0.2 0.0 0.1 0.1 0.0Meningitis (G00, G03) 2 0 2 0.2 0.0 0.4 0.1 0.0 0.2Parkinson’s disease (G20-G21) 56 32 24 5.4 6.3 4.6 3.3 4.6 2.4Alzheimer’s disease (G30) 184 62 122 17.9 12.1 23.6 9.1 8.4 9.5Major cardiovascular diseases (I00-I78) 2,740 1,386 1,354 266.2 271.0 261.4 159.0 207.2 120.4Diseases of heart (I00-I09, I11, I13, I20-I51) 2,010 1,069 941 195.3 209.0 181.7 118.7 161.3 84.1Acute rheumatic fever and chronic rheumatic heart diseases
(I00-I09) 16 7 9 1.6 1.4 1.7 1.2 1.1 1.2Hypertensive heart disease (I11) 45 14 31 4.4 2.7 6.0 2.1 2.0 2.0Hypertensive heart and renal disease (I13) 2 0 2 0.2 0.0 0.4 0.1 0.0 0.1Ischaemic heart diseases (I20-I25) 1,300 774 526 126.3 151.4 101.6 79.7 117.6 49.2Acute myocardial infarction (I21-I22) 432 246 186 42.0 48.1 35.9 26.2 37.1 17.6Other acute ischaemic heart diseases (I24) 21 10 11 2.0 2.0 2.1 1.3 1.6 0.8Other forms of chronic ischaemic heart disease (I20, I25) 847 518 329 82.3 101.3 63.5 52.3 78.8 30.7
See notes at the end of the table.
36 Statistics Canada – Catalogue no. 84F0209X

Mortality, Summary List of Causes – 2009
Table 1-9 – continued
Deaths and mortality rate, by selected grouped causes, sex and geography — Saskatchewan1
Number of deaths Crude mortality rateper 100,000 population 2
Age-standardized mortality rateper 100,000 population 2
Bothsexes
Males Females Bothsexes
Males Females Bothsexes
Males Females
Atherosclerotic cardiovascular disease, so described (I25.0) 235 158 77 22.8 30.9 14.9 16.6 25.3 9.0All other forms of chronic ischaemic heart disease (I20,
I25.1-I25.9) 612 360 252 59.5 70.4 48.7 35.7 53.6 21.8Other heart diseases (I26-I51) 647 274 373 62.9 53.6 72.0 35.6 40.6 31.6Acute and subacute endocarditis (I33) 6 4 2 0.6 0.8 0.4 0.5 0.7 0.3Diseases of pericardium and acute myocarditis (I30-I31, I40) 3 2 1 0.3 0.4 0.2 0.2 0.3 0.1Heart failure (I50) 312 109 203 30.3 21.3 39.2 15.3 15.4 15.2All other forms of heart disease (I26-I28, I34-I38, I42-I49,
I51) 326 159 167 31.7 31.1 32.2 19.6 24.2 16.0Essential hypertension and hypertensive renal disease (I10,
I12, I15) 102 44 58 9.9 8.6 11.2 5.2 6.5 4.2Cerebrovascular diseases (I60-I69) 533 223 310 51.8 43.6 59.9 29.6 32.1 27.9Atherosclerosis (I70) 29 10 19 2.8 2.0 3.7 1.6 1.5 1.6Other diseases of circulatory system (I71-I78) 66 40 26 6.4 7.8 5.0 3.9 5.9 2.6Aortic aneurysm and dissection (I71) 34 23 11 3.3 4.5 2.1 2.2 3.5 1.2Other diseases of arteries, arterioles and capillaries (I72-I78) 32 17 15 3.1 3.3 2.9 1.7 2.3 1.4Other disorders of circulatory system (I80-I99) 9 5 4 0.9 1.0 0.8 0.7 0.8 0.5Influenza and pneumonia (J09-J18) 251 111 140 24.4 21.7 27.0 13.4 16.0 11.2Influenza (J09-J11) 15 8 7 1.5 1.6 1.4 1.1 1.4 0.8Pneumonia (J12-J18) 236 103 133 22.9 20.1 25.7 12.3 14.7 10.4Other acute lower respiratory infections (J20-J22) 10 2 8 1.0 0.4 1.5 0.5 0.3 0.6Acute bronchitis and bronchiolitis (J20-J21) 1 1 0 0.1 0.2 0.0 0.1 0.2 0.0Unspecified acute lower respiratory infection (J22) 9 1 8 0.9 0.2 1.5 0.4 0.1 0.6Chronic lower respiratory diseases (J40-J47) 365 185 180 35.5 36.2 34.8 22.5 27.1 20.1Bronchitis, chronic and unspecified (J40-J42) 1 0 1 0.1 0.0 0.2 0.1 0.0 0.1Emphysema (J43) 19 10 9 1.8 2.0 1.7 1.3 1.6 1.1Asthma (J45-J46) 6 4 2 0.6 0.8 0.4 0.4 0.6 0.4Other chronic lower respiratory diseases (J44, J47) 339 171 168 32.9 33.4 32.4 20.7 25.0 18.4Pneumoconioses and chemical effects (J60-J66, J68) 0 0 0 0.0 0.0 0.0 0.0 0.0 0.0Pneumonitis due to solids and liquids (J69) 42 23 19 4.1 4.5 3.7 2.5 3.4 1.8Other diseases of respiratory system (J00-J06, J30-J39,
J67, J70-J98) 106 52 54 10.3 10.2 10.4 6.8 8.2 5.6Peptic ulcer (K25-K28) 18 12 6 1.7 2.3 1.2 1.1 1.7 0.6Diseases of appendix (K35-K38) 2 0 2 0.2 0.0 0.4 0.1 0.0 0.2Hernia (K40-K46) 14 7 7 1.4 1.4 1.4 0.6 0.9 0.4Chronic liver disease and cirrhosis (K70, K73-K74) 80 52 28 7.8 10.2 5.4 6.4 8.4 4.7Alcoholic liver disease (K70) 37 27 10 3.6 5.3 1.9 3.2 4.6 1.9Other chronic liver disease and cirrhosis (K73-K74) 43 25 18 4.2 4.9 3.5 3.2 3.8 2.8Cholelithiasis and other disorders of gallbladder (K80-K82) 10 6 4 1.0 1.2 0.8 0.6 0.9 0.4Nephritis, nephrotic syndrome and nephrosis (N00-N07,
N17-N19, N25-N27) 188 99 89 18.3 19.4 17.2 10.9 14.3 8.6Acute and rapidly progressive nephritic and nephrotic
syndrome (N00-N01, N04) 0 0 0 0.0 0.0 0.0 0.0 0.0 0.0Chronic glomerulonephritis, nephritis and nephropathy
not specified as acute or chronic, and renal sclerosisunspecified (N02-N03, N05-N07, N26) 5 4 1 0.5 0.8 0.2 0.3 0.6 0.1
Renal failure (N17-N19) 183 95 88 17.8 18.6 17.0 10.6 13.7 8.5Other disorders of kidney (N25, N27) 0 0 0 0.0 0.0 0.0 0.0 0.0 0.0Infections of kidney (N10-N12, N13.6, N15.1) 5 1 4 0.5 0.2 0.8 0.2 0.1 0.4Hyperplasia of prostate (N40) ... 4 ... ... 0.8 ... ... 0.6 ...Inflammatory diseases of female pelvic organs (N70-N76) ... ... 0 ... ... 0.0 ... ... 0.0Pregnancy, childbirth and the puerperium (O00-O99) ... ... 1 ... ... 0.2 ... ... 0.3Pregnancy with abortive outcome (O00-O07) ... ... 0 ... ... 0.0 ... ... 0.0Other complications of pregnancy, childbirth and the
puerperium (O10-O99) ... ... 1 ... ... 0.2 ... ... 0.3Certain conditions originating in the perinatal period
(P00-P96) 34 16 18 3.3 3.1 3.5 3.4 3.2 3.7Congenital malformations, deformations and chromosomal
abnormalities (Q00-Q99) 37 14 23 3.6 2.7 4.4 3.4 2.4 4.4Symptoms, signs and abnormal clinical and laboratory
findings, not elsewhere classified (R00-R99) 153 61 92 14.9 11.9 17.8 8.3 9.5 7.1All other diseases (residual) 7 1,109 471 638 107.7 92.1 123.2 64.2 71.1 57.3Accidents (unintentional injuries) (V01-X59, Y85-Y86) 499 302 197 48.5 59.1 38.0 38.2 52.8 24.8Transport accidents (V01-V99, Y85) 165 109 56 16.0 21.3 10.8 15.5 20.1 11.1Motor vehicle accidents 8 152 97 55 14.8 19.0 10.6 14.5 18.1 10.9Other land transport accidents 9 3 2 1 0.3 0.4 0.2 0.3 0.4 0.2Water, air and space, and other and unspecified transport
accidents and their sequelae (V90-V99, Y85) 10 10 0 1.0 2.0 0.0 0.7 1.5 0.0Nontransport accidents (W00-X59, Y86) 334 193 141 32.4 37.7 27.2 22.7 32.7 13.6Falls (W00-W19) 183 96 87 17.8 18.8 16.8 10.1 14.3 6.8Accidental discharge of firearms (W32-W34) 0 0 0 0.0 0.0 0.0 0.0 0.0 0.0Accidental drowning and submersion (W65-W74) 4 3 1 0.4 0.6 0.2 0.3 0.5 0.1Accidental exposure to smoke, fire and flames (X00-X09) 7 6 1 0.7 1.2 0.2 0.6 1.0 0.3Accidental poisoning and exposure to noxious substances
(X40-X49) 58 40 18 5.6 7.8 3.5 6.1 8.7 3.4
See notes at the end of the table.
Statistics Canada – Catalogue no. 84F0209X 37

Mortality, Summary List of Causes – 2009
Table 1-9 – continued
Deaths and mortality rate, by selected grouped causes, sex and geography — Saskatchewan1
Number of deaths Crude mortality rateper 100,000 population 2
Age-standardized mortality rateper 100,000 population 2
Bothsexes
Males Females Bothsexes
Males Females Bothsexes
Males Females
Other and unspecified nontransport accidents and theirsequelae (W20-W31, W35-W64, W75-W99, X10-X39,X50-X59, Y86) 82 48 34 8.0 9.4 6.6 5.6 8.2 3.0
Intentional self-harm (suicide) (X60-X84, Y87.0) 156 122 34 15.2 23.9 6.6 15.5 24.4 6.6Intentional self-harm (suicide) by discharge of firearms
(X72-X74) 39 37 2 3.8 7.2 0.4 3.6 6.8 0.5Intentional self-harm (suicide) by other and unspecified
means and their sequelae (X60-X71, X75-X84, Y87.0) 117 85 32 11.4 16.6 6.2 11.9 17.7 6.1Assault (homicide) (X85-Y09, Y87.1) 39 32 7 3.8 6.3 1.4 3.9 6.5 1.3Assault (homicide) by discharge of firearms (X93-X95) 4 2 2 0.4 0.4 0.4 0.3 0.4 0.3Assault (homicide) by other and unspecified means and
their sequelae (X85-X92, X96-Y09, Y87.1) 35 30 5 3.4 5.9 1.0 3.6 6.2 1.0Legal intervention (Y35, Y89.0) 0 0 0 0.0 0.0 0.0 0.0 0.0 0.0Events of undetermined intent (Y10-Y34, Y87.2, Y89.9) 9 7 2 0.9 1.4 0.4 0.8 1.3 0.4Discharge of firearms, undetermined intent (Y22-Y24) 0 0 0 0.0 0.0 0.0 0.0 0.0 0.0Other and unspecified events of undetermined intent and
their sequelae (Y10-Y21, Y25-Y34, Y87.2, Y89.9) 9 7 2 0.9 1.4 0.4 0.8 1.3 0.4Operations of war and their sequelae (Y36, Y89.1) 0 0 0 0.0 0.0 0.0 0.0 0.0 0.0Complications of medical and surgical care (Y40-Y84, Y88) 24 8 16 2.3 1.6 3.1 1.6 1.1 2.1
1. The geographic distribution of deaths in this table is based on the deceased’s usual place of residence.2. Starting in 2005, the population estimates used to calculate the mortality rates are presented in the Appendix II of the publication "Mortality Summary List of
Causes" (catalogue number 84F0209XIE).3. The cause of death tabulated is the underlying cause of death. This is defined as (a) the disease or injury which initiated the train of events leading directly to
death, or (b) the circumstances of the accident or violence which produced the fatal injury. The underlying cause is selected from the conditions listed onthe medical certificate of cause of death.
4. World Health Organization (WHO), International Statistical Classification of Diseases and Related Health Problems, Tenth Revision (ICD-10)5. National Center for Health Statistics, United States. "B" list in "Instruction Manual; Part 9; ICD-10 Cause-of-Death Lists for Tabulating Mortality Statistics".6. Other and unspecified infectious and parasitic diseases and their sequelae A00, A05, A20 to A36, A42 to A44, A48 to A49, A54 to A79, A81 to A82,
A85.0 to A85.1, A85.8, A86 to B04, B06 to B09, B25 to B49, B55 to B99.7. All other diseases (residual) D65 to E07, E15 to E34, E65 to F99, G04 to G12, G23 to G25, G31 to H93, K00 to K22, K29 to K31, K50 to K66, K71 to K72, K75 to
K76, K83 to M99, N13.0 to N13.5, N13.7 to N13.9, N14, N15.0, N15.8 to N15.9, N20 to N23, N28 to N39, N41 to N64, N80 to N98. As of 2003, also includes U04.8. Motor vehicle accidents V02 to V04, V09.0, V09.2, V12 to V14, V19.0 to V19.2, V19.4 to V19.6, V20 to V79, V80.3 to V80.5, V81.0 to V81.1, V82.0 to V82.1,
V83 to V86, V87.0 to V87.8, V88.0 to V88.8, V89.0, V89.2.9. Other land transport accidents V01, V05 to V06, V09.1, V09.3 to V09.9, V10 to V11, V15 to V18, V19.3, V19.8 to V19.9, V80.0 to V80.2, V80.6 to V80.9,
V81.2 to V81.9, V82.2 to V82.9, V87.9, V88.9, V89.1, V89.3, V89.9.Note(s): See Data quality, concepts and methodology — Explanatory notes for the tables section.Source(s): Statistics Canada, Canadian Vital Statistics, Birth and Death Databases (CANSIM table 102-0552) and Appendix II.
38 Statistics Canada – Catalogue no. 84F0209X

Mortality, Summary List of Causes – 2009
Table 1-10Deaths and mortality rate, by selected grouped causes, sex and geography — Alberta1
Number of deaths Crude mortality rateper 100,000 population 2
Age-standardized mortality rateper 100,000 population 2
Bothsexes
Males Females Bothsexes
Males Females Bothsexes
Males Females
Total, all causes of death (A00-Y89) 3 , 4 , 5 20,987 10,975 10,012 571.6 585.1 557.5 527.2 642.7 431.3
Salmonella infections (A01-A02) 0 0 0 0.0 0.0 0.0 0.0 0.0 0.0Shigellosis and amoebiasis (A03, A06) 2 1 1 0.1 0.1 0.1 0.1 0.1 0.1Certain other intestinal infections (A04, A07-A09) 67 27 40 1.8 1.4 2.2 1.7 1.6 1.8Tuberculosis (A16-A19) 5 4 1 0.1 0.2 0.1 0.1 0.2 0.1Respiratory tuberculosis (A16) 3 3 0 0.1 0.2 0.0 0.1 0.2 0.0Other tuberculosis (A17-A19) 2 1 1 0.1 0.1 0.1 0.1 0.0 0.1Whooping cough (A37) 0 0 0 0.0 0.0 0.0 0.0 0.0 0.0Scarlet fever and erysipelas (A38, A46) 0 0 0 0.0 0.0 0.0 0.0 0.0 0.0Meningococcal infection (A39) 1 1 0 0.0 0.1 0.0 0.0 0.1 0.0Septicaemia (A40-A41) 185 87 98 5.0 4.6 5.5 4.7 5.4 4.4Syphilis (A50-A53) 1 0 1 0.0 0.0 0.1 0.0 0.0 0.0Acute poliomyelitis (A80) 0 0 0 0.0 0.0 0.0 0.0 0.0 0.0Arthropod-borne viral encephalitis (A83-A84, A85.2) 0 0 0 0.0 0.0 0.0 0.0 0.0 0.0Measles (B05) 0 0 0 0.0 0.0 0.0 0.0 0.0 0.0Viral hepatitis (B15-B19) 38 28 10 1.0 1.5 0.6 0.9 1.3 0.4Human immunodeficiency virus [HIV] disease (B20-B24) 27 19 8 0.7 1.0 0.4 0.7 0.9 0.4Malaria (B50-B54) 0 0 0 0.0 0.0 0.0 0.0 0.0 0.0Other and unspecified infectious and parasitic diseases
and their sequelae 6 50 24 26 1.4 1.3 1.4 1.3 1.3 1.2Malignant neoplasms (C00-C97) 5,772 3,096 2,676 157.2 165.1 149.0 152.0 182.1 129.7Malignant neoplasms of lip, oral cavity and pharynx
(C00-C14) 93 60 33 2.5 3.2 1.8 2.4 3.3 1.6Malignant neoplasm of oesophagus (C15) 154 116 38 4.2 6.2 2.1 4.0 6.4 1.8Malignant neoplasm of stomach (C16) 147 91 56 4.0 4.9 3.1 3.8 5.2 2.6Malignant neoplasms of colon, rectum and anus (C18-C21) 602 350 252 16.4 18.7 14.0 15.8 20.7 11.8Malignant neoplasm of liver and intrahepatic bile ducts
(C22) 166 99 67 4.5 5.3 3.7 4.4 5.6 3.4Malignant neoplasm of pancreas (C25) 336 165 171 9.2 8.8 9.5 8.8 9.6 8.2Malignant neoplasm of larynx (C32) 21 17 4 0.6 0.9 0.2 0.6 1.1 0.2Malignant neoplasms of trachea, bronchus and lung
(C33-C34) 1,449 794 655 39.5 42.3 36.5 39.2 47.1 33.0Malignant melanoma of skin (C43) 84 53 31 2.3 2.8 1.7 2.1 2.8 1.4Malignant neoplasm of breast (C50) 405 2 403 11.0 0.1 22.4 10.3 0.1 19.2Malignant neoplasm of cervix uteri (C53) ... ... 42 ... ... 2.3 ... ... 2.1Malignant neoplasms of corpus uteri and uterus, part
unspecified (C54-C55) ... ... 60 ... ... 3.3 ... ... 2.7Malignant neoplasm of ovary (C56) ... ... 136 ... ... 7.6 ... ... 6.8Malignant neoplasm of prostate (C61) ... 365 ... ... 19.5 ... ... 22.7 ...Malignant neoplasms of kidney and renal pelvis (C64-C65) 145 97 48 3.9 5.2 2.7 3.8 5.5 2.2Malignant neoplasm of bladder (C67) 135 102 33 3.7 5.4 1.8 3.5 6.2 1.5Malignant neoplasms of meninges, brain and other parts
of central nervous system (C70-C72) 158 95 63 4.3 5.1 3.5 4.2 5.3 3.3Malignant neoplasms of lymphoid, haematopoietic and
related tissue (C81-C96) 565 311 254 15.4 16.6 14.1 15.1 18.6 12.2Hodgkin’s disease (C81) 12 6 6 0.3 0.3 0.3 0.3 0.4 0.3Non-Hodgkin’s lymphoma (C82-C85) 200 104 96 5.4 5.5 5.3 5.3 6.2 4.5Leukaemia (C91-C95) 223 126 97 6.1 6.7 5.4 6.0 7.6 4.7Multiple myeloma and immunoproliferative neoplasms
(C88, C90) 129 74 55 3.5 3.9 3.1 3.5 4.4 2.8Other and unspecified malignant neoplasms of lymphoid,
haematopoietic and related tissue (C96) 1 1 0 0.0 0.1 0.0 0.0 0.1 0.0All other and unspecified malignant neoplasms (C17,
C23-C24, C26-C31, C37-C41, C44-C49, C51-C52,C57-C60, C62-C63, C66, C68-C69, C73-C80, C97) 709 379 330 19.3 20.2 18.4 18.4 22.3 15.6
In situ neoplasms, benign neoplasms and neoplasms ofuncertain or unknown behaviour (D00-D48) 150 79 71 4.1 4.2 4.0 3.8 4.7 3.4
Anaemias (D50-D64) 39 22 17 1.1 1.2 0.9 1.0 1.4 0.8Diabetes mellitus (E10-E14) 406 217 189 11.1 11.6 10.5 10.3 13.0 8.2Nutritional deficiencies (E40-E64) 18 5 13 0.5 0.3 0.7 0.4 0.3 0.5Malnutrition (E40-E46) 14 4 10 0.4 0.2 0.6 0.3 0.2 0.4Other nutritional deficiencies (E50-E64) 4 1 3 0.1 0.1 0.2 0.1 0.1 0.1Meningitis (G00, G03) 6 4 2 0.2 0.2 0.1 0.2 0.2 0.1Parkinson’s disease (G20-G21) 114 69 45 3.1 3.7 2.5 2.9 4.4 1.8Alzheimer’s disease (G30) 400 137 263 10.9 7.3 14.6 9.3 8.6 9.5Major cardiovascular diseases (I00-I78) 6,598 3,358 3,240 179.7 179.0 180.4 160.7 201.2 126.6Diseases of heart (I00-I09, I11, I13, I20-I51) 4,908 2,636 2,272 133.7 140.5 126.5 120.2 157.0 90.1Acute rheumatic fever and chronic rheumatic heart
diseases (I00-I09) 29 9 20 0.8 0.5 1.1 0.8 0.6 0.9Hypertensive heart disease (I11) 81 36 45 2.2 1.9 2.5 1.9 2.0 1.7Hypertensive heart and renal disease (I13) 11 2 9 0.3 0.1 0.5 0.3 0.1 0.3Ischaemic heart diseases (I20-I25) 3,804 2,170 1,634 103.6 115.7 91.0 93.6 128.6 65.3Acute myocardial infarction (I21-I22) 1,098 623 475 29.9 33.2 26.4 27.0 37.4 18.8Other acute ischaemic heart diseases (I24) 33 18 15 0.9 1.0 0.8 0.8 1.1 0.5
See notes at the end of the table.
Statistics Canada – Catalogue no. 84F0209X 39

Mortality, Summary List of Causes – 2009
Table 1-10 – continued
Deaths and mortality rate, by selected grouped causes, sex and geography — Alberta1
Number of deaths Crude mortality rateper 100,000 population 2
Age-standardized mortality rateper 100,000 population 2
Bothsexes
Males Females Bothsexes
Males Females Bothsexes
Males Females
Other forms of chronic ischaemic heart disease (I20,I25) 2,673 1,529 1,144 72.8 81.5 63.7 65.8 90.1 45.9
Atherosclerotic cardiovascular disease, so described(I25.0) 840 513 327 22.9 27.4 18.2 21.5 29.4 14.6
All other forms of chronic ischaemic heart disease (I20,I25.1-I25.9) 1,833 1,016 817 49.9 54.2 45.5 44.3 60.8 31.4
Other heart diseases (I26-I51) 983 419 564 26.8 22.3 31.4 23.6 25.7 21.9Acute and subacute endocarditis (I33) 12 5 7 0.3 0.3 0.4 0.3 0.2 0.3Diseases of pericardium and acute myocarditis (I30-I31,
I40) 7 2 5 0.2 0.1 0.3 0.2 0.1 0.3Heart failure (I50) 380 135 245 10.3 7.2 13.6 8.7 8.6 8.9All other forms of heart disease (I26-I28, I34-I38, I42-I49,
I51) 584 277 307 15.9 14.8 17.1 14.4 16.8 12.4Essential hypertension and hypertensive renal disease
(I10, I12, I15) 149 55 94 4.1 2.9 5.2 3.5 3.4 3.4Cerebrovascular diseases (I60-I69) 1,171 492 679 31.9 26.2 37.8 28.1 30.2 25.9Atherosclerosis (I70) 185 66 119 5.0 3.5 6.6 4.2 4.1 4.0Other diseases of circulatory system (I71-I78) 185 109 76 5.0 5.8 4.2 4.7 6.5 3.2Aortic aneurysm and dissection (I71) 129 91 38 3.5 4.9 2.1 3.3 5.5 1.5Other diseases of arteries, arterioles and capillaries
(I72-I78) 56 18 38 1.5 1.0 2.1 1.4 1.1 1.6Other disorders of circulatory system (I80-I99) 32 16 16 0.9 0.9 0.9 0.8 0.9 0.6Influenza and pneumonia (J09-J18) 471 223 248 12.8 11.9 13.8 11.3 13.4 9.8Influenza (J09-J11) 68 26 42 1.9 1.4 2.3 1.7 1.4 2.0Pneumonia (J12-J18) 403 197 206 11.0 10.5 11.5 9.6 12.0 7.9Other acute lower respiratory infections (J20-J22) 1 0 1 0.0 0.0 0.1 0.0 0.0 0.0Acute bronchitis and bronchiolitis (J20-J21) 0 0 0 0.0 0.0 0.0 0.0 0.0 0.0Unspecified acute lower respiratory infection (J22) 1 0 1 0.0 0.0 0.1 0.0 0.0 0.0Chronic lower respiratory diseases (J40-J47) 925 492 433 25.2 26.2 24.1 23.9 30.8 19.4Bronchitis, chronic and unspecified (J40-J42) 5 3 2 0.1 0.2 0.1 0.1 0.2 0.1Emphysema (J43) 59 33 26 1.6 1.8 1.4 1.6 2.0 1.4Asthma (J45-J46) 20 7 13 0.5 0.4 0.7 0.5 0.4 0.6Other chronic lower respiratory diseases (J44, J47) 841 449 392 22.9 23.9 21.8 21.7 28.2 17.4Pneumoconioses and chemical effects (J60-J66, J68) 17 11 6 0.5 0.6 0.3 0.4 0.6 0.3Pneumonitis due to solids and liquids (J69) 205 113 92 5.6 6.0 5.1 4.9 7.1 3.4Other diseases of respiratory system (J00-J06, J30-J39,
J67, J70-J98) 232 133 99 6.3 7.1 5.5 5.9 8.0 4.2Peptic ulcer (K25-K28) 43 21 22 1.2 1.1 1.2 1.1 1.2 0.9Diseases of appendix (K35-K38) 5 3 2 0.1 0.2 0.1 0.2 0.2 0.1Hernia (K40-K46) 22 12 10 0.6 0.6 0.6 0.6 0.8 0.4Chronic liver disease and cirrhosis (K70, K73-K74) 238 148 90 6.5 7.9 5.0 5.9 7.5 4.5Alcoholic liver disease (K70) 130 91 39 3.5 4.9 2.2 3.1 4.4 1.9Other chronic liver disease and cirrhosis (K73-K74) 108 57 51 2.9 3.0 2.8 2.8 3.1 2.6Cholelithiasis and other disorders of gallbladder (K80-K82) 25 9 16 0.7 0.5 0.9 0.6 0.6 0.6Nephritis, nephrotic syndrome and nephrosis
(N00-N07, N17-N19, N25-N27) 303 142 161 8.3 7.6 9.0 7.2 8.8 6.2Acute and rapidly progressive nephritic and nephrotic
syndrome (N00-N01, N04) 2 2 0 0.1 0.1 0.0 0.0 0.1 0.0Chronic glomerulonephritis, nephritis and nephropathy
not specified as acute or chronic, and renal sclerosisunspecified (N02-N03, N05-N07, N26) 12 9 3 0.3 0.5 0.2 0.3 0.6 0.1
Renal failure (N17-N19) 288 131 157 7.8 7.0 8.7 6.8 8.1 6.0Other disorders of kidney (N25, N27) 1 0 1 0.0 0.0 0.1 0.0 0.0 0.1Infections of kidney (N10-N12, N13.6, N15.1) 4 1 3 0.1 0.1 0.2 0.1 0.1 0.1Hyperplasia of prostate (N40) ... 6 ... ... 0.3 ... ... 0.4 ...Inflammatory diseases of female pelvic organs (N70-N76) ... ... 3 ... ... 0.2 ... ... 0.2Pregnancy, childbirth and the puerperium (O00-O99) ... ... 5 ... ... 0.3 ... ... 0.3Pregnancy with abortive outcome (O00-O07) ... ... 1 ... ... 0.1 ... ... 0.1Other complications of pregnancy, childbirth and the
puerperium (O10-O99) ... ... 4 ... ... 0.2 ... ... 0.2Certain conditions originating in the perinatal period
(P00-P96) 169 90 79 4.6 4.8 4.4 4.7 4.8 4.5Congenital malformations, deformations and chromosomal
abnormalities (Q00-Q99) 106 53 53 2.9 2.8 3.0 2.8 2.8 2.8Symptoms, signs and abnormal clinical and laboratory
findings, not elsewhere classified (R00-R99) 162 75 87 4.4 4.0 4.8 3.9 4.0 3.4All other diseases (residual) 7 2,300 978 1,322 62.6 52.1 73.6 55.6 58.0 52.7Accidents (unintentional injuries) (V01-X59, Y85-Y86) 900 596 304 24.5 31.8 16.9 23.2 32.5 14.2Transport accidents (V01-V99, Y85) 400 295 105 10.9 15.7 5.8 10.7 15.4 5.7Motor vehicle accidents 8 363 269 94 9.9 14.3 5.2 9.8 14.1 5.2Other land transport accidents 9 7 4 3 0.2 0.2 0.2 0.2 0.2 0.2Water, air and space, and other and unspecified transport
accidents and their sequelae (V90-V99, Y85) 30 22 8 0.8 1.2 0.4 0.8 1.1 0.4Nontransport accidents (W00-X59, Y86) 500 301 199 13.6 16.0 11.1 12.5 17.1 8.4Falls (W00-W19) 180 104 76 4.9 5.5 4.2 4.4 6.2 3.1
See notes at the end of the table.
40 Statistics Canada – Catalogue no. 84F0209X

Mortality, Summary List of Causes – 2009
Table 1-10 – continued
Deaths and mortality rate, by selected grouped causes, sex and geography — Alberta1
Number of deaths Crude mortality rateper 100,000 population 2
Age-standardized mortality rateper 100,000 population 2
Bothsexes
Males Females Bothsexes
Males Females Bothsexes
Males Females
Accidental discharge of firearms (W32-W34) 4 4 0 0.1 0.2 0.0 0.1 0.2 0.0Accidental drowning and submersion (W65-W74) 17 12 5 0.5 0.6 0.3 0.5 0.6 0.3Accidental exposure to smoke, fire and flames (X00-X09) 21 11 10 0.6 0.6 0.6 0.6 0.6 0.5Accidental poisoning and exposure to noxious substances
(X40-X49) 40 26 14 1.1 1.4 0.8 1.0 1.3 0.6Other and unspecified nontransport accidents and their
sequelae (W20-W31, W35-W64, W75-W99, X10-X39,X50-X59, Y86) 238 144 94 6.5 7.7 5.2 5.9 8.2 3.8
Intentional self-harm (suicide) (X60-X84, Y87.0) 480 378 102 13.1 20.2 5.7 12.2 18.8 5.3Intentional self-harm (suicide) by discharge of firearms
(X72-X74) 70 69 1 1.9 3.7 0.1 1.8 3.5 0.1Intentional self-harm (suicide) by other and unspecified
means and their sequelae (X60-X71, X75-X84, Y87.0) 410 309 101 11.2 16.5 5.6 10.4 15.4 5.2Assault (homicide) (X85-Y09, Y87.1) 88 68 20 2.4 3.6 1.1 2.4 3.5 1.1Assault (homicide) by discharge of firearms (X93-X95) 26 20 6 0.7 1.1 0.3 0.7 1.1 0.3Assault (homicide) by other and unspecified means and
their sequelae (X85-X92, X96-Y09, Y87.1) 62 48 14 1.7 2.6 0.8 1.7 2.5 0.8Legal intervention (Y35, Y89.0) 3 3 0 0.1 0.2 0.0 0.1 0.2 0.0Events of undetermined intent (Y10-Y34, Y87.2, Y89.9) 345 220 125 9.4 11.7 7.0 8.7 10.7 6.5Discharge of firearms, undetermined intent (Y22-Y24) 1 1 0 0.0 0.1 0.0 0.0 0.0 0.0Other and unspecified events of undetermined intent and
their sequelae (Y10-Y21, Y25-Y34, Y87.2, Y89.9) 344 219 125 9.4 11.7 7.0 8.6 10.6 6.5Operations of war and their sequelae (Y36, Y89.1) 0 0 0 0.0 0.0 0.0 0.0 0.0 0.0Complications of medical and surgical care (Y40-Y84, Y88) 18 6 12 0.5 0.3 0.7 0.5 0.4 0.5
1. The geographic distribution of deaths in this table is based on the deceased’s usual place of residence.2. Starting in 2005, the population estimates used to calculate the mortality rates are presented in the Appendix II of the publication "Mortality Summary List of
Causes" (catalogue number 84F0209XIE).3. The cause of death tabulated is the underlying cause of death. This is defined as (a) the disease or injury which initiated the train of events leading directly to
death, or (b) the circumstances of the accident or violence which produced the fatal injury. The underlying cause is selected from the conditions listed onthe medical certificate of cause of death.
4. World Health Organization (WHO), International Statistical Classification of Diseases and Related Health Problems, Tenth Revision (ICD-10)5. National Center for Health Statistics, United States. "B" list in "Instruction Manual; Part 9; ICD-10 Cause-of-Death Lists for Tabulating Mortality Statistics".6. Other and unspecified infectious and parasitic diseases and their sequelae A00, A05, A20 to A36, A42 to A44, A48 to A49, A54 to A79, A81 to A82,
A85.0 to A85.1, A85.8, A86 to B04, B06 to B09, B25 to B49, B55 to B99.7. All other diseases (residual) D65 to E07, E15 to E34, E65 to F99, G04 to G12, G23 to G25, G31 to H93, K00 to K22, K29 to K31, K50 to K66, K71 to K72, K75 to
K76, K83 to M99, N13.0 to N13.5, N13.7 to N13.9, N14, N15.0, N15.8 to N15.9, N20 to N23, N28 to N39, N41 to N64, N80 to N98. As of 2003, also includes U04.8. Motor vehicle accidents V02 to V04, V09.0, V09.2, V12 to V14, V19.0 to V19.2, V19.4 to V19.6, V20 to V79, V80.3 to V80.5, V81.0 to V81.1, V82.0 to V82.1,
V83 to V86, V87.0 to V87.8, V88.0 to V88.8, V89.0, V89.2.9. Other land transport accidents V01, V05 to V06, V09.1, V09.3 to V09.9, V10 to V11, V15 to V18, V19.3, V19.8 to V19.9, V80.0 to V80.2, V80.6 to V80.9,
V81.2 to V81.9, V82.2 to V82.9, V87.9, V88.9, V89.1, V89.3, V89.9.Note(s): See Data quality, concepts and methodology — Explanatory notes for the tables section.Source(s): Statistics Canada, Canadian Vital Statistics, Birth and Death Databases (CANSIM table 102-0552) and Appendix II.
Statistics Canada – Catalogue no. 84F0209X 41
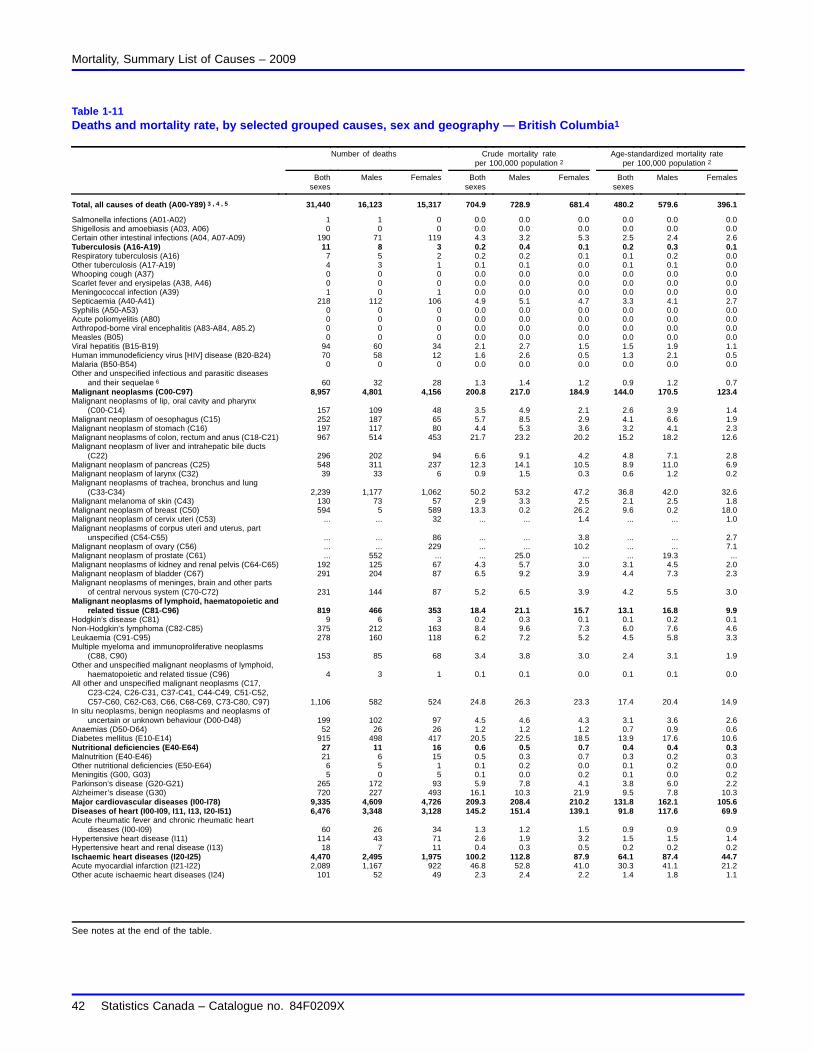
Mortality, Summary List of Causes – 2009
Table 1-11Deaths and mortality rate, by selected grouped causes, sex and geography — British Columbia1
Number of deaths Crude mortality rateper 100,000 population 2
Age-standardized mortality rateper 100,000 population 2
Bothsexes
Males Females Bothsexes
Males Females Bothsexes
Males Females
Total, all causes of death (A00-Y89) 3 , 4 , 5 31,440 16,123 15,317 704.9 728.9 681.4 480.2 579.6 396.1
Salmonella infections (A01-A02) 1 1 0 0.0 0.0 0.0 0.0 0.0 0.0Shigellosis and amoebiasis (A03, A06) 0 0 0 0.0 0.0 0.0 0.0 0.0 0.0Certain other intestinal infections (A04, A07-A09) 190 71 119 4.3 3.2 5.3 2.5 2.4 2.6Tuberculosis (A16-A19) 11 8 3 0.2 0.4 0.1 0.2 0.3 0.1Respiratory tuberculosis (A16) 7 5 2 0.2 0.2 0.1 0.1 0.2 0.0Other tuberculosis (A17-A19) 4 3 1 0.1 0.1 0.0 0.1 0.1 0.0Whooping cough (A37) 0 0 0 0.0 0.0 0.0 0.0 0.0 0.0Scarlet fever and erysipelas (A38, A46) 0 0 0 0.0 0.0 0.0 0.0 0.0 0.0Meningococcal infection (A39) 1 0 1 0.0 0.0 0.0 0.0 0.0 0.0Septicaemia (A40-A41) 218 112 106 4.9 5.1 4.7 3.3 4.1 2.7Syphilis (A50-A53) 0 0 0 0.0 0.0 0.0 0.0 0.0 0.0Acute poliomyelitis (A80) 0 0 0 0.0 0.0 0.0 0.0 0.0 0.0Arthropod-borne viral encephalitis (A83-A84, A85.2) 0 0 0 0.0 0.0 0.0 0.0 0.0 0.0Measles (B05) 0 0 0 0.0 0.0 0.0 0.0 0.0 0.0Viral hepatitis (B15-B19) 94 60 34 2.1 2.7 1.5 1.5 1.9 1.1Human immunodeficiency virus [HIV] disease (B20-B24) 70 58 12 1.6 2.6 0.5 1.3 2.1 0.5Malaria (B50-B54) 0 0 0 0.0 0.0 0.0 0.0 0.0 0.0Other and unspecified infectious and parasitic diseases
and their sequelae 6 60 32 28 1.3 1.4 1.2 0.9 1.2 0.7Malignant neoplasms (C00-C97) 8,957 4,801 4,156 200.8 217.0 184.9 144.0 170.5 123.4Malignant neoplasms of lip, oral cavity and pharynx
(C00-C14) 157 109 48 3.5 4.9 2.1 2.6 3.9 1.4Malignant neoplasm of oesophagus (C15) 252 187 65 5.7 8.5 2.9 4.1 6.6 1.9Malignant neoplasm of stomach (C16) 197 117 80 4.4 5.3 3.6 3.2 4.1 2.3Malignant neoplasms of colon, rectum and anus (C18-C21) 967 514 453 21.7 23.2 20.2 15.2 18.2 12.6Malignant neoplasm of liver and intrahepatic bile ducts
(C22) 296 202 94 6.6 9.1 4.2 4.8 7.1 2.8Malignant neoplasm of pancreas (C25) 548 311 237 12.3 14.1 10.5 8.9 11.0 6.9Malignant neoplasm of larynx (C32) 39 33 6 0.9 1.5 0.3 0.6 1.2 0.2Malignant neoplasms of trachea, bronchus and lung
(C33-C34) 2,239 1,177 1,062 50.2 53.2 47.2 36.8 42.0 32.6Malignant melanoma of skin (C43) 130 73 57 2.9 3.3 2.5 2.1 2.5 1.8Malignant neoplasm of breast (C50) 594 5 589 13.3 0.2 26.2 9.6 0.2 18.0Malignant neoplasm of cervix uteri (C53) ... ... 32 ... ... 1.4 ... ... 1.0Malignant neoplasms of corpus uteri and uterus, part
unspecified (C54-C55) ... ... 86 ... ... 3.8 ... ... 2.7Malignant neoplasm of ovary (C56) ... ... 229 ... ... 10.2 ... ... 7.1Malignant neoplasm of prostate (C61) ... 552 ... ... 25.0 ... ... 19.3 ...Malignant neoplasms of kidney and renal pelvis (C64-C65) 192 125 67 4.3 5.7 3.0 3.1 4.5 2.0Malignant neoplasm of bladder (C67) 291 204 87 6.5 9.2 3.9 4.4 7.3 2.3Malignant neoplasms of meninges, brain and other parts
of central nervous system (C70-C72) 231 144 87 5.2 6.5 3.9 4.2 5.5 3.0Malignant neoplasms of lymphoid, haematopoietic and
related tissue (C81-C96) 819 466 353 18.4 21.1 15.7 13.1 16.8 9.9Hodgkin’s disease (C81) 9 6 3 0.2 0.3 0.1 0.1 0.2 0.1Non-Hodgkin’s lymphoma (C82-C85) 375 212 163 8.4 9.6 7.3 6.0 7.6 4.6Leukaemia (C91-C95) 278 160 118 6.2 7.2 5.2 4.5 5.8 3.3Multiple myeloma and immunoproliferative neoplasms
(C88, C90) 153 85 68 3.4 3.8 3.0 2.4 3.1 1.9Other and unspecified malignant neoplasms of lymphoid,
haematopoietic and related tissue (C96) 4 3 1 0.1 0.1 0.0 0.1 0.1 0.0All other and unspecified malignant neoplasms (C17,
C23-C24, C26-C31, C37-C41, C44-C49, C51-C52,C57-C60, C62-C63, C66, C68-C69, C73-C80, C97) 1,106 582 524 24.8 26.3 23.3 17.4 20.4 14.9
In situ neoplasms, benign neoplasms and neoplasms ofuncertain or unknown behaviour (D00-D48) 199 102 97 4.5 4.6 4.3 3.1 3.6 2.6
Anaemias (D50-D64) 52 26 26 1.2 1.2 1.2 0.7 0.9 0.6Diabetes mellitus (E10-E14) 915 498 417 20.5 22.5 18.5 13.9 17.6 10.6Nutritional deficiencies (E40-E64) 27 11 16 0.6 0.5 0.7 0.4 0.4 0.3Malnutrition (E40-E46) 21 6 15 0.5 0.3 0.7 0.3 0.2 0.3Other nutritional deficiencies (E50-E64) 6 5 1 0.1 0.2 0.0 0.1 0.2 0.0Meningitis (G00, G03) 5 0 5 0.1 0.0 0.2 0.1 0.0 0.2Parkinson’s disease (G20-G21) 265 172 93 5.9 7.8 4.1 3.8 6.0 2.2Alzheimer’s disease (G30) 720 227 493 16.1 10.3 21.9 9.5 7.8 10.3Major cardiovascular diseases (I00-I78) 9,335 4,609 4,726 209.3 208.4 210.2 131.8 162.1 105.6Diseases of heart (I00-I09, I11, I13, I20-I51) 6,476 3,348 3,128 145.2 151.4 139.1 91.8 117.6 69.9Acute rheumatic fever and chronic rheumatic heart
diseases (I00-I09) 60 26 34 1.3 1.2 1.5 0.9 0.9 0.9Hypertensive heart disease (I11) 114 43 71 2.6 1.9 3.2 1.5 1.5 1.4Hypertensive heart and renal disease (I13) 18 7 11 0.4 0.3 0.5 0.2 0.2 0.2Ischaemic heart diseases (I20-I25) 4,470 2,495 1,975 100.2 112.8 87.9 64.1 87.4 44.7Acute myocardial infarction (I21-I22) 2,089 1,167 922 46.8 52.8 41.0 30.3 41.1 21.2Other acute ischaemic heart diseases (I24) 101 52 49 2.3 2.4 2.2 1.4 1.8 1.1
See notes at the end of the table.
42 Statistics Canada – Catalogue no. 84F0209X

Mortality, Summary List of Causes – 2009
Table 1-11 – continued
Deaths and mortality rate, by selected grouped causes, sex and geography — British Columbia1
Number of deaths Crude mortality rateper 100,000 population 2
Age-standardized mortality rateper 100,000 population 2
Bothsexes
Males Females Bothsexes
Males Females Bothsexes
Males Females
Other forms of chronic ischaemic heart disease (I20,I25) 2,280 1,276 1,004 51.1 57.7 44.7 32.5 44.5 22.4
Atherosclerotic cardiovascular disease, so described(I25.0) 139 101 38 3.1 4.6 1.7 2.2 3.5 1.1
All other forms of chronic ischaemic heart disease (I20,I25.1-I25.9) 2,141 1,175 966 48.0 53.1 43.0 30.3 41.0 21.3
Other heart diseases (I26-I51) 1,814 777 1,037 40.7 35.1 46.1 25.1 27.6 22.7Acute and subacute endocarditis (I33) 11 9 2 0.2 0.4 0.1 0.2 0.3 0.1Diseases of pericardium and acute myocarditis (I30-I31,
I40) 10 6 4 0.2 0.3 0.2 0.2 0.2 0.1Heart failure (I50) 674 257 417 15.1 11.6 18.5 8.6 8.9 8.2All other forms of heart disease (I26-I28, I34-I38, I42-I49,
I51) 1,119 505 614 25.1 22.8 27.3 16.1 18.0 14.3Essential hypertension and hypertensive renal disease
(I10, I12, I15) 230 99 131 5.2 4.5 5.8 3.2 3.5 3.1Cerebrovascular diseases (I60-I69) 2,240 946 1,294 50.2 42.8 57.6 30.9 33.3 28.7Atherosclerosis (I70) 75 27 48 1.7 1.2 2.1 1.0 1.0 1.0Other diseases of circulatory system (I71-I78) 314 189 125 7.0 8.5 5.6 4.7 6.8 3.1Aortic aneurysm and dissection (I71) 191 130 61 4.3 5.9 2.7 3.0 4.7 1.6Other diseases of arteries, arterioles and capillaries
(I72-I78) 123 59 64 2.8 2.7 2.8 1.7 2.1 1.5Other disorders of circulatory system (I80-I99) 40 21 19 0.9 0.9 0.8 0.6 0.7 0.5Influenza and pneumonia (J09-J18) 901 407 494 20.2 18.4 22.0 12.5 14.4 11.1Influenza (J09-J11) 71 27 44 1.6 1.2 2.0 1.2 1.0 1.3Pneumonia (J12-J18) 830 380 450 18.6 17.2 20.0 11.3 13.4 9.9Other acute lower respiratory infections (J20-J22) 5 0 5 0.1 0.0 0.2 0.1 0.0 0.1Acute bronchitis and bronchiolitis (J20-J21) 1 0 1 0.0 0.0 0.0 0.0 0.0 0.0Unspecified acute lower respiratory infection (J22) 4 0 4 0.1 0.0 0.2 0.1 0.0 0.1Chronic lower respiratory diseases (J40-J47) 1,502 747 755 33.7 33.8 33.6 22.2 26.2 19.4Bronchitis, chronic and unspecified (J40-J42) 10 5 5 0.2 0.2 0.2 0.1 0.2 0.1Emphysema (J43) 100 54 46 2.2 2.4 2.0 1.6 1.9 1.3Asthma (J45-J46) 49 16 33 1.1 0.7 1.5 0.7 0.6 0.8Other chronic lower respiratory diseases (J44, J47) 1,343 672 671 30.1 30.4 29.8 19.7 23.5 17.2Pneumoconioses and chemical effects (J60-J66, J68) 14 13 1 0.3 0.6 0.0 0.2 0.5 0.0Pneumonitis due to solids and liquids (J69) 244 122 122 5.5 5.5 5.4 3.4 4.3 2.7Other diseases of respiratory system (J00-J06, J30-J39,
J67, J70-J98) 326 201 125 7.3 9.1 5.6 5.0 7.1 3.5Peptic ulcer (K25-K28) 57 24 33 1.3 1.1 1.5 0.8 0.8 0.8Diseases of appendix (K35-K38) 4 3 1 0.1 0.1 0.0 0.1 0.1 0.0Hernia (K40-K46) 36 22 14 0.8 1.0 0.6 0.5 0.8 0.3Chronic liver disease and cirrhosis (K70, K73-K74) 342 219 123 7.7 9.9 5.5 5.6 7.5 3.8Alcoholic liver disease (K70) 239 165 74 5.4 7.5 3.3 4.0 5.6 2.4Other chronic liver disease and cirrhosis (K73-K74) 103 54 49 2.3 2.4 2.2 1.6 1.8 1.4Cholelithiasis and other disorders of gallbladder (K80-K82) 56 19 37 1.3 0.9 1.6 0.8 0.7 0.9Nephritis, nephrotic syndrome and nephrosis
(N00-N07, N17-N19, N25-N27) 371 193 178 8.3 8.7 7.9 5.2 6.7 4.3Acute and rapidly progressive nephritic and nephrotic
syndrome (N00-N01, N04) 3 1 2 0.1 0.0 0.1 0.0 0.0 0.0Chronic glomerulonephritis, nephritis and nephropathy
not specified as acute or chronic, and renal sclerosisunspecified (N02-N03, N05-N07, N26) 40 18 22 0.9 0.8 1.0 0.6 0.6 0.5
Renal failure (N17-N19) 328 174 154 7.4 7.9 6.9 4.7 6.1 3.8Other disorders of kidney (N25, N27) 0 0 0 0.0 0.0 0.0 0.0 0.0 0.0Infections of kidney (N10-N12, N13.6, N15.1) 15 7 8 0.3 0.3 0.4 0.2 0.3 0.2Hyperplasia of prostate (N40) ... 10 ... ... 0.5 ... ... 0.3 ...Inflammatory diseases of female pelvic organs (N70-N76) ... ... 1 ... ... 0.0 ... ... 0.0Pregnancy, childbirth and the puerperium (O00-O99) ... ... 3 ... ... 0.1 ... ... 0.2Pregnancy with abortive outcome (O00-O07) ... ... 0 ... ... 0.0 ... ... 0.0Other complications of pregnancy, childbirth and the
puerperium (O10-O99) ... ... 3 ... ... 0.1 ... ... 0.2Certain conditions originating in the perinatal period
(P00-P96) 84 38 46 1.9 1.7 2.0 2.7 2.3 3.0Congenital malformations, deformations and chromosomal
abnormalities (Q00-Q99) 87 46 41 2.0 2.1 1.8 2.1 2.2 2.2Symptoms, signs and abnormal clinical and laboratory
findings, not elsewhere classified (R00-R99) 430 250 180 9.6 11.3 8.0 7.9 10.1 5.8All other diseases (residual) 7 3,689 1,594 2,095 82.7 72.1 93.2 52.8 56.4 49.8Accidents (unintentional injuries) (V01-X59, Y85-Y86) 1,423 888 535 31.9 40.1 23.8 26.1 35.5 16.8Transport accidents (V01-V99, Y85) 420 310 110 9.4 14.0 4.9 8.7 13.1 4.4Motor vehicle accidents 8 376 270 106 8.4 12.2 4.7 7.8 11.4 4.2Other land transport accidents 9 12 12 0 0.3 0.5 0.0 0.2 0.5 0.0Water, air and space, and other and unspecified transport
accidents and their sequelae (V90-V99, Y85) 32 28 4 0.7 1.3 0.2 0.7 1.2 0.2Nontransport accidents (W00-X59, Y86) 1,003 578 425 22.5 26.1 18.9 17.3 22.5 12.4Falls (W00-W19) 406 203 203 9.1 9.2 9.0 5.9 7.3 4.6
See notes at the end of the table.
Statistics Canada – Catalogue no. 84F0209X 43

Mortality, Summary List of Causes – 2009
Table 1-11 – continued
Deaths and mortality rate, by selected grouped causes, sex and geography — British Columbia1
Number of deaths Crude mortality rateper 100,000 population 2
Age-standardized mortality rateper 100,000 population 2
Bothsexes
Males Females Bothsexes
Males Females Bothsexes
Males Females
Accidental discharge of firearms (W32-W34) 1 1 0 0.0 0.0 0.0 0.0 0.0 0.0Accidental drowning and submersion (W65-W74) 31 27 4 0.7 1.2 0.2 0.6 1.0 0.1Accidental exposure to smoke, fire and flames (X00-X09) 43 23 20 1.0 1.0 0.9 0.8 0.8 0.8Accidental poisoning and exposure to noxious substances
(X40-X49) 342 227 115 7.7 10.3 5.1 7.2 9.8 4.6Other and unspecified nontransport accidents and their
sequelae (W20-W31, W35-W64, W75-W99, X10-X39,X50-X59, Y86) 180 97 83 4.0 4.4 3.7 2.9 3.6 2.2
Intentional self-harm (suicide) (X60-X84, Y87.0) 488 380 108 10.9 17.2 4.8 10.2 16.0 4.5Intentional self-harm (suicide) by discharge of firearms
(X72-X74) 68 62 6 1.5 2.8 0.3 1.3 2.4 0.2Intentional self-harm (suicide) by other and unspecified
means and their sequelae (X60-X71, X75-X84, Y87.0) 420 318 102 9.4 14.4 4.5 8.9 13.5 4.3Assault (homicide) (X85-Y09, Y87.1) 103 82 21 2.3 3.7 0.9 2.5 4.0 1.0Assault (homicide) by discharge of firearms (X93-X95) 49 41 8 1.1 1.9 0.4 1.3 2.1 0.4Assault (homicide) by other and unspecified means and
their sequelae (X85-X92, X96-Y09, Y87.1) 54 41 13 1.2 1.9 0.6 1.2 1.8 0.6Legal intervention (Y35, Y89.0) 3 3 0 0.1 0.1 0.0 0.1 0.1 0.0Events of undetermined intent (Y10-Y34, Y87.2, Y89.9) 39 19 20 0.9 0.9 0.9 0.8 0.8 0.8Discharge of firearms, undetermined intent (Y22-Y24) 1 1 0 0.0 0.0 0.0 0.0 0.0 0.0Other and unspecified events of undetermined intent and
their sequelae (Y10-Y21, Y25-Y34, Y87.2, Y89.9) 38 18 20 0.9 0.8 0.9 0.8 0.8 0.8Operations of war and their sequelae (Y36, Y89.1) 0 0 0 0.0 0.0 0.0 0.0 0.0 0.0Complications of medical and surgical care (Y40-Y84, Y88) 47 27 20 1.1 1.2 0.9 0.7 0.9 0.6
1. The geographic distribution of deaths in this table is based on the deceased’s usual place of residence.2. Starting in 2005, the population estimates used to calculate the mortality rates are presented in the Appendix II of the publication "Mortality Summary List of
Causes" (catalogue number 84F0209XIE).3. The cause of death tabulated is the underlying cause of death. This is defined as (a) the disease or injury which initiated the train of events leading directly to
death, or (b) the circumstances of the accident or violence which produced the fatal injury. The underlying cause is selected from the conditions listed onthe medical certificate of cause of death.
4. World Health Organization (WHO), International Statistical Classification of Diseases and Related Health Problems, Tenth Revision (ICD-10)5. National Center for Health Statistics, United States. "B" list in "Instruction Manual; Part 9; ICD-10 Cause-of-Death Lists for Tabulating Mortality Statistics".6. Other and unspecified infectious and parasitic diseases and their sequelae A00, A05, A20 to A36, A42 to A44, A48 to A49, A54 to A79, A81 to A82,
A85.0 to A85.1, A85.8, A86 to B04, B06 to B09, B25 to B49, B55 to B99.7. All other diseases (residual) D65 to E07, E15 to E34, E65 to F99, G04 to G12, G23 to G25, G31 to H93, K00 to K22, K29 to K31, K50 to K66, K71 to K72, K75 to
K76, K83 to M99, N13.0 to N13.5, N13.7 to N13.9, N14, N15.0, N15.8 to N15.9, N20 to N23, N28 to N39, N41 to N64, N80 to N98. As of 2003, also includes U04.8. Motor vehicle accidents V02 to V04, V09.0, V09.2, V12 to V14, V19.0 to V19.2, V19.4 to V19.6, V20 to V79, V80.3 to V80.5, V81.0 to V81.1, V82.0 to V82.1,
V83 to V86, V87.0 to V87.8, V88.0 to V88.8, V89.0, V89.2.9. Other land transport accidents V01, V05 to V06, V09.1, V09.3 to V09.9, V10 to V11, V15 to V18, V19.3, V19.8 to V19.9, V80.0 to V80.2, V80.6 to V80.9,
V81.2 to V81.9, V82.2 to V82.9, V87.9, V88.9, V89.1, V89.3, V89.9.Note(s): See Data quality, concepts and methodology — Explanatory notes for the tables section.Source(s): Statistics Canada, Canadian Vital Statistics, Birth and Death Databases (CANSIM table 102-0552) and Appendix II.
44 Statistics Canada – Catalogue no. 84F0209X

Mortality, Summary List of Causes – 2009
Table 1-12Deaths and mortality rate, by selected grouped causes, sex and geography — Yukon1
Number of deaths Crude mortality rateper 100,000 population 2
Age-standardized mortality rateper 100,000 population 2
Bothsexes
Males Females Bothsexes
Males Females Bothsexes
Males Females
Total, all causes of death (A00-Y89) 3 , 4 , 5 201 115 86 596.7 667.5 522.6 754.9 915.6 654.6
Salmonella infections (A01-A02) 0 0 0 0.0 0.0 0.0 0.0 0.0 0.0Shigellosis and amoebiasis (A03, A06) 0 0 0 0.0 0.0 0.0 0.0 0.0 0.0Certain other intestinal infections (A04, A07-A09) 1 1 0 3.0 5.8 0.0 5.1 12.7 0.0Tuberculosis (A16-A19) 0 0 0 0.0 0.0 0.0 0.0 0.0 0.0Respiratory tuberculosis (A16) 0 0 0 0.0 0.0 0.0 0.0 0.0 0.0Other tuberculosis (A17-A19) 0 0 0 0.0 0.0 0.0 0.0 0.0 0.0Whooping cough (A37) 0 0 0 0.0 0.0 0.0 0.0 0.0 0.0Scarlet fever and erysipelas (A38, A46) 0 0 0 0.0 0.0 0.0 0.0 0.0 0.0Meningococcal infection (A39) 0 0 0 0.0 0.0 0.0 0.0 0.0 0.0Septicaemia (A40-A41) 4 2 2 11.9 11.6 12.2 16.0 20.8 14.0Syphilis (A50-A53) 0 0 0 0.0 0.0 0.0 0.0 0.0 0.0Acute poliomyelitis (A80) 0 0 0 0.0 0.0 0.0 0.0 0.0 0.0Arthropod-borne viral encephalitis (A83-A84, A85.2) 0 0 0 0.0 0.0 0.0 0.0 0.0 0.0Measles (B05) 0 0 0 0.0 0.0 0.0 0.0 0.0 0.0Viral hepatitis (B15-B19) 0 0 0 0.0 0.0 0.0 0.0 0.0 0.0Human immunodeficiency virus [HIV] disease (B20-B24) 0 0 0 0.0 0.0 0.0 0.0 0.0 0.0Malaria (B50-B54) 0 0 0 0.0 0.0 0.0 0.0 0.0 0.0Other and unspecified infectious and parasitic diseases and
their sequelae 6 0 0 0 0.0 0.0 0.0 0.0 0.0 0.0Malignant neoplasms (C00-C97) 63 30 33 187.0 174.1 200.5 217.1 227.5 234.3Malignant neoplasms of lip, oral cavity and pharynx
(C00-C14) 1 1 0 3.0 5.8 0.0 1.6 2.9 0.0Malignant neoplasm of oesophagus (C15) 4 3 1 11.9 17.4 6.1 20.0 40.8 9.4Malignant neoplasm of stomach (C16) 5 3 2 14.8 17.4 12.2 15.3 18.2 11.2Malignant neoplasms of colon, rectum and anus (C18-C21) 6 4 2 17.8 23.2 12.2 21.4 29.0 16.0Malignant neoplasm of liver and intrahepatic bile ducts (C22) 0 0 0 0.0 0.0 0.0 0.0 0.0 0.0Malignant neoplasm of pancreas (C25) 3 1 2 8.9 5.8 12.2 10.9 8.1 14.0Malignant neoplasm of larynx (C32) 0 0 0 0.0 0.0 0.0 0.0 0.0 0.0Malignant neoplasms of trachea, bronchus and lung
(C33-C34) 18 6 12 53.4 34.8 72.9 62.7 37.2 89.3Malignant melanoma of skin (C43) 0 0 0 0.0 0.0 0.0 0.0 0.0 0.0Malignant neoplasm of breast (C50) 6 0 6 17.8 0.0 36.5 16.9 0.0 36.8Malignant neoplasm of cervix uteri (C53) ... ... 0 ... ... 0.0 ... ... 0.0Malignant neoplasms of corpus uteri and uterus, part
unspecified (C54-C55) ... ... 2 ... ... 12.2 ... ... 13.7Malignant neoplasm of ovary (C56) ... ... 1 ... ... 6.1 ... ... 3.5Malignant neoplasm of prostate (C61) ... 2 ... ... 11.6 ... ... 26.3 ...Malignant neoplasms of kidney and renal pelvis (C64-C65) 3 2 1 8.9 11.6 6.1 9.3 8.9 9.4Malignant neoplasm of bladder (C67) 0 0 0 0.0 0.0 0.0 0.0 0.0 0.0Malignant neoplasms of meninges, brain and other parts of
central nervous system (C70-C72) 1 1 0 3.0 5.8 0.0 2.2 4.1 0.0Malignant neoplasms of lymphoid, haematopoietic and
related tissue (C81-C96) 6 5 1 17.8 29.0 6.1 22.9 44.7 9.4Hodgkin’s disease (C81) 0 0 0 0.0 0.0 0.0 0.0 0.0 0.0Non-Hodgkin’s lymphoma (C82-C85) 0 0 0 0.0 0.0 0.0 0.0 0.0 0.0Leukaemia (C91-C95) 5 4 1 14.8 23.2 6.1 18.5 36.6 9.4Multiple myeloma and immunoproliferative neoplasms (C88,
C90) 1 1 0 3.0 5.8 0.0 4.3 8.1 0.0Other and unspecified malignant neoplasms of lymphoid,
haematopoietic and related tissue (C96) 0 0 0 0.0 0.0 0.0 0.0 0.0 0.0All other and unspecified malignant neoplasms (C17,
C23-C24, C26-C31, C37-C41, C44-C49, C51-C52,C57-C60, C62-C63, C66, C68-C69, C73-C80, C97) 5 2 3 14.8 11.6 18.2 14.1 7.3 21.7
In situ neoplasms, benign neoplasms and neoplasms ofuncertain or unknown behaviour (D00-D48) 0 0 0 0.0 0.0 0.0 0.0 0.0 0.0
Anaemias (D50-D64) 1 1 0 3.0 5.8 0.0 4.3 8.1 0.0Diabetes mellitus (E10-E14) 5 2 3 14.8 11.6 18.2 27.0 17.7 31.7Nutritional deficiencies (E40-E64) 0 0 0 0.0 0.0 0.0 0.0 0.0 0.0Malnutrition (E40-E46) 0 0 0 0.0 0.0 0.0 0.0 0.0 0.0Other nutritional deficiencies (E50-E64) 0 0 0 0.0 0.0 0.0 0.0 0.0 0.0Meningitis (G00, G03) 1 1 0 3.0 5.8 0.0 4.3 8.1 0.0Parkinson’s disease (G20-G21) 2 2 0 5.9 11.6 0.0 10.6 21.7 0.0Alzheimer’s disease (G30) 3 3 0 8.9 17.4 0.0 14.8 32.3 0.0Major cardiovascular diseases (I00-I78) 37 22 15 109.8 127.7 91.2 154.6 176.9 140.1Diseases of heart (I00-I09, I11, I13, I20-I51) 27 19 8 80.2 110.3 48.6 108.7 158.1 72.2Acute rheumatic fever and chronic rheumatic heart diseases
(I00-I09) 1 0 1 3.0 0.0 6.1 6.3 0.0 11.7Hypertensive heart disease (I11) 1 1 0 3.0 5.8 0.0 4.3 8.1 0.0Hypertensive heart and renal disease (I13) 0 0 0 0.0 0.0 0.0 0.0 0.0 0.0Ischaemic heart diseases (I20-I25) 15 9 6 44.5 52.2 36.5 61.9 81.4 52.2Acute myocardial infarction (I21-I22) 6 3 3 17.8 17.4 18.2 27.8 45.3 26.8Other acute ischaemic heart diseases (I24) 2 2 0 5.9 11.6 0.0 3.9 7.3 0.0Other forms of chronic ischaemic heart disease (I20, I25) 7 4 3 20.8 23.2 18.2 30.2 28.7 25.4
See notes at the end of the table.
Statistics Canada – Catalogue no. 84F0209X 45

Mortality, Summary List of Causes – 2009
Table 1-12 – continued
Deaths and mortality rate, by selected grouped causes, sex and geography — Yukon1
Number of deaths Crude mortality rateper 100,000 population 2
Age-standardized mortality rateper 100,000 population 2
Bothsexes
Males Females Bothsexes
Males Females Bothsexes
Males Females
Atherosclerotic cardiovascular disease, so described (I25.0) 3 3 0 8.9 17.4 0.0 7.7 15.1 0.0All other forms of chronic ischaemic heart disease (I20,
I25.1-I25.9) 4 1 3 11.9 5.8 18.2 22.5 13.6 25.4Other heart diseases (I26-I51) 10 9 1 29.7 52.2 6.1 36.2 68.7 8.3Acute and subacute endocarditis (I33) 0 0 0 0.0 0.0 0.0 0.0 0.0 0.0Diseases of pericardium and acute myocarditis (I30-I31, I40) 0 0 0 0.0 0.0 0.0 0.0 0.0 0.0Heart failure (I50) 6 5 1 17.8 29.0 6.1 28.4 53.9 8.3All other forms of heart disease (I26-I28, I34-I38, I42-I49,
I51) 4 4 0 11.9 23.2 0.0 7.7 14.8 0.0Essential hypertension and hypertensive renal disease (I10,
I12, I15) 0 0 0 0.0 0.0 0.0 0.0 0.0 0.0Cerebrovascular diseases (I60-I69) 8 2 6 23.8 11.6 36.5 37.8 15.6 56.2Atherosclerosis (I70) 0 0 0 0.0 0.0 0.0 0.0 0.0 0.0Other diseases of circulatory system (I71-I78) 2 1 1 5.9 5.8 6.1 8.0 3.2 11.7Aortic aneurysm and dissection (I71) 1 0 1 3.0 0.0 6.1 6.3 0.0 11.7Other diseases of arteries, arterioles and capillaries (I72-I78) 1 1 0 3.0 5.8 0.0 1.7 3.2 0.0Other disorders of circulatory system (I80-I99) 0 0 0 0.0 0.0 0.0 0.0 0.0 0.0Influenza and pneumonia (J09-J18) 3 1 2 8.9 5.8 12.2 9.9 9.3 11.3Influenza (J09-J11) 1 0 1 3.0 0.0 6.1 3.6 0.0 7.6Pneumonia (J12-J18) 2 1 1 5.9 5.8 6.1 6.3 9.3 3.7Other acute lower respiratory infections (J20-J22) 0 0 0 0.0 0.0 0.0 0.0 0.0 0.0Acute bronchitis and bronchiolitis (J20-J21) 0 0 0 0.0 0.0 0.0 0.0 0.0 0.0Unspecified acute lower respiratory infection (J22) 0 0 0 0.0 0.0 0.0 0.0 0.0 0.0Chronic lower respiratory diseases (J40-J47) 10 5 5 29.7 29.0 30.4 51.5 71.4 47.6Bronchitis, chronic and unspecified (J40-J42) 0 0 0 0.0 0.0 0.0 0.0 0.0 0.0Emphysema (J43) 0 0 0 0.0 0.0 0.0 0.0 0.0 0.0Asthma (J45-J46) 0 0 0 0.0 0.0 0.0 0.0 0.0 0.0Other chronic lower respiratory diseases (J44, J47) 10 5 5 29.7 29.0 30.4 51.5 71.4 47.6Pneumoconioses and chemical effects (J60-J66, J68) 1 1 0 3.0 5.8 0.0 5.1 12.7 0.0Pneumonitis due to solids and liquids (J69) 0 0 0 0.0 0.0 0.0 0.0 0.0 0.0Other diseases of respiratory system (J00-J06, J30-J39,
J67, J70-J98) 3 2 1 8.9 11.6 6.1 8.9 11.3 5.5Peptic ulcer (K25-K28) 1 1 0 3.0 5.8 0.0 2.2 4.1 0.0Diseases of appendix (K35-K38) 0 0 0 0.0 0.0 0.0 0.0 0.0 0.0Hernia (K40-K46) 0 0 0 0.0 0.0 0.0 0.0 0.0 0.0Chronic liver disease and cirrhosis (K70, K73-K74) 4 3 1 11.9 17.4 6.1 6.6 9.0 3.7Alcoholic liver disease (K70) 3 2 1 8.9 11.6 6.1 4.8 5.8 3.7Other chronic liver disease and cirrhosis (K73-K74) 1 1 0 3.0 5.8 0.0 1.7 3.2 0.0Cholelithiasis and other disorders of gallbladder (K80-K82) 0 0 0 0.0 0.0 0.0 0.0 0.0 0.0Nephritis, nephrotic syndrome and nephrosis (N00-N07,
N17-N19, N25-N27) 1 1 0 3.0 5.8 0.0 4.6 9.3 0.0Acute and rapidly progressive nephritic and nephrotic
syndrome (N00-N01, N04) 0 0 0 0.0 0.0 0.0 0.0 0.0 0.0Chronic glomerulonephritis, nephritis and nephropathy
not specified as acute or chronic, and renal sclerosisunspecified (N02-N03, N05-N07, N26) 0 0 0 0.0 0.0 0.0 0.0 0.0 0.0
Renal failure (N17-N19) 1 1 0 3.0 5.8 0.0 4.6 9.3 0.0Other disorders of kidney (N25, N27) 0 0 0 0.0 0.0 0.0 0.0 0.0 0.0Infections of kidney (N10-N12, N13.6, N15.1) 0 0 0 0.0 0.0 0.0 0.0 0.0 0.0Hyperplasia of prostate (N40) ... 0 ... ... 0.0 ... ... 0.0 ...Inflammatory diseases of female pelvic organs (N70-N76) ... ... 0 ... ... 0.0 ... ... 0.0Pregnancy, childbirth and the puerperium (O00-O99) ... ... 0 ... ... 0.0 ... ... 0.0Pregnancy with abortive outcome (O00-O07) ... ... 0 ... ... 0.0 ... ... 0.0Other complications of pregnancy, childbirth and the
puerperium (O10-O99) ... ... 0 ... ... 0.0 ... ... 0.0Certain conditions originating in the perinatal period
(P00-P96) 2 2 0 5.9 11.6 0.0 7.5 14.1 0.0Congenital malformations, deformations and chromosomal
abnormalities (Q00-Q99) 0 0 0 0.0 0.0 0.0 0.0 0.0 0.0Symptoms, signs and abnormal clinical and laboratory
findings, not elsewhere classified (R00-R99) 7 4 3 20.8 23.2 18.2 28.3 29.2 21.5All other diseases (residual) 7 21 11 10 62.3 63.8 60.8 75.2 82.5 72.9Accidents (unintentional injuries) (V01-X59, Y85-Y86) 27 17 10 80.2 98.7 60.8 92.4 123.7 67.5Transport accidents (V01-V99, Y85) 12 7 5 35.6 40.6 30.4 37.1 42.0 30.8Motor vehicle accidents 8 10 7 3 29.7 40.6 18.2 30.6 42.0 16.8Other land transport accidents 9 0 0 0 0.0 0.0 0.0 0.0 0.0 0.0Water, air and space, and other and unspecified transport
accidents and their sequelae (V90-V99, Y85) 2 0 2 5.9 0.0 12.2 6.5 0.0 14.0Nontransport accidents (W00-X59, Y86) 15 10 5 44.5 58.0 30.4 55.3 81.8 36.7Falls (W00-W19) 4 4 0 11.9 23.2 0.0 21.2 52.2 0.0Accidental discharge of firearms (W32-W34) 0 0 0 0.0 0.0 0.0 0.0 0.0 0.0Accidental drowning and submersion (W65-W74) 0 0 0 0.0 0.0 0.0 0.0 0.0 0.0Accidental exposure to smoke, fire and flames (X00-X09) 2 1 1 5.9 5.8 6.1 8.2 8.1 7.7Accidental poisoning and exposure to noxious substances
(X40-X49) 7 4 3 20.8 23.2 18.2 19.0 17.8 20.4
See notes at the end of the table.
46 Statistics Canada – Catalogue no. 84F0209X

Mortality, Summary List of Causes – 2009
Table 1-12 – continued
Deaths and mortality rate, by selected grouped causes, sex and geography — Yukon1
Number of deaths Crude mortality rateper 100,000 population 2
Age-standardized mortality rateper 100,000 population 2
Bothsexes
Males Females Bothsexes
Males Females Bothsexes
Males Females
Other and unspecified nontransport accidents and theirsequelae (W20-W31, W35-W64, W75-W99, X10-X39,X50-X59, Y86) 2 1 1 5.9 5.8 6.1 6.9 3.7 8.6
Intentional self-harm (suicide) (X60-X84, Y87.0) 2 2 0 5.9 11.6 0.0 5.1 10.2 0.0Intentional self-harm (suicide) by discharge of firearms
(X72-X74) 1 1 0 3.0 5.8 0.0 2.2 4.1 0.0Intentional self-harm (suicide) by other and unspecified
means and their sequelae (X60-X71, X75-X84, Y87.0) 1 1 0 3.0 5.8 0.0 2.9 6.0 0.0Assault (homicide) (X85-Y09, Y87.1) 1 1 0 3.0 5.8 0.0 1.7 3.2 0.0Assault (homicide) by discharge of firearms (X93-X95) 0 0 0 0.0 0.0 0.0 0.0 0.0 0.0Assault (homicide) by other and unspecified means and
their sequelae (X85-X92, X96-Y09, Y87.1) 1 1 0 3.0 5.8 0.0 1.7 3.2 0.0Legal intervention (Y35, Y89.0) 0 0 0 0.0 0.0 0.0 0.0 0.0 0.0Events of undetermined intent (Y10-Y34, Y87.2, Y89.9) 0 0 0 0.0 0.0 0.0 0.0 0.0 0.0Discharge of firearms, undetermined intent (Y22-Y24) 0 0 0 0.0 0.0 0.0 0.0 0.0 0.0Other and unspecified events of undetermined intent and
their sequelae (Y10-Y21, Y25-Y34, Y87.2, Y89.9) 0 0 0 0.0 0.0 0.0 0.0 0.0 0.0Operations of war and their sequelae (Y36, Y89.1) 0 0 0 0.0 0.0 0.0 0.0 0.0 0.0Complications of medical and surgical care (Y40-Y84, Y88) 1 0 1 3.0 0.0 6.1 2.2 0.0 4.6
1. The geographic distribution of deaths in this table is based on the deceased’s usual place of residence.2. Starting in 2005, the population estimates used to calculate the mortality rates are presented in the Appendix II of the publication "Mortality Summary List of
Causes" (catalogue number 84F0209XIE).3. The cause of death tabulated is the underlying cause of death. This is defined as (a) the disease or injury which initiated the train of events leading directly to
death, or (b) the circumstances of the accident or violence which produced the fatal injury. The underlying cause is selected from the conditions listed onthe medical certificate of cause of death.
4. World Health Organization (WHO), International Statistical Classification of Diseases and Related Health Problems, Tenth Revision (ICD-10)5. National Center for Health Statistics, United States. "B" list in "Instruction Manual; Part 9; ICD-10 Cause-of-Death Lists for Tabulating Mortality Statistics".6. Other and unspecified infectious and parasitic diseases and their sequelae A00, A05, A20 to A36, A42 to A44, A48 to A49, A54 to A79, A81 to A82,
A85.0 to A85.1, A85.8, A86 to B04, B06 to B09, B25 to B49, B55 to B99.7. All other diseases (residual) D65 to E07, E15 to E34, E65 to F99, G04 to G12, G23 to G25, G31 to H93, K00 to K22, K29 to K31, K50 to K66, K71 to K72, K75 to
K76, K83 to M99, N13.0 to N13.5, N13.7 to N13.9, N14, N15.0, N15.8 to N15.9, N20 to N23, N28 to N39, N41 to N64, N80 to N98. As of 2003, also includes U04.8. Motor vehicle accidents V02 to V04, V09.0, V09.2, V12 to V14, V19.0 to V19.2, V19.4 to V19.6, V20 to V79, V80.3 to V80.5, V81.0 to V81.1, V82.0 to V82.1,
V83 to V86, V87.0 to V87.8, V88.0 to V88.8, V89.0, V89.2.9. Other land transport accidents V01, V05 to V06, V09.1, V09.3 to V09.9, V10 to V11, V15 to V18, V19.3, V19.8 to V19.9, V80.0 to V80.2, V80.6 to V80.9,
V81.2 to V81.9, V82.2 to V82.9, V87.9, V88.9, V89.1, V89.3, V89.9.Note(s): See Data quality, concepts and methodology — Explanatory notes for the tables section.Source(s): Statistics Canada, Canadian Vital Statistics, Birth and Death Databases (CANSIM table 102-0552) and Appendix II.
Statistics Canada – Catalogue no. 84F0209X 47

Mortality, Summary List of Causes – 2009
Table 1-13Deaths and mortality rate, by selected grouped causes, sex and geography — Northwest Territories1
Number of deaths Crude mortality rateper 100,000 population 2
Age-standardized mortality rateper 100,000 population 2
Bothsexes
Males Females Bothsexes
Males Females Bothsexes
Males Females
Total, all causes of death (A00-Y89) 3 , 4 , 5 186 113 73 426.2 501.3 346.0 700.2 837.0 551.9
Salmonella infections (A01-A02) 0 0 0 0.0 0.0 0.0 0.0 0.0 0.0Shigellosis and amoebiasis (A03, A06) 0 0 0 0.0 0.0 0.0 0.0 0.0 0.0Certain other intestinal infections (A04, A07-A09) 0 0 0 0.0 0.0 0.0 0.0 0.0 0.0Tuberculosis (A16-A19) 0 0 0 0.0 0.0 0.0 0.0 0.0 0.0Respiratory tuberculosis (A16) 0 0 0 0.0 0.0 0.0 0.0 0.0 0.0Other tuberculosis (A17-A19) 0 0 0 0.0 0.0 0.0 0.0 0.0 0.0Whooping cough (A37) 0 0 0 0.0 0.0 0.0 0.0 0.0 0.0Scarlet fever and erysipelas (A38, A46) 0 0 0 0.0 0.0 0.0 0.0 0.0 0.0Meningococcal infection (A39) 0 0 0 0.0 0.0 0.0 0.0 0.0 0.0Septicaemia (A40-A41) 1 1 0 2.3 4.4 0.0 4.4 8.0 0.0Syphilis (A50-A53) 0 0 0 0.0 0.0 0.0 0.0 0.0 0.0Acute poliomyelitis (A80) 0 0 0 0.0 0.0 0.0 0.0 0.0 0.0Arthropod-borne viral encephalitis (A83-A84, A85.2) 0 0 0 0.0 0.0 0.0 0.0 0.0 0.0Measles (B05) 0 0 0 0.0 0.0 0.0 0.0 0.0 0.0Viral hepatitis (B15-B19) 0 0 0 0.0 0.0 0.0 0.0 0.0 0.0Human immunodeficiency virus [HIV] disease (B20-B24) 0 0 0 0.0 0.0 0.0 0.0 0.0 0.0Malaria (B50-B54) 0 0 0 0.0 0.0 0.0 0.0 0.0 0.0Other and unspecified infectious and parasitic diseases and
their sequelae 6 0 0 0 0.0 0.0 0.0 0.0 0.0 0.0Malignant neoplasms (C00-C97) 45 24 21 103.1 106.5 99.5 171.6 172.9 164.1Malignant neoplasms of lip, oral cavity and pharynx
(C00-C14) 2 2 0 4.6 8.9 0.0 3.3 6.3 0.0Malignant neoplasm of oesophagus (C15) 0 0 0 0.0 0.0 0.0 0.0 0.0 0.0Malignant neoplasm of stomach (C16) 4 2 2 9.2 8.9 9.5 6.8 6.5 6.7Malignant neoplasms of colon, rectum and anus (C18-C21) 5 5 0 11.5 22.2 0.0 20.8 39.0 0.0Malignant neoplasm of liver and intrahepatic bile ducts (C22) 0 0 0 0.0 0.0 0.0 0.0 0.0 0.0Malignant neoplasm of pancreas (C25) 4 2 2 9.2 8.9 9.5 19.7 14.3 22.2Malignant neoplasm of larynx (C32) 1 1 0 2.3 4.4 0.0 4.4 8.0 0.0Malignant neoplasms of trachea, bronchus and lung
(C33-C34) 13 5 8 29.8 22.2 37.9 54.1 45.7 64.6Malignant melanoma of skin (C43) 0 0 0 0.0 0.0 0.0 0.0 0.0 0.0Malignant neoplasm of breast (C50) 2 0 2 4.6 0.0 9.5 4.1 0.0 8.4Malignant neoplasm of cervix uteri (C53) ... ... 0 ... ... 0.0 ... ... 0.0Malignant neoplasms of corpus uteri and uterus, part
unspecified (C54-C55) ... ... 0 ... ... 0.0 ... ... 0.0Malignant neoplasm of ovary (C56) ... ... 1 ... ... 4.7 ... ... 3.2Malignant neoplasm of prostate (C61) ... 3 ... ... 13.3 ... ... 20.0 ...Malignant neoplasms of kidney and renal pelvis (C64-C65) 1 0 1 2.3 0.0 4.7 5.4 0.0 11.1Malignant neoplasm of bladder (C67) 0 0 0 0.0 0.0 0.0 0.0 0.0 0.0Malignant neoplasms of meninges, brain and other parts of
central nervous system (C70-C72) 1 0 1 2.3 0.0 4.7 5.6 0.0 11.2Malignant neoplasms of lymphoid, haematopoietic and
related tissue (C81-C96) 1 1 0 2.3 4.4 0.0 5.6 11.0 0.0Hodgkin’s disease (C81) 0 0 0 0.0 0.0 0.0 0.0 0.0 0.0Non-Hodgkin’s lymphoma (C82-C85) 1 1 0 2.3 4.4 0.0 5.6 11.0 0.0Leukaemia (C91-C95) 0 0 0 0.0 0.0 0.0 0.0 0.0 0.0Multiple myeloma and immunoproliferative neoplasms (C88,
C90) 0 0 0 0.0 0.0 0.0 0.0 0.0 0.0Other and unspecified malignant neoplasms of lymphoid,
haematopoietic and related tissue (C96) 0 0 0 0.0 0.0 0.0 0.0 0.0 0.0All other and unspecified malignant neoplasms (C17,
C23-C24, C26-C31, C37-C41, C44-C49, C51-C52,C57-C60, C62-C63, C66, C68-C69, C73-C80, C97) 7 3 4 16.0 13.3 19.0 29.5 22.2 36.8
In situ neoplasms, benign neoplasms and neoplasms ofuncertain or unknown behaviour (D00-D48) 4 2 2 9.2 8.9 9.5 18.7 25.0 15.0
Anaemias (D50-D64) 0 0 0 0.0 0.0 0.0 0.0 0.0 0.0Diabetes mellitus (E10-E14) 2 1 1 4.6 4.4 4.7 4.4 3.2 6.5Nutritional deficiencies (E40-E64) 1 0 1 2.3 0.0 4.7 5.3 0.0 10.1Malnutrition (E40-E46) 1 0 1 2.3 0.0 4.7 5.3 0.0 10.1Other nutritional deficiencies (E50-E64) 0 0 0 0.0 0.0 0.0 0.0 0.0 0.0Meningitis (G00, G03) 0 0 0 0.0 0.0 0.0 0.0 0.0 0.0Parkinson’s disease (G20-G21) 0 0 0 0.0 0.0 0.0 0.0 0.0 0.0Alzheimer’s disease (G30) 0 0 0 0.0 0.0 0.0 0.0 0.0 0.0Major cardiovascular diseases (I00-I78) 43 33 10 98.5 146.4 47.4 192.0 286.0 95.2Diseases of heart (I00-I09, I11, I13, I20-I51) 35 27 8 80.2 119.8 37.9 149.3 222.0 78.3Acute rheumatic fever and chronic rheumatic heart diseases
(I00-I09) 0 0 0 0.0 0.0 0.0 0.0 0.0 0.0Hypertensive heart disease (I11) 1 1 0 2.3 4.4 0.0 5.3 11.0 0.0Hypertensive heart and renal disease (I13) 0 0 0 0.0 0.0 0.0 0.0 0.0 0.0Ischaemic heart diseases (I20-I25) 30 23 7 68.7 102.0 33.2 121.3 168.9 67.2Acute myocardial infarction (I21-I22) 7 5 2 16.0 22.2 9.5 28.8 40.1 21.3Other acute ischaemic heart diseases (I24) 0 0 0 0.0 0.0 0.0 0.0 0.0 0.0Other forms of chronic ischaemic heart disease (I20, I25) 23 18 5 52.7 79.9 23.7 92.4 128.7 45.9
See notes at the end of the table.
48 Statistics Canada – Catalogue no. 84F0209X

Mortality, Summary List of Causes – 2009
Table 1-13 – continued
Deaths and mortality rate, by selected grouped causes, sex and geography — Northwest Territories1
Number of deaths Crude mortality rateper 100,000 population 2
Age-standardized mortality rateper 100,000 population 2
Bothsexes
Males Females Bothsexes
Males Females Bothsexes
Males Females
Atherosclerotic cardiovascular disease, so described (I25.0) 9 8 1 20.6 35.5 4.7 36.1 56.6 8.4All other forms of chronic ischaemic heart disease (I20,
I25.1-I25.9) 14 10 4 32.1 44.4 19.0 56.4 72.1 37.5Other heart diseases (I26-I51) 4 3 1 9.2 13.3 4.7 22.8 42.2 11.1Acute and subacute endocarditis (I33) 0 0 0 0.0 0.0 0.0 0.0 0.0 0.0Diseases of pericardium and acute myocarditis (I30-I31, I40) 0 0 0 0.0 0.0 0.0 0.0 0.0 0.0Heart failure (I50) 1 0 1 2.3 0.0 4.7 5.4 0.0 11.1All other forms of heart disease (I26-I28, I34-I38, I42-I49,
I51) 3 3 0 6.9 13.3 0.0 17.4 42.2 0.0Essential hypertension and hypertensive renal disease (I10,
I12, I15) 0 0 0 0.0 0.0 0.0 0.0 0.0 0.0Cerebrovascular diseases (I60-I69) 7 5 2 16.0 22.2 9.5 37.1 52.9 16.9Atherosclerosis (I70) 0 0 0 0.0 0.0 0.0 0.0 0.0 0.0Other diseases of circulatory system (I71-I78) 1 1 0 2.3 4.4 0.0 5.6 11.0 0.0Aortic aneurysm and dissection (I71) 1 1 0 2.3 4.4 0.0 5.6 11.0 0.0Other diseases of arteries, arterioles and capillaries (I72-I78) 0 0 0 0.0 0.0 0.0 0.0 0.0 0.0Other disorders of circulatory system (I80-I99) 0 0 0 0.0 0.0 0.0 0.0 0.0 0.0Influenza and pneumonia (J09-J18) 4 2 2 9.2 8.9 9.5 18.5 21.3 16.7Influenza (J09-J11) 0 0 0 0.0 0.0 0.0 0.0 0.0 0.0Pneumonia (J12-J18) 4 2 2 9.2 8.9 9.5 18.5 21.3 16.7Other acute lower respiratory infections (J20-J22) 0 0 0 0.0 0.0 0.0 0.0 0.0 0.0Acute bronchitis and bronchiolitis (J20-J21) 0 0 0 0.0 0.0 0.0 0.0 0.0 0.0Unspecified acute lower respiratory infection (J22) 0 0 0 0.0 0.0 0.0 0.0 0.0 0.0Chronic lower respiratory diseases (J40-J47) 9 8 1 20.6 35.5 4.7 50.1 95.9 11.2Bronchitis, chronic and unspecified (J40-J42) 0 0 0 0.0 0.0 0.0 0.0 0.0 0.0Emphysema (J43) 0 0 0 0.0 0.0 0.0 0.0 0.0 0.0Asthma (J45-J46) 0 0 0 0.0 0.0 0.0 0.0 0.0 0.0Other chronic lower respiratory diseases (J44, J47) 9 8 1 20.6 35.5 4.7 50.1 95.9 11.2Pneumoconioses and chemical effects (J60-J66, J68) 0 0 0 0.0 0.0 0.0 0.0 0.0 0.0Pneumonitis due to solids and liquids (J69) 0 0 0 0.0 0.0 0.0 0.0 0.0 0.0Other diseases of respiratory system (J00-J06, J30-J39,
J67, J70-J98) 2 2 0 4.6 8.9 0.0 10.6 21.3 0.0Peptic ulcer (K25-K28) 0 0 0 0.0 0.0 0.0 0.0 0.0 0.0Diseases of appendix (K35-K38) 0 0 0 0.0 0.0 0.0 0.0 0.0 0.0Hernia (K40-K46) 0 0 0 0.0 0.0 0.0 0.0 0.0 0.0Chronic liver disease and cirrhosis (K70, K73-K74) 1 1 0 2.3 4.4 0.0 2.7 4.5 0.0Alcoholic liver disease (K70) 0 0 0 0.0 0.0 0.0 0.0 0.0 0.0Other chronic liver disease and cirrhosis (K73-K74) 1 1 0 2.3 4.4 0.0 2.7 4.5 0.0Cholelithiasis and other disorders of gallbladder (K80-K82) 0 0 0 0.0 0.0 0.0 0.0 0.0 0.0Nephritis, nephrotic syndrome and nephrosis (N00-N07,
N17-N19, N25-N27) 1 0 1 2.3 0.0 4.7 6.8 0.0 11.0Acute and rapidly progressive nephritic and nephrotic
syndrome (N00-N01, N04) 0 0 0 0.0 0.0 0.0 0.0 0.0 0.0Chronic glomerulonephritis, nephritis and nephropathy
not specified as acute or chronic, and renal sclerosisunspecified (N02-N03, N05-N07, N26) 0 0 0 0.0 0.0 0.0 0.0 0.0 0.0
Renal failure (N17-N19) 1 0 1 2.3 0.0 4.7 6.8 0.0 11.0Other disorders of kidney (N25, N27) 0 0 0 0.0 0.0 0.0 0.0 0.0 0.0Infections of kidney (N10-N12, N13.6, N15.1) 0 0 0 0.0 0.0 0.0 0.0 0.0 0.0Hyperplasia of prostate (N40) ... 0 ... ... 0.0 ... ... 0.0 ...Inflammatory diseases of female pelvic organs (N70-N76) ... ... 0 ... ... 0.0 ... ... 0.0Pregnancy, childbirth and the puerperium (O00-O99) ... ... 0 ... ... 0.0 ... ... 0.0Pregnancy with abortive outcome (O00-O07) ... ... 0 ... ... 0.0 ... ... 0.0Other complications of pregnancy, childbirth and the
puerperium (O10-O99) ... ... 0 ... ... 0.0 ... ... 0.0Certain conditions originating in the perinatal period
(P00-P96) 8 3 5 18.3 13.3 23.7 16.1 11.5 21.3Congenital malformations, deformations and chromosomal
abnormalities (Q00-Q99) 3 1 2 6.9 4.4 9.5 5.9 3.5 8.5Symptoms, signs and abnormal clinical and laboratory
findings, not elsewhere classified (R00-R99) 15 7 8 34.4 31.1 37.9 47.5 28.5 60.2All other diseases (residual) 7 19 10 9 43.5 44.4 42.7 72.7 73.0 72.0Accidents (unintentional injuries) (V01-X59, Y85-Y86) 21 13 8 48.1 57.7 37.9 57.9 62.6 50.9Transport accidents (V01-V99, Y85) 4 2 2 9.2 8.9 9.5 8.9 8.8 9.2Motor vehicle accidents 8 4 2 2 9.2 8.9 9.5 8.9 8.8 9.2Other land transport accidents 9 0 0 0 0.0 0.0 0.0 0.0 0.0 0.0Water, air and space, and other and unspecified transport
accidents and their sequelae (V90-V99, Y85) 0 0 0 0.0 0.0 0.0 0.0 0.0 0.0Nontransport accidents (W00-X59, Y86) 17 11 6 39.0 48.8 28.4 49.0 53.8 41.8Falls (W00-W19) 2 1 1 4.6 4.4 4.7 8.0 4.5 11.1Accidental discharge of firearms (W32-W34) 0 0 0 0.0 0.0 0.0 0.0 0.0 0.0Accidental drowning and submersion (W65-W74) 3 3 0 6.9 13.3 0.0 6.5 12.7 0.0Accidental exposure to smoke, fire and flames (X00-X09) 0 0 0 0.0 0.0 0.0 0.0 0.0 0.0Accidental poisoning and exposure to noxious substances
(X40-X49) 10 6 4 22.9 26.6 19.0 22.1 25.7 19.7
See notes at the end of the table.
Statistics Canada – Catalogue no. 84F0209X 49

Mortality, Summary List of Causes – 2009
Table 1-13 – continued
Deaths and mortality rate, by selected grouped causes, sex and geography — Northwest Territories1
Number of deaths Crude mortality rateper 100,000 population 2
Age-standardized mortality rateper 100,000 population 2
Bothsexes
Males Females Bothsexes
Males Females Bothsexes
Males Females
Other and unspecified nontransport accidents and theirsequelae (W20-W31, W35-W64, W75-W99, X10-X39,X50-X59, Y86) 2 1 1 4.6 4.4 4.7 12.4 11.0 11.0
Intentional self-harm (suicide) (X60-X84, Y87.0) 7 5 2 16.0 22.2 9.5 14.9 19.9 9.1Intentional self-harm (suicide) by discharge of firearms
(X72-X74) 1 1 0 2.3 4.4 0.0 2.6 5.0 0.0Intentional self-harm (suicide) by other and unspecified
means and their sequelae (X60-X71, X75-X84, Y87.0) 6 4 2 13.7 17.7 9.5 12.3 14.9 9.1Assault (homicide) (X85-Y09, Y87.1) 0 0 0 0.0 0.0 0.0 0.0 0.0 0.0Assault (homicide) by discharge of firearms (X93-X95) 0 0 0 0.0 0.0 0.0 0.0 0.0 0.0Assault (homicide) by other and unspecified means and
their sequelae (X85-X92, X96-Y09, Y87.1) 0 0 0 0.0 0.0 0.0 0.0 0.0 0.0Legal intervention (Y35, Y89.0) 0 0 0 0.0 0.0 0.0 0.0 0.0 0.0Events of undetermined intent (Y10-Y34, Y87.2, Y89.9) 0 0 0 0.0 0.0 0.0 0.0 0.0 0.0Discharge of firearms, undetermined intent (Y22-Y24) 0 0 0 0.0 0.0 0.0 0.0 0.0 0.0Other and unspecified events of undetermined intent and
their sequelae (Y10-Y21, Y25-Y34, Y87.2, Y89.9) 0 0 0 0.0 0.0 0.0 0.0 0.0 0.0Operations of war and their sequelae (Y36, Y89.1) 0 0 0 0.0 0.0 0.0 0.0 0.0 0.0Complications of medical and surgical care (Y40-Y84, Y88) 0 0 0 0.0 0.0 0.0 0.0 0.0 0.0
1. The geographic distribution of deaths in this table is based on the deceased’s usual place of residence.2. Starting in 2005, the population estimates used to calculate the mortality rates are presented in the Appendix II of the publication "Mortality Summary List of
Causes" (catalogue number 84F0209XIE).3. The cause of death tabulated is the underlying cause of death. This is defined as (a) the disease or injury which initiated the train of events leading directly to
death, or (b) the circumstances of the accident or violence which produced the fatal injury. The underlying cause is selected from the conditions listed onthe medical certificate of cause of death.
4. World Health Organization (WHO), International Statistical Classification of Diseases and Related Health Problems, Tenth Revision (ICD-10)5. National Center for Health Statistics, United States. "B" list in "Instruction Manual; Part 9; ICD-10 Cause-of-Death Lists for Tabulating Mortality Statistics".6. Other and unspecified infectious and parasitic diseases and their sequelae A00, A05, A20 to A36, A42 to A44, A48 to A49, A54 to A79, A81 to A82,
A85.0 to A85.1, A85.8, A86 to B04, B06 to B09, B25 to B49, B55 to B99.7. All other diseases (residual) D65 to E07, E15 to E34, E65 to F99, G04 to G12, G23 to G25, G31 to H93, K00 to K22, K29 to K31, K50 to K66, K71 to K72, K75 to
K76, K83 to M99, N13.0 to N13.5, N13.7 to N13.9, N14, N15.0, N15.8 to N15.9, N20 to N23, N28 to N39, N41 to N64, N80 to N98. As of 2003, also includes U04.8. Motor vehicle accidents V02 to V04, V09.0, V09.2, V12 to V14, V19.0 to V19.2, V19.4 to V19.6, V20 to V79, V80.3 to V80.5, V81.0 to V81.1, V82.0 to V82.1,
V83 to V86, V87.0 to V87.8, V88.0 to V88.8, V89.0, V89.2.9. Other land transport accidents V01, V05 to V06, V09.1, V09.3 to V09.9, V10 to V11, V15 to V18, V19.3, V19.8 to V19.9, V80.0 to V80.2, V80.6 to V80.9,
V81.2 to V81.9, V82.2 to V82.9, V87.9, V88.9, V89.1, V89.3, V89.9.Note(s): See Data quality, concepts and methodology — Explanatory notes for the tables section.Source(s): Statistics Canada, Canadian Vital Statistics, Birth and Death Databases (CANSIM table 102-0552) and Appendix II.
50 Statistics Canada – Catalogue no. 84F0209X

Mortality, Summary List of Causes – 2009
Table 1-14Deaths and mortality rate, by selected grouped causes, sex and geography — Nunavut1
Number of deaths Crude mortality rateper 100,000 population 2
Age-standardized mortality rateper 100,000 population 2
Bothsexes
Males Females Bothsexes
Males Females Bothsexes
Males Females
Total, all causes of death (A00-Y89) 3 , 4 , 5 162 94 68 502.5 563.9 436.7 1,165.0 1,409.5 979.6
Salmonella infections (A01-A02) 0 0 0 0.0 0.0 0.0 0.0 0.0 0.0Shigellosis and amoebiasis (A03, A06) 0 0 0 0.0 0.0 0.0 0.0 0.0 0.0Certain other intestinal infections (A04, A07-A09) 2 2 0 6.2 12.0 0.0 3.7 7.2 0.0Tuberculosis (A16-A19) 1 1 0 3.1 6.0 0.0 11.6 20.3 0.0Respiratory tuberculosis (A16) 1 1 0 3.1 6.0 0.0 11.6 20.3 0.0Other tuberculosis (A17-A19) 0 0 0 0.0 0.0 0.0 0.0 0.0 0.0Whooping cough (A37) 0 0 0 0.0 0.0 0.0 0.0 0.0 0.0Scarlet fever and erysipelas (A38, A46) 0 0 0 0.0 0.0 0.0 0.0 0.0 0.0Meningococcal infection (A39) 0 0 0 0.0 0.0 0.0 0.0 0.0 0.0Septicaemia (A40-A41) 2 1 1 6.2 6.0 6.4 13.7 20.3 4.3Syphilis (A50-A53) 0 0 0 0.0 0.0 0.0 0.0 0.0 0.0Acute poliomyelitis (A80) 0 0 0 0.0 0.0 0.0 0.0 0.0 0.0Arthropod-borne viral encephalitis (A83-A84, A85.2) 0 0 0 0.0 0.0 0.0 0.0 0.0 0.0Measles (B05) 0 0 0 0.0 0.0 0.0 0.0 0.0 0.0Viral hepatitis (B15-B19) 0 0 0 0.0 0.0 0.0 0.0 0.0 0.0Human immunodeficiency virus [HIV] disease (B20-B24) 0 0 0 0.0 0.0 0.0 0.0 0.0 0.0Malaria (B50-B54) 0 0 0 0.0 0.0 0.0 0.0 0.0 0.0Other and unspecified infectious and parasitic diseases
and their sequelae 6 0 0 0 0.0 0.0 0.0 0.0 0.0 0.0Malignant neoplasms (C00-C97) 43 20 23 133.4 120.0 147.7 377.8 349.4 408.1Malignant neoplasms of lip, oral cavity and pharynx
(C00-C14) 1 0 1 3.1 0.0 6.4 14.6 0.0 33.5Malignant neoplasm of oesophagus (C15) 0 0 0 0.0 0.0 0.0 0.0 0.0 0.0Malignant neoplasm of stomach (C16) 2 2 0 6.2 12.0 0.0 20.0 37.3 0.0Malignant neoplasms of colon, rectum and anus
(C18-C21) 9 6 3 27.9 36.0 19.3 66.8 53.5 74.0Malignant neoplasm of liver and intrahepatic bile ducts
(C22) 0 0 0 0.0 0.0 0.0 0.0 0.0 0.0Malignant neoplasm of pancreas (C25) 2 0 2 6.2 0.0 12.8 12.4 0.0 25.5Malignant neoplasm of larynx (C32) 0 0 0 0.0 0.0 0.0 0.0 0.0 0.0Malignant neoplasms of trachea, bronchus and lung
(C33-C34) 14 6 8 43.4 36.0 51.4 137.6 156.7 119.6Malignant melanoma of skin (C43) 0 0 0 0.0 0.0 0.0 0.0 0.0 0.0Malignant neoplasm of breast (C50) 0 0 0 0.0 0.0 0.0 0.0 0.0 0.0Malignant neoplasm of cervix uteri (C53) ... ... 1 ... ... 6.4 ... ... 7.3Malignant neoplasms of corpus uteri and uterus, part
unspecified (C54-C55) ... ... 0 ... ... 0.0 ... ... 0.0Malignant neoplasm of ovary (C56) ... ... 1 ... ... 6.4 ... ... 11.8Malignant neoplasm of prostate (C61) ... 0 ... ... 0.0 ... ... 0.0 ...Malignant neoplasms of kidney and renal pelvis
(C64-C65) 0 0 0 0.0 0.0 0.0 0.0 0.0 0.0Malignant neoplasm of bladder (C67) 0 0 0 0.0 0.0 0.0 0.0 0.0 0.0Malignant neoplasms of meninges, brain and other parts
of central nervous system (C70-C72) 1 0 1 3.1 0.0 6.4 4.0 0.0 8.8Malignant neoplasms of lymphoid, haematopoietic
and related tissue (C81-C96) 3 2 1 9.3 12.0 6.4 9.9 11.1 8.2Hodgkin’s disease (C81) 0 0 0 0.0 0.0 0.0 0.0 0.0 0.0Non-Hodgkin’s lymphoma (C82-C85) 0 0 0 0.0 0.0 0.0 0.0 0.0 0.0Leukaemia (C91-C95) 3 2 1 9.3 12.0 6.4 9.9 11.1 8.2Multiple myeloma and immunoproliferative neoplasms
(C88, C90) 0 0 0 0.0 0.0 0.0 0.0 0.0 0.0Other and unspecified malignant neoplasms of lymphoid,
haematopoietic and related tissue (C96) 0 0 0 0.0 0.0 0.0 0.0 0.0 0.0All other and unspecified malignant neoplasms (C17,
C23-C24, C26-C31, C37-C41, C44-C49, C51-C52,C57-C60, C62-C63, C66, C68-C69, C73-C80, C97) 9 4 5 27.9 24.0 32.1 103.8 90.7 119.5
In situ neoplasms, benign neoplasms and neoplasms ofuncertain or unknown behaviour (D00-D48) 0 0 0 0.0 0.0 0.0 0.0 0.0 0.0
Anaemias (D50-D64) 2 2 0 6.2 12.0 0.0 34.2 72.6 0.0Diabetes mellitus (E10-E14) 0 0 0 0.0 0.0 0.0 0.0 0.0 0.0Nutritional deficiencies (E40-E64) 0 0 0 0.0 0.0 0.0 0.0 0.0 0.0Malnutrition (E40-E46) 0 0 0 0.0 0.0 0.0 0.0 0.0 0.0Other nutritional deficiencies (E50-E64) 0 0 0 0.0 0.0 0.0 0.0 0.0 0.0Meningitis (G00, G03) 0 0 0 0.0 0.0 0.0 0.0 0.0 0.0Parkinson’s disease (G20-G21) 0 0 0 0.0 0.0 0.0 0.0 0.0 0.0Alzheimer’s disease (G30) 0 0 0 0.0 0.0 0.0 0.0 0.0 0.0Major cardiovascular diseases (I00-I78) 14 10 4 43.4 60.0 25.7 145.6 249.2 60.5Diseases of heart (I00-I09, I11, I13, I20-I51) 11 8 3 34.1 48.0 19.3 125.2 219.6 52.3Acute rheumatic fever and chronic rheumatic heart
diseases (I00-I09) 1 1 0 3.1 6.0 0.0 14.6 25.7 0.0Hypertensive heart disease (I11) 0 0 0 0.0 0.0 0.0 0.0 0.0 0.0Hypertensive heart and renal disease (I13) 0 0 0 0.0 0.0 0.0 0.0 0.0 0.0Ischaemic heart diseases (I20-I25) 3 2 1 9.3 12.0 6.4 34.6 69.3 7.0
See notes at the end of the table.
Statistics Canada – Catalogue no. 84F0209X 51

Mortality, Summary List of Causes – 2009
Table 1-14 – continued
Deaths and mortality rate, by selected grouped causes, sex and geography — Nunavut1
Number of deaths Crude mortality rateper 100,000 population 2
Age-standardized mortality rateper 100,000 population 2
Bothsexes
Males Females Bothsexes
Males Females Bothsexes
Males Females
Acute myocardial infarction (I21-I22) 2 1 1 6.2 6.0 6.4 26.2 52.3 7.0Other acute ischaemic heart diseases (I24) 0 0 0 0.0 0.0 0.0 0.0 0.0 0.0Other forms of chronic ischaemic heart disease (I20,
I25) 1 1 0 3.1 6.0 0.0 8.4 17.0 0.0Atherosclerotic cardiovascular disease, so described
(I25.0) 1 1 0 3.1 6.0 0.0 8.4 17.0 0.0All other forms of chronic ischaemic heart disease (I20,
I25.1-I25.9) 0 0 0 0.0 0.0 0.0 0.0 0.0 0.0Other heart diseases (I26-I51) 7 5 2 21.7 30.0 12.8 76.1 124.6 45.3Acute and subacute endocarditis (I33) 0 0 0 0.0 0.0 0.0 0.0 0.0 0.0Diseases of pericardium and acute myocarditis (I30-I31,
I40) 0 0 0 0.0 0.0 0.0 0.0 0.0 0.0Heart failure (I50) 1 1 0 3.1 6.0 0.0 22.7 52.3 0.0All other forms of heart disease (I26-I28, I34-I38, I42-I49,
I51) 6 4 2 18.6 24.0 12.8 53.4 72.3 45.3Essential hypertension and hypertensive renal disease
(I10, I12, I15) 1 1 0 3.1 6.0 0.0 14.6 25.7 0.0Cerebrovascular diseases (I60-I69) 2 1 1 6.2 6.0 6.4 5.9 3.9 8.2Atherosclerosis (I70) 0 0 0 0.0 0.0 0.0 0.0 0.0 0.0Other diseases of circulatory system (I71-I78) 0 0 0 0.0 0.0 0.0 0.0 0.0 0.0Aortic aneurysm and dissection (I71) 0 0 0 0.0 0.0 0.0 0.0 0.0 0.0Other diseases of arteries, arterioles and capillaries
(I72-I78) 0 0 0 0.0 0.0 0.0 0.0 0.0 0.0Other disorders of circulatory system (I80-I99) 0 0 0 0.0 0.0 0.0 0.0 0.0 0.0Influenza and pneumonia (J09-J18) 5 2 3 15.5 12.0 19.3 53.0 59.5 38.4Influenza (J09-J11) 1 0 1 3.1 0.0 6.4 2.1 0.0 4.3Pneumonia (J12-J18) 4 2 2 12.4 12.0 12.8 50.9 59.5 34.1Other acute lower respiratory infections (J20-J22) 0 0 0 0.0 0.0 0.0 0.0 0.0 0.0Acute bronchitis and bronchiolitis (J20-J21) 0 0 0 0.0 0.0 0.0 0.0 0.0 0.0Unspecified acute lower respiratory infection (J22) 0 0 0 0.0 0.0 0.0 0.0 0.0 0.0Chronic lower respiratory diseases (J40-J47) 11 4 7 34.1 24.0 45.0 106.8 80.0 120.5Bronchitis, chronic and unspecified (J40-J42) 0 0 0 0.0 0.0 0.0 0.0 0.0 0.0Emphysema (J43) 0 0 0 0.0 0.0 0.0 0.0 0.0 0.0Asthma (J45-J46) 0 0 0 0.0 0.0 0.0 0.0 0.0 0.0Other chronic lower respiratory diseases (J44, J47) 11 4 7 34.1 24.0 45.0 106.8 80.0 120.5Pneumoconioses and chemical effects (J60-J66, J68) 0 0 0 0.0 0.0 0.0 0.0 0.0 0.0Pneumonitis due to solids and liquids (J69) 0 0 0 0.0 0.0 0.0 0.0 0.0 0.0Other diseases of respiratory system (J00-J06, J30-J39,
J67, J70-J98) 3 1 2 9.3 6.0 12.8 45.8 20.3 57.8Peptic ulcer (K25-K28) 0 0 0 0.0 0.0 0.0 0.0 0.0 0.0Diseases of appendix (K35-K38) 0 0 0 0.0 0.0 0.0 0.0 0.0 0.0Hernia (K40-K46) 1 1 0 3.1 6.0 0.0 3.8 7.3 0.0Chronic liver disease and cirrhosis (K70, K73-K74) 1 0 1 3.1 0.0 6.4 11.6 0.0 27.0Alcoholic liver disease (K70) 0 0 0 0.0 0.0 0.0 0.0 0.0 0.0Other chronic liver disease and cirrhosis (K73-K74) 1 0 1 3.1 0.0 6.4 11.6 0.0 27.0Cholelithiasis and other disorders of gallbladder
(K80-K82) 1 0 1 3.1 0.0 6.4 8.4 0.0 16.6Nephritis, nephrotic syndrome and nephrosis
(N00-N07, N17-N19, N25-N27) 3 2 1 9.3 12.0 6.4 59.8 110.6 30.9Acute and rapidly progressive nephritic and nephrotic
syndrome (N00-N01, N04) 0 0 0 0.0 0.0 0.0 0.0 0.0 0.0Chronic glomerulonephritis, nephritis and nephropathy
not specified as acute or chronic, and renal sclerosisunspecified (N02-N03, N05-N07, N26) 0 0 0 0.0 0.0 0.0 0.0 0.0 0.0
Renal failure (N17-N19) 3 2 1 9.3 12.0 6.4 59.8 110.6 30.9Other disorders of kidney (N25, N27) 0 0 0 0.0 0.0 0.0 0.0 0.0 0.0Infections of kidney (N10-N12, N13.6, N15.1) 0 0 0 0.0 0.0 0.0 0.0 0.0 0.0Hyperplasia of prostate (N40) ... 0 ... ... 0.0 ... ... 0.0 ...Inflammatory diseases of female pelvic organs (N70-N76) ... ... 0 ... ... 0.0 ... ... 0.0Pregnancy, childbirth and the puerperium (O00-O99) ... ... 0 ... ... 0.0 ... ... 0.0Pregnancy with abortive outcome (O00-O07) ... ... 0 ... ... 0.0 ... ... 0.0Other complications of pregnancy, childbirth and the
puerperium (O10-O99) ... ... 0 ... ... 0.0 ... ... 0.0Certain conditions originating in the perinatal period
(P00-P96) 6 5 1 18.6 30.0 6.4 9.8 16.4 3.3Congenital malformations, deformations and
chromosomal abnormalities (Q00-Q99) 4 2 2 12.4 12.0 12.8 6.9 7.1 6.5Symptoms, signs and abnormal clinical and laboratory
findings, not elsewhere classified (R00-R99) 12 4 8 37.2 24.0 51.4 46.4 36.1 57.1All other diseases (residual) 7 8 4 4 24.8 24.0 25.7 62.5 48.4 82.2Accidents (unintentional injuries) (V01-X59, Y85-Y86) 18 11 7 55.8 66.0 45.0 95.0 188.2 49.1Transport accidents (V01-V99, Y85) 4 3 1 12.4 18.0 6.4 14.1 20.9 7.7Motor vehicle accidents 8 4 3 1 12.4 18.0 6.4 14.1 20.9 7.7Other land transport accidents 9 0 0 0 0.0 0.0 0.0 0.0 0.0 0.0
See notes at the end of the table.
52 Statistics Canada – Catalogue no. 84F0209X

Mortality, Summary List of Causes – 2009
Table 1-14 – continued
Deaths and mortality rate, by selected grouped causes, sex and geography — Nunavut1
Number of deaths Crude mortality rateper 100,000 population 2
Age-standardized mortality rateper 100,000 population 2
Bothsexes
Males Females Bothsexes
Males Females Bothsexes
Males Females
Water, air and space, and other and unspecified transportaccidents and their sequelae (V90-V99, Y85) 0 0 0 0.0 0.0 0.0 0.0 0.0 0.0
Nontransport accidents (W00-X59, Y86) 14 8 6 43.4 48.0 38.5 80.9 167.3 41.4Falls (W00-W19) 1 1 0 3.1 6.0 0.0 22.6 84.9 0.0Accidental discharge of firearms (W32-W34) 1 1 0 3.1 6.0 0.0 2.1 4.1 0.0Accidental drowning and submersion (W65-W74) 5 3 2 15.5 18.0 12.8 14.7 15.1 13.4Accidental exposure to smoke, fire and flames (X00-X09) 0 0 0 0.0 0.0 0.0 0.0 0.0 0.0Accidental poisoning and exposure to noxious substances
(X40-X49) 4 1 3 12.4 6.0 19.3 13.5 4.8 23.8Other and unspecified nontransport accidents and
their sequelae (W20-W31, W35-W64, W75-W99,X10-X39, X50-X59, Y86) 3 2 1 9.3 12.0 6.4 27.9 58.4 4.1
Intentional self-harm (suicide) (X60-X84, Y87.0) 21 18 3 65.1 108.0 19.3 57.1 94.8 17.2Intentional self-harm (suicide) by discharge of firearms
(X72-X74) 6 5 1 18.6 30.0 6.4 17.6 26.8 7.7Intentional self-harm (suicide) by other and unspecified
means and their sequelae (X60-X71, X75-X84,Y87.0) 15 13 2 46.5 78.0 12.8 39.5 68.0 9.5
Assault (homicide) (X85-Y09, Y87.1) 3 3 0 9.3 18.0 0.0 7.5 14.3 0.0Assault (homicide) by discharge of firearms (X93-X95) 1 1 0 3.1 6.0 0.0 2.1 4.1 0.0Assault (homicide) by other and unspecified means and
their sequelae (X85-X92, X96-Y09, Y87.1) 2 2 0 6.2 12.0 0.0 5.4 10.2 0.0Legal intervention (Y35, Y89.0) 0 0 0 0.0 0.0 0.0 0.0 0.0 0.0Events of undetermined intent (Y10-Y34, Y87.2, Y89.9) 1 1 0 3.1 6.0 0.0 4.0 7.2 0.0Discharge of firearms, undetermined intent (Y22-Y24) 0 0 0 0.0 0.0 0.0 0.0 0.0 0.0Other and unspecified events of undetermined intent and
their sequelae (Y10-Y21, Y25-Y34, Y87.2, Y89.9) 1 1 0 3.1 6.0 0.0 4.0 7.2 0.0Operations of war and their sequelae (Y36, Y89.1) 0 0 0 0.0 0.0 0.0 0.0 0.0 0.0Complications of medical and surgical care (Y40-Y84,
Y88) 0 0 0 0.0 0.0 0.0 0.0 0.0 0.0
1. The geographic distribution of deaths in this table is based on the deceased’s usual place of residence.2. Starting in 2005, the population estimates used to calculate the mortality rates are presented in the Appendix II of the publication "Mortality Summary List of
Causes" (catalogue number 84F0209XIE).3. The cause of death tabulated is the underlying cause of death. This is defined as (a) the disease or injury which initiated the train of events leading directly to
death, or (b) the circumstances of the accident or violence which produced the fatal injury. The underlying cause is selected from the conditions listed onthe medical certificate of cause of death.
4. World Health Organization (WHO), International Statistical Classification of Diseases and Related Health Problems, Tenth Revision (ICD-10)5. National Center for Health Statistics, United States. "B" list in "Instruction Manual; Part 9; ICD-10 Cause-of-Death Lists for Tabulating Mortality Statistics".6. Other and unspecified infectious and parasitic diseases and their sequelae A00, A05, A20 to A36, A42 to A44, A48 to A49, A54 to A79, A81 to A82,
A85.0 to A85.1, A85.8, A86 to B04, B06 to B09, B25 to B49, B55 to B99.7. All other diseases (residual) D65 to E07, E15 to E34, E65 to F99, G04 to G12, G23 to G25, G31 to H93, K00 to K22, K29 to K31, K50 to K66, K71 to K72, K75 to
K76, K83 to M99, N13.0 to N13.5, N13.7 to N13.9, N14, N15.0, N15.8 to N15.9, N20 to N23, N28 to N39, N41 to N64, N80 to N98. As of 2003, also includes U04.8. Motor vehicle accidents V02 to V04, V09.0, V09.2, V12 to V14, V19.0 to V19.2, V19.4 to V19.6, V20 to V79, V80.3 to V80.5, V81.0 to V81.1, V82.0 to V82.1,
V83 to V86, V87.0 to V87.8, V88.0 to V88.8, V89.0, V89.2.9. Other land transport accidents V01, V05 to V06, V09.1, V09.3 to V09.9, V10 to V11, V15 to V18, V19.3, V19.8 to V19.9, V80.0 to V80.2, V80.6 to V80.9,
V81.2 to V81.9, V82.2 to V82.9, V87.9, V88.9, V89.1, V89.3, V89.9.Note(s): See Data quality, concepts and methodology — Explanatory notes for the tables section.Source(s): Statistics Canada, Canadian Vital Statistics, Birth and Death Databases (CANSIM table 102-0552) and Appendix II.
Statistics Canada – Catalogue no. 84F0209X 53
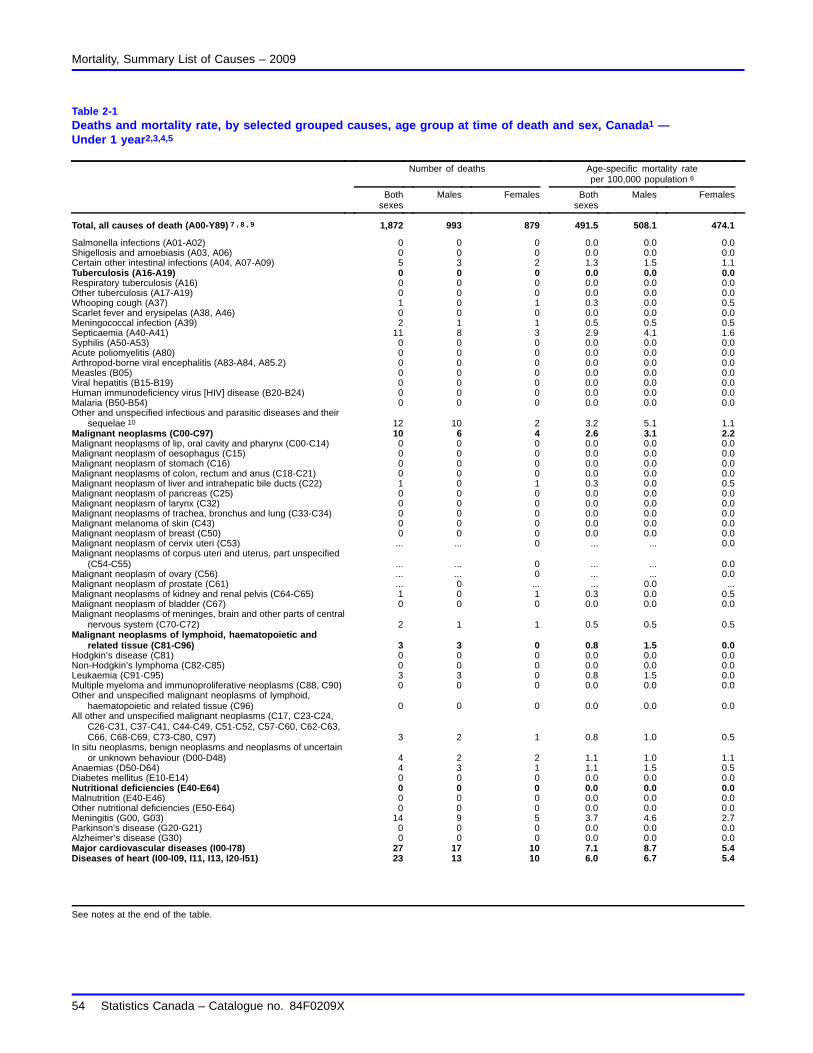
Mortality, Summary List of Causes – 2009
Table 2-1Deaths and mortality rate, by selected grouped causes, age group at time of death and sex, Canada1 —Under 1 year2,3,4,5
Number of deaths Age-specific mortality rateper 100,000 population 6
Bothsexes
Males Females Bothsexes
Males Females
Total, all causes of death (A00-Y89) 7 , 8 , 9 1,872 993 879 491.5 508.1 474.1
Salmonella infections (A01-A02) 0 0 0 0.0 0.0 0.0Shigellosis and amoebiasis (A03, A06) 0 0 0 0.0 0.0 0.0Certain other intestinal infections (A04, A07-A09) 5 3 2 1.3 1.5 1.1Tuberculosis (A16-A19) 0 0 0 0.0 0.0 0.0Respiratory tuberculosis (A16) 0 0 0 0.0 0.0 0.0Other tuberculosis (A17-A19) 0 0 0 0.0 0.0 0.0Whooping cough (A37) 1 0 1 0.3 0.0 0.5Scarlet fever and erysipelas (A38, A46) 0 0 0 0.0 0.0 0.0Meningococcal infection (A39) 2 1 1 0.5 0.5 0.5Septicaemia (A40-A41) 11 8 3 2.9 4.1 1.6Syphilis (A50-A53) 0 0 0 0.0 0.0 0.0Acute poliomyelitis (A80) 0 0 0 0.0 0.0 0.0Arthropod-borne viral encephalitis (A83-A84, A85.2) 0 0 0 0.0 0.0 0.0Measles (B05) 0 0 0 0.0 0.0 0.0Viral hepatitis (B15-B19) 0 0 0 0.0 0.0 0.0Human immunodeficiency virus [HIV] disease (B20-B24) 0 0 0 0.0 0.0 0.0Malaria (B50-B54) 0 0 0 0.0 0.0 0.0Other and unspecified infectious and parasitic diseases and their
sequelae 10 12 10 2 3.2 5.1 1.1Malignant neoplasms (C00-C97) 10 6 4 2.6 3.1 2.2Malignant neoplasms of lip, oral cavity and pharynx (C00-C14) 0 0 0 0.0 0.0 0.0Malignant neoplasm of oesophagus (C15) 0 0 0 0.0 0.0 0.0Malignant neoplasm of stomach (C16) 0 0 0 0.0 0.0 0.0Malignant neoplasms of colon, rectum and anus (C18-C21) 0 0 0 0.0 0.0 0.0Malignant neoplasm of liver and intrahepatic bile ducts (C22) 1 0 1 0.3 0.0 0.5Malignant neoplasm of pancreas (C25) 0 0 0 0.0 0.0 0.0Malignant neoplasm of larynx (C32) 0 0 0 0.0 0.0 0.0Malignant neoplasms of trachea, bronchus and lung (C33-C34) 0 0 0 0.0 0.0 0.0Malignant melanoma of skin (C43) 0 0 0 0.0 0.0 0.0Malignant neoplasm of breast (C50) 0 0 0 0.0 0.0 0.0Malignant neoplasm of cervix uteri (C53) ... ... 0 ... ... 0.0Malignant neoplasms of corpus uteri and uterus, part unspecified
(C54-C55) ... ... 0 ... ... 0.0Malignant neoplasm of ovary (C56) ... ... 0 ... ... 0.0Malignant neoplasm of prostate (C61) ... 0 ... ... 0.0 ...Malignant neoplasms of kidney and renal pelvis (C64-C65) 1 0 1 0.3 0.0 0.5Malignant neoplasm of bladder (C67) 0 0 0 0.0 0.0 0.0Malignant neoplasms of meninges, brain and other parts of central
nervous system (C70-C72) 2 1 1 0.5 0.5 0.5Malignant neoplasms of lymphoid, haematopoietic and
related tissue (C81-C96) 3 3 0 0.8 1.5 0.0Hodgkin’s disease (C81) 0 0 0 0.0 0.0 0.0Non-Hodgkin’s lymphoma (C82-C85) 0 0 0 0.0 0.0 0.0Leukaemia (C91-C95) 3 3 0 0.8 1.5 0.0Multiple myeloma and immunoproliferative neoplasms (C88, C90) 0 0 0 0.0 0.0 0.0Other and unspecified malignant neoplasms of lymphoid,
haematopoietic and related tissue (C96) 0 0 0 0.0 0.0 0.0All other and unspecified malignant neoplasms (C17, C23-C24,
C26-C31, C37-C41, C44-C49, C51-C52, C57-C60, C62-C63,C66, C68-C69, C73-C80, C97) 3 2 1 0.8 1.0 0.5
In situ neoplasms, benign neoplasms and neoplasms of uncertainor unknown behaviour (D00-D48) 4 2 2 1.1 1.0 1.1
Anaemias (D50-D64) 4 3 1 1.1 1.5 0.5Diabetes mellitus (E10-E14) 0 0 0 0.0 0.0 0.0Nutritional deficiencies (E40-E64) 0 0 0 0.0 0.0 0.0Malnutrition (E40-E46) 0 0 0 0.0 0.0 0.0Other nutritional deficiencies (E50-E64) 0 0 0 0.0 0.0 0.0Meningitis (G00, G03) 14 9 5 3.7 4.6 2.7Parkinson’s disease (G20-G21) 0 0 0 0.0 0.0 0.0Alzheimer’s disease (G30) 0 0 0 0.0 0.0 0.0Major cardiovascular diseases (I00-I78) 27 17 10 7.1 8.7 5.4Diseases of heart (I00-I09, I11, I13, I20-I51) 23 13 10 6.0 6.7 5.4
See notes at the end of the table.
54 Statistics Canada – Catalogue no. 84F0209X

Mortality, Summary List of Causes – 2009
Table 2-1 – continued
Deaths and mortality rate, by selected grouped causes, age group at time of death and sex, Canada1 —Under 1 year2,3,4,5
Number of deaths Age-specific mortality rateper 100,000 population 6
Bothsexes
Males Females Bothsexes
Males Females
Acute rheumatic fever and chronic rheumatic heart diseases(I00-I09) 0 0 0 0.0 0.0 0.0
Hypertensive heart disease (I11) 0 0 0 0.0 0.0 0.0Hypertensive heart and renal disease (I13) 0 0 0 0.0 0.0 0.0Ischaemic heart diseases (I20-I25) 1 1 0 0.3 0.5 0.0Acute myocardial infarction (I21-I22) 0 0 0 0.0 0.0 0.0Other acute ischaemic heart diseases (I24) 0 0 0 0.0 0.0 0.0Other forms of chronic ischaemic heart disease (I20, I25) 1 1 0 0.3 0.5 0.0Atherosclerotic cardiovascular disease, so described (I25.0) 0 0 0 0.0 0.0 0.0All other forms of chronic ischaemic heart disease (I20, I25.1-I25.9) 1 1 0 0.3 0.5 0.0Other heart diseases (I26-I51) 22 12 10 5.8 6.1 5.4Acute and subacute endocarditis (I33) 0 0 0 0.0 0.0 0.0Diseases of pericardium and acute myocarditis (I30-I31, I40) 3 2 1 0.8 1.0 0.5Heart failure (I50) 0 0 0 0.0 0.0 0.0All other forms of heart disease (I26-I28, I34-I38, I42-I49, I51) 19 10 9 5.0 5.1 4.9Essential hypertension and hypertensive renal disease (I10, I12,
I15) 1 1 0 0.3 0.5 0.0Cerebrovascular diseases (I60-I69) 3 3 0 0.8 1.5 0.0Atherosclerosis (I70) 0 0 0 0.0 0.0 0.0Other diseases of circulatory system (I71-I78) 0 0 0 0.0 0.0 0.0Aortic aneurysm and dissection (I71) 0 0 0 0.0 0.0 0.0Other diseases of arteries, arterioles and capillaries (I72-I78) 0 0 0 0.0 0.0 0.0Other disorders of circulatory system (I80-I99) 1 0 1 0.3 0.0 0.5Influenza and pneumonia (J09-J18) 14 9 5 3.7 4.6 2.7Influenza (J09-J11) 5 2 3 1.3 1.0 1.6Pneumonia (J12-J18) 9 7 2 2.4 3.6 1.1Other acute lower respiratory infections (J20-J22) 1 1 0 0.3 0.5 0.0Acute bronchitis and bronchiolitis (J20-J21) 1 1 0 0.3 0.5 0.0Unspecified acute lower respiratory infection (J22) 0 0 0 0.0 0.0 0.0Chronic lower respiratory diseases (J40-J47) 1 0 1 0.3 0.0 0.5Bronchitis, chronic and unspecified (J40-J42) 0 0 0 0.0 0.0 0.0Emphysema (J43) 1 0 1 0.3 0.0 0.5Asthma (J45-J46) 0 0 0 0.0 0.0 0.0Other chronic lower respiratory diseases (J44, J47) 0 0 0 0.0 0.0 0.0Pneumoconioses and chemical effects (J60-J66, J68) 0 0 0 0.0 0.0 0.0Pneumonitis due to solids and liquids (J69) 1 1 0 0.3 0.5 0.0Other diseases of respiratory system (J00-J06, J30-J39, J67,
J70-J98) 9 5 4 2.4 2.6 2.2Peptic ulcer (K25-K28) 0 0 0 0.0 0.0 0.0Diseases of appendix (K35-K38) 0 0 0 0.0 0.0 0.0Hernia (K40-K46) 1 0 1 0.3 0.0 0.5Chronic liver disease and cirrhosis (K70, K73-K74) 0 0 0 0.0 0.0 0.0Alcoholic liver disease (K70) 0 0 0 0.0 0.0 0.0Other chronic liver disease and cirrhosis (K73-K74) 0 0 0 0.0 0.0 0.0Cholelithiasis and other disorders of gallbladder (K80-K82) 0 0 0 0.0 0.0 0.0Nephritis, nephrotic syndrome and nephrosis (N00-N07,
N17-N19, N25-N27) 0 0 0 0.0 0.0 0.0Acute and rapidly progressive nephritic and nephrotic syndrome
(N00-N01, N04) 0 0 0 0.0 0.0 0.0Chronic glomerulonephritis, nephritis and nephropathy not
specified as acute or chronic, and renal sclerosis unspecified(N02-N03, N05-N07, N26) 0 0 0 0.0 0.0 0.0
Renal failure (N17-N19) 0 0 0 0.0 0.0 0.0Other disorders of kidney (N25, N27) 0 0 0 0.0 0.0 0.0Infections of kidney (N10-N12, N13.6, N15.1) 0 0 0 0.0 0.0 0.0Hyperplasia of prostate (N40) ... 0 ... ... 0.0 ...Inflammatory diseases of female pelvic organs (N70-N76) ... ... 0 ... ... 0.0Pregnancy, childbirth and the puerperium (O00-O99) ... ... 0 ... ... 0.0Pregnancy with abortive outcome (O00-O07) ... ... 0 ... ... 0.0Other complications of pregnancy, childbirth and the puerperium
(O10-O99) ... ... 0 ... ... 0.0Certain conditions originating in the perinatal period (P00-P96) 1,064 555 509 279.4 284.0 274.5Congenital malformations, deformations and chromosomal
abnormalities (Q00-Q99) 420 215 205 110.3 110.0 110.6Symptoms, signs and abnormal clinical and laboratory findings,
not elsewhere classified (R00-R99) 160 85 75 42.0 43.5 40.5
See notes at the end of the table.
Statistics Canada – Catalogue no. 84F0209X 55

Mortality, Summary List of Causes – 2009
Table 2-1 – continued
Deaths and mortality rate, by selected grouped causes, age group at time of death and sex, Canada1 —Under 1 year2,3,4,5
Number of deaths Age-specific mortality rateper 100,000 population 6
Bothsexes
Males Females Bothsexes
Males Females
All other diseases (residual) 11 72 41 31 18.9 21.0 16.7Accidents (unintentional injuries) (V01-X59, Y85-Y86) 30 16 14 7.9 8.2 7.6Transport accidents (V01-V99, Y85) 4 3 1 1.1 1.5 0.5Motor vehicle accidents 12 3 3 0 0.8 1.5 0.0Other land transport accidents 13 0 0 0 0.0 0.0 0.0Water, air and space, and other and unspecified transport
accidents and their sequelae (V90-V99, Y85) 1 0 1 0.3 0.0 0.5Nontransport accidents (W00-X59, Y86) 26 13 13 6.8 6.7 7.0Falls (W00-W19) 1 1 0 0.3 0.5 0.0Accidental discharge of firearms (W32-W34) 0 0 0 0.0 0.0 0.0Accidental drowning and submersion (W65-W74) 1 1 0 0.3 0.5 0.0Accidental exposure to smoke, fire and flames (X00-X09) 2 0 2 0.5 0.0 1.1Accidental poisoning and exposure to noxious substances
(X40-X49) 0 0 0 0.0 0.0 0.0Other and unspecified nontransport accidents and their sequelae
(W20-W31, W35-W64, W75-W99, X10-X39, X50-X59, Y86) 22 11 11 5.8 5.6 5.9Intentional self-harm (suicide) (X60-X84, Y87.0) 0 0 0 0.0 0.0 0.0Intentional self-harm (suicide) by discharge of firearms (X72-X74) 0 0 0 0.0 0.0 0.0Intentional self-harm (suicide) by other and unspecified means
and their sequelae (X60-X71, X75-X84, Y87.0) 0 0 0 0.0 0.0 0.0Assault (homicide) (X85-Y09, Y87.1) 8 6 2 2.1 3.1 1.1Assault (homicide) by discharge of firearms (X93-X95) 0 0 0 0.0 0.0 0.0Assault (homicide) by other and unspecified means and their
sequelae (X85-X92, X96-Y09, Y87.1) 8 6 2 2.1 3.1 1.1Legal intervention (Y35, Y89.0) 0 0 0 0.0 0.0 0.0Events of undetermined intent (Y10-Y34, Y87.2, Y89.9) 0 0 0 0.0 0.0 0.0Discharge of firearms, undetermined intent (Y22-Y24) 0 0 0 0.0 0.0 0.0Other and unspecified events of undetermined intent and their
sequelae (Y10-Y21, Y25-Y34, Y87.2, Y89.9) 0 0 0 0.0 0.0 0.0Operations of war and their sequelae (Y36, Y89.1) 0 0 0 0.0 0.0 0.0Complications of medical and surgical care (Y40-Y84, Y88) 0 0 0 0.0 0.0 0.0
1. The number of deaths in this table is based on the deceased’s usual place of residence.2. Age attained at the last birthday preceding death.3. For "Age at time of death, under 1 year", the mortality rate is based on live births in the calendar year.4. For "Age at time of death, 1 to 4 years", the mortality rate is based on population estimates for 0 to 4 year olds less live births in the calendar year.5. For "Age at time of death", each age group except "All ages", the mortality rate represents the age-specific death rate or the number of deaths in a particular age
group during a given year per 100,000 population in the same age group as of July 1 of the same year.6. Starting in 2005, the population estimates used to calculate the mortality rate are presented in the Appendix II of the publication "Mortality Summary List of
Causes" (catalogue number 84F0209XIE).7. The cause of death tabulated is the underlying cause of death. This is defined as (a) the disease or injury which initiated the train of events leading directly to
death, or (b) the circumstances of the accident or violence which produced the fatal injury. The underlying cause is selected from the conditions listed onthe medical certificate of cause of death.
8. World Health Organization (WHO), International Statistical Classification of Diseases and Related Health Problems, Tenth Revision (ICD-10)9. National Center for Health Statistics, United States. "B" list in "Instruction Manual; Part 9; ICD-10 Cause-of-Death Lists for Tabulating Mortality Statistics".10. Other and unspecified infectious and parasitic diseases, and their sequelae A00, A05, A20 to A36, A42 to A44, A48 to A49, A54 to A79, A81 to A82,
A85.0 to A85.1, A85.8, A86 to B04, B06 to B09, B25 to B49, B55 to B99.11. All other diseases (residual) D65 to E07, E15 to E34, E65 to F99, G04 to G12, G23 to G25, G31 to H93, K00 to K22, K29 to K31, K50 to K66, K71 to K72, K75 to
K76, K83 to M99, N13.0 to N13.5, N13.7 to N13.9, N14, N15.0, N15.8 to N15.9, N20 to N23, N28 to N39, N41 to N64, N80 to N98. As of 2003, also includes U04.12. Motor vehicle accidents V02 to V04, V09.0, V09.2, V12 to V14, V19.0 to V19.2, V19.4 to V19.6, V20 to V79, V80.3 to V80.5, V81.0 to V81.1, V82.0 to V82.1,
V83 to V86, V87.0 to V87.8, V88.0 to V88.8, V89.0, V89.2.13. Other land transport accidents V01, V05 to V06, V09.1, V09.3 to V09.9, V10 to V11, V15 to V18, V19.3, V19.8 to V19.9, V80.0 to V80.2, V80.6 to V80.9,
V81.2 to V81.9, V82.2 to V82.9, V87.9, V88.9, V89.1, V89.3, V89.9.Note(s): See Data quality, concepts and methodology — Explanatory notes for the tables section.Source(s): Statistics Canada, Canadian Vital Statistics, Birth and Death Databases (CANSIM table 102-0551) and Appendix II.
56 Statistics Canada – Catalogue no. 84F0209X

Mortality, Summary List of Causes – 2009
Table 2-2Deaths and mortality rate, by selected grouped causes, age group at time of death and sex, Canada1 — 1 to 4 years2,3,4,5
Number of deaths Age-specific mortality rateper 100,000 population 6
Bothsexes
Males Females Bothsexes
Males Females
Total, all causes of death (A00-Y89) 7 , 8 , 9 250 148 102 17.1 19.7 14.3
Salmonella infections (A01-A02) 0 0 0 0.0 0.0 0.0Shigellosis and amoebiasis (A03, A06) 1 0 1 0.1 0.0 0.1Certain other intestinal infections (A04, A07-A09) 1 1 0 0.1 0.1 0.0Tuberculosis (A16-A19) 0 0 0 0.0 0.0 0.0Respiratory tuberculosis (A16) 0 0 0 0.0 0.0 0.0Other tuberculosis (A17-A19) 0 0 0 0.0 0.0 0.0Whooping cough (A37) 0 0 0 0.0 0.0 0.0Scarlet fever and erysipelas (A38, A46) 0 0 0 0.0 0.0 0.0Meningococcal infection (A39) 2 1 1 0.1 0.1 0.1Septicaemia (A40-A41) 2 0 2 0.1 0.0 0.3Syphilis (A50-A53) 0 0 0 0.0 0.0 0.0Acute poliomyelitis (A80) 0 0 0 0.0 0.0 0.0Arthropod-borne viral encephalitis (A83-A84, A85.2) 0 0 0 0.0 0.0 0.0Measles (B05) 0 0 0 0.0 0.0 0.0Viral hepatitis (B15-B19) 0 0 0 0.0 0.0 0.0Human immunodeficiency virus [HIV] disease (B20-B24) 0 0 0 0.0 0.0 0.0Malaria (B50-B54) 0 0 0 0.0 0.0 0.0Other and unspecified infectious and parasitic diseases and their
sequelae 10 8 4 4 0.5 0.5 0.6Malignant neoplasms (C00-C97) 30 12 18 2.1 1.6 2.5Malignant neoplasms of lip, oral cavity and pharynx (C00-C14) 1 0 1 0.1 0.0 0.1Malignant neoplasm of oesophagus (C15) 0 0 0 0.0 0.0 0.0Malignant neoplasm of stomach (C16) 0 0 0 0.0 0.0 0.0Malignant neoplasms of colon, rectum and anus (C18-C21) 0 0 0 0.0 0.0 0.0Malignant neoplasm of liver and intrahepatic bile ducts (C22) 3 1 2 0.2 0.1 0.3Malignant neoplasm of pancreas (C25) 0 0 0 0.0 0.0 0.0Malignant neoplasm of larynx (C32) 0 0 0 0.0 0.0 0.0Malignant neoplasms of trachea, bronchus and lung (C33-C34) 0 0 0 0.0 0.0 0.0Malignant melanoma of skin (C43) 0 0 0 0.0 0.0 0.0Malignant neoplasm of breast (C50) 0 0 0 0.0 0.0 0.0Malignant neoplasm of cervix uteri (C53) ... ... 0 ... ... 0.0Malignant neoplasms of corpus uteri and uterus, part unspecified
(C54-C55) ... ... 0 ... ... 0.0Malignant neoplasm of ovary (C56) ... ... 0 ... ... 0.0Malignant neoplasm of prostate (C61) ... 0 ... ... 0.0 ...Malignant neoplasms of kidney and renal pelvis (C64-C65) 3 0 3 0.2 0.0 0.4Malignant neoplasm of bladder (C67) 0 0 0 0.0 0.0 0.0Malignant neoplasms of meninges, brain and other parts of central
nervous system (C70-C72) 9 4 5 0.6 0.5 0.7Malignant neoplasms of lymphoid, haematopoietic and
related tissue (C81-C96) 9 6 3 0.6 0.8 0.4Hodgkin’s disease (C81) 0 0 0 0.0 0.0 0.0Non-Hodgkin’s lymphoma (C82-C85) 1 0 1 0.1 0.0 0.1Leukaemia (C91-C95) 8 6 2 0.5 0.8 0.3Multiple myeloma and immunoproliferative neoplasms (C88, C90) 0 0 0 0.0 0.0 0.0Other and unspecified malignant neoplasms of lymphoid,
haematopoietic and related tissue (C96) 0 0 0 0.0 0.0 0.0All other and unspecified malignant neoplasms (C17, C23-C24,
C26-C31, C37-C41, C44-C49, C51-C52, C57-C60, C62-C63,C66, C68-C69, C73-C80, C97) 5 1 4 0.3 0.1 0.6
In situ neoplasms, benign neoplasms and neoplasms of uncertainor unknown behaviour (D00-D48) 2 0 2 0.1 0.0 0.3
Anaemias (D50-D64) 0 0 0 0.0 0.0 0.0Diabetes mellitus (E10-E14) 0 0 0 0.0 0.0 0.0Nutritional deficiencies (E40-E64) 0 0 0 0.0 0.0 0.0Malnutrition (E40-E46) 0 0 0 0.0 0.0 0.0Other nutritional deficiencies (E50-E64) 0 0 0 0.0 0.0 0.0Meningitis (G00, G03) 2 1 1 0.1 0.1 0.1Parkinson’s disease (G20-G21) 0 0 0 0.0 0.0 0.0Alzheimer’s disease (G30) 0 0 0 0.0 0.0 0.0Major cardiovascular diseases (I00-I78) 13 8 5 0.9 1.1 0.7Diseases of heart (I00-I09, I11, I13, I20-I51) 10 5 5 0.7 0.7 0.7Acute rheumatic fever and chronic rheumatic heart diseases
(I00-I09) 0 0 0 0.0 0.0 0.0Hypertensive heart disease (I11) 0 0 0 0.0 0.0 0.0
See notes at the end of the table.
Statistics Canada – Catalogue no. 84F0209X 57

Mortality, Summary List of Causes – 2009
Table 2-2 – continued
Deaths and mortality rate, by selected grouped causes, age group at time of death and sex, Canada1 — 1 to 4 years2,3,4,5
Number of deaths Age-specific mortality rateper 100,000 population 6
Bothsexes
Males Females Bothsexes
Males Females
Hypertensive heart and renal disease (I13) 0 0 0 0.0 0.0 0.0Ischaemic heart diseases (I20-I25) 0 0 0 0.0 0.0 0.0Acute myocardial infarction (I21-I22) 0 0 0 0.0 0.0 0.0Other acute ischaemic heart diseases (I24) 0 0 0 0.0 0.0 0.0Other forms of chronic ischaemic heart disease (I20, I25) 0 0 0 0.0 0.0 0.0Atherosclerotic cardiovascular disease, so described (I25.0) 0 0 0 0.0 0.0 0.0All other forms of chronic ischaemic heart disease (I20, I25.1-I25.9) 0 0 0 0.0 0.0 0.0Other heart diseases (I26-I51) 10 5 5 0.7 0.7 0.7Acute and subacute endocarditis (I33) 1 1 0 0.1 0.1 0.0Diseases of pericardium and acute myocarditis (I30-I31, I40) 1 1 0 0.1 0.1 0.0Heart failure (I50) 0 0 0 0.0 0.0 0.0All other forms of heart disease (I26-I28, I34-I38, I42-I49, I51) 8 3 5 0.5 0.4 0.7Essential hypertension and hypertensive renal disease (I10, I12,
I15) 0 0 0 0.0 0.0 0.0Cerebrovascular diseases (I60-I69) 3 3 0 0.2 0.4 0.0Atherosclerosis (I70) 0 0 0 0.0 0.0 0.0Other diseases of circulatory system (I71-I78) 0 0 0 0.0 0.0 0.0Aortic aneurysm and dissection (I71) 0 0 0 0.0 0.0 0.0Other diseases of arteries, arterioles and capillaries (I72-I78) 0 0 0 0.0 0.0 0.0Other disorders of circulatory system (I80-I99) 0 0 0 0.0 0.0 0.0Influenza and pneumonia (J09-J18) 14 6 8 1.0 0.8 1.1Influenza (J09-J11) 6 1 5 0.4 0.1 0.7Pneumonia (J12-J18) 8 5 3 0.5 0.7 0.4Other acute lower respiratory infections (J20-J22) 1 1 0 0.1 0.1 0.0Acute bronchitis and bronchiolitis (J20-J21) 1 1 0 0.1 0.1 0.0Unspecified acute lower respiratory infection (J22) 0 0 0 0.0 0.0 0.0Chronic lower respiratory diseases (J40-J47) 1 1 0 0.1 0.1 0.0Bronchitis, chronic and unspecified (J40-J42) 0 0 0 0.0 0.0 0.0Emphysema (J43) 0 0 0 0.0 0.0 0.0Asthma (J45-J46) 1 1 0 0.1 0.1 0.0Other chronic lower respiratory diseases (J44, J47) 0 0 0 0.0 0.0 0.0Pneumoconioses and chemical effects (J60-J66, J68) 0 0 0 0.0 0.0 0.0Pneumonitis due to solids and liquids (J69) 2 1 1 0.1 0.1 0.1Other diseases of respiratory system (J00-J06, J30-J39, J67,
J70-J98) 4 3 1 0.3 0.4 0.1Peptic ulcer (K25-K28) 1 1 0 0.1 0.1 0.0Diseases of appendix (K35-K38) 1 0 1 0.1 0.0 0.1Hernia (K40-K46) 0 0 0 0.0 0.0 0.0Chronic liver disease and cirrhosis (K70, K73-K74) 0 0 0 0.0 0.0 0.0Alcoholic liver disease (K70) 0 0 0 0.0 0.0 0.0Other chronic liver disease and cirrhosis (K73-K74) 0 0 0 0.0 0.0 0.0Cholelithiasis and other disorders of gallbladder (K80-K82) 0 0 0 0.0 0.0 0.0Nephritis, nephrotic syndrome and nephrosis (N00-N07,
N17-N19, N25-N27) 0 0 0 0.0 0.0 0.0Acute and rapidly progressive nephritic and nephrotic syndrome
(N00-N01, N04) 0 0 0 0.0 0.0 0.0Chronic glomerulonephritis, nephritis and nephropathy not
specified as acute or chronic, and renal sclerosis unspecified(N02-N03, N05-N07, N26) 0 0 0 0.0 0.0 0.0
Renal failure (N17-N19) 0 0 0 0.0 0.0 0.0Other disorders of kidney (N25, N27) 0 0 0 0.0 0.0 0.0Infections of kidney (N10-N12, N13.6, N15.1) 0 0 0 0.0 0.0 0.0Hyperplasia of prostate (N40) ... 0 ... ... 0.0 ...Inflammatory diseases of female pelvic organs (N70-N76) ... ... 0 ... ... 0.0Pregnancy, childbirth and the puerperium (O00-O99) ... ... 0 ... ... 0.0Pregnancy with abortive outcome (O00-O07) ... ... 0 ... ... 0.0Other complications of pregnancy, childbirth and the puerperium
(O10-O99) ... ... 0 ... ... 0.0Certain conditions originating in the perinatal period (P00-P96) 6 5 1 0.4 0.7 0.1Congenital malformations, deformations and chromosomal
abnormalities (Q00-Q99) 31 24 7 2.1 3.2 1.0Symptoms, signs and abnormal clinical and laboratory findings,
not elsewhere classified (R00-R99) 22 16 6 1.5 2.1 0.8All other diseases (residual) 11 40 25 15 2.7 3.3 2.1Accidents (unintentional injuries) (V01-X59, Y85-Y86) 53 30 23 3.6 4.0 3.2Transport accidents (V01-V99, Y85) 18 9 9 1.2 1.2 1.3Motor vehicle accidents 12 18 9 9 1.2 1.2 1.3
See notes at the end of the table.
58 Statistics Canada – Catalogue no. 84F0209X

Mortality, Summary List of Causes – 2009
Table 2-2 – continued
Deaths and mortality rate, by selected grouped causes, age group at time of death and sex, Canada1 — 1 to 4 years2,3,4,5
Number of deaths Age-specific mortality rateper 100,000 population 6
Bothsexes
Males Females Bothsexes
Males Females
Other land transport accidents 13 0 0 0 0.0 0.0 0.0Water, air and space, and other and unspecified transport
accidents and their sequelae (V90-V99, Y85) 0 0 0 0.0 0.0 0.0Nontransport accidents (W00-X59, Y86) 35 21 14 2.4 2.8 2.0Falls (W00-W19) 4 1 3 0.3 0.1 0.4Accidental discharge of firearms (W32-W34) 0 0 0 0.0 0.0 0.0Accidental drowning and submersion (W65-W74) 15 12 3 1.0 1.6 0.4Accidental exposure to smoke, fire and flames (X00-X09) 2 1 1 0.1 0.1 0.1Accidental poisoning and exposure to noxious substances
(X40-X49) 2 2 0 0.1 0.3 0.0Other and unspecified nontransport accidents and their sequelae
(W20-W31, W35-W64, W75-W99, X10-X39, X50-X59, Y86) 12 5 7 0.8 0.7 1.0Intentional self-harm (suicide) (X60-X84, Y87.0) 0 0 0 0.0 0.0 0.0Intentional self-harm (suicide) by discharge of firearms (X72-X74) 0 0 0 0.0 0.0 0.0Intentional self-harm (suicide) by other and unspecified means
and their sequelae (X60-X71, X75-X84, Y87.0) 0 0 0 0.0 0.0 0.0Assault (homicide) (X85-Y09, Y87.1) 11 7 4 0.8 0.9 0.6Assault (homicide) by discharge of firearms (X93-X95) 0 0 0 0.0 0.0 0.0Assault (homicide) by other and unspecified means and their
sequelae (X85-X92, X96-Y09, Y87.1) 11 7 4 0.8 0.9 0.6Legal intervention (Y35, Y89.0) 0 0 0 0.0 0.0 0.0Events of undetermined intent (Y10-Y34, Y87.2, Y89.9) 1 0 1 0.1 0.0 0.1Discharge of firearms, undetermined intent (Y22-Y24) 0 0 0 0.0 0.0 0.0Other and unspecified events of undetermined intent and their
sequelae (Y10-Y21, Y25-Y34, Y87.2, Y89.9) 1 0 1 0.1 0.0 0.1Operations of war and their sequelae (Y36, Y89.1) 0 0 0 0.0 0.0 0.0Complications of medical and surgical care (Y40-Y84, Y88) 1 1 0 0.1 0.1 0.0
1. The number of deaths in this table is based on the deceased’s usual place of residence.2. Age attained at the last birthday preceding death.3. For "Age at time of death, under 1 year", the mortality rate is based on live births in the calendar year.4. For "Age at time of death, 1 to 4 years", the mortality rate is based on population estimates for 0 to 4 year olds less live births in the calendar year.5. For "Age at time of death", each age group except "All ages", the mortality rate represents the age-specific death rate or the number of deaths in a particular age
group during a given year per 100,000 population in the same age group as of July 1 of the same year.6. Starting in 2005, the population estimates used to calculate the mortality rate are presented in the Appendix II of the publication "Mortality Summary List of
Causes" (catalogue number 84F0209XIE).7. The cause of death tabulated is the underlying cause of death. This is defined as (a) the disease or injury which initiated the train of events leading directly to
death, or (b) the circumstances of the accident or violence which produced the fatal injury. The underlying cause is selected from the conditions listed onthe medical certificate of cause of death.
8. World Health Organization (WHO), International Statistical Classification of Diseases and Related Health Problems, Tenth Revision (ICD-10)9. National Center for Health Statistics, United States. "B" list in "Instruction Manual; Part 9; ICD-10 Cause-of-Death Lists for Tabulating Mortality Statistics".10. Other and unspecified infectious and parasitic diseases, and their sequelae A00, A05, A20 to A36, A42 to A44, A48 to A49, A54 to A79, A81 to A82,
A85.0 to A85.1, A85.8, A86 to B04, B06 to B09, B25 to B49, B55 to B99.11. All other diseases (residual) D65 to E07, E15 to E34, E65 to F99, G04 to G12, G23 to G25, G31 to H93, K00 to K22, K29 to K31, K50 to K66, K71 to K72, K75 to
K76, K83 to M99, N13.0 to N13.5, N13.7 to N13.9, N14, N15.0, N15.8 to N15.9, N20 to N23, N28 to N39, N41 to N64, N80 to N98. As of 2003, also includes U04.12. Motor vehicle accidents V02 to V04, V09.0, V09.2, V12 to V14, V19.0 to V19.2, V19.4 to V19.6, V20 to V79, V80.3 to V80.5, V81.0 to V81.1, V82.0 to V82.1,
V83 to V86, V87.0 to V87.8, V88.0 to V88.8, V89.0, V89.2.13. Other land transport accidents V01, V05 to V06, V09.1, V09.3 to V09.9, V10 to V11, V15 to V18, V19.3, V19.8 to V19.9, V80.0 to V80.2, V80.6 to V80.9,
V81.2 to V81.9, V82.2 to V82.9, V87.9, V88.9, V89.1, V89.3, V89.9.Note(s): See Data quality, concepts and methodology — Explanatory notes for the tables section.Source(s): Statistics Canada, Canadian Vital Statistics, Birth and Death Databases (CANSIM table 102-0551) and Appendix II.
Statistics Canada – Catalogue no. 84F0209X 59

Mortality, Summary List of Causes – 2009
Table 2-3Deaths and mortality rate, by selected grouped causes, age group at time of death and sex, Canada1 — 5 to 9 years2,3,4,5
Number of deaths Age-specific mortality rateper 100,000 population 6
Bothsexes
Males Females Bothsexes
Males Females
Total, all causes of death (A00-Y89) 7 , 8 , 9 183 111 72 10.2 12.0 8.2
Salmonella infections (A01-A02) 0 0 0 0.0 0.0 0.0Shigellosis and amoebiasis (A03, A06) 0 0 0 0.0 0.0 0.0Certain other intestinal infections (A04, A07-A09) 0 0 0 0.0 0.0 0.0Tuberculosis (A16-A19) 0 0 0 0.0 0.0 0.0Respiratory tuberculosis (A16) 0 0 0 0.0 0.0 0.0Other tuberculosis (A17-A19) 0 0 0 0.0 0.0 0.0Whooping cough (A37) 0 0 0 0.0 0.0 0.0Scarlet fever and erysipelas (A38, A46) 0 0 0 0.0 0.0 0.0Meningococcal infection (A39) 0 0 0 0.0 0.0 0.0Septicaemia (A40-A41) 5 3 2 0.3 0.3 0.2Syphilis (A50-A53) 0 0 0 0.0 0.0 0.0Acute poliomyelitis (A80) 0 0 0 0.0 0.0 0.0Arthropod-borne viral encephalitis (A83-A84, A85.2) 0 0 0 0.0 0.0 0.0Measles (B05) 0 0 0 0.0 0.0 0.0Viral hepatitis (B15-B19) 0 0 0 0.0 0.0 0.0Human immunodeficiency virus [HIV] disease (B20-B24) 0 0 0 0.0 0.0 0.0Malaria (B50-B54) 0 0 0 0.0 0.0 0.0Other and unspecified infectious and parasitic diseases and their
sequelae 10 1 1 0 0.1 0.1 0.0Malignant neoplasms (C00-C97) 45 27 18 2.5 2.9 2.1Malignant neoplasms of lip, oral cavity and pharynx (C00-C14) 0 0 0 0.0 0.0 0.0Malignant neoplasm of oesophagus (C15) 0 0 0 0.0 0.0 0.0Malignant neoplasm of stomach (C16) 0 0 0 0.0 0.0 0.0Malignant neoplasms of colon, rectum and anus (C18-C21) 0 0 0 0.0 0.0 0.0Malignant neoplasm of liver and intrahepatic bile ducts (C22) 0 0 0 0.0 0.0 0.0Malignant neoplasm of pancreas (C25) 0 0 0 0.0 0.0 0.0Malignant neoplasm of larynx (C32) 0 0 0 0.0 0.0 0.0Malignant neoplasms of trachea, bronchus and lung (C33-C34) 0 0 0 0.0 0.0 0.0Malignant melanoma of skin (C43) 0 0 0 0.0 0.0 0.0Malignant neoplasm of breast (C50) 0 0 0 0.0 0.0 0.0Malignant neoplasm of cervix uteri (C53) ... ... 0 ... ... 0.0Malignant neoplasms of corpus uteri and uterus, part unspecified
(C54-C55) ... ... 0 ... ... 0.0Malignant neoplasm of ovary (C56) ... ... 0 ... ... 0.0Malignant neoplasm of prostate (C61) ... 0 ... ... 0.0 ...Malignant neoplasms of kidney and renal pelvis (C64-C65) 2 0 2 0.1 0.0 0.2Malignant neoplasm of bladder (C67) 0 0 0 0.0 0.0 0.0Malignant neoplasms of meninges, brain and other parts of central
nervous system (C70-C72) 20 11 9 1.1 1.2 1.0Malignant neoplasms of lymphoid, haematopoietic and
related tissue (C81-C96) 15 10 5 0.8 1.1 0.6Hodgkin’s disease (C81) 0 0 0 0.0 0.0 0.0Non-Hodgkin’s lymphoma (C82-C85) 1 0 1 0.1 0.0 0.1Leukaemia (C91-C95) 14 10 4 0.8 1.1 0.5Multiple myeloma and immunoproliferative neoplasms (C88, C90) 0 0 0 0.0 0.0 0.0Other and unspecified malignant neoplasms of lymphoid,
haematopoietic and related tissue (C96) 0 0 0 0.0 0.0 0.0All other and unspecified malignant neoplasms (C17, C23-C24,
C26-C31, C37-C41, C44-C49, C51-C52, C57-C60, C62-C63,C66, C68-C69, C73-C80, C97) 8 6 2 0.4 0.6 0.2
In situ neoplasms, benign neoplasms and neoplasms of uncertainor unknown behaviour (D00-D48) 2 0 2 0.1 0.0 0.2
Anaemias (D50-D64) 0 0 0 0.0 0.0 0.0Diabetes mellitus (E10-E14) 0 0 0 0.0 0.0 0.0Nutritional deficiencies (E40-E64) 0 0 0 0.0 0.0 0.0Malnutrition (E40-E46) 0 0 0 0.0 0.0 0.0Other nutritional deficiencies (E50-E64) 0 0 0 0.0 0.0 0.0Meningitis (G00, G03) 2 2 0 0.1 0.2 0.0Parkinson’s disease (G20-G21) 0 0 0 0.0 0.0 0.0Alzheimer’s disease (G30) 0 0 0 0.0 0.0 0.0Major cardiovascular diseases (I00-I78) 10 4 6 0.6 0.4 0.7Diseases of heart (I00-I09, I11, I13, I20-I51) 8 3 5 0.4 0.3 0.6Acute rheumatic fever and chronic rheumatic heart diseases
(I00-I09) 0 0 0 0.0 0.0 0.0Hypertensive heart disease (I11) 0 0 0 0.0 0.0 0.0
See notes at the end of the table.
60 Statistics Canada – Catalogue no. 84F0209X

Mortality, Summary List of Causes – 2009
Table 2-3 – continued
Deaths and mortality rate, by selected grouped causes, age group at time of death and sex, Canada1 — 5 to 9 years2,3,4,5
Number of deaths Age-specific mortality rateper 100,000 population 6
Bothsexes
Males Females Bothsexes
Males Females
Hypertensive heart and renal disease (I13) 0 0 0 0.0 0.0 0.0Ischaemic heart diseases (I20-I25) 0 0 0 0.0 0.0 0.0Acute myocardial infarction (I21-I22) 0 0 0 0.0 0.0 0.0Other acute ischaemic heart diseases (I24) 0 0 0 0.0 0.0 0.0Other forms of chronic ischaemic heart disease (I20, I25) 0 0 0 0.0 0.0 0.0Atherosclerotic cardiovascular disease, so described (I25.0) 0 0 0 0.0 0.0 0.0All other forms of chronic ischaemic heart disease (I20, I25.1-I25.9) 0 0 0 0.0 0.0 0.0Other heart diseases (I26-I51) 8 3 5 0.4 0.3 0.6Acute and subacute endocarditis (I33) 0 0 0 0.0 0.0 0.0Diseases of pericardium and acute myocarditis (I30-I31, I40) 1 0 1 0.1 0.0 0.1Heart failure (I50) 0 0 0 0.0 0.0 0.0All other forms of heart disease (I26-I28, I34-I38, I42-I49, I51) 7 3 4 0.4 0.3 0.5Essential hypertension and hypertensive renal disease (I10, I12,
I15) 0 0 0 0.0 0.0 0.0Cerebrovascular diseases (I60-I69) 2 1 1 0.1 0.1 0.1Atherosclerosis (I70) 0 0 0 0.0 0.0 0.0Other diseases of circulatory system (I71-I78) 0 0 0 0.0 0.0 0.0Aortic aneurysm and dissection (I71) 0 0 0 0.0 0.0 0.0Other diseases of arteries, arterioles and capillaries (I72-I78) 0 0 0 0.0 0.0 0.0Other disorders of circulatory system (I80-I99) 0 0 0 0.0 0.0 0.0Influenza and pneumonia (J09-J18) 7 4 3 0.4 0.4 0.3Influenza (J09-J11) 4 2 2 0.2 0.2 0.2Pneumonia (J12-J18) 3 2 1 0.2 0.2 0.1Other acute lower respiratory infections (J20-J22) 0 0 0 0.0 0.0 0.0Acute bronchitis and bronchiolitis (J20-J21) 0 0 0 0.0 0.0 0.0Unspecified acute lower respiratory infection (J22) 0 0 0 0.0 0.0 0.0Chronic lower respiratory diseases (J40-J47) 2 2 0 0.1 0.2 0.0Bronchitis, chronic and unspecified (J40-J42) 0 0 0 0.0 0.0 0.0Emphysema (J43) 0 0 0 0.0 0.0 0.0Asthma (J45-J46) 2 2 0 0.1 0.2 0.0Other chronic lower respiratory diseases (J44, J47) 0 0 0 0.0 0.0 0.0Pneumoconioses and chemical effects (J60-J66, J68) 0 0 0 0.0 0.0 0.0Pneumonitis due to solids and liquids (J69) 2 2 0 0.1 0.2 0.0Other diseases of respiratory system (J00-J06, J30-J39, J67,
J70-J98) 1 1 0 0.1 0.1 0.0Peptic ulcer (K25-K28) 0 0 0 0.0 0.0 0.0Diseases of appendix (K35-K38) 0 0 0 0.0 0.0 0.0Hernia (K40-K46) 1 1 0 0.1 0.1 0.0Chronic liver disease and cirrhosis (K70, K73-K74) 0 0 0 0.0 0.0 0.0Alcoholic liver disease (K70) 0 0 0 0.0 0.0 0.0Other chronic liver disease and cirrhosis (K73-K74) 0 0 0 0.0 0.0 0.0Cholelithiasis and other disorders of gallbladder (K80-K82) 0 0 0 0.0 0.0 0.0Nephritis, nephrotic syndrome and nephrosis (N00-N07,
N17-N19, N25-N27) 1 1 0 0.1 0.1 0.0Acute and rapidly progressive nephritic and nephrotic syndrome
(N00-N01, N04) 0 0 0 0.0 0.0 0.0Chronic glomerulonephritis, nephritis and nephropathy not
specified as acute or chronic, and renal sclerosis unspecified(N02-N03, N05-N07, N26) 0 0 0 0.0 0.0 0.0
Renal failure (N17-N19) 1 1 0 0.1 0.1 0.0Other disorders of kidney (N25, N27) 0 0 0 0.0 0.0 0.0Infections of kidney (N10-N12, N13.6, N15.1) 0 0 0 0.0 0.0 0.0Hyperplasia of prostate (N40) ... 0 ... ... 0.0 ...Inflammatory diseases of female pelvic organs (N70-N76) ... ... 0 ... ... 0.0Pregnancy, childbirth and the puerperium (O00-O99) ... ... 0 ... ... 0.0Pregnancy with abortive outcome (O00-O07) ... ... 0 ... ... 0.0Other complications of pregnancy, childbirth and the puerperium
(O10-O99) ... ... 0 ... ... 0.0Certain conditions originating in the perinatal period (P00-P96) 1 0 1 0.1 0.0 0.1Congenital malformations, deformations and chromosomal
abnormalities (Q00-Q99) 23 15 8 1.3 1.6 0.9Symptoms, signs and abnormal clinical and laboratory findings,
not elsewhere classified (R00-R99) 4 4 0 0.2 0.4 0.0All other diseases (residual) 11 28 16 12 1.6 1.7 1.4Accidents (unintentional injuries) (V01-X59, Y85-Y86) 39 25 14 2.2 2.7 1.6Transport accidents (V01-V99, Y85) 19 13 6 1.1 1.4 0.7Motor vehicle accidents 12 19 13 6 1.1 1.4 0.7
See notes at the end of the table.
Statistics Canada – Catalogue no. 84F0209X 61

Mortality, Summary List of Causes – 2009
Table 2-3 – continued
Deaths and mortality rate, by selected grouped causes, age group at time of death and sex, Canada1 — 5 to 9 years2,3,4,5
Number of deaths Age-specific mortality rateper 100,000 population 6
Bothsexes
Males Females Bothsexes
Males Females
Other land transport accidents 13 0 0 0 0.0 0.0 0.0Water, air and space, and other and unspecified transport
accidents and their sequelae (V90-V99, Y85) 0 0 0 0.0 0.0 0.0Nontransport accidents (W00-X59, Y86) 20 12 8 1.1 1.3 0.9Falls (W00-W19) 0 0 0 0.0 0.0 0.0Accidental discharge of firearms (W32-W34) 0 0 0 0.0 0.0 0.0Accidental drowning and submersion (W65-W74) 7 5 2 0.4 0.5 0.2Accidental exposure to smoke, fire and flames (X00-X09) 8 2 6 0.4 0.2 0.7Accidental poisoning and exposure to noxious substances
(X40-X49) 0 0 0 0.0 0.0 0.0Other and unspecified nontransport accidents and their sequelae
(W20-W31, W35-W64, W75-W99, X10-X39, X50-X59, Y86) 5 5 0 0.3 0.5 0.0Intentional self-harm (suicide) (X60-X84, Y87.0) 0 0 0 0.0 0.0 0.0Intentional self-harm (suicide) by discharge of firearms (X72-X74) 0 0 0 0.0 0.0 0.0Intentional self-harm (suicide) by other and unspecified means
and their sequelae (X60-X71, X75-X84, Y87.0) 0 0 0 0.0 0.0 0.0Assault (homicide) (X85-Y09, Y87.1) 9 3 6 0.5 0.3 0.7Assault (homicide) by discharge of firearms (X93-X95) 1 0 1 0.1 0.0 0.1Assault (homicide) by other and unspecified means and their
sequelae (X85-X92, X96-Y09, Y87.1) 8 3 5 0.4 0.3 0.6Legal intervention (Y35, Y89.0) 0 0 0 0.0 0.0 0.0Events of undetermined intent (Y10-Y34, Y87.2, Y89.9) 0 0 0 0.0 0.0 0.0Discharge of firearms, undetermined intent (Y22-Y24) 0 0 0 0.0 0.0 0.0Other and unspecified events of undetermined intent and their
sequelae (Y10-Y21, Y25-Y34, Y87.2, Y89.9) 0 0 0 0.0 0.0 0.0Operations of war and their sequelae (Y36, Y89.1) 0 0 0 0.0 0.0 0.0Complications of medical and surgical care (Y40-Y84, Y88) 0 0 0 0.0 0.0 0.0
1. The number of deaths in this table is based on the deceased’s usual place of residence.2. Age attained at the last birthday preceding death.3. For "Age at time of death, under 1 year", the mortality rate is based on live births in the calendar year.4. For "Age at time of death, 1 to 4 years", the mortality rate is based on population estimates for 0 to 4 year olds less live births in the calendar year.5. For "Age at time of death", each age group except "All ages", the mortality rate represents the age-specific death rate or the number of deaths in a particular age
group during a given year per 100,000 population in the same age group as of July 1 of the same year.6. Starting in 2005, the population estimates used to calculate the mortality rate are presented in the Appendix II of the publication "Mortality Summary List of
Causes" (catalogue number 84F0209XIE).7. The cause of death tabulated is the underlying cause of death. This is defined as (a) the disease or injury which initiated the train of events leading directly to
death, or (b) the circumstances of the accident or violence which produced the fatal injury. The underlying cause is selected from the conditions listed onthe medical certificate of cause of death.
8. World Health Organization (WHO), International Statistical Classification of Diseases and Related Health Problems, Tenth Revision (ICD-10)9. National Center for Health Statistics, United States. "B" list in "Instruction Manual; Part 9; ICD-10 Cause-of-Death Lists for Tabulating Mortality Statistics".10. Other and unspecified infectious and parasitic diseases, and their sequelae A00, A05, A20 to A36, A42 to A44, A48 to A49, A54 to A79, A81 to A82,
A85.0 to A85.1, A85.8, A86 to B04, B06 to B09, B25 to B49, B55 to B99.11. All other diseases (residual) D65 to E07, E15 to E34, E65 to F99, G04 to G12, G23 to G25, G31 to H93, K00 to K22, K29 to K31, K50 to K66, K71 to K72, K75 to
K76, K83 to M99, N13.0 to N13.5, N13.7 to N13.9, N14, N15.0, N15.8 to N15.9, N20 to N23, N28 to N39, N41 to N64, N80 to N98. As of 2003, also includes U04.12. Motor vehicle accidents V02 to V04, V09.0, V09.2, V12 to V14, V19.0 to V19.2, V19.4 to V19.6, V20 to V79, V80.3 to V80.5, V81.0 to V81.1, V82.0 to V82.1,
V83 to V86, V87.0 to V87.8, V88.0 to V88.8, V89.0, V89.2.13. Other land transport accidents V01, V05 to V06, V09.1, V09.3 to V09.9, V10 to V11, V15 to V18, V19.3, V19.8 to V19.9, V80.0 to V80.2, V80.6 to V80.9,
V81.2 to V81.9, V82.2 to V82.9, V87.9, V88.9, V89.1, V89.3, V89.9.Note(s): See Data quality, concepts and methodology — Explanatory notes for the tables section.Source(s): Statistics Canada, Canadian Vital Statistics, Birth and Death Databases (CANSIM table 102-0551) and Appendix II.
62 Statistics Canada – Catalogue no. 84F0209X
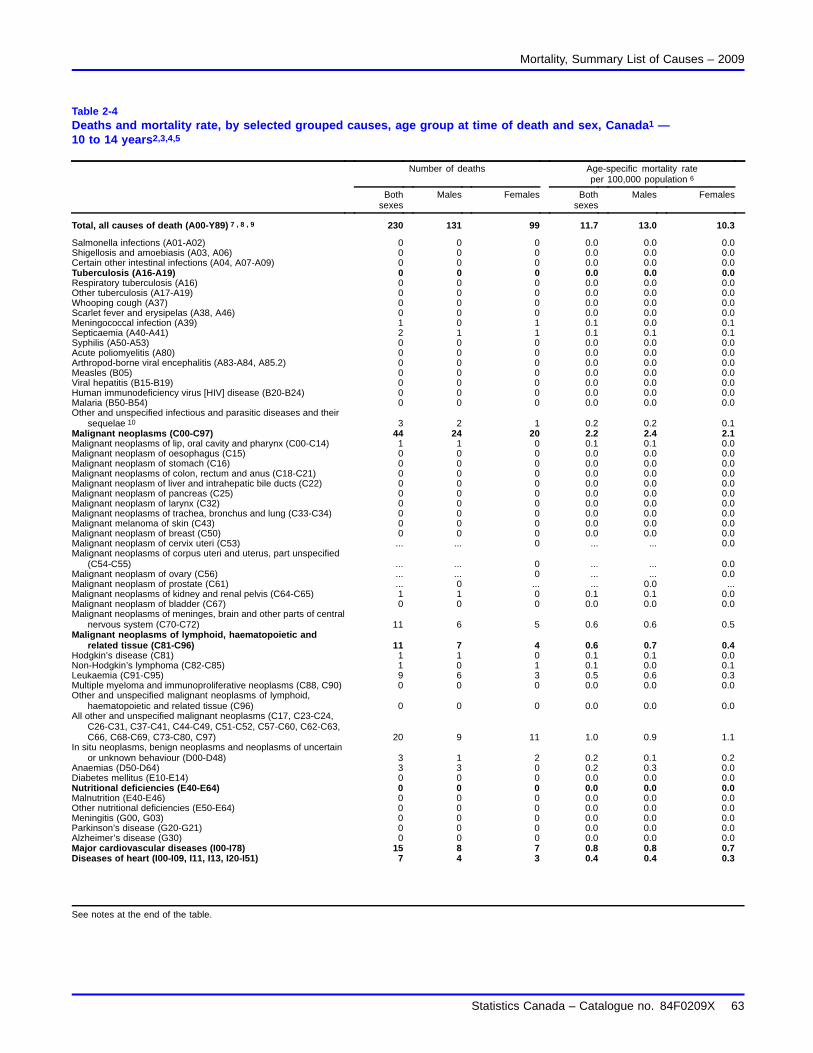
Mortality, Summary List of Causes – 2009
Table 2-4Deaths and mortality rate, by selected grouped causes, age group at time of death and sex, Canada1 —10 to 14 years2,3,4,5
Number of deaths Age-specific mortality rateper 100,000 population 6
Bothsexes
Males Females Bothsexes
Males Females
Total, all causes of death (A00-Y89) 7 , 8 , 9 230 131 99 11.7 13.0 10.3
Salmonella infections (A01-A02) 0 0 0 0.0 0.0 0.0Shigellosis and amoebiasis (A03, A06) 0 0 0 0.0 0.0 0.0Certain other intestinal infections (A04, A07-A09) 0 0 0 0.0 0.0 0.0Tuberculosis (A16-A19) 0 0 0 0.0 0.0 0.0Respiratory tuberculosis (A16) 0 0 0 0.0 0.0 0.0Other tuberculosis (A17-A19) 0 0 0 0.0 0.0 0.0Whooping cough (A37) 0 0 0 0.0 0.0 0.0Scarlet fever and erysipelas (A38, A46) 0 0 0 0.0 0.0 0.0Meningococcal infection (A39) 1 0 1 0.1 0.0 0.1Septicaemia (A40-A41) 2 1 1 0.1 0.1 0.1Syphilis (A50-A53) 0 0 0 0.0 0.0 0.0Acute poliomyelitis (A80) 0 0 0 0.0 0.0 0.0Arthropod-borne viral encephalitis (A83-A84, A85.2) 0 0 0 0.0 0.0 0.0Measles (B05) 0 0 0 0.0 0.0 0.0Viral hepatitis (B15-B19) 0 0 0 0.0 0.0 0.0Human immunodeficiency virus [HIV] disease (B20-B24) 0 0 0 0.0 0.0 0.0Malaria (B50-B54) 0 0 0 0.0 0.0 0.0Other and unspecified infectious and parasitic diseases and their
sequelae 10 3 2 1 0.2 0.2 0.1Malignant neoplasms (C00-C97) 44 24 20 2.2 2.4 2.1Malignant neoplasms of lip, oral cavity and pharynx (C00-C14) 1 1 0 0.1 0.1 0.0Malignant neoplasm of oesophagus (C15) 0 0 0 0.0 0.0 0.0Malignant neoplasm of stomach (C16) 0 0 0 0.0 0.0 0.0Malignant neoplasms of colon, rectum and anus (C18-C21) 0 0 0 0.0 0.0 0.0Malignant neoplasm of liver and intrahepatic bile ducts (C22) 0 0 0 0.0 0.0 0.0Malignant neoplasm of pancreas (C25) 0 0 0 0.0 0.0 0.0Malignant neoplasm of larynx (C32) 0 0 0 0.0 0.0 0.0Malignant neoplasms of trachea, bronchus and lung (C33-C34) 0 0 0 0.0 0.0 0.0Malignant melanoma of skin (C43) 0 0 0 0.0 0.0 0.0Malignant neoplasm of breast (C50) 0 0 0 0.0 0.0 0.0Malignant neoplasm of cervix uteri (C53) ... ... 0 ... ... 0.0Malignant neoplasms of corpus uteri and uterus, part unspecified
(C54-C55) ... ... 0 ... ... 0.0Malignant neoplasm of ovary (C56) ... ... 0 ... ... 0.0Malignant neoplasm of prostate (C61) ... 0 ... ... 0.0 ...Malignant neoplasms of kidney and renal pelvis (C64-C65) 1 1 0 0.1 0.1 0.0Malignant neoplasm of bladder (C67) 0 0 0 0.0 0.0 0.0Malignant neoplasms of meninges, brain and other parts of central
nervous system (C70-C72) 11 6 5 0.6 0.6 0.5Malignant neoplasms of lymphoid, haematopoietic and
related tissue (C81-C96) 11 7 4 0.6 0.7 0.4Hodgkin’s disease (C81) 1 1 0 0.1 0.1 0.0Non-Hodgkin’s lymphoma (C82-C85) 1 0 1 0.1 0.0 0.1Leukaemia (C91-C95) 9 6 3 0.5 0.6 0.3Multiple myeloma and immunoproliferative neoplasms (C88, C90) 0 0 0 0.0 0.0 0.0Other and unspecified malignant neoplasms of lymphoid,
haematopoietic and related tissue (C96) 0 0 0 0.0 0.0 0.0All other and unspecified malignant neoplasms (C17, C23-C24,
C26-C31, C37-C41, C44-C49, C51-C52, C57-C60, C62-C63,C66, C68-C69, C73-C80, C97) 20 9 11 1.0 0.9 1.1
In situ neoplasms, benign neoplasms and neoplasms of uncertainor unknown behaviour (D00-D48) 3 1 2 0.2 0.1 0.2
Anaemias (D50-D64) 3 3 0 0.2 0.3 0.0Diabetes mellitus (E10-E14) 0 0 0 0.0 0.0 0.0Nutritional deficiencies (E40-E64) 0 0 0 0.0 0.0 0.0Malnutrition (E40-E46) 0 0 0 0.0 0.0 0.0Other nutritional deficiencies (E50-E64) 0 0 0 0.0 0.0 0.0Meningitis (G00, G03) 0 0 0 0.0 0.0 0.0Parkinson’s disease (G20-G21) 0 0 0 0.0 0.0 0.0Alzheimer’s disease (G30) 0 0 0 0.0 0.0 0.0Major cardiovascular diseases (I00-I78) 15 8 7 0.8 0.8 0.7Diseases of heart (I00-I09, I11, I13, I20-I51) 7 4 3 0.4 0.4 0.3
See notes at the end of the table.
Statistics Canada – Catalogue no. 84F0209X 63

Mortality, Summary List of Causes – 2009
Table 2-4 – continued
Deaths and mortality rate, by selected grouped causes, age group at time of death and sex, Canada1 —10 to 14 years2,3,4,5
Number of deaths Age-specific mortality rateper 100,000 population 6
Bothsexes
Males Females Bothsexes
Males Females
Acute rheumatic fever and chronic rheumatic heart diseases(I00-I09) 0 0 0 0.0 0.0 0.0
Hypertensive heart disease (I11) 0 0 0 0.0 0.0 0.0Hypertensive heart and renal disease (I13) 0 0 0 0.0 0.0 0.0Ischaemic heart diseases (I20-I25) 1 0 1 0.1 0.0 0.1Acute myocardial infarction (I21-I22) 0 0 0 0.0 0.0 0.0Other acute ischaemic heart diseases (I24) 0 0 0 0.0 0.0 0.0Other forms of chronic ischaemic heart disease (I20, I25) 1 0 1 0.1 0.0 0.1Atherosclerotic cardiovascular disease, so described (I25.0) 0 0 0 0.0 0.0 0.0All other forms of chronic ischaemic heart disease (I20, I25.1-I25.9) 1 0 1 0.1 0.0 0.1Other heart diseases (I26-I51) 6 4 2 0.3 0.4 0.2Acute and subacute endocarditis (I33) 0 0 0 0.0 0.0 0.0Diseases of pericardium and acute myocarditis (I30-I31, I40) 0 0 0 0.0 0.0 0.0Heart failure (I50) 0 0 0 0.0 0.0 0.0All other forms of heart disease (I26-I28, I34-I38, I42-I49, I51) 6 4 2 0.3 0.4 0.2Essential hypertension and hypertensive renal disease (I10, I12,
I15) 0 0 0 0.0 0.0 0.0Cerebrovascular diseases (I60-I69) 8 4 4 0.4 0.4 0.4Atherosclerosis (I70) 0 0 0 0.0 0.0 0.0Other diseases of circulatory system (I71-I78) 0 0 0 0.0 0.0 0.0Aortic aneurysm and dissection (I71) 0 0 0 0.0 0.0 0.0Other diseases of arteries, arterioles and capillaries (I72-I78) 0 0 0 0.0 0.0 0.0Other disorders of circulatory system (I80-I99) 0 0 0 0.0 0.0 0.0Influenza and pneumonia (J09-J18) 8 2 6 0.4 0.2 0.6Influenza (J09-J11) 5 1 4 0.3 0.1 0.4Pneumonia (J12-J18) 3 1 2 0.2 0.1 0.2Other acute lower respiratory infections (J20-J22) 1 0 1 0.1 0.0 0.1Acute bronchitis and bronchiolitis (J20-J21) 1 0 1 0.1 0.0 0.1Unspecified acute lower respiratory infection (J22) 0 0 0 0.0 0.0 0.0Chronic lower respiratory diseases (J40-J47) 2 2 0 0.1 0.2 0.0Bronchitis, chronic and unspecified (J40-J42) 0 0 0 0.0 0.0 0.0Emphysema (J43) 0 0 0 0.0 0.0 0.0Asthma (J45-J46) 2 2 0 0.1 0.2 0.0Other chronic lower respiratory diseases (J44, J47) 0 0 0 0.0 0.0 0.0Pneumoconioses and chemical effects (J60-J66, J68) 0 0 0 0.0 0.0 0.0Pneumonitis due to solids and liquids (J69) 0 0 0 0.0 0.0 0.0Other diseases of respiratory system (J00-J06, J30-J39, J67,
J70-J98) 0 0 0 0.0 0.0 0.0Peptic ulcer (K25-K28) 0 0 0 0.0 0.0 0.0Diseases of appendix (K35-K38) 0 0 0 0.0 0.0 0.0Hernia (K40-K46) 0 0 0 0.0 0.0 0.0Chronic liver disease and cirrhosis (K70, K73-K74) 0 0 0 0.0 0.0 0.0Alcoholic liver disease (K70) 0 0 0 0.0 0.0 0.0Other chronic liver disease and cirrhosis (K73-K74) 0 0 0 0.0 0.0 0.0Cholelithiasis and other disorders of gallbladder (K80-K82) 0 0 0 0.0 0.0 0.0Nephritis, nephrotic syndrome and nephrosis (N00-N07,
N17-N19, N25-N27) 0 0 0 0.0 0.0 0.0Acute and rapidly progressive nephritic and nephrotic syndrome
(N00-N01, N04) 0 0 0 0.0 0.0 0.0Chronic glomerulonephritis, nephritis and nephropathy not
specified as acute or chronic, and renal sclerosis unspecified(N02-N03, N05-N07, N26) 0 0 0 0.0 0.0 0.0
Renal failure (N17-N19) 0 0 0 0.0 0.0 0.0Other disorders of kidney (N25, N27) 0 0 0 0.0 0.0 0.0Infections of kidney (N10-N12, N13.6, N15.1) 0 0 0 0.0 0.0 0.0Hyperplasia of prostate (N40) ... 0 ... ... 0.0 ...Inflammatory diseases of female pelvic organs (N70-N76) ... ... 0 ... ... 0.0Pregnancy, childbirth and the puerperium (O00-O99) ... ... 0 ... ... 0.0Pregnancy with abortive outcome (O00-O07) ... ... 0 ... ... 0.0Other complications of pregnancy, childbirth and the puerperium
(O10-O99) ... ... 0 ... ... 0.0Certain conditions originating in the perinatal period (P00-P96) 2 1 1 0.1 0.1 0.1Congenital malformations, deformations and chromosomal
abnormalities (Q00-Q99) 13 6 7 0.7 0.6 0.7Symptoms, signs and abnormal clinical and laboratory findings,
not elsewhere classified (R00-R99) 4 3 1 0.2 0.3 0.1
See notes at the end of the table.
64 Statistics Canada – Catalogue no. 84F0209X

Mortality, Summary List of Causes – 2009
Table 2-4 – continued
Deaths and mortality rate, by selected grouped causes, age group at time of death and sex, Canada1 —10 to 14 years2,3,4,5
Number of deaths Age-specific mortality rateper 100,000 population 6
Bothsexes
Males Females Bothsexes
Males Females
All other diseases (residual) 11 38 20 18 1.9 2.0 1.9Accidents (unintentional injuries) (V01-X59, Y85-Y86) 53 37 16 2.7 3.7 1.7Transport accidents (V01-V99, Y85) 29 19 10 1.5 1.9 1.0Motor vehicle accidents 12 27 18 9 1.4 1.8 0.9Other land transport accidents 13 1 1 0 0.1 0.1 0.0Water, air and space, and other and unspecified transport
accidents and their sequelae (V90-V99, Y85) 1 0 1 0.1 0.0 0.1Nontransport accidents (W00-X59, Y86) 24 18 6 1.2 1.8 0.6Falls (W00-W19) 2 2 0 0.1 0.2 0.0Accidental discharge of firearms (W32-W34) 1 1 0 0.1 0.1 0.0Accidental drowning and submersion (W65-W74) 6 4 2 0.3 0.4 0.2Accidental exposure to smoke, fire and flames (X00-X09) 3 1 2 0.2 0.1 0.2Accidental poisoning and exposure to noxious substances
(X40-X49) 4 4 0 0.2 0.4 0.0Other and unspecified nontransport accidents and their sequelae
(W20-W31, W35-W64, W75-W99, X10-X39, X50-X59, Y86) 8 6 2 0.4 0.6 0.2Intentional self-harm (suicide) (X60-X84, Y87.0) 25 13 12 1.3 1.3 1.2Intentional self-harm (suicide) by discharge of firearms (X72-X74) 4 4 0 0.2 0.4 0.0Intentional self-harm (suicide) by other and unspecified means
and their sequelae (X60-X71, X75-X84, Y87.0) 21 9 12 1.1 0.9 1.2Assault (homicide) (X85-Y09, Y87.1) 8 5 3 0.4 0.5 0.3Assault (homicide) by discharge of firearms (X93-X95) 1 1 0 0.1 0.1 0.0Assault (homicide) by other and unspecified means and their
sequelae (X85-X92, X96-Y09, Y87.1) 7 4 3 0.4 0.4 0.3Legal intervention (Y35, Y89.0) 0 0 0 0.0 0.0 0.0Events of undetermined intent (Y10-Y34, Y87.2, Y89.9) 5 3 2 0.3 0.3 0.2Discharge of firearms, undetermined intent (Y22-Y24) 0 0 0 0.0 0.0 0.0Other and unspecified events of undetermined intent and their
sequelae (Y10-Y21, Y25-Y34, Y87.2, Y89.9) 5 3 2 0.3 0.3 0.2Operations of war and their sequelae (Y36, Y89.1) 0 0 0 0.0 0.0 0.0Complications of medical and surgical care (Y40-Y84, Y88) 0 0 0 0.0 0.0 0.0
1. The number of deaths in this table is based on the deceased’s usual place of residence.2. Age attained at the last birthday preceding death.3. For "Age at time of death, under 1 year", the mortality rate is based on live births in the calendar year.4. For "Age at time of death, 1 to 4 years", the mortality rate is based on population estimates for 0 to 4 year olds less live births in the calendar year.5. For "Age at time of death", each age group except "All ages", the mortality rate represents the age-specific death rate or the number of deaths in a particular age
group during a given year per 100,000 population in the same age group as of July 1 of the same year.6. Starting in 2005, the population estimates used to calculate the mortality rate are presented in the Appendix II of the publication "Mortality Summary List of
Causes" (catalogue number 84F0209XIE).7. The cause of death tabulated is the underlying cause of death. This is defined as (a) the disease or injury which initiated the train of events leading directly to
death, or (b) the circumstances of the accident or violence which produced the fatal injury. The underlying cause is selected from the conditions listed onthe medical certificate of cause of death.
8. World Health Organization (WHO), International Statistical Classification of Diseases and Related Health Problems, Tenth Revision (ICD-10)9. National Center for Health Statistics, United States. "B" list in "Instruction Manual; Part 9; ICD-10 Cause-of-Death Lists for Tabulating Mortality Statistics".10. Other and unspecified infectious and parasitic diseases, and their sequelae A00, A05, A20 to A36, A42 to A44, A48 to A49, A54 to A79, A81 to A82,
A85.0 to A85.1, A85.8, A86 to B04, B06 to B09, B25 to B49, B55 to B99.11. All other diseases (residual) D65 to E07, E15 to E34, E65 to F99, G04 to G12, G23 to G25, G31 to H93, K00 to K22, K29 to K31, K50 to K66, K71 to K72, K75 to
K76, K83 to M99, N13.0 to N13.5, N13.7 to N13.9, N14, N15.0, N15.8 to N15.9, N20 to N23, N28 to N39, N41 to N64, N80 to N98. As of 2003, also includes U04.12. Motor vehicle accidents V02 to V04, V09.0, V09.2, V12 to V14, V19.0 to V19.2, V19.4 to V19.6, V20 to V79, V80.3 to V80.5, V81.0 to V81.1, V82.0 to V82.1,
V83 to V86, V87.0 to V87.8, V88.0 to V88.8, V89.0, V89.2.13. Other land transport accidents V01, V05 to V06, V09.1, V09.3 to V09.9, V10 to V11, V15 to V18, V19.3, V19.8 to V19.9, V80.0 to V80.2, V80.6 to V80.9,
V81.2 to V81.9, V82.2 to V82.9, V87.9, V88.9, V89.1, V89.3, V89.9.Note(s): See Data quality, concepts and methodology — Explanatory notes for the tables section.Source(s): Statistics Canada, Canadian Vital Statistics, Birth and Death Databases (CANSIM table 102-0551) and Appendix II.
Statistics Canada – Catalogue no. 84F0209X 65

Mortality, Summary List of Causes – 2009
Table 2-5Deaths and mortality rate, by selected grouped causes, age group at time of death and sex, Canada1 —15 to 19 years2,3,4,5
Number of deaths Age-specific mortality rateper 100,000 population 6
Bothsexes
Males Females Bothsexes
Males Females
Total, all causes of death (A00-Y89) 7 , 8 , 9 888 604 284 39.4 52.4 25.9
Salmonella infections (A01-A02) 0 0 0 0.0 0.0 0.0Shigellosis and amoebiasis (A03, A06) 0 0 0 0.0 0.0 0.0Certain other intestinal infections (A04, A07-A09) 0 0 0 0.0 0.0 0.0Tuberculosis (A16-A19) 0 0 0 0.0 0.0 0.0Respiratory tuberculosis (A16) 0 0 0 0.0 0.0 0.0Other tuberculosis (A17-A19) 0 0 0 0.0 0.0 0.0Whooping cough (A37) 0 0 0 0.0 0.0 0.0Scarlet fever and erysipelas (A38, A46) 0 0 0 0.0 0.0 0.0Meningococcal infection (A39) 0 0 0 0.0 0.0 0.0Septicaemia (A40-A41) 3 0 3 0.1 0.0 0.3Syphilis (A50-A53) 0 0 0 0.0 0.0 0.0Acute poliomyelitis (A80) 0 0 0 0.0 0.0 0.0Arthropod-borne viral encephalitis (A83-A84, A85.2) 0 0 0 0.0 0.0 0.0Measles (B05) 0 0 0 0.0 0.0 0.0Viral hepatitis (B15-B19) 0 0 0 0.0 0.0 0.0Human immunodeficiency virus [HIV] disease (B20-B24) 1 0 1 0.0 0.0 0.1Malaria (B50-B54) 0 0 0 0.0 0.0 0.0Other and unspecified infectious and parasitic diseases and their
sequelae 10 2 0 2 0.1 0.0 0.2Malignant neoplasms (C00-C97) 71 40 31 3.2 3.5 2.8Malignant neoplasms of lip, oral cavity and pharynx (C00-C14) 1 1 0 0.0 0.1 0.0Malignant neoplasm of oesophagus (C15) 0 0 0 0.0 0.0 0.0Malignant neoplasm of stomach (C16) 0 0 0 0.0 0.0 0.0Malignant neoplasms of colon, rectum and anus (C18-C21) 0 0 0 0.0 0.0 0.0Malignant neoplasm of liver and intrahepatic bile ducts (C22) 0 0 0 0.0 0.0 0.0Malignant neoplasm of pancreas (C25) 1 1 0 0.0 0.1 0.0Malignant neoplasm of larynx (C32) 0 0 0 0.0 0.0 0.0Malignant neoplasms of trachea, bronchus and lung (C33-C34) 1 1 0 0.0 0.1 0.0Malignant melanoma of skin (C43) 0 0 0 0.0 0.0 0.0Malignant neoplasm of breast (C50) 1 0 1 0.0 0.0 0.1Malignant neoplasm of cervix uteri (C53) ... ... 0 ... ... 0.0Malignant neoplasms of corpus uteri and uterus, part unspecified
(C54-C55) ... ... 0 ... ... 0.0Malignant neoplasm of ovary (C56) ... ... 1 ... ... 0.1Malignant neoplasm of prostate (C61) ... 0 ... ... 0.0 ...Malignant neoplasms of kidney and renal pelvis (C64-C65) 2 1 1 0.1 0.1 0.1Malignant neoplasm of bladder (C67) 0 0 0 0.0 0.0 0.0Malignant neoplasms of meninges, brain and other parts of central
nervous system (C70-C72) 13 7 6 0.6 0.6 0.5Malignant neoplasms of lymphoid, haematopoietic and
related tissue (C81-C96) 24 14 10 1.1 1.2 0.9Hodgkin’s disease (C81) 3 2 1 0.1 0.2 0.1Non-Hodgkin’s lymphoma (C82-C85) 2 1 1 0.1 0.1 0.1Leukaemia (C91-C95) 19 11 8 0.8 1.0 0.7Multiple myeloma and immunoproliferative neoplasms (C88, C90) 0 0 0 0.0 0.0 0.0Other and unspecified malignant neoplasms of lymphoid,
haematopoietic and related tissue (C96) 0 0 0 0.0 0.0 0.0All other and unspecified malignant neoplasms (C17, C23-C24,
C26-C31, C37-C41, C44-C49, C51-C52, C57-C60, C62-C63,C66, C68-C69, C73-C80, C97) 27 15 12 1.2 1.3 1.1
In situ neoplasms, benign neoplasms and neoplasms of uncertainor unknown behaviour (D00-D48) 5 3 2 0.2 0.3 0.2
Anaemias (D50-D64) 0 0 0 0.0 0.0 0.0Diabetes mellitus (E10-E14) 2 2 0 0.1 0.2 0.0Nutritional deficiencies (E40-E64) 0 0 0 0.0 0.0 0.0Malnutrition (E40-E46) 0 0 0 0.0 0.0 0.0Other nutritional deficiencies (E50-E64) 0 0 0 0.0 0.0 0.0Meningitis (G00, G03) 1 0 1 0.0 0.0 0.1Parkinson’s disease (G20-G21) 0 0 0 0.0 0.0 0.0Alzheimer’s disease (G30) 0 0 0 0.0 0.0 0.0Major cardiovascular diseases (I00-I78) 35 22 13 1.6 1.9 1.2Diseases of heart (I00-I09, I11, I13, I20-I51) 28 18 10 1.2 1.6 0.9
See notes at the end of the table.
66 Statistics Canada – Catalogue no. 84F0209X

Mortality, Summary List of Causes – 2009
Table 2-5 – continued
Deaths and mortality rate, by selected grouped causes, age group at time of death and sex, Canada1 —15 to 19 years2,3,4,5
Number of deaths Age-specific mortality rateper 100,000 population 6
Bothsexes
Males Females Bothsexes
Males Females
Acute rheumatic fever and chronic rheumatic heart diseases(I00-I09) 0 0 0 0.0 0.0 0.0
Hypertensive heart disease (I11) 0 0 0 0.0 0.0 0.0Hypertensive heart and renal disease (I13) 0 0 0 0.0 0.0 0.0Ischaemic heart diseases (I20-I25) 1 1 0 0.0 0.1 0.0Acute myocardial infarction (I21-I22) 1 1 0 0.0 0.1 0.0Other acute ischaemic heart diseases (I24) 0 0 0 0.0 0.0 0.0Other forms of chronic ischaemic heart disease (I20, I25) 0 0 0 0.0 0.0 0.0Atherosclerotic cardiovascular disease, so described (I25.0) 0 0 0 0.0 0.0 0.0All other forms of chronic ischaemic heart disease (I20, I25.1-I25.9) 0 0 0 0.0 0.0 0.0Other heart diseases (I26-I51) 27 17 10 1.2 1.5 0.9Acute and subacute endocarditis (I33) 2 1 1 0.1 0.1 0.1Diseases of pericardium and acute myocarditis (I30-I31, I40) 1 1 0 0.0 0.1 0.0Heart failure (I50) 2 1 1 0.1 0.1 0.1All other forms of heart disease (I26-I28, I34-I38, I42-I49, I51) 22 14 8 1.0 1.2 0.7Essential hypertension and hypertensive renal disease (I10, I12,
I15) 0 0 0 0.0 0.0 0.0Cerebrovascular diseases (I60-I69) 4 1 3 0.2 0.1 0.3Atherosclerosis (I70) 0 0 0 0.0 0.0 0.0Other diseases of circulatory system (I71-I78) 3 3 0 0.1 0.3 0.0Aortic aneurysm and dissection (I71) 1 1 0 0.0 0.1 0.0Other diseases of arteries, arterioles and capillaries (I72-I78) 2 2 0 0.1 0.2 0.0Other disorders of circulatory system (I80-I99) 2 1 1 0.1 0.1 0.1Influenza and pneumonia (J09-J18) 12 8 4 0.5 0.7 0.4Influenza (J09-J11) 9 6 3 0.4 0.5 0.3Pneumonia (J12-J18) 3 2 1 0.1 0.2 0.1Other acute lower respiratory infections (J20-J22) 0 0 0 0.0 0.0 0.0Acute bronchitis and bronchiolitis (J20-J21) 0 0 0 0.0 0.0 0.0Unspecified acute lower respiratory infection (J22) 0 0 0 0.0 0.0 0.0Chronic lower respiratory diseases (J40-J47) 2 2 0 0.1 0.2 0.0Bronchitis, chronic and unspecified (J40-J42) 0 0 0 0.0 0.0 0.0Emphysema (J43) 0 0 0 0.0 0.0 0.0Asthma (J45-J46) 2 2 0 0.1 0.2 0.0Other chronic lower respiratory diseases (J44, J47) 0 0 0 0.0 0.0 0.0Pneumoconioses and chemical effects (J60-J66, J68) 0 0 0 0.0 0.0 0.0Pneumonitis due to solids and liquids (J69) 3 3 0 0.1 0.3 0.0Other diseases of respiratory system (J00-J06, J30-J39, J67,
J70-J98) 3 1 2 0.1 0.1 0.2Peptic ulcer (K25-K28) 0 0 0 0.0 0.0 0.0Diseases of appendix (K35-K38) 0 0 0 0.0 0.0 0.0Hernia (K40-K46) 0 0 0 0.0 0.0 0.0Chronic liver disease and cirrhosis (K70, K73-K74) 1 1 0 0.0 0.1 0.0Alcoholic liver disease (K70) 1 1 0 0.0 0.1 0.0Other chronic liver disease and cirrhosis (K73-K74) 0 0 0 0.0 0.0 0.0Cholelithiasis and other disorders of gallbladder (K80-K82) 0 0 0 0.0 0.0 0.0Nephritis, nephrotic syndrome and nephrosis (N00-N07,
N17-N19, N25-N27) 0 0 0 0.0 0.0 0.0Acute and rapidly progressive nephritic and nephrotic syndrome
(N00-N01, N04) 0 0 0 0.0 0.0 0.0Chronic glomerulonephritis, nephritis and nephropathy not
specified as acute or chronic, and renal sclerosis unspecified(N02-N03, N05-N07, N26) 0 0 0 0.0 0.0 0.0
Renal failure (N17-N19) 0 0 0 0.0 0.0 0.0Other disorders of kidney (N25, N27) 0 0 0 0.0 0.0 0.0Infections of kidney (N10-N12, N13.6, N15.1) 0 0 0 0.0 0.0 0.0Hyperplasia of prostate (N40) ... 0 ... ... 0.0 ...Inflammatory diseases of female pelvic organs (N70-N76) ... ... 0 ... ... 0.0Pregnancy, childbirth and the puerperium (O00-O99) ... ... 1 ... ... 0.1Pregnancy with abortive outcome (O00-O07) ... ... 0 ... ... 0.0Other complications of pregnancy, childbirth and the puerperium
(O10-O99) ... ... 1 ... ... 0.1Certain conditions originating in the perinatal period (P00-P96) 1 1 0 0.0 0.1 0.0Congenital malformations, deformations and chromosomal
abnormalities (Q00-Q99) 24 11 13 1.1 1.0 1.2Symptoms, signs and abnormal clinical and laboratory findings,
not elsewhere classified (R00-R99) 17 12 5 0.8 1.0 0.5
See notes at the end of the table.
Statistics Canada – Catalogue no. 84F0209X 67

Mortality, Summary List of Causes – 2009
Table 2-5 – continued
Deaths and mortality rate, by selected grouped causes, age group at time of death and sex, Canada1 —15 to 19 years2,3,4,5
Number of deaths Age-specific mortality rateper 100,000 population 6
Bothsexes
Males Females Bothsexes
Males Females
All other diseases (residual) 11 53 29 24 2.4 2.5 2.2Accidents (unintentional injuries) (V01-X59, Y85-Y86) 360 257 103 16.0 22.3 9.4Transport accidents (V01-V99, Y85) 279 197 82 12.4 17.1 7.5Motor vehicle accidents 12 258 179 79 11.5 15.5 7.2Other land transport accidents 13 7 6 1 0.3 0.5 0.1Water, air and space, and other and unspecified transport
accidents and their sequelae (V90-V99, Y85) 14 12 2 0.6 1.0 0.2Nontransport accidents (W00-X59, Y86) 81 60 21 3.6 5.2 1.9Falls (W00-W19) 10 10 0 0.4 0.9 0.0Accidental discharge of firearms (W32-W34) 3 3 0 0.1 0.3 0.0Accidental drowning and submersion (W65-W74) 14 13 1 0.6 1.1 0.1Accidental exposure to smoke, fire and flames (X00-X09) 8 5 3 0.4 0.4 0.3Accidental poisoning and exposure to noxious substances
(X40-X49) 31 21 10 1.4 1.8 0.9Other and unspecified nontransport accidents and their sequelae
(W20-W31, W35-W64, W75-W99, X10-X39, X50-X59, Y86) 15 8 7 0.7 0.7 0.6Intentional self-harm (suicide) (X60-X84, Y87.0) 202 145 57 9.0 12.6 5.2Intentional self-harm (suicide) by discharge of firearms (X72-X74) 25 25 0 1.1 2.2 0.0Intentional self-harm (suicide) by other and unspecified means
and their sequelae (X60-X71, X75-X84, Y87.0) 177 120 57 7.9 10.4 5.2Assault (homicide) (X85-Y09, Y87.1) 66 53 13 2.9 4.6 1.2Assault (homicide) by discharge of firearms (X93-X95) 23 21 2 1.0 1.8 0.2Assault (homicide) by other and unspecified means and their
sequelae (X85-X92, X96-Y09, Y87.1) 43 32 11 1.9 2.8 1.0Legal intervention (Y35, Y89.0) 2 2 0 0.1 0.2 0.0Events of undetermined intent (Y10-Y34, Y87.2, Y89.9) 18 10 8 0.8 0.9 0.7Discharge of firearms, undetermined intent (Y22-Y24) 1 1 0 0.0 0.1 0.0Other and unspecified events of undetermined intent and their
sequelae (Y10-Y21, Y25-Y34, Y87.2, Y89.9) 17 9 8 0.8 0.8 0.7Operations of war and their sequelae (Y36, Y89.1) 0 0 0 0.0 0.0 0.0Complications of medical and surgical care (Y40-Y84, Y88) 1 1 0 0.0 0.1 0.0
1. The number of deaths in this table is based on the deceased’s usual place of residence.2. Age attained at the last birthday preceding death.3. For "Age at time of death, under 1 year", the mortality rate is based on live births in the calendar year.4. For "Age at time of death, 1 to 4 years", the mortality rate is based on population estimates for 0 to 4 year olds less live births in the calendar year.5. For "Age at time of death", each age group except "All ages", the mortality rate represents the age-specific death rate or the number of deaths in a particular age
group during a given year per 100,000 population in the same age group as of July 1 of the same year.6. Starting in 2005, the population estimates used to calculate the mortality rate are presented in the Appendix II of the publication "Mortality Summary List of
Causes" (catalogue number 84F0209XIE).7. The cause of death tabulated is the underlying cause of death. This is defined as (a) the disease or injury which initiated the train of events leading directly to
death, or (b) the circumstances of the accident or violence which produced the fatal injury. The underlying cause is selected from the conditions listed onthe medical certificate of cause of death.
8. World Health Organization (WHO), International Statistical Classification of Diseases and Related Health Problems, Tenth Revision (ICD-10)9. National Center for Health Statistics, United States. "B" list in "Instruction Manual; Part 9; ICD-10 Cause-of-Death Lists for Tabulating Mortality Statistics".10. Other and unspecified infectious and parasitic diseases, and their sequelae A00, A05, A20 to A36, A42 to A44, A48 to A49, A54 to A79, A81 to A82,
A85.0 to A85.1, A85.8, A86 to B04, B06 to B09, B25 to B49, B55 to B99.11. All other diseases (residual) D65 to E07, E15 to E34, E65 to F99, G04 to G12, G23 to G25, G31 to H93, K00 to K22, K29 to K31, K50 to K66, K71 to K72, K75 to
K76, K83 to M99, N13.0 to N13.5, N13.7 to N13.9, N14, N15.0, N15.8 to N15.9, N20 to N23, N28 to N39, N41 to N64, N80 to N98. As of 2003, also includes U04.12. Motor vehicle accidents V02 to V04, V09.0, V09.2, V12 to V14, V19.0 to V19.2, V19.4 to V19.6, V20 to V79, V80.3 to V80.5, V81.0 to V81.1, V82.0 to V82.1,
V83 to V86, V87.0 to V87.8, V88.0 to V88.8, V89.0, V89.2.13. Other land transport accidents V01, V05 to V06, V09.1, V09.3 to V09.9, V10 to V11, V15 to V18, V19.3, V19.8 to V19.9, V80.0 to V80.2, V80.6 to V80.9,
V81.2 to V81.9, V82.2 to V82.9, V87.9, V88.9, V89.1, V89.3, V89.9.Note(s): See Data quality, concepts and methodology — Explanatory notes for the tables section.Source(s): Statistics Canada, Canadian Vital Statistics, Birth and Death Databases (CANSIM table 102-0551) and Appendix II.
68 Statistics Canada – Catalogue no. 84F0209X

Mortality, Summary List of Causes – 2009
Table 2-6Deaths and mortality rate, by selected grouped causes, age group at time of death and sex, Canada1 —20 to 24 years2,3,4,5
Number of deaths Age-specific mortality rateper 100,000 population 6
Bothsexes
Males Females Bothsexes
Males Females
Total, all causes of death (A00-Y89) 7 , 8 , 9 1,208 878 330 52.0 73.6 29.2
Salmonella infections (A01-A02) 0 0 0 0.0 0.0 0.0Shigellosis and amoebiasis (A03, A06) 0 0 0 0.0 0.0 0.0Certain other intestinal infections (A04, A07-A09) 0 0 0 0.0 0.0 0.0Tuberculosis (A16-A19) 0 0 0 0.0 0.0 0.0Respiratory tuberculosis (A16) 0 0 0 0.0 0.0 0.0Other tuberculosis (A17-A19) 0 0 0 0.0 0.0 0.0Whooping cough (A37) 0 0 0 0.0 0.0 0.0Scarlet fever and erysipelas (A38, A46) 0 0 0 0.0 0.0 0.0Meningococcal infection (A39) 3 1 2 0.1 0.1 0.2Septicaemia (A40-A41) 3 1 2 0.1 0.1 0.2Syphilis (A50-A53) 0 0 0 0.0 0.0 0.0Acute poliomyelitis (A80) 0 0 0 0.0 0.0 0.0Arthropod-borne viral encephalitis (A83-A84, A85.2) 0 0 0 0.0 0.0 0.0Measles (B05) 0 0 0 0.0 0.0 0.0Viral hepatitis (B15-B19) 0 0 0 0.0 0.0 0.0Human immunodeficiency virus [HIV] disease (B20-B24) 4 1 3 0.2 0.1 0.3Malaria (B50-B54) 0 0 0 0.0 0.0 0.0Other and unspecified infectious and parasitic diseases and their
sequelae 10 0 0 0 0.0 0.0 0.0Malignant neoplasms (C00-C97) 94 60 34 4.1 5.0 3.0Malignant neoplasms of lip, oral cavity and pharynx (C00-C14) 1 0 1 0.0 0.0 0.1Malignant neoplasm of oesophagus (C15) 0 0 0 0.0 0.0 0.0Malignant neoplasm of stomach (C16) 1 0 1 0.0 0.0 0.1Malignant neoplasms of colon, rectum and anus (C18-C21) 5 4 1 0.2 0.3 0.1Malignant neoplasm of liver and intrahepatic bile ducts (C22) 0 0 0 0.0 0.0 0.0Malignant neoplasm of pancreas (C25) 0 0 0 0.0 0.0 0.0Malignant neoplasm of larynx (C32) 0 0 0 0.0 0.0 0.0Malignant neoplasms of trachea, bronchus and lung (C33-C34) 2 1 1 0.1 0.1 0.1Malignant melanoma of skin (C43) 3 1 2 0.1 0.1 0.2Malignant neoplasm of breast (C50) 0 0 0 0.0 0.0 0.0Malignant neoplasm of cervix uteri (C53) ... ... 0 ... ... 0.0Malignant neoplasms of corpus uteri and uterus, part unspecified
(C54-C55) ... ... 0 ... ... 0.0Malignant neoplasm of ovary (C56) ... ... 1 ... ... 0.1Malignant neoplasm of prostate (C61) ... 0 ... ... 0.0 ...Malignant neoplasms of kidney and renal pelvis (C64-C65) 3 2 1 0.1 0.2 0.1Malignant neoplasm of bladder (C67) 1 1 0 0.0 0.1 0.0Malignant neoplasms of meninges, brain and other parts of central
nervous system (C70-C72) 20 14 6 0.9 1.2 0.5Malignant neoplasms of lymphoid, haematopoietic and
related tissue (C81-C96) 22 13 9 0.9 1.1 0.8Hodgkin’s disease (C81) 3 2 1 0.1 0.2 0.1Non-Hodgkin’s lymphoma (C82-C85) 4 3 1 0.2 0.3 0.1Leukaemia (C91-C95) 15 8 7 0.6 0.7 0.6Multiple myeloma and immunoproliferative neoplasms (C88, C90) 0 0 0 0.0 0.0 0.0Other and unspecified malignant neoplasms of lymphoid,
haematopoietic and related tissue (C96) 0 0 0 0.0 0.0 0.0All other and unspecified malignant neoplasms (C17, C23-C24,
C26-C31, C37-C41, C44-C49, C51-C52, C57-C60, C62-C63,C66, C68-C69, C73-C80, C97) 35 24 11 1.5 2.0 1.0
In situ neoplasms, benign neoplasms and neoplasms of uncertainor unknown behaviour (D00-D48) 2 1 1 0.1 0.1 0.1
Anaemias (D50-D64) 2 1 1 0.1 0.1 0.1Diabetes mellitus (E10-E14) 7 6 1 0.3 0.5 0.1Nutritional deficiencies (E40-E64) 0 0 0 0.0 0.0 0.0Malnutrition (E40-E46) 0 0 0 0.0 0.0 0.0Other nutritional deficiencies (E50-E64) 0 0 0 0.0 0.0 0.0Meningitis (G00, G03) 1 0 1 0.0 0.0 0.1Parkinson’s disease (G20-G21) 0 0 0 0.0 0.0 0.0Alzheimer’s disease (G30) 0 0 0 0.0 0.0 0.0Major cardiovascular diseases (I00-I78) 46 34 12 2.0 2.9 1.1Diseases of heart (I00-I09, I11, I13, I20-I51) 37 25 12 1.6 2.1 1.1
See notes at the end of the table.
Statistics Canada – Catalogue no. 84F0209X 69

Mortality, Summary List of Causes – 2009
Table 2-6 – continued
Deaths and mortality rate, by selected grouped causes, age group at time of death and sex, Canada1 —20 to 24 years2,3,4,5
Number of deaths Age-specific mortality rateper 100,000 population 6
Bothsexes
Males Females Bothsexes
Males Females
Acute rheumatic fever and chronic rheumatic heart diseases(I00-I09) 1 1 0 0.0 0.1 0.0
Hypertensive heart disease (I11) 0 0 0 0.0 0.0 0.0Hypertensive heart and renal disease (I13) 0 0 0 0.0 0.0 0.0Ischaemic heart diseases (I20-I25) 6 6 0 0.3 0.5 0.0Acute myocardial infarction (I21-I22) 4 4 0 0.2 0.3 0.0Other acute ischaemic heart diseases (I24) 0 0 0 0.0 0.0 0.0Other forms of chronic ischaemic heart disease (I20, I25) 2 2 0 0.1 0.2 0.0Atherosclerotic cardiovascular disease, so described (I25.0) 0 0 0 0.0 0.0 0.0All other forms of chronic ischaemic heart disease (I20, I25.1-I25.9) 2 2 0 0.1 0.2 0.0Other heart diseases (I26-I51) 30 18 12 1.3 1.5 1.1Acute and subacute endocarditis (I33) 2 2 0 0.1 0.2 0.0Diseases of pericardium and acute myocarditis (I30-I31, I40) 0 0 0 0.0 0.0 0.0Heart failure (I50) 1 0 1 0.0 0.0 0.1All other forms of heart disease (I26-I28, I34-I38, I42-I49, I51) 27 16 11 1.2 1.3 1.0Essential hypertension and hypertensive renal disease (I10, I12,
I15) 1 1 0 0.0 0.1 0.0Cerebrovascular diseases (I60-I69) 5 5 0 0.2 0.4 0.0Atherosclerosis (I70) 0 0 0 0.0 0.0 0.0Other diseases of circulatory system (I71-I78) 3 3 0 0.1 0.3 0.0Aortic aneurysm and dissection (I71) 2 2 0 0.1 0.2 0.0Other diseases of arteries, arterioles and capillaries (I72-I78) 1 1 0 0.0 0.1 0.0Other disorders of circulatory system (I80-I99) 2 2 0 0.1 0.2 0.0Influenza and pneumonia (J09-J18) 20 11 9 0.9 0.9 0.8Influenza (J09-J11) 15 8 7 0.6 0.7 0.6Pneumonia (J12-J18) 5 3 2 0.2 0.3 0.2Other acute lower respiratory infections (J20-J22) 0 0 0 0.0 0.0 0.0Acute bronchitis and bronchiolitis (J20-J21) 0 0 0 0.0 0.0 0.0Unspecified acute lower respiratory infection (J22) 0 0 0 0.0 0.0 0.0Chronic lower respiratory diseases (J40-J47) 4 2 2 0.2 0.2 0.2Bronchitis, chronic and unspecified (J40-J42) 0 0 0 0.0 0.0 0.0Emphysema (J43) 0 0 0 0.0 0.0 0.0Asthma (J45-J46) 2 0 2 0.1 0.0 0.2Other chronic lower respiratory diseases (J44, J47) 2 2 0 0.1 0.2 0.0Pneumoconioses and chemical effects (J60-J66, J68) 0 0 0 0.0 0.0 0.0Pneumonitis due to solids and liquids (J69) 3 1 2 0.1 0.1 0.2Other diseases of respiratory system (J00-J06, J30-J39, J67,
J70-J98) 1 0 1 0.0 0.0 0.1Peptic ulcer (K25-K28) 1 1 0 0.0 0.1 0.0Diseases of appendix (K35-K38) 0 0 0 0.0 0.0 0.0Hernia (K40-K46) 0 0 0 0.0 0.0 0.0Chronic liver disease and cirrhosis (K70, K73-K74) 0 0 0 0.0 0.0 0.0Alcoholic liver disease (K70) 0 0 0 0.0 0.0 0.0Other chronic liver disease and cirrhosis (K73-K74) 0 0 0 0.0 0.0 0.0Cholelithiasis and other disorders of gallbladder (K80-K82) 0 0 0 0.0 0.0 0.0Nephritis, nephrotic syndrome and nephrosis (N00-N07,
N17-N19, N25-N27) 3 2 1 0.1 0.2 0.1Acute and rapidly progressive nephritic and nephrotic syndrome
(N00-N01, N04) 1 1 0 0.0 0.1 0.0Chronic glomerulonephritis, nephritis and nephropathy not
specified as acute or chronic, and renal sclerosis unspecified(N02-N03, N05-N07, N26) 0 0 0 0.0 0.0 0.0
Renal failure (N17-N19) 2 1 1 0.1 0.1 0.1Other disorders of kidney (N25, N27) 0 0 0 0.0 0.0 0.0Infections of kidney (N10-N12, N13.6, N15.1) 0 0 0 0.0 0.0 0.0Hyperplasia of prostate (N40) ... 0 ... ... 0.0 ...Inflammatory diseases of female pelvic organs (N70-N76) ... ... 0 ... ... 0.0Pregnancy, childbirth and the puerperium (O00-O99) ... ... 3 ... ... 0.3Pregnancy with abortive outcome (O00-O07) ... ... 0 ... ... 0.0Other complications of pregnancy, childbirth and the puerperium
(O10-O99) ... ... 3 ... ... 0.3Certain conditions originating in the perinatal period (P00-P96) 0 0 0 0.0 0.0 0.0Congenital malformations, deformations and chromosomal
abnormalities (Q00-Q99) 21 12 9 0.9 1.0 0.8Symptoms, signs and abnormal clinical and laboratory findings,
not elsewhere classified (R00-R99) 38 28 10 1.6 2.3 0.9
See notes at the end of the table.
70 Statistics Canada – Catalogue no. 84F0209X
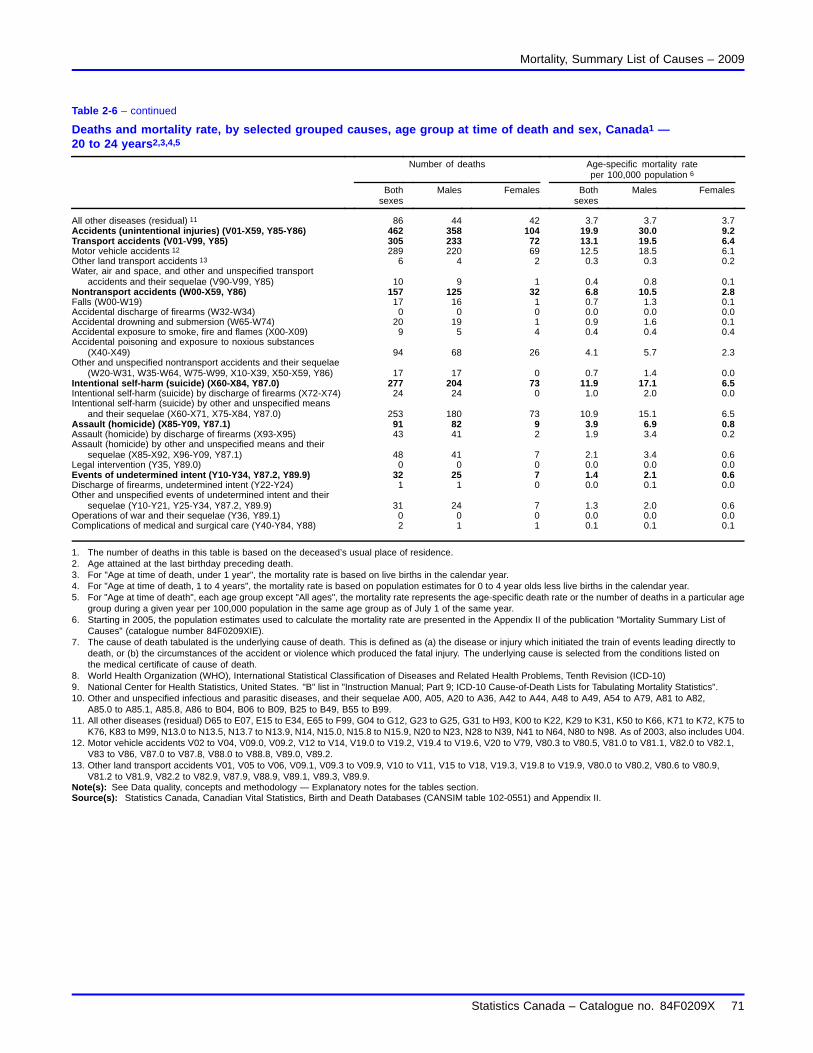
Mortality, Summary List of Causes – 2009
Table 2-6 – continued
Deaths and mortality rate, by selected grouped causes, age group at time of death and sex, Canada1 —20 to 24 years2,3,4,5
Number of deaths Age-specific mortality rateper 100,000 population 6
Bothsexes
Males Females Bothsexes
Males Females
All other diseases (residual) 11 86 44 42 3.7 3.7 3.7Accidents (unintentional injuries) (V01-X59, Y85-Y86) 462 358 104 19.9 30.0 9.2Transport accidents (V01-V99, Y85) 305 233 72 13.1 19.5 6.4Motor vehicle accidents 12 289 220 69 12.5 18.5 6.1Other land transport accidents 13 6 4 2 0.3 0.3 0.2Water, air and space, and other and unspecified transport
accidents and their sequelae (V90-V99, Y85) 10 9 1 0.4 0.8 0.1Nontransport accidents (W00-X59, Y86) 157 125 32 6.8 10.5 2.8Falls (W00-W19) 17 16 1 0.7 1.3 0.1Accidental discharge of firearms (W32-W34) 0 0 0 0.0 0.0 0.0Accidental drowning and submersion (W65-W74) 20 19 1 0.9 1.6 0.1Accidental exposure to smoke, fire and flames (X00-X09) 9 5 4 0.4 0.4 0.4Accidental poisoning and exposure to noxious substances
(X40-X49) 94 68 26 4.1 5.7 2.3Other and unspecified nontransport accidents and their sequelae
(W20-W31, W35-W64, W75-W99, X10-X39, X50-X59, Y86) 17 17 0 0.7 1.4 0.0Intentional self-harm (suicide) (X60-X84, Y87.0) 277 204 73 11.9 17.1 6.5Intentional self-harm (suicide) by discharge of firearms (X72-X74) 24 24 0 1.0 2.0 0.0Intentional self-harm (suicide) by other and unspecified means
and their sequelae (X60-X71, X75-X84, Y87.0) 253 180 73 10.9 15.1 6.5Assault (homicide) (X85-Y09, Y87.1) 91 82 9 3.9 6.9 0.8Assault (homicide) by discharge of firearms (X93-X95) 43 41 2 1.9 3.4 0.2Assault (homicide) by other and unspecified means and their
sequelae (X85-X92, X96-Y09, Y87.1) 48 41 7 2.1 3.4 0.6Legal intervention (Y35, Y89.0) 0 0 0 0.0 0.0 0.0Events of undetermined intent (Y10-Y34, Y87.2, Y89.9) 32 25 7 1.4 2.1 0.6Discharge of firearms, undetermined intent (Y22-Y24) 1 1 0 0.0 0.1 0.0Other and unspecified events of undetermined intent and their
sequelae (Y10-Y21, Y25-Y34, Y87.2, Y89.9) 31 24 7 1.3 2.0 0.6Operations of war and their sequelae (Y36, Y89.1) 0 0 0 0.0 0.0 0.0Complications of medical and surgical care (Y40-Y84, Y88) 2 1 1 0.1 0.1 0.1
1. The number of deaths in this table is based on the deceased’s usual place of residence.2. Age attained at the last birthday preceding death.3. For "Age at time of death, under 1 year", the mortality rate is based on live births in the calendar year.4. For "Age at time of death, 1 to 4 years", the mortality rate is based on population estimates for 0 to 4 year olds less live births in the calendar year.5. For "Age at time of death", each age group except "All ages", the mortality rate represents the age-specific death rate or the number of deaths in a particular age
group during a given year per 100,000 population in the same age group as of July 1 of the same year.6. Starting in 2005, the population estimates used to calculate the mortality rate are presented in the Appendix II of the publication "Mortality Summary List of
Causes" (catalogue number 84F0209XIE).7. The cause of death tabulated is the underlying cause of death. This is defined as (a) the disease or injury which initiated the train of events leading directly to
death, or (b) the circumstances of the accident or violence which produced the fatal injury. The underlying cause is selected from the conditions listed onthe medical certificate of cause of death.
8. World Health Organization (WHO), International Statistical Classification of Diseases and Related Health Problems, Tenth Revision (ICD-10)9. National Center for Health Statistics, United States. "B" list in "Instruction Manual; Part 9; ICD-10 Cause-of-Death Lists for Tabulating Mortality Statistics".10. Other and unspecified infectious and parasitic diseases, and their sequelae A00, A05, A20 to A36, A42 to A44, A48 to A49, A54 to A79, A81 to A82,
A85.0 to A85.1, A85.8, A86 to B04, B06 to B09, B25 to B49, B55 to B99.11. All other diseases (residual) D65 to E07, E15 to E34, E65 to F99, G04 to G12, G23 to G25, G31 to H93, K00 to K22, K29 to K31, K50 to K66, K71 to K72, K75 to
K76, K83 to M99, N13.0 to N13.5, N13.7 to N13.9, N14, N15.0, N15.8 to N15.9, N20 to N23, N28 to N39, N41 to N64, N80 to N98. As of 2003, also includes U04.12. Motor vehicle accidents V02 to V04, V09.0, V09.2, V12 to V14, V19.0 to V19.2, V19.4 to V19.6, V20 to V79, V80.3 to V80.5, V81.0 to V81.1, V82.0 to V82.1,
V83 to V86, V87.0 to V87.8, V88.0 to V88.8, V89.0, V89.2.13. Other land transport accidents V01, V05 to V06, V09.1, V09.3 to V09.9, V10 to V11, V15 to V18, V19.3, V19.8 to V19.9, V80.0 to V80.2, V80.6 to V80.9,
V81.2 to V81.9, V82.2 to V82.9, V87.9, V88.9, V89.1, V89.3, V89.9.Note(s): See Data quality, concepts and methodology — Explanatory notes for the tables section.Source(s): Statistics Canada, Canadian Vital Statistics, Birth and Death Databases (CANSIM table 102-0551) and Appendix II.
Statistics Canada – Catalogue no. 84F0209X 71

Mortality, Summary List of Causes – 2009
Table 2-7Deaths and mortality rate, by selected grouped causes, age group at time of death and sex, Canada1 —25 to 29 years2,3,4,5
Number of deaths Age-specific mortality rateper 100,000 population 6
Bothsexes
Males Females Bothsexes
Males Females
Total, all causes of death (A00-Y89) 7 , 8 , 9 1,310 899 411 55.8 75.9 35.4
Salmonella infections (A01-A02) 0 0 0 0.0 0.0 0.0Shigellosis and amoebiasis (A03, A06) 0 0 0 0.0 0.0 0.0Certain other intestinal infections (A04, A07-A09) 1 1 0 0.0 0.1 0.0Tuberculosis (A16-A19) 1 1 0 0.0 0.1 0.0Respiratory tuberculosis (A16) 1 1 0 0.0 0.1 0.0Other tuberculosis (A17-A19) 0 0 0 0.0 0.0 0.0Whooping cough (A37) 0 0 0 0.0 0.0 0.0Scarlet fever and erysipelas (A38, A46) 0 0 0 0.0 0.0 0.0Meningococcal infection (A39) 0 0 0 0.0 0.0 0.0Septicaemia (A40-A41) 6 3 3 0.3 0.3 0.3Syphilis (A50-A53) 0 0 0 0.0 0.0 0.0Acute poliomyelitis (A80) 0 0 0 0.0 0.0 0.0Arthropod-borne viral encephalitis (A83-A84, A85.2) 0 0 0 0.0 0.0 0.0Measles (B05) 0 0 0 0.0 0.0 0.0Viral hepatitis (B15-B19) 0 0 0 0.0 0.0 0.0Human immunodeficiency virus [HIV] disease (B20-B24) 9 5 4 0.4 0.4 0.3Malaria (B50-B54) 0 0 0 0.0 0.0 0.0Other and unspecified infectious and parasitic diseases and their
sequelae 10 4 0 4 0.2 0.0 0.3Malignant neoplasms (C00-C97) 119 53 66 5.1 4.5 5.7Malignant neoplasms of lip, oral cavity and pharynx (C00-C14) 2 2 0 0.1 0.2 0.0Malignant neoplasm of oesophagus (C15) 0 0 0 0.0 0.0 0.0Malignant neoplasm of stomach (C16) 4 2 2 0.2 0.2 0.2Malignant neoplasms of colon, rectum and anus (C18-C21) 7 2 5 0.3 0.2 0.4Malignant neoplasm of liver and intrahepatic bile ducts (C22) 5 4 1 0.2 0.3 0.1Malignant neoplasm of pancreas (C25) 0 0 0 0.0 0.0 0.0Malignant neoplasm of larynx (C32) 0 0 0 0.0 0.0 0.0Malignant neoplasms of trachea, bronchus and lung (C33-C34) 6 2 4 0.3 0.2 0.3Malignant melanoma of skin (C43) 8 2 6 0.3 0.2 0.5Malignant neoplasm of breast (C50) 11 0 11 0.5 0.0 0.9Malignant neoplasm of cervix uteri (C53) ... ... 0 ... ... 0.0Malignant neoplasms of corpus uteri and uterus, part unspecified
(C54-C55) ... ... 0 ... ... 0.0Malignant neoplasm of ovary (C56) ... ... 4 ... ... 0.3Malignant neoplasm of prostate (C61) ... 0 ... ... 0.0 ...Malignant neoplasms of kidney and renal pelvis (C64-C65) 2 0 2 0.1 0.0 0.2Malignant neoplasm of bladder (C67) 0 0 0 0.0 0.0 0.0Malignant neoplasms of meninges, brain and other parts of central
nervous system (C70-C72) 14 6 8 0.6 0.5 0.7Malignant neoplasms of lymphoid, haematopoietic and
related tissue (C81-C96) 34 20 14 1.4 1.7 1.2Hodgkin’s disease (C81) 10 5 5 0.4 0.4 0.4Non-Hodgkin’s lymphoma (C82-C85) 8 6 2 0.3 0.5 0.2Leukaemia (C91-C95) 16 9 7 0.7 0.8 0.6Multiple myeloma and immunoproliferative neoplasms (C88, C90) 0 0 0 0.0 0.0 0.0Other and unspecified malignant neoplasms of lymphoid,
haematopoietic and related tissue (C96) 0 0 0 0.0 0.0 0.0All other and unspecified malignant neoplasms (C17, C23-C24,
C26-C31, C37-C41, C44-C49, C51-C52, C57-C60, C62-C63,C66, C68-C69, C73-C80, C97) 22 13 9 0.9 1.1 0.8
In situ neoplasms, benign neoplasms and neoplasms of uncertainor unknown behaviour (D00-D48) 9 5 4 0.4 0.4 0.3
Anaemias (D50-D64) 4 3 1 0.2 0.3 0.1Diabetes mellitus (E10-E14) 14 5 9 0.6 0.4 0.8Nutritional deficiencies (E40-E64) 2 1 1 0.1 0.1 0.1Malnutrition (E40-E46) 2 1 1 0.1 0.1 0.1Other nutritional deficiencies (E50-E64) 0 0 0 0.0 0.0 0.0Meningitis (G00, G03) 1 0 1 0.0 0.0 0.1Parkinson’s disease (G20-G21) 0 0 0 0.0 0.0 0.0Alzheimer’s disease (G30) 0 0 0 0.0 0.0 0.0Major cardiovascular diseases (I00-I78) 89 63 26 3.8 5.3 2.2Diseases of heart (I00-I09, I11, I13, I20-I51) 66 45 21 2.8 3.8 1.8
See notes at the end of the table.
72 Statistics Canada – Catalogue no. 84F0209X

Mortality, Summary List of Causes – 2009
Table 2-7 – continued
Deaths and mortality rate, by selected grouped causes, age group at time of death and sex, Canada1 —25 to 29 years2,3,4,5
Number of deaths Age-specific mortality rateper 100,000 population 6
Bothsexes
Males Females Bothsexes
Males Females
Acute rheumatic fever and chronic rheumatic heart diseases(I00-I09) 2 0 2 0.1 0.0 0.2
Hypertensive heart disease (I11) 1 0 1 0.0 0.0 0.1Hypertensive heart and renal disease (I13) 0 0 0 0.0 0.0 0.0Ischaemic heart diseases (I20-I25) 16 12 4 0.7 1.0 0.3Acute myocardial infarction (I21-I22) 6 5 1 0.3 0.4 0.1Other acute ischaemic heart diseases (I24) 0 0 0 0.0 0.0 0.0Other forms of chronic ischaemic heart disease (I20, I25) 10 7 3 0.4 0.6 0.3Atherosclerotic cardiovascular disease, so described (I25.0) 3 3 0 0.1 0.3 0.0All other forms of chronic ischaemic heart disease (I20, I25.1-I25.9) 7 4 3 0.3 0.3 0.3Other heart diseases (I26-I51) 47 33 14 2.0 2.8 1.2Acute and subacute endocarditis (I33) 2 0 2 0.1 0.0 0.2Diseases of pericardium and acute myocarditis (I30-I31, I40) 3 1 2 0.1 0.1 0.2Heart failure (I50) 1 1 0 0.0 0.1 0.0All other forms of heart disease (I26-I28, I34-I38, I42-I49, I51) 41 31 10 1.7 2.6 0.9Essential hypertension and hypertensive renal disease (I10, I12,
I15) 1 1 0 0.0 0.1 0.0Cerebrovascular diseases (I60-I69) 16 12 4 0.7 1.0 0.3Atherosclerosis (I70) 0 0 0 0.0 0.0 0.0Other diseases of circulatory system (I71-I78) 6 5 1 0.3 0.4 0.1Aortic aneurysm and dissection (I71) 4 4 0 0.2 0.3 0.0Other diseases of arteries, arterioles and capillaries (I72-I78) 2 1 1 0.1 0.1 0.1Other disorders of circulatory system (I80-I99) 5 3 2 0.2 0.3 0.2Influenza and pneumonia (J09-J18) 28 11 17 1.2 0.9 1.5Influenza (J09-J11) 16 7 9 0.7 0.6 0.8Pneumonia (J12-J18) 12 4 8 0.5 0.3 0.7Other acute lower respiratory infections (J20-J22) 0 0 0 0.0 0.0 0.0Acute bronchitis and bronchiolitis (J20-J21) 0 0 0 0.0 0.0 0.0Unspecified acute lower respiratory infection (J22) 0 0 0 0.0 0.0 0.0Chronic lower respiratory diseases (J40-J47) 4 3 1 0.2 0.3 0.1Bronchitis, chronic and unspecified (J40-J42) 0 0 0 0.0 0.0 0.0Emphysema (J43) 0 0 0 0.0 0.0 0.0Asthma (J45-J46) 4 3 1 0.2 0.3 0.1Other chronic lower respiratory diseases (J44, J47) 0 0 0 0.0 0.0 0.0Pneumoconioses and chemical effects (J60-J66, J68) 0 0 0 0.0 0.0 0.0Pneumonitis due to solids and liquids (J69) 3 2 1 0.1 0.2 0.1Other diseases of respiratory system (J00-J06, J30-J39, J67,
J70-J98) 9 5 4 0.4 0.4 0.3Peptic ulcer (K25-K28) 0 0 0 0.0 0.0 0.0Diseases of appendix (K35-K38) 1 1 0 0.0 0.1 0.0Hernia (K40-K46) 1 1 0 0.0 0.1 0.0Chronic liver disease and cirrhosis (K70, K73-K74) 5 1 4 0.2 0.1 0.3Alcoholic liver disease (K70) 5 1 4 0.2 0.1 0.3Other chronic liver disease and cirrhosis (K73-K74) 0 0 0 0.0 0.0 0.0Cholelithiasis and other disorders of gallbladder (K80-K82) 0 0 0 0.0 0.0 0.0Nephritis, nephrotic syndrome and nephrosis (N00-N07,
N17-N19, N25-N27) 3 1 2 0.1 0.1 0.2Acute and rapidly progressive nephritic and nephrotic syndrome
(N00-N01, N04) 0 0 0 0.0 0.0 0.0Chronic glomerulonephritis, nephritis and nephropathy not
specified as acute or chronic, and renal sclerosis unspecified(N02-N03, N05-N07, N26) 0 0 0 0.0 0.0 0.0
Renal failure (N17-N19) 3 1 2 0.1 0.1 0.2Other disorders of kidney (N25, N27) 0 0 0 0.0 0.0 0.0Infections of kidney (N10-N12, N13.6, N15.1) 0 0 0 0.0 0.0 0.0Hyperplasia of prostate (N40) ... 0 ... ... 0.0 ...Inflammatory diseases of female pelvic organs (N70-N76) ... ... 0 ... ... 0.0Pregnancy, childbirth and the puerperium (O00-O99) ... ... 7 ... ... 0.6Pregnancy with abortive outcome (O00-O07) ... ... 1 ... ... 0.1Other complications of pregnancy, childbirth and the puerperium
(O10-O99) ... ... 6 ... ... 0.5Certain conditions originating in the perinatal period (P00-P96) 0 0 0 0.0 0.0 0.0Congenital malformations, deformations and chromosomal
abnormalities (Q00-Q99) 24 12 12 1.0 1.0 1.0Symptoms, signs and abnormal clinical and laboratory findings,
not elsewhere classified (R00-R99) 34 20 14 1.4 1.7 1.2
See notes at the end of the table.
Statistics Canada – Catalogue no. 84F0209X 73

Mortality, Summary List of Causes – 2009
Table 2-7 – continued
Deaths and mortality rate, by selected grouped causes, age group at time of death and sex, Canada1 —25 to 29 years2,3,4,5
Number of deaths Age-specific mortality rateper 100,000 population 6
Bothsexes
Males Females Bothsexes
Males Females
All other diseases (residual) 11 111 58 53 4.7 4.9 4.6Accidents (unintentional injuries) (V01-X59, Y85-Y86) 412 320 92 17.6 27.0 7.9Transport accidents (V01-V99, Y85) 221 169 52 9.4 14.3 4.5Motor vehicle accidents 12 198 148 50 8.4 12.5 4.3Other land transport accidents 13 2 2 0 0.1 0.2 0.0Water, air and space, and other and unspecified transport
accidents and their sequelae (V90-V99, Y85) 21 19 2 0.9 1.6 0.2Nontransport accidents (W00-X59, Y86) 191 151 40 8.1 12.7 3.4Falls (W00-W19) 15 12 3 0.6 1.0 0.3Accidental discharge of firearms (W32-W34) 0 0 0 0.0 0.0 0.0Accidental drowning and submersion (W65-W74) 11 10 1 0.5 0.8 0.1Accidental exposure to smoke, fire and flames (X00-X09) 10 6 4 0.4 0.5 0.3Accidental poisoning and exposure to noxious substances
(X40-X49) 119 89 30 5.1 7.5 2.6Other and unspecified nontransport accidents and their sequelae
(W20-W31, W35-W64, W75-W99, X10-X39, X50-X59, Y86) 36 34 2 1.5 2.9 0.2Intentional self-harm (suicide) (X60-X84, Y87.0) 258 203 55 11.0 17.1 4.7Intentional self-harm (suicide) by discharge of firearms (X72-X74) 20 18 2 0.9 1.5 0.2Intentional self-harm (suicide) by other and unspecified means
and their sequelae (X60-X71, X75-X84, Y87.0) 238 185 53 10.1 15.6 4.6Assault (homicide) (X85-Y09, Y87.1) 73 60 13 3.1 5.1 1.1Assault (homicide) by discharge of firearms (X93-X95) 35 34 1 1.5 2.9 0.1Assault (homicide) by other and unspecified means and their
sequelae (X85-X92, X96-Y09, Y87.1) 38 26 12 1.6 2.2 1.0Legal intervention (Y35, Y89.0) 5 5 0 0.2 0.4 0.0Events of undetermined intent (Y10-Y34, Y87.2, Y89.9) 67 52 15 2.9 4.4 1.3Discharge of firearms, undetermined intent (Y22-Y24) 1 1 0 0.0 0.1 0.0Other and unspecified events of undetermined intent and their
sequelae (Y10-Y21, Y25-Y34, Y87.2, Y89.9) 66 51 15 2.8 4.3 1.3Operations of war and their sequelae (Y36, Y89.1) 1 1 0 0.0 0.1 0.0Complications of medical and surgical care (Y40-Y84, Y88) 0 0 0 0.0 0.0 0.0
1. The number of deaths in this table is based on the deceased’s usual place of residence.2. Age attained at the last birthday preceding death.3. For "Age at time of death, under 1 year", the mortality rate is based on live births in the calendar year.4. For "Age at time of death, 1 to 4 years", the mortality rate is based on population estimates for 0 to 4 year olds less live births in the calendar year.5. For "Age at time of death", each age group except "All ages", the mortality rate represents the age-specific death rate or the number of deaths in a particular age
group during a given year per 100,000 population in the same age group as of July 1 of the same year.6. Starting in 2005, the population estimates used to calculate the mortality rate are presented in the Appendix II of the publication "Mortality Summary List of
Causes" (catalogue number 84F0209XIE).7. The cause of death tabulated is the underlying cause of death. This is defined as (a) the disease or injury which initiated the train of events leading directly to
death, or (b) the circumstances of the accident or violence which produced the fatal injury. The underlying cause is selected from the conditions listed onthe medical certificate of cause of death.
8. World Health Organization (WHO), International Statistical Classification of Diseases and Related Health Problems, Tenth Revision (ICD-10)9. National Center for Health Statistics, United States. "B" list in "Instruction Manual; Part 9; ICD-10 Cause-of-Death Lists for Tabulating Mortality Statistics".10. Other and unspecified infectious and parasitic diseases, and their sequelae A00, A05, A20 to A36, A42 to A44, A48 to A49, A54 to A79, A81 to A82,
A85.0 to A85.1, A85.8, A86 to B04, B06 to B09, B25 to B49, B55 to B99.11. All other diseases (residual) D65 to E07, E15 to E34, E65 to F99, G04 to G12, G23 to G25, G31 to H93, K00 to K22, K29 to K31, K50 to K66, K71 to K72, K75 to
K76, K83 to M99, N13.0 to N13.5, N13.7 to N13.9, N14, N15.0, N15.8 to N15.9, N20 to N23, N28 to N39, N41 to N64, N80 to N98. As of 2003, also includes U04.12. Motor vehicle accidents V02 to V04, V09.0, V09.2, V12 to V14, V19.0 to V19.2, V19.4 to V19.6, V20 to V79, V80.3 to V80.5, V81.0 to V81.1, V82.0 to V82.1,
V83 to V86, V87.0 to V87.8, V88.0 to V88.8, V89.0, V89.2.13. Other land transport accidents V01, V05 to V06, V09.1, V09.3 to V09.9, V10 to V11, V15 to V18, V19.3, V19.8 to V19.9, V80.0 to V80.2, V80.6 to V80.9,
V81.2 to V81.9, V82.2 to V82.9, V87.9, V88.9, V89.1, V89.3, V89.9.Note(s): See Data quality, concepts and methodology — Explanatory notes for the tables section.Source(s): Statistics Canada, Canadian Vital Statistics, Birth and Death Databases (CANSIM table 102-0551) and Appendix II.
74 Statistics Canada – Catalogue no. 84F0209X

Mortality, Summary List of Causes – 2009
Table 2-8Deaths and mortality rate, by selected grouped causes, age group at time of death and sex, Canada1 —30 to 34 years2,3,4,5
Number of deaths Age-specific mortality rateper 100,000 population 6
Bothsexes
Males Females Bothsexes
Males Females
Total, all causes of death (A00-Y89) 7 , 8 , 9 1,470 953 517 65.1 84.3 45.8
Salmonella infections (A01-A02) 0 0 0 0.0 0.0 0.0Shigellosis and amoebiasis (A03, A06) 0 0 0 0.0 0.0 0.0Certain other intestinal infections (A04, A07-A09) 2 1 1 0.1 0.1 0.1Tuberculosis (A16-A19) 0 0 0 0.0 0.0 0.0Respiratory tuberculosis (A16) 0 0 0 0.0 0.0 0.0Other tuberculosis (A17-A19) 0 0 0 0.0 0.0 0.0Whooping cough (A37) 0 0 0 0.0 0.0 0.0Scarlet fever and erysipelas (A38, A46) 0 0 0 0.0 0.0 0.0Meningococcal infection (A39) 0 0 0 0.0 0.0 0.0Septicaemia (A40-A41) 8 5 3 0.4 0.4 0.3Syphilis (A50-A53) 0 0 0 0.0 0.0 0.0Acute poliomyelitis (A80) 0 0 0 0.0 0.0 0.0Arthropod-borne viral encephalitis (A83-A84, A85.2) 0 0 0 0.0 0.0 0.0Measles (B05) 0 0 0 0.0 0.0 0.0Viral hepatitis (B15-B19) 2 1 1 0.1 0.1 0.1Human immunodeficiency virus [HIV] disease (B20-B24) 18 14 4 0.8 1.2 0.4Malaria (B50-B54) 0 0 0 0.0 0.0 0.0Other and unspecified infectious and parasitic diseases and their
sequelae 10 4 4 0 0.2 0.4 0.0Malignant neoplasms (C00-C97) 218 90 128 9.7 8.0 11.3Malignant neoplasms of lip, oral cavity and pharynx (C00-C14) 2 2 0 0.1 0.2 0.0Malignant neoplasm of oesophagus (C15) 3 2 1 0.1 0.2 0.1Malignant neoplasm of stomach (C16) 12 7 5 0.5 0.6 0.4Malignant neoplasms of colon, rectum and anus (C18-C21) 23 11 12 1.0 1.0 1.1Malignant neoplasm of liver and intrahepatic bile ducts (C22) 6 4 2 0.3 0.4 0.2Malignant neoplasm of pancreas (C25) 3 2 1 0.1 0.2 0.1Malignant neoplasm of larynx (C32) 0 0 0 0.0 0.0 0.0Malignant neoplasms of trachea, bronchus and lung (C33-C34) 5 3 2 0.2 0.3 0.2Malignant melanoma of skin (C43) 12 8 4 0.5 0.7 0.4Malignant neoplasm of breast (C50) 28 1 27 1.2 0.1 2.4Malignant neoplasm of cervix uteri (C53) ... ... 11 ... ... 1.0Malignant neoplasms of corpus uteri and uterus, part unspecified
(C54-C55) ... ... 3 ... ... 0.3Malignant neoplasm of ovary (C56) ... ... 8 ... ... 0.7Malignant neoplasm of prostate (C61) ... 1 ... ... 0.1 ...Malignant neoplasms of kidney and renal pelvis (C64-C65) 0 0 0 0.0 0.0 0.0Malignant neoplasm of bladder (C67) 3 2 1 0.1 0.2 0.1Malignant neoplasms of meninges, brain and other parts of central
nervous system (C70-C72) 33 17 16 1.5 1.5 1.4Malignant neoplasms of lymphoid, haematopoietic and
related tissue (C81-C96) 37 18 19 1.6 1.6 1.7Hodgkin’s disease (C81) 6 3 3 0.3 0.3 0.3Non-Hodgkin’s lymphoma (C82-C85) 15 5 10 0.7 0.4 0.9Leukaemia (C91-C95) 14 8 6 0.6 0.7 0.5Multiple myeloma and immunoproliferative neoplasms (C88, C90) 2 2 0 0.1 0.2 0.0Other and unspecified malignant neoplasms of lymphoid,
haematopoietic and related tissue (C96) 0 0 0 0.0 0.0 0.0All other and unspecified malignant neoplasms (C17, C23-C24,
C26-C31, C37-C41, C44-C49, C51-C52, C57-C60, C62-C63,C66, C68-C69, C73-C80, C97) 28 12 16 1.2 1.1 1.4
In situ neoplasms, benign neoplasms and neoplasms of uncertainor unknown behaviour (D00-D48) 9 4 5 0.4 0.4 0.4
Anaemias (D50-D64) 3 1 2 0.1 0.1 0.2Diabetes mellitus (E10-E14) 17 10 7 0.8 0.9 0.6Nutritional deficiencies (E40-E64) 1 1 0 0.0 0.1 0.0Malnutrition (E40-E46) 0 0 0 0.0 0.0 0.0Other nutritional deficiencies (E50-E64) 1 1 0 0.0 0.1 0.0Meningitis (G00, G03) 2 0 2 0.1 0.0 0.2Parkinson’s disease (G20-G21) 1 1 0 0.0 0.1 0.0Alzheimer’s disease (G30) 0 0 0 0.0 0.0 0.0Major cardiovascular diseases (I00-I78) 111 67 44 4.9 5.9 3.9Diseases of heart (I00-I09, I11, I13, I20-I51) 78 45 33 3.5 4.0 2.9
See notes at the end of the table.
Statistics Canada – Catalogue no. 84F0209X 75

Mortality, Summary List of Causes – 2009
Table 2-8 – continued
Deaths and mortality rate, by selected grouped causes, age group at time of death and sex, Canada1 —30 to 34 years2,3,4,5
Number of deaths Age-specific mortality rateper 100,000 population 6
Bothsexes
Males Females Bothsexes
Males Females
Acute rheumatic fever and chronic rheumatic heart diseases(I00-I09) 1 1 0 0.0 0.1 0.0
Hypertensive heart disease (I11) 4 2 2 0.2 0.2 0.2Hypertensive heart and renal disease (I13) 0 0 0 0.0 0.0 0.0Ischaemic heart diseases (I20-I25) 26 17 9 1.2 1.5 0.8Acute myocardial infarction (I21-I22) 8 4 4 0.4 0.4 0.4Other acute ischaemic heart diseases (I24) 1 0 1 0.0 0.0 0.1Other forms of chronic ischaemic heart disease (I20, I25) 17 13 4 0.8 1.2 0.4Atherosclerotic cardiovascular disease, so described (I25.0) 2 1 1 0.1 0.1 0.1All other forms of chronic ischaemic heart disease (I20, I25.1-I25.9) 15 12 3 0.7 1.1 0.3Other heart diseases (I26-I51) 47 25 22 2.1 2.2 1.9Acute and subacute endocarditis (I33) 1 1 0 0.0 0.1 0.0Diseases of pericardium and acute myocarditis (I30-I31, I40) 2 1 1 0.1 0.1 0.1Heart failure (I50) 0 0 0 0.0 0.0 0.0All other forms of heart disease (I26-I28, I34-I38, I42-I49, I51) 44 23 21 1.9 2.0 1.9Essential hypertension and hypertensive renal disease (I10, I12,
I15) 1 1 0 0.0 0.1 0.0Cerebrovascular diseases (I60-I69) 21 13 8 0.9 1.2 0.7Atherosclerosis (I70) 0 0 0 0.0 0.0 0.0Other diseases of circulatory system (I71-I78) 11 8 3 0.5 0.7 0.3Aortic aneurysm and dissection (I71) 8 7 1 0.4 0.6 0.1Other diseases of arteries, arterioles and capillaries (I72-I78) 3 1 2 0.1 0.1 0.2Other disorders of circulatory system (I80-I99) 6 1 5 0.3 0.1 0.4Influenza and pneumonia (J09-J18) 30 20 10 1.3 1.8 0.9Influenza (J09-J11) 16 11 5 0.7 1.0 0.4Pneumonia (J12-J18) 14 9 5 0.6 0.8 0.4Other acute lower respiratory infections (J20-J22) 0 0 0 0.0 0.0 0.0Acute bronchitis and bronchiolitis (J20-J21) 0 0 0 0.0 0.0 0.0Unspecified acute lower respiratory infection (J22) 0 0 0 0.0 0.0 0.0Chronic lower respiratory diseases (J40-J47) 6 1 5 0.3 0.1 0.4Bronchitis, chronic and unspecified (J40-J42) 0 0 0 0.0 0.0 0.0Emphysema (J43) 1 0 1 0.0 0.0 0.1Asthma (J45-J46) 2 0 2 0.1 0.0 0.2Other chronic lower respiratory diseases (J44, J47) 3 1 2 0.1 0.1 0.2Pneumoconioses and chemical effects (J60-J66, J68) 0 0 0 0.0 0.0 0.0Pneumonitis due to solids and liquids (J69) 3 1 2 0.1 0.1 0.2Other diseases of respiratory system (J00-J06, J30-J39, J67,
J70-J98) 5 1 4 0.2 0.1 0.4Peptic ulcer (K25-K28) 0 0 0 0.0 0.0 0.0Diseases of appendix (K35-K38) 0 0 0 0.0 0.0 0.0Hernia (K40-K46) 2 1 1 0.1 0.1 0.1Chronic liver disease and cirrhosis (K70, K73-K74) 20 5 15 0.9 0.4 1.3Alcoholic liver disease (K70) 16 5 11 0.7 0.4 1.0Other chronic liver disease and cirrhosis (K73-K74) 4 0 4 0.2 0.0 0.4Cholelithiasis and other disorders of gallbladder (K80-K82) 1 0 1 0.0 0.0 0.1Nephritis, nephrotic syndrome and nephrosis (N00-N07,
N17-N19, N25-N27) 5 2 3 0.2 0.2 0.3Acute and rapidly progressive nephritic and nephrotic syndrome
(N00-N01, N04) 0 0 0 0.0 0.0 0.0Chronic glomerulonephritis, nephritis and nephropathy not
specified as acute or chronic, and renal sclerosis unspecified(N02-N03, N05-N07, N26) 0 0 0 0.0 0.0 0.0
Renal failure (N17-N19) 5 2 3 0.2 0.2 0.3Other disorders of kidney (N25, N27) 0 0 0 0.0 0.0 0.0Infections of kidney (N10-N12, N13.6, N15.1) 1 1 0 0.0 0.1 0.0Hyperplasia of prostate (N40) ... 0 ... ... 0.0 ...Inflammatory diseases of female pelvic organs (N70-N76) ... ... 0 ... ... 0.0Pregnancy, childbirth and the puerperium (O00-O99) ... ... 7 ... ... 0.6Pregnancy with abortive outcome (O00-O07) ... ... 1 ... ... 0.1Other complications of pregnancy, childbirth and the puerperium
(O10-O99) ... ... 6 ... ... 0.5Certain conditions originating in the perinatal period (P00-P96) 0 0 0 0.0 0.0 0.0Congenital malformations, deformations and chromosomal
abnormalities (Q00-Q99) 22 9 13 1.0 0.8 1.2Symptoms, signs and abnormal clinical and laboratory findings,
not elsewhere classified (R00-R99) 40 27 13 1.8 2.4 1.2
See notes at the end of the table.
76 Statistics Canada – Catalogue no. 84F0209X
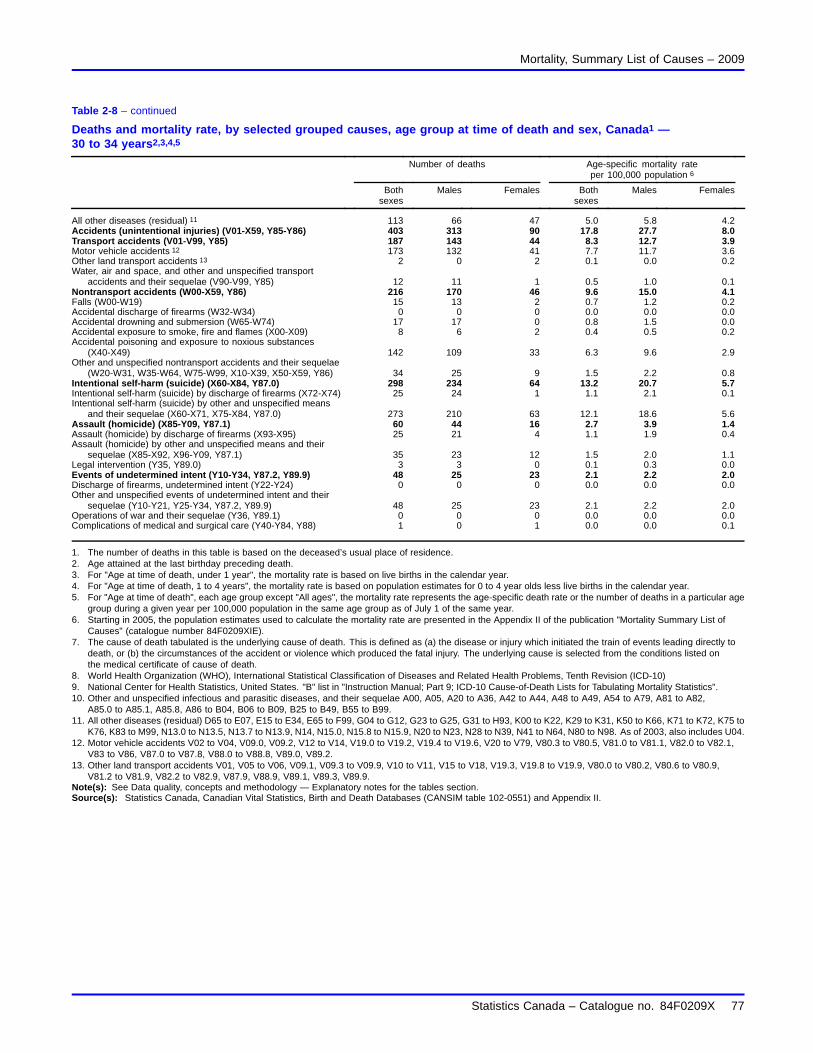
Mortality, Summary List of Causes – 2009
Table 2-8 – continued
Deaths and mortality rate, by selected grouped causes, age group at time of death and sex, Canada1 —30 to 34 years2,3,4,5
Number of deaths Age-specific mortality rateper 100,000 population 6
Bothsexes
Males Females Bothsexes
Males Females
All other diseases (residual) 11 113 66 47 5.0 5.8 4.2Accidents (unintentional injuries) (V01-X59, Y85-Y86) 403 313 90 17.8 27.7 8.0Transport accidents (V01-V99, Y85) 187 143 44 8.3 12.7 3.9Motor vehicle accidents 12 173 132 41 7.7 11.7 3.6Other land transport accidents 13 2 0 2 0.1 0.0 0.2Water, air and space, and other and unspecified transport
accidents and their sequelae (V90-V99, Y85) 12 11 1 0.5 1.0 0.1Nontransport accidents (W00-X59, Y86) 216 170 46 9.6 15.0 4.1Falls (W00-W19) 15 13 2 0.7 1.2 0.2Accidental discharge of firearms (W32-W34) 0 0 0 0.0 0.0 0.0Accidental drowning and submersion (W65-W74) 17 17 0 0.8 1.5 0.0Accidental exposure to smoke, fire and flames (X00-X09) 8 6 2 0.4 0.5 0.2Accidental poisoning and exposure to noxious substances
(X40-X49) 142 109 33 6.3 9.6 2.9Other and unspecified nontransport accidents and their sequelae
(W20-W31, W35-W64, W75-W99, X10-X39, X50-X59, Y86) 34 25 9 1.5 2.2 0.8Intentional self-harm (suicide) (X60-X84, Y87.0) 298 234 64 13.2 20.7 5.7Intentional self-harm (suicide) by discharge of firearms (X72-X74) 25 24 1 1.1 2.1 0.1Intentional self-harm (suicide) by other and unspecified means
and their sequelae (X60-X71, X75-X84, Y87.0) 273 210 63 12.1 18.6 5.6Assault (homicide) (X85-Y09, Y87.1) 60 44 16 2.7 3.9 1.4Assault (homicide) by discharge of firearms (X93-X95) 25 21 4 1.1 1.9 0.4Assault (homicide) by other and unspecified means and their
sequelae (X85-X92, X96-Y09, Y87.1) 35 23 12 1.5 2.0 1.1Legal intervention (Y35, Y89.0) 3 3 0 0.1 0.3 0.0Events of undetermined intent (Y10-Y34, Y87.2, Y89.9) 48 25 23 2.1 2.2 2.0Discharge of firearms, undetermined intent (Y22-Y24) 0 0 0 0.0 0.0 0.0Other and unspecified events of undetermined intent and their
sequelae (Y10-Y21, Y25-Y34, Y87.2, Y89.9) 48 25 23 2.1 2.2 2.0Operations of war and their sequelae (Y36, Y89.1) 0 0 0 0.0 0.0 0.0Complications of medical and surgical care (Y40-Y84, Y88) 1 0 1 0.0 0.0 0.1
1. The number of deaths in this table is based on the deceased’s usual place of residence.2. Age attained at the last birthday preceding death.3. For "Age at time of death, under 1 year", the mortality rate is based on live births in the calendar year.4. For "Age at time of death, 1 to 4 years", the mortality rate is based on population estimates for 0 to 4 year olds less live births in the calendar year.5. For "Age at time of death", each age group except "All ages", the mortality rate represents the age-specific death rate or the number of deaths in a particular age
group during a given year per 100,000 population in the same age group as of July 1 of the same year.6. Starting in 2005, the population estimates used to calculate the mortality rate are presented in the Appendix II of the publication "Mortality Summary List of
Causes" (catalogue number 84F0209XIE).7. The cause of death tabulated is the underlying cause of death. This is defined as (a) the disease or injury which initiated the train of events leading directly to
death, or (b) the circumstances of the accident or violence which produced the fatal injury. The underlying cause is selected from the conditions listed onthe medical certificate of cause of death.
8. World Health Organization (WHO), International Statistical Classification of Diseases and Related Health Problems, Tenth Revision (ICD-10)9. National Center for Health Statistics, United States. "B" list in "Instruction Manual; Part 9; ICD-10 Cause-of-Death Lists for Tabulating Mortality Statistics".10. Other and unspecified infectious and parasitic diseases, and their sequelae A00, A05, A20 to A36, A42 to A44, A48 to A49, A54 to A79, A81 to A82,
A85.0 to A85.1, A85.8, A86 to B04, B06 to B09, B25 to B49, B55 to B99.11. All other diseases (residual) D65 to E07, E15 to E34, E65 to F99, G04 to G12, G23 to G25, G31 to H93, K00 to K22, K29 to K31, K50 to K66, K71 to K72, K75 to
K76, K83 to M99, N13.0 to N13.5, N13.7 to N13.9, N14, N15.0, N15.8 to N15.9, N20 to N23, N28 to N39, N41 to N64, N80 to N98. As of 2003, also includes U04.12. Motor vehicle accidents V02 to V04, V09.0, V09.2, V12 to V14, V19.0 to V19.2, V19.4 to V19.6, V20 to V79, V80.3 to V80.5, V81.0 to V81.1, V82.0 to V82.1,
V83 to V86, V87.0 to V87.8, V88.0 to V88.8, V89.0, V89.2.13. Other land transport accidents V01, V05 to V06, V09.1, V09.3 to V09.9, V10 to V11, V15 to V18, V19.3, V19.8 to V19.9, V80.0 to V80.2, V80.6 to V80.9,
V81.2 to V81.9, V82.2 to V82.9, V87.9, V88.9, V89.1, V89.3, V89.9.Note(s): See Data quality, concepts and methodology — Explanatory notes for the tables section.Source(s): Statistics Canada, Canadian Vital Statistics, Birth and Death Databases (CANSIM table 102-0551) and Appendix II.
Statistics Canada – Catalogue no. 84F0209X 77

Mortality, Summary List of Causes – 2009
Table 2-9Deaths and mortality rate, by selected grouped causes, age group at time of death and sex, Canada1 —35 to 39 years2,3,4,5
Number of deaths Age-specific mortality rateper 100,000 population 6
Bothsexes
Males Females Bothsexes
Males Females
Total, all causes of death (A00-Y89) 7 , 8 , 9 1,955 1,220 735 85.0 105.3 64.4
Salmonella infections (A01-A02) 0 0 0 0.0 0.0 0.0Shigellosis and amoebiasis (A03, A06) 0 0 0 0.0 0.0 0.0Certain other intestinal infections (A04, A07-A09) 1 0 1 0.0 0.0 0.1Tuberculosis (A16-A19) 0 0 0 0.0 0.0 0.0Respiratory tuberculosis (A16) 0 0 0 0.0 0.0 0.0Other tuberculosis (A17-A19) 0 0 0 0.0 0.0 0.0Whooping cough (A37) 0 0 0 0.0 0.0 0.0Scarlet fever and erysipelas (A38, A46) 0 0 0 0.0 0.0 0.0Meningococcal infection (A39) 1 1 0 0.0 0.1 0.0Septicaemia (A40-A41) 10 6 4 0.4 0.5 0.4Syphilis (A50-A53) 0 0 0 0.0 0.0 0.0Acute poliomyelitis (A80) 0 0 0 0.0 0.0 0.0Arthropod-borne viral encephalitis (A83-A84, A85.2) 0 0 0 0.0 0.0 0.0Measles (B05) 0 0 0 0.0 0.0 0.0Viral hepatitis (B15-B19) 5 3 2 0.2 0.3 0.2Human immunodeficiency virus [HIV] disease (B20-B24) 23 13 10 1.0 1.1 0.9Malaria (B50-B54) 0 0 0 0.0 0.0 0.0Other and unspecified infectious and parasitic diseases and their
sequelae 10 8 5 3 0.3 0.4 0.3Malignant neoplasms (C00-C97) 422 170 252 18.4 14.7 22.1Malignant neoplasms of lip, oral cavity and pharynx (C00-C14) 8 4 4 0.3 0.3 0.4Malignant neoplasm of oesophagus (C15) 4 4 0 0.2 0.3 0.0Malignant neoplasm of stomach (C16) 13 7 6 0.6 0.6 0.5Malignant neoplasms of colon, rectum and anus (C18-C21) 41 21 20 1.8 1.8 1.8Malignant neoplasm of liver and intrahepatic bile ducts (C22) 11 5 6 0.5 0.4 0.5Malignant neoplasm of pancreas (C25) 16 11 5 0.7 0.9 0.4Malignant neoplasm of larynx (C32) 0 0 0 0.0 0.0 0.0Malignant neoplasms of trachea, bronchus and lung (C33-C34) 23 8 15 1.0 0.7 1.3Malignant melanoma of skin (C43) 17 11 6 0.7 0.9 0.5Malignant neoplasm of breast (C50) 92 0 92 4.0 0.0 8.1Malignant neoplasm of cervix uteri (C53) ... ... 19 ... ... 1.7Malignant neoplasms of corpus uteri and uterus, part unspecified
(C54-C55) ... ... 4 ... ... 0.4Malignant neoplasm of ovary (C56) ... ... 11 ... ... 1.0Malignant neoplasm of prostate (C61) ... 1 ... ... 0.1 ...Malignant neoplasms of kidney and renal pelvis (C64-C65) 8 8 0 0.3 0.7 0.0Malignant neoplasm of bladder (C67) 5 0 5 0.2 0.0 0.4Malignant neoplasms of meninges, brain and other parts of central
nervous system (C70-C72) 43 26 17 1.9 2.2 1.5Malignant neoplasms of lymphoid, haematopoietic and
related tissue (C81-C96) 54 38 16 2.3 3.3 1.4Hodgkin’s disease (C81) 4 2 2 0.2 0.2 0.2Non-Hodgkin’s lymphoma (C82-C85) 21 18 3 0.9 1.6 0.3Leukaemia (C91-C95) 26 16 10 1.1 1.4 0.9Multiple myeloma and immunoproliferative neoplasms (C88, C90) 3 2 1 0.1 0.2 0.1Other and unspecified malignant neoplasms of lymphoid,
haematopoietic and related tissue (C96) 0 0 0 0.0 0.0 0.0All other and unspecified malignant neoplasms (C17, C23-C24,
C26-C31, C37-C41, C44-C49, C51-C52, C57-C60, C62-C63,C66, C68-C69, C73-C80, C97) 52 26 26 2.3 2.2 2.3
In situ neoplasms, benign neoplasms and neoplasms of uncertainor unknown behaviour (D00-D48) 8 2 6 0.3 0.2 0.5
Anaemias (D50-D64) 3 2 1 0.1 0.2 0.1Diabetes mellitus (E10-E14) 45 26 19 2.0 2.2 1.7Nutritional deficiencies (E40-E64) 1 0 1 0.0 0.0 0.1Malnutrition (E40-E46) 1 0 1 0.0 0.0 0.1Other nutritional deficiencies (E50-E64) 0 0 0 0.0 0.0 0.0Meningitis (G00, G03) 3 2 1 0.1 0.2 0.1Parkinson’s disease (G20-G21) 0 0 0 0.0 0.0 0.0Alzheimer’s disease (G30) 0 0 0 0.0 0.0 0.0Major cardiovascular diseases (I00-I78) 216 155 61 9.4 13.4 5.3Diseases of heart (I00-I09, I11, I13, I20-I51) 164 124 40 7.1 10.7 3.5
See notes at the end of the table.
78 Statistics Canada – Catalogue no. 84F0209X

Mortality, Summary List of Causes – 2009
Table 2-9 – continued
Deaths and mortality rate, by selected grouped causes, age group at time of death and sex, Canada1 —35 to 39 years2,3,4,5
Number of deaths Age-specific mortality rateper 100,000 population 6
Bothsexes
Males Females Bothsexes
Males Females
Acute rheumatic fever and chronic rheumatic heart diseases(I00-I09) 3 2 1 0.1 0.2 0.1
Hypertensive heart disease (I11) 3 2 1 0.1 0.2 0.1Hypertensive heart and renal disease (I13) 0 0 0 0.0 0.0 0.0Ischaemic heart diseases (I20-I25) 103 80 23 4.5 6.9 2.0Acute myocardial infarction (I21-I22) 41 31 10 1.8 2.7 0.9Other acute ischaemic heart diseases (I24) 3 1 2 0.1 0.1 0.2Other forms of chronic ischaemic heart disease (I20, I25) 59 48 11 2.6 4.1 1.0Atherosclerotic cardiovascular disease, so described (I25.0) 9 9 0 0.4 0.8 0.0All other forms of chronic ischaemic heart disease (I20, I25.1-I25.9) 50 39 11 2.2 3.4 1.0Other heart diseases (I26-I51) 55 40 15 2.4 3.5 1.3Acute and subacute endocarditis (I33) 2 2 0 0.1 0.2 0.0Diseases of pericardium and acute myocarditis (I30-I31, I40) 0 0 0 0.0 0.0 0.0Heart failure (I50) 2 2 0 0.1 0.2 0.0All other forms of heart disease (I26-I28, I34-I38, I42-I49, I51) 51 36 15 2.2 3.1 1.3Essential hypertension and hypertensive renal disease (I10, I12,
I15) 6 6 0 0.3 0.5 0.0Cerebrovascular diseases (I60-I69) 41 21 20 1.8 1.8 1.8Atherosclerosis (I70) 0 0 0 0.0 0.0 0.0Other diseases of circulatory system (I71-I78) 5 4 1 0.2 0.3 0.1Aortic aneurysm and dissection (I71) 3 3 0 0.1 0.3 0.0Other diseases of arteries, arterioles and capillaries (I72-I78) 2 1 1 0.1 0.1 0.1Other disorders of circulatory system (I80-I99) 6 4 2 0.3 0.3 0.2Influenza and pneumonia (J09-J18) 34 17 17 1.5 1.5 1.5Influenza (J09-J11) 18 9 9 0.8 0.8 0.8Pneumonia (J12-J18) 16 8 8 0.7 0.7 0.7Other acute lower respiratory infections (J20-J22) 0 0 0 0.0 0.0 0.0Acute bronchitis and bronchiolitis (J20-J21) 0 0 0 0.0 0.0 0.0Unspecified acute lower respiratory infection (J22) 0 0 0 0.0 0.0 0.0Chronic lower respiratory diseases (J40-J47) 6 3 3 0.3 0.3 0.3Bronchitis, chronic and unspecified (J40-J42) 0 0 0 0.0 0.0 0.0Emphysema (J43) 1 1 0 0.0 0.1 0.0Asthma (J45-J46) 3 2 1 0.1 0.2 0.1Other chronic lower respiratory diseases (J44, J47) 2 0 2 0.1 0.0 0.2Pneumoconioses and chemical effects (J60-J66, J68) 0 0 0 0.0 0.0 0.0Pneumonitis due to solids and liquids (J69) 8 5 3 0.3 0.4 0.3Other diseases of respiratory system (J00-J06, J30-J39, J67,
J70-J98) 8 5 3 0.3 0.4 0.3Peptic ulcer (K25-K28) 4 3 1 0.2 0.3 0.1Diseases of appendix (K35-K38) 4 3 1 0.2 0.3 0.1Hernia (K40-K46) 0 0 0 0.0 0.0 0.0Chronic liver disease and cirrhosis (K70, K73-K74) 40 19 21 1.7 1.6 1.8Alcoholic liver disease (K70) 32 14 18 1.4 1.2 1.6Other chronic liver disease and cirrhosis (K73-K74) 8 5 3 0.3 0.4 0.3Cholelithiasis and other disorders of gallbladder (K80-K82) 0 0 0 0.0 0.0 0.0Nephritis, nephrotic syndrome and nephrosis (N00-N07,
N17-N19, N25-N27) 9 3 6 0.4 0.3 0.5Acute and rapidly progressive nephritic and nephrotic syndrome
(N00-N01, N04) 0 0 0 0.0 0.0 0.0Chronic glomerulonephritis, nephritis and nephropathy not
specified as acute or chronic, and renal sclerosis unspecified(N02-N03, N05-N07, N26) 2 2 0 0.1 0.2 0.0
Renal failure (N17-N19) 7 1 6 0.3 0.1 0.5Other disorders of kidney (N25, N27) 0 0 0 0.0 0.0 0.0Infections of kidney (N10-N12, N13.6, N15.1) 0 0 0 0.0 0.0 0.0Hyperplasia of prostate (N40) ... 0 ... ... 0.0 ...Inflammatory diseases of female pelvic organs (N70-N76) ... ... 0 ... ... 0.0Pregnancy, childbirth and the puerperium (O00-O99) ... ... 6 ... ... 0.5Pregnancy with abortive outcome (O00-O07) ... ... 0 ... ... 0.0Other complications of pregnancy, childbirth and the puerperium
(O10-O99) ... ... 6 ... ... 0.5Certain conditions originating in the perinatal period (P00-P96) 1 1 0 0.0 0.1 0.0Congenital malformations, deformations and chromosomal
abnormalities (Q00-Q99) 20 11 9 0.9 0.9 0.8Symptoms, signs and abnormal clinical and laboratory findings,
not elsewhere classified (R00-R99) 53 39 14 2.3 3.4 1.2
See notes at the end of the table.
Statistics Canada – Catalogue no. 84F0209X 79

Mortality, Summary List of Causes – 2009
Table 2-9 – continued
Deaths and mortality rate, by selected grouped causes, age group at time of death and sex, Canada1 —35 to 39 years2,3,4,5
Number of deaths Age-specific mortality rateper 100,000 population 6
Bothsexes
Males Females Bothsexes
Males Females
All other diseases (residual) 11 184 108 76 8.0 9.3 6.7Accidents (unintentional injuries) (V01-X59, Y85-Y86) 376 283 93 16.4 24.4 8.2Transport accidents (V01-V99, Y85) 151 117 34 6.6 10.1 3.0Motor vehicle accidents 12 133 101 32 5.8 8.7 2.8Other land transport accidents 13 1 1 0 0.0 0.1 0.0Water, air and space, and other and unspecified transport
accidents and their sequelae (V90-V99, Y85) 17 15 2 0.7 1.3 0.2Nontransport accidents (W00-X59, Y86) 225 166 59 9.8 14.3 5.2Falls (W00-W19) 19 16 3 0.8 1.4 0.3Accidental discharge of firearms (W32-W34) 0 0 0 0.0 0.0 0.0Accidental drowning and submersion (W65-W74) 13 9 4 0.6 0.8 0.4Accidental exposure to smoke, fire and flames (X00-X09) 8 8 0 0.3 0.7 0.0Accidental poisoning and exposure to noxious substances
(X40-X49) 152 107 45 6.6 9.2 3.9Other and unspecified nontransport accidents and their sequelae
(W20-W31, W35-W64, W75-W99, X10-X39, X50-X59, Y86) 33 26 7 1.4 2.2 0.6Intentional self-harm (suicide) (X60-X84, Y87.0) 332 251 81 14.4 21.7 7.1Intentional self-harm (suicide) by discharge of firearms (X72-X74) 38 36 2 1.7 3.1 0.2Intentional self-harm (suicide) by other and unspecified means
and their sequelae (X60-X71, X75-X84, Y87.0) 294 215 79 12.8 18.6 6.9Assault (homicide) (X85-Y09, Y87.1) 57 40 17 2.5 3.5 1.5Assault (homicide) by discharge of firearms (X93-X95) 16 12 4 0.7 1.0 0.4Assault (homicide) by other and unspecified means and their
sequelae (X85-X92, X96-Y09, Y87.1) 41 28 13 1.8 2.4 1.1Legal intervention (Y35, Y89.0) 4 4 0 0.2 0.3 0.0Events of undetermined intent (Y10-Y34, Y87.2, Y89.9) 56 35 21 2.4 3.0 1.8Discharge of firearms, undetermined intent (Y22-Y24) 1 0 1 0.0 0.0 0.1Other and unspecified events of undetermined intent and their
sequelae (Y10-Y21, Y25-Y34, Y87.2, Y89.9) 55 35 20 2.4 3.0 1.8Operations of war and their sequelae (Y36, Y89.1) 0 0 0 0.0 0.0 0.0Complications of medical and surgical care (Y40-Y84, Y88) 1 1 0 0.0 0.1 0.0
1. The number of deaths in this table is based on the deceased’s usual place of residence.2. Age attained at the last birthday preceding death.3. For "Age at time of death, under 1 year", the mortality rate is based on live births in the calendar year.4. For "Age at time of death, 1 to 4 years", the mortality rate is based on population estimates for 0 to 4 year olds less live births in the calendar year.5. For "Age at time of death", each age group except "All ages", the mortality rate represents the age-specific death rate or the number of deaths in a particular age
group during a given year per 100,000 population in the same age group as of July 1 of the same year.6. Starting in 2005, the population estimates used to calculate the mortality rate are presented in the Appendix II of the publication "Mortality Summary List of
Causes" (catalogue number 84F0209XIE).7. The cause of death tabulated is the underlying cause of death. This is defined as (a) the disease or injury which initiated the train of events leading directly to
death, or (b) the circumstances of the accident or violence which produced the fatal injury. The underlying cause is selected from the conditions listed onthe medical certificate of cause of death.
8. World Health Organization (WHO), International Statistical Classification of Diseases and Related Health Problems, Tenth Revision (ICD-10)9. National Center for Health Statistics, United States. "B" list in "Instruction Manual; Part 9; ICD-10 Cause-of-Death Lists for Tabulating Mortality Statistics".10. Other and unspecified infectious and parasitic diseases, and their sequelae A00, A05, A20 to A36, A42 to A44, A48 to A49, A54 to A79, A81 to A82,
A85.0 to A85.1, A85.8, A86 to B04, B06 to B09, B25 to B49, B55 to B99.11. All other diseases (residual) D65 to E07, E15 to E34, E65 to F99, G04 to G12, G23 to G25, G31 to H93, K00 to K22, K29 to K31, K50 to K66, K71 to K72, K75 to
K76, K83 to M99, N13.0 to N13.5, N13.7 to N13.9, N14, N15.0, N15.8 to N15.9, N20 to N23, N28 to N39, N41 to N64, N80 to N98. As of 2003, also includes U04.12. Motor vehicle accidents V02 to V04, V09.0, V09.2, V12 to V14, V19.0 to V19.2, V19.4 to V19.6, V20 to V79, V80.3 to V80.5, V81.0 to V81.1, V82.0 to V82.1,
V83 to V86, V87.0 to V87.8, V88.0 to V88.8, V89.0, V89.2.13. Other land transport accidents V01, V05 to V06, V09.1, V09.3 to V09.9, V10 to V11, V15 to V18, V19.3, V19.8 to V19.9, V80.0 to V80.2, V80.6 to V80.9,
V81.2 to V81.9, V82.2 to V82.9, V87.9, V88.9, V89.1, V89.3, V89.9.Note(s): See Data quality, concepts and methodology — Explanatory notes for the tables section.Source(s): Statistics Canada, Canadian Vital Statistics, Birth and Death Databases (CANSIM table 102-0551) and Appendix II.
80 Statistics Canada – Catalogue no. 84F0209X

Mortality, Summary List of Causes – 2009
Table 2-10Deaths and mortality rate, by selected grouped causes, age group at time of death and sex, Canada1 —40 to 44 years2,3,4,5
Number of deaths Age-specific mortality rateper 100,000 population 6
Bothsexes
Males Females Bothsexes
Males Females
Total, all causes of death (A00-Y89) 7 , 8 , 9 3,229 1,973 1,256 130.1 157.8 102.0
Salmonella infections (A01-A02) 0 0 0 0.0 0.0 0.0Shigellosis and amoebiasis (A03, A06) 0 0 0 0.0 0.0 0.0Certain other intestinal infections (A04, A07-A09) 2 2 0 0.1 0.2 0.0Tuberculosis (A16-A19) 2 2 0 0.1 0.2 0.0Respiratory tuberculosis (A16) 1 1 0 0.0 0.1 0.0Other tuberculosis (A17-A19) 1 1 0 0.0 0.1 0.0Whooping cough (A37) 0 0 0 0.0 0.0 0.0Scarlet fever and erysipelas (A38, A46) 0 0 0 0.0 0.0 0.0Meningococcal infection (A39) 0 0 0 0.0 0.0 0.0Septicaemia (A40-A41) 19 11 8 0.8 0.9 0.6Syphilis (A50-A53) 0 0 0 0.0 0.0 0.0Acute poliomyelitis (A80) 0 0 0 0.0 0.0 0.0Arthropod-borne viral encephalitis (A83-A84, A85.2) 0 0 0 0.0 0.0 0.0Measles (B05) 0 0 0 0.0 0.0 0.0Viral hepatitis (B15-B19) 15 10 5 0.6 0.8 0.4Human immunodeficiency virus [HIV] disease (B20-B24) 53 42 11 2.1 3.4 0.9Malaria (B50-B54) 1 1 0 0.0 0.1 0.0Other and unspecified infectious and parasitic diseases and their
sequelae 10 7 4 3 0.3 0.3 0.2Malignant neoplasms (C00-C97) 876 375 501 35.3 30.0 40.7Malignant neoplasms of lip, oral cavity and pharynx (C00-C14) 22 11 11 0.9 0.9 0.9Malignant neoplasm of oesophagus (C15) 12 12 0 0.5 1.0 0.0Malignant neoplasm of stomach (C16) 35 17 18 1.4 1.4 1.5Malignant neoplasms of colon, rectum and anus (C18-C21) 90 46 44 3.6 3.7 3.6Malignant neoplasm of liver and intrahepatic bile ducts (C22) 28 19 9 1.1 1.5 0.7Malignant neoplasm of pancreas (C25) 44 23 21 1.8 1.8 1.7Malignant neoplasm of larynx (C32) 2 2 0 0.1 0.2 0.0Malignant neoplasms of trachea, bronchus and lung (C33-C34) 117 51 66 4.7 4.1 5.4Malignant melanoma of skin (C43) 29 19 10 1.2 1.5 0.8Malignant neoplasm of breast (C50) 158 1 157 6.4 0.1 12.7Malignant neoplasm of cervix uteri (C53) ... ... 27 ... ... 2.2Malignant neoplasms of corpus uteri and uterus, part unspecified
(C54-C55) ... ... 7 ... ... 0.6Malignant neoplasm of ovary (C56) ... ... 27 ... ... 2.2Malignant neoplasm of prostate (C61) ... 2 ... ... 0.2 ...Malignant neoplasms of kidney and renal pelvis (C64-C65) 20 13 7 0.8 1.0 0.6Malignant neoplasm of bladder (C67) 8 5 3 0.3 0.4 0.2Malignant neoplasms of meninges, brain and other parts of central
nervous system (C70-C72) 78 54 24 3.1 4.3 1.9Malignant neoplasms of lymphoid, haematopoietic and
related tissue (C81-C96) 86 49 37 3.5 3.9 3.0Hodgkin’s disease (C81) 8 7 1 0.3 0.6 0.1Non-Hodgkin’s lymphoma (C82-C85) 34 23 11 1.4 1.8 0.9Leukaemia (C91-C95) 34 16 18 1.4 1.3 1.5Multiple myeloma and immunoproliferative neoplasms (C88, C90) 9 3 6 0.4 0.2 0.5Other and unspecified malignant neoplasms of lymphoid,
haematopoietic and related tissue (C96) 1 0 1 0.0 0.0 0.1All other and unspecified malignant neoplasms (C17, C23-C24,
C26-C31, C37-C41, C44-C49, C51-C52, C57-C60, C62-C63,C66, C68-C69, C73-C80, C97) 84 51 33 3.4 4.1 2.7
In situ neoplasms, benign neoplasms and neoplasms of uncertainor unknown behaviour (D00-D48) 16 11 5 0.6 0.9 0.4
Anaemias (D50-D64) 2 1 1 0.1 0.1 0.1Diabetes mellitus (E10-E14) 68 41 27 2.7 3.3 2.2Nutritional deficiencies (E40-E64) 3 0 3 0.1 0.0 0.2Malnutrition (E40-E46) 3 0 3 0.1 0.0 0.2Other nutritional deficiencies (E50-E64) 0 0 0 0.0 0.0 0.0Meningitis (G00, G03) 3 3 0 0.1 0.2 0.0Parkinson’s disease (G20-G21) 0 0 0 0.0 0.0 0.0Alzheimer’s disease (G30) 0 0 0 0.0 0.0 0.0Major cardiovascular diseases (I00-I78) 504 365 139 20.3 29.2 11.3Diseases of heart (I00-I09, I11, I13, I20-I51) 414 314 100 16.7 25.1 8.1
See notes at the end of the table.
Statistics Canada – Catalogue no. 84F0209X 81
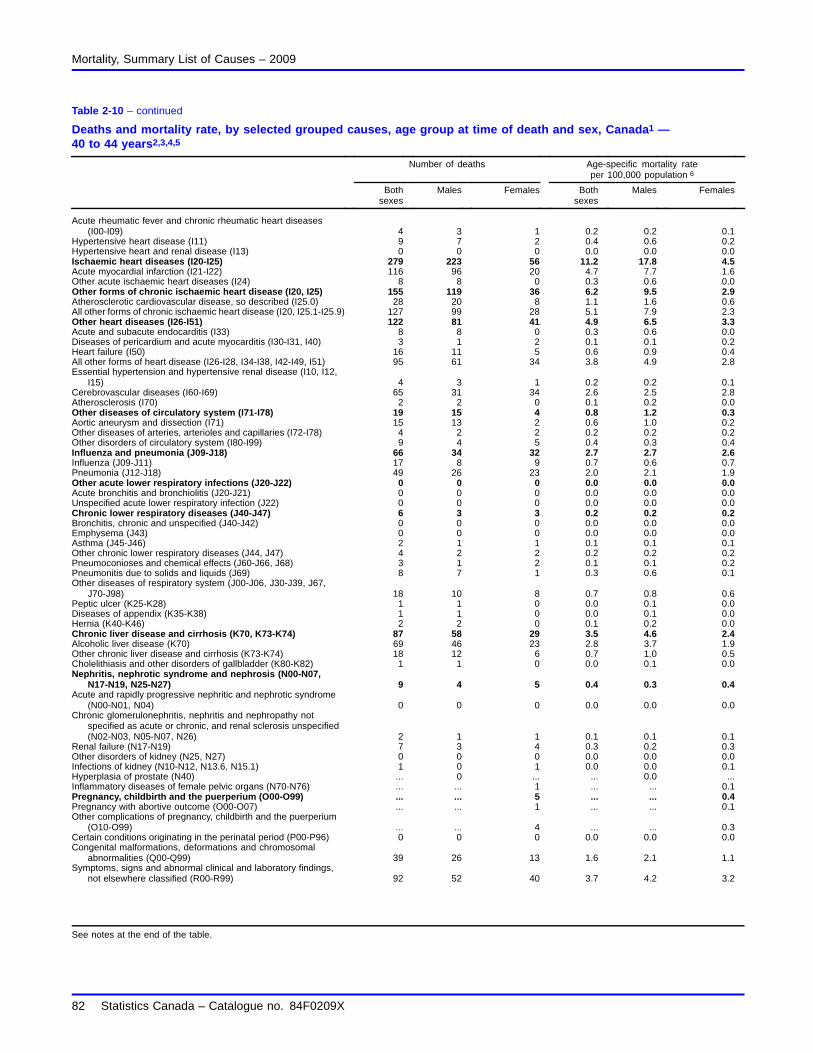
Mortality, Summary List of Causes – 2009
Table 2-10 – continued
Deaths and mortality rate, by selected grouped causes, age group at time of death and sex, Canada1 —40 to 44 years2,3,4,5
Number of deaths Age-specific mortality rateper 100,000 population 6
Bothsexes
Males Females Bothsexes
Males Females
Acute rheumatic fever and chronic rheumatic heart diseases(I00-I09) 4 3 1 0.2 0.2 0.1
Hypertensive heart disease (I11) 9 7 2 0.4 0.6 0.2Hypertensive heart and renal disease (I13) 0 0 0 0.0 0.0 0.0Ischaemic heart diseases (I20-I25) 279 223 56 11.2 17.8 4.5Acute myocardial infarction (I21-I22) 116 96 20 4.7 7.7 1.6Other acute ischaemic heart diseases (I24) 8 8 0 0.3 0.6 0.0Other forms of chronic ischaemic heart disease (I20, I25) 155 119 36 6.2 9.5 2.9Atherosclerotic cardiovascular disease, so described (I25.0) 28 20 8 1.1 1.6 0.6All other forms of chronic ischaemic heart disease (I20, I25.1-I25.9) 127 99 28 5.1 7.9 2.3Other heart diseases (I26-I51) 122 81 41 4.9 6.5 3.3Acute and subacute endocarditis (I33) 8 8 0 0.3 0.6 0.0Diseases of pericardium and acute myocarditis (I30-I31, I40) 3 1 2 0.1 0.1 0.2Heart failure (I50) 16 11 5 0.6 0.9 0.4All other forms of heart disease (I26-I28, I34-I38, I42-I49, I51) 95 61 34 3.8 4.9 2.8Essential hypertension and hypertensive renal disease (I10, I12,
I15) 4 3 1 0.2 0.2 0.1Cerebrovascular diseases (I60-I69) 65 31 34 2.6 2.5 2.8Atherosclerosis (I70) 2 2 0 0.1 0.2 0.0Other diseases of circulatory system (I71-I78) 19 15 4 0.8 1.2 0.3Aortic aneurysm and dissection (I71) 15 13 2 0.6 1.0 0.2Other diseases of arteries, arterioles and capillaries (I72-I78) 4 2 2 0.2 0.2 0.2Other disorders of circulatory system (I80-I99) 9 4 5 0.4 0.3 0.4Influenza and pneumonia (J09-J18) 66 34 32 2.7 2.7 2.6Influenza (J09-J11) 17 8 9 0.7 0.6 0.7Pneumonia (J12-J18) 49 26 23 2.0 2.1 1.9Other acute lower respiratory infections (J20-J22) 0 0 0 0.0 0.0 0.0Acute bronchitis and bronchiolitis (J20-J21) 0 0 0 0.0 0.0 0.0Unspecified acute lower respiratory infection (J22) 0 0 0 0.0 0.0 0.0Chronic lower respiratory diseases (J40-J47) 6 3 3 0.2 0.2 0.2Bronchitis, chronic and unspecified (J40-J42) 0 0 0 0.0 0.0 0.0Emphysema (J43) 0 0 0 0.0 0.0 0.0Asthma (J45-J46) 2 1 1 0.1 0.1 0.1Other chronic lower respiratory diseases (J44, J47) 4 2 2 0.2 0.2 0.2Pneumoconioses and chemical effects (J60-J66, J68) 3 1 2 0.1 0.1 0.2Pneumonitis due to solids and liquids (J69) 8 7 1 0.3 0.6 0.1Other diseases of respiratory system (J00-J06, J30-J39, J67,
J70-J98) 18 10 8 0.7 0.8 0.6Peptic ulcer (K25-K28) 1 1 0 0.0 0.1 0.0Diseases of appendix (K35-K38) 1 1 0 0.0 0.1 0.0Hernia (K40-K46) 2 2 0 0.1 0.2 0.0Chronic liver disease and cirrhosis (K70, K73-K74) 87 58 29 3.5 4.6 2.4Alcoholic liver disease (K70) 69 46 23 2.8 3.7 1.9Other chronic liver disease and cirrhosis (K73-K74) 18 12 6 0.7 1.0 0.5Cholelithiasis and other disorders of gallbladder (K80-K82) 1 1 0 0.0 0.1 0.0Nephritis, nephrotic syndrome and nephrosis (N00-N07,
N17-N19, N25-N27) 9 4 5 0.4 0.3 0.4Acute and rapidly progressive nephritic and nephrotic syndrome
(N00-N01, N04) 0 0 0 0.0 0.0 0.0Chronic glomerulonephritis, nephritis and nephropathy not
specified as acute or chronic, and renal sclerosis unspecified(N02-N03, N05-N07, N26) 2 1 1 0.1 0.1 0.1
Renal failure (N17-N19) 7 3 4 0.3 0.2 0.3Other disorders of kidney (N25, N27) 0 0 0 0.0 0.0 0.0Infections of kidney (N10-N12, N13.6, N15.1) 1 0 1 0.0 0.0 0.1Hyperplasia of prostate (N40) ... 0 ... ... 0.0 ...Inflammatory diseases of female pelvic organs (N70-N76) ... ... 1 ... ... 0.1Pregnancy, childbirth and the puerperium (O00-O99) ... ... 5 ... ... 0.4Pregnancy with abortive outcome (O00-O07) ... ... 1 ... ... 0.1Other complications of pregnancy, childbirth and the puerperium
(O10-O99) ... ... 4 ... ... 0.3Certain conditions originating in the perinatal period (P00-P96) 0 0 0 0.0 0.0 0.0Congenital malformations, deformations and chromosomal
abnormalities (Q00-Q99) 39 26 13 1.6 2.1 1.1Symptoms, signs and abnormal clinical and laboratory findings,
not elsewhere classified (R00-R99) 92 52 40 3.7 4.2 3.2
See notes at the end of the table.
82 Statistics Canada – Catalogue no. 84F0209X
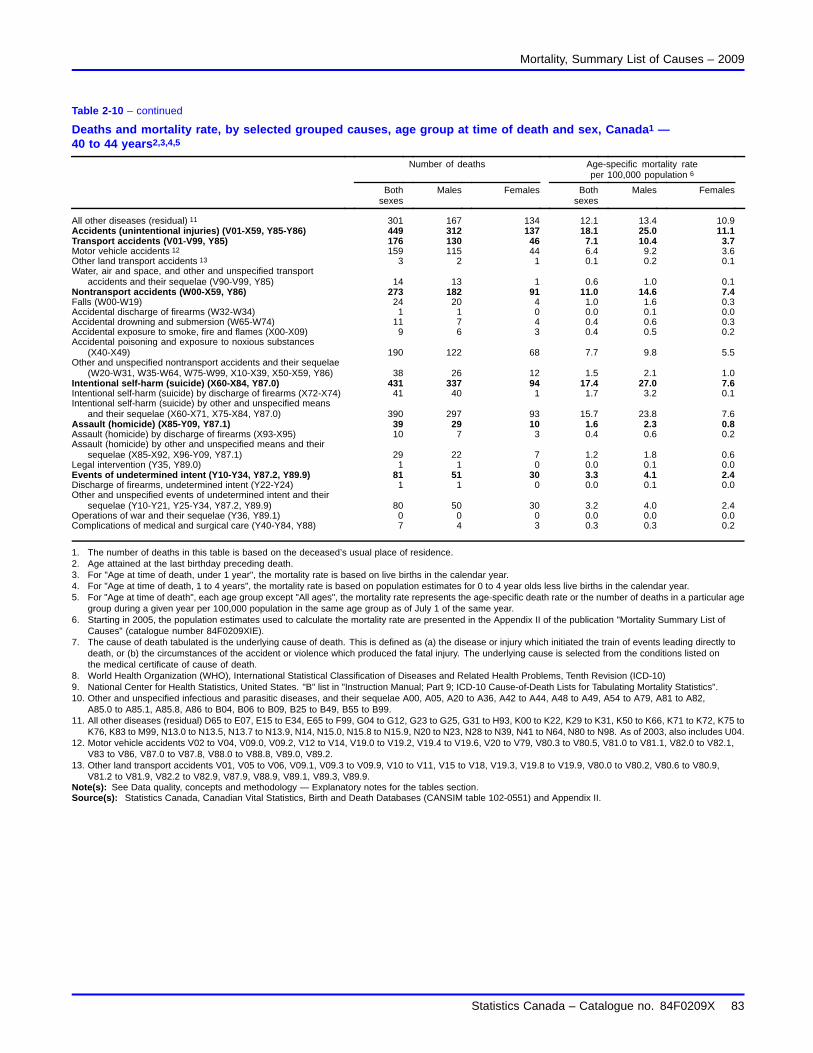
Mortality, Summary List of Causes – 2009
Table 2-10 – continued
Deaths and mortality rate, by selected grouped causes, age group at time of death and sex, Canada1 —40 to 44 years2,3,4,5
Number of deaths Age-specific mortality rateper 100,000 population 6
Bothsexes
Males Females Bothsexes
Males Females
All other diseases (residual) 11 301 167 134 12.1 13.4 10.9Accidents (unintentional injuries) (V01-X59, Y85-Y86) 449 312 137 18.1 25.0 11.1Transport accidents (V01-V99, Y85) 176 130 46 7.1 10.4 3.7Motor vehicle accidents 12 159 115 44 6.4 9.2 3.6Other land transport accidents 13 3 2 1 0.1 0.2 0.1Water, air and space, and other and unspecified transport
accidents and their sequelae (V90-V99, Y85) 14 13 1 0.6 1.0 0.1Nontransport accidents (W00-X59, Y86) 273 182 91 11.0 14.6 7.4Falls (W00-W19) 24 20 4 1.0 1.6 0.3Accidental discharge of firearms (W32-W34) 1 1 0 0.0 0.1 0.0Accidental drowning and submersion (W65-W74) 11 7 4 0.4 0.6 0.3Accidental exposure to smoke, fire and flames (X00-X09) 9 6 3 0.4 0.5 0.2Accidental poisoning and exposure to noxious substances
(X40-X49) 190 122 68 7.7 9.8 5.5Other and unspecified nontransport accidents and their sequelae
(W20-W31, W35-W64, W75-W99, X10-X39, X50-X59, Y86) 38 26 12 1.5 2.1 1.0Intentional self-harm (suicide) (X60-X84, Y87.0) 431 337 94 17.4 27.0 7.6Intentional self-harm (suicide) by discharge of firearms (X72-X74) 41 40 1 1.7 3.2 0.1Intentional self-harm (suicide) by other and unspecified means
and their sequelae (X60-X71, X75-X84, Y87.0) 390 297 93 15.7 23.8 7.6Assault (homicide) (X85-Y09, Y87.1) 39 29 10 1.6 2.3 0.8Assault (homicide) by discharge of firearms (X93-X95) 10 7 3 0.4 0.6 0.2Assault (homicide) by other and unspecified means and their
sequelae (X85-X92, X96-Y09, Y87.1) 29 22 7 1.2 1.8 0.6Legal intervention (Y35, Y89.0) 1 1 0 0.0 0.1 0.0Events of undetermined intent (Y10-Y34, Y87.2, Y89.9) 81 51 30 3.3 4.1 2.4Discharge of firearms, undetermined intent (Y22-Y24) 1 1 0 0.0 0.1 0.0Other and unspecified events of undetermined intent and their
sequelae (Y10-Y21, Y25-Y34, Y87.2, Y89.9) 80 50 30 3.2 4.0 2.4Operations of war and their sequelae (Y36, Y89.1) 0 0 0 0.0 0.0 0.0Complications of medical and surgical care (Y40-Y84, Y88) 7 4 3 0.3 0.3 0.2
1. The number of deaths in this table is based on the deceased’s usual place of residence.2. Age attained at the last birthday preceding death.3. For "Age at time of death, under 1 year", the mortality rate is based on live births in the calendar year.4. For "Age at time of death, 1 to 4 years", the mortality rate is based on population estimates for 0 to 4 year olds less live births in the calendar year.5. For "Age at time of death", each age group except "All ages", the mortality rate represents the age-specific death rate or the number of deaths in a particular age
group during a given year per 100,000 population in the same age group as of July 1 of the same year.6. Starting in 2005, the population estimates used to calculate the mortality rate are presented in the Appendix II of the publication "Mortality Summary List of
Causes" (catalogue number 84F0209XIE).7. The cause of death tabulated is the underlying cause of death. This is defined as (a) the disease or injury which initiated the train of events leading directly to
death, or (b) the circumstances of the accident or violence which produced the fatal injury. The underlying cause is selected from the conditions listed onthe medical certificate of cause of death.
8. World Health Organization (WHO), International Statistical Classification of Diseases and Related Health Problems, Tenth Revision (ICD-10)9. National Center for Health Statistics, United States. "B" list in "Instruction Manual; Part 9; ICD-10 Cause-of-Death Lists for Tabulating Mortality Statistics".10. Other and unspecified infectious and parasitic diseases, and their sequelae A00, A05, A20 to A36, A42 to A44, A48 to A49, A54 to A79, A81 to A82,
A85.0 to A85.1, A85.8, A86 to B04, B06 to B09, B25 to B49, B55 to B99.11. All other diseases (residual) D65 to E07, E15 to E34, E65 to F99, G04 to G12, G23 to G25, G31 to H93, K00 to K22, K29 to K31, K50 to K66, K71 to K72, K75 to
K76, K83 to M99, N13.0 to N13.5, N13.7 to N13.9, N14, N15.0, N15.8 to N15.9, N20 to N23, N28 to N39, N41 to N64, N80 to N98. As of 2003, also includes U04.12. Motor vehicle accidents V02 to V04, V09.0, V09.2, V12 to V14, V19.0 to V19.2, V19.4 to V19.6, V20 to V79, V80.3 to V80.5, V81.0 to V81.1, V82.0 to V82.1,
V83 to V86, V87.0 to V87.8, V88.0 to V88.8, V89.0, V89.2.13. Other land transport accidents V01, V05 to V06, V09.1, V09.3 to V09.9, V10 to V11, V15 to V18, V19.3, V19.8 to V19.9, V80.0 to V80.2, V80.6 to V80.9,
V81.2 to V81.9, V82.2 to V82.9, V87.9, V88.9, V89.1, V89.3, V89.9.Note(s): See Data quality, concepts and methodology — Explanatory notes for the tables section.Source(s): Statistics Canada, Canadian Vital Statistics, Birth and Death Databases (CANSIM table 102-0551) and Appendix II.
Statistics Canada – Catalogue no. 84F0209X 83

Mortality, Summary List of Causes – 2009
Table 2-11Deaths and mortality rate, by selected grouped causes, age group at time of death and sex, Canada1 —45 to 49 years2,3,4,5
Number of deaths Age-specific mortality rateper 100,000 population 6
Bothsexes
Males Females Bothsexes
Males Females
Total, all causes of death (A00-Y89) 7 , 8 , 9 5,846 3,510 2,336 209.7 250.4 168.5
Salmonella infections (A01-A02) 0 0 0 0.0 0.0 0.0Shigellosis and amoebiasis (A03, A06) 0 0 0 0.0 0.0 0.0Certain other intestinal infections (A04, A07-A09) 8 6 2 0.3 0.4 0.1Tuberculosis (A16-A19) 3 3 0 0.1 0.2 0.0Respiratory tuberculosis (A16) 1 1 0 0.0 0.1 0.0Other tuberculosis (A17-A19) 2 2 0 0.1 0.1 0.0Whooping cough (A37) 0 0 0 0.0 0.0 0.0Scarlet fever and erysipelas (A38, A46) 0 0 0 0.0 0.0 0.0Meningococcal infection (A39) 0 0 0 0.0 0.0 0.0Septicaemia (A40-A41) 32 17 15 1.1 1.2 1.1Syphilis (A50-A53) 0 0 0 0.0 0.0 0.0Acute poliomyelitis (A80) 0 0 0 0.0 0.0 0.0Arthropod-borne viral encephalitis (A83-A84, A85.2) 0 0 0 0.0 0.0 0.0Measles (B05) 0 0 0 0.0 0.0 0.0Viral hepatitis (B15-B19) 34 21 13 1.2 1.5 0.9Human immunodeficiency virus [HIV] disease (B20-B24) 78 63 15 2.8 4.5 1.1Malaria (B50-B54) 0 0 0 0.0 0.0 0.0Other and unspecified infectious and parasitic diseases and their
sequelae 10 10 8 2 0.4 0.6 0.1Malignant neoplasms (C00-C97) 2,035 890 1,145 73.0 63.5 82.6Malignant neoplasms of lip, oral cavity and pharynx (C00-C14) 36 28 8 1.3 2.0 0.6Malignant neoplasm of oesophagus (C15) 62 53 9 2.2 3.8 0.6Malignant neoplasm of stomach (C16) 64 41 23 2.3 2.9 1.7Malignant neoplasms of colon, rectum and anus (C18-C21) 206 117 89 7.4 8.3 6.4Malignant neoplasm of liver and intrahepatic bile ducts (C22) 51 38 13 1.8 2.7 0.9Malignant neoplasm of pancreas (C25) 106 58 48 3.8 4.1 3.5Malignant neoplasm of larynx (C32) 6 6 0 0.2 0.4 0.0Malignant neoplasms of trachea, bronchus and lung (C33-C34) 438 188 250 15.7 13.4 18.0Malignant melanoma of skin (C43) 77 46 31 2.8 3.3 2.2Malignant neoplasm of breast (C50) 288 2 286 10.3 0.1 20.6Malignant neoplasm of cervix uteri (C53) ... ... 51 ... ... 3.7Malignant neoplasms of corpus uteri and uterus, part unspecified
(C54-C55) ... ... 23 ... ... 1.7Malignant neoplasm of ovary (C56) ... ... 75 ... ... 5.4Malignant neoplasm of prostate (C61) ... 13 ... ... 0.9 ...Malignant neoplasms of kidney and renal pelvis (C64-C65) 43 29 14 1.5 2.1 1.0Malignant neoplasm of bladder (C67) 24 15 9 0.9 1.1 0.6Malignant neoplasms of meninges, brain and other parts of central
nervous system (C70-C72) 108 75 33 3.9 5.3 2.4Malignant neoplasms of lymphoid, haematopoietic and
related tissue (C81-C96) 138 71 67 4.9 5.1 4.8Hodgkin’s disease (C81) 4 1 3 0.1 0.1 0.2Non-Hodgkin’s lymphoma (C82-C85) 67 37 30 2.4 2.6 2.2Leukaemia (C91-C95) 53 26 27 1.9 1.9 1.9Multiple myeloma and immunoproliferative neoplasms (C88, C90) 13 6 7 0.5 0.4 0.5Other and unspecified malignant neoplasms of lymphoid,
haematopoietic and related tissue (C96) 1 1 0 0.0 0.1 0.0All other and unspecified malignant neoplasms (C17, C23-C24,
C26-C31, C37-C41, C44-C49, C51-C52, C57-C60, C62-C63,C66, C68-C69, C73-C80, C97) 226 110 116 8.1 7.8 8.4
In situ neoplasms, benign neoplasms and neoplasms of uncertainor unknown behaviour (D00-D48) 23 15 8 0.8 1.1 0.6
Anaemias (D50-D64) 2 2 0 0.1 0.1 0.0Diabetes mellitus (E10-E14) 112 78 34 4.0 5.6 2.5Nutritional deficiencies (E40-E64) 1 0 1 0.0 0.0 0.1Malnutrition (E40-E46) 0 0 0 0.0 0.0 0.0Other nutritional deficiencies (E50-E64) 1 0 1 0.0 0.0 0.1Meningitis (G00, G03) 6 4 2 0.2 0.3 0.1Parkinson’s disease (G20-G21) 0 0 0 0.0 0.0 0.0Alzheimer’s disease (G30) 5 1 4 0.2 0.1 0.3Major cardiovascular diseases (I00-I78) 1,024 745 279 36.7 53.1 20.1Diseases of heart (I00-I09, I11, I13, I20-I51) 843 646 197 30.2 46.1 14.2
See notes at the end of the table.
84 Statistics Canada – Catalogue no. 84F0209X

Mortality, Summary List of Causes – 2009
Table 2-11 – continued
Deaths and mortality rate, by selected grouped causes, age group at time of death and sex, Canada1 —45 to 49 years2,3,4,5
Number of deaths Age-specific mortality rateper 100,000 population 6
Bothsexes
Males Females Bothsexes
Males Females
Acute rheumatic fever and chronic rheumatic heart diseases(I00-I09) 4 3 1 0.1 0.2 0.1
Hypertensive heart disease (I11) 18 16 2 0.6 1.1 0.1Hypertensive heart and renal disease (I13) 1 1 0 0.0 0.1 0.0Ischaemic heart diseases (I20-I25) 629 504 125 22.6 35.9 9.0Acute myocardial infarction (I21-I22) 290 229 61 10.4 16.3 4.4Other acute ischaemic heart diseases (I24) 21 17 4 0.8 1.2 0.3Other forms of chronic ischaemic heart disease (I20, I25) 318 258 60 11.4 18.4 4.3Atherosclerotic cardiovascular disease, so described (I25.0) 51 39 12 1.8 2.8 0.9All other forms of chronic ischaemic heart disease (I20, I25.1-I25.9) 267 219 48 9.6 15.6 3.5Other heart diseases (I26-I51) 191 122 69 6.9 8.7 5.0Acute and subacute endocarditis (I33) 6 3 3 0.2 0.2 0.2Diseases of pericardium and acute myocarditis (I30-I31, I40) 7 4 3 0.3 0.3 0.2Heart failure (I50) 12 9 3 0.4 0.6 0.2All other forms of heart disease (I26-I28, I34-I38, I42-I49, I51) 166 106 60 6.0 7.6 4.3Essential hypertension and hypertensive renal disease (I10, I12,
I15) 5 4 1 0.2 0.3 0.1Cerebrovascular diseases (I60-I69) 143 74 69 5.1 5.3 5.0Atherosclerosis (I70) 3 3 0 0.1 0.2 0.0Other diseases of circulatory system (I71-I78) 30 18 12 1.1 1.3 0.9Aortic aneurysm and dissection (I71) 22 16 6 0.8 1.1 0.4Other diseases of arteries, arterioles and capillaries (I72-I78) 8 2 6 0.3 0.1 0.4Other disorders of circulatory system (I80-I99) 18 9 9 0.6 0.6 0.6Influenza and pneumonia (J09-J18) 118 68 50 4.2 4.9 3.6Influenza (J09-J11) 41 23 18 1.5 1.6 1.3Pneumonia (J12-J18) 77 45 32 2.8 3.2 2.3Other acute lower respiratory infections (J20-J22) 1 1 0 0.0 0.1 0.0Acute bronchitis and bronchiolitis (J20-J21) 1 1 0 0.0 0.1 0.0Unspecified acute lower respiratory infection (J22) 0 0 0 0.0 0.0 0.0Chronic lower respiratory diseases (J40-J47) 45 20 25 1.6 1.4 1.8Bronchitis, chronic and unspecified (J40-J42) 1 1 0 0.0 0.1 0.0Emphysema (J43) 5 4 1 0.2 0.3 0.1Asthma (J45-J46) 10 4 6 0.4 0.3 0.4Other chronic lower respiratory diseases (J44, J47) 29 11 18 1.0 0.8 1.3Pneumoconioses and chemical effects (J60-J66, J68) 6 2 4 0.2 0.1 0.3Pneumonitis due to solids and liquids (J69) 17 10 7 0.6 0.7 0.5Other diseases of respiratory system (J00-J06, J30-J39, J67,
J70-J98) 34 18 16 1.2 1.3 1.2Peptic ulcer (K25-K28) 9 8 1 0.3 0.6 0.1Diseases of appendix (K35-K38) 3 2 1 0.1 0.1 0.1Hernia (K40-K46) 3 2 1 0.1 0.1 0.1Chronic liver disease and cirrhosis (K70, K73-K74) 203 121 82 7.3 8.6 5.9Alcoholic liver disease (K70) 142 87 55 5.1 6.2 4.0Other chronic liver disease and cirrhosis (K73-K74) 61 34 27 2.2 2.4 1.9Cholelithiasis and other disorders of gallbladder (K80-K82) 7 2 5 0.3 0.1 0.4Nephritis, nephrotic syndrome and nephrosis (N00-N07,
N17-N19, N25-N27) 17 11 6 0.6 0.8 0.4Acute and rapidly progressive nephritic and nephrotic syndrome
(N00-N01, N04) 1 1 0 0.0 0.1 0.0Chronic glomerulonephritis, nephritis and nephropathy not
specified as acute or chronic, and renal sclerosis unspecified(N02-N03, N05-N07, N26) 0 0 0 0.0 0.0 0.0
Renal failure (N17-N19) 16 10 6 0.6 0.7 0.4Other disorders of kidney (N25, N27) 0 0 0 0.0 0.0 0.0Infections of kidney (N10-N12, N13.6, N15.1) 5 0 5 0.2 0.0 0.4Hyperplasia of prostate (N40) ... 0 ... ... 0.0 ...Inflammatory diseases of female pelvic organs (N70-N76) ... ... 2 ... ... 0.1Pregnancy, childbirth and the puerperium (O00-O99) ... ... 0 ... ... 0.0Pregnancy with abortive outcome (O00-O07) ... ... 0 ... ... 0.0Other complications of pregnancy, childbirth and the puerperium
(O10-O99) ... ... 0 ... ... 0.0Certain conditions originating in the perinatal period (P00-P96) 0 0 0 0.0 0.0 0.0Congenital malformations, deformations and chromosomal
abnormalities (Q00-Q99) 49 30 19 1.8 2.1 1.4Symptoms, signs and abnormal clinical and laboratory findings,
not elsewhere classified (R00-R99) 111 72 39 4.0 5.1 2.8
See notes at the end of the table.
Statistics Canada – Catalogue no. 84F0209X 85

Mortality, Summary List of Causes – 2009
Table 2-11 – continued
Deaths and mortality rate, by selected grouped causes, age group at time of death and sex, Canada1 —45 to 49 years2,3,4,5
Number of deaths Age-specific mortality rateper 100,000 population 6
Bothsexes
Males Females Bothsexes
Males Females
All other diseases (residual) 11 540 313 227 19.4 22.3 16.4Accidents (unintentional injuries) (V01-X59, Y85-Y86) 638 481 157 22.9 34.3 11.3Transport accidents (V01-V99, Y85) 235 182 53 8.4 13.0 3.8Motor vehicle accidents 12 199 152 47 7.1 10.8 3.4Other land transport accidents 13 4 4 0 0.1 0.3 0.0Water, air and space, and other and unspecified transport
accidents and their sequelae (V90-V99, Y85) 32 26 6 1.1 1.9 0.4Nontransport accidents (W00-X59, Y86) 403 299 104 14.5 21.3 7.5Falls (W00-W19) 55 43 12 2.0 3.1 0.9Accidental discharge of firearms (W32-W34) 0 0 0 0.0 0.0 0.0Accidental drowning and submersion (W65-W74) 20 16 4 0.7 1.1 0.3Accidental exposure to smoke, fire and flames (X00-X09) 13 10 3 0.5 0.7 0.2Accidental poisoning and exposure to noxious substances
(X40-X49) 237 166 71 8.5 11.8 5.1Other and unspecified nontransport accidents and their sequelae
(W20-W31, W35-W64, W75-W99, X10-X39, X50-X59, Y86) 78 64 14 2.8 4.6 1.0Intentional self-harm (suicide) (X60-X84, Y87.0) 491 376 115 17.6 26.8 8.3Intentional self-harm (suicide) by discharge of firearms (X72-X74) 67 63 4 2.4 4.5 0.3Intentional self-harm (suicide) by other and unspecified means
and their sequelae (X60-X71, X75-X84, Y87.0) 424 313 111 15.2 22.3 8.0Assault (homicide) (X85-Y09, Y87.1) 42 30 12 1.5 2.1 0.9Assault (homicide) by discharge of firearms (X93-X95) 5 3 2 0.2 0.2 0.1Assault (homicide) by other and unspecified means and their
sequelae (X85-X92, X96-Y09, Y87.1) 37 27 10 1.3 1.9 0.7Legal intervention (Y35, Y89.0) 3 3 0 0.1 0.2 0.0Events of undetermined intent (Y10-Y34, Y87.2, Y89.9) 106 75 31 3.8 5.3 2.2Discharge of firearms, undetermined intent (Y22-Y24) 0 0 0 0.0 0.0 0.0Other and unspecified events of undetermined intent and their
sequelae (Y10-Y21, Y25-Y34, Y87.2, Y89.9) 106 75 31 3.8 5.3 2.2Operations of war and their sequelae (Y36, Y89.1) 0 0 0 0.0 0.0 0.0Complications of medical and surgical care (Y40-Y84, Y88) 5 3 2 0.2 0.2 0.1
1. The number of deaths in this table is based on the deceased’s usual place of residence.2. Age attained at the last birthday preceding death.3. For "Age at time of death, under 1 year", the mortality rate is based on live births in the calendar year.4. For "Age at time of death, 1 to 4 years", the mortality rate is based on population estimates for 0 to 4 year olds less live births in the calendar year.5. For "Age at time of death", each age group except "All ages", the mortality rate represents the age-specific death rate or the number of deaths in a particular age
group during a given year per 100,000 population in the same age group as of July 1 of the same year.6. Starting in 2005, the population estimates used to calculate the mortality rate are presented in the Appendix II of the publication "Mortality Summary List of
Causes" (catalogue number 84F0209XIE).7. The cause of death tabulated is the underlying cause of death. This is defined as (a) the disease or injury which initiated the train of events leading directly to
death, or (b) the circumstances of the accident or violence which produced the fatal injury. The underlying cause is selected from the conditions listed onthe medical certificate of cause of death.
8. World Health Organization (WHO), International Statistical Classification of Diseases and Related Health Problems, Tenth Revision (ICD-10)9. National Center for Health Statistics, United States. "B" list in "Instruction Manual; Part 9; ICD-10 Cause-of-Death Lists for Tabulating Mortality Statistics".10. Other and unspecified infectious and parasitic diseases, and their sequelae A00, A05, A20 to A36, A42 to A44, A48 to A49, A54 to A79, A81 to A82,
A85.0 to A85.1, A85.8, A86 to B04, B06 to B09, B25 to B49, B55 to B99.11. All other diseases (residual) D65 to E07, E15 to E34, E65 to F99, G04 to G12, G23 to G25, G31 to H93, K00 to K22, K29 to K31, K50 to K66, K71 to K72, K75 to
K76, K83 to M99, N13.0 to N13.5, N13.7 to N13.9, N14, N15.0, N15.8 to N15.9, N20 to N23, N28 to N39, N41 to N64, N80 to N98. As of 2003, also includes U04.12. Motor vehicle accidents V02 to V04, V09.0, V09.2, V12 to V14, V19.0 to V19.2, V19.4 to V19.6, V20 to V79, V80.3 to V80.5, V81.0 to V81.1, V82.0 to V82.1,
V83 to V86, V87.0 to V87.8, V88.0 to V88.8, V89.0, V89.2.13. Other land transport accidents V01, V05 to V06, V09.1, V09.3 to V09.9, V10 to V11, V15 to V18, V19.3, V19.8 to V19.9, V80.0 to V80.2, V80.6 to V80.9,
V81.2 to V81.9, V82.2 to V82.9, V87.9, V88.9, V89.1, V89.3, V89.9.Note(s): See Data quality, concepts and methodology — Explanatory notes for the tables section.Source(s): Statistics Canada, Canadian Vital Statistics, Birth and Death Databases (CANSIM table 102-0551) and Appendix II.
86 Statistics Canada – Catalogue no. 84F0209X
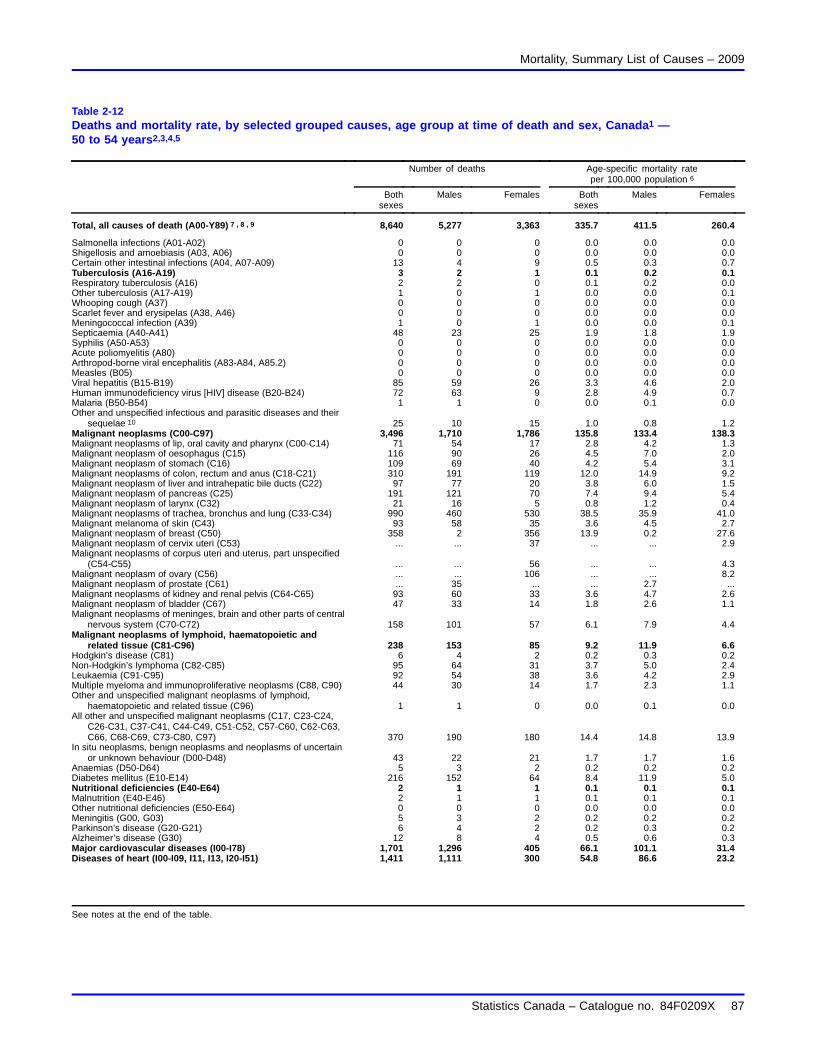
Mortality, Summary List of Causes – 2009
Table 2-12Deaths and mortality rate, by selected grouped causes, age group at time of death and sex, Canada1 —50 to 54 years2,3,4,5
Number of deaths Age-specific mortality rateper 100,000 population 6
Bothsexes
Males Females Bothsexes
Males Females
Total, all causes of death (A00-Y89) 7 , 8 , 9 8,640 5,277 3,363 335.7 411.5 260.4
Salmonella infections (A01-A02) 0 0 0 0.0 0.0 0.0Shigellosis and amoebiasis (A03, A06) 0 0 0 0.0 0.0 0.0Certain other intestinal infections (A04, A07-A09) 13 4 9 0.5 0.3 0.7Tuberculosis (A16-A19) 3 2 1 0.1 0.2 0.1Respiratory tuberculosis (A16) 2 2 0 0.1 0.2 0.0Other tuberculosis (A17-A19) 1 0 1 0.0 0.0 0.1Whooping cough (A37) 0 0 0 0.0 0.0 0.0Scarlet fever and erysipelas (A38, A46) 0 0 0 0.0 0.0 0.0Meningococcal infection (A39) 1 0 1 0.0 0.0 0.1Septicaemia (A40-A41) 48 23 25 1.9 1.8 1.9Syphilis (A50-A53) 0 0 0 0.0 0.0 0.0Acute poliomyelitis (A80) 0 0 0 0.0 0.0 0.0Arthropod-borne viral encephalitis (A83-A84, A85.2) 0 0 0 0.0 0.0 0.0Measles (B05) 0 0 0 0.0 0.0 0.0Viral hepatitis (B15-B19) 85 59 26 3.3 4.6 2.0Human immunodeficiency virus [HIV] disease (B20-B24) 72 63 9 2.8 4.9 0.7Malaria (B50-B54) 1 1 0 0.0 0.1 0.0Other and unspecified infectious and parasitic diseases and their
sequelae 10 25 10 15 1.0 0.8 1.2Malignant neoplasms (C00-C97) 3,496 1,710 1,786 135.8 133.4 138.3Malignant neoplasms of lip, oral cavity and pharynx (C00-C14) 71 54 17 2.8 4.2 1.3Malignant neoplasm of oesophagus (C15) 116 90 26 4.5 7.0 2.0Malignant neoplasm of stomach (C16) 109 69 40 4.2 5.4 3.1Malignant neoplasms of colon, rectum and anus (C18-C21) 310 191 119 12.0 14.9 9.2Malignant neoplasm of liver and intrahepatic bile ducts (C22) 97 77 20 3.8 6.0 1.5Malignant neoplasm of pancreas (C25) 191 121 70 7.4 9.4 5.4Malignant neoplasm of larynx (C32) 21 16 5 0.8 1.2 0.4Malignant neoplasms of trachea, bronchus and lung (C33-C34) 990 460 530 38.5 35.9 41.0Malignant melanoma of skin (C43) 93 58 35 3.6 4.5 2.7Malignant neoplasm of breast (C50) 358 2 356 13.9 0.2 27.6Malignant neoplasm of cervix uteri (C53) ... ... 37 ... ... 2.9Malignant neoplasms of corpus uteri and uterus, part unspecified
(C54-C55) ... ... 56 ... ... 4.3Malignant neoplasm of ovary (C56) ... ... 106 ... ... 8.2Malignant neoplasm of prostate (C61) ... 35 ... ... 2.7 ...Malignant neoplasms of kidney and renal pelvis (C64-C65) 93 60 33 3.6 4.7 2.6Malignant neoplasm of bladder (C67) 47 33 14 1.8 2.6 1.1Malignant neoplasms of meninges, brain and other parts of central
nervous system (C70-C72) 158 101 57 6.1 7.9 4.4Malignant neoplasms of lymphoid, haematopoietic and
related tissue (C81-C96) 238 153 85 9.2 11.9 6.6Hodgkin’s disease (C81) 6 4 2 0.2 0.3 0.2Non-Hodgkin’s lymphoma (C82-C85) 95 64 31 3.7 5.0 2.4Leukaemia (C91-C95) 92 54 38 3.6 4.2 2.9Multiple myeloma and immunoproliferative neoplasms (C88, C90) 44 30 14 1.7 2.3 1.1Other and unspecified malignant neoplasms of lymphoid,
haematopoietic and related tissue (C96) 1 1 0 0.0 0.1 0.0All other and unspecified malignant neoplasms (C17, C23-C24,
C26-C31, C37-C41, C44-C49, C51-C52, C57-C60, C62-C63,C66, C68-C69, C73-C80, C97) 370 190 180 14.4 14.8 13.9
In situ neoplasms, benign neoplasms and neoplasms of uncertainor unknown behaviour (D00-D48) 43 22 21 1.7 1.7 1.6
Anaemias (D50-D64) 5 3 2 0.2 0.2 0.2Diabetes mellitus (E10-E14) 216 152 64 8.4 11.9 5.0Nutritional deficiencies (E40-E64) 2 1 1 0.1 0.1 0.1Malnutrition (E40-E46) 2 1 1 0.1 0.1 0.1Other nutritional deficiencies (E50-E64) 0 0 0 0.0 0.0 0.0Meningitis (G00, G03) 5 3 2 0.2 0.2 0.2Parkinson’s disease (G20-G21) 6 4 2 0.2 0.3 0.2Alzheimer’s disease (G30) 12 8 4 0.5 0.6 0.3Major cardiovascular diseases (I00-I78) 1,701 1,296 405 66.1 101.1 31.4Diseases of heart (I00-I09, I11, I13, I20-I51) 1,411 1,111 300 54.8 86.6 23.2
See notes at the end of the table.
Statistics Canada – Catalogue no. 84F0209X 87

Mortality, Summary List of Causes – 2009
Table 2-12 – continued
Deaths and mortality rate, by selected grouped causes, age group at time of death and sex, Canada1 —50 to 54 years2,3,4,5
Number of deaths Age-specific mortality rateper 100,000 population 6
Bothsexes
Males Females Bothsexes
Males Females
Acute rheumatic fever and chronic rheumatic heart diseases(I00-I09) 6 2 4 0.2 0.2 0.3
Hypertensive heart disease (I11) 29 24 5 1.1 1.9 0.4Hypertensive heart and renal disease (I13) 1 1 0 0.0 0.1 0.0Ischaemic heart diseases (I20-I25) 1,119 916 203 43.5 71.4 15.7Acute myocardial infarction (I21-I22) 506 407 99 19.7 31.7 7.7Other acute ischaemic heart diseases (I24) 37 29 8 1.4 2.3 0.6Other forms of chronic ischaemic heart disease (I20, I25) 576 480 96 22.4 37.4 7.4Atherosclerotic cardiovascular disease, so described (I25.0) 108 90 18 4.2 7.0 1.4All other forms of chronic ischaemic heart disease (I20, I25.1-I25.9) 468 390 78 18.2 30.4 6.0Other heart diseases (I26-I51) 256 168 88 9.9 13.1 6.8Acute and subacute endocarditis (I33) 10 8 2 0.4 0.6 0.2Diseases of pericardium and acute myocarditis (I30-I31, I40) 5 2 3 0.2 0.2 0.2Heart failure (I50) 29 19 10 1.1 1.5 0.8All other forms of heart disease (I26-I28, I34-I38, I42-I49, I51) 212 139 73 8.2 10.8 5.7Essential hypertension and hypertensive renal disease (I10, I12,
I15) 18 16 2 0.7 1.2 0.2Cerebrovascular diseases (I60-I69) 223 131 92 8.7 10.2 7.1Atherosclerosis (I70) 11 7 4 0.4 0.5 0.3Other diseases of circulatory system (I71-I78) 38 31 7 1.5 2.4 0.5Aortic aneurysm and dissection (I71) 21 16 5 0.8 1.2 0.4Other diseases of arteries, arterioles and capillaries (I72-I78) 17 15 2 0.7 1.2 0.2Other disorders of circulatory system (I80-I99) 19 11 8 0.7 0.9 0.6Influenza and pneumonia (J09-J18) 138 83 55 5.4 6.5 4.3Influenza (J09-J11) 39 21 18 1.5 1.6 1.4Pneumonia (J12-J18) 99 62 37 3.8 4.8 2.9Other acute lower respiratory infections (J20-J22) 1 1 0 0.0 0.1 0.0Acute bronchitis and bronchiolitis (J20-J21) 1 1 0 0.0 0.1 0.0Unspecified acute lower respiratory infection (J22) 0 0 0 0.0 0.0 0.0Chronic lower respiratory diseases (J40-J47) 127 64 63 4.9 5.0 4.9Bronchitis, chronic and unspecified (J40-J42) 3 2 1 0.1 0.2 0.1Emphysema (J43) 20 13 7 0.8 1.0 0.5Asthma (J45-J46) 12 5 7 0.5 0.4 0.5Other chronic lower respiratory diseases (J44, J47) 92 44 48 3.6 3.4 3.7Pneumoconioses and chemical effects (J60-J66, J68) 4 2 2 0.2 0.2 0.2Pneumonitis due to solids and liquids (J69) 31 23 8 1.2 1.8 0.6Other diseases of respiratory system (J00-J06, J30-J39, J67,
J70-J98) 58 29 29 2.3 2.3 2.2Peptic ulcer (K25-K28) 25 15 10 1.0 1.2 0.8Diseases of appendix (K35-K38) 0 0 0 0.0 0.0 0.0Hernia (K40-K46) 6 5 1 0.2 0.4 0.1Chronic liver disease and cirrhosis (K70, K73-K74) 338 238 100 13.1 18.6 7.7Alcoholic liver disease (K70) 238 170 68 9.2 13.3 5.3Other chronic liver disease and cirrhosis (K73-K74) 100 68 32 3.9 5.3 2.5Cholelithiasis and other disorders of gallbladder (K80-K82) 10 2 8 0.4 0.2 0.6Nephritis, nephrotic syndrome and nephrosis (N00-N07,
N17-N19, N25-N27) 43 24 19 1.7 1.9 1.5Acute and rapidly progressive nephritic and nephrotic syndrome
(N00-N01, N04) 1 0 1 0.0 0.0 0.1Chronic glomerulonephritis, nephritis and nephropathy not
specified as acute or chronic, and renal sclerosis unspecified(N02-N03, N05-N07, N26) 3 3 0 0.1 0.2 0.0
Renal failure (N17-N19) 39 21 18 1.5 1.6 1.4Other disorders of kidney (N25, N27) 0 0 0 0.0 0.0 0.0Infections of kidney (N10-N12, N13.6, N15.1) 3 1 2 0.1 0.1 0.2Hyperplasia of prostate (N40) ... 1 ... ... 0.1 ...Inflammatory diseases of female pelvic organs (N70-N76) ... ... 1 ... ... 0.1Pregnancy, childbirth and the puerperium (O00-O99) ... ... 0 ... ... 0.0Pregnancy with abortive outcome (O00-O07) ... ... 0 ... ... 0.0Other complications of pregnancy, childbirth and the puerperium
(O10-O99) ... ... 0 ... ... 0.0Certain conditions originating in the perinatal period (P00-P96) 1 1 0 0.0 0.1 0.0Congenital malformations, deformations and chromosomal
abnormalities (Q00-Q99) 42 22 20 1.6 1.7 1.5Symptoms, signs and abnormal clinical and laboratory findings,
not elsewhere classified (R00-R99) 102 66 36 4.0 5.1 2.8
See notes at the end of the table.
88 Statistics Canada – Catalogue no. 84F0209X

Mortality, Summary List of Causes – 2009
Table 2-12 – continued
Deaths and mortality rate, by selected grouped causes, age group at time of death and sex, Canada1 —50 to 54 years2,3,4,5
Number of deaths Age-specific mortality rateper 100,000 population 6
Bothsexes
Males Females Bothsexes
Males Females
All other diseases (residual) 11 733 425 308 28.5 33.1 23.8Accidents (unintentional injuries) (V01-X59, Y85-Y86) 599 453 146 23.3 35.3 11.3Transport accidents (V01-V99, Y85) 214 158 56 8.3 12.3 4.3Motor vehicle accidents 12 185 134 51 7.2 10.4 3.9Other land transport accidents 13 6 5 1 0.2 0.4 0.1Water, air and space, and other and unspecified transport
accidents and their sequelae (V90-V99, Y85) 23 19 4 0.9 1.5 0.3Nontransport accidents (W00-X59, Y86) 385 295 90 15.0 23.0 7.0Falls (W00-W19) 71 62 9 2.8 4.8 0.7Accidental discharge of firearms (W32-W34) 0 0 0 0.0 0.0 0.0Accidental drowning and submersion (W65-W74) 32 28 4 1.2 2.2 0.3Accidental exposure to smoke, fire and flames (X00-X09) 20 14 6 0.8 1.1 0.5Accidental poisoning and exposure to noxious substances
(X40-X49) 199 138 61 7.7 10.8 4.7Other and unspecified nontransport accidents and their sequelae
(W20-W31, W35-W64, W75-W99, X10-X39, X50-X59, Y86) 63 53 10 2.4 4.1 0.8Intentional self-harm (suicide) (X60-X84, Y87.0) 476 364 112 18.5 28.4 8.7Intentional self-harm (suicide) by discharge of firearms (X72-X74) 48 46 2 1.9 3.6 0.2Intentional self-harm (suicide) by other and unspecified means
and their sequelae (X60-X71, X75-X84, Y87.0) 428 318 110 16.6 24.8 8.5Assault (homicide) (X85-Y09, Y87.1) 27 20 7 1.0 1.6 0.5Assault (homicide) by discharge of firearms (X93-X95) 5 3 2 0.2 0.2 0.2Assault (homicide) by other and unspecified means and their
sequelae (X85-X92, X96-Y09, Y87.1) 22 17 5 0.9 1.3 0.4Legal intervention (Y35, Y89.0) 0 0 0 0.0 0.0 0.0Events of undetermined intent (Y10-Y34, Y87.2, Y89.9) 114 62 52 4.4 4.8 4.0Discharge of firearms, undetermined intent (Y22-Y24) 0 0 0 0.0 0.0 0.0Other and unspecified events of undetermined intent and their
sequelae (Y10-Y21, Y25-Y34, Y87.2, Y89.9) 114 62 52 4.4 4.8 4.0Operations of war and their sequelae (Y36, Y89.1) 0 0 0 0.0 0.0 0.0Complications of medical and surgical care (Y40-Y84, Y88) 7 4 3 0.3 0.3 0.2
1. The number of deaths in this table is based on the deceased’s usual place of residence.2. Age attained at the last birthday preceding death.3. For "Age at time of death, under 1 year", the mortality rate is based on live births in the calendar year.4. For "Age at time of death, 1 to 4 years", the mortality rate is based on population estimates for 0 to 4 year olds less live births in the calendar year.5. For "Age at time of death", each age group except "All ages", the mortality rate represents the age-specific death rate or the number of deaths in a particular age
group during a given year per 100,000 population in the same age group as of July 1 of the same year.6. Starting in 2005, the population estimates used to calculate the mortality rate are presented in the Appendix II of the publication "Mortality Summary List of
Causes" (catalogue number 84F0209XIE).7. The cause of death tabulated is the underlying cause of death. This is defined as (a) the disease or injury which initiated the train of events leading directly to
death, or (b) the circumstances of the accident or violence which produced the fatal injury. The underlying cause is selected from the conditions listed onthe medical certificate of cause of death.
8. World Health Organization (WHO), International Statistical Classification of Diseases and Related Health Problems, Tenth Revision (ICD-10)9. National Center for Health Statistics, United States. "B" list in "Instruction Manual; Part 9; ICD-10 Cause-of-Death Lists for Tabulating Mortality Statistics".10. Other and unspecified infectious and parasitic diseases, and their sequelae A00, A05, A20 to A36, A42 to A44, A48 to A49, A54 to A79, A81 to A82,
A85.0 to A85.1, A85.8, A86 to B04, B06 to B09, B25 to B49, B55 to B99.11. All other diseases (residual) D65 to E07, E15 to E34, E65 to F99, G04 to G12, G23 to G25, G31 to H93, K00 to K22, K29 to K31, K50 to K66, K71 to K72, K75 to
K76, K83 to M99, N13.0 to N13.5, N13.7 to N13.9, N14, N15.0, N15.8 to N15.9, N20 to N23, N28 to N39, N41 to N64, N80 to N98. As of 2003, also includes U04.12. Motor vehicle accidents V02 to V04, V09.0, V09.2, V12 to V14, V19.0 to V19.2, V19.4 to V19.6, V20 to V79, V80.3 to V80.5, V81.0 to V81.1, V82.0 to V82.1,
V83 to V86, V87.0 to V87.8, V88.0 to V88.8, V89.0, V89.2.13. Other land transport accidents V01, V05 to V06, V09.1, V09.3 to V09.9, V10 to V11, V15 to V18, V19.3, V19.8 to V19.9, V80.0 to V80.2, V80.6 to V80.9,
V81.2 to V81.9, V82.2 to V82.9, V87.9, V88.9, V89.1, V89.3, V89.9.Note(s): See Data quality, concepts and methodology — Explanatory notes for the tables section.Source(s): Statistics Canada, Canadian Vital Statistics, Birth and Death Databases (CANSIM table 102-0551) and Appendix II.
Statistics Canada – Catalogue no. 84F0209X 89

Mortality, Summary List of Causes – 2009
Table 2-13Deaths and mortality rate, by selected grouped causes, age group at time of death and sex, Canada1 —55 to 59 years2,3,4,5
Number of deaths Age-specific mortality rateper 100,000 population 6
Bothsexes
Males Females Bothsexes
Males Females
Total, all causes of death (A00-Y89) 7 , 8 , 9 11,176 6,813 4,363 504.4 623.5 388.5
Salmonella infections (A01-A02) 1 0 1 0.0 0.0 0.1Shigellosis and amoebiasis (A03, A06) 0 0 0 0.0 0.0 0.0Certain other intestinal infections (A04, A07-A09) 20 10 10 0.9 0.9 0.9Tuberculosis (A16-A19) 5 3 2 0.2 0.3 0.2Respiratory tuberculosis (A16) 4 2 2 0.2 0.2 0.2Other tuberculosis (A17-A19) 1 1 0 0.0 0.1 0.0Whooping cough (A37) 0 0 0 0.0 0.0 0.0Scarlet fever and erysipelas (A38, A46) 0 0 0 0.0 0.0 0.0Meningococcal infection (A39) 0 0 0 0.0 0.0 0.0Septicaemia (A40-A41) 68 36 32 3.1 3.3 2.8Syphilis (A50-A53) 0 0 0 0.0 0.0 0.0Acute poliomyelitis (A80) 0 0 0 0.0 0.0 0.0Arthropod-borne viral encephalitis (A83-A84, A85.2) 0 0 0 0.0 0.0 0.0Measles (B05) 0 0 0 0.0 0.0 0.0Viral hepatitis (B15-B19) 107 86 21 4.8 7.9 1.9Human immunodeficiency virus [HIV] disease (B20-B24) 40 33 7 1.8 3.0 0.6Malaria (B50-B54) 0 0 0 0.0 0.0 0.0Other and unspecified infectious and parasitic diseases and their
sequelae 10 27 14 13 1.2 1.3 1.2Malignant neoplasms (C00-C97) 5,103 2,686 2,417 230.3 245.8 215.2Malignant neoplasms of lip, oral cavity and pharynx (C00-C14) 103 77 26 4.6 7.0 2.3Malignant neoplasm of oesophagus (C15) 137 110 27 6.2 10.1 2.4Malignant neoplasm of stomach (C16) 118 92 26 5.3 8.4 2.3Malignant neoplasms of colon, rectum and anus (C18-C21) 499 312 187 22.5 28.6 16.6Malignant neoplasm of liver and intrahepatic bile ducts (C22) 187 135 52 8.4 12.4 4.6Malignant neoplasm of pancreas (C25) 310 180 130 14.0 16.5 11.6Malignant neoplasm of larynx (C32) 42 33 9 1.9 3.0 0.8Malignant neoplasms of trachea, bronchus and lung (C33-C34) 1,465 796 669 66.1 72.9 59.6Malignant melanoma of skin (C43) 108 70 38 4.9 6.4 3.4Malignant neoplasm of breast (C50) 483 4 479 21.8 0.4 42.6Malignant neoplasm of cervix uteri (C53) ... ... 38 ... ... 3.4Malignant neoplasms of corpus uteri and uterus, part unspecified
(C54-C55) ... ... 68 ... ... 6.1Malignant neoplasm of ovary (C56) ... ... 157 ... ... 14.0Malignant neoplasm of prostate (C61) ... 72 ... ... 6.6 ...Malignant neoplasms of kidney and renal pelvis (C64-C65) 138 95 43 6.2 8.7 3.8Malignant neoplasm of bladder (C67) 74 54 20 3.3 4.9 1.8Malignant neoplasms of meninges, brain and other parts of
central nervous system (C70-C72) 184 118 66 8.3 10.8 5.9Malignant neoplasms of lymphoid, haematopoietic and
related tissue (C81-C96) 386 229 157 17.4 21.0 14.0Hodgkin’s disease (C81) 9 6 3 0.4 0.5 0.3Non-Hodgkin’s lymphoma (C82-C85) 165 101 64 7.4 9.2 5.7Leukaemia (C91-C95) 121 69 52 5.5 6.3 4.6Multiple myeloma and immunoproliferative neoplasms (C88, C90) 89 51 38 4.0 4.7 3.4Other and unspecified malignant neoplasms of lymphoid,
haematopoietic and related tissue (C96) 2 2 0 0.1 0.2 0.0All other and unspecified malignant neoplasms (C17, C23-C24,
C26-C31, C37-C41, C44-C49, C51-C52, C57-C60, C62-C63,C66, C68-C69, C73-C80, C97) 534 309 225 24.1 28.3 20.0
In situ neoplasms, benign neoplasms and neoplasms of uncertainor unknown behaviour (D00-D48) 52 26 26 2.3 2.4 2.3
Anaemias (D50-D64) 9 6 3 0.4 0.5 0.3Diabetes mellitus (E10-E14) 281 198 83 12.7 18.1 7.4Nutritional deficiencies (E40-E64) 8 4 4 0.4 0.4 0.4Malnutrition (E40-E46) 8 4 4 0.4 0.4 0.4Other nutritional deficiencies (E50-E64) 0 0 0 0.0 0.0 0.0Meningitis (G00, G03) 4 1 3 0.2 0.1 0.3Parkinson’s disease (G20-G21) 10 8 2 0.5 0.7 0.2Alzheimer’s disease (G30) 26 9 17 1.2 0.8 1.5Major cardiovascular diseases (I00-I78) 2,298 1,685 613 103.7 154.2 54.6Diseases of heart (I00-I09, I11, I13, I20-I51) 1,896 1,455 441 85.6 133.2 39.3
See notes at the end of the table.
90 Statistics Canada – Catalogue no. 84F0209X

Mortality, Summary List of Causes – 2009
Table 2-13 – continued
Deaths and mortality rate, by selected grouped causes, age group at time of death and sex, Canada1 —55 to 59 years2,3,4,5
Number of deaths Age-specific mortality rateper 100,000 population 6
Bothsexes
Males Females Bothsexes
Males Females
Acute rheumatic fever and chronic rheumatic heart diseases(I00-I09) 16 7 9 0.7 0.6 0.8
Hypertensive heart disease (I11) 29 21 8 1.3 1.9 0.7Hypertensive heart and renal disease (I13) 3 1 2 0.1 0.1 0.2Ischaemic heart diseases (I20-I25) 1,531 1,221 310 69.1 111.8 27.6Acute myocardial infarction (I21-I22) 703 565 138 31.7 51.7 12.3Other acute ischaemic heart diseases (I24) 39 29 10 1.8 2.7 0.9Other forms of chronic ischaemic heart disease (I20, I25) 789 627 162 35.6 57.4 14.4Atherosclerotic cardiovascular disease, so described (I25.0) 114 85 29 5.1 7.8 2.6All other forms of chronic ischaemic heart disease (I20,
I25.1-I25.9) 675 542 133 30.5 49.6 11.8Other heart diseases (I26-I51) 317 205 112 14.3 18.8 10.0Acute and subacute endocarditis (I33) 10 6 4 0.5 0.5 0.4Diseases of pericardium and acute myocarditis (I30-I31, I40) 5 3 2 0.2 0.3 0.2Heart failure (I50) 56 33 23 2.5 3.0 2.0All other forms of heart disease (I26-I28, I34-I38, I42-I49, I51) 246 163 83 11.1 14.9 7.4Essential hypertension and hypertensive renal disease (I10, I12,
I15) 26 15 11 1.2 1.4 1.0Cerebrovascular diseases (I60-I69) 289 153 136 13.0 14.0 12.1Atherosclerosis (I70) 16 10 6 0.7 0.9 0.5Other diseases of circulatory system (I71-I78) 71 52 19 3.2 4.8 1.7Aortic aneurysm and dissection (I71) 43 34 9 1.9 3.1 0.8Other diseases of arteries, arterioles and capillaries (I72-I78) 28 18 10 1.3 1.6 0.9Other disorders of circulatory system (I80-I99) 37 24 13 1.7 2.2 1.2Influenza and pneumonia (J09-J18) 158 91 67 7.1 8.3 6.0Influenza (J09-J11) 38 17 21 1.7 1.6 1.9Pneumonia (J12-J18) 120 74 46 5.4 6.8 4.1Other acute lower respiratory infections (J20-J22) 0 0 0 0.0 0.0 0.0Acute bronchitis and bronchiolitis (J20-J21) 0 0 0 0.0 0.0 0.0Unspecified acute lower respiratory infection (J22) 0 0 0 0.0 0.0 0.0Chronic lower respiratory diseases (J40-J47) 257 133 124 11.6 12.2 11.0Bronchitis, chronic and unspecified (J40-J42) 1 0 1 0.0 0.0 0.1Emphysema (J43) 33 21 12 1.5 1.9 1.1Asthma (J45-J46) 5 2 3 0.2 0.2 0.3Other chronic lower respiratory diseases (J44, J47) 218 110 108 9.8 10.1 9.6Pneumoconioses and chemical effects (J60-J66, J68) 1 1 0 0.0 0.1 0.0Pneumonitis due to solids and liquids (J69) 28 16 12 1.3 1.5 1.1Other diseases of respiratory system (J00-J06, J30-J39, J67,
J70-J98) 89 48 41 4.0 4.4 3.7Peptic ulcer (K25-K28) 23 15 8 1.0 1.4 0.7Diseases of appendix (K35-K38) 4 3 1 0.2 0.3 0.1Hernia (K40-K46) 9 4 5 0.4 0.4 0.4Chronic liver disease and cirrhosis (K70, K73-K74) 390 286 104 17.6 26.2 9.3Alcoholic liver disease (K70) 256 193 63 11.6 17.7 5.6Other chronic liver disease and cirrhosis (K73-K74) 134 93 41 6.0 8.5 3.7Cholelithiasis and other disorders of gallbladder (K80-K82) 10 7 3 0.5 0.6 0.3Nephritis, nephrotic syndrome and nephrosis (N00-N07,
N17-N19, N25-N27) 58 36 22 2.6 3.3 2.0Acute and rapidly progressive nephritic and nephrotic syndrome
(N00-N01, N04) 0 0 0 0.0 0.0 0.0Chronic glomerulonephritis, nephritis and nephropathy not
specified as acute or chronic, and renal sclerosis unspecified(N02-N03, N05-N07, N26) 3 1 2 0.1 0.1 0.2
Renal failure (N17-N19) 55 35 20 2.5 3.2 1.8Other disorders of kidney (N25, N27) 0 0 0 0.0 0.0 0.0Infections of kidney (N10-N12, N13.6, N15.1) 1 0 1 0.0 0.0 0.1Hyperplasia of prostate (N40) ... 1 ... ... 0.1 ...Inflammatory diseases of female pelvic organs (N70-N76) ... ... 0 ... ... 0.0Pregnancy, childbirth and the puerperium (O00-O99) ... ... 0 ... ... 0.0Pregnancy with abortive outcome (O00-O07) ... ... 0 ... ... 0.0Other complications of pregnancy, childbirth and the puerperium
(O10-O99) ... ... 0 ... ... 0.0Certain conditions originating in the perinatal period (P00-P96) 0 0 0 0.0 0.0 0.0Congenital malformations, deformations and chromosomal
abnormalities (Q00-Q99) 51 29 22 2.3 2.7 2.0
See notes at the end of the table.
Statistics Canada – Catalogue no. 84F0209X 91

Mortality, Summary List of Causes – 2009
Table 2-13 – continued
Deaths and mortality rate, by selected grouped causes, age group at time of death and sex, Canada1 —55 to 59 years2,3,4,5
Number of deaths Age-specific mortality rateper 100,000 population 6
Bothsexes
Males Females Bothsexes
Males Females
Symptoms, signs and abnormal clinical and laboratory findings,not elsewhere classified (R00-R99) 105 70 35 4.7 6.4 3.1
All other diseases (residual) 11 886 527 359 40.0 48.2 32.0Accidents (unintentional injuries) (V01-X59, Y85-Y86) 530 371 159 23.9 34.0 14.2Transport accidents (V01-V99, Y85) 189 140 49 8.5 12.8 4.4Motor vehicle accidents 12 160 115 45 7.2 10.5 4.0Other land transport accidents 13 5 4 1 0.2 0.4 0.1Water, air and space, and other and unspecified transport
accidents and their sequelae (V90-V99, Y85) 24 21 3 1.1 1.9 0.3Nontransport accidents (W00-X59, Y86) 341 231 110 15.4 21.1 9.8Falls (W00-W19) 90 62 28 4.1 5.7 2.5Accidental discharge of firearms (W32-W34) 2 2 0 0.1 0.2 0.0Accidental drowning and submersion (W65-W74) 23 19 4 1.0 1.7 0.4Accidental exposure to smoke, fire and flames (X00-X09) 24 16 8 1.1 1.5 0.7Accidental poisoning and exposure to noxious substances
(X40-X49) 131 78 53 5.9 7.1 4.7Other and unspecified nontransport accidents and their sequelae
(W20-W31, W35-W64, W75-W99, X10-X39, X50-X59, Y86) 71 54 17 3.2 4.9 1.5Intentional self-harm (suicide) (X60-X84, Y87.0) 371 284 87 16.7 26.0 7.7Intentional self-harm (suicide) by discharge of firearms (X72-X74) 60 57 3 2.7 5.2 0.3Intentional self-harm (suicide) by other and unspecified means
and their sequelae (X60-X71, X75-X84, Y87.0) 311 227 84 14.0 20.8 7.5Assault (homicide) (X85-Y09, Y87.1) 30 20 10 1.4 1.8 0.9Assault (homicide) by discharge of firearms (X93-X95) 4 2 2 0.2 0.2 0.2Assault (homicide) by other and unspecified means and their
sequelae (X85-X92, X96-Y09, Y87.1) 26 18 8 1.2 1.6 0.7Legal intervention (Y35, Y89.0) 1 1 0 0.0 0.1 0.0Events of undetermined intent (Y10-Y34, Y87.2, Y89.9) 66 36 30 3.0 3.3 2.7Discharge of firearms, undetermined intent (Y22-Y24) 2 2 0 0.1 0.2 0.0Other and unspecified events of undetermined intent and their
sequelae (Y10-Y21, Y25-Y34, Y87.2, Y89.9) 64 34 30 2.9 3.1 2.7Operations of war and their sequelae (Y36, Y89.1) 0 0 0 0.0 0.0 0.0Complications of medical and surgical care (Y40-Y84, Y88) 11 5 6 0.5 0.5 0.5
1. The number of deaths in this table is based on the deceased’s usual place of residence.2. Age attained at the last birthday preceding death.3. For "Age at time of death, under 1 year", the mortality rate is based on live births in the calendar year.4. For "Age at time of death, 1 to 4 years", the mortality rate is based on population estimates for 0 to 4 year olds less live births in the calendar year.5. For "Age at time of death", each age group except "All ages", the mortality rate represents the age-specific death rate or the number of deaths in a particular age
group during a given year per 100,000 population in the same age group as of July 1 of the same year.6. Starting in 2005, the population estimates used to calculate the mortality rate are presented in the Appendix II of the publication "Mortality Summary List of
Causes" (catalogue number 84F0209XIE).7. The cause of death tabulated is the underlying cause of death. This is defined as (a) the disease or injury which initiated the train of events leading directly to
death, or (b) the circumstances of the accident or violence which produced the fatal injury. The underlying cause is selected from the conditions listed onthe medical certificate of cause of death.
8. World Health Organization (WHO), International Statistical Classification of Diseases and Related Health Problems, Tenth Revision (ICD-10)9. National Center for Health Statistics, United States. "B" list in "Instruction Manual; Part 9; ICD-10 Cause-of-Death Lists for Tabulating Mortality Statistics".10. Other and unspecified infectious and parasitic diseases, and their sequelae A00, A05, A20 to A36, A42 to A44, A48 to A49, A54 to A79, A81 to A82,
A85.0 to A85.1, A85.8, A86 to B04, B06 to B09, B25 to B49, B55 to B99.11. All other diseases (residual) D65 to E07, E15 to E34, E65 to F99, G04 to G12, G23 to G25, G31 to H93, K00 to K22, K29 to K31, K50 to K66, K71 to K72, K75 to
K76, K83 to M99, N13.0 to N13.5, N13.7 to N13.9, N14, N15.0, N15.8 to N15.9, N20 to N23, N28 to N39, N41 to N64, N80 to N98. As of 2003, also includes U04.12. Motor vehicle accidents V02 to V04, V09.0, V09.2, V12 to V14, V19.0 to V19.2, V19.4 to V19.6, V20 to V79, V80.3 to V80.5, V81.0 to V81.1, V82.0 to V82.1,
V83 to V86, V87.0 to V87.8, V88.0 to V88.8, V89.0, V89.2.13. Other land transport accidents V01, V05 to V06, V09.1, V09.3 to V09.9, V10 to V11, V15 to V18, V19.3, V19.8 to V19.9, V80.0 to V80.2, V80.6 to V80.9,
V81.2 to V81.9, V82.2 to V82.9, V87.9, V88.9, V89.1, V89.3, V89.9.Note(s): See Data quality, concepts and methodology — Explanatory notes for the tables section.Source(s): Statistics Canada, Canadian Vital Statistics, Birth and Death Databases (CANSIM table 102-0551) and Appendix II.
92 Statistics Canada – Catalogue no. 84F0209X

Mortality, Summary List of Causes – 2009
Table 2-14Deaths and mortality rate, by selected grouped causes, age group at time of death and sex, Canada1 —60 to 64 years2,3,4,5
Number of deaths Age-specific mortality rateper 100,000 population 6
Bothsexes
Males Females Bothsexes
Males Females
Total, all causes of death (A00-Y89) 7 , 8 , 9 14,781 8,862 5,919 783.0 957.0 615.4
Salmonella infections (A01-A02) 2 0 2 0.1 0.0 0.2Shigellosis and amoebiasis (A03, A06) 0 0 0 0.0 0.0 0.0Certain other intestinal infections (A04, A07-A09) 38 17 21 2.0 1.8 2.2Tuberculosis (A16-A19) 3 3 0 0.2 0.3 0.0Respiratory tuberculosis (A16) 1 1 0 0.1 0.1 0.0Other tuberculosis (A17-A19) 2 2 0 0.1 0.2 0.0Whooping cough (A37) 0 0 0 0.0 0.0 0.0Scarlet fever and erysipelas (A38, A46) 0 0 0 0.0 0.0 0.0Meningococcal infection (A39) 1 0 1 0.1 0.0 0.1Septicaemia (A40-A41) 116 65 51 6.1 7.0 5.3Syphilis (A50-A53) 0 0 0 0.0 0.0 0.0Acute poliomyelitis (A80) 0 0 0 0.0 0.0 0.0Arthropod-borne viral encephalitis (A83-A84, A85.2) 0 0 0 0.0 0.0 0.0Measles (B05) 0 0 0 0.0 0.0 0.0Viral hepatitis (B15-B19) 63 45 18 3.3 4.9 1.9Human immunodeficiency virus [HIV] disease (B20-B24) 27 24 3 1.4 2.6 0.3Malaria (B50-B54) 0 0 0 0.0 0.0 0.0Other and unspecified infectious and parasitic diseases and
their sequelae 10 48 24 24 2.5 2.6 2.5Malignant neoplasms (C00-C97) 7,020 3,808 3,212 371.9 411.2 334.0Malignant neoplasms of lip, oral cavity and pharynx (C00-C14) 154 124 30 8.2 13.4 3.1Malignant neoplasm of oesophagus (C15) 225 186 39 11.9 20.1 4.1Malignant neoplasm of stomach (C16) 179 125 54 9.5 13.5 5.6Malignant neoplasms of colon, rectum and anus (C18-C21) 698 441 257 37.0 47.6 26.7Malignant neoplasm of liver and intrahepatic bile ducts (C22) 198 140 58 10.5 15.1 6.0Malignant neoplasm of pancreas (C25) 381 206 175 20.2 22.2 18.2Malignant neoplasm of larynx (C32) 49 40 9 2.6 4.3 0.9Malignant neoplasms of trachea, bronchus and lung (C33-C34) 2,231 1,259 972 118.2 136.0 101.1Malignant melanoma of skin (C43) 96 59 37 5.1 6.4 3.8Malignant neoplasm of breast (C50) 509 5 504 27.0 0.5 52.4Malignant neoplasm of cervix uteri (C53) ... ... 39 ... ... 4.1Malignant neoplasms of corpus uteri and uterus, part
unspecified (C54-C55) ... ... 106 ... ... 11.0Malignant neoplasm of ovary (C56) ... ... 174 ... ... 18.1Malignant neoplasm of prostate (C61) ... 165 ... ... 17.8 ...Malignant neoplasms of kidney and renal pelvis (C64-C65) 173 127 46 9.2 13.7 4.8Malignant neoplasm of bladder (C67) 127 91 36 6.7 9.8 3.7Malignant neoplasms of meninges, brain and other parts of
central nervous system (C70-C72) 238 136 102 12.6 14.7 10.6Malignant neoplasms of lymphoid, haematopoietic and
related tissue (C81-C96) 568 330 238 30.1 35.6 24.7Hodgkin’s disease (C81) 9 4 5 0.5 0.4 0.5Non-Hodgkin’s lymphoma (C82-C85) 221 131 90 11.7 14.1 9.4Leukaemia (C91-C95) 197 119 78 10.4 12.9 8.1Multiple myeloma and immunoproliferative neoplasms (C88,
C90) 139 75 64 7.4 8.1 6.7Other and unspecified malignant neoplasms of lymphoid,
haematopoietic and related tissue (C96) 2 1 1 0.1 0.1 0.1All other and unspecified malignant neoplasms (C17, C23-C24,
C26-C31, C37-C41, C44-C49, C51-C52, C57-C60,C62-C63, C66, C68-C69, C73-C80, C97) 710 374 336 37.6 40.4 34.9
In situ neoplasms, benign neoplasms and neoplasms ofuncertain or unknown behaviour (D00-D48) 74 32 42 3.9 3.5 4.4
Anaemias (D50-D64) 13 7 6 0.7 0.8 0.6Diabetes mellitus (E10-E14) 492 314 178 26.1 33.9 18.5Nutritional deficiencies (E40-E64) 7 3 4 0.4 0.3 0.4Malnutrition (E40-E46) 5 2 3 0.3 0.2 0.3Other nutritional deficiencies (E50-E64) 2 1 1 0.1 0.1 0.1Meningitis (G00, G03) 6 3 3 0.3 0.3 0.3Parkinson’s disease (G20-G21) 26 13 13 1.4 1.4 1.4Alzheimer’s disease (G30) 52 24 28 2.8 2.6 2.9Major cardiovascular diseases (I00-I78) 3,277 2,364 913 173.6 255.3 94.9Diseases of heart (I00-I09, I11, I13, I20-I51) 2,652 1,972 680 140.5 213.0 70.7
See notes at the end of the table.
Statistics Canada – Catalogue no. 84F0209X 93

Mortality, Summary List of Causes – 2009
Table 2-14 – continued
Deaths and mortality rate, by selected grouped causes, age group at time of death and sex, Canada1 —60 to 64 years2,3,4,5
Number of deaths Age-specific mortality rateper 100,000 population 6
Bothsexes
Males Females Bothsexes
Males Females
Acute rheumatic fever and chronic rheumatic heart diseases(I00-I09) 24 10 14 1.3 1.1 1.5
Hypertensive heart disease (I11) 37 24 13 2.0 2.6 1.4Hypertensive heart and renal disease (I13) 3 2 1 0.2 0.2 0.1Ischaemic heart diseases (I20-I25) 2,109 1,620 489 111.7 174.9 50.8Acute myocardial infarction (I21-I22) 986 758 228 52.2 81.9 23.7Other acute ischaemic heart diseases (I24) 58 36 22 3.1 3.9 2.3Other forms of chronic ischaemic heart disease (I20, I25) 1,065 826 239 56.4 89.2 24.8Atherosclerotic cardiovascular disease, so described (I25.0) 158 130 28 8.4 14.0 2.9All other forms of chronic ischaemic heart disease (I20,
I25.1-I25.9) 907 696 211 48.0 75.2 21.9Other heart diseases (I26-I51) 479 316 163 25.4 34.1 16.9Acute and subacute endocarditis (I33) 11 7 4 0.6 0.8 0.4Diseases of pericardium and acute myocarditis (I30-I31, I40) 5 1 4 0.3 0.1 0.4Heart failure (I50) 74 49 25 3.9 5.3 2.6All other forms of heart disease (I26-I28, I34-I38, I42-I49, I51) 389 259 130 20.6 28.0 13.5Essential hypertension and hypertensive renal disease (I10,
I12, I15) 40 28 12 2.1 3.0 1.2Cerebrovascular diseases (I60-I69) 447 260 187 23.7 28.1 19.4Atherosclerosis (I70) 22 16 6 1.2 1.7 0.6Other diseases of circulatory system (I71-I78) 116 88 28 6.1 9.5 2.9Aortic aneurysm and dissection (I71) 83 67 16 4.4 7.2 1.7Other diseases of arteries, arterioles and capillaries (I72-I78) 33 21 12 1.7 2.3 1.2Other disorders of circulatory system (I80-I99) 23 11 12 1.2 1.2 1.2Influenza and pneumonia (J09-J18) 191 113 78 10.1 12.2 8.1Influenza (J09-J11) 33 15 18 1.7 1.6 1.9Pneumonia (J12-J18) 158 98 60 8.4 10.6 6.2Other acute lower respiratory infections (J20-J22) 1 0 1 0.1 0.0 0.1Acute bronchitis and bronchiolitis (J20-J21) 0 0 0 0.0 0.0 0.0Unspecified acute lower respiratory infection (J22) 1 0 1 0.1 0.0 0.1Chronic lower respiratory diseases (J40-J47) 471 233 238 25.0 25.2 24.7Bronchitis, chronic and unspecified (J40-J42) 4 2 2 0.2 0.2 0.2Emphysema (J43) 51 30 21 2.7 3.2 2.2Asthma (J45-J46) 11 4 7 0.6 0.4 0.7Other chronic lower respiratory diseases (J44, J47) 405 197 208 21.5 21.3 21.6Pneumoconioses and chemical effects (J60-J66, J68) 3 3 0 0.2 0.3 0.0Pneumonitis due to solids and liquids (J69) 46 27 19 2.4 2.9 2.0Other diseases of respiratory system (J00-J06, J30-J39, J67,
J70-J98) 137 83 54 7.3 9.0 5.6Peptic ulcer (K25-K28) 25 17 8 1.3 1.8 0.8Diseases of appendix (K35-K38) 6 3 3 0.3 0.3 0.3Hernia (K40-K46) 10 5 5 0.5 0.5 0.5Chronic liver disease and cirrhosis (K70, K73-K74) 382 267 115 20.2 28.8 12.0Alcoholic liver disease (K70) 226 168 58 12.0 18.1 6.0Other chronic liver disease and cirrhosis (K73-K74) 156 99 57 8.3 10.7 5.9Cholelithiasis and other disorders of gallbladder (K80-K82) 27 15 12 1.4 1.6 1.2Nephritis, nephrotic syndrome and nephrosis (N00-N07,
N17-N19, N25-N27) 146 84 62 7.7 9.1 6.4Acute and rapidly progressive nephritic and nephrotic syndrome
(N00-N01, N04) 1 1 0 0.1 0.1 0.0Chronic glomerulonephritis, nephritis and nephropathy
not specified as acute or chronic, and renal sclerosisunspecified (N02-N03, N05-N07, N26) 5 0 5 0.3 0.0 0.5
Renal failure (N17-N19) 138 83 55 7.3 9.0 5.7Other disorders of kidney (N25, N27) 2 0 2 0.1 0.0 0.2Infections of kidney (N10-N12, N13.6, N15.1) 4 2 2 0.2 0.2 0.2Hyperplasia of prostate (N40) ... 0 ... ... 0.0 ...Inflammatory diseases of female pelvic organs (N70-N76) ... ... 0 ... ... 0.0Pregnancy, childbirth and the puerperium (O00-O99) ... ... 0 ... ... 0.0Pregnancy with abortive outcome (O00-O07) ... ... 0 ... ... 0.0Other complications of pregnancy, childbirth and the puerperium
(O10-O99) ... ... 0 ... ... 0.0Certain conditions originating in the perinatal period (P00-P96) 0 0 0 0.0 0.0 0.0Congenital malformations, deformations and chromosomal
abnormalities (Q00-Q99) 34 11 23 1.8 1.2 2.4
See notes at the end of the table.
94 Statistics Canada – Catalogue no. 84F0209X

Mortality, Summary List of Causes – 2009
Table 2-14 – continued
Deaths and mortality rate, by selected grouped causes, age group at time of death and sex, Canada1 —60 to 64 years2,3,4,5
Number of deaths Age-specific mortality rateper 100,000 population 6
Bothsexes
Males Females Bothsexes
Males Females
Symptoms, signs and abnormal clinical and laboratory findings,not elsewhere classified (R00-R99) 91 60 31 4.8 6.5 3.2
All other diseases (residual) 11 1,150 643 507 60.9 69.4 52.7Accidents (unintentional injuries) (V01-X59, Y85-Y86) 459 328 131 24.3 35.4 13.6Transport accidents (V01-V99, Y85) 142 109 33 7.5 11.8 3.4Motor vehicle accidents 12 118 88 30 6.3 9.5 3.1Other land transport accidents 13 7 7 0 0.4 0.8 0.0Water, air and space, and other and unspecified transport
accidents and their sequelae (V90-V99, Y85) 17 14 3 0.9 1.5 0.3Nontransport accidents (W00-X59, Y86) 317 219 98 16.8 23.7 10.2Falls (W00-W19) 116 83 33 6.1 9.0 3.4Accidental discharge of firearms (W32-W34) 0 0 0 0.0 0.0 0.0Accidental drowning and submersion (W65-W74) 12 10 2 0.6 1.1 0.2Accidental exposure to smoke, fire and flames (X00-X09) 16 9 7 0.8 1.0 0.7Accidental poisoning and exposure to noxious substances
(X40-X49) 74 45 29 3.9 4.9 3.0Other and unspecified nontransport accidents and their
sequelae (W20-W31, W35-W64, W75-W99, X10-X39,X50-X59, Y86) 99 72 27 5.2 7.8 2.8
Intentional self-harm (suicide) (X60-X84, Y87.0) 241 180 61 12.8 19.4 6.3Intentional self-harm (suicide) by discharge of firearms
(X72-X74) 40 40 0 2.1 4.3 0.0Intentional self-harm (suicide) by other and unspecified means
and their sequelae (X60-X71, X75-X84, Y87.0) 201 140 61 10.6 15.1 6.3Assault (homicide) (X85-Y09, Y87.1) 20 11 9 1.1 1.2 0.9Assault (homicide) by discharge of firearms (X93-X95) 4 1 3 0.2 0.1 0.3Assault (homicide) by other and unspecified means and their
sequelae (X85-X92, X96-Y09, Y87.1) 16 10 6 0.8 1.1 0.6Legal intervention (Y35, Y89.0) 0 0 0 0.0 0.0 0.0Events of undetermined intent (Y10-Y34, Y87.2, Y89.9) 37 16 21 2.0 1.7 2.2Discharge of firearms, undetermined intent (Y22-Y24) 1 1 0 0.1 0.1 0.0Other and unspecified events of undetermined intent and their
sequelae (Y10-Y21, Y25-Y34, Y87.2, Y89.9) 36 15 21 1.9 1.6 2.2Operations of war and their sequelae (Y36, Y89.1) 0 0 0 0.0 0.0 0.0Complications of medical and surgical care (Y40-Y84, Y88) 12 4 8 0.6 0.4 0.8
1. The number of deaths in this table is based on the deceased’s usual place of residence.2. Age attained at the last birthday preceding death.3. For "Age at time of death, under 1 year", the mortality rate is based on live births in the calendar year.4. For "Age at time of death, 1 to 4 years", the mortality rate is based on population estimates for 0 to 4 year olds less live births in the calendar year.5. For "Age at time of death", each age group except "All ages", the mortality rate represents the age-specific death rate or the number of deaths in a particular age
group during a given year per 100,000 population in the same age group as of July 1 of the same year.6. Starting in 2005, the population estimates used to calculate the mortality rate are presented in the Appendix II of the publication "Mortality Summary List of
Causes" (catalogue number 84F0209XIE).7. The cause of death tabulated is the underlying cause of death. This is defined as (a) the disease or injury which initiated the train of events leading directly to
death, or (b) the circumstances of the accident or violence which produced the fatal injury. The underlying cause is selected from the conditions listed onthe medical certificate of cause of death.
8. World Health Organization (WHO), International Statistical Classification of Diseases and Related Health Problems, Tenth Revision (ICD-10)9. National Center for Health Statistics, United States. "B" list in "Instruction Manual; Part 9; ICD-10 Cause-of-Death Lists for Tabulating Mortality Statistics".10. Other and unspecified infectious and parasitic diseases, and their sequelae A00, A05, A20 to A36, A42 to A44, A48 to A49, A54 to A79, A81 to A82,
A85.0 to A85.1, A85.8, A86 to B04, B06 to B09, B25 to B49, B55 to B99.11. All other diseases (residual) D65 to E07, E15 to E34, E65 to F99, G04 to G12, G23 to G25, G31 to H93, K00 to K22, K29 to K31, K50 to K66, K71 to K72, K75 to
K76, K83 to M99, N13.0 to N13.5, N13.7 to N13.9, N14, N15.0, N15.8 to N15.9, N20 to N23, N28 to N39, N41 to N64, N80 to N98. As of 2003, also includes U04.12. Motor vehicle accidents V02 to V04, V09.0, V09.2, V12 to V14, V19.0 to V19.2, V19.4 to V19.6, V20 to V79, V80.3 to V80.5, V81.0 to V81.1, V82.0 to V82.1,
V83 to V86, V87.0 to V87.8, V88.0 to V88.8, V89.0, V89.2.13. Other land transport accidents V01, V05 to V06, V09.1, V09.3 to V09.9, V10 to V11, V15 to V18, V19.3, V19.8 to V19.9, V80.0 to V80.2, V80.6 to V80.9,
V81.2 to V81.9, V82.2 to V82.9, V87.9, V88.9, V89.1, V89.3, V89.9.Note(s): See Data quality, concepts and methodology — Explanatory notes for the tables section.Source(s): Statistics Canada, Canadian Vital Statistics, Birth and Death Databases (CANSIM table 102-0551) and Appendix II.
Statistics Canada – Catalogue no. 84F0209X 95
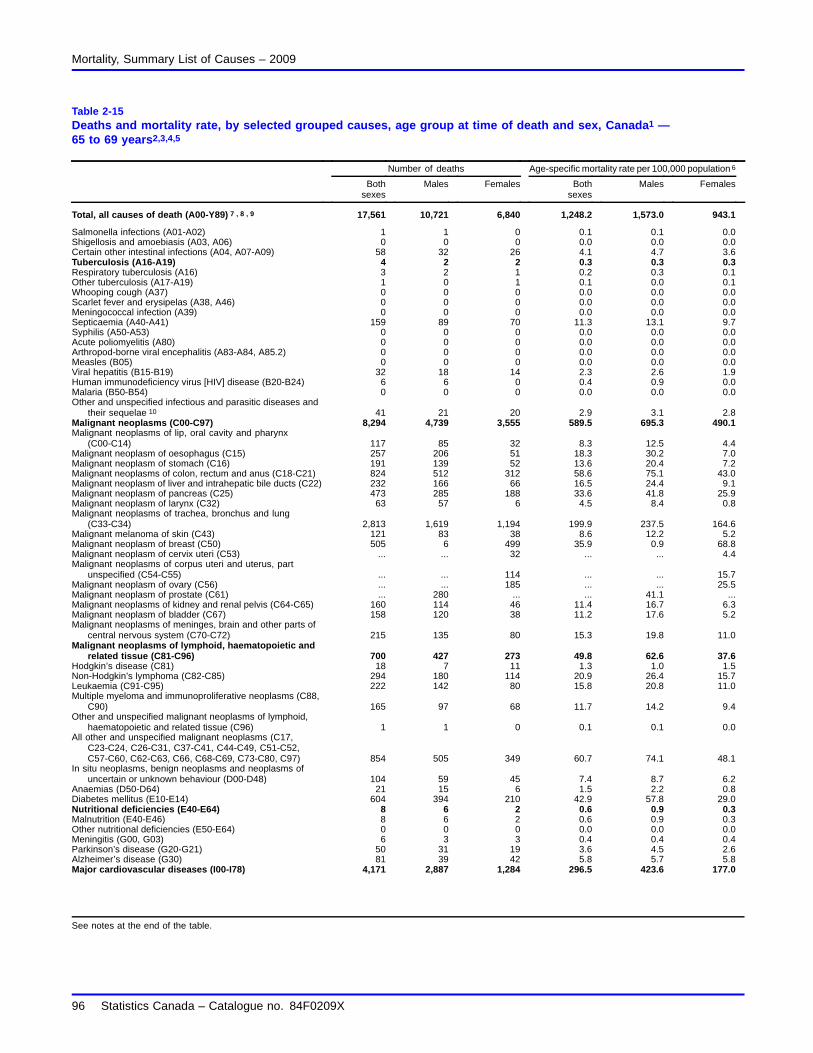
Mortality, Summary List of Causes – 2009
Table 2-15Deaths and mortality rate, by selected grouped causes, age group at time of death and sex, Canada1 —65 to 69 years2,3,4,5
Number of deaths Age-specific mortality rate per 100,000 population 6
Bothsexes
Males Females Bothsexes
Males Females
Total, all causes of death (A00-Y89) 7 , 8 , 9 17,561 10,721 6,840 1,248.2 1,573.0 943.1
Salmonella infections (A01-A02) 1 1 0 0.1 0.1 0.0Shigellosis and amoebiasis (A03, A06) 0 0 0 0.0 0.0 0.0Certain other intestinal infections (A04, A07-A09) 58 32 26 4.1 4.7 3.6Tuberculosis (A16-A19) 4 2 2 0.3 0.3 0.3Respiratory tuberculosis (A16) 3 2 1 0.2 0.3 0.1Other tuberculosis (A17-A19) 1 0 1 0.1 0.0 0.1Whooping cough (A37) 0 0 0 0.0 0.0 0.0Scarlet fever and erysipelas (A38, A46) 0 0 0 0.0 0.0 0.0Meningococcal infection (A39) 0 0 0 0.0 0.0 0.0Septicaemia (A40-A41) 159 89 70 11.3 13.1 9.7Syphilis (A50-A53) 0 0 0 0.0 0.0 0.0Acute poliomyelitis (A80) 0 0 0 0.0 0.0 0.0Arthropod-borne viral encephalitis (A83-A84, A85.2) 0 0 0 0.0 0.0 0.0Measles (B05) 0 0 0 0.0 0.0 0.0Viral hepatitis (B15-B19) 32 18 14 2.3 2.6 1.9Human immunodeficiency virus [HIV] disease (B20-B24) 6 6 0 0.4 0.9 0.0Malaria (B50-B54) 0 0 0 0.0 0.0 0.0Other and unspecified infectious and parasitic diseases and
their sequelae 10 41 21 20 2.9 3.1 2.8Malignant neoplasms (C00-C97) 8,294 4,739 3,555 589.5 695.3 490.1Malignant neoplasms of lip, oral cavity and pharynx
(C00-C14) 117 85 32 8.3 12.5 4.4Malignant neoplasm of oesophagus (C15) 257 206 51 18.3 30.2 7.0Malignant neoplasm of stomach (C16) 191 139 52 13.6 20.4 7.2Malignant neoplasms of colon, rectum and anus (C18-C21) 824 512 312 58.6 75.1 43.0Malignant neoplasm of liver and intrahepatic bile ducts (C22) 232 166 66 16.5 24.4 9.1Malignant neoplasm of pancreas (C25) 473 285 188 33.6 41.8 25.9Malignant neoplasm of larynx (C32) 63 57 6 4.5 8.4 0.8Malignant neoplasms of trachea, bronchus and lung
(C33-C34) 2,813 1,619 1,194 199.9 237.5 164.6Malignant melanoma of skin (C43) 121 83 38 8.6 12.2 5.2Malignant neoplasm of breast (C50) 505 6 499 35.9 0.9 68.8Malignant neoplasm of cervix uteri (C53) ... ... 32 ... ... 4.4Malignant neoplasms of corpus uteri and uterus, part
unspecified (C54-C55) ... ... 114 ... ... 15.7Malignant neoplasm of ovary (C56) ... ... 185 ... ... 25.5Malignant neoplasm of prostate (C61) ... 280 ... ... 41.1 ...Malignant neoplasms of kidney and renal pelvis (C64-C65) 160 114 46 11.4 16.7 6.3Malignant neoplasm of bladder (C67) 158 120 38 11.2 17.6 5.2Malignant neoplasms of meninges, brain and other parts of
central nervous system (C70-C72) 215 135 80 15.3 19.8 11.0Malignant neoplasms of lymphoid, haematopoietic and
related tissue (C81-C96) 700 427 273 49.8 62.6 37.6Hodgkin’s disease (C81) 18 7 11 1.3 1.0 1.5Non-Hodgkin’s lymphoma (C82-C85) 294 180 114 20.9 26.4 15.7Leukaemia (C91-C95) 222 142 80 15.8 20.8 11.0Multiple myeloma and immunoproliferative neoplasms (C88,
C90) 165 97 68 11.7 14.2 9.4Other and unspecified malignant neoplasms of lymphoid,
haematopoietic and related tissue (C96) 1 1 0 0.1 0.1 0.0All other and unspecified malignant neoplasms (C17,
C23-C24, C26-C31, C37-C41, C44-C49, C51-C52,C57-C60, C62-C63, C66, C68-C69, C73-C80, C97) 854 505 349 60.7 74.1 48.1
In situ neoplasms, benign neoplasms and neoplasms ofuncertain or unknown behaviour (D00-D48) 104 59 45 7.4 8.7 6.2
Anaemias (D50-D64) 21 15 6 1.5 2.2 0.8Diabetes mellitus (E10-E14) 604 394 210 42.9 57.8 29.0Nutritional deficiencies (E40-E64) 8 6 2 0.6 0.9 0.3Malnutrition (E40-E46) 8 6 2 0.6 0.9 0.3Other nutritional deficiencies (E50-E64) 0 0 0 0.0 0.0 0.0Meningitis (G00, G03) 6 3 3 0.4 0.4 0.4Parkinson’s disease (G20-G21) 50 31 19 3.6 4.5 2.6Alzheimer’s disease (G30) 81 39 42 5.8 5.7 5.8Major cardiovascular diseases (I00-I78) 4,171 2,887 1,284 296.5 423.6 177.0
See notes at the end of the table.
96 Statistics Canada – Catalogue no. 84F0209X

Mortality, Summary List of Causes – 2009
Table 2-15 – continued
Deaths and mortality rate, by selected grouped causes, age group at time of death and sex, Canada1 —65 to 69 years2,3,4,5
Number of deaths Age-specific mortality rate per 100,000 population 6
Bothsexes
Males Females Bothsexes
Males Females
Diseases of heart (I00-I09, I11, I13, I20-I51) 3,248 2,329 919 230.9 341.7 126.7Acute rheumatic fever and chronic rheumatic heart diseases
(I00-I09) 35 9 26 2.5 1.3 3.6Hypertensive heart disease (I11) 37 23 14 2.6 3.4 1.9Hypertensive heart and renal disease (I13) 3 1 2 0.2 0.1 0.3Ischaemic heart diseases (I20-I25) 2,574 1,911 663 183.0 280.4 91.4Acute myocardial infarction (I21-I22) 1,186 877 309 84.3 128.7 42.6Other acute ischaemic heart diseases (I24) 79 55 24 5.6 8.1 3.3Other forms of chronic ischaemic heart disease (I20, I25) 1,309 979 330 93.0 143.6 45.5Atherosclerotic cardiovascular disease, so described (I25.0) 163 126 37 11.6 18.5 5.1All other forms of chronic ischaemic heart disease (I20,
I25.1-I25.9) 1,146 853 293 81.5 125.2 40.4Other heart diseases (I26-I51) 599 385 214 42.6 56.5 29.5Acute and subacute endocarditis (I33) 10 7 3 0.7 1.0 0.4Diseases of pericardium and acute myocarditis (I30-I31, I40) 6 3 3 0.4 0.4 0.4Heart failure (I50) 143 87 56 10.2 12.8 7.7All other forms of heart disease (I26-I28, I34-I38, I42-I49, I51) 440 288 152 31.3 42.3 21.0Essential hypertension and hypertensive renal disease (I10,
I12, I15) 64 42 22 4.5 6.2 3.0Cerebrovascular diseases (I60-I69) 656 374 282 46.6 54.9 38.9Atherosclerosis (I70) 27 19 8 1.9 2.8 1.1Other diseases of circulatory system (I71-I78) 176 123 53 12.5 18.0 7.3Aortic aneurysm and dissection (I71) 115 91 24 8.2 13.4 3.3Other diseases of arteries, arterioles and capillaries (I72-I78) 61 32 29 4.3 4.7 4.0Other disorders of circulatory system (I80-I99) 34 21 13 2.4 3.1 1.8Influenza and pneumonia (J09-J18) 191 105 86 13.6 15.4 11.9Influenza (J09-J11) 28 13 15 2.0 1.9 2.1Pneumonia (J12-J18) 163 92 71 11.6 13.5 9.8Other acute lower respiratory infections (J20-J22) 2 1 1 0.1 0.1 0.1Acute bronchitis and bronchiolitis (J20-J21) 1 1 0 0.1 0.1 0.0Unspecified acute lower respiratory infection (J22) 1 0 1 0.1 0.0 0.1Chronic lower respiratory diseases (J40-J47) 821 462 359 58.4 67.8 49.5Bronchitis, chronic and unspecified (J40-J42) 8 3 5 0.6 0.4 0.7Emphysema (J43) 70 43 27 5.0 6.3 3.7Asthma (J45-J46) 13 5 8 0.9 0.7 1.1Other chronic lower respiratory diseases (J44, J47) 730 411 319 51.9 60.3 44.0Pneumoconioses and chemical effects (J60-J66, J68) 7 7 0 0.5 1.0 0.0Pneumonitis due to solids and liquids (J69) 62 32 30 4.4 4.7 4.1Other diseases of respiratory system (J00-J06, J30-J39, J67,
J70-J98) 213 151 62 15.1 22.2 8.5Peptic ulcer (K25-K28) 31 17 14 2.2 2.5 1.9Diseases of appendix (K35-K38) 6 3 3 0.4 0.4 0.4Hernia (K40-K46) 17 9 8 1.2 1.3 1.1Chronic liver disease and cirrhosis (K70, K73-K74) 341 248 93 24.2 36.4 12.8Alcoholic liver disease (K70) 183 149 34 13.0 21.9 4.7Other chronic liver disease and cirrhosis (K73-K74) 158 99 59 11.2 14.5 8.1Cholelithiasis and other disorders of gallbladder (K80-K82) 20 12 8 1.4 1.8 1.1Nephritis, nephrotic syndrome and nephrosis (N00-N07,
N17-N19, N25-N27) 165 98 67 11.7 14.4 9.2Acute and rapidly progressive nephritic and nephrotic
syndrome (N00-N01, N04) 0 0 0 0.0 0.0 0.0Chronic glomerulonephritis, nephritis and nephropathy
not specified as acute or chronic, and renal sclerosisunspecified (N02-N03, N05-N07, N26) 14 11 3 1.0 1.6 0.4
Renal failure (N17-N19) 151 87 64 10.7 12.8 8.8Other disorders of kidney (N25, N27) 0 0 0 0.0 0.0 0.0Infections of kidney (N10-N12, N13.6, N15.1) 5 3 2 0.4 0.4 0.3Hyperplasia of prostate (N40) ... 3 ... ... 0.4 ...Inflammatory diseases of female pelvic organs (N70-N76) ... ... 2 ... ... 0.3Pregnancy, childbirth and the puerperium (O00-O99) ... ... 0 ... ... 0.0Pregnancy with abortive outcome (O00-O07) ... ... 0 ... ... 0.0Other complications of pregnancy, childbirth and the
puerperium (O10-O99) ... ... 0 ... ... 0.0Certain conditions originating in the perinatal period
(P00-P96) 0 0 0 0.0 0.0 0.0
See notes at the end of the table.
Statistics Canada – Catalogue no. 84F0209X 97

Mortality, Summary List of Causes – 2009
Table 2-15 – continued
Deaths and mortality rate, by selected grouped causes, age group at time of death and sex, Canada1 —65 to 69 years2,3,4,5
Number of deaths Age-specific mortality rate per 100,000 population 6
Bothsexes
Males Females Bothsexes
Males Females
Congenital malformations, deformations and chromosomalabnormalities (Q00-Q99) 21 12 9 1.5 1.8 1.2
Symptoms, signs and abnormal clinical and laboratoryfindings, not elsewhere classified (R00-R99) 83 47 36 5.9 6.9 5.0
All other diseases (residual) 11 1,343 764 579 95.5 112.1 79.8Accidents (unintentional injuries) (V01-X59, Y85-Y86) 366 243 123 26.0 35.7 17.0Transport accidents (V01-V99, Y85) 88 60 28 6.3 8.8 3.9Motor vehicle accidents 12 74 46 28 5.3 6.7 3.9Other land transport accidents 13 7 7 0 0.5 1.0 0.0Water, air and space, and other and unspecified transport
accidents and their sequelae (V90-V99, Y85) 7 7 0 0.5 1.0 0.0Nontransport accidents (W00-X59, Y86) 278 183 95 19.8 26.8 13.1Falls (W00-W19) 138 87 51 9.8 12.8 7.0Accidental discharge of firearms (W32-W34) 1 1 0 0.1 0.1 0.0Accidental drowning and submersion (W65-W74) 15 11 4 1.1 1.6 0.6Accidental exposure to smoke, fire and flames (X00-X09) 10 6 4 0.7 0.9 0.6Accidental poisoning and exposure to noxious substances
(X40-X49) 49 34 15 3.5 5.0 2.1Other and unspecified nontransport accidents and their
sequelae (W20-W31, W35-W64, W75-W99, X10-X39,X50-X59, Y86) 65 44 21 4.6 6.5 2.9
Intentional self-harm (suicide) (X60-X84, Y87.0) 138 112 26 9.8 16.4 3.6Intentional self-harm (suicide) by discharge of firearms
(X72-X74) 38 36 2 2.7 5.3 0.3Intentional self-harm (suicide) by other and unspecified
means and their sequelae (X60-X71, X75-X84, Y87.0) 100 76 24 7.1 11.2 3.3Assault (homicide) (X85-Y09, Y87.1) 11 6 5 0.8 0.9 0.7Assault (homicide) by discharge of firearms (X93-X95) 3 2 1 0.2 0.3 0.1Assault (homicide) by other and unspecified means and their
sequelae (X85-X92, X96-Y09, Y87.1) 8 4 4 0.6 0.6 0.6Legal intervention (Y35, Y89.0) 0 0 0 0.0 0.0 0.0Events of undetermined intent (Y10-Y34, Y87.2, Y89.9) 23 16 7 1.6 2.3 1.0Discharge of firearms, undetermined intent (Y22-Y24) 2 2 0 0.1 0.3 0.0Other and unspecified events of undetermined intent and
their sequelae (Y10-Y21, Y25-Y34, Y87.2, Y89.9) 21 14 7 1.5 2.1 1.0Operations of war and their sequelae (Y36, Y89.1) 0 0 0 0.0 0.0 0.0Complications of medical and surgical care (Y40-Y84, Y88) 16 7 9 1.1 1.0 1.2
1. The number of deaths in this table is based on the deceased’s usual place of residence.2. Age attained at the last birthday preceding death.3. For "Age at time of death, under 1 year", the mortality rate is based on live births in the calendar year.4. For "Age at time of death, 1 to 4 years", the mortality rate is based on population estimates for 0 to 4 year olds less live births in the calendar year.5. For "Age at time of death", each age group except "All ages", the mortality rate represents the age-specific death rate or the number of deaths in a particular age
group during a given year per 100,000 population in the same age group as of July 1 of the same year.6. Starting in 2005, the population estimates used to calculate the mortality rate are presented in the Appendix II of the publication "Mortality Summary List of
Causes" (catalogue number 84F0209XIE).7. The cause of death tabulated is the underlying cause of death. This is defined as (a) the disease or injury which initiated the train of events leading directly to
death, or (b) the circumstances of the accident or violence which produced the fatal injury. The underlying cause is selected from the conditions listed onthe medical certificate of cause of death.
8. World Health Organization (WHO), International Statistical Classification of Diseases and Related Health Problems, Tenth Revision (ICD-10)9. National Center for Health Statistics, United States. "B" list in "Instruction Manual; Part 9; ICD-10 Cause-of-Death Lists for Tabulating Mortality Statistics".10. Other and unspecified infectious and parasitic diseases, and their sequelae A00, A05, A20 to A36, A42 to A44, A48 to A49, A54 to A79, A81 to A82,
A85.0 to A85.1, A85.8, A86 to B04, B06 to B09, B25 to B49, B55 to B99.11. All other diseases (residual) D65 to E07, E15 to E34, E65 to F99, G04 to G12, G23 to G25, G31 to H93, K00 to K22, K29 to K31, K50 to K66, K71 to K72, K75 to
K76, K83 to M99, N13.0 to N13.5, N13.7 to N13.9, N14, N15.0, N15.8 to N15.9, N20 to N23, N28 to N39, N41 to N64, N80 to N98. As of 2003, also includes U04.12. Motor vehicle accidents V02 to V04, V09.0, V09.2, V12 to V14, V19.0 to V19.2, V19.4 to V19.6, V20 to V79, V80.3 to V80.5, V81.0 to V81.1, V82.0 to V82.1,
V83 to V86, V87.0 to V87.8, V88.0 to V88.8, V89.0, V89.2.13. Other land transport accidents V01, V05 to V06, V09.1, V09.3 to V09.9, V10 to V11, V15 to V18, V19.3, V19.8 to V19.9, V80.0 to V80.2, V80.6 to V80.9,
V81.2 to V81.9, V82.2 to V82.9, V87.9, V88.9, V89.1, V89.3, V89.9.Note(s): See Data quality, concepts and methodology — Explanatory notes for the tables section.Source(s): Statistics Canada, Canadian Vital Statistics, Birth and Death Databases (CANSIM table 102-0551) and Appendix II.
98 Statistics Canada – Catalogue no. 84F0209X

Mortality, Summary List of Causes – 2009
Table 2-16Deaths and mortality rate, by selected grouped causes, age group at time of death and sex, Canada1 —70 to 74 years2,3,4,5
Number of deaths Age-specific mortality rate per 100,000 population 6
Bothsexes
Males Females Bothsexes
Males Females
Total, all causes of death (A00-Y89) 7 , 8 , 9 21,491 12,447 9,044 1,988.6 2,453.3 1,577.4
Salmonella infections (A01-A02) 0 0 0 0.0 0.0 0.0Shigellosis and amoebiasis (A03, A06) 0 0 0 0.0 0.0 0.0Certain other intestinal infections (A04, A07-A09) 83 43 40 7.7 8.5 7.0Tuberculosis (A16-A19) 8 6 2 0.7 1.2 0.3Respiratory tuberculosis (A16) 5 3 2 0.5 0.6 0.3Other tuberculosis (A17-A19) 3 3 0 0.3 0.6 0.0Whooping cough (A37) 0 0 0 0.0 0.0 0.0Scarlet fever and erysipelas (A38, A46) 0 0 0 0.0 0.0 0.0Meningococcal infection (A39) 0 0 0 0.0 0.0 0.0Septicaemia (A40-A41) 199 102 97 18.4 20.1 16.9Syphilis (A50-A53) 1 1 0 0.1 0.2 0.0Acute poliomyelitis (A80) 0 0 0 0.0 0.0 0.0Arthropod-borne viral encephalitis (A83-A84, A85.2) 0 0 0 0.0 0.0 0.0Measles (B05) 0 0 0 0.0 0.0 0.0Viral hepatitis (B15-B19) 29 17 12 2.7 3.4 2.1Human immunodeficiency virus [HIV] disease (B20-B24) 11 10 1 1.0 2.0 0.2Malaria (B50-B54) 0 0 0 0.0 0.0 0.0Other and unspecified infectious and parasitic diseases and
their sequelae 10 56 33 23 5.2 6.5 4.0Malignant neoplasms (C00-C97) 9,356 5,256 4,100 865.7 1,036.0 715.1Malignant neoplasms of lip, oral cavity and pharynx
(C00-C14) 147 100 47 13.6 19.7 8.2Malignant neoplasm of oesophagus (C15) 209 161 48 19.3 31.7 8.4Malignant neoplasm of stomach (C16) 244 171 73 22.6 33.7 12.7Malignant neoplasms of colon, rectum and anus (C18-C21) 955 553 402 88.4 109.0 70.1Malignant neoplasm of liver and intrahepatic bile ducts (C22) 273 182 91 25.3 35.9 15.9Malignant neoplasm of pancreas (C25) 568 308 260 52.6 60.7 45.3Malignant neoplasm of larynx (C32) 68 59 9 6.3 11.6 1.6Malignant neoplasms of trachea, bronchus and lung
(C33-C34) 3,026 1,726 1,300 280.0 340.2 226.7Malignant melanoma of skin (C43) 83 61 22 7.7 12.0 3.8Malignant neoplasm of breast (C50) 472 6 466 43.7 1.2 81.3Malignant neoplasm of cervix uteri (C53) ... ... 24 ... ... 4.2Malignant neoplasms of corpus uteri and uterus, part
unspecified (C54-C55) ... ... 118 ... ... 20.6Malignant neoplasm of ovary (C56) ... ... 192 ... ... 33.5Malignant neoplasm of prostate (C61) ... 379 ... ... 74.7 ...Malignant neoplasms of kidney and renal pelvis (C64-C65) 212 113 99 19.6 22.3 17.3Malignant neoplasm of bladder (C67) 208 171 37 19.2 33.7 6.5Malignant neoplasms of meninges, brain and other parts of
central nervous system (C70-C72) 232 138 94 21.5 27.2 16.4Malignant neoplasms of lymphoid, haematopoietic and
related tissue (C81-C96) 913 550 363 84.5 108.4 63.3Hodgkin’s disease (C81) 9 5 4 0.8 1.0 0.7Non-Hodgkin’s lymphoma (C82-C85) 360 218 142 33.3 43.0 24.8Leukaemia (C91-C95) 344 207 137 31.8 40.8 23.9Multiple myeloma and immunoproliferative neoplasms (C88,
C90) 199 119 80 18.4 23.5 14.0Other and unspecified malignant neoplasms of lymphoid,
haematopoietic and related tissue (C96) 1 1 0 0.1 0.2 0.0All other and unspecified malignant neoplasms (C17,
C23-C24, C26-C31, C37-C41, C44-C49, C51-C52,C57-C60, C62-C63, C66, C68-C69, C73-C80, C97) 1,033 578 455 95.6 113.9 79.4
In situ neoplasms, benign neoplasms and neoplasms ofuncertain or unknown behaviour (D00-D48) 143 93 50 13.2 18.3 8.7
Anaemias (D50-D64) 24 10 14 2.2 2.0 2.4Diabetes mellitus (E10-E14) 715 432 283 66.2 85.1 49.4Nutritional deficiencies (E40-E64) 10 5 5 0.9 1.0 0.9Malnutrition (E40-E46) 10 5 5 0.9 1.0 0.9Other nutritional deficiencies (E50-E64) 0 0 0 0.0 0.0 0.0Meningitis (G00, G03) 5 4 1 0.5 0.8 0.2Parkinson’s disease (G20-G21) 179 126 53 16.6 24.8 9.2Alzheimer’s disease (G30) 231 103 128 21.4 20.3 22.3Major cardiovascular diseases (I00-I78) 5,350 3,328 2,022 495.0 656.0 352.7
See notes at the end of the table.
Statistics Canada – Catalogue no. 84F0209X 99

Mortality, Summary List of Causes – 2009
Table 2-16 – continued
Deaths and mortality rate, by selected grouped causes, age group at time of death and sex, Canada1 —70 to 74 years2,3,4,5
Number of deaths Age-specific mortality rate per 100,000 population 6
Bothsexes
Males Females Bothsexes
Males Females
Diseases of heart (I00-I09, I11, I13, I20-I51) 3,933 2,539 1,394 363.9 500.4 243.1Acute rheumatic fever and chronic rheumatic heart diseases
(I00-I09) 39 14 25 3.6 2.8 4.4Hypertensive heart disease (I11) 39 21 18 3.6 4.1 3.1Hypertensive heart and renal disease (I13) 7 4 3 0.6 0.8 0.5Ischaemic heart diseases (I20-I25) 3,106 2,064 1,042 287.4 406.8 181.7Acute myocardial infarction (I21-I22) 1,435 953 482 132.8 187.8 84.1Other acute ischaemic heart diseases (I24) 91 56 35 8.4 11.0 6.1Other forms of chronic ischaemic heart disease (I20, I25) 1,580 1,055 525 146.2 207.9 91.6Atherosclerotic cardiovascular disease, so described (I25.0) 169 104 65 15.6 20.5 11.3All other forms of chronic ischaemic heart disease (I20,
I25.1-I25.9) 1,411 951 460 130.6 187.4 80.2Other heart diseases (I26-I51) 742 436 306 68.7 85.9 53.4Acute and subacute endocarditis (I33) 6 4 2 0.6 0.8 0.3Diseases of pericardium and acute myocarditis (I30-I31, I40) 10 7 3 0.9 1.4 0.5Heart failure (I50) 216 131 85 20.0 25.8 14.8All other forms of heart disease (I26-I28, I34-I38, I42-I49, I51) 510 294 216 47.2 57.9 37.7Essential hypertension and hypertensive renal disease (I10,
I12, I15) 109 52 57 10.1 10.2 9.9Cerebrovascular diseases (I60-I69) 1,002 551 451 92.7 108.6 78.7Atherosclerosis (I70) 45 25 20 4.2 4.9 3.5Other diseases of circulatory system (I71-I78) 261 161 100 24.2 31.7 17.4Aortic aneurysm and dissection (I71) 172 117 55 15.9 23.1 9.6Other diseases of arteries, arterioles and capillaries (I72-I78) 89 44 45 8.2 8.7 7.8Other disorders of circulatory system (I80-I99) 25 15 10 2.3 3.0 1.7Influenza and pneumonia (J09-J18) 305 190 115 28.2 37.4 20.1Influenza (J09-J11) 27 13 14 2.5 2.6 2.4Pneumonia (J12-J18) 278 177 101 25.7 34.9 17.6Other acute lower respiratory infections (J20-J22) 5 1 4 0.5 0.2 0.7Acute bronchitis and bronchiolitis (J20-J21) 3 0 3 0.3 0.0 0.5Unspecified acute lower respiratory infection (J22) 2 1 1 0.2 0.2 0.2Chronic lower respiratory diseases (J40-J47) 1,178 615 563 109.0 121.2 98.2Bronchitis, chronic and unspecified (J40-J42) 9 8 1 0.8 1.6 0.2Emphysema (J43) 90 50 40 8.3 9.9 7.0Asthma (J45-J46) 8 1 7 0.7 0.2 1.2Other chronic lower respiratory diseases (J44, J47) 1,071 556 515 99.1 109.6 89.8Pneumoconioses and chemical effects (J60-J66, J68) 6 6 0 0.6 1.2 0.0Pneumonitis due to solids and liquids (J69) 117 78 39 10.8 15.4 6.8Other diseases of respiratory system (J00-J06, J30-J39, J67,
J70-J98) 295 178 117 27.3 35.1 20.4Peptic ulcer (K25-K28) 39 24 15 3.6 4.7 2.6Diseases of appendix (K35-K38) 2 1 1 0.2 0.2 0.2Hernia (K40-K46) 23 11 12 2.1 2.2 2.1Chronic liver disease and cirrhosis (K70, K73-K74) 300 190 110 27.8 37.4 19.2Alcoholic liver disease (K70) 132 95 37 12.2 18.7 6.5Other chronic liver disease and cirrhosis (K73-K74) 168 95 73 15.5 18.7 12.7Cholelithiasis and other disorders of gallbladder (K80-K82) 25 13 12 2.3 2.6 2.1Nephritis, nephrotic syndrome and nephrosis (N00-N07,
N17-N19, N25-N27) 261 146 115 24.2 28.8 20.1Acute and rapidly progressive nephritic and nephrotic
syndrome (N00-N01, N04) 0 0 0 0.0 0.0 0.0Chronic glomerulonephritis, nephritis and nephropathy
not specified as acute or chronic, and renal sclerosisunspecified (N02-N03, N05-N07, N26) 12 4 8 1.1 0.8 1.4
Renal failure (N17-N19) 248 141 107 22.9 27.8 18.7Other disorders of kidney (N25, N27) 1 1 0 0.1 0.2 0.0Infections of kidney (N10-N12, N13.6, N15.1) 8 4 4 0.7 0.8 0.7Hyperplasia of prostate (N40) ... 1 ... ... 0.2 ...Inflammatory diseases of female pelvic organs (N70-N76) ... ... 0 ... ... 0.0Pregnancy, childbirth and the puerperium (O00-O99) ... ... 0 ... ... 0.0Pregnancy with abortive outcome (O00-O07) ... ... 0 ... ... 0.0Other complications of pregnancy, childbirth and the
puerperium (O10-O99) ... ... 0 ... ... 0.0Certain conditions originating in the perinatal period
(P00-P96) 0 0 0 0.0 0.0 0.0
See notes at the end of the table.
100 Statistics Canada – Catalogue no. 84F0209X

Mortality, Summary List of Causes – 2009
Table 2-16 – continued
Deaths and mortality rate, by selected grouped causes, age group at time of death and sex, Canada1 —70 to 74 years2,3,4,5
Number of deaths Age-specific mortality rate per 100,000 population 6
Bothsexes
Males Females Bothsexes
Males Females
Congenital malformations, deformations and chromosomalabnormalities (Q00-Q99) 15 13 2 1.4 2.6 0.3
Symptoms, signs and abnormal clinical and laboratoryfindings, not elsewhere classified (R00-R99) 113 72 41 10.5 14.2 7.2
All other diseases (residual) 11 1,771 917 854 163.9 180.7 148.9Accidents (unintentional injuries) (V01-X59, Y85-Y86) 440 277 163 40.7 54.6 28.4Transport accidents (V01-V99, Y85) 102 66 36 9.4 13.0 6.3Motor vehicle accidents 12 93 58 35 8.6 11.4 6.1Other land transport accidents 13 1 1 0 0.1 0.2 0.0Water, air and space, and other and unspecified transport
accidents and their sequelae (V90-V99, Y85) 8 7 1 0.7 1.4 0.2Nontransport accidents (W00-X59, Y86) 338 211 127 31.3 41.6 22.2Falls (W00-W19) 187 118 69 17.3 23.3 12.0Accidental discharge of firearms (W32-W34) 2 2 0 0.2 0.4 0.0Accidental drowning and submersion (W65-W74) 7 5 2 0.6 1.0 0.3Accidental exposure to smoke, fire and flames (X00-X09) 12 7 5 1.1 1.4 0.9Accidental poisoning and exposure to noxious substances
(X40-X49) 20 9 11 1.9 1.8 1.9Other and unspecified nontransport accidents and their
sequelae (W20-W31, W35-W64, W75-W99, X10-X39,X50-X59, Y86) 110 70 40 10.2 13.8 7.0
Intentional self-harm (suicide) (X60-X84, Y87.0) 122 104 18 11.3 20.5 3.1Intentional self-harm (suicide) by discharge of firearms
(X72-X74) 44 44 0 4.1 8.7 0.0Intentional self-harm (suicide) by other and unspecified
means and their sequelae (X60-X71, X75-X84, Y87.0) 78 60 18 7.2 11.8 3.1Assault (homicide) (X85-Y09, Y87.1) 6 5 1 0.6 1.0 0.2Assault (homicide) by discharge of firearms (X93-X95) 1 1 0 0.1 0.2 0.0Assault (homicide) by other and unspecified means and their
sequelae (X85-X92, X96-Y09, Y87.1) 5 4 1 0.5 0.8 0.2Legal intervention (Y35, Y89.0) 0 0 0 0.0 0.0 0.0Events of undetermined intent (Y10-Y34, Y87.2, Y89.9) 13 6 7 1.2 1.2 1.2Discharge of firearms, undetermined intent (Y22-Y24) 2 1 1 0.2 0.2 0.2Other and unspecified events of undetermined intent and
their sequelae (Y10-Y21, Y25-Y34, Y87.2, Y89.9) 11 5 6 1.0 1.0 1.0Operations of war and their sequelae (Y36, Y89.1) 0 0 0 0.0 0.0 0.0Complications of medical and surgical care (Y40-Y84, Y88) 21 11 10 1.9 2.2 1.7
1. The number of deaths in this table is based on the deceased’s usual place of residence.2. Age attained at the last birthday preceding death.3. For "Age at time of death, under 1 year", the mortality rate is based on live births in the calendar year.4. For "Age at time of death, 1 to 4 years", the mortality rate is based on population estimates for 0 to 4 year olds less live births in the calendar year.5. For "Age at time of death", each age group except "All ages", the mortality rate represents the age-specific death rate or the number of deaths in a particular age
group during a given year per 100,000 population in the same age group as of July 1 of the same year.6. Starting in 2005, the population estimates used to calculate the mortality rate are presented in the Appendix II of the publication "Mortality Summary List of
Causes" (catalogue number 84F0209XIE).7. The cause of death tabulated is the underlying cause of death. This is defined as (a) the disease or injury which initiated the train of events leading directly to
death, or (b) the circumstances of the accident or violence which produced the fatal injury. The underlying cause is selected from the conditions listed onthe medical certificate of cause of death.
8. World Health Organization (WHO), International Statistical Classification of Diseases and Related Health Problems, Tenth Revision (ICD-10)9. National Center for Health Statistics, United States. "B" list in "Instruction Manual; Part 9; ICD-10 Cause-of-Death Lists for Tabulating Mortality Statistics".10. Other and unspecified infectious and parasitic diseases, and their sequelae A00, A05, A20 to A36, A42 to A44, A48 to A49, A54 to A79, A81 to A82,
A85.0 to A85.1, A85.8, A86 to B04, B06 to B09, B25 to B49, B55 to B99.11. All other diseases (residual) D65 to E07, E15 to E34, E65 to F99, G04 to G12, G23 to G25, G31 to H93, K00 to K22, K29 to K31, K50 to K66, K71 to K72, K75 to
K76, K83 to M99, N13.0 to N13.5, N13.7 to N13.9, N14, N15.0, N15.8 to N15.9, N20 to N23, N28 to N39, N41 to N64, N80 to N98. As of 2003, also includes U04.12. Motor vehicle accidents V02 to V04, V09.0, V09.2, V12 to V14, V19.0 to V19.2, V19.4 to V19.6, V20 to V79, V80.3 to V80.5, V81.0 to V81.1, V82.0 to V82.1,
V83 to V86, V87.0 to V87.8, V88.0 to V88.8, V89.0, V89.2.13. Other land transport accidents V01, V05 to V06, V09.1, V09.3 to V09.9, V10 to V11, V15 to V18, V19.3, V19.8 to V19.9, V80.0 to V80.2, V80.6 to V80.9,
V81.2 to V81.9, V82.2 to V82.9, V87.9, V88.9, V89.1, V89.3, V89.9.Note(s): See Data quality, concepts and methodology — Explanatory notes for the tables section.Source(s): Statistics Canada, Canadian Vital Statistics, Birth and Death Databases (CANSIM table 102-0551) and Appendix II.
Statistics Canada – Catalogue no. 84F0209X 101

Mortality, Summary List of Causes – 2009
Table 2-17Deaths and mortality rate, by selected grouped causes, age group at time of death and sex, Canada1 —75 to 79 years2,3,4,5
Number of deaths Age-specific mortality rate per 100,000 population 6
Bothsexes
Males Females Bothsexes
Males Females
Total, all causes of death (A00-Y89) 7 , 8 , 9 30,181 17,048 13,133 3,320.4 4,164.4 2,628.8
Salmonella infections (A01-A02) 1 0 1 0.1 0.0 0.2Shigellosis and amoebiasis (A03, A06) 0 0 0 0.0 0.0 0.0Certain other intestinal infections (A04, A07-A09) 181 79 102 19.9 19.3 20.4Tuberculosis (A16-A19) 9 6 3 1.0 1.5 0.6Respiratory tuberculosis (A16) 6 4 2 0.7 1.0 0.4Other tuberculosis (A17-A19) 3 2 1 0.3 0.5 0.2Whooping cough (A37) 0 0 0 0.0 0.0 0.0Scarlet fever and erysipelas (A38, A46) 0 0 0 0.0 0.0 0.0Meningococcal infection (A39) 0 0 0 0.0 0.0 0.0Septicaemia (A40-A41) 317 163 154 34.9 39.8 30.8Syphilis (A50-A53) 0 0 0 0.0 0.0 0.0Acute poliomyelitis (A80) 0 0 0 0.0 0.0 0.0Arthropod-borne viral encephalitis (A83-A84, A85.2) 0 0 0 0.0 0.0 0.0Measles (B05) 0 0 0 0.0 0.0 0.0Viral hepatitis (B15-B19) 25 12 13 2.8 2.9 2.6Human immunodeficiency virus [HIV] disease (B20-B24) 9 8 1 1.0 2.0 0.2Malaria (B50-B54) 0 0 0 0.0 0.0 0.0Other and unspecified infectious and parasitic diseases and
their sequelae 10 65 32 33 7.2 7.8 6.6Malignant neoplasms (C00-C97) 11,089 6,287 4,802 1,220.0 1,535.8 961.2Malignant neoplasms of lip, oral cavity and pharynx
(C00-C14) 136 89 47 15.0 21.7 9.4Malignant neoplasm of oesophagus (C15) 229 167 62 25.2 40.8 12.4Malignant neoplasm of stomach (C16) 314 182 132 34.5 44.5 26.4Malignant neoplasms of colon, rectum and anus (C18-C21) 1,181 691 490 129.9 168.8 98.1Malignant neoplasm of liver and intrahepatic bile ducts (C22) 329 226 103 36.2 55.2 20.6Malignant neoplasm of pancreas (C25) 672 325 347 73.9 79.4 69.5Malignant neoplasm of larynx (C32) 67 56 11 7.4 13.7 2.2Malignant neoplasms of trachea, bronchus and lung
(C33-C34) 3,290 1,901 1,389 362.0 464.4 278.0Malignant melanoma of skin (C43) 134 93 41 14.7 22.7 8.2Malignant neoplasm of breast (C50) 553 4 549 60.8 1.0 109.9Malignant neoplasm of cervix uteri (C53) ... ... 31 ... ... 6.2Malignant neoplasms of corpus uteri and uterus, part
unspecified (C54-C55) ... ... 121 ... ... 24.2Malignant neoplasm of ovary (C56) ... ... 227 ... ... 45.4Malignant neoplasm of prostate (C61) ... 705 ... ... 172.2 ...Malignant neoplasms of kidney and renal pelvis (C64-C65) 213 140 73 23.4 34.2 14.6Malignant neoplasm of bladder (C67) 310 224 86 34.1 54.7 17.2Malignant neoplasms of meninges, brain and other parts of
central nervous system (C70-C72) 210 127 83 23.1 31.0 16.6Malignant neoplasms of lymphoid, haematopoietic and
related tissue (C81-C96) 1,045 603 442 115.0 147.3 88.5Hodgkin’s disease (C81) 9 5 4 1.0 1.2 0.8Non-Hodgkin’s lymphoma (C82-C85) 413 228 185 45.4 55.7 37.0Leukaemia (C91-C95) 394 248 146 43.3 60.6 29.2Multiple myeloma and immunoproliferative neoplasms (C88,
C90) 224 119 105 24.6 29.1 21.0Other and unspecified malignant neoplasms of lymphoid,
haematopoietic and related tissue (C96) 5 3 2 0.6 0.7 0.4All other and unspecified malignant neoplasms (C17,
C23-C24, C26-C31, C37-C41, C44-C49, C51-C52,C57-C60, C62-C63, C66, C68-C69, C73-C80, C97) 1,322 754 568 145.4 184.2 113.7
In situ neoplasms, benign neoplasms and neoplasms ofuncertain or unknown behaviour (D00-D48) 204 120 84 22.4 29.3 16.8
Anaemias (D50-D64) 53 27 26 5.8 6.6 5.2Diabetes mellitus (E10-E14) 1,013 562 451 111.4 137.3 90.3Nutritional deficiencies (E40-E64) 29 18 11 3.2 4.4 2.2Malnutrition (E40-E46) 24 15 9 2.6 3.7 1.8Other nutritional deficiencies (E50-E64) 5 3 2 0.6 0.7 0.4Meningitis (G00, G03) 3 0 3 0.3 0.0 0.6Parkinson’s disease (G20-G21) 313 205 108 34.4 50.1 21.6Alzheimer’s disease (G30) 649 267 382 71.4 65.2 76.5Major cardiovascular diseases (I00-I78) 8,367 4,940 3,427 920.5 1,206.7 686.0
See notes at the end of the table.
102 Statistics Canada – Catalogue no. 84F0209X

Mortality, Summary List of Causes – 2009
Table 2-17 – continued
Deaths and mortality rate, by selected grouped causes, age group at time of death and sex, Canada1 —75 to 79 years2,3,4,5
Number of deaths Age-specific mortality rate per 100,000 population 6
Bothsexes
Males Females Bothsexes
Males Females
Diseases of heart (I00-I09, I11, I13, I20-I51) 5,895 3,625 2,270 648.6 885.5 454.4Acute rheumatic fever and chronic rheumatic heart diseases
(I00-I09) 63 30 33 6.9 7.3 6.6Hypertensive heart disease (I11) 66 34 32 7.3 8.3 6.4Hypertensive heart and renal disease (I13) 7 3 4 0.8 0.7 0.8Ischaemic heart diseases (I20-I25) 4,425 2,851 1,574 486.8 696.4 315.1Acute myocardial infarction (I21-I22) 1,914 1,217 697 210.6 297.3 139.5Other acute ischaemic heart diseases (I24) 130 66 64 14.3 16.1 12.8Other forms of chronic ischaemic heart disease (I20, I25) 2,381 1,568 813 262.0 383.0 162.7Atherosclerotic cardiovascular disease, so described (I25.0) 230 144 86 25.3 35.2 17.2All other forms of chronic ischaemic heart disease (I20,
I25.1-I25.9) 2,151 1,424 727 236.6 347.9 145.5Other heart diseases (I26-I51) 1,334 707 627 146.8 172.7 125.5Acute and subacute endocarditis (I33) 15 10 5 1.7 2.4 1.0Diseases of pericardium and acute myocarditis (I30-I31, I40) 12 6 6 1.3 1.5 1.2Heart failure (I50) 391 191 200 43.0 46.7 40.0All other forms of heart disease (I26-I28, I34-I38, I42-I49, I51) 916 500 416 100.8 122.1 83.3Essential hypertension and hypertensive renal disease (I10,
I12, I15) 156 64 92 17.2 15.6 18.4Cerebrovascular diseases (I60-I69) 1,799 931 868 197.9 227.4 173.7Atherosclerosis (I70) 81 54 27 8.9 13.2 5.4Other diseases of circulatory system (I71-I78) 436 266 170 48.0 65.0 34.0Aortic aneurysm and dissection (I71) 284 183 101 31.2 44.7 20.2Other diseases of arteries, arterioles and capillaries (I72-I78) 152 83 69 16.7 20.3 13.8Other disorders of circulatory system (I80-I99) 40 22 18 4.4 5.4 3.6Influenza and pneumonia (J09-J18) 581 324 257 63.9 79.1 51.4Influenza (J09-J11) 35 18 17 3.9 4.4 3.4Pneumonia (J12-J18) 546 306 240 60.1 74.7 48.0Other acute lower respiratory infections (J20-J22) 8 5 3 0.9 1.2 0.6Acute bronchitis and bronchiolitis (J20-J21) 8 5 3 0.9 1.2 0.6Unspecified acute lower respiratory infection (J22) 0 0 0 0.0 0.0 0.0Chronic lower respiratory diseases (J40-J47) 1,806 1,011 795 198.7 247.0 159.1Bronchitis, chronic and unspecified (J40-J42) 9 4 5 1.0 1.0 1.0Emphysema (J43) 107 66 41 11.8 16.1 8.2Asthma (J45-J46) 15 6 9 1.7 1.5 1.8Other chronic lower respiratory diseases (J44, J47) 1,675 935 740 184.3 228.4 148.1Pneumoconioses and chemical effects (J60-J66, J68) 20 20 0 2.2 4.9 0.0Pneumonitis due to solids and liquids (J69) 206 133 73 22.7 32.5 14.6Other diseases of respiratory system (J00-J06, J30-J39, J67,
J70-J98) 422 272 150 46.4 66.4 30.0Peptic ulcer (K25-K28) 63 38 25 6.9 9.3 5.0Diseases of appendix (K35-K38) 6 5 1 0.7 1.2 0.2Hernia (K40-K46) 46 22 24 5.1 5.4 4.8Chronic liver disease and cirrhosis (K70, K73-K74) 254 159 95 27.9 38.8 19.0Alcoholic liver disease (K70) 82 68 14 9.0 16.6 2.8Other chronic liver disease and cirrhosis (K73-K74) 172 91 81 18.9 22.2 16.2Cholelithiasis and other disorders of gallbladder (K80-K82) 52 29 23 5.7 7.1 4.6Nephritis, nephrotic syndrome and nephrosis (N00-N07,
N17-N19, N25-N27) 460 249 211 50.6 60.8 42.2Acute and rapidly progressive nephritic and nephrotic
syndrome (N00-N01, N04) 2 1 1 0.2 0.2 0.2Chronic glomerulonephritis, nephritis and nephropathy
not specified as acute or chronic, and renal sclerosisunspecified (N02-N03, N05-N07, N26) 14 9 5 1.5 2.2 1.0
Renal failure (N17-N19) 443 239 204 48.7 58.4 40.8Other disorders of kidney (N25, N27) 1 0 1 0.1 0.0 0.2Infections of kidney (N10-N12, N13.6, N15.1) 11 2 9 1.2 0.5 1.8Hyperplasia of prostate (N40) ... 15 ... ... 3.7 ...Inflammatory diseases of female pelvic organs (N70-N76) ... ... 2 ... ... 0.4Pregnancy, childbirth and the puerperium (O00-O99) ... ... 0 ... ... 0.0Pregnancy with abortive outcome (O00-O07) ... ... 0 ... ... 0.0Other complications of pregnancy, childbirth and the
puerperium (O10-O99) ... ... 0 ... ... 0.0Certain conditions originating in the perinatal period
(P00-P96) 0 0 0 0.0 0.0 0.0
See notes at the end of the table.
Statistics Canada – Catalogue no. 84F0209X 103

Mortality, Summary List of Causes – 2009
Table 2-17 – continued
Deaths and mortality rate, by selected grouped causes, age group at time of death and sex, Canada1 —75 to 79 years2,3,4,5
Number of deaths Age-specific mortality rate per 100,000 population 6
Bothsexes
Males Females Bothsexes
Males Females
Congenital malformations, deformations and chromosomalabnormalities (Q00-Q99) 19 5 14 2.1 1.2 2.8
Symptoms, signs and abnormal clinical and laboratoryfindings, not elsewhere classified (R00-R99) 123 66 57 13.5 16.1 11.4
All other diseases (residual) 11 2,859 1,414 1,445 314.5 345.4 289.2Accidents (unintentional injuries) (V01-X59, Y85-Y86) 734 436 298 80.8 106.5 59.7Transport accidents (V01-V99, Y85) 124 86 38 13.6 21.0 7.6Motor vehicle accidents 12 112 76 36 12.3 18.6 7.2Other land transport accidents 13 3 3 0 0.3 0.7 0.0Water, air and space, and other and unspecified transport
accidents and their sequelae (V90-V99, Y85) 9 7 2 1.0 1.7 0.4Nontransport accidents (W00-X59, Y86) 610 350 260 67.1 85.5 52.0Falls (W00-W19) 374 226 148 41.1 55.2 29.6Accidental discharge of firearms (W32-W34) 0 0 0 0.0 0.0 0.0Accidental drowning and submersion (W65-W74) 9 5 4 1.0 1.2 0.8Accidental exposure to smoke, fire and flames (X00-X09) 20 11 9 2.2 2.7 1.8Accidental poisoning and exposure to noxious substances
(X40-X49) 27 14 13 3.0 3.4 2.6Other and unspecified nontransport accidents and their
sequelae (W20-W31, W35-W64, W75-W99, X10-X39,X50-X59, Y86) 180 94 86 19.8 23.0 17.2
Intentional self-harm (suicide) (X60-X84, Y87.0) 82 69 13 9.0 16.9 2.6Intentional self-harm (suicide) by discharge of firearms
(X72-X74) 27 26 1 3.0 6.4 0.2Intentional self-harm (suicide) by other and unspecified
means and their sequelae (X60-X71, X75-X84, Y87.0) 55 43 12 6.1 10.5 2.4Assault (homicide) (X85-Y09, Y87.1) 6 4 2 0.7 1.0 0.4Assault (homicide) by discharge of firearms (X93-X95) 0 0 0 0.0 0.0 0.0Assault (homicide) by other and unspecified means and their
sequelae (X85-X92, X96-Y09, Y87.1) 6 4 2 0.7 1.0 0.4Legal intervention (Y35, Y89.0) 0 0 0 0.0 0.0 0.0Events of undetermined intent (Y10-Y34, Y87.2, Y89.9) 7 6 1 0.8 1.5 0.2Discharge of firearms, undetermined intent (Y22-Y24) 0 0 0 0.0 0.0 0.0Other and unspecified events of undetermined intent and
their sequelae (Y10-Y21, Y25-Y34, Y87.2, Y89.9) 7 6 1 0.8 1.5 0.2Operations of war and their sequelae (Y36, Y89.1) 0 0 0 0.0 0.0 0.0Complications of medical and surgical care (Y40-Y84, Y88) 32 16 16 3.5 3.9 3.2
1. The number of deaths in this table is based on the deceased’s usual place of residence.2. Age attained at the last birthday preceding death.3. For "Age at time of death, under 1 year", the mortality rate is based on live births in the calendar year.4. For "Age at time of death, 1 to 4 years", the mortality rate is based on population estimates for 0 to 4 year olds less live births in the calendar year.5. For "Age at time of death", each age group except "All ages", the mortality rate represents the age-specific death rate or the number of deaths in a particular age
group during a given year per 100,000 population in the same age group as of July 1 of the same year.6. Starting in 2005, the population estimates used to calculate the mortality rate are presented in the Appendix II of the publication "Mortality Summary List of
Causes" (catalogue number 84F0209XIE).7. The cause of death tabulated is the underlying cause of death. This is defined as (a) the disease or injury which initiated the train of events leading directly to
death, or (b) the circumstances of the accident or violence which produced the fatal injury. The underlying cause is selected from the conditions listed onthe medical certificate of cause of death.
8. World Health Organization (WHO), International Statistical Classification of Diseases and Related Health Problems, Tenth Revision (ICD-10)9. National Center for Health Statistics, United States. "B" list in "Instruction Manual; Part 9; ICD-10 Cause-of-Death Lists for Tabulating Mortality Statistics".10. Other and unspecified infectious and parasitic diseases, and their sequelae A00, A05, A20 to A36, A42 to A44, A48 to A49, A54 to A79, A81 to A82,
A85.0 to A85.1, A85.8, A86 to B04, B06 to B09, B25 to B49, B55 to B99.11. All other diseases (residual) D65 to E07, E15 to E34, E65 to F99, G04 to G12, G23 to G25, G31 to H93, K00 to K22, K29 to K31, K50 to K66, K71 to K72, K75 to
K76, K83 to M99, N13.0 to N13.5, N13.7 to N13.9, N14, N15.0, N15.8 to N15.9, N20 to N23, N28 to N39, N41 to N64, N80 to N98. As of 2003, also includes U04.12. Motor vehicle accidents V02 to V04, V09.0, V09.2, V12 to V14, V19.0 to V19.2, V19.4 to V19.6, V20 to V79, V80.3 to V80.5, V81.0 to V81.1, V82.0 to V82.1,
V83 to V86, V87.0 to V87.8, V88.0 to V88.8, V89.0, V89.2.13. Other land transport accidents V01, V05 to V06, V09.1, V09.3 to V09.9, V10 to V11, V15 to V18, V19.3, V19.8 to V19.9, V80.0 to V80.2, V80.6 to V80.9,
V81.2 to V81.9, V82.2 to V82.9, V87.9, V88.9, V89.1, V89.3, V89.9.Note(s): See Data quality, concepts and methodology — Explanatory notes for the tables section.Source(s): Statistics Canada, Canadian Vital Statistics, Birth and Death Databases (CANSIM table 102-0551) and Appendix II.
104 Statistics Canada – Catalogue no. 84F0209X

Mortality, Summary List of Causes – 2009
Table 2-18Deaths and mortality rate, by selected grouped causes, age group at time of death and sex, Canada1 —80 to 84 years2,3,4,5
Number of deaths Age-specific mortality rate per 100,000 population 6
Bothsexes
Males Females Bothsexes
Males Females
Total, all causes of death (A00-Y89) 7 , 8 , 9 38,315 19,302 19,013 5,662.0 7,001.4 4,741.2
Salmonella infections (A01-A02) 0 0 0 0.0 0.0 0.0Shigellosis and amoebiasis (A03, A06) 1 1 0 0.1 0.4 0.0Certain other intestinal infections (A04, A07-A09) 278 115 163 41.1 41.7 40.6Tuberculosis (A16-A19) 7 2 5 1.0 0.7 1.2Respiratory tuberculosis (A16) 6 2 4 0.9 0.7 1.0Other tuberculosis (A17-A19) 1 0 1 0.1 0.0 0.2Whooping cough (A37) 0 0 0 0.0 0.0 0.0Scarlet fever and erysipelas (A38, A46) 0 0 0 0.0 0.0 0.0Meningococcal infection (A39) 0 0 0 0.0 0.0 0.0Septicaemia (A40-A41) 420 195 225 62.1 70.7 56.1Syphilis (A50-A53) 1 0 1 0.1 0.0 0.2Acute poliomyelitis (A80) 0 0 0 0.0 0.0 0.0Arthropod-borne viral encephalitis (A83-A84, A85.2) 0 0 0 0.0 0.0 0.0Measles (B05) 0 0 0 0.0 0.0 0.0Viral hepatitis (B15-B19) 39 15 24 5.8 5.4 6.0Human immunodeficiency virus [HIV] disease (B20-B24) 3 3 0 0.4 1.1 0.0Malaria (B50-B54) 0 0 0 0.0 0.0 0.0Other and unspecified infectious and parasitic diseases and
their sequelae 10 69 31 38 10.2 11.2 9.5Malignant neoplasms (C00-C97) 10,609 5,676 4,933 1,567.8 2,058.9 1,230.1Malignant neoplasms of lip, oral cavity and pharynx
(C00-C14) 127 84 43 18.8 30.5 10.7Malignant neoplasm of oesophagus (C15) 223 158 65 33.0 57.3 16.2Malignant neoplasm of stomach (C16) 312 186 126 46.1 67.5 31.4Malignant neoplasms of colon, rectum and anus (C18-C21) 1,264 643 621 186.8 233.2 154.9Malignant neoplasm of liver and intrahepatic bile ducts (C22) 293 148 145 43.3 53.7 36.2Malignant neoplasm of pancreas (C25) 567 247 320 83.8 89.6 79.8Malignant neoplasm of larynx (C32) 72 59 13 10.6 21.4 3.2Malignant neoplasms of trachea, bronchus and lung
(C33-C34) 2,581 1,469 1,112 381.4 532.9 277.3Malignant melanoma of skin (C43) 118 67 51 17.4 24.3 12.7Malignant neoplasm of breast (C50) 643 8 635 95.0 2.9 158.3Malignant neoplasm of cervix uteri (C53) ... ... 32 ... ... 8.0Malignant neoplasms of corpus uteri and uterus, part
unspecified (C54-C55) ... ... 93 ... ... 23.2Malignant neoplasm of ovary (C56) ... ... 197 ... ... 49.1Malignant neoplasm of prostate (C61) ... 872 ... ... 316.3 ...Malignant neoplasms of kidney and renal pelvis (C64-C65) 209 145 64 30.9 52.6 16.0Malignant neoplasm of bladder (C67) 384 266 118 56.7 96.5 29.4Malignant neoplasms of meninges, brain and other parts of
central nervous system (C70-C72) 164 80 84 24.2 29.0 20.9Malignant neoplasms of lymphoid, haematopoietic and
related tissue (C81-C96) 1,079 560 519 159.4 203.1 129.4Hodgkin’s disease (C81) 10 7 3 1.5 2.5 0.7Non-Hodgkin’s lymphoma (C82-C85) 436 201 235 64.4 72.9 58.6Leukaemia (C91-C95) 402 222 180 59.4 80.5 44.9Multiple myeloma and immunoproliferative neoplasms (C88,
C90) 230 129 101 34.0 46.8 25.2Other and unspecified malignant neoplasms of lymphoid,
haematopoietic and related tissue (C96) 1 1 0 0.1 0.4 0.0All other and unspecified malignant neoplasms (C17,
C23-C24, C26-C31, C37-C41, C44-C49, C51-C52,C57-C60, C62-C63, C66, C68-C69, C73-C80, C97) 1,379 684 695 203.8 248.1 173.3
In situ neoplasms, benign neoplasms and neoplasms ofuncertain or unknown behaviour (D00-D48) 271 135 136 40.0 49.0 33.9
Anaemias (D50-D64) 98 43 55 14.5 15.6 13.7Diabetes mellitus (E10-E14) 1,323 642 681 195.5 232.9 169.8Nutritional deficiencies (E40-E64) 35 12 23 5.2 4.4 5.7Malnutrition (E40-E46) 26 9 17 3.8 3.3 4.2Other nutritional deficiencies (E50-E64) 9 3 6 1.3 1.1 1.5Meningitis (G00, G03) 3 2 1 0.4 0.7 0.2Parkinson’s disease (G20-G21) 553 351 202 81.7 127.3 50.4Alzheimer’s disease (G30) 1,319 527 792 194.9 191.2 197.5Major cardiovascular diseases (I00-I78) 12,130 6,123 6,007 1,792.5 2,221.0 1,497.9
See notes at the end of the table.
Statistics Canada – Catalogue no. 84F0209X 105
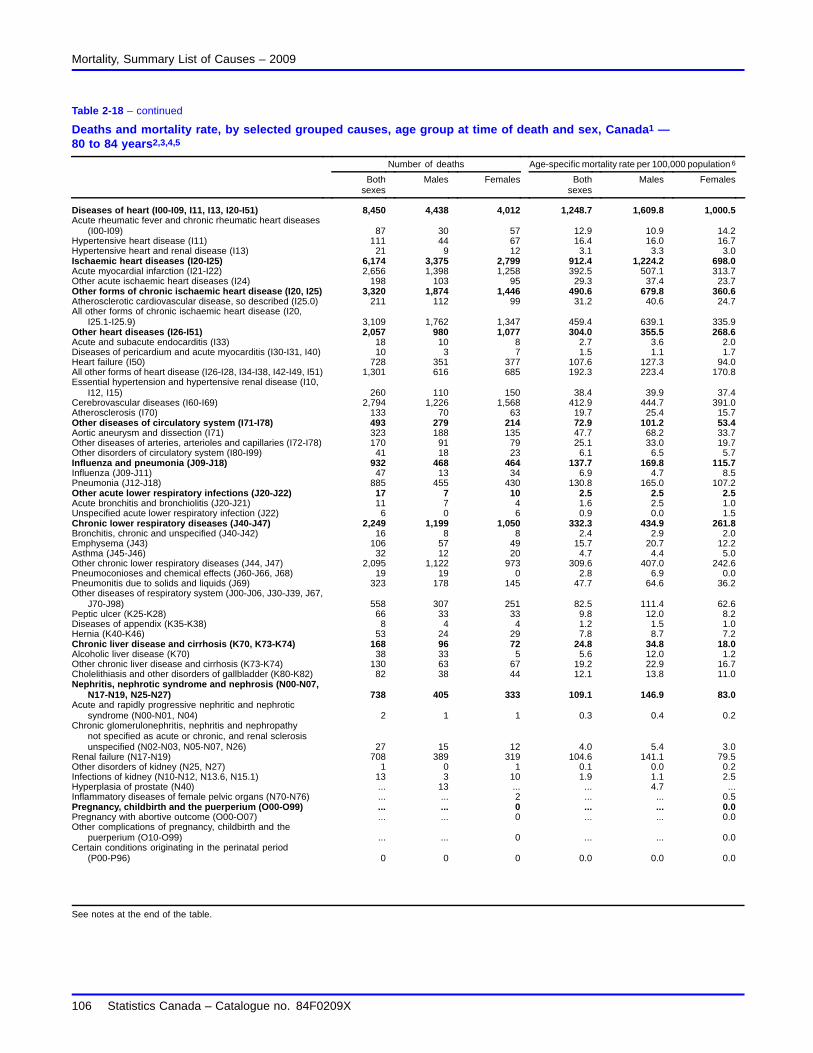
Mortality, Summary List of Causes – 2009
Table 2-18 – continued
Deaths and mortality rate, by selected grouped causes, age group at time of death and sex, Canada1 —80 to 84 years2,3,4,5
Number of deaths Age-specific mortality rate per 100,000 population 6
Bothsexes
Males Females Bothsexes
Males Females
Diseases of heart (I00-I09, I11, I13, I20-I51) 8,450 4,438 4,012 1,248.7 1,609.8 1,000.5Acute rheumatic fever and chronic rheumatic heart diseases
(I00-I09) 87 30 57 12.9 10.9 14.2Hypertensive heart disease (I11) 111 44 67 16.4 16.0 16.7Hypertensive heart and renal disease (I13) 21 9 12 3.1 3.3 3.0Ischaemic heart diseases (I20-I25) 6,174 3,375 2,799 912.4 1,224.2 698.0Acute myocardial infarction (I21-I22) 2,656 1,398 1,258 392.5 507.1 313.7Other acute ischaemic heart diseases (I24) 198 103 95 29.3 37.4 23.7Other forms of chronic ischaemic heart disease (I20, I25) 3,320 1,874 1,446 490.6 679.8 360.6Atherosclerotic cardiovascular disease, so described (I25.0) 211 112 99 31.2 40.6 24.7All other forms of chronic ischaemic heart disease (I20,
I25.1-I25.9) 3,109 1,762 1,347 459.4 639.1 335.9Other heart diseases (I26-I51) 2,057 980 1,077 304.0 355.5 268.6Acute and subacute endocarditis (I33) 18 10 8 2.7 3.6 2.0Diseases of pericardium and acute myocarditis (I30-I31, I40) 10 3 7 1.5 1.1 1.7Heart failure (I50) 728 351 377 107.6 127.3 94.0All other forms of heart disease (I26-I28, I34-I38, I42-I49, I51) 1,301 616 685 192.3 223.4 170.8Essential hypertension and hypertensive renal disease (I10,
I12, I15) 260 110 150 38.4 39.9 37.4Cerebrovascular diseases (I60-I69) 2,794 1,226 1,568 412.9 444.7 391.0Atherosclerosis (I70) 133 70 63 19.7 25.4 15.7Other diseases of circulatory system (I71-I78) 493 279 214 72.9 101.2 53.4Aortic aneurysm and dissection (I71) 323 188 135 47.7 68.2 33.7Other diseases of arteries, arterioles and capillaries (I72-I78) 170 91 79 25.1 33.0 19.7Other disorders of circulatory system (I80-I99) 41 18 23 6.1 6.5 5.7Influenza and pneumonia (J09-J18) 932 468 464 137.7 169.8 115.7Influenza (J09-J11) 47 13 34 6.9 4.7 8.5Pneumonia (J12-J18) 885 455 430 130.8 165.0 107.2Other acute lower respiratory infections (J20-J22) 17 7 10 2.5 2.5 2.5Acute bronchitis and bronchiolitis (J20-J21) 11 7 4 1.6 2.5 1.0Unspecified acute lower respiratory infection (J22) 6 0 6 0.9 0.0 1.5Chronic lower respiratory diseases (J40-J47) 2,249 1,199 1,050 332.3 434.9 261.8Bronchitis, chronic and unspecified (J40-J42) 16 8 8 2.4 2.9 2.0Emphysema (J43) 106 57 49 15.7 20.7 12.2Asthma (J45-J46) 32 12 20 4.7 4.4 5.0Other chronic lower respiratory diseases (J44, J47) 2,095 1,122 973 309.6 407.0 242.6Pneumoconioses and chemical effects (J60-J66, J68) 19 19 0 2.8 6.9 0.0Pneumonitis due to solids and liquids (J69) 323 178 145 47.7 64.6 36.2Other diseases of respiratory system (J00-J06, J30-J39, J67,
J70-J98) 558 307 251 82.5 111.4 62.6Peptic ulcer (K25-K28) 66 33 33 9.8 12.0 8.2Diseases of appendix (K35-K38) 8 4 4 1.2 1.5 1.0Hernia (K40-K46) 53 24 29 7.8 8.7 7.2Chronic liver disease and cirrhosis (K70, K73-K74) 168 96 72 24.8 34.8 18.0Alcoholic liver disease (K70) 38 33 5 5.6 12.0 1.2Other chronic liver disease and cirrhosis (K73-K74) 130 63 67 19.2 22.9 16.7Cholelithiasis and other disorders of gallbladder (K80-K82) 82 38 44 12.1 13.8 11.0Nephritis, nephrotic syndrome and nephrosis (N00-N07,
N17-N19, N25-N27) 738 405 333 109.1 146.9 83.0Acute and rapidly progressive nephritic and nephrotic
syndrome (N00-N01, N04) 2 1 1 0.3 0.4 0.2Chronic glomerulonephritis, nephritis and nephropathy
not specified as acute or chronic, and renal sclerosisunspecified (N02-N03, N05-N07, N26) 27 15 12 4.0 5.4 3.0
Renal failure (N17-N19) 708 389 319 104.6 141.1 79.5Other disorders of kidney (N25, N27) 1 0 1 0.1 0.0 0.2Infections of kidney (N10-N12, N13.6, N15.1) 13 3 10 1.9 1.1 2.5Hyperplasia of prostate (N40) ... 13 ... ... 4.7 ...Inflammatory diseases of female pelvic organs (N70-N76) ... ... 2 ... ... 0.5Pregnancy, childbirth and the puerperium (O00-O99) ... ... 0 ... ... 0.0Pregnancy with abortive outcome (O00-O07) ... ... 0 ... ... 0.0Other complications of pregnancy, childbirth and the
puerperium (O10-O99) ... ... 0 ... ... 0.0Certain conditions originating in the perinatal period
(P00-P96) 0 0 0 0.0 0.0 0.0
See notes at the end of the table.
106 Statistics Canada – Catalogue no. 84F0209X

Mortality, Summary List of Causes – 2009
Table 2-18 – continued
Deaths and mortality rate, by selected grouped causes, age group at time of death and sex, Canada1 —80 to 84 years2,3,4,5
Number of deaths Age-specific mortality rate per 100,000 population 6
Bothsexes
Males Females Bothsexes
Males Females
Congenital malformations, deformations and chromosomalabnormalities (Q00-Q99) 9 6 3 1.3 2.2 0.7
Symptoms, signs and abnormal clinical and laboratoryfindings, not elsewhere classified (R00-R99) 197 93 104 29.1 33.7 25.9
All other diseases (residual) 11 4,488 1,929 2,559 663.2 699.7 638.1Accidents (unintentional injuries) (V01-X59, Y85-Y86) 1,059 508 551 156.5 184.3 137.4Transport accidents (V01-V99, Y85) 113 73 40 16.7 26.5 10.0Motor vehicle accidents 12 104 68 36 15.4 24.7 9.0Other land transport accidents 13 4 2 2 0.6 0.7 0.5Water, air and space, and other and unspecified transport
accidents and their sequelae (V90-V99, Y85) 5 3 2 0.7 1.1 0.5Nontransport accidents (W00-X59, Y86) 946 435 511 139.8 157.8 127.4Falls (W00-W19) 644 308 336 95.2 111.7 83.8Accidental discharge of firearms (W32-W34) 0 0 0 0.0 0.0 0.0Accidental drowning and submersion (W65-W74) 4 4 0 0.6 1.5 0.0Accidental exposure to smoke, fire and flames (X00-X09) 25 13 12 3.7 4.7 3.0Accidental poisoning and exposure to noxious substances
(X40-X49) 23 12 11 3.4 4.4 2.7Other and unspecified nontransport accidents and their
sequelae (W20-W31, W35-W64, W75-W99, X10-X39,X50-X59, Y86) 250 98 152 36.9 35.5 37.9
Intentional self-harm (suicide) (X60-X84, Y87.0) 73 54 19 10.8 19.6 4.7Intentional self-harm (suicide) by discharge of firearms
(X72-X74) 19 19 0 2.8 6.9 0.0Intentional self-harm (suicide) by other and unspecified
means and their sequelae (X60-X71, X75-X84, Y87.0) 54 35 19 8.0 12.7 4.7Assault (homicide) (X85-Y09, Y87.1) 6 1 5 0.9 0.4 1.2Assault (homicide) by discharge of firearms (X93-X95) 1 0 1 0.1 0.0 0.2Assault (homicide) by other and unspecified means and their
sequelae (X85-X92, X96-Y09, Y87.1) 5 1 4 0.7 0.4 1.0Legal intervention (Y35, Y89.0) 0 0 0 0.0 0.0 0.0Events of undetermined intent (Y10-Y34, Y87.2, Y89.9) 4 4 0 0.6 1.5 0.0Discharge of firearms, undetermined intent (Y22-Y24) 0 0 0 0.0 0.0 0.0Other and unspecified events of undetermined intent and
their sequelae (Y10-Y21, Y25-Y34, Y87.2, Y89.9) 4 4 0 0.6 1.5 0.0Operations of war and their sequelae (Y36, Y89.1) 0 0 0 0.0 0.0 0.0Complications of medical and surgical care (Y40-Y84, Y88) 38 22 16 5.6 8.0 4.0
1. The number of deaths in this table is based on the deceased’s usual place of residence.2. Age attained at the last birthday preceding death.3. For "Age at time of death, under 1 year", the mortality rate is based on live births in the calendar year.4. For "Age at time of death, 1 to 4 years", the mortality rate is based on population estimates for 0 to 4 year olds less live births in the calendar year.5. For "Age at time of death", each age group except "All ages", the mortality rate represents the age-specific death rate or the number of deaths in a particular age
group during a given year per 100,000 population in the same age group as of July 1 of the same year.6. Starting in 2005, the population estimates used to calculate the mortality rate are presented in the Appendix II of the publication "Mortality Summary List of
Causes" (catalogue number 84F0209XIE).7. The cause of death tabulated is the underlying cause of death. This is defined as (a) the disease or injury which initiated the train of events leading directly to
death, or (b) the circumstances of the accident or violence which produced the fatal injury. The underlying cause is selected from the conditions listed onthe medical certificate of cause of death.
8. World Health Organization (WHO), International Statistical Classification of Diseases and Related Health Problems, Tenth Revision (ICD-10)9. National Center for Health Statistics, United States. "B" list in "Instruction Manual; Part 9; ICD-10 Cause-of-Death Lists for Tabulating Mortality Statistics".10. Other and unspecified infectious and parasitic diseases, and their sequelae A00, A05, A20 to A36, A42 to A44, A48 to A49, A54 to A79, A81 to A82,
A85.0 to A85.1, A85.8, A86 to B04, B06 to B09, B25 to B49, B55 to B99.11. All other diseases (residual) D65 to E07, E15 to E34, E65 to F99, G04 to G12, G23 to G25, G31 to H93, K00 to K22, K29 to K31, K50 to K66, K71 to K72, K75 to
K76, K83 to M99, N13.0 to N13.5, N13.7 to N13.9, N14, N15.0, N15.8 to N15.9, N20 to N23, N28 to N39, N41 to N64, N80 to N98. As of 2003, also includes U04.12. Motor vehicle accidents V02 to V04, V09.0, V09.2, V12 to V14, V19.0 to V19.2, V19.4 to V19.6, V20 to V79, V80.3 to V80.5, V81.0 to V81.1, V82.0 to V82.1,
V83 to V86, V87.0 to V87.8, V88.0 to V88.8, V89.0, V89.2.13. Other land transport accidents V01, V05 to V06, V09.1, V09.3 to V09.9, V10 to V11, V15 to V18, V19.3, V19.8 to V19.9, V80.0 to V80.2, V80.6 to V80.9,
V81.2 to V81.9, V82.2 to V82.9, V87.9, V88.9, V89.1, V89.3, V89.9.Note(s): See Data quality, concepts and methodology — Explanatory notes for the tables section.Source(s): Statistics Canada, Canadian Vital Statistics, Birth and Death Databases (CANSIM table 102-0551) and Appendix II.
Statistics Canada – Catalogue no. 84F0209X 107

Mortality, Summary List of Causes – 2009
Table 2-19Deaths and mortality rate, by selected grouped causes, age group at time of death and sex, Canada1 —85 to 89 years2,3,4,5
Number of deaths Age-specific mortality rate per 100,000 population 6
Bothsexes
Males Females Bothsexes
Males Females
Total, all causes of death (A00-Y89) 7 , 8 , 9 39,633 16,846 22,787 9,612.7 11,704.4 8,491.0
Salmonella infections (A01-A02) 0 0 0 0.0 0.0 0.0Shigellosis and amoebiasis (A03, A06) 0 0 0 0.0 0.0 0.0Certain other intestinal infections (A04, A07-A09) 349 150 199 84.6 104.2 74.2Tuberculosis (A16-A19) 11 8 3 2.7 5.6 1.1Respiratory tuberculosis (A16) 10 7 3 2.4 4.9 1.1Other tuberculosis (A17-A19) 1 1 0 0.2 0.7 0.0Whooping cough (A37) 0 0 0 0.0 0.0 0.0Scarlet fever and erysipelas (A38, A46) 0 0 0 0.0 0.0 0.0Meningococcal infection (A39) 0 0 0 0.0 0.0 0.0Septicaemia (A40-A41) 426 167 259 103.3 116.0 96.5Syphilis (A50-A53) 0 0 0 0.0 0.0 0.0Acute poliomyelitis (A80) 0 0 0 0.0 0.0 0.0Arthropod-borne viral encephalitis (A83-A84, A85.2) 0 0 0 0.0 0.0 0.0Measles (B05) 0 0 0 0.0 0.0 0.0Viral hepatitis (B15-B19) 8 6 2 1.9 4.2 0.7Human immunodeficiency virus [HIV] disease (B20-B24) 1 0 1 0.2 0.0 0.4Malaria (B50-B54) 0 0 0 0.0 0.0 0.0Other and unspecified infectious and parasitic diseases and
their sequelae 10 65 27 38 15.8 18.8 14.2Malignant neoplasms (C00-C97) 7,838 3,799 4,039 1,901.1 2,639.5 1,505.0Malignant neoplasms of lip, oral cavity and pharynx
(C00-C14) 82 41 41 19.9 28.5 15.3Malignant neoplasm of oesophagus (C15) 149 86 63 36.1 59.8 23.5Malignant neoplasm of stomach (C16) 207 96 111 50.2 66.7 41.4Malignant neoplasms of colon, rectum and anus (C18-C21) 1,021 448 573 247.6 311.3 213.5Malignant neoplasm of liver and intrahepatic bile ducts (C22) 167 81 86 40.5 56.3 32.0Malignant neoplasm of pancreas (C25) 441 162 279 107.0 112.6 104.0Malignant neoplasm of larynx (C32) 30 26 4 7.3 18.1 1.5Malignant neoplasms of trachea, bronchus and lung
(C33-C34) 1,515 802 713 367.5 557.2 265.7Malignant melanoma of skin (C43) 77 44 33 18.7 30.6 12.3Malignant neoplasm of breast (C50) 506 3 503 122.7 2.1 187.4Malignant neoplasm of cervix uteri (C53) ... ... 19 ... ... 7.1Malignant neoplasms of corpus uteri and uterus, part
unspecified (C54-C55) ... ... 84 ... ... 31.3Malignant neoplasm of ovary (C56) ... ... 158 ... ... 58.9Malignant neoplasm of prostate (C61) ... 775 ... ... 538.5 ...Malignant neoplasms of kidney and renal pelvis (C64-C65) 167 86 81 40.5 59.8 30.2Malignant neoplasm of bladder (C67) 339 222 117 82.2 154.2 43.6Malignant neoplasms of meninges, brain and other parts of
central nervous system (C70-C72) 86 37 49 20.9 25.7 18.3Malignant neoplasms of lymphoid, haematopoietic and
related tissue (C81-C96) 830 391 439 201.3 271.7 163.6Hodgkin’s disease (C81) 14 9 5 3.4 6.3 1.9Non-Hodgkin’s lymphoma (C82-C85) 333 148 185 80.8 102.8 68.9Leukaemia (C91-C95) 300 150 150 72.8 104.2 55.9Multiple myeloma and immunoproliferative neoplasms (C88,
C90) 181 83 98 43.9 57.7 36.5Other and unspecified malignant neoplasms of lymphoid,
haematopoietic and related tissue (C96) 2 1 1 0.5 0.7 0.4All other and unspecified malignant neoplasms (C17,
C23-C24, C26-C31, C37-C41, C44-C49, C51-C52,C57-C60, C62-C63, C66, C68-C69, C73-C80, C97) 1,185 499 686 287.4 346.7 255.6
In situ neoplasms, benign neoplasms and neoplasms ofuncertain or unknown behaviour (D00-D48) 295 143 152 71.6 99.4 56.6
Anaemias (D50-D64) 125 61 64 30.3 42.4 23.8Diabetes mellitus (E10-E14) 1,153 468 685 279.7 325.2 255.2Nutritional deficiencies (E40-E64) 52 15 37 12.6 10.4 13.8Malnutrition (E40-E46) 44 11 33 10.7 7.6 12.3Other nutritional deficiencies (E50-E64) 8 4 4 1.9 2.8 1.5Meningitis (G00, G03) 7 1 6 1.7 0.7 2.2Parkinson’s disease (G20-G21) 484 251 233 117.4 174.4 86.8Alzheimer’s disease (G30) 1,828 557 1,271 443.4 387.0 473.6Major cardiovascular diseases (I00-I78) 14,039 5,745 8,294 3,405.1 3,991.6 3,090.5
See notes at the end of the table.
108 Statistics Canada – Catalogue no. 84F0209X

Mortality, Summary List of Causes – 2009
Table 2-19 – continued
Deaths and mortality rate, by selected grouped causes, age group at time of death and sex, Canada1 —85 to 89 years2,3,4,5
Number of deaths Age-specific mortality rate per 100,000 population 6
Bothsexes
Males Females Bothsexes
Males Females
Diseases of heart (I00-I09, I11, I13, I20-I51) 9,690 4,105 5,585 2,350.2 2,852.1 2,081.1Acute rheumatic fever and chronic rheumatic heart diseases
(I00-I09) 81 14 67 19.6 9.7 25.0Hypertensive heart disease (I11) 145 46 99 35.2 32.0 36.9Hypertensive heart and renal disease (I13) 35 13 22 8.5 9.0 8.2Ischaemic heart diseases (I20-I25) 6,784 3,044 3,740 1,645.4 2,114.9 1,393.6Acute myocardial infarction (I21-I22) 2,769 1,216 1,553 671.6 844.9 578.7Other acute ischaemic heart diseases (I24) 194 86 108 47.1 59.8 40.2Other forms of chronic ischaemic heart disease (I20, I25) 3,821 1,742 2,079 926.8 1,210.3 774.7Atherosclerotic cardiovascular disease, so described (I25.0) 191 85 106 46.3 59.1 39.5All other forms of chronic ischaemic heart disease (I20,
I25.1-I25.9) 3,630 1,657 1,973 880.4 1,151.3 735.2Other heart diseases (I26-I51) 2,645 988 1,657 641.5 686.4 617.4Acute and subacute endocarditis (I33) 5 1 4 1.2 0.7 1.5Diseases of pericardium and acute myocarditis (I30-I31, I40) 5 2 3 1.2 1.4 1.1Heart failure (I50) 1,058 416 642 256.6 289.0 239.2All other forms of heart disease (I26-I28, I34-I38, I42-I49,
I51) 1,577 569 1,008 382.5 395.3 375.6Essential hypertension and hypertensive renal disease (I10,
I12, I15) 375 126 249 91.0 87.5 92.8Cerebrovascular diseases (I60-I69) 3,269 1,189 2,080 792.9 826.1 775.1Atherosclerosis (I70) 202 79 123 49.0 54.9 45.8Other diseases of circulatory system (I71-I78) 503 246 257 122.0 170.9 95.8Aortic aneurysm and dissection (I71) 287 161 126 69.6 111.9 47.0Other diseases of arteries, arterioles and capillaries (I72-I78) 216 85 131 52.4 59.1 48.8Other disorders of circulatory system (I80-I99) 47 18 29 11.4 12.5 10.8Influenza and pneumonia (J09-J18) 1,224 562 662 296.9 390.5 246.7Influenza (J09-J11) 62 22 40 15.0 15.3 14.9Pneumonia (J12-J18) 1,162 540 622 281.8 375.2 231.8Other acute lower respiratory infections (J20-J22) 15 5 10 3.6 3.5 3.7Acute bronchitis and bronchiolitis (J20-J21) 11 3 8 2.7 2.1 3.0Unspecified acute lower respiratory infection (J22) 4 2 2 1.0 1.4 0.7Chronic lower respiratory diseases (J40-J47) 2,138 1,058 1,080 518.6 735.1 402.4Bronchitis, chronic and unspecified (J40-J42) 30 15 15 7.3 10.4 5.6Emphysema (J43) 90 53 37 21.8 36.8 13.8Asthma (J45-J46) 54 10 44 13.1 6.9 16.4Other chronic lower respiratory diseases (J44, J47) 1,964 980 984 476.4 680.9 366.7Pneumoconioses and chemical effects (J60-J66, J68) 12 10 2 2.9 6.9 0.7Pneumonitis due to solids and liquids (J69) 397 216 181 96.3 150.1 67.4Other diseases of respiratory system (J00-J06, J30-J39,
J67, J70-J98) 519 243 276 125.9 168.8 102.8Peptic ulcer (K25-K28) 66 27 39 16.0 18.8 14.5Diseases of appendix (K35-K38) 14 6 8 3.4 4.2 3.0Hernia (K40-K46) 67 31 36 16.3 21.5 13.4Chronic liver disease and cirrhosis (K70, K73-K74) 117 47 70 28.4 32.7 26.1Alcoholic liver disease (K70) 25 14 11 6.1 9.7 4.1Other chronic liver disease and cirrhosis (K73-K74) 92 33 59 22.3 22.9 22.0Cholelithiasis and other disorders of gallbladder (K80-K82) 90 35 55 21.8 24.3 20.5Nephritis, nephrotic syndrome and nephrosis (N00-N07,
N17-N19, N25-N27) 879 433 446 213.2 300.8 166.2Acute and rapidly progressive nephritic and nephrotic
syndrome (N00-N01, N04) 5 2 3 1.2 1.4 1.1Chronic glomerulonephritis, nephritis and nephropathy
not specified as acute or chronic, and renal sclerosisunspecified (N02-N03, N05-N07, N26) 42 19 23 10.2 13.2 8.6
Renal failure (N17-N19) 832 412 420 201.8 286.3 156.5Other disorders of kidney (N25, N27) 0 0 0 0.0 0.0 0.0Infections of kidney (N10-N12, N13.6, N15.1) 27 7 20 6.5 4.9 7.5Hyperplasia of prostate (N40) ... 21 ... ... 14.6 ...Inflammatory diseases of female pelvic organs (N70-N76) ... ... 0 ... ... 0.0Pregnancy, childbirth and the puerperium (O00-O99) ... ... 0 ... ... 0.0Pregnancy with abortive outcome (O00-O07) ... ... 0 ... ... 0.0Other complications of pregnancy, childbirth and the
puerperium (O10-O99) ... ... 0 ... ... 0.0Certain conditions originating in the perinatal period
(P00-P96) 0 0 0 0.0 0.0 0.0
See notes at the end of the table.
Statistics Canada – Catalogue no. 84F0209X 109

Mortality, Summary List of Causes – 2009
Table 2-19 – continued
Deaths and mortality rate, by selected grouped causes, age group at time of death and sex, Canada1 —85 to 89 years2,3,4,5
Number of deaths Age-specific mortality rate per 100,000 population 6
Bothsexes
Males Females Bothsexes
Males Females
Congenital malformations, deformations and chromosomalabnormalities (Q00-Q99) 10 2 8 2.4 1.4 3.0
Symptoms, signs and abnormal clinical and laboratoryfindings, not elsewhere classified (R00-R99) 259 77 182 62.8 53.5 67.8
All other diseases (residual) 11 5,640 2,041 3,599 1,367.9 1,418.1 1,341.1Accidents (unintentional injuries) (V01-X59, Y85-Y86) 1,314 543 771 318.7 377.3 287.3Transport accidents (V01-V99, Y85) 65 33 32 15.8 22.9 11.9Motor vehicle accidents 12 62 30 32 15.0 20.8 11.9Other land transport accidents 13 1 1 0 0.2 0.7 0.0Water, air and space, and other and unspecified transport
accidents and their sequelae (V90-V99, Y85) 2 2 0 0.5 1.4 0.0Nontransport accidents (W00-X59, Y86) 1,249 510 739 302.9 354.3 275.4Falls (W00-W19) 854 352 502 207.1 244.6 187.1Accidental discharge of firearms (W32-W34) 0 0 0 0.0 0.0 0.0Accidental drowning and submersion (W65-W74) 0 0 0 0.0 0.0 0.0Accidental exposure to smoke, fire and flames (X00-X09) 11 8 3 2.7 5.6 1.1Accidental poisoning and exposure to noxious substances
(X40-X49) 9 4 5 2.2 2.8 1.9Other and unspecified nontransport accidents and their
sequelae (W20-W31, W35-W64, W75-W99, X10-X39,X50-X59, Y86) 375 146 229 91.0 101.4 85.3
Intentional self-harm (suicide) (X60-X84, Y87.0) 54 44 10 13.1 30.6 3.7Intentional self-harm (suicide) by discharge of firearms
(X72-X74) 8 8 0 1.9 5.6 0.0Intentional self-harm (suicide) by other and unspecified
means and their sequelae (X60-X71, X75-X84, Y87.0) 46 36 10 11.2 25.0 3.7Assault (homicide) (X85-Y09, Y87.1) 4 4 0 1.0 2.8 0.0Assault (homicide) by discharge of firearms (X93-X95) 0 0 0 0.0 0.0 0.0Assault (homicide) by other and unspecified means and
their sequelae (X85-X92, X96-Y09, Y87.1) 4 4 0 1.0 2.8 0.0Legal intervention (Y35, Y89.0) 0 0 0 0.0 0.0 0.0Events of undetermined intent (Y10-Y34, Y87.2, Y89.9) 4 2 2 1.0 1.4 0.7Discharge of firearms, undetermined intent (Y22-Y24) 0 0 0 0.0 0.0 0.0Other and unspecified events of undetermined intent and
their sequelae (Y10-Y21, Y25-Y34, Y87.2, Y89.9) 4 2 2 1.0 1.4 0.7Operations of war and their sequelae (Y36, Y89.1) 0 0 0 0.0 0.0 0.0Complications of medical and surgical care (Y40-Y84, Y88) 34 16 18 8.2 11.1 6.7
1. The number of deaths in this table is based on the deceased’s usual place of residence.2. Age attained at the last birthday preceding death.3. For "Age at time of death, under 1 year", the mortality rate is based on live births in the calendar year.4. For "Age at time of death, 1 to 4 years", the mortality rate is based on population estimates for 0 to 4 year olds less live births in the calendar year.5. For "Age at time of death", each age group except "All ages", the mortality rate represents the age-specific death rate or the number of deaths in a particular age
group during a given year per 100,000 population in the same age group as of July 1 of the same year.6. Starting in 2005, the population estimates used to calculate the mortality rate are presented in the Appendix II of the publication "Mortality Summary List of
Causes" (catalogue number 84F0209XIE).7. The cause of death tabulated is the underlying cause of death. This is defined as (a) the disease or injury which initiated the train of events leading directly to
death, or (b) the circumstances of the accident or violence which produced the fatal injury. The underlying cause is selected from the conditions listed onthe medical certificate of cause of death.
8. World Health Organization (WHO), International Statistical Classification of Diseases and Related Health Problems, Tenth Revision (ICD-10)9. National Center for Health Statistics, United States. "B" list in "Instruction Manual; Part 9; ICD-10 Cause-of-Death Lists for Tabulating Mortality Statistics".10. Other and unspecified infectious and parasitic diseases, and their sequelae A00, A05, A20 to A36, A42 to A44, A48 to A49, A54 to A79, A81 to A82,
A85.0 to A85.1, A85.8, A86 to B04, B06 to B09, B25 to B49, B55 to B99.11. All other diseases (residual) D65 to E07, E15 to E34, E65 to F99, G04 to G12, G23 to G25, G31 to H93, K00 to K22, K29 to K31, K50 to K66, K71 to K72, K75 to
K76, K83 to M99, N13.0 to N13.5, N13.7 to N13.9, N14, N15.0, N15.8 to N15.9, N20 to N23, N28 to N39, N41 to N64, N80 to N98. As of 2003, also includes U04.12. Motor vehicle accidents V02 to V04, V09.0, V09.2, V12 to V14, V19.0 to V19.2, V19.4 to V19.6, V20 to V79, V80.3 to V80.5, V81.0 to V81.1, V82.0 to V82.1,
V83 to V86, V87.0 to V87.8, V88.0 to V88.8, V89.0, V89.2.13. Other land transport accidents V01, V05 to V06, V09.1, V09.3 to V09.9, V10 to V11, V15 to V18, V19.3, V19.8 to V19.9, V80.0 to V80.2, V80.6 to V80.9,
V81.2 to V81.9, V82.2 to V82.9, V87.9, V88.9, V89.1, V89.3, V89.9.Note(s): See Data quality, concepts and methodology — Explanatory notes for the tables section.Source(s): Statistics Canada, Canadian Vital Statistics, Birth and Death Databases (CANSIM table 102-0551) and Appendix II.
110 Statistics Canada – Catalogue no. 84F0209X

Mortality, Summary List of Causes – 2009
Table 2-20Deaths and mortality rate, by selected grouped causes, age group at time of death and sex, Canada1 — 90 yearsand over2,3,4,5
Number of deaths Age-specific mortality rate per 100,000 population 6
Bothsexes
Males Females Bothsexes
Males Females
Total, all causes of death (A00-Y89) 7 , 8 , 9 38,197 11,575 26,622 18,751.4 21,188.8 17,858.2
Salmonella infections (A01-A02) 0 0 0 0.0 0.0 0.0Shigellosis and amoebiasis (A03, A06) 0 0 0 0.0 0.0 0.0Certain other intestinal infections (A04, A07-A09) 337 97 240 165.4 177.6 161.0Tuberculosis (A16-A19) 5 3 2 2.5 5.5 1.3Respiratory tuberculosis (A16) 5 3 2 2.5 5.5 1.3Other tuberculosis (A17-A19) 0 0 0 0.0 0.0 0.0Whooping cough (A37) 0 0 0 0.0 0.0 0.0Scarlet fever and erysipelas (A38, A46) 0 0 0 0.0 0.0 0.0Meningococcal infection (A39) 1 1 0 0.5 1.8 0.0Septicaemia (A40-A41) 357 131 226 175.3 239.8 151.6Syphilis (A50-A53) 1 0 1 0.5 0.0 0.7Acute poliomyelitis (A80) 0 0 0 0.0 0.0 0.0Arthropod-borne viral encephalitis (A83-A84, A85.2) 0 0 0 0.0 0.0 0.0Measles (B05) 0 0 0 0.0 0.0 0.0Viral hepatitis (B15-B19) 7 2 5 3.4 3.7 3.4Human immunodeficiency virus [HIV] disease (B20-B24) 0 0 0 0.0 0.0 0.0Malaria (B50-B54) 0 0 0 0.0 0.0 0.0Other and unspecified infectious and parasitic diseases
and their sequelae 10 74 32 42 36.3 58.6 28.2Malignant neoplasms (C00-C97) 4,356 1,744 2,612 2,138.4 3,192.5 1,752.1Malignant neoplasms of lip, oral cavity and pharynx
(C00-C14) 54 18 36 26.5 33.0 24.1Malignant neoplasm of oesophagus (C15) 59 29 30 29.0 53.1 20.1Malignant neoplasm of stomach (C16) 108 43 65 53.0 78.7 43.6Malignant neoplasms of colon, rectum and anus (C18-C21) 686 211 475 336.8 386.2 318.6Malignant neoplasm of liver and intrahepatic bile ducts
(C22) 69 30 39 33.9 54.9 26.2Malignant neoplasm of pancreas (C25) 208 56 152 102.1 102.5 102.0Malignant neoplasm of larynx (C32) 19 14 5 9.3 25.6 3.4Malignant neoplasms of trachea, bronchus and lung
(C33-C34) 609 286 323 299.0 523.5 216.7Malignant melanoma of skin (C43) 43 12 31 21.1 22.0 20.8Malignant neoplasm of breast (C50) 383 4 379 188.0 7.3 254.2Malignant neoplasm of cervix uteri (C53) ... ... 10 ... ... 6.7Malignant neoplasms of corpus uteri and uterus, part
unspecified (C54-C55) ... ... 65 ... ... 43.6Malignant neoplasm of ovary (C56) ... ... 74 ... ... 49.6Malignant neoplasm of prostate (C61) ... 445 ... ... 814.6 ...Malignant neoplasms of kidney and renal pelvis (C64-C65) 97 40 57 47.6 73.2 38.2Malignant neoplasm of bladder (C67) 222 126 96 109.0 230.7 64.4Malignant neoplasms of meninges, brain and other parts
of central nervous system (C70-C72) 29 9 20 14.2 16.5 13.4Malignant neoplasms of lymphoid, haematopoietic and
related tissue (C81-C96) 366 137 229 179.7 250.8 153.6Hodgkin’s disease (C81) 3 1 2 1.5 1.8 1.3Non-Hodgkin’s lymphoma (C82-C85) 126 55 71 61.9 100.7 47.6Leukaemia (C91-C95) 180 60 120 88.4 109.8 80.5Multiple myeloma and immunoproliferative neoplasms
(C88, C90) 54 20 34 26.5 36.6 22.8Other and unspecified malignant neoplasms of lymphoid,
haematopoietic and related tissue (C96) 3 1 2 1.5 1.8 1.3All other and unspecified malignant neoplasms (C17,
C23-C24, C26-C31, C37-C41, C44-C49, C51-C52,C57-C60, C62-C63, C66, C68-C69, C73-C80, C97) 810 284 526 397.6 519.9 352.8
In situ neoplasms, benign neoplasms and neoplasms ofuncertain or unknown behaviour (D00-D48) 190 64 126 93.3 117.2 84.5
Anaemias (D50-D64) 153 47 106 75.1 86.0 71.1Diabetes mellitus (E10-E14) 861 286 575 422.7 523.5 385.7Nutritional deficiencies (E40-E64) 61 19 42 29.9 34.8 28.2Malnutrition (E40-E46) 52 15 37 25.5 27.5 24.8Other nutritional deficiencies (E50-E64) 9 4 5 4.4 7.3 3.4Meningitis (G00, G03) 1 0 1 0.5 0.0 0.7Parkinson’s disease (G20-G21) 279 126 153 137.0 230.7 102.6Alzheimer’s disease (G30) 2,078 397 1,681 1,020.1 726.7 1,127.6
See notes at the end of the table.
Statistics Canada – Catalogue no. 84F0209X 111

Mortality, Summary List of Causes – 2009
Table 2-20 – continued
Deaths and mortality rate, by selected grouped causes, age group at time of death and sex, Canada1 — 90 yearsand over2,3,4,5
Number of deaths Age-specific mortality rate per 100,000 population 6
Bothsexes
Males Females Bothsexes
Males Females
Major cardiovascular diseases (I00-I78) 14,919 4,294 10,625 7,323.9 7,860.4 7,127.3Diseases of heart (I00-I09, I11, I13, I20-I51) 10,418 3,134 7,284 5,114.3 5,737.0 4,886.2Acute rheumatic fever and chronic rheumatic heart
diseases (I00-I09) 45 13 32 22.1 23.8 21.5Hypertensive heart disease (I11) 227 40 187 111.4 73.2 125.4Hypertensive heart and renal disease (I13) 40 9 31 19.6 16.5 20.8Ischaemic heart diseases (I20-I25) 7,012 2,205 4,807 3,442.3 4,036.4 3,224.6Acute myocardial infarction (I21-I22) 2,490 806 1,684 1,222.4 1,475.4 1,129.6Other acute ischaemic heart diseases (I24) 234 77 157 114.9 141.0 105.3Other forms of chronic ischaemic heart disease (I20,
I25) 4,288 1,322 2,966 2,105.0 2,420.0 1,989.6Atherosclerotic cardiovascular disease, so described
(I25.0) 204 71 133 100.1 130.0 89.2All other forms of chronic ischaemic heart disease (I20,
I25.1-I25.9) 4,084 1,251 2,833 2,004.9 2,290.0 1,900.4Other heart diseases (I26-I51) 3,094 867 2,227 1,518.9 1,587.1 1,493.9Acute and subacute endocarditis (I33) 4 3 1 2.0 5.5 0.7Diseases of pericardium and acute myocarditis (I30-I31,
I40) 6 2 4 2.9 3.7 2.7Heart failure (I50) 1,482 403 1,079 727.5 737.7 723.8All other forms of heart disease (I26-I28, I34-I38, I42-I49,
I51) 1,602 459 1,143 786.4 840.2 766.7Essential hypertension and hypertensive renal disease
(I10, I12, I15) 517 115 402 253.8 210.5 269.7Cerebrovascular diseases (I60-I69) 3,315 840 2,475 1,627.4 1,537.7 1,660.2Atherosclerosis (I70) 274 50 224 134.5 91.5 150.3Other diseases of circulatory system (I71-I78) 395 155 240 193.9 283.7 161.0Aortic aneurysm and dissection (I71) 181 90 91 88.9 164.8 61.0Other diseases of arteries, arterioles and capillaries
(I72-I78) 214 65 149 105.1 119.0 100.0Other disorders of circulatory system (I80-I99) 46 12 34 22.6 22.0 22.8Influenza and pneumonia (J09-J18) 1,755 568 1,187 861.6 1,039.8 796.2Influenza (J09-J11) 69 27 42 33.9 49.4 28.2Pneumonia (J12-J18) 1,686 541 1,145 827.7 990.3 768.1Other acute lower respiratory infections (J20-J22) 30 7 23 14.7 12.8 15.4Acute bronchitis and bronchiolitis (J20-J21) 18 5 13 8.8 9.2 8.7Unspecified acute lower respiratory infection (J22) 12 2 10 5.9 3.7 6.7Chronic lower respiratory diseases (J40-J47) 1,733 711 1,022 850.8 1,301.5 685.6Bronchitis, chronic and unspecified (J40-J42) 39 14 25 19.1 25.6 16.8Emphysema (J43) 48 21 27 23.6 38.4 18.1Asthma (J45-J46) 48 13 35 23.6 23.8 23.5Other chronic lower respiratory diseases (J44, J47) 1,598 663 935 784.5 1,213.7 627.2Pneumoconioses and chemical effects (J60-J66, J68) 3 3 0 1.5 5.5 0.0Pneumonitis due to solids and liquids (J69) 450 162 288 220.9 296.6 193.2Other diseases of respiratory system (J00-J06, J30-J39,
J67, J70-J98) 351 124 227 172.3 227.0 152.3Peptic ulcer (K25-K28) 66 13 53 32.4 23.8 35.6Diseases of appendix (K35-K38) 7 2 5 3.4 3.7 3.4Hernia (K40-K46) 71 28 43 34.9 51.3 28.8Chronic liver disease and cirrhosis (K70, K73-K74) 37 15 22 18.2 27.5 14.8Alcoholic liver disease (K70) 4 4 0 2.0 7.3 0.0Other chronic liver disease and cirrhosis (K73-K74) 33 11 22 16.2 20.1 14.8Cholelithiasis and other disorders of gallbladder (K80-K82) 86 28 58 42.2 51.3 38.9Nephritis, nephrotic syndrome and nephrosis
(N00-N07, N17-N19, N25-N27) 812 276 536 398.6 505.2 359.6Acute and rapidly progressive nephritic and nephrotic
syndrome (N00-N01, N04) 2 1 1 1.0 1.8 0.7Chronic glomerulonephritis, nephritis and nephropathy
not specified as acute or chronic, and renal sclerosisunspecified (N02-N03, N05-N07, N26) 27 12 15 13.3 22.0 10.1
Renal failure (N17-N19) 783 263 520 384.4 481.4 348.8Other disorders of kidney (N25, N27) 0 0 0 0.0 0.0 0.0Infections of kidney (N10-N12, N13.6, N15.1) 27 9 18 13.3 16.5 12.1Hyperplasia of prostate (N40) ... 22 ... ... 40.3 ...Inflammatory diseases of female pelvic organs (N70-N76) ... ... 2 ... ... 1.3Pregnancy, childbirth and the puerperium (O00-O99) ... ... 0 ... ... 0.0
See notes at the end of the table.
112 Statistics Canada – Catalogue no. 84F0209X
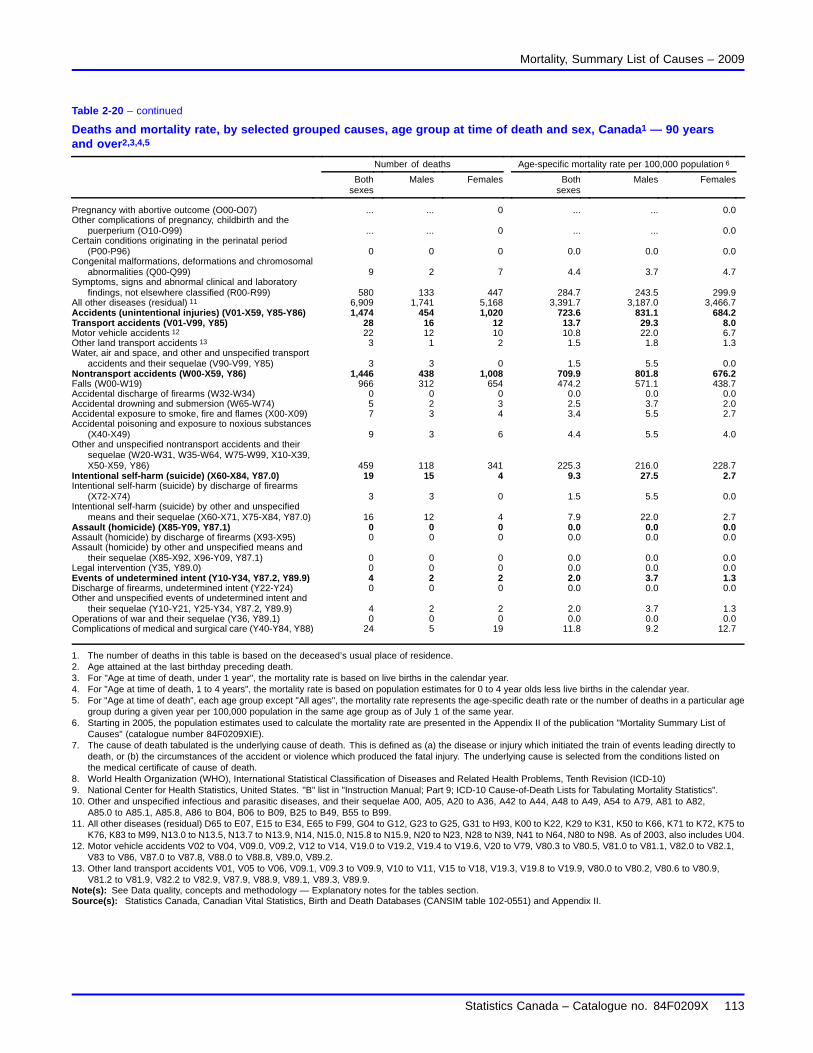
Mortality, Summary List of Causes – 2009
Table 2-20 – continued
Deaths and mortality rate, by selected grouped causes, age group at time of death and sex, Canada1 — 90 yearsand over2,3,4,5
Number of deaths Age-specific mortality rate per 100,000 population 6
Bothsexes
Males Females Bothsexes
Males Females
Pregnancy with abortive outcome (O00-O07) ... ... 0 ... ... 0.0Other complications of pregnancy, childbirth and the
puerperium (O10-O99) ... ... 0 ... ... 0.0Certain conditions originating in the perinatal period
(P00-P96) 0 0 0 0.0 0.0 0.0Congenital malformations, deformations and chromosomal
abnormalities (Q00-Q99) 9 2 7 4.4 3.7 4.7Symptoms, signs and abnormal clinical and laboratory
findings, not elsewhere classified (R00-R99) 580 133 447 284.7 243.5 299.9All other diseases (residual) 11 6,909 1,741 5,168 3,391.7 3,187.0 3,466.7Accidents (unintentional injuries) (V01-X59, Y85-Y86) 1,474 454 1,020 723.6 831.1 684.2Transport accidents (V01-V99, Y85) 28 16 12 13.7 29.3 8.0Motor vehicle accidents 12 22 12 10 10.8 22.0 6.7Other land transport accidents 13 3 1 2 1.5 1.8 1.3Water, air and space, and other and unspecified transport
accidents and their sequelae (V90-V99, Y85) 3 3 0 1.5 5.5 0.0Nontransport accidents (W00-X59, Y86) 1,446 438 1,008 709.9 801.8 676.2Falls (W00-W19) 966 312 654 474.2 571.1 438.7Accidental discharge of firearms (W32-W34) 0 0 0 0.0 0.0 0.0Accidental drowning and submersion (W65-W74) 5 2 3 2.5 3.7 2.0Accidental exposure to smoke, fire and flames (X00-X09) 7 3 4 3.4 5.5 2.7Accidental poisoning and exposure to noxious substances
(X40-X49) 9 3 6 4.4 5.5 4.0Other and unspecified nontransport accidents and their
sequelae (W20-W31, W35-W64, W75-W99, X10-X39,X50-X59, Y86) 459 118 341 225.3 216.0 228.7
Intentional self-harm (suicide) (X60-X84, Y87.0) 19 15 4 9.3 27.5 2.7Intentional self-harm (suicide) by discharge of firearms
(X72-X74) 3 3 0 1.5 5.5 0.0Intentional self-harm (suicide) by other and unspecified
means and their sequelae (X60-X71, X75-X84, Y87.0) 16 12 4 7.9 22.0 2.7Assault (homicide) (X85-Y09, Y87.1) 0 0 0 0.0 0.0 0.0Assault (homicide) by discharge of firearms (X93-X95) 0 0 0 0.0 0.0 0.0Assault (homicide) by other and unspecified means and
their sequelae (X85-X92, X96-Y09, Y87.1) 0 0 0 0.0 0.0 0.0Legal intervention (Y35, Y89.0) 0 0 0 0.0 0.0 0.0Events of undetermined intent (Y10-Y34, Y87.2, Y89.9) 4 2 2 2.0 3.7 1.3Discharge of firearms, undetermined intent (Y22-Y24) 0 0 0 0.0 0.0 0.0Other and unspecified events of undetermined intent and
their sequelae (Y10-Y21, Y25-Y34, Y87.2, Y89.9) 4 2 2 2.0 3.7 1.3Operations of war and their sequelae (Y36, Y89.1) 0 0 0 0.0 0.0 0.0Complications of medical and surgical care (Y40-Y84, Y88) 24 5 19 11.8 9.2 12.7
1. The number of deaths in this table is based on the deceased’s usual place of residence.2. Age attained at the last birthday preceding death.3. For "Age at time of death, under 1 year", the mortality rate is based on live births in the calendar year.4. For "Age at time of death, 1 to 4 years", the mortality rate is based on population estimates for 0 to 4 year olds less live births in the calendar year.5. For "Age at time of death", each age group except "All ages", the mortality rate represents the age-specific death rate or the number of deaths in a particular age
group during a given year per 100,000 population in the same age group as of July 1 of the same year.6. Starting in 2005, the population estimates used to calculate the mortality rate are presented in the Appendix II of the publication "Mortality Summary List of
Causes" (catalogue number 84F0209XIE).7. The cause of death tabulated is the underlying cause of death. This is defined as (a) the disease or injury which initiated the train of events leading directly to
death, or (b) the circumstances of the accident or violence which produced the fatal injury. The underlying cause is selected from the conditions listed onthe medical certificate of cause of death.
8. World Health Organization (WHO), International Statistical Classification of Diseases and Related Health Problems, Tenth Revision (ICD-10)9. National Center for Health Statistics, United States. "B" list in "Instruction Manual; Part 9; ICD-10 Cause-of-Death Lists for Tabulating Mortality Statistics".10. Other and unspecified infectious and parasitic diseases, and their sequelae A00, A05, A20 to A36, A42 to A44, A48 to A49, A54 to A79, A81 to A82,
A85.0 to A85.1, A85.8, A86 to B04, B06 to B09, B25 to B49, B55 to B99.11. All other diseases (residual) D65 to E07, E15 to E34, E65 to F99, G04 to G12, G23 to G25, G31 to H93, K00 to K22, K29 to K31, K50 to K66, K71 to K72, K75 to
K76, K83 to M99, N13.0 to N13.5, N13.7 to N13.9, N14, N15.0, N15.8 to N15.9, N20 to N23, N28 to N39, N41 to N64, N80 to N98. As of 2003, also includes U04.12. Motor vehicle accidents V02 to V04, V09.0, V09.2, V12 to V14, V19.0 to V19.2, V19.4 to V19.6, V20 to V79, V80.3 to V80.5, V81.0 to V81.1, V82.0 to V82.1,
V83 to V86, V87.0 to V87.8, V88.0 to V88.8, V89.0, V89.2.13. Other land transport accidents V01, V05 to V06, V09.1, V09.3 to V09.9, V10 to V11, V15 to V18, V19.3, V19.8 to V19.9, V80.0 to V80.2, V80.6 to V80.9,
V81.2 to V81.9, V82.2 to V82.9, V87.9, V88.9, V89.1, V89.3, V89.9.Note(s): See Data quality, concepts and methodology — Explanatory notes for the tables section.Source(s): Statistics Canada, Canadian Vital Statistics, Birth and Death Databases (CANSIM table 102-0551) and Appendix II.
Statistics Canada – Catalogue no. 84F0209X 113
Definitions
The definitions used for the production of statistical tables of Canadian vital statistics data are based on thoserecommended by the World Health Organization1 and the United Nations.2
Age. Age attained at the last birthday preceding death. In the case of infant deaths, the completed number ofmonths (or minutes, hours, or days) since birth.
Cause of death. The cause of death coded and tabulated is the underlying cause of death. This is defined as “(a)the disease or injury which initiated the train of morbid events leading directly to death, or (b) the circumstances ofthe accident or violence which produced the fatal injury”. This underlying cause of death is selected from a numberof conditions listed on the medical certificate of cause of death.
Beginning in the year 2000 in Canada, causes of death and stillbirth are coded to the 10th revision of the World HealthOrganization’s International Statistical Classification of Diseases and Related Health Problems (ICD-10). Theprevious revision, ICD-93 was used in Canada for the classification of cause of death and stillbirth from 1979 to 1999.
Death. The permanent disappearance of all evidence of life at any time after a live birth has taken place. Stillbirthsare excluded from death statistics unless otherwise indicated.
• Infant death. Death of a child under one year of age.
Death rates
• Age-specific death rate: The number of deaths in a particular age group during a given yearper 100,000 population in the same age group as of July 1 of the same year.
• Age-standardized death rate: Age-standardization removes the effects of differences in the age structureof populations among areas and over time. Age-standardized death rates show the number of deathsper 100,000 population that would have occurred in a given area if the age structure of the population of thatarea was the same as the age structure of a specified standard population.
The formula for an age-standardized death rate r is:
ii i
i wpdr
=
=20
1
where,
For age group i:
di is the age-sex-specific death count for a particular cause of death for a given year and geographical area,
pi is the age-sex-specific population estimate for July 1 of the same year and geographical area, and
wi is the weight for that age group in a standard population. The 1991 Canadian Census of Population, is used asthe standard population for the calculation of age-standardized death rates. This standard population and calculatedweights are shown in Text table 1. Note that the same weight is used for each sex.
To yield a rate per 100,000 population, r is multiplied by 100,000.
1. World Health Organization (WHO). International Statistical Classification of Diseases and Related Health Problems, Tenth Revision, Volumes 1 and 2(ICD-10). Geneva, 1992.
2. United Nations. Principles and Recommendations for a Vital Statistics System. Statistical Papers, Series M, No. 19, Rev. 1. New York, 1974.3. World Health Organization (WHO). International Classification of Diseases, 1975 Revision, Volume 1 (ICD-9). Geneva, 1977.
114 Statistics Canada – Catalogue no. 84F0209X

Mortality, Summary List of Causes – 2009
Text table 1Standardized-population by age group, Canada, July 1, 1991 (both sexes)
Groupi
Agein
years
Standardpopulation
Weightw
1 under 1 403,061 0.01432 1 to 4 1,550,285 0.05513 5 to 9 1,953,045 0.06954 10 to 14 1,913,115 0.06805 15 to 19 1,926,090 0.06856 20 to 24 2,109,452 0.07507 25 to 29 2,529,239 0.08998 30 to 34 2,598,289 0.09249 35 to 39 2,344,872 0.083410 40 to 44 2,138,891 0.076111 45 to 49 1,674,153 0.059512 50 to 54 1,339,902 0.047613 55 to 59 1,238,441 0.044014 60 to 64 1,190,217 0.042315 65 to 69 1,084,588 0.038616 70 to 74 834,024 0.029717 75 to 79 622,221 0.022118 80 to 84 382,303 0.013619 85 to 89 192,410 0.006820 90 and over 95,467 0.0034Total … 28,120,065 1.0000
• Crude death rate: The number of deaths during a given year per 100,000 population as of July 1 of the sameyear.
• Infant death rate: The number of infant deaths during a given year per 1,000 live births in the same year.
Delivery. A delivery may consist of one or more live born or stillborn fetuses. The number of deliveries in a givenperiod will be equal to or less than the total number of births because a multiple birth (twins, triplets or higher-ordermultiple births) is counted as a single delivery.
Gestational age. The interval, in completed weeks, between the first day of the mother’s last menstrual periodand the day of delivery (that is, the duration of pregnancy). It can also be an estimate of that interval, basedon ultrasound, a physical examination, or other method. Canadian birth registration documents do not specifyhow the gestational age was calculated. Pre-term refers to a period of gestation under 37 completed weeks;term, 37 through 41 completed weeks; and post-term, 42 or more completed weeks.
ICD-10 codes. The International Statistical Classification of Diseases and Related Health Problems (ICD)codes, 10th Revision, were established by the World Health Organization in 1992. The ICD-10 manual assignscodes to specific diseases, injuries and causes of death.
Live birth. The complete expulsion or extraction from its mother of a product of conception, irrespective of theduration of the pregnancy, which, after such separation, breathes or shows any other evidence of life, such asbeating of the heart, pulsation of the umbilical cord, or definite movement of voluntary muscles, whether or not theumbilical cord has been cut or the placenta is attached.
Population. Persons whose usual place of residence is somewhere in Canada, including Canadian governmentemployees stationed abroad and their families, members of the Canadian Forces stationed abroad and their families,crews of Canadian merchant vessels, and non-permanent residents of Canada.
Mid-year (July 1) population estimates are used to calculate the rates in vital statistics publications (see tablefootnotes). Population estimates are frequently revised by Statistics Canada’s Demography Division.
Provinces and territories. Unless otherwise stated, the geographic distribution of deaths in the tables of thispublication is based on the deceased’s usual place of residence.
Statistics Canada – Catalogue no. 84F0209X 115

Mortality, Summary List of Causes – 2009
Nunavut came into being officially as a Territory of Canada on April 1, 1999. The name Northwest Territories appliesto a Territory with different geographic boundaries before and after April 1, 1999.
Deaths and stillbirths of residents of Nunavut which took place before April 1, 1999 are included with deaths andstillbirths of residents of the Northwest Territories. Deaths and stillbirths which took place on or after April 1, 1999 aretabulated separately for residents of Nunavut.
116 Statistics Canada – Catalogue no. 84F0209X

Explanatory notes for the tables
Table 1— Deaths and mortality rate, by selected grouped causes, sex and geography
Death refers to the permanent disappearance of all evidence of life at any time after a live birth has taken place.Stillbirths are excluded.
Counts in this table exclude deaths of non-residents of Canada.
Missing data on sex of the deceased were imputed based on death registration number.
Table 2— Deaths and mortality rate, by selected grouped causes, age group at time of death and sex, Canada
Death refers to the permanent disappearance of all evidence of life at any time after a live birth has taken place.Stillbirths are excluded.
Counts in this table exclude deaths of non-residents of Canada.
Missing data on sex of the deceased were imputed based on death registration number.
Statistics Canada – Catalogue no. 84F0209X 117
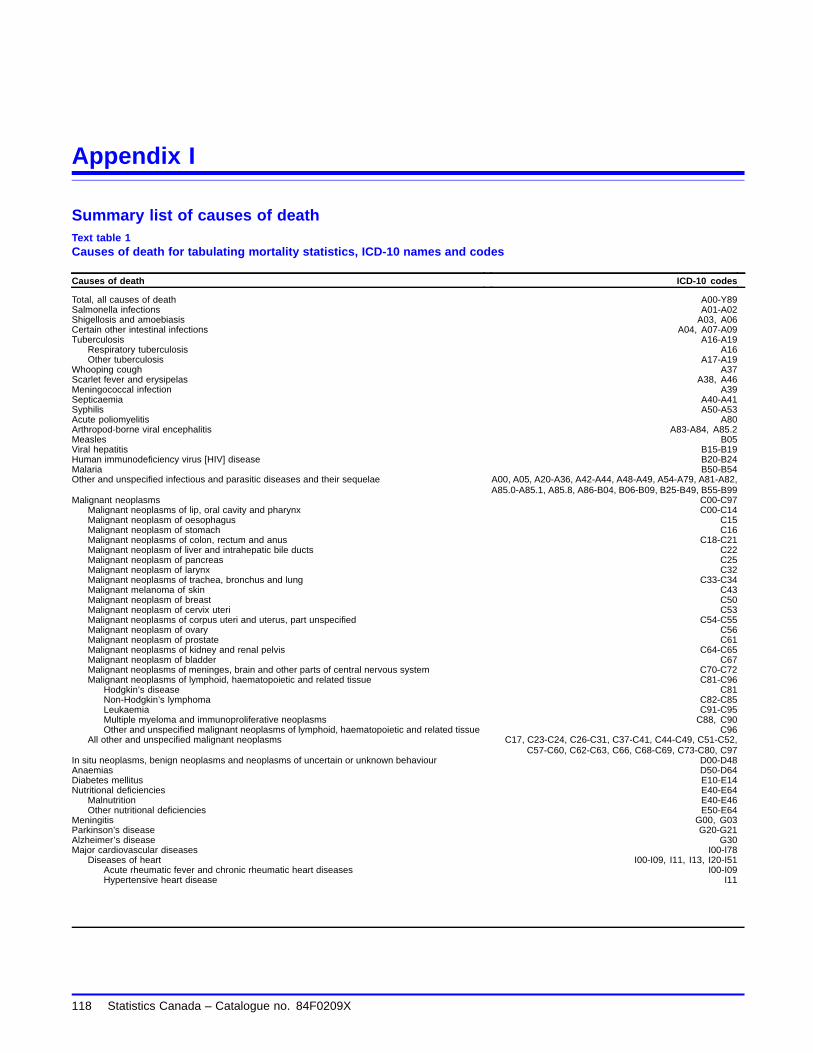
Appendix I
Summary list of causes of deathText table 1Causes of death for tabulating mortality statistics, ICD-10 names and codes
Causes of death ICD-10 codes
Total, all causes of death A00-Y89Salmonella infections A01-A02Shigellosis and amoebiasis A03, A06Certain other intestinal infections A04, A07-A09Tuberculosis A16-A19
Respiratory tuberculosis A16Other tuberculosis A17-A19
Whooping cough A37Scarlet fever and erysipelas A38, A46Meningococcal infection A39Septicaemia A40-A41Syphilis A50-A53Acute poliomyelitis A80Arthropod-borne viral encephalitis A83-A84, A85.2Measles B05Viral hepatitis B15-B19Human immunodeficiency virus [HIV] disease B20-B24Malaria B50-B54Other and unspecified infectious and parasitic diseases and their sequelae A00, A05, A20-A36, A42-A44, A48-A49, A54-A79, A81-A82,
A85.0-A85.1, A85.8, A86-B04, B06-B09, B25-B49, B55-B99Malignant neoplasms C00-C97
Malignant neoplasms of lip, oral cavity and pharynx C00-C14Malignant neoplasm of oesophagus C15Malignant neoplasm of stomach C16Malignant neoplasms of colon, rectum and anus C18-C21Malignant neoplasm of liver and intrahepatic bile ducts C22Malignant neoplasm of pancreas C25Malignant neoplasm of larynx C32Malignant neoplasms of trachea, bronchus and lung C33-C34Malignant melanoma of skin C43Malignant neoplasm of breast C50Malignant neoplasm of cervix uteri C53Malignant neoplasms of corpus uteri and uterus, part unspecified C54-C55Malignant neoplasm of ovary C56Malignant neoplasm of prostate C61Malignant neoplasms of kidney and renal pelvis C64-C65Malignant neoplasm of bladder C67Malignant neoplasms of meninges, brain and other parts of central nervous system C70-C72Malignant neoplasms of lymphoid, haematopoietic and related tissue C81-C96
Hodgkin’s disease C81Non-Hodgkin’s lymphoma C82-C85Leukaemia C91-C95Multiple myeloma and immunoproliferative neoplasms C88, C90Other and unspecified malignant neoplasms of lymphoid, haematopoietic and related tissue C96
All other and unspecified malignant neoplasms C17, C23-C24, C26-C31, C37-C41, C44-C49, C51-C52,C57-C60, C62-C63, C66, C68-C69, C73-C80, C97
In situ neoplasms, benign neoplasms and neoplasms of uncertain or unknown behaviour D00-D48Anaemias D50-D64Diabetes mellitus E10-E14Nutritional deficiencies E40-E64
Malnutrition E40-E46Other nutritional deficiencies E50-E64
Meningitis G00, G03Parkinson’s disease G20-G21Alzheimer’s disease G30Major cardiovascular diseases I00-I78
Diseases of heart I00-I09, I11, I13, I20-I51Acute rheumatic fever and chronic rheumatic heart diseases I00-I09Hypertensive heart disease I11
118 Statistics Canada – Catalogue no. 84F0209X

Mortality, Summary List of Causes – 2009
Text table 1 – continued
Causes of death for tabulating mortality statistics, ICD-10 names and codes
Causes of death ICD-10 codes
Hypertensive heart and renal disease I13Ischaemic heart diseases I20-I25
Acute myocardial infarction I21-I22Other acute ischaemic heart diseases I24Other forms of chronic ischaemic heart disease I20, I25
Atherosclerotic cardiovascular disease, so described I25.0All other forms of chronic ischaemic heart disease I20, I25.1-I25.9
Other heart diseases I26-I51Acute and subacute endocarditis I33Diseases of pericardium and acute myocarditis I30-I31, I40Heart failure I50All other forms of heart disease I26-I28, I34-I38, I42-I49, I51
Essential hypertension and hypertensive renal disease I10, I12, I15Cerebrovascular diseases I60-I69Atherosclerosis I70Other diseases of circulatory system I71-I78
Aortic aneurysm and dissection I71Other diseases of arteries, arterioles and capillaries I72-I78
Other disorders of circulatory system I80-I99Influenza and pneumonia J09-J18
Influenza J09-J11Pneumonia J12-J18
Other acute lower respiratory infections J20-J22Acute bronchitis and bronchiolitis J20-J21Unspecified acute lower respiratory infection J22
Chronic lower respiratory diseases J40-J47Bronchitis, chronic and unspecified J40-J42Emphysema J43Asthma J45-J46Other chronic lower respiratory diseases J44, J47
Pneumoconioses and chemical effects J60-J66, J68Pneumonitis due to solids and liquids J69Other diseases of respiratory system J00-J06, J30-J39, J67, J70-J98Peptic ulcer K25-K28Diseases of appendix K35-K38Hernia K40-K46Chronic liver disease and cirrhosis K70, K73-K74
Alcoholic liver disease K70Other chronic liver disease and cirrhosis K73-K74
Cholelithiasis and other disorders of gallbladder K80-K82Nephritis, nephrotic syndrome and nephrosis N00-N07, N17-N19, N25-N27
Acute and rapidly progressive nephritic and nephrotic syndrome N00-N01, N04Chronic glomerulonephritis, nephritis and nephropathy not specified as acute or chronic, and
renal sclerosis unspecified N02-N03, N05-N07, N26Renal failure N17-N19Other disorders of kidney N25, N27
Infections of kidney N10-N12, N13.6, N15.1Hyperplasia of prostate N40Inflammatory diseases of female pelvic organs N70-N76Pregnancy, childbirth and the puerperium O00-O99
Pregnancy with abortive outcome O00-O07Other complications of pregnancy, childbirth and the puerperium O10-O99
Certain conditions originating in the perinatal period P00-P96Congenital malformations, deformations and chromosomal abnormalities Q00-Q99Symptoms, signs and abnormal clinical and laboratory findings, not elsewhere classified R00-R99All other diseases (residual) D65-E07, E15-E34, E65-F99, G04-G12, G23-G25, G31-H93,
K00-K22, K29-K31, K50-K66, K71-K72, K75-K76, K83-M99,N13.0-N13.5, N13.7-N13.9, N14, N15.0, N15.8-N15.9,
N20-N23, N28-N39, N41-N64, N80-N98, U04Accidents (unintentional injuries) V01-X59, Y85-Y86
Transport accidents V01-V99, Y85Motor vehicle accidents V02-V04, V09.0, V09.2, V12-V14, V19.0-V19.2, V19.4-V19.6,
V20-V79, V80.3-V80.5, V81.0-V81.1, V82.0-V82.1, V83-V86,V87.0-V87.8, V88.0-V88.8, V89.0, V89.2
Other land transport accidents V01, V05-V06, V09.1, V09.3-V09.9, V10-V11, V15-V18,V19.3, V19.8-V19.9, V80.0-V80.2, V80.6-V80.9, V81.2-V81.9,
V82.2-V82.9, V87.9, V88.9, V89.1, V89.3, V89.9Water, air and space, and other and unspecified transport accidents and their sequelae V90-V99, Y85
Nontransport accidents W00-X59, Y86Falls W00-W19Accidental discharge of firearms W32-W34Accidental drowning and submersion W65-W74
Statistics Canada – Catalogue no. 84F0209X 119

Mortality, Summary List of Causes – 2009
Text table 1 – continued
Causes of death for tabulating mortality statistics, ICD-10 names and codes
Causes of death ICD-10 codes
Accidental exposure to smoke, fire and flames X00-X09Accidental poisoning and exposure to noxious substances X40-X49Other and unspecified nontransport accidents and their sequelae W20-W31, W35-W64, W75-W99, X10-X39, X50-X59, Y86
Intentional self-harm (suicide) X60-X84, Y87.0Intentional self-harm (suicide) by discharge of firearms X72-X74Intentional self-harm (suicide) by other and unspecified means and their sequelae X60-X71, X75-X84, Y87.0
Assault (homicide) X85-Y09, Y87.1Assault (homicide) by discharge of firearms X93-X95Assault (homicide) by other and unspecified means and their sequelae X85-X92, X96-Y09, Y87.1
Legal intervention Y35, Y89.0Events of undetermined intent Y10-Y34, Y87.2, Y89.9
Discharge of firearms, undetermined intent Y22-Y24Other and unspecified events of undetermined intent and their sequelae Y10-Y21, Y25-Y34, Y87.2, Y89.9
Operations of war and their sequelae Y36, Y89.1Complications of medical and surgical care Y40-Y84, Y88
Note(s): World Health Organization (WHO), International Statistical Classification of Diseases and Related Health Problems, Tenth Revision (ICD-10)Source(s): National Center for Health Statistics, United States. "B" list in "Instruction Manual; Part 9; ICD-10 Cause-of-Death Lists for Tabulating Mortality
Statistics".
120 Statistics Canada – Catalogue no. 84F0209X
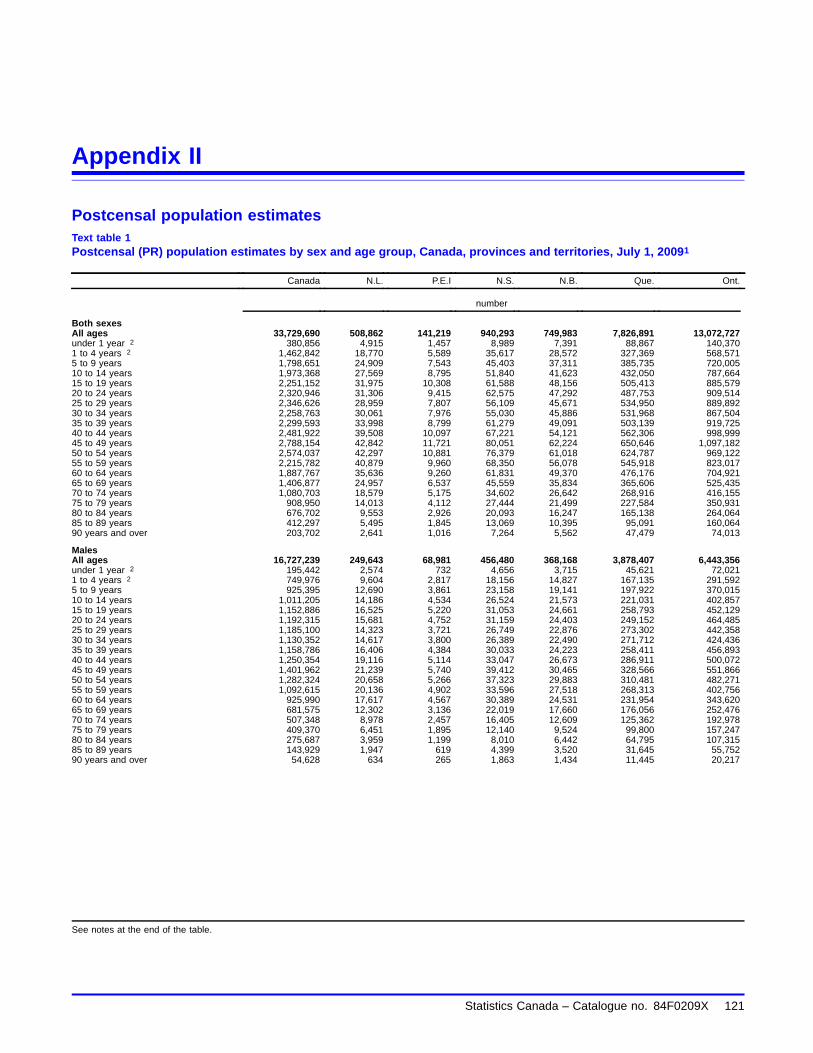
Appendix II
Postcensal population estimatesText table 1Postcensal (PR) population estimates by sex and age group, Canada, provinces and territories, July 1, 20091
Canada N.L. P.E.I N.S. N.B. Que. Ont.
number
Both sexesAll ages 33,729,690 508,862 141,219 940,293 749,983 7,826,891 13,072,727under 1 year 2 380,856 4,915 1,457 8,989 7,391 88,867 140,3701 to 4 years 2 1,462,842 18,770 5,589 35,617 28,572 327,369 568,5715 to 9 years 1,798,651 24,909 7,543 45,403 37,311 385,735 720,00510 to 14 years 1,973,368 27,569 8,795 51,840 41,623 432,050 787,66415 to 19 years 2,251,152 31,975 10,308 61,588 48,156 505,413 885,57920 to 24 years 2,320,946 31,306 9,415 62,575 47,292 487,753 909,51425 to 29 years 2,346,626 28,959 7,807 56,109 45,671 534,950 889,89230 to 34 years 2,258,763 30,061 7,976 55,030 45,886 531,968 867,50435 to 39 years 2,299,593 33,998 8,799 61,279 49,091 503,139 919,72540 to 44 years 2,481,922 39,508 10,097 67,221 54,121 562,306 998,99945 to 49 years 2,788,154 42,842 11,721 80,051 62,224 650,646 1,097,18250 to 54 years 2,574,037 42,297 10,881 76,379 61,018 624,787 969,12255 to 59 years 2,215,782 40,879 9,960 68,350 56,078 545,918 823,01760 to 64 years 1,887,767 35,636 9,260 61,831 49,370 476,176 704,92165 to 69 years 1,406,877 24,957 6,537 45,559 35,834 365,606 525,43570 to 74 years 1,080,703 18,579 5,175 34,602 26,642 268,916 416,15575 to 79 years 908,950 14,013 4,112 27,444 21,499 227,584 350,93180 to 84 years 676,702 9,553 2,926 20,093 16,247 165,138 264,06485 to 89 years 412,297 5,495 1,845 13,069 10,395 95,091 160,06490 years and over 203,702 2,641 1,016 7,264 5,562 47,479 74,013
MalesAll ages 16,727,239 249,643 68,981 456,480 368,168 3,878,407 6,443,356under 1 year 2 195,442 2,574 732 4,656 3,715 45,621 72,0211 to 4 years 2 749,976 9,604 2,817 18,156 14,827 167,135 291,5925 to 9 years 925,395 12,690 3,861 23,158 19,141 197,922 370,01510 to 14 years 1,011,205 14,186 4,534 26,524 21,573 221,031 402,85715 to 19 years 1,152,886 16,525 5,220 31,053 24,661 258,793 452,12920 to 24 years 1,192,315 15,681 4,752 31,159 24,403 249,152 464,48525 to 29 years 1,185,100 14,323 3,721 26,749 22,876 273,302 442,35830 to 34 years 1,130,352 14,617 3,800 26,389 22,490 271,712 424,43635 to 39 years 1,158,786 16,406 4,384 30,033 24,223 258,411 456,89340 to 44 years 1,250,354 19,116 5,114 33,047 26,673 286,911 500,07245 to 49 years 1,401,962 21,239 5,740 39,412 30,465 328,566 551,86650 to 54 years 1,282,324 20,658 5,266 37,323 29,883 310,481 482,27155 to 59 years 1,092,615 20,136 4,902 33,596 27,518 268,313 402,75660 to 64 years 925,990 17,617 4,567 30,389 24,531 231,954 343,62065 to 69 years 681,575 12,302 3,136 22,019 17,660 176,056 252,47670 to 74 years 507,348 8,978 2,457 16,405 12,609 125,362 192,97875 to 79 years 409,370 6,451 1,895 12,140 9,524 99,800 157,24780 to 84 years 275,687 3,959 1,199 8,010 6,442 64,795 107,31585 to 89 years 143,929 1,947 619 4,399 3,520 31,645 55,75290 years and over 54,628 634 265 1,863 1,434 11,445 20,217
See notes at the end of the table.
Statistics Canada – Catalogue no. 84F0209X 121

Mortality, Summary List of Causes – 2009
Text table 1 – continued
Postcensal (PR) population estimates by sex and age group, Canada, provinces and territories, July 1, 20091
Canada N.L. P.E.I N.S. N.B. Que. Ont.
number
FemalesTotal 17,002,451 259,219 72,238 483,813 381,815 3,948,484 6,629,371under 1 year 2 185,414 2,341 725 4,333 3,676 43,246 68,3491 to 4 years 2 712,866 9,166 2,772 17,461 13,745 160,234 276,9795 to 9 years 873,256 12,219 3,682 22,245 18,170 187,813 349,99010 to 14 years 962,163 13,383 4,261 25,316 20,050 211,019 384,80715 to 19 years 1,098,266 15,450 5,088 30,535 23,495 246,620 433,45020 to 24 years 1,128,631 15,625 4,663 31,416 22,889 238,601 445,02925 to 29 years 1,161,526 14,636 4,086 29,360 22,795 261,648 447,53430 to 34 years 1,128,411 15,444 4,176 28,641 23,396 260,256 443,06835 to 39 years 1,140,807 17,592 4,415 31,246 24,868 244,728 462,83240 to 44 years 1,231,568 20,392 4,983 34,174 27,448 275,395 498,92745 to 49 years 1,386,192 21,603 5,981 40,639 31,759 322,080 545,31650 to 54 years 1,291,713 21,639 5,615 39,056 31,135 314,306 486,85155 to 59 years 1,123,167 20,743 5,058 34,754 28,560 277,605 420,26160 to 64 years 961,777 18,019 4,693 31,442 24,839 244,222 361,30165 to 69 years 725,302 12,655 3,401 23,540 18,174 189,550 272,95970 to 74 years 573,355 9,601 2,718 18,197 14,033 143,554 223,17775 to 79 years 499,580 7,562 2,217 15,304 11,975 127,784 193,68480 to 84 years 401,015 5,594 1,727 12,083 9,805 100,343 156,74985 to 89 years 268,368 3,548 1,226 8,670 6,875 63,446 104,31290 years and over 149,074 2,007 751 5,401 4,128 36,034 53,796
See notes at the end of the table.
122 Statistics Canada – Catalogue no. 84F0209X

Mortality, Summary List of Causes – 2009
Text table 1 – continued
Postcensal (PR) population estimates by sex and age group, Canada, provinces and territories, July 1, 20091
Canada Man. Sask. Alta. B.C. Y.T. N.W.T. Nvt.
number
Both sexesAll ages 33,729,690 1,219,183 1,029,325 3,671,699 4,459,947 33,683 43,638 32,240under 1 year 2 380,856 15,940 14,241 51,722 44,993 383 711 8771 to 4 years 2 1,462,842 59,195 51,558 185,900 174,813 1,497 2,674 2,7175 to 9 years 1,798,651 74,373 62,307 212,477 220,130 1,953 3,090 3,41510 to 14 years 1,973,368 80,819 66,818 221,134 246,610 2,019 3,077 3,35015 to 19 years 2,251,152 89,506 75,779 246,899 286,632 2,297 3,762 3,25820 to 24 years 2,320,946 86,743 76,188 287,624 313,691 2,342 3,505 2,99825 to 29 years 2,346,626 82,847 71,374 309,092 311,200 2,180 3,847 2,69830 to 34 years 2,258,763 77,672 64,349 283,138 286,943 2,258 3,577 2,40135 to 39 years 2,299,593 78,136 59,996 273,659 303,695 2,545 3,314 2,21740 to 44 years 2,481,922 81,438 64,355 268,094 327,781 2,644 3,183 2,17545 to 49 years 2,788,154 94,315 77,931 294,460 368,130 3,314 3,508 1,83050 to 54 years 2,574,037 88,721 75,923 270,352 346,986 3,035 3,059 1,47755 to 59 years 2,215,782 76,853 64,393 214,864 309,309 2,578 2,475 1,10860 to 64 years 1,887,767 64,192 52,135 167,271 262,692 1,940 1,597 74665 to 69 years 1,406,877 47,068 39,698 117,779 195,943 1,127 875 45970 to 74 years 1,080,703 36,510 33,186 88,806 150,659 684 533 25675 to 79 years 908,950 32,160 29,816 74,880 125,466 480 413 15280 to 84 years 676,702 25,691 24,206 54,078 94,172 216 258 6085 to 89 years 412,297 17,450 15,784 32,758 60,051 134 130 3190 years and over 203,702 9,554 9,288 16,712 30,051 57 50 15
MalesAll ages 16,727,239 606,757 511,385 1,875,669 2,211,954 17,228 22,541 16,670under 1 year 2 195,442 8,089 7,236 26,552 23,231 204 375 4361 to 4 years 2 749,976 30,412 26,336 95,288 90,245 808 1,348 1,4085 to 9 years 925,395 38,289 32,010 110,101 113,909 1,038 1,460 1,80110 to 14 years 1,011,205 41,549 34,221 113,382 127,099 980 1,566 1,70315 to 19 years 1,152,886 45,612 38,966 126,885 148,164 1,224 1,983 1,67120 to 24 years 1,192,315 44,619 39,287 151,221 162,950 1,215 1,840 1,55125 to 29 years 1,185,100 42,394 35,950 163,452 155,683 1,112 1,880 1,30030 to 34 years 1,130,352 39,248 32,235 149,381 141,872 1,065 1,838 1,26935 to 39 years 1,158,786 39,592 30,242 143,774 150,661 1,222 1,806 1,13940 to 44 years 1,250,354 41,222 32,409 139,098 162,734 1,260 1,611 1,08745 to 49 years 1,401,962 47,955 38,962 150,626 182,710 1,627 1,814 98050 to 54 years 1,282,324 45,261 37,910 138,858 170,393 1,644 1,554 82255 to 59 years 1,092,615 38,108 32,534 109,289 152,108 1,386 1,360 60960 to 64 years 925,990 31,607 25,999 83,867 129,478 1,025 948 38865 to 69 years 681,575 22,808 19,377 58,038 96,349 644 483 22770 to 74 years 507,348 16,897 15,718 42,115 73,047 367 269 14675 to 79 years 409,370 14,303 13,521 34,505 59,447 237 214 8680 to 84 years 275,687 10,313 10,188 22,801 40,415 100 124 2685 to 89 years 143,929 5,867 5,691 11,835 22,534 54 49 1790 years and over 54,628 2,612 2,593 4,601 8,925 16 19 4
FemalesAll ages 17,002,451 612,426 517,940 1,796,030 2,247,993 16,455 21,097 15,570under 1 year 2 185,414 7,851 7,005 25,170 21,762 179 336 4411 to 4 years 2 712,866 28,783 25,222 90,612 84,568 689 1,326 1,3095 to 9 years 873,256 36,084 30,297 102,376 106,221 915 1,630 1,61410 to 14 years 962,163 39,270 32,597 107,752 119,511 1,039 1,511 1,64715 to 19 years 1,098,266 43,894 36,813 120,014 138,468 1,073 1,779 1,58720 to 24 years 1,128,631 42,124 36,901 136,403 150,741 1,127 1,665 1,44725 to 29 years 1,161,526 40,453 35,424 145,640 155,517 1,068 1,967 1,39830 to 34 years 1,128,411 38,424 32,114 133,757 145,071 1,193 1,739 1,13235 to 39 years 1,140,807 38,544 29,754 129,885 153,034 1,323 1,508 1,07840 to 44 years 1,231,568 40,216 31,946 128,996 165,047 1,384 1,572 1,08845 to 49 years 1,386,192 46,360 38,969 143,834 185,420 1,687 1,694 85050 to 54 years 1,291,713 43,460 38,013 131,494 176,593 1,391 1,505 65555 to 59 years 1,123,167 38,745 31,859 105,575 157,201 1,192 1,115 49960 to 64 years 961,777 32,585 26,136 83,404 133,214 915 649 35865 to 69 years 725,302 24,260 20,321 59,741 99,594 483 392 23270 to 74 years 573,355 19,613 17,468 46,691 77,612 317 264 11075 to 79 years 499,580 17,857 16,295 40,375 66,019 243 199 6680 to 84 years 401,015 15,378 14,018 31,277 53,757 116 134 3485 to 89 years 268,368 11,583 10,093 20,923 37,517 80 81 1490 years and over 149,074 6,942 6,695 12,111 21,126 41 31 11
1. These postcensal population estimates, which are based on the 2006 census, are adjusted for net census undercoverage and include non-permanent residents.2. 2009 population counts for the "under 1 year" and "1 to 4 years" categories were adjusted for 2009 births by Health Statistics Division.Note(s): PR = updated postcensal.Source(s): Statistics Canada, Demography Division (CANSIM table 051-0001 released on September 27, 2011) and Health Statistics Division.
Statistics Canada – Catalogue no. 84F0209X 123


