Mortality Granger-Causality · Data Collection Exercise (Asia-Pacific ... – 34 papers used APAC...
44
Mortality Granger-Causality Andreas Milidonis Insurance Risk & Finance Research Centre Nanyang Technological University & University of Cyprus September 2014 Longevity 10 Conference Santiago, Chile Maria Efthymiou University of Cyprus
Transcript of Mortality Granger-Causality · Data Collection Exercise (Asia-Pacific ... – 34 papers used APAC...

Mortality Granger-Causality
Andreas Milidonis Insurance Risk & Finance Research Centre
Nanyang Technological University & University of Cyprus
September 2014 Longevity 10 Conference
Santiago, Chile
Maria Efthymiou University of Cyprus

Outline of Presentation
1. Motivation. 2. Data Collection Exercise (Asia-Pacific). 3. Methodology. 4. Descriptive Statistics. 5. Results. 6. Why Longevity Risk Transfer makes sense? 7. Conclusion.
2
1. Motivation
• Emerging countries may be lagging behind increases in longevity risk compared to more developed countries.
• However, they may be lagging in predictable ways. Granger causality can reveal such lead-lag relationships.
• Bivariate Granger-causality allows us to establish predictive
relationships between pairs of time-series data.
• Predictive relationships established through Granger-causality analysis on mortality time-series data, could provide incentives for risk sharing opportunities.
• These incentives will emerge through the direction of the predictability established (positive/negative). 3

1. Motivation
• We focus on an unexplored geographic region in terms of mortality/longevity risk: Asia-Pacific (APAC).
• APAC has ample heterogeneity across countries (but also within countries: Biffis, Lin and Milidonis (2014)).
• Analysis conducted on APAC and Western countries.
• High Insurance growth and low penetration in APAC, provides longevity risk sharing opportunities.
4

2. Data Collection Exercise: Target Countries in APAC
5
Country Yes Less Least
Australia/New
Zealand MelanesiaEastern
Asia
South-Central
Asia
South-Eastern
AsiaAustralia √ √Bangladesh √ √
China √ √Hong Kong √ √India √ √Indonesia √ √Japan √ √Laos √ √Malaysia √ √Myanmar √ √Nepal √ √
DEVELOPED REGION

2. Data Collection Exercise: Target Countries in APAC
6
Country Yes Less Least
Australia/New
Zealand MelanesiaEastern
Asia
South-Central
Asia
South-Eastern
AsiaNew Zealand √ √Pakistan √ √Papua New Guinea
√ √
Philippines √ √South Korea √ √Singapore √ √Sri Lanka √ √Taiwan √ √Thailand √ √Vietnam √ √
DEVELOPED REGION
2. Data Collection Exercise
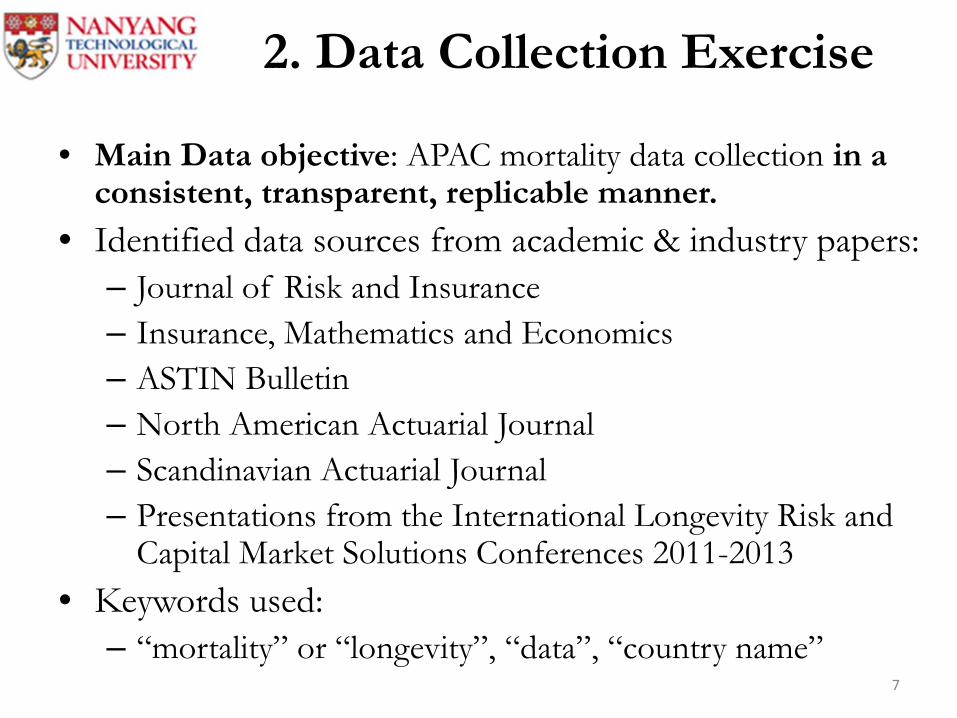
• Main Data objective: APAC mortality data collection in a consistent, transparent, replicable manner.
• Identified data sources from academic & industry papers: – Journal of Risk and Insurance – Insurance, Mathematics and Economics – ASTIN Bulletin – North American Actuarial Journal – Scandinavian Actuarial Journal – Presentations from the International Longevity Risk and
Capital Market Solutions Conferences 2011-2013 • Keywords used:
– “mortality” or “longevity”, “data”, “country name” 7

2. Data Collection Exercise: Mortality Data Sources
• A bit over 200 papers/presentations identified. – 74 papers used APAC data – 34 papers used APAC data that were not on HMD and HLT. – APAC data (non-HMD non-HLT) used: not available.
• Main data sources (additional to HMD and HLT) – Department of Statistics, – Ministry of Health, – Statistical Yearbooks, Censuses (for each country) – Sample registration system (SRS) – India – World Bank
8

• Other data sources: – Vital Registration systems – Population studies journal – Measure DHS (Demographic and health surveys) – Global Health Data Exchange – World Health Organisation (WHO) – CEIC database – International Database on Longevity (IDL) – Datastream – OECD
9
2. Data Collection Exercise: Mortality Data Sources

2. Data Collection Exercise: Output
• Resulted in 2 databases, and two separate projects:
1. Asia-Pacific Aggregate (APA) Mortality Database • Milidonis and Efthymiou, 2014
2. Asia-Pacific Age-Gender (APAG) Mortality Database • Biffis, Lin & Milidonis, 2014
• Both databases freely available for future research from the Insurance Risk & Finance Research Centre, Nanyang Business School, NTU.
10

3. Methodology - APA
• Mortality data (death rates) are not stationary. • Hence a transformation is needed. • To obtain stationarity we use
– First difference:
– Log of ratio of mortality rates:
11
1−− tt CDRCDR
( )1log −tt CDRCDR

3. Methodology: Lead-Lag Bivariate Granger Causality • : logarithmic change in mortality of country A, on year t. • : logarithmic change in mortality of country B, on year t. Do lagged changes in B help predict current changes in A? (1) (2)
∆𝐴𝑡 = 𝑐1 + ∑ 𝑎𝑘 ∆𝐴𝑡−𝑘 + 𝑔𝑡5𝑘=1
∆𝐴𝑡 = 𝑐2 + ∑ 𝑎𝑘 ∆𝐴𝑡−𝑘5𝑘=1 + ∑ 𝑏𝑘∆𝐵𝑡−𝑘5
𝑘=1 + 𝑔𝑡
12
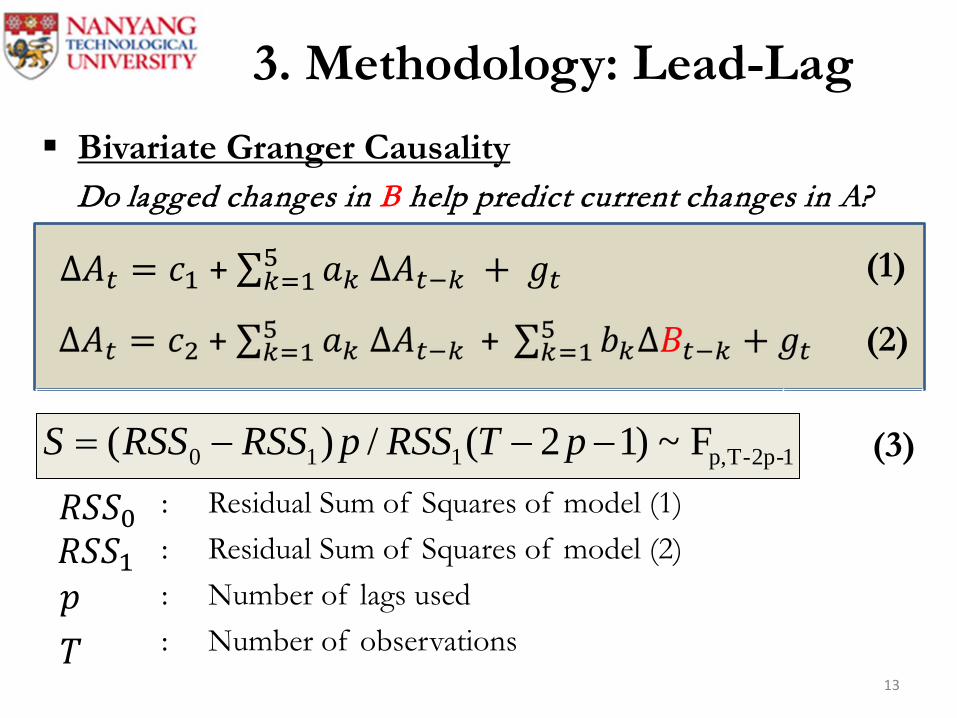
Bivariate Granger Causality Do lagged changes in B help predict current changes in A? : Residual Sum of Squares of model (1) : Residual Sum of Squares of model (2) : Number of lags used : Number of observations
3. Methodology: Lead-Lag
∆𝐴𝑡 = 𝑐1 + ∑ 𝑎𝑘 ∆𝐴𝑡−𝑘 + 𝑔𝑡5𝑘=1
13
(3)
𝑅𝑅𝑅0 𝑅𝑅𝑅1 𝑝 𝑇
(1)
(2)
1-2p-Tp,110 F~)12(/)( −−−= pTRSSpRSSRSSS

Bivariate Granger Causality – Reverse Relation Do lagged changes in A help predict current changes in B? : Residual Sum of Squares of model (4) : Residual Sum of Squares of model (5) : Number of lags used : Number of observations
3. Methodology: Lead-Lag
∆𝐵𝑡 = 𝑐1 + ∑ 𝑎𝑘 ∆𝐵𝑡−𝑘 + 𝑔𝑡5𝑘=1
∆𝐵𝑡 = 𝑐2 + ∑ 𝑎𝑘 ∆𝐵𝑡−𝑘5𝑘=1 + ∑ 𝑏𝑘∆𝐴𝑡−𝑘5
𝑘=1 + 𝑔𝑡
14
(6)
𝑅𝑅𝑅0 𝑅𝑅𝑅1 𝑝 𝑇
(4)
(5)
1-2p-Tp,110 F~)12(/)( −−−= pTRSSpRSSRSSS

• Aggregate Population mortality. • Crude death rates. • Target: largest 21 APAC countries. • Data identified and collected on 11 countries. • Annual frequency. • Earliest year in the sample: 1896 (Japan). • Analysis focused on 1950 onwards. *We also use one age group from APAG (males age 60) as an example for age-specific analysis (back-up slides).
4. Descriptive Statistics: APA Mortality Database
15
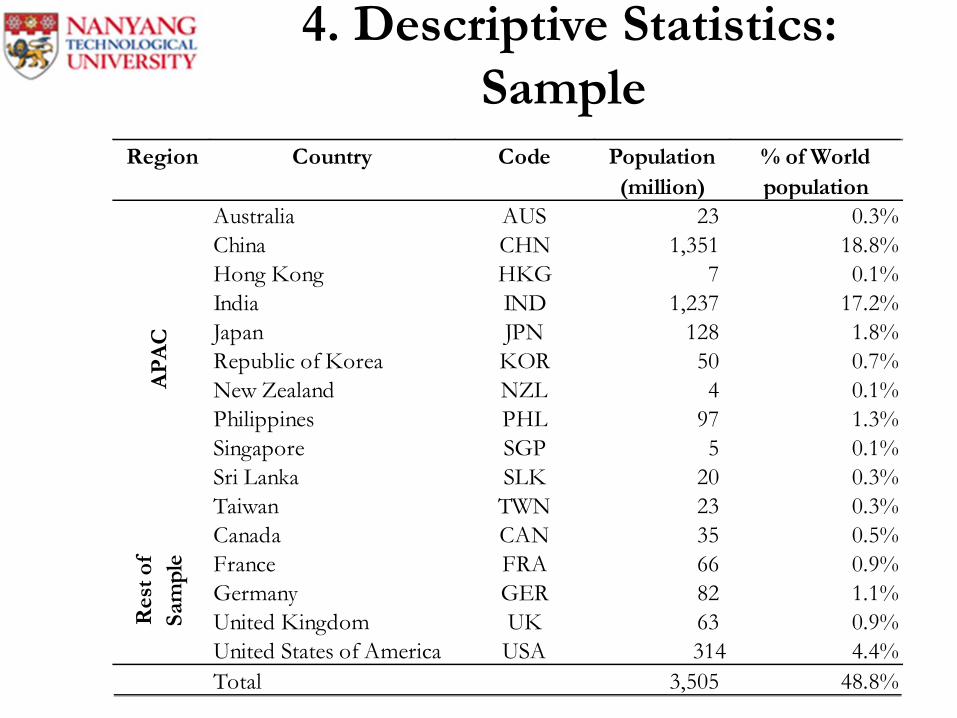
4. Descriptive Statistics: Sample
16
Region Country Code Population (million)
% of World population
Australia AUS 23 0.3%China CHN 1,351 18.8%Hong Kong HKG 7 0.1%India IND 1,237 17.2%Japan JPN 128 1.8%Republic of Korea KOR 50 0.7%New Zealand NZL 4 0.1%Philippines PHL 97 1.3%Singapore SGP 5 0.1%Sri Lanka SLK 20 0.3%Taiwan TWN 23 0.3%Canada CAN 35 0.5%France FRA 66 0.9%Germany GER 82 1.1%United Kingdom UK 63 0.9%United States of America USA 314 4.4%Total 3,505 48.8%
APA
CR
est o
f Sa
mpl
e

4. Descriptive Statistics: APA Mortality Database
17

4. Mortality Indices-APA (1890 - 2012)
18

19
4. Mortality Indices-APA (1950 - 2012)

4. Log Mortality Returns - APA
20

4. Spearman Correlations – APA
21 Statistical Significance denoted at 5% (shaded).
CAN CHN FRA GER HKG IND JPN KOR NZL PHL SGP SLK TWN UK USA
AUS 0.17 0.03 -0.19 -0.15 0.05 -0.05 -0.06 0.08 0.26 -0.05 0.19 0.14 -0.01 -0.01 -0.06
CAN 0.219 0.268 0.265 0.015 -0.09 0.438 0.034 0.24 0.057 0.162 0.254 0.358 0.389 0.471
CHN -0.08 0.09 -0.01 -0.10 0.20 0.31 -0.05 0.16 -0.07 0.29 0.21 -0.16 -0.04
FRA 0.64 -0.03 0.04 0.32 0.06 -0.18 0.19 -0.04 0.03 0.13 0.38 0.41
GER -0.01 -0.21 0.28 0.11 -0.02 0.13 0.07 -0.03 0.04 0.26 0.48
HKG 0.04 0.22 0.02 0.02 0.24 0.09 0.01 0.34 0.17 0.10
IND 0.16 -0.22 0.00 0.13 0.11 0.27 0.12 -0.19 0.03
JPN 0.30 0.08 0.20 0.16 -0.02 0.50 -0.08 0.39
KOR -0.10 -0.02 0.01 -0.14 0.28 -0.20 -0.05
NZL 0.11 0.28 0.11 0.17 0.16 0.29
PHL 0.25 0.29 0.17 0.04 0.22
SGP 0.08 0.37 0.03 0.14
SLK 0.22 0.05 0.13
TWN -0.12 0.21
UK 0.40

5. Results
22
Granger-Causality (APA)
Examples

5. Granger-Causality (APA) Country B predicts Country A
23

5. Granger-Causality (APA) Country A predicts Country B
24

5. Granger-Causality (APA) Country B predicts Country A
25

5. Granger-Causality (APA) Country A predicts Country B
26

5. Granger-Causality (APA) Example: Taiwan predicts Korea
27
Est P Est P Est P Est P
KOR TWN Intercept -0.02 0.01 -0.02 0.01 -0.03 0.01 -0.03 0.01
KOR TWN KOR-1st lag -0.23 0.11 -0.28 0.06 -0.34 0.04 -0.32 0.05
KOR TWN TWN-1st lag 0.58 0.05 0.36 0.24 0.36 0.25 0.55 0.08
KOR TWN KOR-2nd lag 0.04 0.78 -0.05 0.76 0.08 0.64
KOR TWN TWN-2nd lag 0.71 0.02 0.74 0.02 0.76 0.01
KOR TWN KOR-3rd lag -0.17 0.27 -0.11 0.47
KOR TWN TWN-3rd lag 0.44 0.16 0.60 0.06
KOR TWN KOR-4th lag -0.09 0.52
KOR TWN TWN-4th lag -0.71 0.03
Variable4 LAGS1 LAG 2 LAGS 3 LAGS
A B
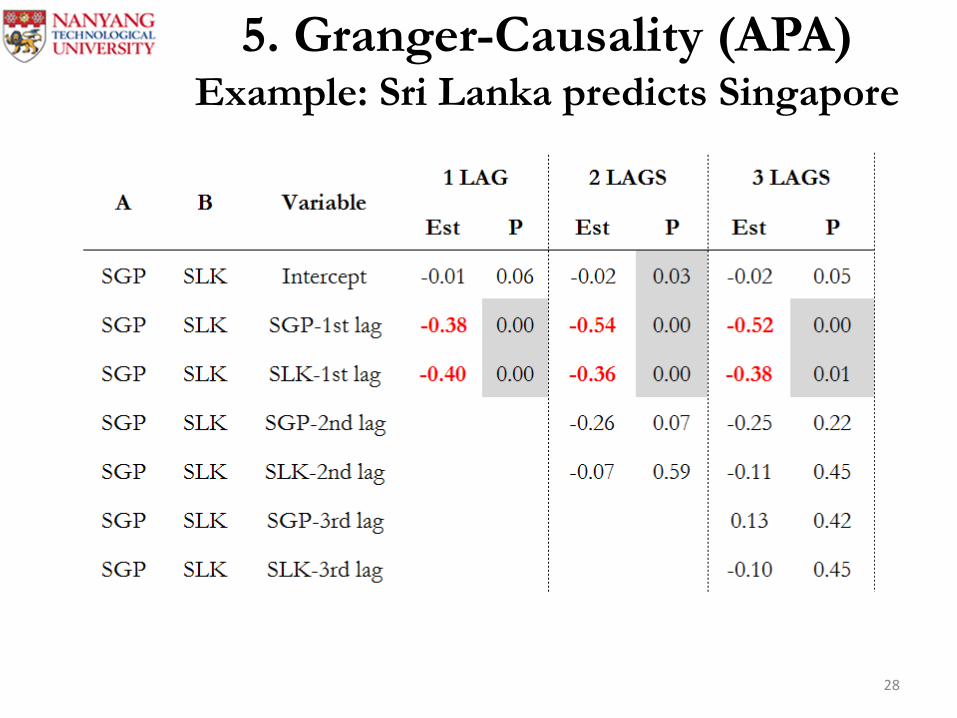
5. Granger-Causality (APA) Example: Sri Lanka predicts Singapore
28

Results show predictability from Country A to B. • Risk-increasing cases: Positive parameter estimates
– Use the predictability for forecasting Country B’s exposures
• Risk-decreasing cases: Negative parameter estimates – Assume: pension plan in countries A and B. – Hence set up a forward contract on A’ mortality index – A has incentive to go short on A’s mortality index. – B has incentive to go long on A’s mortality index.
6. Why does Longevity Risk Transfer make sense?
29

• Intuitive Example: – Countries A and B want to hedge pension liability risk.
– Forward contract on A’s mortality index, one year ahead.
– Hence, A and B agree at time t about a trade at time (t+1).
– B promises at t to buy (long) the index at agreed price q(t+1).
– A promises at t to sell (short) the index at agreed price q(t+1).
– A’s q(t+1) predicts B’s q(t+2) with a negative coefficient.
6. Why does Longevity Risk Transfer make sense?
30

• Intuitive Example:
6. Why does Longevity Risk Transfer make sense?
31

6. Why does Longevity Risk Transfer make sense?
32
A's Index Instrument B (long) A (short)
Up Pensions: More at (t+2) Less at (t+1)
Forward: Gain Loss
Down Pensions: Less at (t+2) More at (t+1)
Forward: Loss Gain
For simplicity we assume 0% interest.

• We use Granger-causality analysis in a multi-population setting.
• Data collection on APAC mortality resulted in a rich, unique dataset of 11 countries.
• Analysis conducted in relation to other western countries.
• Identified significant predictability relationships among pairs of countries.
• Proposed longevity risk forward contracts based predictability relationships established.
7. Conclusion
33

Andreas Milidonis, Ph.D. Senior Research Fellow Insurance Risk & Finance Research Centre (IRFRC) Division of Banking & Finance, Nanyang Business School, Nanyang Technological University. Tel: (65) 6790-6261 Fax: (65) 6791-3236 Email: [email protected]
Feedback welcome:
34

Back-up Slides
35

2nd Database: APAG Mortality Database
For ease of reference the following color representations are used:
HMD
HLT
Bureau of Statistics
Censuses
Ministry of Health
Sample registration system (India)
36
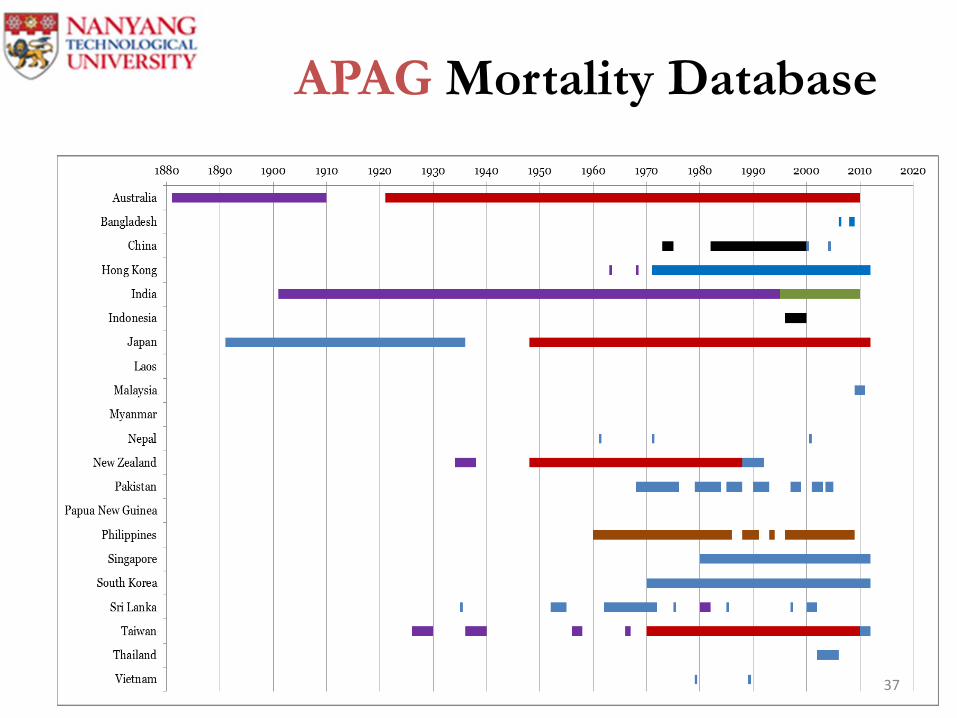
APAG Mortality Database
37

Mortality Indices-APAG (1950 - 2012) Males 60-64
38

Methodology - APAG
• To obtain stationarity we use – First difference:
– Log of ratio of mortality rates:
– Exception of South Korea (2nd difference)
( )1log −tt qq
1−− tt qq
39
( ) ( ) ( )21 loglog2log −− +− ttt qqq

Log Mortality Returns* - APAG
40
*

Spearman Correlations – APAG
41 Statistical Significance denoted at 5% (shaded).
CAN FRA HKG JPN KOR NZL PHL SGP TWN UK USA
AUS 0.412 -0.015 -0.121 -0.012 -0.09 0.348 0.231 -0.129 -0.139 0.164 0.407
CAN 0.005 0.025 -0.007 -0.109 0.232 -0.01 -0.293 -0.102 0.116 0.343
FRA -0.064 0.212 0.136 0.021 -0.039 0.318 -0.073 0.497 0.308
HKG 0.299 0.24 -0.277 0.084 0.121 -0.071 0.386 0.083
JPN 0.005 -0.072 0.224 -0.041 0.509 0.12 0.353
KOR 0.034 -0.329 0.163 0.166 0.027 -0.064
NZL -0.11 0.063 0.053 0.308 0.115
PHL -0.126 -0.003 -0.163 0.047
SGP 0.143 0.02 -0.009
TWN -0.113 0.162
UK 0.437

Granger-Causality (APAG) Country B predicts Country A
42

Granger-Causality (APAG) Country A predicts Country B
43

Parameter estimates – APAG Example: USA predicts Canada
44