MORPHOLOGY AND MECHANICAL PROPERTIES OF NYLON=NITRIK...
22
MORPHOLOGY AND MECHANICAL PROPERTIES OF NYLON=NITRIK RUBBER BLENDS Nyh-nitride rubber Mends havin~ fierent plasticmbber mponent ratios {IOO'ct, WO,?(K30,6Qi40, fjOi50, 40/60,30170,20180 and 01100) were prepared by melt mixing technique in a Rheacord-90 at a temperature set at 1WC. The mixi charact@cs of the blends have been analvsed frm ihe rheographs. The momhoiagy d he blend was studied using opdical and electron d changer; l r ~ ~ ~ mc , in rnecha deb such I pecial reference to tj f blend ratio. The micrapphs indicate ~se t ~mponent having b rtions was found to d'iperse in the ma,@ IUS phase. A ~(xontinuom morphob was LWEI vvu for 3/50 composition. MeWil properlies ot the blends have ken measured awrtfing to standard test methods. The eff& d blend ratio on the mechanid propaties like tensile strength, tear strength, elongation at. braak, stress-strain 'oehaviow and hardness has been anatysed. The influence of the drain rate on the mechanical pperbes has abo been amlysed. The mechanid pmprbes were fmd to haw a s2rolilg dependence on the amount af nylon in tbe blend. It is f d &at the b W with proportions of rtyton haw swrim mechanical mdes. ah4 p~operties are explained on the ba morpholq bnd, V? as kes, PamBel, HaipiiTsai, and Cc, 3fjtions hav ?d $a 8 oith; b e been usc Results of this chapter have been published in 3. Appl. Polym. PSci,61,2383 (1996) 6
Transcript of MORPHOLOGY AND MECHANICAL PROPERTIES OF NYLON=NITRIK...
MORPHOLOGY AND MECHANICAL PROPERTIES OF NYLON=NITRIK RUBBER BLENDS
Nyh-nitride rubber Mends havin~ fierent plasticmbber mponent ratios {IOO'ct, WO,?(K30,6Qi40, fjOi50, 40/60,30170,20180 and 01100) were prepared by melt mixing
technique in a Rheacord-90 at a temperature set at 1WC. The m i x i charact@cs of the blends have been analvsed frm ihe rheographs. The momhoiagy d he blend was studied using opdical and electron
d changer; l r ~ ~ ~ mc
, in rnecha deb such
I pecial reference to tj f blend ratio. The micrapphs indicate ~se t ~mponent having b rtions was found to d'iperse in the ma,@ IUS
phase. A ~(xontinuom morphob was LWEI vvu for 3/50 composition. M e W i l properlies ot the blends have ken measured awrtfing to standard test methods. The eff& d blend ratio on the
mechanid propaties like tensile strength, tear strength, elongation at. braak, stress-strain 'oehaviow and hardness has been anatysed. The influence of the drain rate on the mechanical pperbes has abo been amlysed. The mechanid pmprbes were fmd to haw a s2rolilg dependence on the amount af nylon in tbe blend. It is f d &at the b W with proportions of rtyton haw swrim mechanical m d e s .
ah4 p~operties are explained on the ba morpholq bnd, V? as k e s , PamBel, HaipiiTsai, and Cc, 3fjtions hav ?d $a
8 oith; b e been usc
Results of this chapter have been published in 3. Appl. Polym. PSci,61,2383 (1996) 6
Morphology muiMechicalPmpeMes OfNylm-Nihile Rubber Blends 61
3.1. Introduction
T he thermoplastic elastomers from rubber-plastic blends are such
materials which combine the excellent processing characteristics of the
thermoplastic mabrials at high temperature and a wide range of physical
properties of elastomera at service? temperature.'" Thermoplastic elastomeric
materials are reprocessable and studies on this material are highly important
due to their improved propel-ties, easy processability and economic
advantages.
Two critical parameters for the toughening of polyarnides are
dispersed particle size and the interfacial adhesion. It has been shown that
polyamide-rubber blends require a particle size less than 1 pm to accomplish
super toughness.69 Borgreve et a1.'"13 reported that the impact behaviour of
the rubber modified nylon depends on the type of modifier and their particle
size. Coran and Patel14-'8 have published a series of articles on rubber-
thermoplastic blends correlating the physical properties of the blend with
fundamental characteristics of thc! elastomer and thermoplastic components.
Blending of nylon with NIbile rubber produces a new class of material
having excellent oil resistance, ozone resistance, good toughness and
mechanical properties. It has teen r e p ~ r t e d ~ ~ ~ l by many authors that the
properties of polymer blends depend on their morphology. Morphology of
different polymer blends has been studied by various researchers.22-31 The
strong influence of the morpholcgy on the properties of the resulting polymer
Morpholog~ mtdMechrmcdPmperh~ ofNylwcNitrle Rubber B l e d 62
blends have been reported.20,31~32 Baer found mechanical and dynamic
properties to be mainly dependent cln the particle size."
In this chapter, the mechanical properties of nylon-nitrile rubber
blends having various proporhons of nylon and nitrile rubber prepared by
melt blending technique are reported. Attempts have been made to correlate
the blend morphology with the mechanical properties. The influence of
blend composition on morphology and mechanical properties has been
analysed. Finally, various theonztical models have been used to fit the
experimental mechanical data.
3.2. Results and discussion
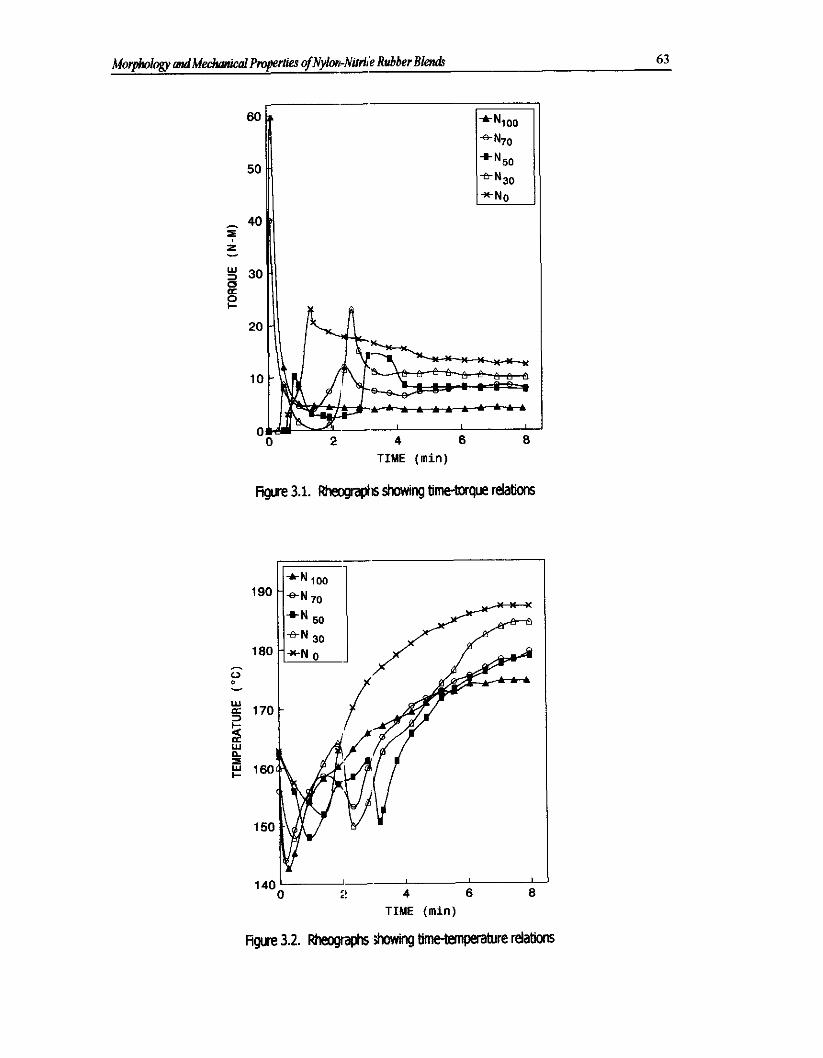
The processing charactcrisbcs of the blend have been studied from the
Rheocord-90 time-torque, time-temperature curves which are shown in
Figures 3.1 and 3.2. The time-to~gue curves for all blends have two peaks.
The first peak is associated with increase in viscosity as a result of the
introduction of unmolten nylon. The viscosity then decreases, showing the
complete melting of nylon. Upon the addition of NBR into nylon, the
viscosity again increases which corresponds to the second peak. The curves
thereafter come down showing the complete melting of the second phase and
finally curves level off to give un~form torque values at the end of the mixing
cycle. The uniform torque value is an indication of good level of mixing of
the two components. The exlent of mixing is an important criteria for
immiscible blends, since the final properties of the blend depend on the
mixing time and extent of mixin5 The torque values of the blend in general
(after the addition of NBR) in'zreases as the NBR content increases. The
equilibrium mixing torque is metximum for NBR and is the lowest for nylon.
The blends show intermediate behaviour. This is attributed to the high melt
viscosity of the NBR component compared to nylon.
Morphologv odMecha&al PmperrieJ ofhyImNiniIIe - Rubber Bl& 63
TIME (min)
3.1. -a shovnng time-toque rel*
140 0 :! 4 6 8
TIME ( m i n )
~ g w e 3.2. Rheographs hoWKlg time-temperature relations
Mwphology mdMechmcol Propertla ofNy1on-Niii,lile Rubber B l e d 64
Figure 3.2 shows the time-temperature mixing curves of the various
nylon/NBR blends. The temperature decreases first due to the introduction
of plastic into the chamber then increases showing the melting of the plastic.
The second drop in temperature is due to the addition of NBR to the nylon
melt. This drop is more pronounced for blends of high NBR content. The
temperature again increases with time and levels off at the end of the mixing
cycle. From the graph it is clear that the mixing temperatures of the blends
increase with increase in NBR content This is due to the higher shear forces
involved as NBR content increases, owing to its higher viscosity.
Micro-scale morphology is a profound determinant of the properties of
polymer blends. The prominent factors that decide the blend morphology are
the blend ratio, the intrinsic melt viscosity of the components, shear rate
during mixing and the presence of additives such as fillers, plasticizers etc. It
is reported that for the same prj~cessing conditions, the composition ratios
and melt viscosity differences for the components determine the
morphology.19 If the viscosities of the components are matching the
dispersion of the minor phase is )found to be uniform in the major phase. In
the case of unmatching viscosities, the morphology depends on whether the
minor component has a lower viscosity or higher viscosity than the major
one. If the minor component has lower viscosity, this component will be
finely dispersed. In contrast the minor component shows a coarse dispersion
as spherical domains if its viscosity is higher than that of the major
constituent.
The mode and state of dispersion of the domains are strongly
dependent upon the molecul.ar structure and characteristics of the
components, blend composition, blending procedure, and conditions of
crystallisation. The thermoplastic elastomers are phase-separated systems in
which one phase is hard and solid while the other phase is rubbery at room
Morphology m~dMechmrical Pmperties ofNylon-Ailrile Rubber B l e d - 65
temperature. The hard phase acts as pseudo crosslinks. The strength in th~s
system is provided by the hard phase, in the absence of which the elastomeric
phase starts to flow under stress. The properties usually depend on the
amount of hard phase present. The elastomer phase controls the stability and
stiffness of the resulting produci's. The maximised distribution of mixing
stresses (due to viscosity matching,) and generation of increased stresses (due
to higher viscosities) would be expected to give more extensive break up of
the dispersed phases. As can be seen later, in the present system of NBR
dispersed blends, the large particle size is attributed to the difference
between the surface energies of two phases. Several authors have attempted
to correlate the morphology with the mechanical properties of the blends.1g-21
Avegeropoulos33 and Hamecis have studied the phase morphology
developing during mixing. Initially the dispersed phase appears as large
elongated structures that become d~.awn into domains. Upon further mixing
the elongated droplets are broken down into smaller spherical particles or
droplets. In order to make proper correlation it is necessary to have
information about the morphological aspects, the nature of the matrix and the
dispersed particles, the dimension and distribution of the dispersed particles,
the extent and nature of the interfacial adhesion etc. Therefore, in this study,
scanning electron microscopy and optical microscopy have been employed to
investigate the morphology of the blend system. The average particle size of
the dispersed phase is found out by measuring the size of about 100 domains
selected at random from the micrographs.
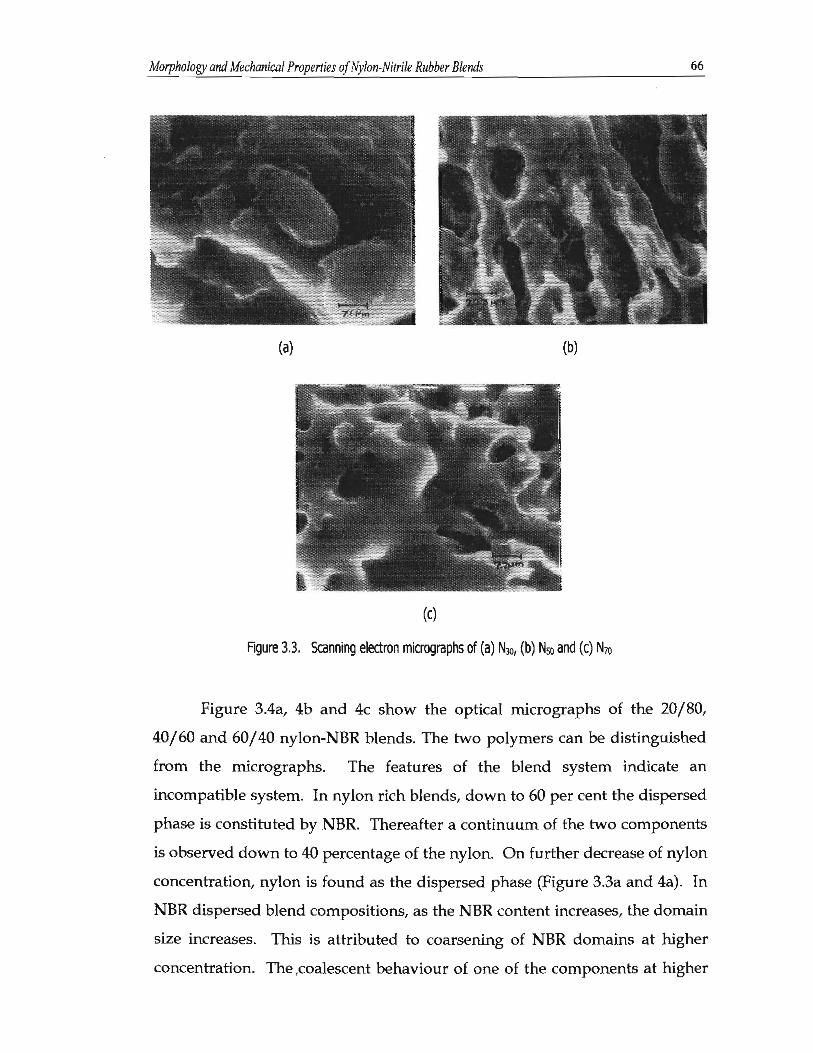
Figures 3.3a, 3b and 3c show the scanning electron micrographs of the
fracture surface of the nylon-NBR blends having nylon/nitrile rubber ratio,
30/70, 50/50 and 70/30. In thest? blends the NBR phase has been
preferentially extracted using toluene. In Figures 3.3b and 3c the holes
indicate the NBR phase that has been extracted by the solvent.
Morphology and Mechanical Properties of Nylon-Nitrite Rubber Blend 66
(c)
Figure 3.3. Scanning electron micrographs of (a) N , (b) NSO and (c) N ~ o
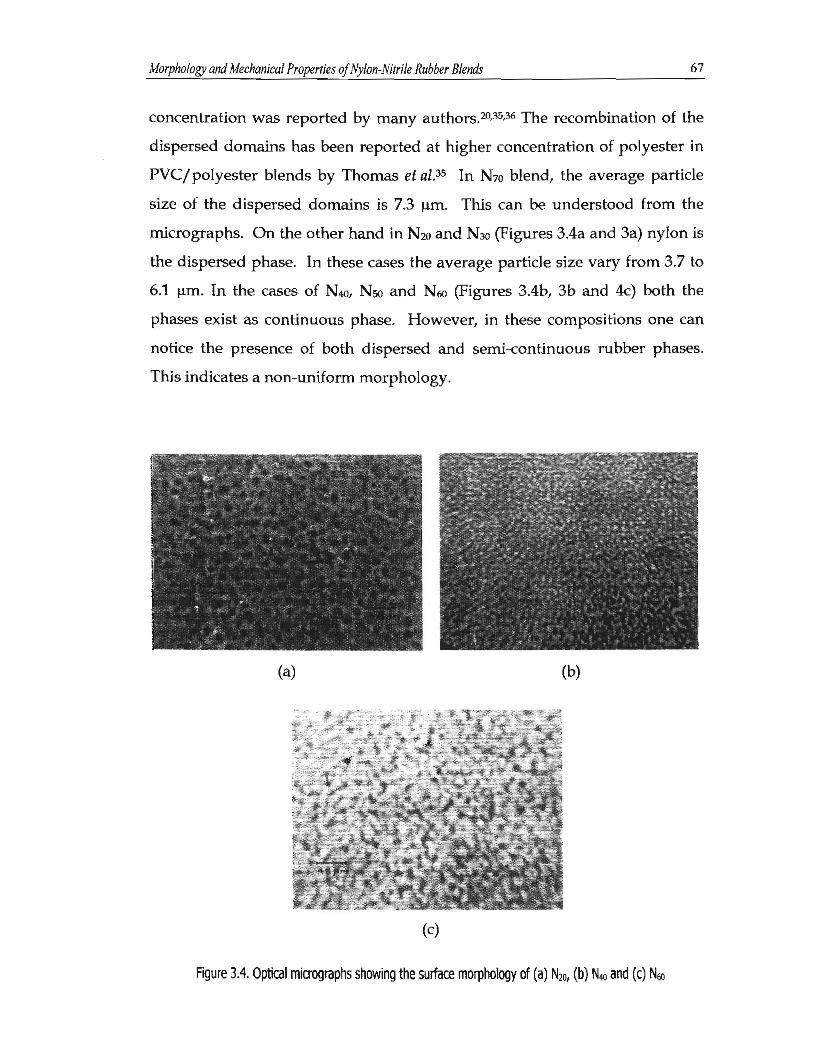
Figure 3.4a, 4b and 4c show the optical micrographs of the 20/80,
40/60 and 60/40 nylon-NBR blends. The fwo polymers can be distinguished
from the micrographs. The features of the blend system indicate an
incompatible system. In nylon rich blends, down to 60 per cent the dispersed
phase is constituted by NBR. Thereafter a continuum of the two components
is observed down to 40 percentage of the nyIon. On further decrease of nylon
concentration, nylon is found as the dispersed phase (Figure 3.3a and 4a). In
NBR dispersed blend compositions, as the NBR content increases, the domain
size increases. This is attributed to coarsening of NBR domains at higher
concentration. The,coalescent behaviour of one of the components at higher
Morphology andMechunica1 Properries of Nylon-Mrile Rubber Blends 67
concentration was reported by many authors.20~35~36 The recombination of the
dispersed domains has been reported at higher concentration of polyester in
PVC/polyester blends by Thomas et a1.35 In N70 blend, the average particle
size of the dispersed domains is 7.3 pm. This can be understood from the
micrographs. On the other hand in N2" and N30 (Figures 3.4a and 3a) nylon is
the dispersed phase. In these cases the average particle size vary from 3.7 to
6.1 pm. In the cases of N40, N50 and N60 (Figures 3.4b, 3b and 4c) both the
phases exist as continuous phase. However, in these compositions one can
notice the presence of both dispersed and semi-continuous rubber phases.
This indicates a non-uniform morphology.
(4
Figure 3.4. Optical micrographs showing the surface morphology of (a) NZ0, (b) N4 and (c) N60
~ w p h o ~ &Me&mdPmpertie~ OfNylon-Ntrn~e Rubber B l e d 68 -
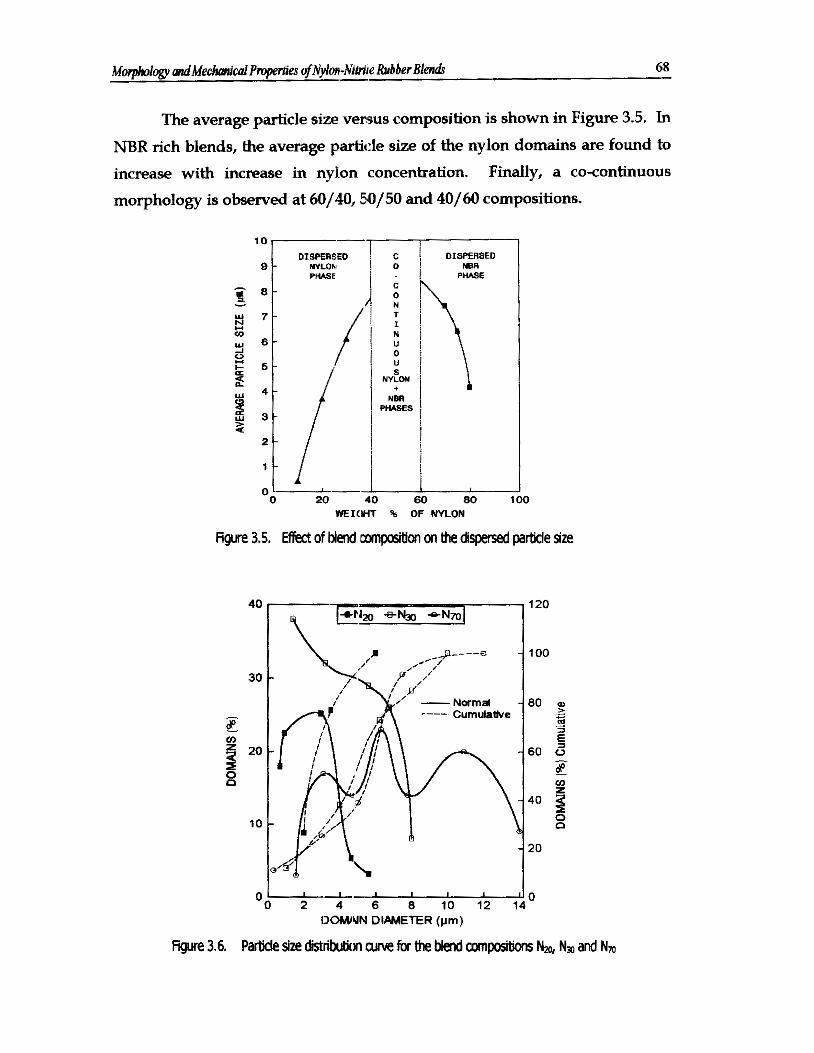
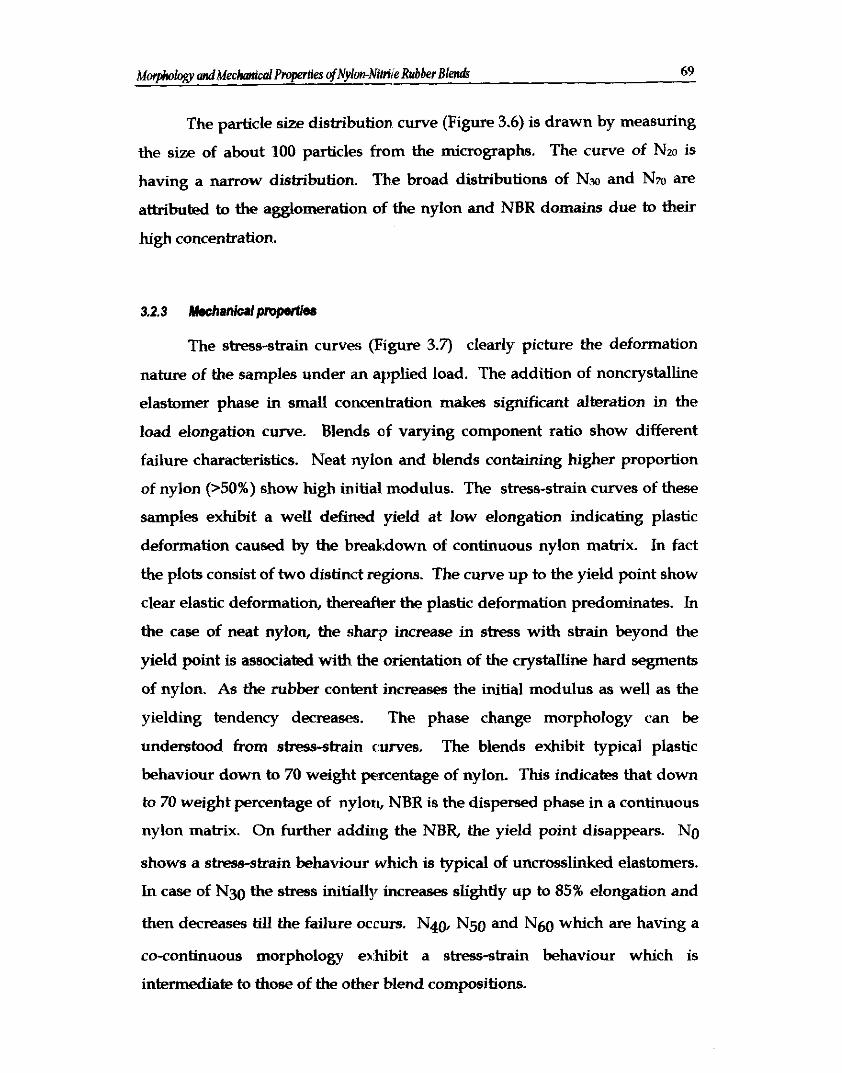
The average particle size versus composition is shown in Figure 3.5. In
NBR rich blends, the average particle size of the nylon domains are found to
increase with increase in nylon concentration. Finally, a co-continuous
morphology is observed at 60/40,50/50 and 40160 compositions.
WEICIHT % OF NYLON
figure 3.5. Efkct of Mend mmpmition on the dispersed particle size
L - 0 ' 0 2 4 6 8 10 12 14
I30MIUN DIPMETER (pm)
Figure 3.6. ParWe size clistnbutitn cume for the blend wnlpositim Nm, Na and N70
M e r O g V &Mechanical Properlies @Nylon-NiIri(Ie Rubber Bl& - 69
The particle size distribution curve (Figure 3.6) is drawn by measuring
the size of about 100 particles from the micrographs. The curve of Nm is
having a narrow distribution. The broad distributions of N30 and Nm are
atbibuted to the agglomeration of the nylon and NBR domains due to their
high concentration.
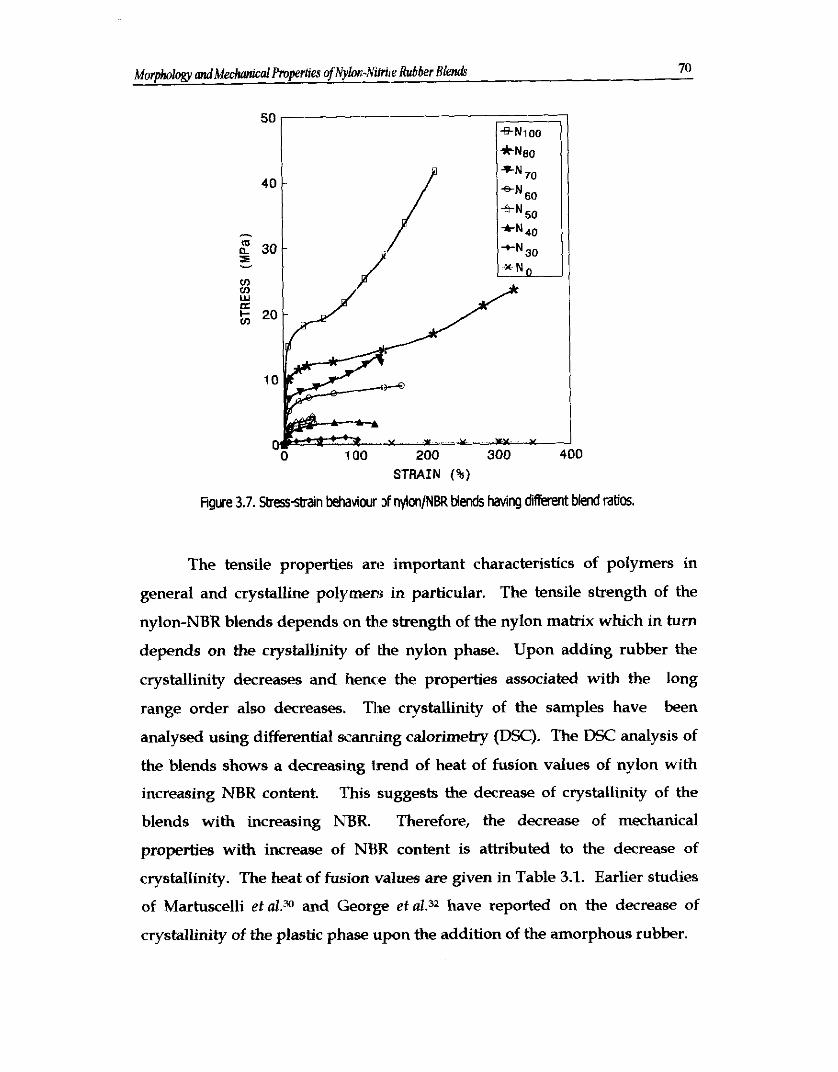
The stress-strain curves (Figure 3.7) clearly picture the deformation
nature of the samples under an applied load. The addition of noncrystalline
elastomer phase in small concentration makes significant alteration in the
load elongation curve. Blends of varying component ratio show different
failure characteristics. Neat nylon and blends containing higher proportion
of nylon (>50%) show high initial modulus. The stress-strain curves of these
samples exhibit a well defined yield at low elongation indicating plastic
deformation caused by the breakdown of continuous nylon matrix. In fact
the plots consist of two distinct regions. The curve up to the yield point show
clear elastic deformation, thereafter the plastic deformation predominates. In
the case of neat nylon, the sharp increase in stress with strain beyond the
yield point is associated with the orientation of the crystalline hard segments
of nylon. As the rubber content increases the initial modulus as well as the
yielding tendency decreases. The phase change morphology can be
understood from shs-strain tumes. The blends exhibit typical plastic
behaviour down to 70 weight percentage of nylon. This indicates that down
to 70 weight percentage of nylon, NBR is the dispersed phase in a continuous
nylon matrix. On further adding the NBR, the yield point disappears. No
shows a stress-strain behaviour which is typical of uncrosslinked elastomers.
In case of N30 the stress initially increases slightly up to 85% elongation and
then decreases till the failure occurs. N40, N50 and N60 which are having a
co-continuous morphology elhibit a stress-strain behaviour which is
intermediate to those of the other blend compositions.
STRAIN (%)
Figure 3.7. Sbess-sbain behaviwr ~f nyion/NBR blends having different blend ratios.
The tensile properties are important characteristics of polymers in
general and crystalline polymer:$ in particular. The tensile strength of the
nylon-NBR blends depends on the strength of the nylon matrix which in turn
depends on the crystallinity of the nylon phase. Upon adding rubber the
crystallinity decreases and hence the properties associated with the long
range order also decreases. The crystallinity of the samples have been
analysed using differential scamung calorimetry (DSC). The DSC analysis of
the blends shows a decreasing trend of heat of fusion values of nylon with
increasing NBR content. This suggests the decrease of crystallinity of the
blends with increasing NBR. Therefore, the decrease of mechanical
properties with increase of NBR content is attributed to the decrease of
crystallinity. The heat of hsion values are given in Table 3.1. Earlier studies
of Martuscelli et a1.m and George et al.32 have reported on the decrease of
crystallinity of the plastic phase upon the addition of the amorphous rubber.
M o d o h andMec~alPmwrt ies ofNvlon-Nirril,? Rubber Bl& 71
Table 3.1. Heat of hison values of the Mends
Composition Heat of fusion values (J/g deg.)
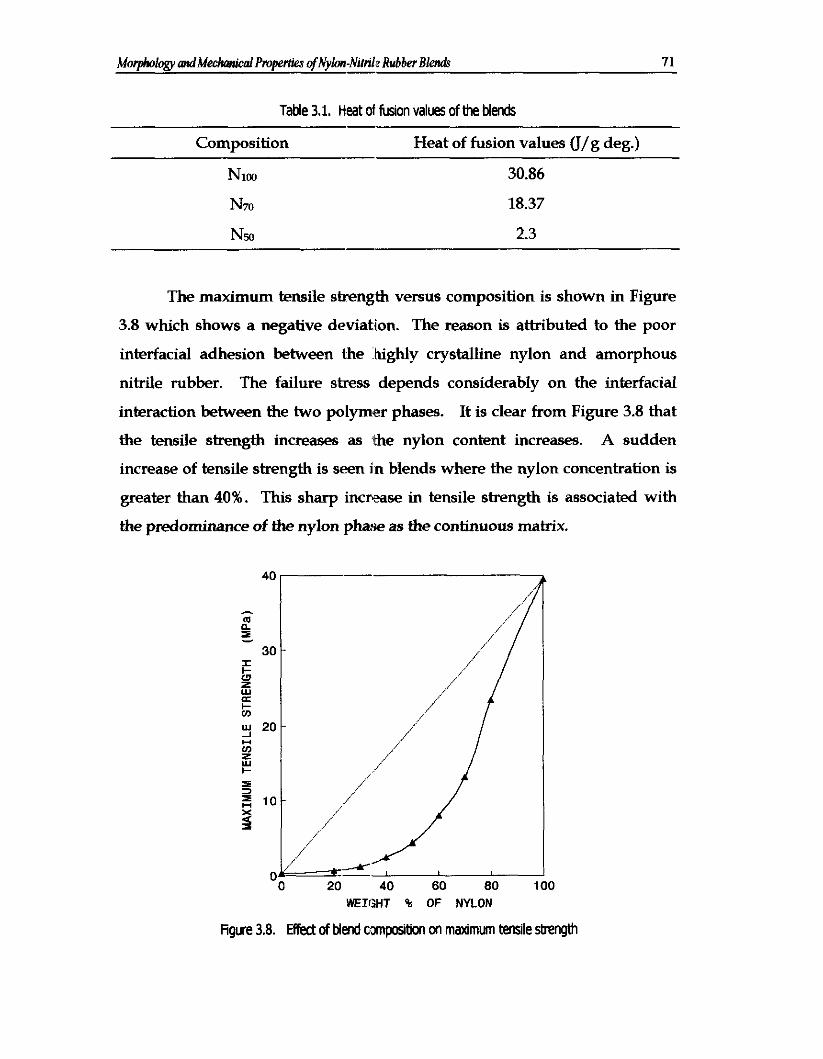
The maximum tensile strength versus composition is shown in Figure
3.8 which shows a negative deviation. The reason is attributed to the poor
interfacial adhesion between the highly crystalline nylon and amorphous
nitrile rubber. The failure stress depends considerably on the interfacial
interaction between the two polymer phases. It is clear from Figure 3.8 that
the tensile strength increases as the nylon content increases. A sudden
increase of tensile strength is seen in blends where the nylon concentration is
greater than 40%. This sharp increase in tensile strength is associated with
the predominance of the nylon phaw as the continuous matrix.
WEI1;HT % OF NYLON
Figure 3.8. Efiect of blend cmposlbon on maximum tensile strength
Moqhology mrdMecMcnlProperries OfNylm-Nihile Rubber BIends 72
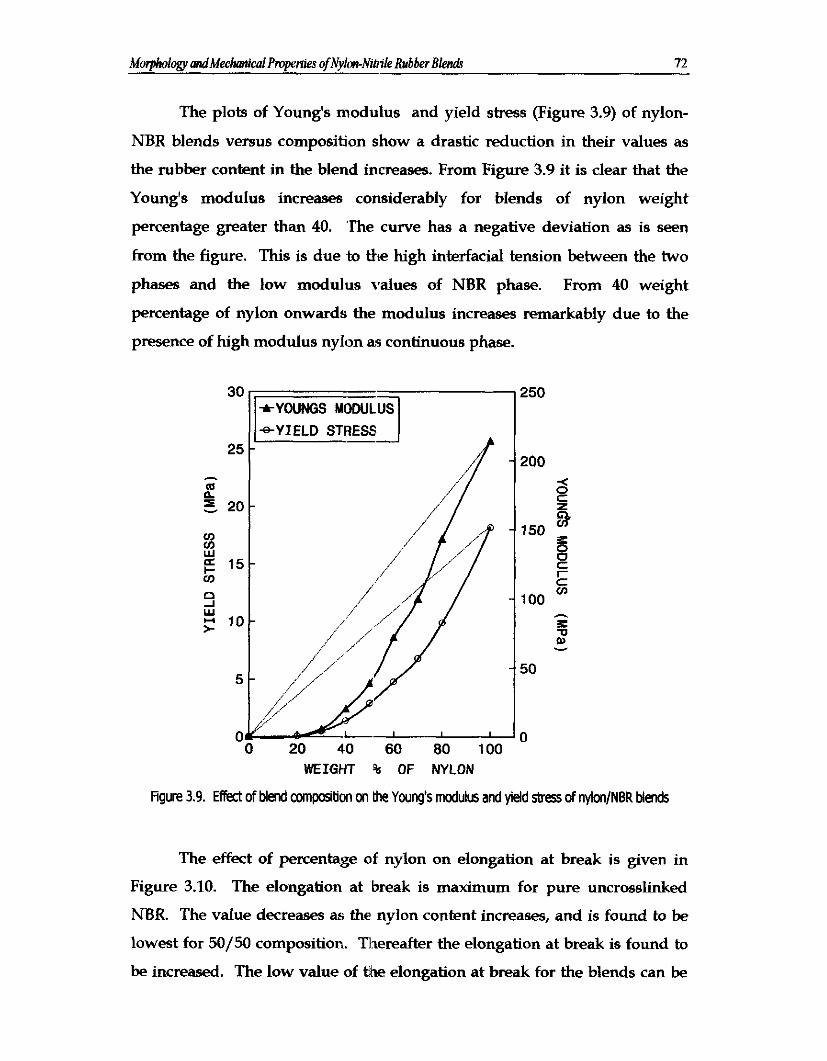
The plots of Young's modulus and yield stress (Figure 3.9) of nylon-
NBR blends versus composition show a drastic reduction in their values as
the rubber content in the blend increases. From Figure 3.9 it is clear that the
Young's modulus increases considerably for blends of nylon weight
percentage greater than 40. 'The curve has a negative deviation as is seen
from the figure. This is due to the high interfacial tension between the two
phases and the low modulus values of NBR phase. From 40 weight
percentage of nylon onwards the modulus increases remarkably due to the
presence of high modulus nylon as continuous phase.
WEIGHT % OF NYLON
Figure 3.9. Effect of Mend composition on the Young's modulus and yield stress of nylon/NBR Mends
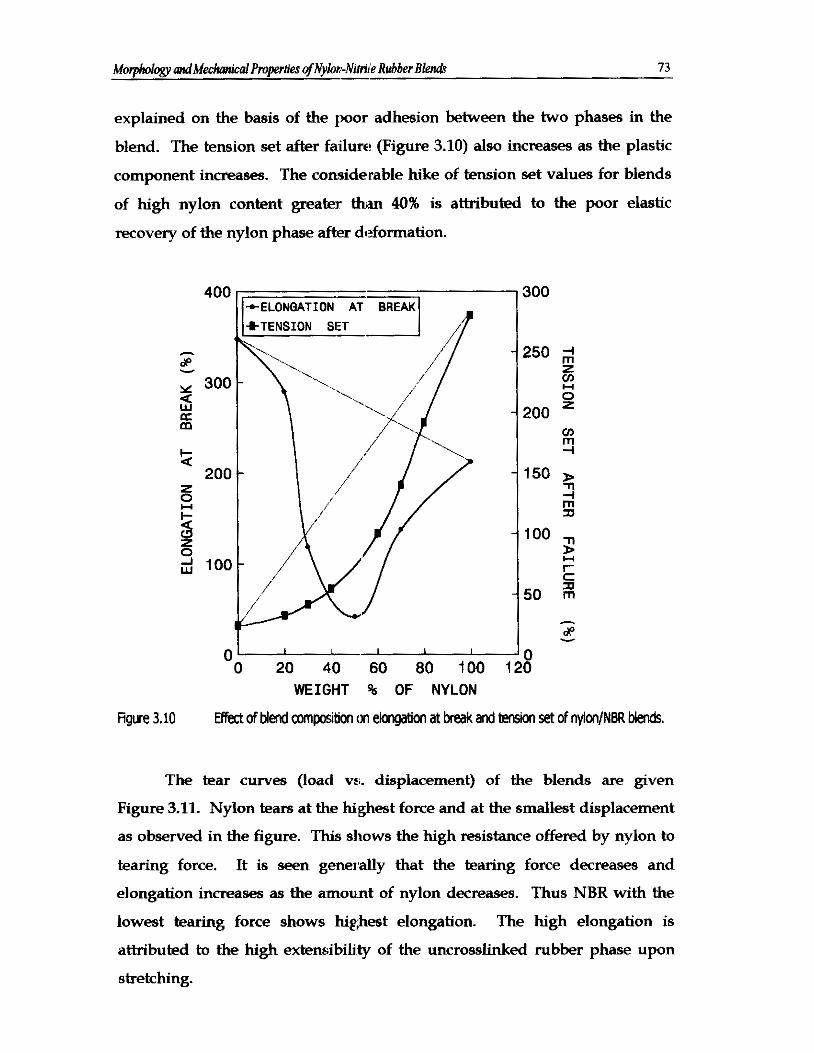
The effect of percentage of nylon on elongation at break is given in
Figure 3.10. The elongation at break is maximum for pure uncrosslinked
NBR. The value decreases as the nylon content increases, and is found to be
lowest for 50/50 composition. Thereafter the elongation at break is found to
be increased. The low value of the elongation at break for the blends can be
MorpMogv mdMechanic01 Pmperties qfNylon-Nifriie Rubber Bl& 73 -
explained on the basis of the poor adhesion between the two phases in the
blend. The tension set after failurc! (Figure 3.10) also increases as the plastic
component increases. The considerable hike of tension set values for blends
of high nylon content greater h m 40% is attributed to the poor elastic
recovery of the nylon phase after deformation.
: d o '0 20 40 60 80 100 120
WEIGHT % OF NYLON
Figure 3.10 Effect of Mend composition (m elongabon at break and tension set of nylon/NBR Mends.
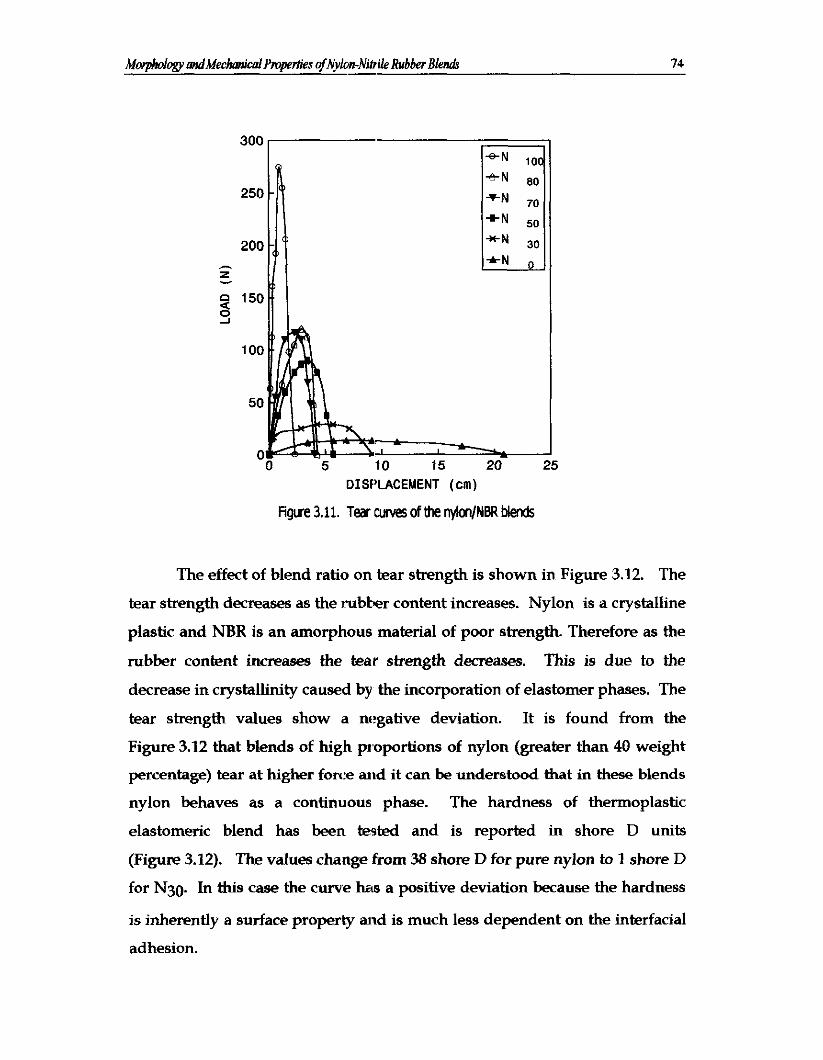
The bear curves (load vt,. displacement) of the blends are given
Figure 3.11. Nylon tears at the highest force and at the smallest displacement
as observed in the figure. This shows the high resistance offered by nylon to
tearing force. It is seen generally that the tearing force decreases and
elongation increases as the amount of nylon decreases. Thus NBR with the
lowest tearing force shows highest elongation The high elongation is
attributed to the high extensibility of the uncrosslinked rubber phase upon
stretching.
M w o g y m~dMednmicaIPmpeld'es ofiylon-Nioile Rubber Blend - 74
DISF'LACEMENT (cm)
Mure 3.11. Tear amres of the nylon/NBR blends
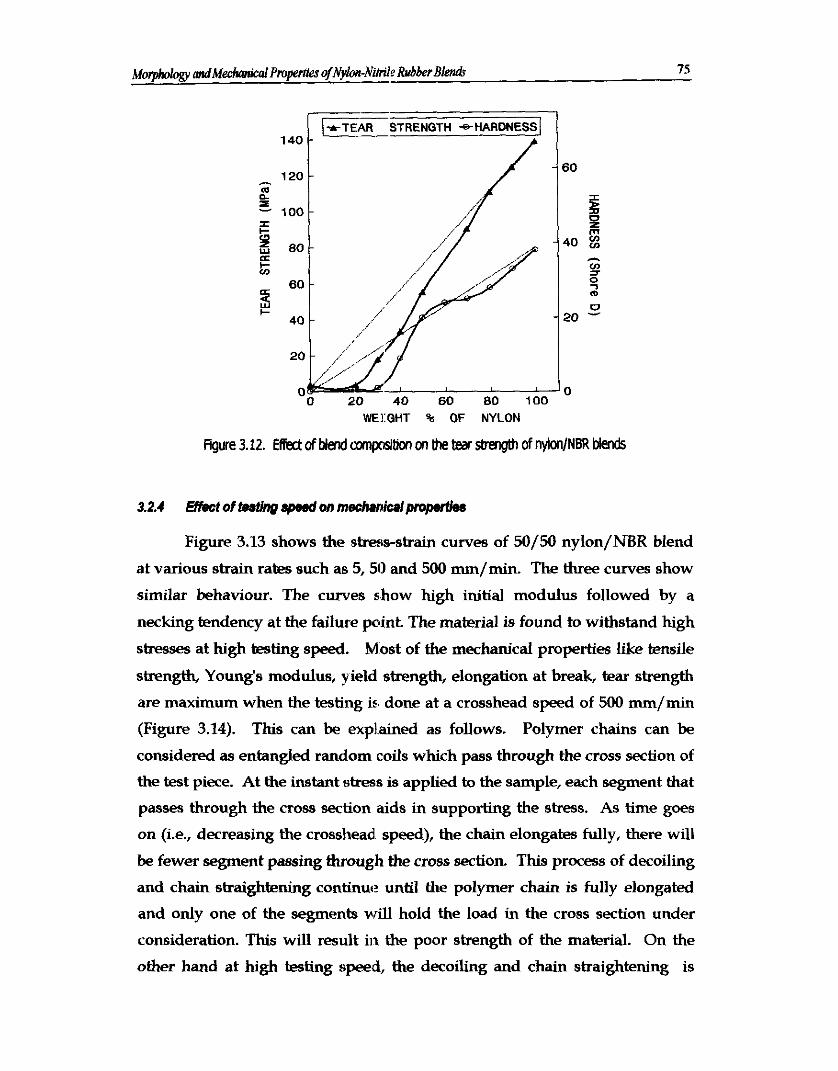
The effect of blend ratio on tear strength is shown in Figure 3.12. The
tear strength decreases as the rubter content increases. Nylon is a crystalline
plastic and NBR is an amorphous material of poor strength. Therefore as the
rubber content increases the tear strength decreases. This is due to the
decrease in crystallinity caused by the incorporation of elastomer phases. The
tear strength values show a negative deviation. It is found from the
Figure 3.12 that blends of high proportions of nylon (greater than 40 weight
percentage) tear at higher force and it can be understood that in these blends
nylon behaves as a continuous phase. The hardness of thermoplastic
elastomeric blend has been tested and is reported in shore D units
(Figure 3.12). The values change from 38 shore D for pure nylon to 1 shore D
for N30 In this case the curve has a positive deviation because the hardness
is inherently a surface property and is much less dependent on the interfacial
adhesion.
WECGHT % OF NYLON
Figute 3.12. EM ofW aJmpxibon on the tea sbength of nylon/NBR Mends
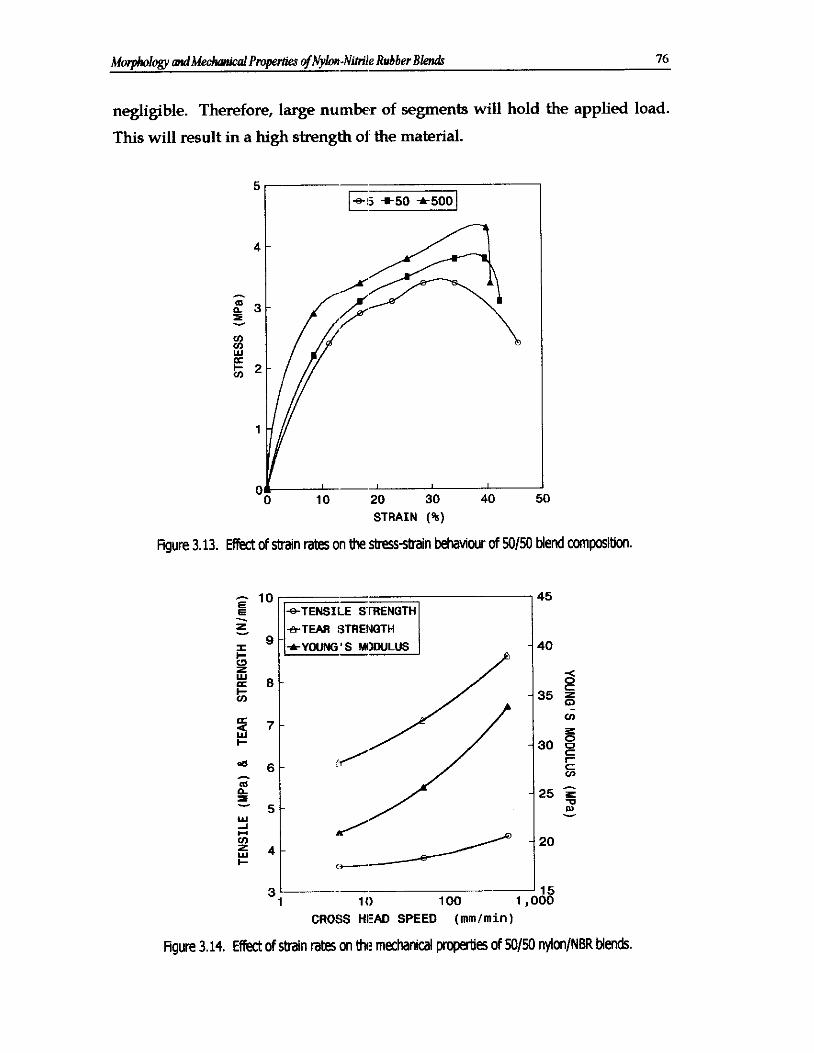
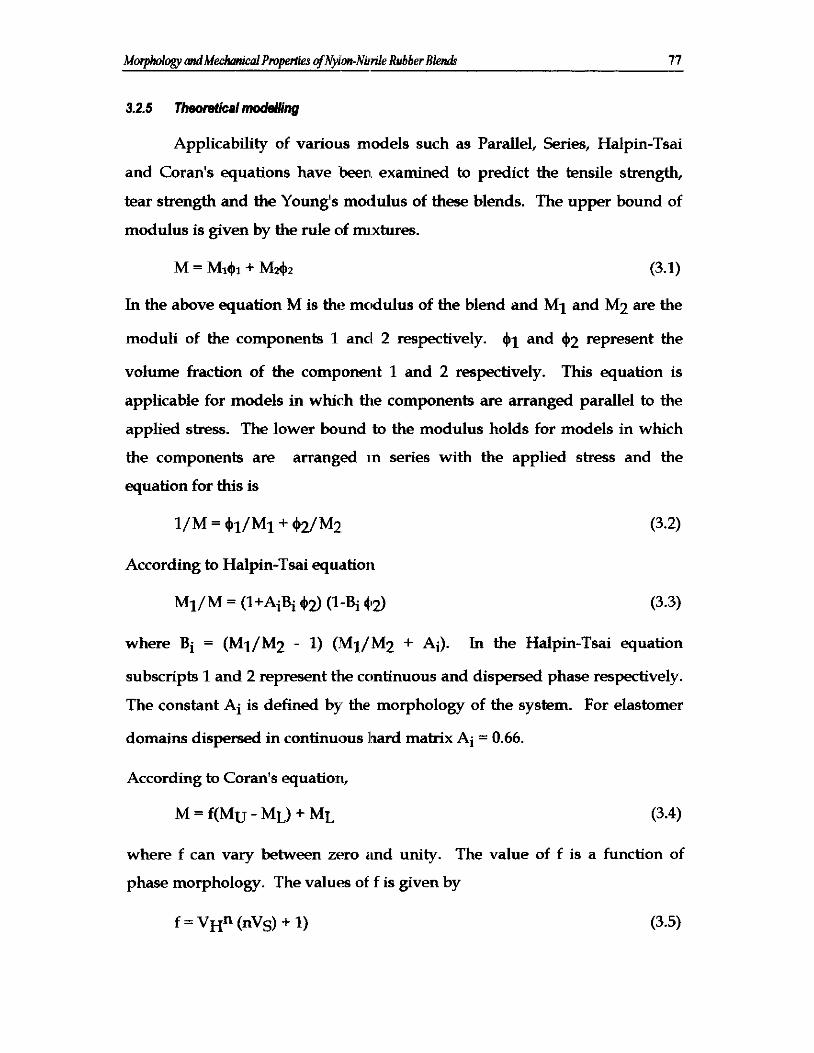
Figure 3.13 shows the stress-strain curves of 50150 nylon/NBR blend
at various strain rates such as 5,511 and 500 mm/rnin. The three curves show
similar behaviour. The curves show high initial modulus followed by a
necking tendency at the failure point The material is found to withstand high
stresses at high testing speed. Most of the mechanical properties like tensile
strength, Young's modulus, yield strength, elongation at break, tear strength
are maximum when the testing is, done at a crosshead speed of 500 mm/min
(Figure 3.14). This can be explained as follows. Polymer chains can be
considered as entangled random coils which pass through the cross section of
the test piece. At the instant stress is applied to the sample, each segment that
passes through the cross section aids in supporting the stress. As time goes
on (i.e., decreasing the crosshead speed), the chain elongates fully, there will
be fewer segment passing through the cross section. This process of decoiling
and chain straightening continue until the polymer chain is fully elongated
and only one of the segments vdl hold the load in the cross section under
consideration. This will result in the poor strength of the material. On the
other hand at high testing speed, the decoiling and chain straightening is
Morphology ondMechanieolPmper~ies of&bn-Nihile - Rubber Blend 76
negligible. Therefore, large number of segments will hold the applied load.
This will result in a high strength of: the material.
Figure 3.13.
STRAIN (%)
Effect of strain rates on the *-strain behavlwr of 9 /50 blend composition.
- 10 E
45 E
z +-TEAFI STRENGTH I - 40
4 w < a 8 o I- V) - 3 5 5 1 % 7
V)
W ?= I- 30
" 6 r- C (R
m n - 2 5 I w w - Y
- 20 I-
3 1 - 1 5 1 10 100 1 ,000
CROSS HI!AD SPEED (mrn lmin )
Figure 3.14. Effect of sbain rates on h? mechanical properbe5 of 9 /50 nylonlNBR M&.
Applicability of various models such as Parallel, Series, Halpin-Tsai
and Coran's equations have been1 examined to predict the tensile strength,
tear strength and the Young's modulus of these blends. The upper bound of
modulus is given by the rule of nuxtures.
In the above equation M is the mcdulus of the blend and M i and M2 are the
moduli of the components 1 ancl 2 respectively. 41 and 42 represent the
volume fraction of the component 1 and 2 respectively. This equation is
applicable for models in which the components are arranged parallel to the
applied stress. The lower bound to the modulus holds for models in which
the components are arranged in series with the applied stress and the
equation for this is
According to Halpin-Tsai equatior~
where Bi = (Ml/M2 - 1) (M1/M2 + Ai). In the Halpin-Tsai equation
subscripts 1 and 2 represent the continuous and dispersed phase respectively.
The constant Ai is defined by the morphology of the system. For elastomer
domains dispersed in continuous lhard matrix Ai = 0.66.
According to Coran's equation,
where f can vary between zero imd unity. The value of f is a function of
phase morphology. The values of f is given by
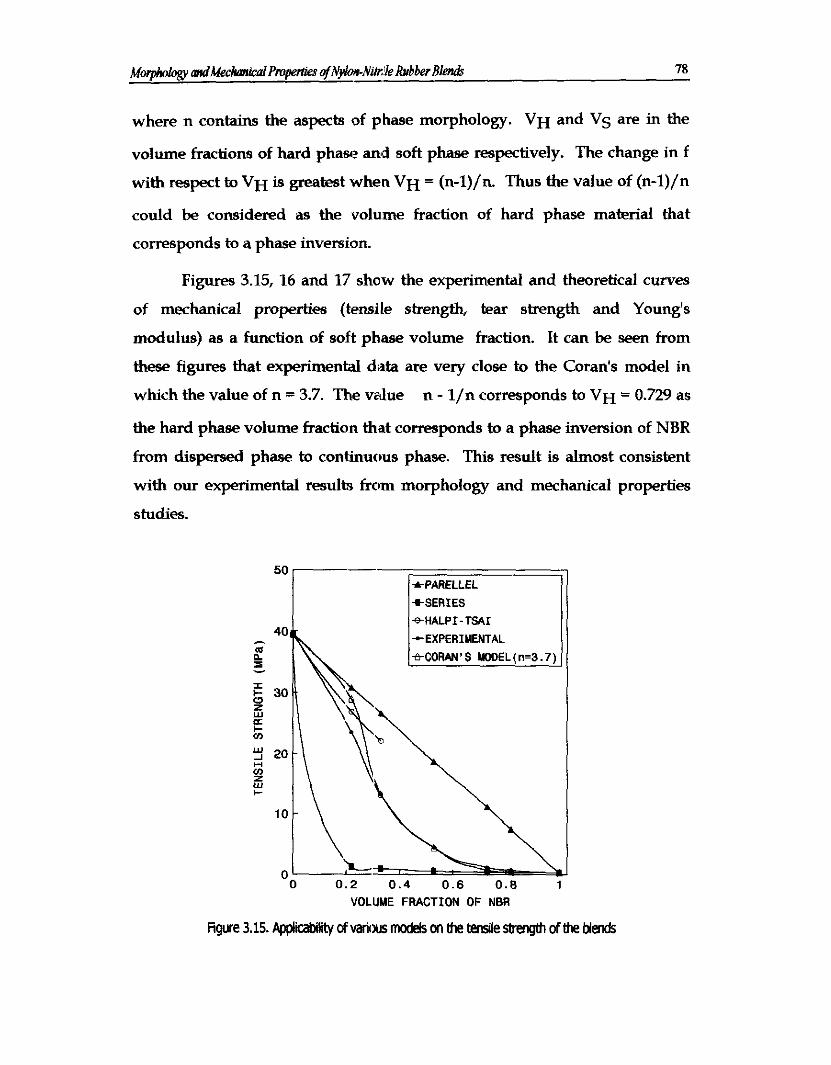
where n contains the aspects of phase morphology. VH and VS are in the
volume fractions of hard phase an'd soft phase respectively. The change in f
with respect to VH is greatest when VH = (n-l)/n. Thus the value of (n-l)/n
could be considered as the volume fraction of hard phase material that
corresponds to a phase inversion.
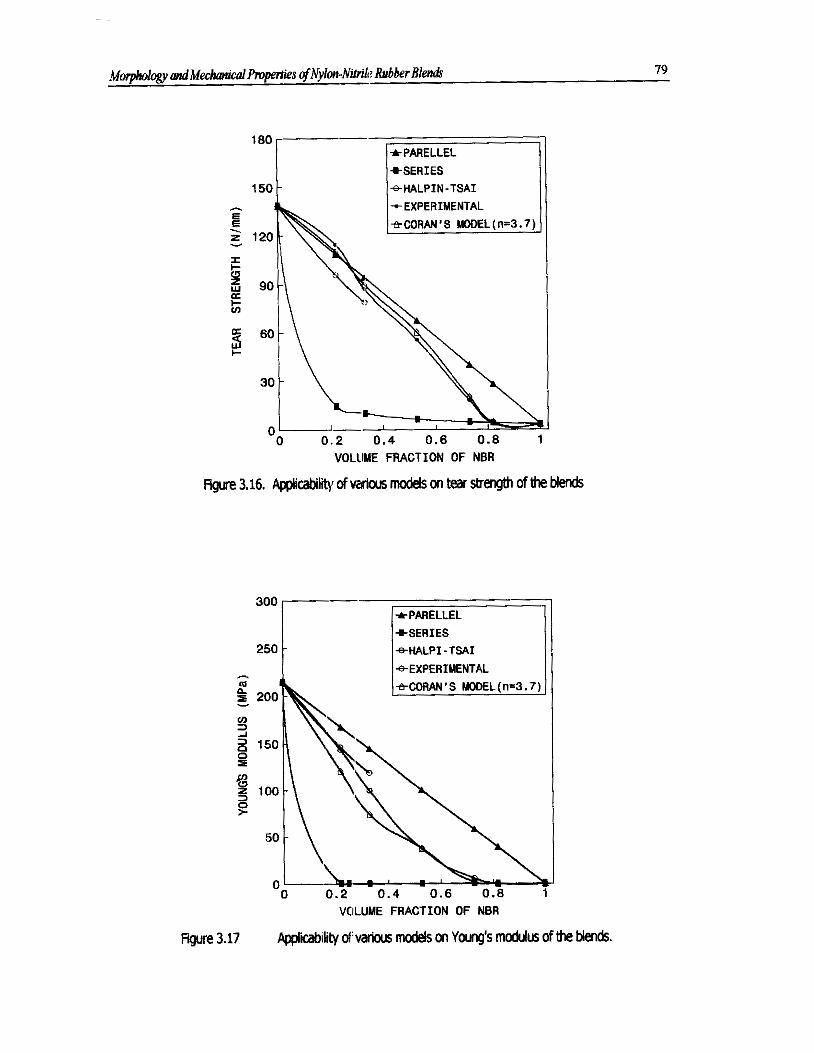
Figures 3.15,16 and 17 show the experimental and theoretical curves
of mechanical properties (tensile strength, tear strength and Young's
modulus) as a function of soft phase volume fraction. It can be seen from
these figures that experimental data are very close to the Coran's model in
which the value of n = 3.7. The value n - l / n corresponds to VH = 0.729 as
the hard phase volume fraction that corresponds to a phase inversion of NBR
from dispersed phase to continuous phase. This result is almost consistent
with our experimental results frc~m morphology and mechanical properties
studies.
0 . 2 0 . 4 0 . 6 0 . 8 1 VOLUME FRACTION OF NBR
figure 3.15. Appl- ofMlicns models cm the the tenslleergth of the blends
M~* &~&hop?rlies ofNyllon.Nitrtl~! Rubber B l e d 79 -
-EXPERIMENTAL
VOLllME FRACTION OF NBR
Figure 3.16. ApplicabiMy of MKioUs mOdelS on tea sbength of the Mends
VCILUME FRACTION OF NBR
Figwe 3.17 Ap@cab!lity o f v W modek on Yo~ng's modulus of W Mends.
Morphologv andMechanicdPmpetiies ofNylorrN iWle Rubber Blends - 80
3.3. References
B. M. Walker. Hand Rook of Thermoplastic Elatomers, Van Nostrand Reinhold Company, New Yorlr (1979).
A. D. Thorn. ~errnopla~t ic .Elastomers, A Review of Cztrrent Information, Rubber and Plastics Research 4ssociation of Great Britain, Shawbury, England (1980).
J. C. West and S. L. Cooper. :?cience and Technologv ofRubber, F . R. Eirich, Ed., Academic Press, Inc., New York, Ch. 13 (1978).
A. Whelan and K. S. Lee. Developments in Rubber Technology 3, Tbermoplastic Rubbers, Applied Science Publishers, London (1982).
L. Mullins. Rubber Developme,rt, 31,92 (1978).
S. Wu, Polymer, 26, 1855 (1985).
A Margolina and S. Wu, Polymer, 29,2170 (1988).
T. Fulkui, Y. Kkuchi, and T. h u e , Polymer, 33,3173 (1992).
Y. Takeda, H Keskkula, and D. R. Paul, Polymer, 33 3 173 (1992)
R. J. M. Borgreve, R. J. Ciapans, J. Schuijer and J. F. Insen Housz. Polymer 28, 1489 (1987).
R. J. Gaymans, R. J. M. Borgreve and A. B. Spoelstra. J. Appl. Polym. Sci. 37, 479 (1 989).
R. J. M. Borgreve and R. J. Ga-mms. Polymer 30,63 (1989).
R. J. M. Borgreve and R. J. Gaymans and J. Schuijer. Polymer 30,71 (1989).
A. Y. Corm and R. P. Patel. Rubber Chem. Technol. 53, 141 (1980).
A. Y. Corm and R. P. Patel. Ruliber Chem. Technol. 54,91(1981)
A. Y. Coran and R. P. Patel. Ruliber Chem. Techno]. 53, 781 (1980)
A. Y. Coran and R. P. Pate1 Rubber Chem. Technol. 54,892 (1981)
A. Y. Coran and R. P. Patel. Rubber Chem. Technol. 55, 116 (1982)
S. Danesi and R. S. Porter. J'olymer 19,448 (1978).
K. C. Dao. Polymer 25, 1527 (1984)
M. Baer. J. Appl. P o l ' . Sci. 16, 1109 (1972)
C. G. Bragaw, Advances in Che.mistry, ACS Symposium Series 99, Ameiican Chemical Society, Washington, D.C., 1971.
W. M. Speri and G. R. Particle, Polym. Eng. Sci.. 15, 668 (1975).
C. K. Riew, E. H. Rowe, and 14. R. Stebert, Advances in Chemistry, ACS Symposium Series 154, American Chemical Society, Washington, D.C., 1976.
S. Miller, TZS Report 78 MAL005, General Electric Company, Louisville, KY, 1978.
S. Miller, Proceedings Int. Con$ Toughening of Plastics, Paper 8, Plastics and Rubber Institute, London, 1978.
S. Cimmino, L. D'Orazio, R. Creco, G. Maglio, M. Malinconica, C. Mancarell, E. Murtuscelli, R. Palumbo, and G. Ragosta, Polym. Eng. Sci., 24,48 (1984).
D. Yang, B. Zhang, Y. 'lrang, Z. Fang, G. Sun, and Z. Feng, Polym. Eng. Sci., 24,612 (1984).
D. Heikens and W. Barentsg Polymer, 18,69 (1977).
E. Martuscelli, C. Silvestre, and G. Abate, Polymer, 23,229 (1982).
E. Martuscelli, F. Riva, C. Sellitti, and C. Silvestre, Polymer, 26,270 (1985).
S. George, K. T. Varughese and S. Thomas. Polymer, 36(23), 4405 (1995).
G. N. Avegeropoulos, F. L. Weissert, P. H. Biddison and G. G. A. Bohn, Rubber Chem. Technol., 49,9:? (1976).
G. R. Hamed, Rubber Chem. Technol., 55, 151 (1982).
S. Thomas, B. R. Gupta and S. K. De. J. Vinyl Technol., 9(2), 71 (1987).
2. K. Wakzak. J. Appl. P o l ' . Sci., 17, 169 (1973).