Morphological and Genetic Diversity of Cercospora beticola ... · 36 Morphological and Genetic...
14
35 Morphological and Genetic Diversity of Cercospora beticola Isolates Nenad Trkulja, Žarko Ivanović Institute for Plant Protection and Environment, Teodora Drajzera 9, 11000 Belgrade, Serbia e-mail: [email protected] Abstract e fungus Cercospora beticola Sacc. is the one of the most important pathogens on the sugar beet. is plant pathogen causes cercospora leaf spot disease which is a serious economic problem for growers of this crop all over the world. Traditionally, the identification of C. beticola is based mainly on conidial characters and host association, but today molecular characterization is necessary for determination of their genetic diversity. is study was designed to evaluate level of morphological and genetic diversity of population C. beticola in Serbia. Isolates originated from sugar beet field where this crop has been cultivated for last two decades and from localities where sugar beet has never been cultivated. e isolates exhibited significant morphological differences in shape, colour and size of border zone of colony on different nutrition media. For molecular identification and characterization of these isolates we used molecular tools: Polymerase Chain Reaction (PCR), Random Amplified Polymorphic DNA (RAPD) and Direct Amplification of Minisatellite-region DNA (DAMD). e ability of random amplified polymorphic DNA (RAPD) to distinguish among C. beticola populations from Serbia was evaluated. Certain specific bands were identified which could be effectively used to distinguish the populations. Polymorphism in RAPD markers among C. beticola populations was high and sufficient to distinguish each of the populations. e results obtained suggest that RAPD and DAMD markers are valuable for the genetic divergence estimation in C. beticola and for the study of diversity among populations. Results of morphological and molecular tests showed the presence of different populations of C. beticola in Serbia. Key words: Cercospora beticola, sugar beet, RAPD, molecular characterization Introduction Cercospora beticola Sacc. is a causal agent of the cercospora leaf spot disease, one of the most economically important diseases in sugar beet crops (Holtschulte, 2000). Inadequate control measures against this destructive disease could consequently cause high yield losses up to a 50% (Shane and Teng, 1992). Chupp (1954) considered the fungi from the genus Cercospora highly specific to their host plants and host-specificity was treated as one the main characteristics in taxonomy of the group. However, the experiments of cross inoculations using different plants and Cercospora species showed that these fungi could develop on a wide range of alternative hosts (Berger and Hanson, 1963; Kaiser and Lukesic, 1965). Groenewald et al. (2006) analyzed the populations of C. beticola and C. apii from many plants belonging to different genera and determined that the two species have not been closely associated with specific host plant, and therefore could not be strictly identified based on the plant they were collected from. Morphological characters commonly used in the taxonomy of the genus Cercospora are the size and shape of the conidia and conidiophores (Chupp, 1954). Pons et al. (1985) also noted the importance of conidial scars and hyaline image of the conidia for identification of C. beticola. However, the
Transcript of Morphological and Genetic Diversity of Cercospora beticola ... · 36 Morphological and Genetic...

35
Morphological and Genetic Diversity of Cercospora beticola Isolates
Nenad Trkulja, Žarko IvanovićInstitute for Plant Protection and Environment, Teodora Drajzera 9, 11000 Belgrade, Serbia
e-mail: [email protected]
Abstract
The fungus Cercospora beticola Sacc. is the one of the most important pathogens on the sugar beet. This plant pathogen causes cercospora leaf spot disease which is a serious economic problem for growers of this crop all over the world. Traditionally, the identification of C. beticola is based mainly on conidial characters and host association, but today molecular characterization is necessary for determination of their genetic diversity. This study was designed to evaluate level of morphological and genetic diversity of population C. beticola in Serbia. Isolates originated from sugar beet field where this crop has been cultivated for last two decades and from localities where sugar beet has never been cultivated. The isolates exhibited significant morphological differences in shape, colour and size of border zone of colony on different nutrition media. For molecular identification and characterization of these isolates we used molecular tools: Polymerase Chain Reaction (PCR), Random Amplified Polymorphic DNA (RAPD) and Direct Amplification of Minisatellite-region DNA (DAMD). The ability of random amplified polymorphic DNA (RAPD) to distinguish among C. beticola populations from Serbia was evaluated. Certain specific bands were identified which could be effectively used to distinguish the populations. Polymorphism in RAPD markers among C. beticola populations was high and sufficient to distinguish each of the populations. The results obtained suggest that RAPD and DAMD markers are valuable for the genetic divergence estimation in C. beticola and for the study of diversity among populations. Results of morphological and molecular tests showed the presence of different populations of C. beticola in Serbia.
Key words: Cercospora beticola, sugar beet, RAPD, molecular characterization
Introduction
Cercospora beticola Sacc. is a causal agent of the cercospora leaf spot disease, one of the most economically important diseases in sugar beet crops (Holtschulte, 2000). Inadequate control measures against this destructive disease could consequently cause high yield losses up to a 50% (Shane and Teng, 1992). Chupp (1954) considered the fungi from the genus Cercospora highly specific to their host plants and host-specificity was treated as one the main characteristics in taxonomy of the group. However, the experiments of cross inoculations using different plants and Cercospora species showed that these fungi could develop on a wide range of alternative hosts (Berger and Hanson, 1963; Kaiser and Lukesic, 1965). Groenewald et al. (2006) analyzed the populations of C. beticola and C. apii from many plants belonging to different genera and determined that the two species have not been closely associated with specific host plant, and therefore could not be strictly identified based on the plant they were collected from. Morphological characters commonly used in the taxonomy of the genus Cercospora are the size and shape of the conidia and conidiophores (Chupp, 1954). Pons et al. (1985) also noted the importance of conidial scars and hyaline image of the conidia for identification of C. beticola. However, the

36
Morphological and Genetic Diversity of Cercospora beticola Isolates
appearance and the size of the conidia is very similar for species within the genus Cercospora, in some cases with the intraspecific exceeding the interspecific rate of variation (Welles, 1933). Around 3000 species were primarily described within the genus Cercospora (Pollack, 1987). In latter studies, 659 species were confirmed to belong to the genus Cercospora, whereas 281 were unrecognizable based on the morphological characters and symptoms, thus were designated as Cercospora apii sensu lato (Crous and Braun, 2003).
Additional useful tool for the identification and characterization of phytopathogenic fungi are the cardinal temperatures for the mycelial growth. Groenewald et al. (2005) studied the growth of three different Cercospora species and determined significant differences in growth dynamics between lower and higher temperature regimes.
Development of the molecular tools for identification and characterization of the fungi enabled revision of the phylogenetic relations and classification of the taxons (Hibbett et al., 2007). Phylogenetic analysis of several protein coding genes, i.e. elongation factor EF, ß-tubuline, histone H3 within isolates of C. piaropi and C. rodmanii of different geographic origin did not reveal significant differences between the two species (Tessmann et al., 2001). Taylor et al. (2003) did not determine divergence in the sequences of the ITS region between C. maydis and C. nicotianae, clustering these two species in the same phylogenetic group with Septoria spp. Stewart et al. (1999) analyzed the same region and determined a high level of homology between C. apii, C. hayi, C. kikuchii, C nicotianae and the species Cercospora beticola. In search for a representative molecular marker for the identification of the Cercospora fungi on the species level, Groenewald et al. (2005) analyzed internal transcribed spacer ITS, actin gene ACT; elongation factor EF; calmodulin CAL and histone H3. They determined that C. apii and C. beticola are closely related species with no significant difference on four out of five analyzed markers (ITS, ACT, EF, H3). On the other hand, the differences between C. beticola and C. apii have been determined for the calmodulin gene CAL, which finally lead to a development of the species specific primers CercoCal-beta and CercoCal-apii for identification and differentiation of these two cryptic species (Groenewald et al., 2005). In addition, Random Amplified Polymorphic DNA (RAPD) PCR, and Direct Amplification of Minisatellite-region DNA (DAMD) PCR were demonstrated to be useful to screen for DNA polymorphism.
Material and Methods
Sampling and single-conidial isolation
Samples for pathogen isolation were collected from several localities in four geographically distant areas in Serbia, i.e. Srem, South Banat, Moravica and Bor (Table 1). Leaves with clear symptoms of cercospora leaf spot were collected during late August and September, from 2007 to 2010. From locations Šid and Ruma (Srem), including Padinska skela, Kovačica and Stari Tamiš (South Banat) samples were collected in sugar beet crops, while beet root leaves were sampled at Negotin and Guča, localities in the Bor and Moravica district, respectively (Table 1). Leaves with sporulating spots were used for isolation of C. beticola, while the leaves with no sporulation were placed in Petri dishes with filter paper and humidity over 90% to induce sporulation. Petri dishes were then placed in the thermostat at 25oC in the dark for a period of 24 hours. Single-conidial isolates of C. beticola were obtained by transferring individual germinating conidia to potato dextrose agar (PDA) plates. For each sample, conidia from only one lesion per leaf were transferred to the culture medium. After two days of incubation at 25oC in the dark, the fungal colonies were transferred to fresh PDA in Petri dishes and incubated for the following 14 days at 25oC in the dark.

37
Table 1. Geographic origin of Cercospora beticola isolates used in this study with information on crop host and year of collection
Isolates Year Host Origin of isolates (Region, locality)CRI1 2008 sugar beet Srem, ŠidCRI2 2008 sugar beet Srem, ŠidCRI3 2008 sugar beet Srem, ŠidCRI4 2007 beet root Bor, NegotinCRI5 2007 beet root Bor, NegotinCRI6 2008 sugar beet South Banat, Padinska skelaCRI7 2008 sugar beet South Banat, Padinska skelaCRI8 2009 sugar beet South Banat, Stari TamišCRI9 2009 sugar beet South Banat, Stari Tamiš
CRI10 2009 sugar beet Srem, RumaCRI11 2009 sugar beet Srem, RumaCRI12 2009 sugar beet South Banat, KovačicaCRI13 2009 sugar beet South Banat, KovačicaCRI14 2009 sugar beet South Banat, KovačicaCRI15 2007 sugar beet Srem, Sremska MitrovicaCRI16 2010 beet root Moravica, Guča
Molecular identification of C. beticola
DNA from 14-day-old C. beticola isolates was extracted using the QIAGEN Plant MiniKit according to the manufacturer’s instructions. Molecular identification was performed by amplifying calmodulin gene fragment using previously designed species-specific primers CercoCal-R and CercoCal-beta for C. beticola detection and genus-specific primer CercoCal-F (Groenewald et al. 2005). The reaction mixture had a total volume of 20 μl and contained 1 μl of diluted gDNA, 1× PCR buffer, 1.5 mM MgCl2, 0.3 mM dNTPs, 0.5 μM of CercoCal-F, 1.5 μM of each of CercoCal-R and the specific internal primer, and 0.75 units of Taq polymerase (Kapa Biosystems, Boston, MA, USA). The amplification was done in Eppendorf Mastercycler®ep. Reaction conditions were as follows: initial denaturation for 5 min at 95°C followed by 40 cycles of denaturation step at 95°C for 30 s, annealing at 58°C for 30 s and elongation step at 72°C for 30 s; final elongation was performed at 72°C for 7 min. The PCR products were separated on a 1.5% agarose gel and visualized.
Morphological and cultural characterization
For the morphological and cultural characterization, isolates were cultured on different nutrition media, i.e. Potato Dextrose Agar (PDA), Malt Extract Agar (MEA) and Czapek Agar (CZ). Five mm mycelial plugs of 14-day-old isolates were removed from the colony margins and placed upside down on the culture media and incubated at 25°C in the dark. Colony diameters were measured after 7 days, and finally when the isolate with the fastest growth filled the Petri dish (17 days). A total of three replicates were conducted for each isolate on each medium. Aside the growth rate, the width of the border zone was also measured, including the colour of the above and reverse side of the colony. Colony characteristics were determined and colours rated on different growth media using a colour chart (Rayner, 1970). Cardinal growth temperatures were determined on PDA medium, whereas the plates were incubated in the dark for 7 days at temperatures starting at 10°C and progressing to 40°C with 5°C intervals. The experiments included three replicates for each isolate, whereas the whole trial was repeated twice.

38
Morphological and Genetic Diversity of Cercospora beticola Isolates
Amplification of ITS region in C. beticola isolates
The internal transcribed spacer 1 (ITS 1), 5.8S ribosomal RNA, internal transcribed spacer 2 (ITS 2) and 28S ribosomal RNA regions of the fungal rDNA were amplified using the primers ITS 1 ITS 4 (White et al., 1990). Amplifications were performed in 20 µl reactions containing 1 µl of template DNA, 14.45 µl of H2O, 2 µl of High Yield Reaction Buffer A (with 1x1.5mM MgCl2), 0.8 µl of dNTP’s (0.4mM), 0.8 µl of each primer (0.2 µM) and 0.15 µl of KAPATaq DNA polymerase (5U/μl) (Kapabiosystems). PCR protocol included initial denaturation at 94oC for 3 min, 30 cycles consisted of 0.5 min at 94oC, 0.5 min at 55oC, 1.30 min at 72oC and a final extension at 72oC for 10 min. Amplified products were analyzed by 1% agarose gel electrophoresis, stained with ethidium bromide and visualized under a UV transilluminator. All amplified products were purified using the QIAquick PCR purification kit (QIAGEN) according to the manufacturer’s instructions and sequenced using the automated equipment (Macrogen, Korea). Sequences were manually aligned in ClustalW program, phylogenetic tree constructed and evolutionary distances calculated in MEGA4 software (Tamura et al., 2007).
RAPD and DAMD analysis
The Polymerase Chain Reaction (PCR) was performed using RAPD and Minisatellite-region DNA (DAMD) markers (Moretti et al. 2004). Amplification RAPD sequences was performed in volumes of 50 μg using the following reaction mixture: 2.5 U Taq polymerase (Amersham Pharmacia, Italia), 1X Taq buffer (Amersham Pharmacia), 1 mM MgCl2, 0.2 mM each of dATP, dCTP, dGTP, and dTTP (Amersham Pharmacia), 2 μg DNA, and 0.5 μM primer (Amersham Pharmacia). The RAPD primers used were: OPA 01 (5’- CAGGCCCTTC-3’); OPA 13 (5’-CAGCACCCAC- 3’); OPB 01 (5’-GTTTCGCTCC-3’); OPB 10 (5’-CTGCTGGGAC-3’). The thermal Mastercycler personal model (Eppendorf, Hamburg, Germany) was programmed for an initial denaturation at 94 °C for 5 min, followed by 45 cycles at 94 °C for 1 min, 37 °C for 1 min, and 72 °C for 2 min, with a final extension at 72 °C for 5 min.
Amplification minisatellite-region DNA was performed in volumes of 50 μg using the following reaction mixture: 2 U Taq polymerase, 1X Taq buffer, 1.5 mM MgCl2, 0.2 mM each of dATP, dCTP, dGTP, and dTTP, 2 μl DNA, and 0.42 μM primer. The minisatellite primers used were M13 (5’-GAGGGTGGCGGTTCT-3’), SAT1 (GACA)4, and SAT2 (GTG)5. The cycling parameters for M13 were: initial denaturation at 94°C for 1 min, followed by 40 cycles at 94°C for 30 s, 50°C for 1 min, and 72°C for 1 min, with a final extension at 72°C for 6 min. For SAT1 and SAT2 the thermal cycler was programmed for an initial denaturation at 94°C for 1 min, followed by 40 cycles at 94°C for 30 s, 55°C for 1 min, and 72°C for 1 min, with a final extension at 72°C for 6 min. Amplification products were resolved by electrophoresis on 2% agarose gel in TAE buffer (Tris-acetate EDTA Tris-HCl 40 mM and NaEDTA 1 mM) stained with 0.5 μg ml-1 ethidium bromide and visualized on a u.v. trans-illuminator. A hundred base-pair ladder and KiloBase marker were used as molecular weight markers. The negative control was sterile water.
The positions of the bands were assessed visually and each amplification band was treated as a unit character and was scored as present (1) or absent (0). The NEIGHBOR software of the PHYLIP computer package (Felsenstein, 1993) was used to create a phylogenetic tree. Distance matrix was constructed by using the mathematical equation proposed by Nei and Li (1979) based on the proportion of shared DNA fragments and the Unweighted Pair-Group Method (UPGMA) with arithmetic means was used for clustering.
39
Results
Molecular identification of C. beticola
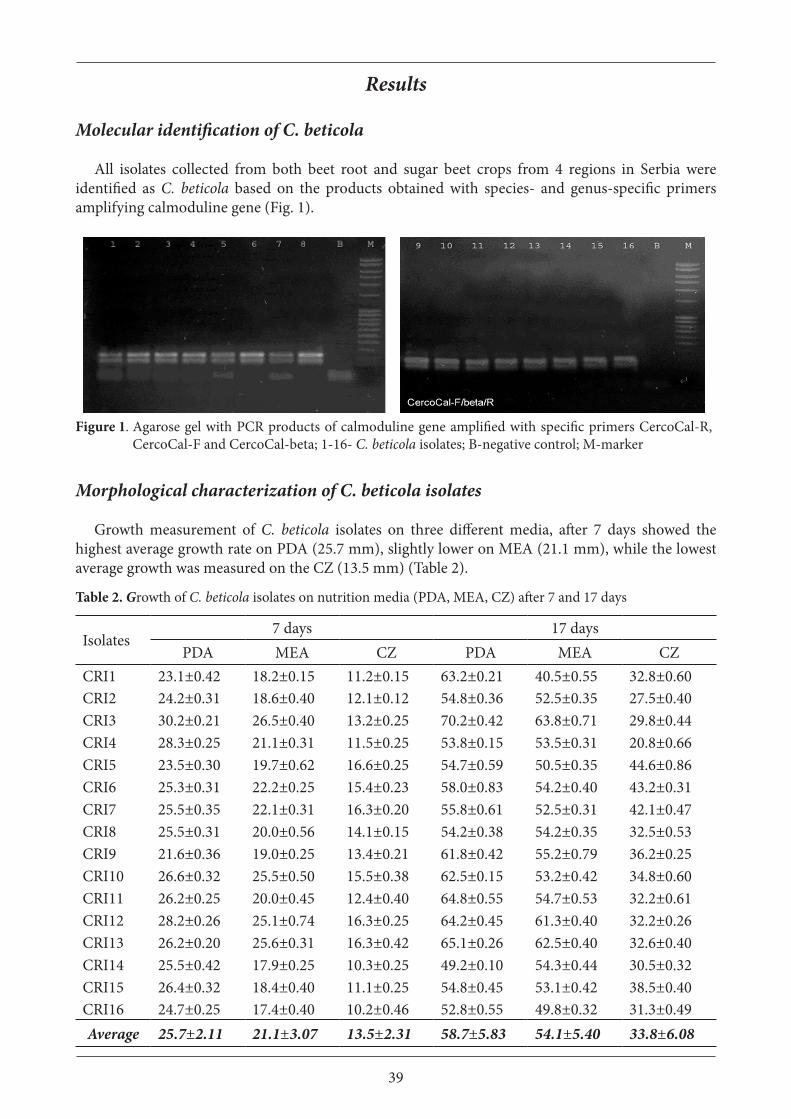
All isolates collected from both beet root and sugar beet crops from 4 regions in Serbia were identified as C. beticola based on the products obtained with species- and genus-specific primers amplifying calmoduline gene (Fig. 1).
Figure 1. Agarose gel with PCR products of calmoduline gene amplified with specific primers CercoCal-R, CercoCal-F and CercoCal-beta; 1-16- C. beticola isolates; B-negative control; M-marker
Morphological characterization of C. beticola isolates
Growth measurement of C. beticola isolates on three different media, after 7 days showed the highest average growth rate on PDA (25.7 mm), slightly lower on MEA (21.1 mm), while the lowest average growth was measured on the CZ (13.5 mm) (Table 2).
Table 2. Growth of C. beticola isolates on nutrition media (PDA, MEA, CZ) after 7 and 17 days
Isolates7 days 17 days
PDA MEA CZ PDA MEA CZCRI1 23.1±0.42 18.2±0.15 11.2±0.15 63.2±0.21 40.5±0.55 32.8±0.60CRI2 24.2±0.31 18.6±0.40 12.1±0.12 54.8±0.36 52.5±0.35 27.5±0.40CRI3 30.2±0.21 26.5±0.40 13.2±0.25 70.2±0.42 63.8±0.71 29.8±0.44CRI4 28.3±0.25 21.1±0.31 11.5±0.25 53.8±0.15 53.5±0.31 20.8±0.66CRI5 23.5±0.30 19.7±0.62 16.6±0.25 54.7±0.59 50.5±0.35 44.6±0.86CRI6 25.3±0.31 22.2±0.25 15.4±0.23 58.0±0.83 54.2±0.40 43.2±0.31CRI7 25.5±0.35 22.1±0.31 16.3±0.20 55.8±0.61 52.5±0.31 42.1±0.47CRI8 25.5±0.31 20.0±0.56 14.1±0.15 54.2±0.38 54.2±0.35 32.5±0.53CRI9 21.6±0.36 19.0±0.25 13.4±0.21 61.8±0.42 55.2±0.79 36.2±0.25CRI10 26.6±0.32 25.5±0.50 15.5±0.38 62.5±0.15 53.2±0.42 34.8±0.60CRI11 26.2±0.25 20.0±0.45 12.4±0.40 64.8±0.55 54.7±0.53 32.2±0.61CRI12 28.2±0.26 25.1±0.74 16.3±0.25 64.2±0.45 61.3±0.40 32.2±0.26CRI13 26.2±0.20 25.6±0.31 16.3±0.42 65.1±0.26 62.5±0.40 32.6±0.40CRI14 25.5±0.42 17.9±0.25 10.3±0.25 49.2±0.10 54.3±0.44 30.5±0.32CRI15 26.4±0.32 18.4±0.40 11.1±0.25 54.8±0.45 53.1±0.42 38.5±0.40CRI16 24.7±0.25 17.4±0.40 10.2±0.46 52.8±0.55 49.8±0.32 31.3±0.49Average 25.7±2.11 21.1±3.07 13.5±2.31 58.7±5.83 54.1±5.40 33.8±6.08
40
Morphological and Genetic Diversity of Cercospora beticola Isolates
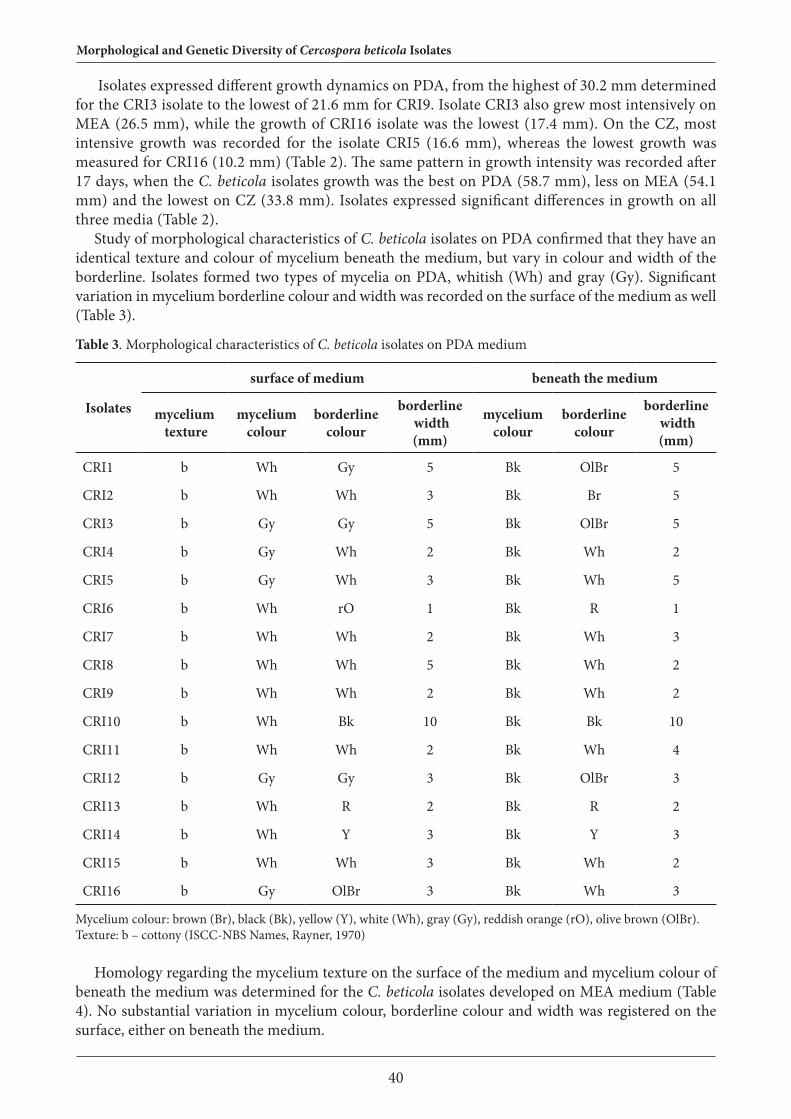
Isolates expressed different growth dynamics on PDA, from the highest of 30.2 mm determined for the CRI3 isolate to the lowest of 21.6 mm for CRI9. Isolate CRI3 also grew most intensively on MEA (26.5 mm), while the growth of CRI16 isolate was the lowest (17.4 mm). On the CZ, most intensive growth was recorded for the isolate CRI5 (16.6 mm), whereas the lowest growth was measured for CRI16 (10.2 mm) (Table 2). The same pattern in growth intensity was recorded after 17 days, when the C. beticola isolates growth was the best on PDA (58.7 mm), less on MEA (54.1 mm) and the lowest on CZ (33.8 mm). Isolates expressed significant differences in growth on all three media (Table 2).
Study of morphological characteristics of C. beticola isolates on PDA confirmed that they have an identical texture and colour of mycelium beneath the medium, but vary in colour and width of the borderline. Isolates formed two types of mycelia on PDA, whitish (Wh) and gray (Gy). Significant variation in mycelium borderline colour and width was recorded on the surface of the medium as well (Table 3).
Table 3. Morphological characteristics of C. beticola isolates on PDA medium
Isolates
surface of medium beneath the medium
mycelium texture
mycelium colour
borderlinecolour
borderline width (mm)
mycelium colour
borderlinecolour
borderline width (mm)
CRI1 b Wh Gy 5 Bk OlBr 5
CRI2 b Wh Wh 3 Bk Br 5
CRI3 b Gy Gy 5 Bk OlBr 5
CRI4 b Gy Wh 2 Bk Wh 2
CRI5 b Gy Wh 3 Bk Wh 5
CRI6 b Wh rO 1 Bk R 1
CRI7 b Wh Wh 2 Bk Wh 3
CRI8 b Wh Wh 5 Bk Wh 2
CRI9 b Wh Wh 2 Bk Wh 2
CRI10 b Wh Bk 10 Bk Bk 10
CRI11 b Wh Wh 2 Bk Wh 4
CRI12 b Gy Gy 3 Bk OlBr 3
CRI13 b Wh R 2 Bk R 2
CRI14 b Wh Y 3 Bk Y 3
CRI15 b Wh Wh 3 Bk Wh 2
CRI16 b Gy OlBr 3 Bk Wh 3
Mycelium colour: brown (Br), black (Bk), yellow (Y), white (Wh), gray (Gy), reddish orange (rO), olive brown (OlBr).Texture: b – cottony (ISCC-NBS Names, Rayner, 1970)
Homology regarding the mycelium texture on the surface of the medium and mycelium colour of beneath the medium was determined for the C. beticola isolates developed on MEA medium (Table 4). No substantial variation in mycelium colour, borderline colour and width was registered on the surface, either on beneath the medium.

41
Table 4. Morphological characteristics of C. beticola isolates on MEA medium
Isolatessurface of medium beneath the medium
mycelium texture
mycelium colour
borderlinecolour
borderline width (mm)
mycelium colour
borderlinecolour
borderline width (mm)
CRI1 b Ol Wh 1 Bk Y 5CRI2 b Ol OlBr 3 Bk Wh 3CRI3 b Ol Wh 1 Bk Y 1CRI4 b OlBr Wh 3 Bk Wh 3CRI5 b Ol Wh 3 Bk Wh 5CRI6 b Ol Wh 3 Bk Y 5CRI7 b Ol Wh 2 Bk Y 3CRI8 b Ol Wh 1 Bk Y 1CRI9 b Ol Wh 2 Bk Wh 2CRI10 b Ol Wh 3 Bk Wh 3CRI11 b Ol Wh 3 Bk Y 3CRI12 b Ol Wh 3 Bk Wh 3CRI13 b OlBr Br 5 Bk yBr 5CRI14 b Ol Wh 1 Bk Wh 7CRI15 b Ol Wh 1 Bk Y 4CRI16 b Ol Wh 3 Bk Wh 3
Mycelium colour: brown (Br), yellow (Y), olive (Ol), black (Bk), white (Wh), yellowish brown (yBr), olive brown (OlBr). Texture: b – cottony (ISCC-NBS Names, Rayner, 1970)
C. beticola isolates growing on CZ medium were identical only in mycelium texture on the surface, while the colour of the mycelia, as well as the borderline colour and the width varied between the isolates on both, the surface and beneath of the medium. Compared to the colour of mycelium developed on PDA and MEA, mycelium growing on the CZ medium was substantially darker (Table 5).
Table 5. Morphological characteristics of C. beticola isolates on CZ medium
Isolatessurface of medium beneath the medium
mycelium texture
mycelium colour
borderlinecolour
borderline width (mm)
mycelium colour
borderlinecolour
borderline width (mm)
CRI1 b Wh-Ol OlGr 1 OlBr Wh 1CRI2 b OlGr OlGr 1 OlBr Wh-Ol 1CRI3 b Wh-Ol Wh 2 OlBr Wh 2CRI4 b OlBr Wh 2 Bk Wh 3CRI5 b OlBr Wh 2 Bk Wh 2CRI6 b OlGr yPk 3 Bk yPk 3CRI7 b Wh-Ol Wh 3 Bk Wh 3CRI8 b Wh-Ol yPk 8 Bk yPk 8CRI9 b OlBr Wh 1 Bk Wh 1CRI10 b OlGr Wh 3 Bk Wh 3CRI11 b OlGr Wh 1 Bk Wh 2CRI12 b OlBr Wh 1 Bk Wh 1CRI13 b OlBr Wh 2 Bk Wh 2CRI14 b OlBr Wh 3 Bk Wh 3CRI15 b OlGr Wh 1 Bk Wh 1CRI16 b OlBr Wh 2 Bk Wh 2

42
Morphological and Genetic Diversity of Cercospora beticola Isolates
Mycelium colour: olive (Ol), black (Bk), white (Wh), yellowish pink (yPk), olive brown (OlBr), olive green (OlGr), b – cottony. Texture: b – cottony (ISCC-NBS Names, Rayner, 1970)
None of the tested isolates grew at temperatures 10°C and 40°C. Range of temperatures at which mycelial growth was recorded for all isolates varied from 15°C to 35°C (Table 6). Optimal temperature was 25°C, with the mean mycelial growth of 25.4±1.27 mm.
Table 6. The mean growth of isolates on different temperature range on PDA medium
Isolatesmean growth±std.dev.
10°C 15°C 20°C 25°C 30°C 35°C 40°C
CRI1 0.00±0.00 8.5±0.40 18.7±0.25 25.5±0.40 20.8±0.72 9.9±0.26 0.00±0.00
CRI2 0.00±0.00 8.2±0.30 18.3±0.32 25.4±0.40 21.3±0.29 9.2±0.31 0.00±0.00
CRI3 0.00±0.00 8.6±0.17 19.0±0.26 28.5±0.45 22.2±0.58 9.8±0.30 0.00±0.00
CRI4 0.00±0.00 8.2±0.68 16.9±0.25 24.7±0.78 18.7±0.29 10.6±0.30 0.00±0.00
CRI5 0.00±0.00 8.2±0.25 18.4±0.25 25.1±0.15 20.0±0.50 10.6±0.30 0.00±0.00
CRI6 0.00±0.00 8.1±0.36 17.7±0.45 25.0±0.67 19.1±0.35 10.2±0.40 0.00±0.00
CRI7 0.00±0.00 8.8±0.20 18.0±0.26 25.3±0.10 19.2±0.30 10.3±0.26 0.00±0.00
CRI8 0.00±0.00 9.0±0.60 19.3±0.32 25.7±0.56 21.3±0.51 10.0±0.46 0.00±0.00
CRI9 0.00±0.00 9.5±0.42 19.3±0.49 24.6±0.35 20.5±0.35 10.5±0.23 0.00±0.00
CRI10 0.00±0.00 10.2±0.21 19.3±0.46 25.0±0.40 20.8±0.64 10.2±0.15 0.00±0.00
CRI11 0.00±0.00 7.8±0.38 18.6±0.35 24.2±0.38 21.7±0.56 11.0±0.21 0.00±0.00
CRI12 0.00±0.00 8.1±0.32 18.9±0.15 25.0±0.32 22.7±0.56 9.7±0.47 0.00±0.00
CRI13 0.00±0.00 8.5±0.36 19.4±0.38 24.3±0.11 19.3±0.38 9.9±0.21 0.00±0.00
CRI14 0.00±0.00 10.2±0.25 18.6±0.35 24.4±0.25 21.6±0.38 9.7±0.26 0.00±0.00
CRI15 0.00±0.00 8.2±0.15 20.4±0.38 25.1±0.56 22.6±0.38 10.0±0.32 0.00±0.00
CRI16 0.00±0.00 9.5±0.36 19.7±0.11 24.6±0.15 21.3±0.11 10.7±0.26 0.00±0.00
Average 0.00±0.00 8.2±1.96 18.8±0.84 25.1±0.99 20.8±1.26 10.1±0.46 0.00±0.00
Genetic diversity of ITS region for Cercospora sp.
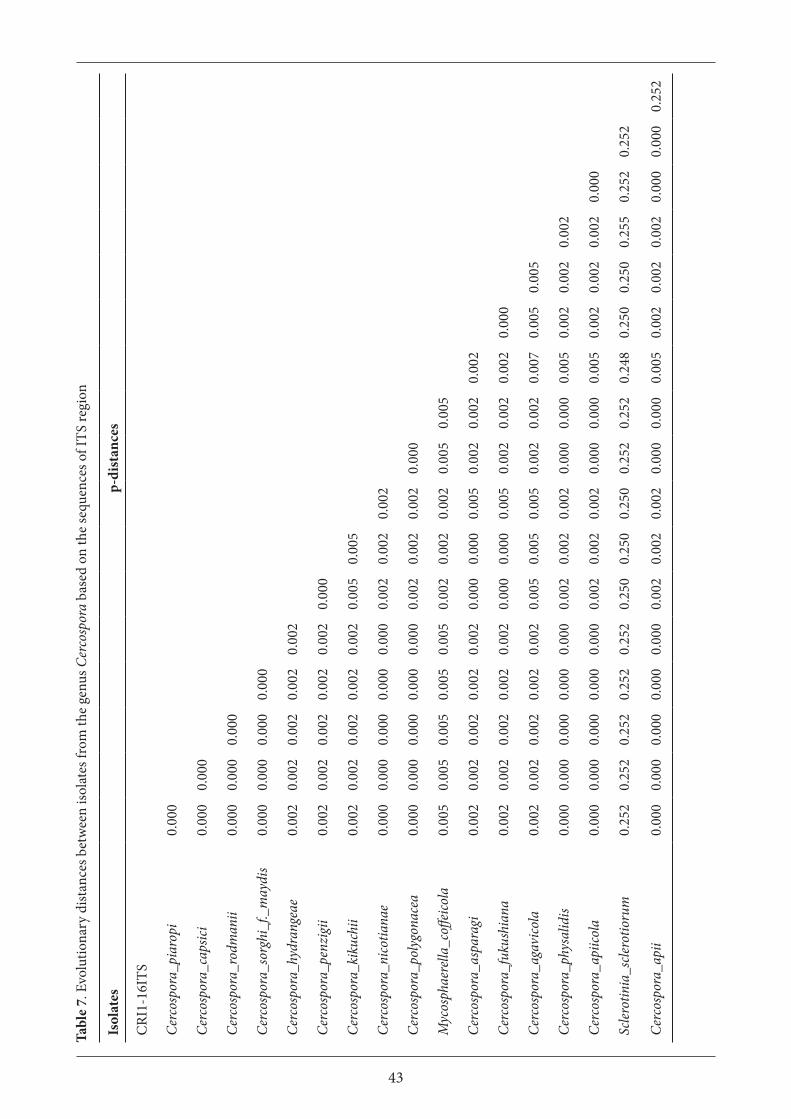
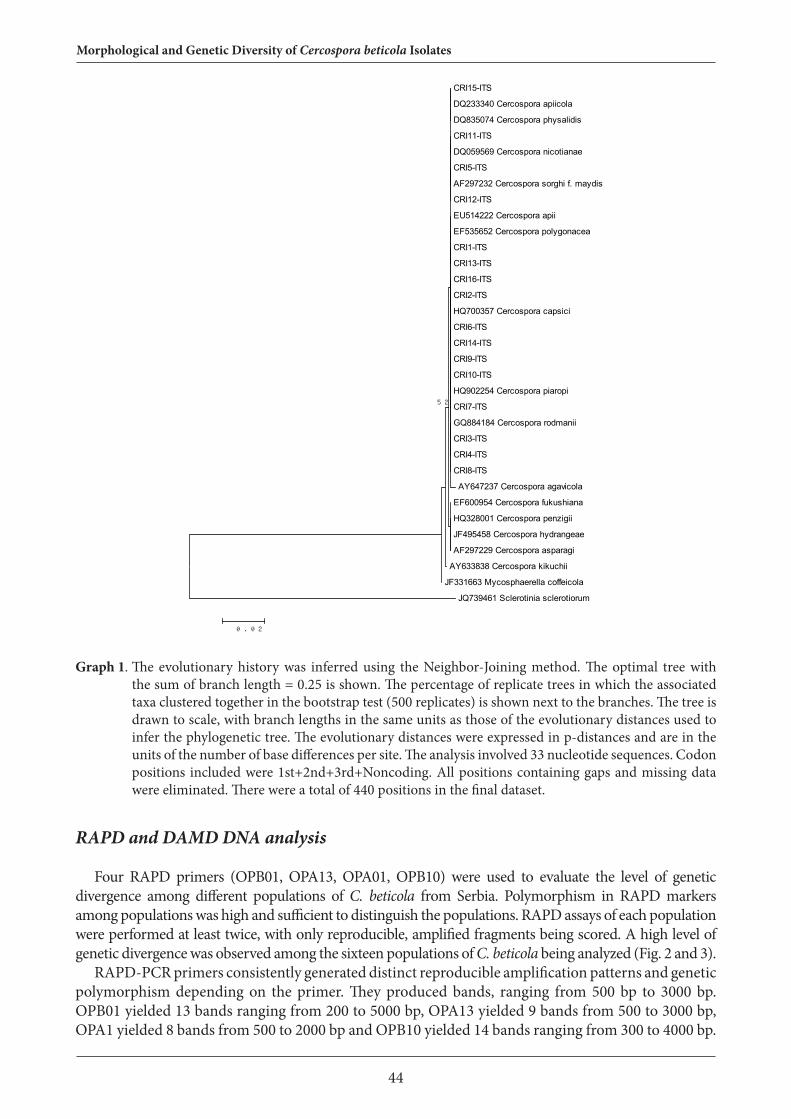
ITS region was successfully amplified for all 16 isolates of C. beticola, for which the alignment and pairwise comparison determined that all were identical. For the phylogenetic analysis, ITS sequences for Cercospora species were obtained from the Gene Bank as follows: C. piaropi (HQ902254), C. capsici (HQ700357), C. hydrangeae (JF495458), C. rodmanii (GQ884184), C. sorghi f. maydis (AF297232), C. apii (EU514222), C. nicotianae (AF297230), C. penzigii (HQ328001), C. kikuchii (AY633838), C. polygonacea (EF535652), C. asparagi (AF297229), C. fukushiana (EF600954), C. physalidis (DQ835074), C. agavicola (AY647237) and C. apiicola (DQ233340). Species Sclerotinia sclerotiorum (JQ739461) and Mycosphaerella coffeicola (JF331663) were used as outgroups to root the tree. Neighbor Joining phylogenetic tree constructed with the ITS sequences showed clustering of all Cercospora species together within the same group. Distances between Cercospora ranged from 0.0 to 0.2% with average evolutionary distance of 0.1% (Table 7). Unlike the Sclerotinia sclerotiorum, which has divided as an outgroup diverging from 24.8% to 25.5% (Graph 1). Mycosphaerella coffeicola clustered with species from the genus Cercospora with ITS region divergence range from 0.2 to 0.7% (Table 7).
43
Tabl
e 7.
Evo
lutio
nary
dist
ance
s bet
wee
n iso
late
s fro
m th
e ge
nus C
erco
spor
a ba
sed
on th
e se
quen
ces o
f ITS
regi
on
Isol
ates
p-di
stan
ces
CRI
1-16
ITS
Cerc
ospo
ra_p
iaro
pi0.
000
Cerc
ospo
ra_c
apsic
i0.
000
0.00
0
Cerc
ospo
ra_r
odm
anii
0.00
00.
000
0.00
0
Cerc
ospo
ra_s
orgh
i_f._
may
dis
0.00
00.
000
0.00
00.
000
Cerc
ospo
ra_h
ydra
ngea
e0.
002
0.00
20.
002
0.00
20.
002
Cerc
ospo
ra_p
enzi
gii
0.00
20.
002
0.00
20.
002
0.00
20.
000
Cerc
ospo
ra_k
ikuc
hii
0.00
20.
002
0.00
20.
002
0.00
20.
005
0.00
5
Cerc
ospo
ra_n
icotia
nae
0.00
00.
000
0.00
00.
000
0.00
00.
002
0.00
20.
002
Cerc
ospo
ra_p
olyg
onac
ea0.
000
0.00
00.
000
0.00
00.
000
0.00
20.
002
0.00
20.
000
Myc
osph
aere
lla_c
offei
cola
0.00
50.
005
0.00
50.
005
0.00
50.
002
0.00
20.
002
0.00
50.
005
Cerc
ospo
ra_a
spar
agi
0.00
20.
002
0.00
20.
002
0.00
20.
000
0.00
00.
005
0.00
20.
002
0.00
2
Cerc
ospo
ra_f
ukus
hian
a0.
002
0.00
20.
002
0.00
20.
002
0.00
00.
000
0.00
50.
002
0.00
20.
002
0.00
0
Cerc
ospo
ra_a
gavi
cola
0.00
20.
002
0.00
20.
002
0.00
20.
005
0.00
50.
005
0.00
20.
002
0.00
70.
005
0.00
5
Cerc
ospo
ra_p
hysa
lidis
0.00
00.
000
0.00
00.
000
0.00
00.
002
0.00
20.
002
0.00
00.
000
0.00
50.
002
0.00
20.
002
Cerc
ospo
ra_a
piico
la0.
000
0.00
00.
000
0.00
00.
000
0.00
20.
002
0.00
20.
000
0.00
00.
005
0.00
20.
002
0.00
20.
000
Scler
otin
ia_s
clero
tioru
m0.
252
0.25
20.
252
0.25
20.
252
0.25
00.
250
0.25
00.
252
0.25
20.
248
0.25
00.
250
0.25
50.
252
0.25
2
Cerc
ospo
ra_a
pii
0.00
00.
000
0.00
00.
000
0.00
00.
002
0.00
20.
002
0.00
00.
000
0.00
50.
002
0.00
20.
002
0.00
00.
000
0.25
2
44
Morphological and Genetic Diversity of Cercospora beticola Isolates
CRI15-ITS
DQ233340 Cercospora apiicola
DQ835074 Cercospora physalidis
CRI11-ITS
DQ059569 Cercospora nicotianae
CRI5-ITS
AF297232 Cercospora sorghi f. maydis
CRI12-ITS
EU514222 Cercospora apii
EF535652 Cercospora polygonacea
CRI1-ITS
CRI13-ITS
CRI16-ITS
CRI2-ITS
HQ700357 Cercospora capsici
CRI6-ITS
CRI14-ITS
CRI9-ITS
CRI10-ITS
HQ902254 Cercospora piaropi
CRI7-ITS
GQ884184 Cercospora rodmanii
CRI3-ITS
CRI4-ITS
CRI8-ITS
AY647237 Cercospora agavicola
EF600954 Cercospora fukushiana
HQ328001 Cercospora penzigii
JF495458 Cercospora hydrangeae
AF297229 Cercospora asparagi
AY633838 Cercospora kikuchii
JF331663 Mycosphaerella coffeicola
JQ739461 Sclerotinia sclerotiorum
52
0.02
Graph 1. The evolutionary history was inferred using the Neighbor-Joining method. The optimal tree with the sum of branch length = 0.25 is shown. The percentage of replicate trees in which the associated taxa clustered together in the bootstrap test (500 replicates) is shown next to the branches. The tree is drawn to scale, with branch lengths in the same units as those of the evolutionary distances used to infer the phylogenetic tree. The evolutionary distances were expressed in p-distances and are in the units of the number of base differences per site. The analysis involved 33 nucleotide sequences. Codon positions included were 1st+2nd+3rd+Noncoding. All positions containing gaps and missing data were eliminated. There were a total of 440 positions in the final dataset.
RAPD and DAMD DNA analysis
Four RAPD primers (OPB01, OPA13, OPA01, OPB10) were used to evaluate the level of genetic divergence among different populations of C. beticola from Serbia. Polymorphism in RAPD markers among populations was high and sufficient to distinguish the populations. RAPD assays of each population were performed at least twice, with only reproducible, amplified fragments being scored. A high level of genetic divergence was observed among the sixteen populations of C. beticola being analyzed (Fig. 2 and 3).
RAPD-PCR primers consistently generated distinct reproducible amplification patterns and genetic polymorphism depending on the primer. They produced bands, ranging from 500 bp to 3000 bp. OPB01 yielded 13 bands ranging from 200 to 5000 bp, OPA13 yielded 9 bands from 500 to 3000 bp, OPA1 yielded 8 bands from 500 to 2000 bp and OPB10 yielded 14 bands ranging from 300 to 4000 bp.

45
Figure 2. Fingerprints obtained by RAPD analysis with OPB1 primer; CRI 1-16 - Cercospora beticola isolates; M-marker
Figure 3. Dendrogram of distances between isolates of C. beticola tested for RAPD profiles with OPB01 primer
Repetitive DNA with tandem repeats of a core or consensus sequences (minisatellites) has been used to study intraspecific genetic variability (Fig. 4).
Figure 4. Fingerprints obtained by DAMD analysis with SAT2 primer

46
Morphological and Genetic Diversity of Cercospora beticola Isolates
The electrophoretic profiles obtained with the minisatellites exhibited bands between 200 and 5000 bp with a high level of polymorphism primers (SAT1) and (SAT2), but M 13 yielded pattern with no difference between the populations of C. beticola. Cluster analysis for RAPD and DAMD led to the dendrograms presented in Fig. 3 and 5. All the strains showed different amplification patterns and were clustered in distinct groups, with different rate of similarities among each other.
Figure 5. Dendrogram of distances between isolates of C. beticola tested for DAMD profiles with SAT2 primer
Discussion
Attempt to identify Cercospora species based on the host plant they are associated with and morphological characteristics of the mycelia developed on different nutrition media, failed as a valid method due to a high homology of congeneric species. Ruppel (1972) has previously reported variability in morphology of C. beticola isolates of a wide geographic origin. In addition, recent studies have shown that even C. beticola isolates originating from the same spot, significantly vary in morphology, regardless the nutrition medium they were developed on (Moretti et al., 2004). In our study, the most intensive growth of C. beticola isolates was recorded on PDA, compared to MEA and CZ. No significant and stable difference was detected in growth dynamics and morphology of the mycelia developed on the same nutrition medium. No clear pattern of the morphology and genetic variation

47
associated with the geographic origin, neither the host plant was determined for Serbian isolates of C. beticola. In addition, isolates showed no alternations in growth rate on different temperature regimes.
Selected RAPD primers yielded highly reproducible patterns and gave the distinction of the C. beticola populations. RAPD profiles generated with primer OPB01 were heterogeneous among samples originating from different areas and hosts. RAPD analysis demonstrated the existence of genetic polymorphism with three main clusters represented by distinctive groups of isolates. Genetic variation within the C. beticola species was confirmed also with DAMD primers, with three differenced clusters. To understand the origin of genetic variability in C. beticola and to know the genetic structure of its populations, further studies must be carried out. Anyhow, the results obtained suggest that RAPD markers are valuable for the genetic divergence estimation in C. beticola and for the study of divergence among populations.
Molecular identification of C. beticola with species-specific primers amplifying a calmoduline gene was the only successful method of species confirmation. On the other hand, phylogenetic analysis showed that ITS region is not variable enough to be used for identification of species from the genus Cercospora, which clustered all in the same group with low evolutionary rate of 0.1%. These results present just another confirmation that the species belonging to the C. apii sensu lato group, aside the morphological similarity, also share homology on a molecular level (Goodwin et al. 2001). This corresponds to the results previously reported by Stewart et al. (1999) and Taylor et al. (2003). ITS region could be used for the confirmation of the higher taxon, i.e. the genus Cercospora, but considering the low evolutionary distance from 0.1 to 0.7% of a closely related species Mycosphaerella coffeicola, additional methods of identification are required, either another gene or morphological characteristics.
Conclusions
The most intensive growth of C. beticola isolates was recorded on PDA medium. Optimal temperature for mycelium development was 25°C. The isolates did not exhibit any stable difference in growth dynamics and mycelium morphology developed on none of the three used nutrition media. No clear pattern of the morphology and genetic variation associated with the geographic origin, neither the host plant was determined. Substantial genetic diversity between C. beticola isolates was detected with RAPD and DAMD patterns. On the other hand, low evolutionary distances were determined for the ITS region between isolates of C. beticola and other congeneric species, clearly discarding this gene as a suitable marker for species recognition within the genus Cercospora.
Acknowledgements
This study is funded by the project TR31018 of Ministry of Education, Science and Technological Development of the Republic of Serbia.
References
Berger RD, Hanson EW (1963). Pathogenicity, host-parasite relationship, and morphology of some forage legume Cercosporae, and factors related to disease development. Phytopathology 53:500-508.
Chupp C (1954). A Monograph of the Fungus Genus Cercospora. Published by the author, Ithaca, NY.Crous PW, Braun U (2003). Mycosphaerella and its anamorphs: 1. Names published in Cercospora and
Passalora. Centraalbureau voor Schimmelcultures, Utrecht, The Netherlands.Felsenstein J (1993). Phylogeny inference package version 3.5 c. Seattle, Wash: Department of Genetics,
University of Washington.

48
Morphological and Genetic Diversity of Cercospora beticola Isolates
Goodwin SB, Dunkley LD, Zismann VL (2001). Phylogenetic analysis of Cercospora and Mycosphaerella based on the internal transcribed spacer region of ribosomal DNA. Phytopathology 91:648-658.
Groenewald M, Groenewald JZ, Crous PW (2005). Distinct species exist within the Cercospora apii morphotype. Phytopathology 95:951-959.
Groenewald M, Groenewald JZ, Braun U, Crous PW (2006). Host range of Cercospora apii and C. beticola and description of C. apiicola, a novel species from celery. Mycologia 98 (2):275–285.
Hibbett DS, Binder M, Bischoff JF, Blackwell M, Cannon PF, Eriksson OE, Huhndorf S, James T, Kirk PM, Lucking R, Lumbsch TH, Lutzoni F, Matheny PB, Mclaughlin DJ, Powell MJ, Redhead S, Schoch CL, Spatafora JW, Stalpers JA, Vilgalys R, Aime MC, Aptroot A, Bauer R, Begerow D, Benny GL, Castlebury LA, Crous PW, Dai Y, Gams W, Geiser DM, Griffith GW, Gueidan C, Hawksworth DL, Hestmark G, Hosaka K, Humber RA, Hyde KD, Ironside JE, Koljalg U, Kurtzman CP, Larsson KH, Lichtwardt R, Longcore J, Miadlikowska J, Miller A, Moncalvo JM, Mozley-Standridge S, Oberwinkler F, Parmasto E, Reeb V, Rogers JD, Roux C, Ryvarden L, Sampaio JP, Schubler A, Sugiyama J, Thorn RG, Tibell L, Untereiner WA, Walker C, Wang Z, Weir A, Weiss M, White MM, Winka K, Yao Y, Zhang N (2007). A higher-level phylogenetic classification of the Fungi. Mycological research, III:509-547.
Holtschulte B (2000). Cercospora beticola_– world-wide distribution and incidence. Pages 5-16 in: Cercospora beticola Sacc. Biology, Agronomic Influences and Control Measures in Sugar Beet IIRB. M. J. C. Asher, B. Holtschulte, M. M. Richard, F. Rosso, G. Steinrucken, and R. Beckers, eds. International Institute for Beet Research, Belgium.
Kaiser WJ, Lukezic FL (1965). Brown spot disease of banana caused by Cercospora hayi. Phytopathology 55:977-980.
Nei M, Li WH (1979). Mathematical model for studying genetic variation in terms of restriction endonucleases. Proceedings of the National Academy of Sciences of the United States of America, 76:1619-1626.
Pollack FG (1987). An annotated compilation of Cercospora names. Mycol. Mem. 12:1-212.Pons N, Sutton BC, Gay JL (1985). Ultrastructure of conidiogenesis in Cercospora beticola. Transactions
of the British Mycological Society 85:405-416Ruppel EG (1972). Variation among isolates of Cercospora beticola from sugar beet. Phytopathology,
62:134-136.Ryner RW (1970). A Mycological Colour Chart. CAB, Kew.Shane WW, Teng PS (1992). Impact of Cercospora leaf spot on root weight, sugar yield, and purity of
Beta vulgaris. Plant Dis. 76:812- 820.Stewart EL, Liu Z, Crous PW, Szabo LJ (1999). Phylogenetic relationships among some cercosporoid
anamorphs of Mycosphaerella based on rDNA sequence analysis. Mycological Research 103:1491-1499.
Tamura K, Dudley J, Nei M, Kumar S (2007). MEGA4: Molecular Evolutionary Genetics Analysis (MEGA)
Taylor JE, Groenewald JZ, Crous PW (2003). A Phylogenetic analysis of Mycosphaerellaceae leaf spot pathogens of Proteaceae. Mycological Research 107:653-658.
Tessmann DJ, Charudattan R, Kistler HC, Rosskopf EN (2001). A molecular characterization of Cercospora species pathogenic to water hyacinth and emendation of C. piaropi. Mycologia 93:323-334.
Welles CG (1933). Taxonomic studies on the genus Cercospora in the Philippine Islands. Am. J. Bot. 12:195-218.
White TJ, Bruns T, Lee S, Taylor J (1990). Amplification and direct sequencing of fungal ribosomal RNA genes for phylogenetics. In: PCR protocols: a guide to methods and applications, chapt 38, 315–322. (Eds. Innis M, Gelfand DH, Shinsky JJ and White TJ). Academic Press, San Diego, CA (US).