
Morphogenesis of defects and tactoids during isotropic ... · Morphogenesis of defects and tactoids...
20
Morphogenesis of defects and tactoids during isotropic–nematic phase transition in self- assembled lyotropic chromonic liquid crystals This article has been downloaded from IOPscience. Please scroll down to see the full text article. 2013 J. Phys.: Condens. Matter 25 404202 (http://iopscience.iop.org/0953-8984/25/40/404202) Download details: IP Address: 131.123.232.10 The article was downloaded on 11/09/2013 at 19:51 Please note that terms and conditions apply. View the table of contents for this issue, or go to the journal homepage for more Home Search Collections Journals About Contact us My IOPscience
Transcript of Morphogenesis of defects and tactoids during isotropic ... · Morphogenesis of defects and tactoids...

Morphogenesis of defects and tactoids during isotropic–nematic phase transition in self-
assembled lyotropic chromonic liquid crystals
This article has been downloaded from IOPscience. Please scroll down to see the full text article.
2013 J. Phys.: Condens. Matter 25 404202
(http://iopscience.iop.org/0953-8984/25/40/404202)
Download details:
IP Address: 131.123.232.10
The article was downloaded on 11/09/2013 at 19:51
Please note that terms and conditions apply.
View the table of contents for this issue, or go to the journal homepage for more
Home Search Collections Journals About Contact us My IOPscience

IOP PUBLISHING JOURNAL OF PHYSICS: CONDENSED MATTER
J. Phys.: Condens. Matter 25 (2013) 404202 (19pp) doi:10.1088/0953-8984/25/40/404202
Morphogenesis of defects and tactoidsduring isotropic–nematic phase transitionin self-assembled lyotropic chromonicliquid crystals
Young-Ki Kim, Sergij V Shiyanovskii and Oleg D Lavrentovich
Liquid Crystal Institute and Chemical Physics Interdisciplinary Program, Kent State University, Kent,OH 44242, USA
E-mail: [email protected]
Received 6 January 2013, in final form 4 March 2013Published 11 September 2013Online at stacks.iop.org/JPhysCM/25/404202
AbstractWe explore the structure of nuclei and topological defects in the first-order phase transitionbetween the nematic (N) and isotropic (I) phases in lyotropic chromonic liquid crystals(LCLCs). The LCLCs are formed by self-assembled molecular aggregates of various lengthsand show a broad biphasic region. The defects emerge as a result of two mechanisms:(1) surface-anisotropy that endows each N nucleus (‘tactoid’) with topological defects thanksto preferential (tangential) orientation of the director at the closed I–N interface, and(2) Kibble mechanism with defects forming when differently oriented N tactoids merge witheach other. Different scenarios of phase transition involve positive (N-in-I) and negative(I-in-N) tactoids with nontrivial topology of the director field and also multiply connectedtactoid-in-tactoid configurations. The closed I–N interface limiting a tactoid shows a certainnumber of cusps; the lips of the interface on the opposite sides of the cusp make an angledifferent from π . The N side of each cusp contains a point defect-boojum. The number ofcusps shows how many times the director becomes perpendicular to the I–N interface whenone circumnavigates the closed boundary of the tactoid. We derive conservation laws thatconnect the number of cusps c to the topological strength m of defects in the N part of thesimply connected and multiply connected tactoids. We demonstrate how the elastic anisotropyof the N phase results in non-circular shape of the disclination cores. A generalized Wulffconstruction is used to derive the shape of I and N tactoids as a function of I–N interfacialtension anisotropy in the approximation of frozen director field of various topological chargesm. The complex shapes and structures of tactoids and topological defects demonstrate animportant role of surface anisotropy in morphogenesis of phase transitions in liquid crystals.
(Some figures may appear in colour only in the online journal)
1. Introduction
Topological defects play an important role in morphogenesis(from the Greek morphe shape and genesis creation) of
Content from this work may be used under the terms ofthe Creative Commons Attribution 3.0 licence. Any further
distribution of this work must maintain attribution to the author(s) and thetitle of the work, journal citation and DOI.
phase transitions in cosmological models and in condensedmatter [1–6]. In both cases, one deals with a high-temperaturesymmetric phase and a low-temperature phase in which thesymmetry is broken. In the model of the early Universeproposed by Kibble [7], topological defects such as cosmicstrings form during the phase transition, when domains of thenew state grow and merge. The order parameter is assumedto be uniform within each domain. When domains with
10953-8984/13/404202+19$33.00 c© 2013 IOP Publishing Ltd Printed in the UK & the USA

J. Phys.: Condens. Matter 25 (2013) 404202 Y-K Kim et al
different ‘orientations’ of space–time merge, their junctionshave a certain probability of producing defects. Similar effectsare expected in condensed matter systems, ranging fromsuperfluids [6, 8] to solids [9].
One of the simplest experimental systems to explorethe interplay of phase transitions and topological defectsis a uniaxial nematic (N) liquid crystal (LC). In the Nphase, the molecules (or their aggregates) are aligned alonga direction called the director n (n2
= 1) with the propertyn ≡ −n that stems from a non-polar character of ordering. Inthree-dimensional (3D) space, the N phase allows three typesof topologically stable defect: linear defects (disclinations),point defects in the bulk (hedgehogs) and point defects at thesurfaces (boojums) [10].
The isotropic–nematic (I–N) transition is of the firstorder. Besides the transition temperature TNI, there are twoother important temperatures T∗ and T∗∗, characterizing thespinodal points: T∗ < TNI is the limit of metastability ofthe I phase upon cooling and T∗∗ > TNI is the limit ofoverheating the N phase. The critical size R∗ of N nuclei,determined by the gain in the bulk condensation energyand the loss in the surface energy of the I–N interface,is about 10 nm near T∗ [11]. As these nuclei grow andcoalesce, they can produce topological defects at the pointsof junction. Chuang et al [12] and Bowick et al [13]performed Kibble-mechanism-inspired experiments on theI–N transition and described the dynamics of the ensuingdefect networks. Mostly disclinations were observed, withhedgehogs appearing seldom; boojums were not recorded.The probability of forming a disclination is significant (∼1/πwhen there are three merging domains [14]). For a hedgehogin a 3D space, as explained by Hindmarsh [15], one needsmany more uncorrelated domains, which drastically reducesthe probability of forming the defect.
In the analysis of defects emerging during the I-to-Nphase transition, it is usually assumed that the director isroughly uniform, n(r) = const, within each N nucleus [13,15]. This assumption mirrors the cosmological model, inwhich each expanding bubble preserves spatial uniformity ofthe scalar field in its interior and at its surface [7, 16]. In otherwords, the I–N interfacial tension is considered as ‘isotropic’,i.e. independent of director orientation at the surface. Thisassumption is certainly valid for small nuclei. As they grow,however, one needs to account for the anisotropy of the I–Ninterface, as discussed below.
The surface properties of LCs are anisotropic because themolecular interactions set up a preferred orientation of n atan interface, called the ‘easy direction’. For the I–N interface,it is convenient to introduce an ‘easy angle’ α between thenormal υ to the interface and the easy direction. Dependingon the details of the anisotropic molecular interactions, theeasy direction might be perpendicular (α = 0) to the interface,conically tilted (0 < α < π/2) or tangential (α = π/2, so thatn can adopt any orientation in the plane of the interface).To deviate the director from the easy axis to some angleα 6= α, one needs to perform work that is in the firstapproximation proportional to the squared angular tilt (α −α)2. The anisotropic potential of the I–N interface is often
written in the so-called Rapini–Papoular form [17] useful foranalytical analysis: σ = σ0[1 + w sin2(α − α)], where σ0 isthe orientation-independent part of the surface tension andw is the surface anchoring coefficient. For small angles, theRapini–Papoular potential describes the work σ0w(α − α)2
needed to realign the director.The surface anchoring by itself is capable of setting up
stable topological defects in the interior of each and every Ndomain [18, 19], in order to satisfy the theorems of Poincareand Gauss that demand a certain number of singularities in thevector field (such as n) defined on surfaces with a non-zeroEuler characteristic E (E = 2 for a sphere). Whether or notthe director in an N nucleus of the size R will follow the ‘easyaxis’, depends on the balance of the surface anchoring energy∼σ0wR2 and the elastic cost of bulk deformations ∼KR,where K is the Frank elastic constant. The last estimate isconstructed by multiplying the elastic energy density ∼K/R2
by the volume ∼R3 of the distorted domain. The ratio of thebulk elastic constant K and the surface anchoring strengthσ0w defines the so-called de Gennes–Kleman extrapolationlength, ξ = K/σ0w. When the N nucleus is small, R �ξ , the director within it can be assumed to be uniform,since KR � σ0wR2. When R � ξ and thus σ0wR2
� KR,the surface anchoring conditions need to be satisfied, whichnecessitates the existence of topological defects in each andevery N drop. For example, a large spherical drop withα = 0 must contain at least one point defect-hedgehog; aradial director field is one of the possible configurationssatisfying the perpendicular surface anchoring. For typicalthermotropic N materials, near the I–N transition, K ≈ 2 pNand σ0w ∼ (10−7–10−6) J m−2 [20], thus ξ ∼ (1–10) µm.The assumption of a uniform director within the nuclei is thusvalid when the nuclei are of a submicron size. However, eachN nucleus that is larger than ξ must carry topological defectsas an intrinsic feature caused by surface anisotropy.
The purpose of this work is to explore experimentally thesurface-anisotropy-controlled morphogenesis of nuclei andtopological defects during the phase transition in an LC thatfeatures a broad biphasic region of coexisting N and I phases,the so-called lyotropic chromonic liquid crystal (LCLC).Lyotropic LCs are typically formed by water dispersionsof anisometric colloidal particles such as rod-like tobaccomosaic viruses (TMVs). According to Onsager, when thevolume fraction of rods exceeds some critical value, the rodsalign parallel to each other, to maximize the translationalentropy at the expense of orientational entropy [21]. The maindistinctive feature of LCLCs is that their ‘building units’ arenot of a fixed shape, representing self-assembled molecularaggregates [22–25]. The range of materials that form LCLCsincludes dyes, drugs [22–25], nucleotides [26] and DNAoligomers [27, 28]. Typically, an LCLC molecule is plank-likeor disc-like with an aromatic flat core and peripheral polargroups. In water, the cores stack face-to-face. The aggregates,bound by weak non-covalent interactions, are polydisperse,with a length distribution that depends on concentration,temperature, ionic strength, etc [23, 29–32]. LCLCs showa temperature- and concentration-triggered first order I–Ntransition with a broad (5–15 ◦C) coexistence region. At high
2

J. Phys.: Condens. Matter 25 (2013) 404202 Y-K Kim et al
temperatures, the aggregates are short and orient randomly. Asthe temperature decreases (or the concentration increases), theaggregates elongate, multiply, and eventually some fraction ofthem separates from the parental I phase and forms N phasenuclei that are called tactoids [31, 33, 34]. For a descriptionof tactoids in LCs other than chromonics, see [35–40].The main goal of this work is to describe experimentallythe surface anchoring-controlled morphogenesis of tactoidsand accompanying topological defects during the I-to-N andN-to-I transitions.
This article is organized as follows. In section 2,we present a relatively simple ‘background’ example of athermotropic LC, formed by organic compounds within acertain range of temperatures. In these materials, the N nucleishow topological defects even when the Kibble mechanismis not relevant, i.e., defects appear within each and every Nnucleus provided its size is large enough, R > (1–10) µm.In what follows, we switch to LCLCs. We limit ourselvesto a two-dimensional (2D) experimental setting, describedin section 3, in which the LCLC is confined between twoclose (a few micrometers) separated plates, in order tomap simultaneously the details of the director field and theshape of the N and I domains. The anisotropic nature ofthe I–N interface in LCLCs favors n being tangential, α =π/2. Section 4 introduces the elements of the topologicaldescription of point defects in 2D that are of two types.Point defect disclinations of integer and semi-integer strengthare located in the interior of the N domain (although theyin principle might also exist at the I–N interface). Pointdefects-boojums of continuously defined topological chargesare located at the cusps of the I–N interface. We definethe cusp as a point that separates two differently tiltedshoulders of the I–N interface. Section 5 describes the earlystages of the I–N phase transition, in which the nucleating,growing and coalescing N tactoids produce disclinationsof various strengths m = ±1/2 through a process similarto the Kibble mechanism. The simplest N tactoid has twocusps and two boojums at the poles; this shape is discussedin section 6. The scenarios of the later stages of I–Ntransitions are presented in section 7. They feature residualsimply connected I tactoids surrounded by director fieldsof various strengths m = 0,±1/2, ±1. As the temperatureis lowered, the disclinations m = ±1 split into pairs ofhalf-integer lines. The cores of m = ±1/2 disclinations inthe homogeneous N phase (formed at the end of the phasetransition) show a non-circular shape described in section 8using the idea of anisotropic elasticity of the LCLC. Thereverse transition, from the homogeneous N phase withdisclinations into the I phase, is described in section 9. Thescenarios include nucleation of I tactoids either in the uniformpart of the director configuration or at the cores of m = ±1/2disclinations. The I tactoids feature cusps, the number ofwhich depends on the strength m of the surrounding directorconfiguration c= 2(1−m). The area of I tactoids grows nearlylinearly with temperature, reflecting the similar temperaturedependences of the volume fractions of coexisting phases. Insection 9, we also present tactoid-in-tactoid scenarios withmultiply connectivity. Finally, in section 10, we use the Wulff
construction to describe the shape of topologically nontrivialN and I tactoids for an elastically frozen director field withdifferent values of m. A different number of cusps emergesas a natural result of surface anchoring anisotropy and thedisclination-imposed requirement to have regions in which theactual director tilt α at the I–N interface is different from theeasy axis α = π/2. The results illustrate an important role ofthe surface tension anisotropy in the morphogenesis of the I–Nphase transition.
2. Point defects and disclination loops in 3D nematicnuclei of thermotropic liquid crystals
Experimental exploration of the morphogenesis of nuclei inthermotropic LCs is hindered by the fact that the temperaturesTNI,T∗ and T∗∗ are all very close (one degree or so) to eachother. Nevertheless, by carefully stabilizing the temperature,one can obtain and observe large N droplets that coexistwith the I background, figure 1(a). We use a commerciallyavailable nematic mixture E7 (EM Industries, Inc.) comprisedof cyanobiphenyl compounds. For these materials, Faettiand Palleschi [20] demonstrated experimentally that the easyangle α between n and the normal υ to the I–N interface is inthe range 48◦–65◦. The tilted easy axis implies that there isa non-zero vector projection onto the interface, n − υ(υ · n).According to the Poincare theorem, such a field must containsingularities of a total strength
∑imi equal to the Euler
characteristic of a surface,∑
imi = E; for a sphere, E = 2.The strength mi of each defect is determined as the numberof rotations of vector n− υ(υ · n) as one circumnavigates thedefect core once. The two defects on the poles of each dropletin figure 1(a) represent these singularities, called boojums,each of strength m = 1.
Besides the 2D topological charges m, one can alsointroduce a 3D characteristic for each boojum, defined as
A = 14π
vn[∂n∂η1×
∂n∂η2
]dη1dη2 =
m2 (n · υ − 1) + N, where
(η1, η2) is a pair of coordinates on the semispherical surfacesurrounding the boojum from the N side and N is aninteger [18]. In the last expression, the director field is treatedas a vector and υ is assumed to be directed outward from theN domain. Note that the definition of A would be ambiguousif n were treated as a director with the states n and −nbeing equivalent: replacing n with −n in the definition of Areverses the sign of A. If there are no disclination lines in theinterior of the N phase, the ambiguity is easily removed byregarding n as a vector rather than a director [18]. In our case,figures 1(a)–(c), the disclination loop near the equatorial planeof the droplets divides the surface into two parts with oppositesigns of the scalar product n ·υ, S+ with n ·υ > 0 and S− withn · υ < 0. The conservation laws connecting the 2D and 3Dcharacteristics of the boojums in the presence of equatorialdisclination have been derived in [18] as
∑iNi =
12
∑imi =
E/2 = 1, which stem from the Gauss theorem. In the caseshown in figures 1(a)–(c), A1 = sin2(α/2), N1 = 1, m1 =
1 and A2 = sin2(α/2), N2 = 0, m2 = 1, which obeys theconservation laws above.
The surface anchoring and topology dictated scenario ofdefect formation is applicable to any N nucleus that is larger
3

J. Phys.: Condens. Matter 25 (2013) 404202 Y-K Kim et al
Figure 1. (a) Nuclei of the thermotropic nematic mixture E7 (EMIndustries) emerging from the isotropic phase, viewed in apolarizing microscope with crossed polarizers; the I phase appearsblack. (b) Spherical droplets of a thermotropic nematicn-butoxyphenyl ester of nonyloxybenzoic acid dispersed in aglycerin–lecithin matrix, viewed in a polarizing microscope with asingle polarizer (no analyzer). In both systems, each N dropletshows two surface point defect-boojums (some are marked by whitearrows) and disclination loops (black arrows). The topologicaldefects occur as a result of the balance of surface anchoring andelastic distortion energy. (c) Principal scheme of directordistortions [18, 19].
than the de Gennes–Kleman length, so that it is energeticallypreferable to satisfy the surface anchoring conditions at theexpense of the elastic deformations associated with defects.The phenomenon is not restricted to the I–N phase transition.Similar defect-rich textures are observed in equilibriumnematic droplets of a fixed size, dispersed in an immiscibleisotropic fluid, such as glycerin [18], figure 1(b). The concreteset of defects depends on the easy angle α that can becontrolled in experiments [18]. If α varies from somenon-zero value to α = 0, then the boojums shown in figure 1should disappear. The disclination loop shrinks into a pointdefect-hedgehog at the surface (which reduces the elastic
energy). The ensuing point defect can leave the surface whenα = 0 and go into the center of the drop, thus establishingeither a 3D radial structure of n or a more complex structure,depending on the elastic anisotropy of the material [41]. If theeasy angle changes towards its maximum value α = π/2, thenthe disclination loop seen in figure 1(b) gradually disappears,and the N drop features only two boojums that are sufficientto satisfy the tangential boundary conditions [18].
The shape of the thermotropic N droplets dispersed eitherin their own melt, figure 1(a), or in a foreign isotropicfluid, figure 1(b), is nearly spherical. The reason is the highsurface tension of the I–N interface and a relatively weaksurface anchoring, σ0 ∼ 10−5 J m−2, while wσ0 ∼ (10−6
−
10−7) J m−2 [42, 43], so that w ∼ 0.1–0.01. The surfaceenergy Fs ∝ σ0R2
∼ 10−17 J of a thermotropic N droplet ofradius R ∼ 1 µm or larger overweighs the elastic energy ofinternal distortions Fe ∝ K(∇n)2R3
∼ KR ∼ 2× 10⁻¹⁸ J.The interplay of surface and bulk effects during phase
transitions in LCs is enriched when the materials are oflyotropic type. If the lyotropic N phase is formed by buildingunits of a size in the range 10–100 nm, the interfacial surfaceenergy is expected to be weaker than in the thermotropiccase; experimentally, σ0 ∼ (10−7–10−5) J m−2 [44, 45]. Thetheoretical expectation [46–50] for a system of very longrigid rods is that σ0 = χ
kBTLD , where kB is the Boltzmann
constant, T is the absolute temperature, L and D are the lengthand diameter of the rods, respectively, χ is the numericalcoefficient estimated by different models to be in the range0.18–0.34. Smallness of σ0 caused by relatively large L andD suggests that the N droplets might not be able to maintaina spherical shape if the surface anchoring requires n to bedistorted in the interior. Indeed, the pioneering observationsby Bernal and Fankuchen [51] of the I–N phase transitionin lyotropic N formed by tobacco mosaic virus dispersed inwater revealed that the N droplets with tangential directororientation are of a peculiar elongated shape with two-cuspedends [51]. These shapes were called tactoids [51, 52]; for morestudies, see [35–39, 53–55].
The surface anchoring anisotropy in lyotropic LCs mightbe more pronounced than in their thermotropic counterparts.Experimental estimates range from w ≈ 4 [56] for waterdispersions of carbon nanotubes to w ∼ 10–100 (wσ0 ∼
(0.5–5)×10−5 J m−2 and σ0 ∼ 5×10⁻⁷ J m−2) for vanadiumpentoxide dispersions [35, 36]. Theoretical consideration [57]for lyotropic systems of worm-like chains predicts a simpleRapini–Papoular type angular dependence of the surfacetension, σ(α) = σ0(1+wcos2α), with w ∼ 0.5–1 (dependingon the flexibility of the chains).
On the other hand, the Frank elastic constants in lyotropicLCs are nearly of the same order as those in thermotropicLCs [32]. It is thus expected that the structure of nucleiin the I–N phase transitions would be highly nontrivial, interms of both their shape and the interior director structure,as the representative energies σ0R2, σ0wR2 and KR mightvary in a much wider range than in thermotropic LCs.Furthermore, in thermotropic systems with a relatively weaksurface anisotropy, the Rapini–Papoular surface potential oreven a simpler quadratic dependence σ(α) ∝ (α− α)2 is often
4

J. Phys.: Condens. Matter 25 (2013) 404202 Y-K Kim et al
Figure 2. (a) The molecular structure of DSCG. (b) Schematic structure of chromonic aggregates in I and N phases. (c) Phase diagram ofDSCG dispersed in water as a function of temperature and DSCG concentration. The numbers correspond to the sections that describe thescenarios of phase transition; the dots indicate the approximate locations of the systems in the phase diagram and the arrows indicatewhether a system is cooled down or heated up; the dot with the number 8 and no arrow corresponds to the discussion of disclination cores insection 8. (d) Temperature dependence of the area occupied by the N phase in the biphasic region, for heating and cooling; the rate oftemperature change is ±1 ◦C min−1. Note the difference in the two curves, associated with the different types of director distortions in thesystem.
sufficient to describe the anchoring phenomena. This mightnot be true in the case of a lyotropic LC with a large w;observation of the first-order anchoring transition of LCLCs incontact with solid substrates suggests that the surface potentialshould be different from the Rapini–Papoular form [58].
3. General properties of LCLCs and experimentaltechniques
We explore water solutions of disodium cromoglycate(DSCG) (Sigma-Aldrich, purity ≥95%), one of the firstLCLCs studied [22, 24], figure 2(a). In water, the DSCGmolecules stack on top of each other face-to-face (theso-called H-aggregation) to minimize the areas of unfavorablecontact with water [31, 33, 59]. The stacking distance is(0.33–0.34) nm [31, 59]. The stacking distance makes LCLCaggregates similar to double-strand B-DNA molecules. Theimportant difference is that in LCLCs there are no chemicalbonds to fix the lengths of aggregates.
We used a DSCG concentration of c = 16 wt%(=0.37 mol kg−1). The relevant portion of the phase diagramis shown in figure 2(c); note a broad biphasic region in whichthe N and I phases coexist. Figure 2(d) shows how the area ofthe N phase changes with temperature in the biphasic region.Although the trend is close to a linear one, the curves forheating and cooling are somewhat different, since the directorpattern in the sample is different upon cooling and heating.
From the experimental point of view, it is importantto explore a pseudo-2D geometry, to mitigate complicationsassociated with effects such as depth-dependent n. 2D
geometry also allows one to apply quantitative methods ofoptical microscopy such as mapping of the optical retardanceand orientation of n [60]. We remind the reader that in regularoptical polarizing microscopy, the image is determined bythe integral over the (generally distorted) configuration ofthe optic axis along the pathway of light propagation. Ifthe sample is thin, the undesirable director distortions alongthe light propagation direction are suppressed and the imagerepresents a 2D pattern of the director field that can bereconstructed by using a microscope with an LC-PolScopeuniversal compensator [61].
The samples were prepared as thin slabs of thicknessd = (1–5) µm between two glass plates, spin-coated withun-rubbed polyimide SE-7511 (Nissan, Inc.) for tangentialanchoring of the DSCG director. The cell thickness was setby glass spheres mixed with UV epoxy (Norland OpticalAdhesive 65, Norland Products, Inc.) applied at the peripheryof cells to seal them and to prevent evaporation of water. Thetemperature was controlled with a Linkam controller TMS94and hot stage LTS350 (Linkam Scientific Instruments) witha precision of 0.01 ◦C. In both cooling and heating, thetemperature rate was typically 0.1 ◦C min−1; we waited untilthe expansion of N or I tactoids stopped before changing thetemperature again.
The textures were examined by a polarizing microscope(Nikon E600) equipped with a Cambridge ResearchIncorporated (CRI) Abrio LC-PolScope package. The LC-PolScope uses monochromatic illumination at 546 nm andmaps the optical retardance 0(x, y) and orientation of theslow axis in the sample [60]. The maximum measured
5

J. Phys.: Condens. Matter 25 (2013) 404202 Y-K Kim et al
optical retardance in the commercial CRI Abrio LC-PolScopepackage is listed as 273 nm, but we found by testing wedgesamples with a variable retardance that the device does notproduce accurate measurement for any value of 0(x, y) largerthan about 240 nm. We thus restricted the thickness d of ourcells to set 0(x, y) in the reliable range between 0 and 240 nm.For a tangentially anchored N, 0 = |ne − no|d, where neand no are the extraordinary and ordinary refractive indices.For DSCG, the optical birefringence is negative, ne − no ≈
−0.02 [33, 34]. The slow axis is thus perpendicular to theoptic axis n. The PolScope was set up to map the localorientation n(x, y) (rather than the slow axis), by headed nails.Note that the nail’s head is an artificial feature of PolScopesoftware that is not related to any particular property ofthe LCLC, as n = −n and there is no director tilt at theN–substrate interface. The accuracy with which the PolScopedetermines the orientation of the optic axis is better than 0.1◦.The map of retardance 0(x, y) allowed us to trace the changesin the degree of the scalar order parameter S, as in the firstapproximation [62], |ne − no| ∝ S.
The surface anchoring of the DSCG at bounding platesis tangential. The director configuration can be treated as 2D,as the bounding plates suppress the out-of-plane distortions.These distortions are better suppressed in thinner samples.However, different contact angles between the N and Iphases and the bounding plates might still distort n in thevertical cross-section of the cell. To explore the menisci,we used fluorescent confocal polarizing microscopy (FCPM)which images vertical cross-sections of the samples [63]. TheDSCG solution was doped with the water-soluble fluorescentdye Acridine Orange (Sigma-Aldrich); it concentratespredominantly in the I phase. In this particular experiment,we used thick cells of 20 µm to enlarge the menisci. Figure 3shows that the I–N interface is nearly perpendicular to thebounding plates, with the N side forming a contact angle βin the range around (77 ± 7)◦ with the substrate. Since thecontact angles are not very different from π/2, the meniscusprofile should not significantly alter the shape of the N andI regions which is determined from the PolScope images ofthin samples. In a sample of thickness 2 µm, the meniscuseffect would lead to a 0.2 µm inaccuracy in measured lateraldistances, which is less than the optical resolution (about0.5 µm).
In order to estimate the surface tension σ0 of the I–Ninterface, we used the pendant drop technique [44, 64]. The16 wt% solution of DSCG was centrifuged at 4400 rpm atI–N biphasic temperature, T = 38 ◦C, to achieve macroscopicphase separation. The I and N phases were carefully filled intoseparate syringes. The corresponding densities were measuredwith a DE45 Density Meter (Mettler Toledo) at T = 38 ◦C:ρN = 1.08 g cm−3 and ρI = 1.06 g cm−3. The centrifuged Isolution was transferred into a rectangular bath and the pipettecontaining the N solution was inserted into the I bath kept at38 ◦C. The N solution was pushed out from the pipette to forma pendant drop. The interfacial tension σ0 was determined byfitting the drop profile with theoretical plots [44, 64]. Since thedroplets were stable only for minutes, we could only estimatethe order of magnitude, σ0 ≈ 10−4 J m−2.
Figure 3. FCPM images of the I–N biphasic region in DSCG watersolution doped with fluorescent dye: (a) in-plane and (b) verticalcross-section of the cell. The tilt angle of the I–N interface withrespect to the bounding plate is about (77± 7)◦.
4. Topological characteristics of point defects in2D N: disclinations and boojums
In what follows, we operate with the 2D description oftopological defects in the N domains, figure 4. The 2D directorfield is parameterized as (nx, ny) = [cos8(θ), sin8(θ)],where8 is the angle between the director and a fixed axis x inthe (x, y) plane, and θ is the polar angle of the polar coordinatesystem (r, θ), figure 4(g). The order parameter space of a2D N represents a circle S1/Z2 with two opposite pointsbeing identical to each other. The first homotopy group ofS1/Z2 is nontrivial, π1(S1/Z2) = {0, ±1/2, ±1, . . .}, whichimplies that in the interior of the 2D domains there might betopologically stable point disclinations of various ‘strengths’or ‘topological charges’ [10]. The disclination strength isintroduced as an integer or semi-integer number,
m =1
2π
∮ (nx∂ny
∂θ− ny
∂nx
∂θ
)dθ
=1
2π[8(θ = 2π)−8(θ = 0)] = 0, ±1/2, ±1, . . . .
(1)
For example, a simple radial configuration (nx, ny) =
(cos θ, sin θ) yields m = 1. Four main disclination types withm = ±1/2, ±1 are shown in figures 4(a)–(d); as an exampleof m = 1 disclinations, in figure 4(c), we show a circulardirector pattern, (nx, ny) = [cos(θ + π/2), sin(θ + π/2)].
The second type of point defect, boojums, are observedin the experiments with DSCG as defects located at the cuspsof the I–N interface. The ‘strength’ of a boojum is determinednot only by the behavior of 8(θ) but also by the angle τN
between the two shoulders on the opposite sides of the cusp(measured in the N phase anti-clockwise; we direct the x axis
6

J. Phys.: Condens. Matter 25 (2013) 404202 Y-K Kim et al
Figure 4. Director configurations for ((a)–(d)) disclinations m = ±1/2, ±1, (e) a positive boojum m = 12 −
τ2π inside a positive cusp,
(f) a negative boojum m = − 12 −
τ2π associated with a negative cusp. (g) Schematic definition of the angular parameters.
along one of the shoulders),
m =1
2π
∫ τN
0
(nx∂ny
∂θ− ny
∂nx
∂θ
)dθ
=1
2π[8(θ = τN)−8(θ = 0)]. (2)
For a flat I–N interface, τN = π and the radial director field(nx, ny) = (cos θ, sin θ) yields m = 1/2, an intuitively clearresult, as such a boojum represents 1/2 of the radial bulkdisclination m = 1. When the interface is not flat, τN 6= π ,equation (2) results in
m =k
2−
τ
2π, (3)
where k is an integer and τ = π − τN is the angle measuredbetween the right shoulder and the continuation of the leftshoulder of the cusp. The convenience of the latter notation isthat the sign of τ discriminates between the positive cusp (Nphase protruding into the I phase, 0 < τN < π, 0 < τ < π )and the negative cusp (I phase protruding into the N phase,π < τN < 2π, −π < τ < 0).
The sign of m and k is determined uniquely bycomparison of the traveling direction around the defect coreand the sense of director rotation [10]. Figure 4(e) shows apositive boojum with k = 1, while figure 4(f) shows a negativeboojum with k = −1. These boojums have the lowest energiesand therefore are observed in our experiment. A ‘zero’ boojumwith k = 0 is unstable as it exists only with a cusp and can besmoothly eliminated simultaneously with the cusp, τ → 0. Itis important to stress that for the tangential surface anchoringat the I–N interface (easy angle α = π/2), the distinction
between the disclinations and boojums is of an energeticrather than a topological origin. The presence of cusps filledwith boojums is dictated by the balance of surface and elasticenergies; when such a balance yields τ = 0, the boojumsacquire semi-integer or integer strength and can leave theinterface and move into the interior of the N domains. Ifthe 2D picture is extended to the third dimension (along thenormal to the LCLC cell), then the point disclinations wouldcorrespond to linear disclinations and the point boojums tothe linear surface disclinations parallel to the third dimensionaxis.
5. Early stages of I-to-N transition: tactoids,boojums and disclinations
Figure 5 illustrates the appearance of the N phase throughelongated tactoids with a two-cusped shape, or ‘2c tactoids’,when the temperature is lowered from the homogeneous Iphase into the biphasic phase, see label ‘5’ in figure 2(c).There are two surface defect-boojums at the cusps. TheI–N interface near the cusp forms an angle 0 < τ < π ,figure 6(b), so that the corresponding boojum is of a strengthm = 1/2− τ/2π , figure 4(e). The director is tangential to theI–N interface, as is clear from the image of a large tactoidin figure 5(a). In the cusp regions, the retardance is reducedas compared to the interior of the tactoid. The reasons are(i) non-flat meniscus, (ii) finite width of the interfacial regionand decrease of the scalar order parameter in order to reducethe energy of strong director distortions, (iii) realignment of nalong the vertical axis, an effect similar to the ‘escape into thethird dimension’ [62].
7

J. Phys.: Condens. Matter 25 (2013) 404202 Y-K Kim et al
Figure 5. PolScope textures of nucleating N tactoids during the I-to-N phase transition in DSCG. (a) The N tactoids feature two cusps withpoint defect-boojums and tangential orientation of the director at the I–N interface. (b)–(e) The tactoids grow and merge as the temperatureis reduced. Note that a merger of two differently oriented 2c tactoids in (c) produces a 3c tactoid with a disclination m = −1/2 in thecenter ((d), (e)).
Figure 6. The anisotropic shape of a small 2c tactoid: (a) PolScope texture and (b) reconstructed shape; (c) phase retardance 0 measuredalong the long l and short u axes of the tactoid.
As the temperature is lowered, the 2c tactoids grow andcoalesce. Most of the time, the tactoids coalesce in pairsand the new tactoids eventually regain the same 2c shape.However, the merger can also produce nontrivial topologicaldefects in the bulk, similarly to the Kibble mechanism. Forexample, parts (c)–(e) in figure 5 show the formation of anm = −1/2 interior disclination as a result of coalescence oftwo 2c tactoids with practically orthogonal alignment of theirlong axes. The resulting tactoid has three cusps at the I–Ninterface, associated with three boojums, each of a positivestrength 0 < m < 1/2. The difference between the describedscenario of coalescence-triggered defect formation and theclassic Kibble mechanism is that each tactoid participatingin the coalescence acts at a scale of (1–100) µm and largeralready contains the topological defects caused by the surfaceanchoring phenomenon.
Coalescence also produces ‘negative’ cusps of protrudingI phase, the N parts of which are filled with boojums ofnegative strength −1/2 < m < 0, figure 4(f). Three negativecusps are clearly visible in figures 5(e) and 7(f). Sinceeach N domain is topologically equivalent to a disk, forthe fixed in-plane tangential surface anchoring, the totaldirector reorientation measured by circumnavigating the I–N
boundary should be equal to 2π minus the angle that describesmissing orientations of the I–N interface. If there are i =1, 2, . . . , c boojums at the interface of strengths mi associatedwith the cusps of angles τi and j = 1, 2, . . . , n disclinationsof charges mj in the interior, then the conservation law for thetopological charges involved is written as
c∑i
(mi +
τi
2π
)+
n∑j
mj = 1 or
12
c∑i
ki +
n∑j
mj = 1.(4)
For a smooth round disk, τi = 0, the last relationship reducesto∑c
i mi +∑n
j mj = 1. In our experiments only low energyboojums are observed: a positive boojum, k = 1, inside thepositive cusp, figure 4(e), and a negative boojum k = −1 inthe negative cusp, figure 4(f). Then, the relationship (4) canbe rewritten in terms of the excess number of positive cuspsc+ over the negative ones c− which is determined by the totaltopological charge of the disclinations,
c+ − c− = 2
(1−
n∑j
mj
). (5)
8

J. Phys.: Condens. Matter 25 (2013) 404202 Y-K Kim et al
Figure 7. PolScope textures of N tactoids with (a) two cusps, (b) four cusps, (c) three cusps and one disclination m = −1/2,((d)–(f)) coalescence of two large tactoids into a single tactoid with a pair of oppositely charged disclinations m = ±1/2 in the bulk, fourpositive and two negative cusps at the I–N interface.
As an illustration, the bottom-right part of figure 7(b)shows a tactoid with three positive cusps and one negativecusp, and no bulk disclinations, thus 3− 1 = 2. When such atactoid coalesces with a regular 2c tactoid the negative surfaceboojum evolves into a full bulk disclination m = −1/2,figure 7(c). The next merger between a disclination-free 4ctactoid and a 3c tactoid with a disclination, figures 7(d)–(e),produces a large 6c tactoid with four positive cusps,two negative cusps, one disclination m = −1/2 and onedisclination m = 1/2, so that the total number of cusps andthe topological charges are again satisfying equation (5), as4 − 2 = 2(1 − 1/2 + 1/2), figure 7(f). Mergers of defects inthe bulk and at the I–N interface are possible, but they do notchange the sum total.
The long axes of different tactoids are oriented indifferent directions. The local alignment at a particular pointx0, y0 might be easily changed when the domains coalesceand restructure their shape and the director field, as seen bycomparing parts (c)–(f) of figure 7. These features indicatethat there is no surface-imposed local anchoring direction inthe x, y plane and that the director configurations and shape ofthe tactoids are determined by the balance of elastic distortionenergy and anisotropic surface tension of the I–N interfacerather than by the in-plane anchoring of the glass substrates.
The color in the PolScope textures of the tactoids infigure 7 is gradually changing from the reddish to yellowas the temperature is lowered and the area occupied by theN phase increases. This shows that the N domains at highertemperatures have a higher concentration of DSCG (andthus higher birefringence) than their counterparts at lowertemperatures [33].
6. Shape of positive N tactoids with two cusps
The shape of negative and positive tactoids is determined bythe balance of the elastic energy of the director in the N
phase and by the I–N interfacial tension energy. The problemis mathematically challenging and can be solved analyticallyonly for certain simplified situations, see, for example, [40,65–67] and references therein. One of these is a special caseof crystals, in which the elastic bulk forces are infinitelylarge as compared to the anisotropic surface forces [68]. Insuch a case, the crystal shape is described by the classicWulff construction based on the angular dependence of σ . TheWulff construction has been applied to elastically ‘rigid’ anduniform N drops with n = const. As discussed by Herring [69,70], if the angular dependence σ(α) on the angle α betweenn and υ is pronounced (but σ remains a smooth functionof α with continuous derivatives), the equilibrium shapeshould be bounded by a number of smoothly curved (notflat) surfaces which intersect in sharp edges. Herring [69]cited the observations by Zocher of nematic tactoids with twosharp cusps [52] as an experimental confirmation of the Wulffconstruction. The only experimental case with an unperturbeddirector, n = const, in the interior of tactoids was reportedrecently by Puech et al [56] for a water dispersion of carbonnanotubes. The inverse Wulff construction led to the estimatew ≈ 4. Kaznacheev et al [35, 36] found that for a vanadiumpentoxide dispersion in water, the surface anisotropy is evenstronger, w ∼ 10–100.
In our case, the director field is clearly distorted withinthe 2c tactoids, being tangential to the I–N interface. Weare not aware of any analytical results for such a geometry.Recently, van der Schoot et al [71] performed numericalsimulations of the shape of positive 2c tactoids taking intoaccount the anisotropic surface tension in the form σ =
a0 + a2 cos 2α and the internal elasticity in a one-constantapproximation with the Frank modulus K. In our notations,σ = σ0(1+wcos2α), σ0 = a0−a2 and σ0w= 2a2. The shapesand director textures within the tactoids were simulated in [71]
for various values of γ = 2a2K
√Aπ
and ω = 2a0K
√Aπ
, whereA is the surface of the 2D tactoid. Unfortunately, the upper
9

J. Phys.: Condens. Matter 25 (2013) 404202 Y-K Kim et al
Figure 8. (a) PolScope textures of a round I domain associated with an m = 1 director field around it; (b), (c) the I tactoid shrinks as thetemperature is reduced and then (d) splits into two disclinations of strength m = 1/2 each. (e) Temperature dependence of the characteristicsize and area of the I tactoid. (f), (g) Retardance profiles of the I tactoid shown in parts (b), (c), respectively. (h) Retardance profile of thetwo disclinations in part (d) separating from each other.
limit of ω was only 100, which limited the comparison ofour experimental shapes with those simulated in [71] to verysmall tactoids. For the relatively small tactoid in figure 6, ofsurface area A = 200 µm2, we measure the ratio ε = l/u ofthe long axis (length l) to the short axis (width u) to be around1.3 ± 0.1 and the cusp angle to be τN = 1.05 ± 0.05. Theradius of curvature of the I–N interface at the cusps is lessthan the resolving power of our microscope, and thus smallerthan 0.5 µm. Comparison to the simulation results in figure 9of [71] shows that the experimentally observed N tactoidscorrespond to the so-called ‘III regime’ of [71]. In this regime,n is always parallel to the I–N interface, while the shape ismodestly anisotropic, ε < 2, and has two pronounced cuspswith boojums. Comparison with figure 8 in [71] leads to arough estimate γ /ω ∼ 0.85 ± 0.1, which suggests a ratherstrong anisotropy of the interfacial tension, of the order of w∼10. To measure w in a more reliable manner, we would need todetermine the surface tension more accurately than presentlypossible and expand the range of numerical simulations to therange of parameters characterizing the tactoids in LCLCs; thiswork is in progress.
7. Late stages of I-to-N transition: I tactoids asdisclination cores
At the late stages of the I-to-N transition, when many largedomains coalesce, they occasionally trap I islands aroundwhich the director rotates by 2π or −2π , which correspondsto integer strength m = 1 (figure 8) and m = −1 (figure 9)disclinations. Topologically, these are allowed in the 2D case.When the temperature is reduced and the I islands at thecore shrink, the integer disclinations always split into pairsof semi-integer disclinations, either m = 1/2 (figure 8) or
m = −1/2 (figure 9). In 3D LCs, the integer disclinationsdo not show such a split, as n simply realigns parallel to thedefect’s axis (‘escape into the third dimension’). It is only forsamples thinner that 0.5 µm that one can suppress the escapeby a very strong tangential anchoring of n [72]. In our case ofLCLC textures, the escape is apparently suppressed at higherthicknesses as the integer cores split into pairs of semi-integerdisclinations. This effect indicates that the director remainsmostly parallel to the (x, y) plane.
The elastic energy of the disclination with the directorperpendicular to its axis grows as m2: fe = πm2K ln R/rc+ fc,where K is the average value of the Frank splay and bendelastic constants, R is the size of the system or the distanceto the closest disclination, rc and fc are the radius and theenergy of the core, respectively. The elastic energy ∼ m2
thus favors splitting of the integer disclinations into pairs ofsemi-integer defects. On the other hand, the interfacial energyof the I–N interface should favor the m = 1 structure with asingle isotropic core. We consider the effect in a greater detail.
The energy of an m = 1 disclination (per unit length,assuming n is perpendicular to the axis) is comprised of theelastic energy fe,1 = πK ln R/r1 of the director, the excessenergy of the isotropic core fcond,1 = (fI − fN)πr2
1, where fIand fN are the free energy densities of the I and N phases,respectively, and the energy of the I–N interface fIN,1 =2πr1σ0. Minimization of f1 = fe,1 + fcond,1 + fIN,1 with
respect to r1 yields r1 =1
2(fI−fN)(
√σ 2
0 + 2K(fI − fN) − σ0).For the split pair of disclinations m = 1/2, separated bya distance L, the elastic energy is fe,pair = πK ln R/r1/2 −π2 K ln L/2r1/2, while fcond,pair = 2(fI− fN)πr2
1/2 and fIN,pair =
2πr1/2σ0(2 + w). The latter estimate accounts for a changeof director orientation from tangential to normal when one
10
J. Phys.: Condens. Matter 25 (2013) 404202 Y-K Kim et al
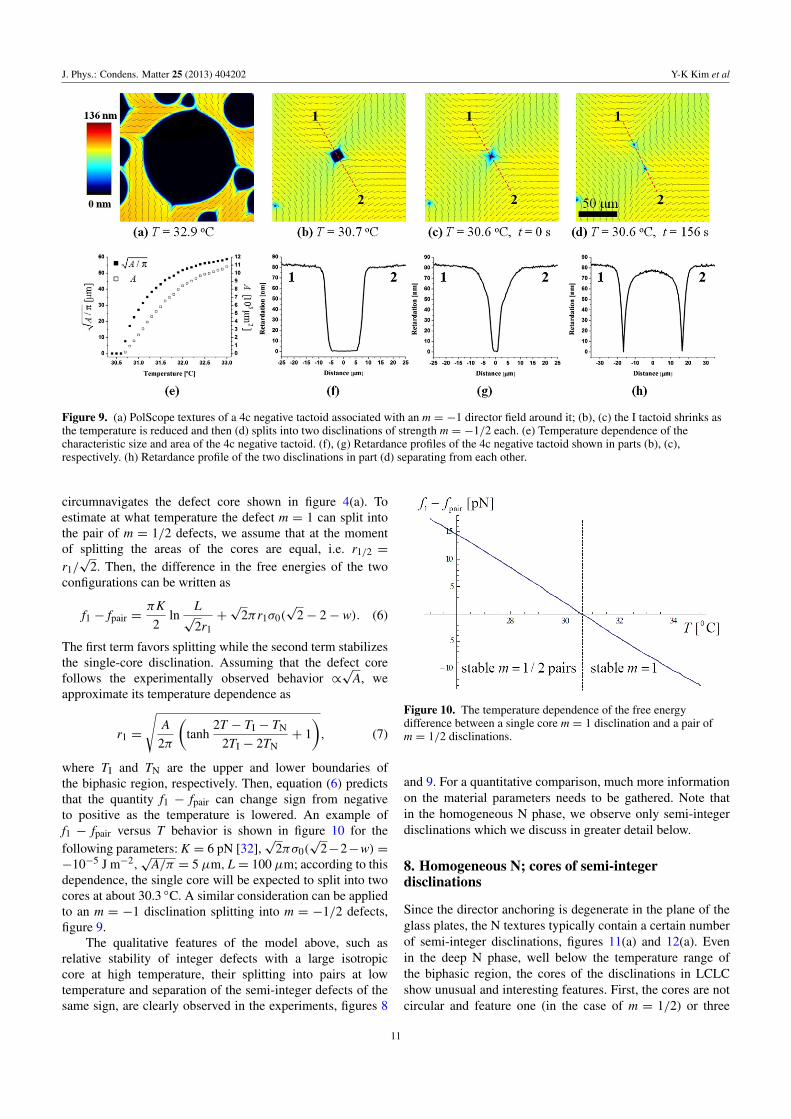
Figure 9. (a) PolScope textures of a 4c negative tactoid associated with an m = −1 director field around it; (b), (c) the I tactoid shrinks asthe temperature is reduced and then (d) splits into two disclinations of strength m = −1/2 each. (e) Temperature dependence of thecharacteristic size and area of the 4c negative tactoid. (f), (g) Retardance profiles of the 4c negative tactoid shown in parts (b), (c),respectively. (h) Retardance profile of the two disclinations in part (d) separating from each other.
circumnavigates the defect core shown in figure 4(a). Toestimate at what temperature the defect m = 1 can split intothe pair of m = 1/2 defects, we assume that at the momentof splitting the areas of the cores are equal, i.e. r1/2 =
r1/√
2. Then, the difference in the free energies of the twoconfigurations can be written as
f1 − fpair =πK
2ln
L√
2r1+√
2πr1σ0(√
2− 2− w). (6)
The first term favors splitting while the second term stabilizesthe single-core disclination. Assuming that the defect corefollows the experimentally observed behavior ∝
√A, we
approximate its temperature dependence as
r1 =
√A
2π
(tanh
2T − TI − TN
2TI − 2TN+ 1
), (7)
where TI and TN are the upper and lower boundaries ofthe biphasic region, respectively. Then, equation (6) predictsthat the quantity f1 − fpair can change sign from negativeto positive as the temperature is lowered. An example off1 − fpair versus T behavior is shown in figure 10 for thefollowing parameters: K = 6 pN [32],
√2πσ0(
√2−2−w) =
−10−5 J m−2,√
A/π = 5 µm,L = 100 µm; according to thisdependence, the single core will be expected to split into twocores at about 30.3 ◦C. A similar consideration can be appliedto an m = −1 disclination splitting into m = −1/2 defects,figure 9.
The qualitative features of the model above, such asrelative stability of integer defects with a large isotropiccore at high temperature, their splitting into pairs at lowtemperature and separation of the semi-integer defects of thesame sign, are clearly observed in the experiments, figures 8
Figure 10. The temperature dependence of the free energydifference between a single core m = 1 disclination and a pair ofm = 1/2 disclinations.
and 9. For a quantitative comparison, much more informationon the material parameters needs to be gathered. Note thatin the homogeneous N phase, we observe only semi-integerdisclinations which we discuss in greater detail below.
8. Homogeneous N; cores of semi-integerdisclinations
Since the director anchoring is degenerate in the plane of theglass plates, the N textures typically contain a certain numberof semi-integer disclinations, figures 11(a) and 12(a). Evenin the deep N phase, well below the temperature range ofthe biphasic region, the cores of the disclinations in LCLCshow unusual and interesting features. First, the cores are notcircular and feature one (in the case of m = 1/2) or three
11

J. Phys.: Condens. Matter 25 (2013) 404202 Y-K Kim et al
Figure 11. (a) PolScope textures of an m = 1/2 disclination and a 1c negative tactoid at the core of the disclination, as a function ofincreasing temperature. (b) Optical retardance 0 across the core of the defect shown in part (a) for 25 ◦C and 30.4 ◦C. (c) Optical retardance0 across the expanded I core of the defect in the biphasic region, corresponding to the temperature 30.5 ◦C. (d) Temperature dependence ofthe characteristic size and area of the 1c negative tactoid.
Figure 12. (a) PolScope textures of an m = −1/2 disclination and a 3c negative tactoid at the core of the disclination, as a function ofincreasing temperature. (b) Optical retardance 0 across the core of the defect shown in part (a) for 25 ◦C and 30.6 ◦C. (c) Optical retardance0 across the expanded I core of the defect in the biphasic region, corresponding to the temperature 30.7 ◦C. (d) Temperature dependence ofthe characteristic size and area of the 3c negative tactoid.
(in the case of m = −1/2) cusp-like irregularities, locatedin the region where the director is forced to be parallel tothe radius vector emanating from the geometrical center ofthe defect. Second, the distance over which the structureshows a substantial change in the degree of orientationalorder is macroscopic, of the order of 10 µm. In figures 11(b)and (c), we show the optical retardance 0 = |ne − no|dprofile measured across the disclination m = 1/2 core. Faraway from the core, the retardance is practically constant.If the temperature is raised, the far-field retardance slightlydecreases, as the LCLC aggregates become shorter so thatthe birefringence |ne − no| and scalar order parameter S arereduced. Within the core region of linear size of about 10 µm,
the retardance drops sharply to zero, being practically a linearfunction of the distance to the center at which 0(r = 0) = 0.Below we discuss the possible origin of cusps, the linear 0(r)dependence and the large core size of disclinations in the deepN phase of LCLC.
The nematic orientational order is described by a tracelesssymmetric tensor order parameter [10]
Qij = S(ninj − δij/3)+ P(li lj − mimj), (8)
which is diagonal, Q = diag(P − S/3, −P − S/3, 2S/3), inthe frame of three mutually orthogonal directors l ≡ −l, m ≡−m, and n ≡ −n; the quantities S and P are the uniaxial and
12

J. Phys.: Condens. Matter 25 (2013) 404202 Y-K Kim et al
biaxial order parameters, respectively, which depend on thetemperature, pressure and composition. In this work, we aredealing with a uniaxial N phase, thus P = 0, at least in theuniform state. The free energy functional associated with thenematic order can be written in the Landau–de Gennes formas [10]
f0 = 12 a(T − T∗)QijQji −
13 BQijQjkQki +
14 C(QijQji)
2, (9)
where a,T∗, B and C are material parameters.The presence of the cubic term is significant, as it
underscores the first-order character of the I–N transition.Experimentally, this transition is weak. The experimentalvalues for the coefficients above have been measuredfor thermotropic LCs. For example, for 5CB, the oftencited [73] values are a = 0.13 × 10⁶ J (m3 K)−1,B = 1.6 ×10⁶ J m−3,C = 3.9 × 10⁶ J m−3. The order parametercan be spatially nonuniform, which is obviously the casefor the first-order phase transitions in which the N and Iphases can coexist and there is thus an interface that separatesthe two phases. The Landau–de Gennes expansion above issupplemented with the gradients of the tensor Q which in thesecond-order expansion reads
fLdG = f0 + L1Qij,kQij,k + L2Qij,jQik,k + L3Qij,kQik,j, (10)
where Ln are the elastic constants and ,k = ∂/∂xk are thespatial derivatives. It is convenient to rewrite fLdG in the form
fLdG = f0 + L1Qij,kQij,k + La(Qij,jQik,k + Qij,kQik,j)
+ Ls(Qij,jQik − QijQik,j),k, (11)
which singles out the divergence (last) term; here, La = (L2+
L3)/2 and Ls = (L2 − L3)/2. This form is useful for thedescription of the I–N interface and defect cores, because itsstructure is represented by a continuous Q-tensor field andthe divergence term becomes negligible. When the Q-tensorchanges over distances much larger than the molecular scaleand the Q-tensor gradients are weak (e.g. far away fromthe defect core), the scalar order parameters adopt constantvalues that correspond to the minimum of f0, S = SN, P = 0.Then, the elastic energy density is controlled by the directordistortions, as described by the Frank–Oseen functional,
fFO =12 K1(divn)2 + 1
2 K2(n · curln)2
+12 K3(n× curln)2
− K24div(ndivn+ n× curln), (12)
with the splay, twist, bend and saddle-splay terms,respectively.
Comparison of fLdG and fFO results in the followingrelations between the elastic constants: K1 = K3 = 4S2
N(L1 +
La),K2 = 4S2NL1 and K24 = S2
N(2L1+La−Ls); the differencebetween splay and bend constants starts with the cubicterm K1 − K3 = O(S3
N) [74–77], L1 corresponds to the oneelastic constant approximation, and La provides the elasticanisotropy. Below we investigate the effect of La on the I–Ninterface and the defect cores.
Consider a planar I–N interface normal to the x-axis atthe transition temperature TNI when f0(SN) = 0. The energy
of the I–N interface per unit area can be calculated byminimizing F =
∫fLdGdx, where fLdG is the characteristic
width of the I–N interface [74]. Neglecting the possiblebiaxiality and assuming that the director does not reorientacross the interface, one obtains
F = 2aTNIh∫ SN
0
√f0(S) dS, (13)
where the coefficient h takes a different value for the directornormal to the interface, h = hn =
√(3L1 + 4La)/aTNI,
and the tangential director, h = ht =√(3L1 + La)/aTNI.
The dependence of the interface energy on the directororientation allows us to estimate the surface anchoringcoefficient w = hn/ht−1 =
√(3L1 + 4La)/(3L1 + La)−1 ≈
√(4K1 − K2)/(K1 + 2K2)− 1. Consider now the disclination
core.The Q-tensor field of the disclination core is determined
by the functional F =∫
fLdG dV . We consider wedgeplanar disclinations with a two-dimensional director fieldn independent of the z-coordinate along the constant mdirector normal to the bounding plates. We describe theQ-tensor, equation (8), in the polar coordinates (r, θ)with the disclination center at r = 0 by order parametersS(r, θ),P(r, θ) and the angle ϕ(r, θ) = mθ + ϕ(r, θ) betweenn and the x-axis; ϕ(r, θ) is a correction term. Mottram andHogan [78] assumed that the core is axially symmetric, sothat S(r),P(r) and ϕ(r) are θ -independent. This assumptionis correct if m = 1 or when the Frank constants are equal,La = 0. For disclinations with m 6= 1 the minimum ofenergy is reached by including angular harmonics k(m− 1)θ ,e.g. S(r, θ) = S0(r)+
∑k=1Sk(r) cos[k(m− 1)θ ]. In LCLCs,
a strong anisotropy La 6= 0 of elastic constants has beendemonstrated, with K2 � K1,K3 [32]. Therefore, we expectw ∼ 1, which leads to a structure that is not axially symmetricand features 2|m−1| cusps. The largest asymmetry is observedfor m = 1/2, as illustrated by the spatial profiles of the scaledorder parameters S = (C/B)S, P = (C/B)P in figure 13(a)and the optical retardance 0 = S − P in figure 13(b). Thesimulated retardance 0 is very close to the experimentalretardance profile, see figure 11(b). The only difference isthat the experimental core does not change as much withtemperature (within the temperature range of the N phase) asthe theory predicts, figure 13(a). The most probable reasonis the balance of surface tensions between the I phase, theN phase and the substrates at the bounding plates that is notaccounted for in the model.
The biaxial nature of the ±1/2 disclinations’ cores wasdiscussed by Lyuksyutov [79]: as one approaches the centerof the defect, r → 0, the energy density of the directordistortions K/r2 becomes comparable to the cubic term BS3
in the Landau–de Gennes free energy expansion. At scales
of rB ∼
√K
BS3 and smaller, the distortions can be relaxedby allowing the structure to become biaxial, as describedin detail by Schopol and Sluckin [80]. In thermotropic5CB, with the typical estimates K = 10 pN,B = 1.6 ×10⁶ J m−3, S = 0.6 [80], one finds rB ∼ 10 nm, a very small(few molecular scales) value, hardly accessible to modernimaging techniques. This is why the theoretical models of
13

J. Phys.: Condens. Matter 25 (2013) 404202 Y-K Kim et al
Figure 13. Simulations of core of an m = 1/2 disclination: (a) dependence of the order parameters S (solid) and P (dashed) on thedimensionless distance x/ξ, ξ =
√L1C/B, along the symmetry line at the temperatures a(T − T∗)C/B2
= 0 (red) and = −0.15 (blue);(b) the normalized phase retardance 0 = S− P (solid lines) calculated along the symmetry line at the same temperatures; the dashed curvesare mirror images of the solid curves and demonstrate the structural asymmetry caused by a relatively large elastic anisotropy La/L1 = 4.
Lyuksyutov [79] and Schopol–Sluckin [80] have not beenverified so far. Since the core size is inversely proportionalto the coefficient B, it should become large as one approachesthe point in the phase diagram where B vanishes. In our case,the scalar order parameter changes over the scale of 10 µm.Since the elastic constants and S values in LCLC nematicsare of the same order of magnitude as their counterparts inthermotropic LCs such as 5CB, the observation of a hugeradius of disclination rB ∼ 10 µm, figures 11(b) and 12(b),suggests that in DSCG the coefficient B is extremely small,only about B = (0.1–1) J m−3. Interestingly, Tang et al [81,82] reported that in a lyotropic N formed by filaments off -actin, the I–N transition is continuous if the average lengthof the filaments is longer than 2 µm and is of first order ifthe filaments are shorter. Another mechanism of the enlargedcore might be brought about by the aggregate structure ofLCLCs. At the core, the average length of the aggregatesmight be smaller than their length in a uniform N, thus the setof parameters in the Landau–de Gennes expansion becomes afunction of position in space near the defect core [83].
9. N-to-I transition: I tactoids and multiplyconnected tactoids
When the temperature is increased to some critical value,the cores of the disclinations start to expand dramatically,see figure 11 for m = 1/2 and figure 12 for m = −1/2. Tocharacterize the temperature behavior of the cores, we usethe normalized square root
√A/π of the isotropic (black in
PolScope textures) area A as a measure of core size. As seenfrom the data in figures 11(d) and 12(d), the temperaturedependence of the core size for m = ±1/2 defects is closeto√
A ∝ const +√
T − Tc, where Tc is some critical pointat which the core starts its expansion; it varies slightlyfrom defect to defect (even if they are of the same charge),indicating an influence of local effects such as surfaceirregularities. Defect-free uniform portions of the N phase alsonucleate I Islands, in the shape of negative tactoids with twocusps, figure 14. The temperature dependence of the negative2c tactoid size, also measured as
√A/π , figure 14(b), is very
similar to the behavior observed for the isotropic disclinationcores, figures 11(d) and 12(d).
The temperature dependence of the core size has beenanalyzed by Mottram and Sluckin [84] for m = 1/2, under
the assumption that the core represents a round island of an Iphase. The disclination energy is then comprised of the elasticenergy of the director distortions outside the core, the surfaceenergy of the I–N interface 2πσ0r1/2 and the condensationenergy (fI− fN)πr2
1/2 ∝ (SI− SN)(TNI−T)r21/2, where SI and
SN are the entropy densities of the I and N phase, respectively.The core size was shown to grow with temperature, followingthe parametric dependence T(r1/2) = TNI +
σ0(SI−SN)r1/2
−
K8(SI−SN)r2
1/2with ∂r1/2/∂T > 0 and ∂2r1/2/∂T2 > 0.
In the case of the biphasic region of LCLC, thecore size of the disclinations follows a different model,since experimentally r±1/2 ∝ const +
√T − Tc, so that
∂r±1/2/∂T > 0 but ∂2r±1/2/∂T2 < 0. The distinctive behaviorof the core defects in LCLCs is brought about by the broadtemperature range of I–N coexistence in which the total area(volume) of each of the two phases shows an approximatelylinear dependence on T , figure 2(d). The total energy ofa singular m = ±1/2 disclination can be approximated asf±1/2 = fe,±1/2 + fcond,±1/2 + fIN,±1/2 =
π4 K ln R/r±1/2 +
πr2±1/2(fI − fN) + 2πr±1/2σr±1/2 , where the equilibrium
core size r±1/2 =1
fI−fN[
√σ 2±1/2 + K(fI − fN)/2 − σ±1/2] is
determined by the anisotropic surface energy σ±1/2(σ0,w,m),which is a function of the isotropic surface tension, the surfaceanchoring strength w and the strength of disclination.
The negative tactoids contain negative cusps, i.e. regionsof the I phase protruding into the N phase at the points wherethe director pattern of the disclination forces the director tobecome perpendicular to the I–N interface. In principle, theLC can simply reduce its scalar order parameter in theseregions to reduce the energy of director distortions or realignthe director along the normal to the bounding plates, figures 11and 12. As already indicated in the discussion of the splittingof integer disclinations, the second mechanism is less likely.In the N regions around the negative cusps, one finds negativeboojums with m=−1/2−τ/2π . Similarly to the conservationlaw (4), one can write down a conservation law for a negativetactoid surrounded by a director field that corresponds to adisclination with the strength mout,
c∑i
(mi +
τi
2π
)− mout = −1, (14)
14

J. Phys.: Condens. Matter 25 (2013) 404202 Y-K Kim et al
Figure 14. (a) PolScope textures of a 2c negative tactoid nucleated in the uniform N part of the texture. (b) Temperature dependence of thecharacteristic size and area of the 2c negative tactoid. (c) Optical retardance 0 before and after the appearance of the 2c tactoid.
which leads to the relationship between the number of positiveand negative cusps and mout,
c− − c+ = 2(1− mout). (15)
For a uniform far field, mout = 0, there are two more negativecusps than positive ones; for mout = −1/2 there should be atleast three negative cusps, etc.
Comparison of figures 11, 12 and 14 demonstrates thatthe 1c, 3c and 2c isotropic tactoids occur in close proximityto each other on the temperature scale, but still at somewhatdifferent values of Tc. The cores of the disclinations are notnecessarily the ones that start to expand first; sometimes the2c isotropic tactoids nucleate at temperatures lower than thetemperature at which the disclination core already presentin the system starts to expand. The overall expansion of theisotropic tactoids with temperature follows the temperaturebehavior of the isotropic phase fraction shown in figure 2(d).
The dynamics of the phase transition can be used tocreate I–N–I tactoids that are non-simply connected. Theserepresent N tactoids that contain large I tactoids inside them,figure 15; ‘large’ here means larger than the disclination corein a homogeneous N phase. A practical approach to createI–N–I tactoids is to first nucleate N tactoids by cooling thesystem from the I phase and then rapidly heat it up, remainingwithin the biphasic region.
The conservation law for these more complicatedgeometries in figure 15 is written as a generalization ofequations (4) and (14),
c∑i
(mi +
τi
2π
)+
n∑j
mj = 1− I or
12
c∑i
ki +
n∑j
mj = 1− I,(16)
where c is the number of boojums at all the I–N interfaces, miis an individual strength, τi is the cusp angle correspondingto the ith boojum, n is the number of disclinations in the Ninterior of the I–N–I tactoid, with topological strengths mj,and I is the number of isotropic tactoids inside the nematictactoid. Similarly to the previously described cases of simplyconnected N and I tactoids, the relationship (16) can berewritten in terms of the excess number of positive cusps c+
over the negative ones c− residing at all the I–N interfaces ofthe multiply connected I–N–I tactoid,
c+ − c− = 2
(1− I −
n∑j
mj
). (17)
As an illustration, figure 15(a) shows two I–N–I tactoidswith I = 1 and two different realizations of the conditionc+−c− = 0. Figure 15(b) illustrates the case of c+ = c− = 3.Figure 15(c) shows an I–N–I tactoid with two I regions. Inthis particular case, there are no cusps on the two round I–Ninterfaces; the only cusps are two negative cusps at the interior2c I tactoid. Finally, figure 15(d) shows six 2c I tactoids insideone N tactoid, c+ − c− = −10.
10. The shape of N and I tactoids in a frozendirector field
As already indicated, the shape of the positive and negativetactoids is determined by the balance of the anisotropicsurface tension and the nematic elasticity of the region eitherinside the positive tactoid or outside the negative tactoid.There is no analytical solution of this problem. On the otherhand, the LCLC tactoids observed in this work show somegeneral features such as multiple cusps, the number of whichis determined by the topological structure of the associated
15

J. Phys.: Condens. Matter 25 (2013) 404202 Y-K Kim et al
Figure 15. PolScope textures of I–N–I tactoid-in-tactoid multiply connected forms with different numbers of isotropic inclusions:(a) I = 1, c− = c+ = 2, (b) I = 1, c− = c+ = 3, (c) I = 2, c− = 2, c+ = 0 and (d) I = 6, c− = 12, c+ = 2.
disclinations. Therefore, it is of interest to describe theseforms using the simplest possible approximation, namely byassuming that the director field is frozen in its distortedstate, as determined by the disclination structures writtenin polar coordinates (r, θ) as nx = cos(mθ + const), ny =
sin(mθ + const); examples of different ms are shown infigures 4(a)–(d). This approximation is equivalent to theassumption of infinitely large elastic constants of the N phase.With the director field frozen, the shape of the I–N boundaryof the tactoids is determined by the angular dependenceof the surface tension which we take in the form σ(α) =
σ0(1+wcos2α). We place the geometrical center of the tactoid(positive or negative) at the center of the disclination. Theangular dependence of the surface energy at the I–N interfacedrawn in the frozen director field then becomes dependent onthe disclination configuration (m) and reads
σ(θ) = σ0{1+ wcos2[(m− 1)θ + const]}, (18)
where the constant in the argument specifies the overallorientation of the director pattern; it can be put equal to 0.
Applying the principle of the Wulff construction ofequilibrium shapes of perfect crystals [68, 85–89] to thedisclination-specific expression (18) for the anisotropicinterfacial tension, we construct the equilibrium shapes ofnegative and positive 2D tactoids under the condition of aconstant surface area and a frozen director field. The principleis illustrated in figure 16.
From some origin O, we draw a line segment OA alongthe direction θ , of length σ(θ). Repeating for all angles θ , weobtain the polar plot of the anisotropic tension σ(θ). In eachpoint A of σ(θ), we raise the normal to the segment OA. Theequilibrium shape is the pedal of the polar plot σ(θ), i.e., theconvex envelope of all these normals. The coordinates (x, y)of the shape curve are expressed in terms of the polar angleψ between the normal to the I–N interface and the x-axis and
Figure 16. Scheme of the Wulff construction of an equilibriumshape of a tactoid of constant area from the polar plot of the surfacetension.
the radius vector r = OB. As is easy to see from figure 16,r cos(ψ − θ) = σ(θ). By taking the derivative with respectto θ, r sin(ψ − θ) = σ ′(θ), one obtains two equations thatprovide a parametric description of the tactoid’s shape: r =√σ 2 + σ ′2 and ψ = θ + arctan σ ′
σ. In Cartesian coordinates,
the shape is parameterized as
x(ψ) = σ(ψ) cosψ − σ ′(ψ) sinψ;
y(ψ) = σ(ψ) sinψ + σ ′(ψ) cosψ.(19)
Figure 17(a) shows different polar plots of thesurface potential σ(ψ) with w = 2 for different directorconfigurations, shown in figures 4(a)–(d), as well as for auniform director field, m = 0. The corresponding shapes ofthe tactoids are shown in figure 17(b). These shapes shouldbe understood as shapes separating either the I interior fromthe N exterior (negative tactoids) or the N interior from the Iexterior (positive tactoids).
Three configurations, namely m = −1; −1/2; 0 fora chosen value of surface anisotropy w = 2 show shape
16

J. Phys.: Condens. Matter 25 (2013) 404202 Y-K Kim et al
Figure 17. (a) Polar plots of the anisotropic surface tension, equation (18), corresponding to the frozen director fields with differenttopological charges m shown in figures 4(a)–(d). (b) The corresponding equilibrium shapes of the negative and positive tactoids,equations (19). The physically relevant parts of the shape do not include the triangular ‘ears’ attached to the cusp points.
Figure 18. Illustration of how the surface anchoring shapes the (a) positive N and (b) negative I tactoids with a frozen director of strengthm = −1/2.
contours that cross themselves, figure 17(b). These crossingsare associated with zeros of the radius of curvature of theenvelope, which is R =
√r′2 + r2ψ ′2 = σ + σ ′′ [68, 87–89].
Whenever σ+σ ′′ > 0, the resulting shape is rounded, with theI–N interface showing all possible orientations in the plane. Ifσ+σ ′′ < 0, the pedal develops cusps of angular discontinuity:some of the orientations of the I–N interface are missingfrom the equilibrium shape. The criterion σ + σ ′′ < 0 formissing orientations for a tactoid associated with a directorfield of strength m and a surface tension dependence given byequation (18) reads
1+ w[1− 4(m− 1)2]cos2(m− 1)ψ + 2(m− 1)2w < 0. (20)
For m = 1/2, 1, this condition is never fulfilled and theshape of the tactoids is circular. Interestingly, as the surfaceanchoring increases, the core of the m = 1/2 disclinationshifts towards the axis at which the director is normal tothe I–N interface, see figure 17(b); in this particular model,
however, the core remains circular. For all other directorconfigurations, the center of the core coincides with the centerof the director field.
For m = −1/2 configurations, inequality (20) predictsσ + σ ′′ < 0 when w > 2/7. Figure 18 shows a progressivechange in the shape of a 3c tactoid with m = −1/2 asthe surface anisotropy increases from values below thecritical value w−1/2 = 2/7 (w = 0.1; 0.25) to values abovew−1/2 (w = 0.4; 1). When w < w−1/2, the I–N interfaceis round with all possible orientations. When w > w−1/2,some orientations are missing. The geometrical indicator ofmissing orientations is triangular ‘ears’ attached to the cuspsin which n is perpendicular to the interface. These ears donot correspond to physical portions of the shape. Our analysisis equally applicable to the positive 3c tactoids shown infigure 18(a) and the negative 3c tactoids shown in figure 18(b).For m = −1, the condition of missing orientations of the I–Ninterface reads w > w−1 = 1/7 and for a classic 2c tactoidwith m = 0,w > w0 = 1.
17
J. Phys.: Condens. Matter 25 (2013) 404202 Y-K Kim et al
11. Conclusion
The term morphogenesis is usually reserved for thedevelopment of forms and structures in systems of biologicalorigin. In this work, we illustrate how the balance ofanisotropic surface energy and internal elasticity shapescomplex morphogenetic developments of tactoidal forms andtopological defects emerging in dynamic phase transitionsbetween the isotropic and nematic phases. In the simplest caseof a thermotropic liquid crystal, the balance of the surfaceand bulk effects produces an equilibrium set of topologicaldefects in N droplets that are larger than about 1–10 µm. Theshape of these N droplets is close to spherical. The situation isvery different in the lyotropic chromonic liquid crystal DSCGwhich was studied in detail for a 2D geometry of confinement.The nuclei of the new phase appear as strongly anisometricislands with pronounced cusps at which the I–N interfaceshows a singular behavior and the director forms surfacedefect-boojums. The reason for the existence of defects is theanisotropy of the interfacial tension, i.e., surface anchoringof the director. The growing nuclei of the N phase mergewith each other and often create bulk defect disclinations ofsemi-integer or even integer strength in a process similar tothe Kibble mechanism. The presence of interior disclinationsinfluences the number of cusps featured by the closed I–Ninterface. We derive conservation laws that relate the numberof positive and negative cusps c to the topological strengthm of the defects inside and outside the simply connected Iand N tactoids. Similar relationships are established for theexperimentally observed multiply connected tactoids.
The integer-strength disclinations that might exist in thebiphasic region split into pairs of semi-integer disclinationsupon approaching the homogeneous N phase. In thehomogeneous N phase, well below the temperature ofthe biphasic region, only semi-integer disclinations survive.The cores of these disclinations are of an extraordinarilylarge radius (tens of microns) and a non-circular shape.Using the Landau–de Gennes theory, we demonstrate thatthe disclination cores contain cusp-like regions, as in theexperiment. The theory associates the cusps at the disclinationcores with the anisotropy of the elastic constants whichtranslates into an effective anisotropy of the I–N interface. Inthe so-called one-constant approximation, the model predictscusp-free circular cores. The N-to-I transition featuresisotropic 2c tactoids nucleating in the uniform parts of thetexture and tactoids with one or three cusps nucleatingat the cores of m = 1/2 and m = −1/2 disclinations,respectively. The size of these isotropic cores increases withtemperature, approximately as r±1/2 ∝ const +
√T − Tc,
which is consistent with the overall temperature dependenceof the volume fractions of coexisting I and N phases. Finally,we illustrate how the orientational anisotropy of the interfacialtension leads to the formation of tactoidal shapes withcusps, by applying a generalized Wulff construction to thetopologically nontrivial frozen director fields.
This is only the first attempt to describe, mostlyqualitatively, the very complex morphogenesis of phasetransition in LCLCs. Much more work is needed to achieve
a better quantitative understanding. An ultimate goal wouldbe to predict the shape and director configuration of tactoidalformations from first principles, using the anisotropic surfaceenergy and the elasticity of the orientational order.
Acknowledgments
We thank Nigel Mottram, Paul van der Schoot, Tim Sluckin,and Shuang Zhou for fruitful discussions, and Luana Tortoraand Chan Kim for help with the experiments. The work wassupported by NSF DMR grants 1104850 and 11212878.
References
[1] Kibble T W B 1997 Aust. J. Phys. 50 697[2] Zurek W H 1996 Phys. Rep. 276 177[3] Trebin H R 1998 Liq. Cryst. 24 127[4] Srivastava A M 1999 Pramana J. Phys. 53 1069[5] Rajantie A 2002 Int. J. Mod. Phys. A 17 1[6] Eltsov V B, Krusius M and Volovik G E 2005 Prog. Low
Temp. Phys. 15 1 (arxiv:cond-mat/9809125)[7] Kibble T W B 1976 J. Phys. A: Math. Gen. 9 1387[8] Das A, Sabbatini J and Zurek W H 2012 Sci. Rep. 2 352[9] Yusupov R, Mertelj T, Kabanov V V, Brazovskii S, Kusar P,
Chu J H, Fisher I R and Mihailovic D 2010 Nature Phys.6 681
[10] Kleman M and Lavrentovich O D 2003 Soft Matter Physics:An Introduction (New York: Springer)
[11] PopaNita V and Sluckin T J 1996 J. Physique II 6 873[12] Chuang I, Durrer R, Turok N and Yurke B 1991 Science
251 1336[13] Bowick M J, Chandar L, Schiff E A and Srivastava A M 1994
Science 263 943[14] Vachaspati T 1991 Phys. Rev. D 44 3723[15] Hindmarsh M 1995 Phys. Rev. Lett. 75 2502[16] Donaire M 2006 J. Phys. A: Math. Gen. 39 15013[17] Rapini A and Papoular M 1969 J. Phys. (Paris) Colloq.
30 C4–54[18] Volovik G E and Lavrentovich O D 1983 Zh. Eksp. Teor. Fiz.
85 1997 (Sov. Phys. JETP 58 1159)[19] Lavrentovich O D 1998 Liq. Cryst. 24 117[20] Faetti S and Palleschi V 1984 Phys. Rev. A 30 3241[21] Onsager L 1949 Ann. New York Acad. Sci. 51 627[22] Lydon J 2011 Liq. Cryst. 38 1663[23] Park H S and Lavrentovich O D 2012 Lyotropic Chromonic
Liquid Crystals: Emerging Applications (Hoboken, NJ:Wiley)
[24] Dickinson A J, LaRacuente N D, McKitterick C B andCollings P J 2009 Mol. Cryst. Liq. Cryst. 509 751
[25] Tam-Chang S W and Huang L M 2008 Chem. Commun. 1957[26] Mariani P, Spinozzi F, Federiconi F, Amenitsch H,
Spindler L and Drevensek-Olenik I 2009 J. Phys. Chem. B113 7934
[27] Zanchetta G, Nakata M, Buscaglia M, Bellini T andClark N A 2008 Proc. Natl Acad. Sci. USA 105 1111
[28] Nakata M, Zanchetta G, Chapman B D, Jones C D, Cross J O,Pindak R, Bellini T and Clark N A 2007 Science 318 1276
[29] Park H S, Kang S W, Tortora L, Kumar S andLavrentovich O D 2011 Langmuir 27 4164
[30] Park H S, Kang S W, Tortora L, Nastishin Y, Finotello D,Kumar S and Lavrentovich O D 2008 J. Phys. Chem. B112 16307
[31] Tortora L, Park H S, Kang S W, Savaryn V, Hong S H,Kaznatcheev K, Finotello D, Sprunt S, Kumar S andLavrentovich O D 2010 Soft Matter 6 4157
18

J. Phys.: Condens. Matter 25 (2013) 404202 Y-K Kim et al
[32] Zhou S, Nastishin Y A, Omelchenko M M, Tortora L,Nazarenko V G, Boiko O P, Ostapenko T, Hu T,Almasan C C, Sprunt S N, Gleeson J T andLavrentovich O D 2012 Phys. Rev. Lett. 109 037801
[33] Nastishin Y A, Liu H, Schneider T, Nazarenko V, Vasyuta R,Shiyanovskii S V and Lavrentovich O D 2005 Phys. Rev. E72 041711
[34] Tortora L and Lavrentovich O D 2011 Proc. Natl Acad. Sci.USA 108 5163
[35] Kaznacheev A V, Bogdanov M M and Taraskin S A 2002J. Exp. Theor. Phys. 95 57
[36] Kaznacheev A V, Bogdanov M M and Sonin A S 2003 J. Exp.Theor. Phys. 97 1159
[37] Prinsen P and van der Schoot P 2003 Phys. Rev. E 68 021701[38] Prinsen P and van der Schoot P 2004 Eur. Phys. J. E 13 35[39] Prinsen P and van der Schoot P 2004 J. Phys.: Condens.
Matter 16 8835[40] Lishchuk S V and Care C M 2004 Phys. Rev. E 70 011702[41] Lavrentovich O D and Terentiev E M 1986 Zh. Eksp. Teor. Fiz.
91 2084 (Sov. Phys. JETP 64 1237)[42] Faetti S and Palleschi V 1984 J. Chem. Phys. 81 6254[43] Blinov L M, Kats E I and Sonin A A 1987 Usp. Fiz. Nauk
152 449[44] Chen W L, Sato T and Teramoto A 1999 Macromolecules
32 1549[45] Chen W L and Gray D G 2002 Langmuir 18 633[46] Doi M and Kuzuu N 1985 Appl. Polym. Symp. 41 65[47] Mcmullen W E 1988 Phys. Rev. A 38 6384[48] Chen Z Y and Noolandi J 1992 Phys. Rev. A 45 2389[49] Koch D L and Harlen O G 1999 Macromolecules 32 219[50] van der Schoot P 1999 J. Phys. Chem. B 103 8804[51] Bernal J D and Fankuchen I 1941 J. Gen. Physiol. 25 146[52] Zocher H 1925 Z. Anorg. Allg. Chem. 147 91[53] Oakes P W, Viamontes J and Tang J X 2007 Phys. Rev. E
75 061902[54] Verhoeff A A, Bakelaar I A, Otten R H J,
van der Schoot P and Lekkerkerker H N W 2011 Langmuir27 116
[55] Davidson P 2010 C. R. Chim. 13 142[56] Puech N, Grelet E, Poulin P, Blanc C and van der Schoot P
2010 Phys. Rev. E 82 020702[57] Jiang Y and Chen J Z Y 2010 Macromolecules 43 10668[58] Nazarenko V G, Boiko O P, Park H S, Brodyn O M,
Omelchenko M M, Tortora L, Nastishin Y A andLavrentovich O D 2010 Phys. Rev. Lett. 105 017801
[59] Hartshor N H and Woodard G D 1973 Mol. Cryst. Liq. Cryst.23 343
[60] Shribak M and Oldenbourg R 2003 Appl. Opt. 42 3009[61] Lavrentovich O D 2012 Contemp. Math. 577 25
[62] de Gennes P G and Prost J 1993 The Physics of LiquidCrystals (Oxford: Clarendon)
[63] Lavrentovich O D 2003 Pramana J. Phys. 61 373[64] Chen W L, Sato T and Teramoto A 1998 Macromolecules
31 6506[65] Fang J Y, Teer E, Knobler C M, Loh K K and Rudnick J 1997
Phys. Rev. E 56 1859[66] Iwamoto M, Liu F and Ou-Yang Z C 2010 Europhys. Lett.
91 16004[67] Rudnick J and Loh K K 1999 Phys. Rev. E 60 3045[68] Burton W K, Cabrera N and Frank F C 1951 Phil. Trans. R.
Soc. 243 299[69] Herring C 1951 Phys. Rev. 82 87[70] Herring C 1953 The Use of Classical Macroscopic Concepts
in Surface-Energy Problems (Chicago: University ofChicago Press)
[71] van Bijnen R M W, Otten R H J and van der Schoot P 2012Phys. Rev. E 86 051703
[72] Chiccoli C, Feruli I, Lavrentovich O D, Pasini P,Shiyanovskii S V and Zannoni C 2002 Phys. Rev. E66 030701
[73] Sheng P 1982 Phys. Rev. A 26 1610[74] de Gennes P 1971 Mol. Cryst. Liq. Cryst. 12 193[75] Lubensky T C 1970 Phys. Rev. A 2 2497[76] Longa L and Trebin H R 1989 Phys. Rev. A 39 2160[77] Schiele K and Trimper S 1983 Phys. Status Solidi b 118 267[78] Mottram N J and Hogan S J 1997 Phil. Trans. R. Soc. A
355 2045[79] Lyuksyutov I F 1978 Zh. Eksp. Teor. Fiz. 75 358 (Sov. Phys.
JETP 48 178)[80] Schopohl N and Sluckin T J 1987 Phys. Rev. Lett. 59 2582[81] Viamontes J, Oakes P W and Tang J X 2006 Phys. Rev. Lett.
97 118103[82] Viamontes J and Tang J X 2003 Phys. Rev. E 67 040701[83] Nastishin Y A, Liu H, Shiyanovskii S V, Lavrentovich O D,
Kostko A F and Anisimov M A 2004 Phys. Rev. E70 051706
[84] Mottram N J and Sluckin T J 2000 Liq. Cryst. 27 1301[85] Landau L D and Lifshits E M 1964 Statisticheskaya Fiz.
(Moscow: Nauka) (in Russian) Statistical Physics(in English)
[86] Oswald P and Pieranski P 2006 Smectic and Columnar LiquidCrystals (Boca Raton, FL: Taylor and Francis)
[87] Wheeler A A 2006 Proc. R. Soc. A 462 3363[88] Khare S V, Kodambaka S, Johnson D D, Petrov I and
Greene J E 2003 Surf. Sci. 522 75[89] Nozieres P 1992 Shape and Growth of Crystals (Cambridge:
Cambridge University Press)
19


![Computational modeling of tactoid dynamics in …...[1, 7, 8, 9]. Tactoids of the nematic phase nucleating upon cooling are called positive tactoids [8] and are the subject of the](https://static.fdocuments.net/doc/165x107/5f5567ac8f70a93d36635a9a/computational-modeling-of-tactoid-dynamics-in-1-7-8-9-tactoids-of-the.jpg)


