Morgan Stanley Conference Handout.ppt - AEP.com · Morgan Stanley Utilities Conference Handout New...
34
1 Morgan Stanley Utilities Conference Handout New York, NY March 7, 2013
Transcript of Morgan Stanley Conference Handout.ppt - AEP.com · Morgan Stanley Utilities Conference Handout New...

1
Morgan Stanley Utilities Conference Handout
New York, NYMarch 7, 2013

2
Investor Relations Contacts
“Safe Harbor” Statement under the Private Securities Litigation Reform Act of 1995
Bette Jo RozsaManaging DirectorInvestor Relations
Julie SherwoodDirector
Investor Relations614-716-2663
Sara MaciochAnalyst
Investor Relations614-716-2835
This presentation contains forward-looking statements within the meaning of Section 21E of the Securities Exchange Act of 1934. Although AEP and each of its RegistrantSubsidiaries believe that their expectations are based on reasonable assumptions, any such statements may be influenced by factors that could cause actual outcomesand results to be materially different from those projected. Among the factors that could cause actual results to differ materially from those in the forward-lookingstatements are: the economic climate and growth in or contraction within and changes in market demand and demographic patterns in our service territory, inflationary ordeflationary interest rate trends, volatility in the financial markets, particularly developments affecting the availability of capital on reasonable terms and developmentsimpairing our ability to finance new capital projects and refinance existing debt at attractive rates, the availability and cost of funds to finance working capital and capitalneeds, particularly during periods when the time lag between incurring costs and recovery is long and the costs are material, electric load, customer growth and the impactof retail competition, particularly in Ohio, weather conditions, including storms and drought conditions, and our ability to recover significant storm restoration costs throughapplicable rate mechanisms, available sources and costs of, and transportation for, fuels and the creditworthiness and performance of fuel suppliers and transporters,availability of necessary generating capacity and the performance of our generating plants, our ability to recover increases in fuel and other energy costs through regulatedor competitive electric rates, our ability to build or acquire generating capacity, and transmission lines and facilities (including our ability to obtain any necessary regulatoryapprovals and permits) when needed at acceptable prices and terms and to recover those costs (including the costs of projects that are cancelled) through applicable ratecases or competitive rates, new legislation, litigation and government regulation including oversight of nuclear generation, energy commodity trading and new orheightened requirements for reduced emissions of sulfur, nitrogen, mercury, carbon, soot or particulate matter and other substances or additional regulation of fly ash andsimilar combustion products that could impact the continued operation and cost recovery of our plants and related assets, evolving public perception of the risksassociated with fuels used before, during and after the generation of electricity, including nuclear fuel, a reduction in the federal statutory tax rate could result in anaccelerated return of deferred federal income taxes to customers, timing and resolution of pending and future rate cases, negotiations and other regulatory decisionsincluding rate or other recovery of new investments in generation, distribution and transmission service and environmental compliance, resolution of litigation, our ability toconstrain operation and maintenance costs, our ability to develop and execute a strategy based on a view regarding prices of electricity, coal, natural gas and otherenergy-related commodities, prices and demand for power that we generate and sell at wholesale, changes in technology, particularly with respect to new, developing oralternative sources of generation, our ability to recover through rates or market prices any remaining unrecovered investment in generating units that may be retired beforethe end of their previously projected useful lives, volatility and changes in markets for electricity, natural gas, and other energy-related commodities, changes in utilityregulation, including the implementation of ESPs and the transition to market and expected legal separation for generation in Ohio and the allocation of costs withinregional transmission organizations, including PJM and SPP, our ability to successfully manage negotiations with stakeholders and obtain regulatory approval to terminatethe Interconnection Agreement, changes in the creditworthiness of the counterparties with whom we have contractual arrangements, including participants in the energytrading market, actions of rating agencies, including changes in the ratings of our debt, the impact of volatility in the capital markets on the value of the investments held byour pension, other postretirement benefit plans, captive insurance entity and nuclear decommissioning trust and the impact on future funding requirements, accountingpronouncements periodically issued by accounting standard-setting bodies and other risks and unforeseen events, including wars, the effects of terrorism (includingincreased security costs), embargoes, cyber security threats and other catastrophic events
3
Table of Contents
Topic PageCompany Overview/Strategy 4Transmission 11Competitive Operations 14Financial 21
4
AEP Investment Opportunity
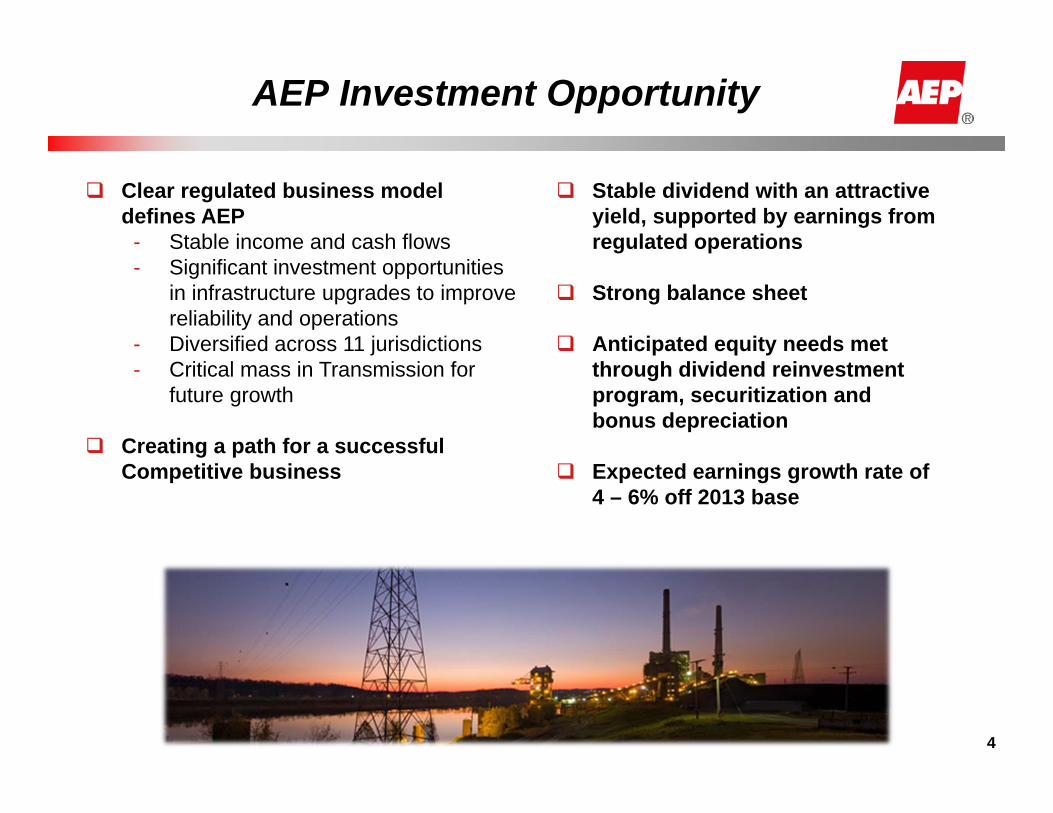
Clear regulated business model defines AEP
- Stable income and cash flows- Significant investment opportunities
in infrastructure upgrades to improve reliability and operations
- Diversified across 11 jurisdictions- Critical mass in Transmission for
future growth
Creating a path for a successful Competitive business
Stable dividend with an attractive yield, supported by earnings from regulated operations
Strong balance sheet
Anticipated equity needs met through dividend reinvestment program, securitization and bonus depreciation
Expected earnings growth rate of 4 – 6% off 2013 base
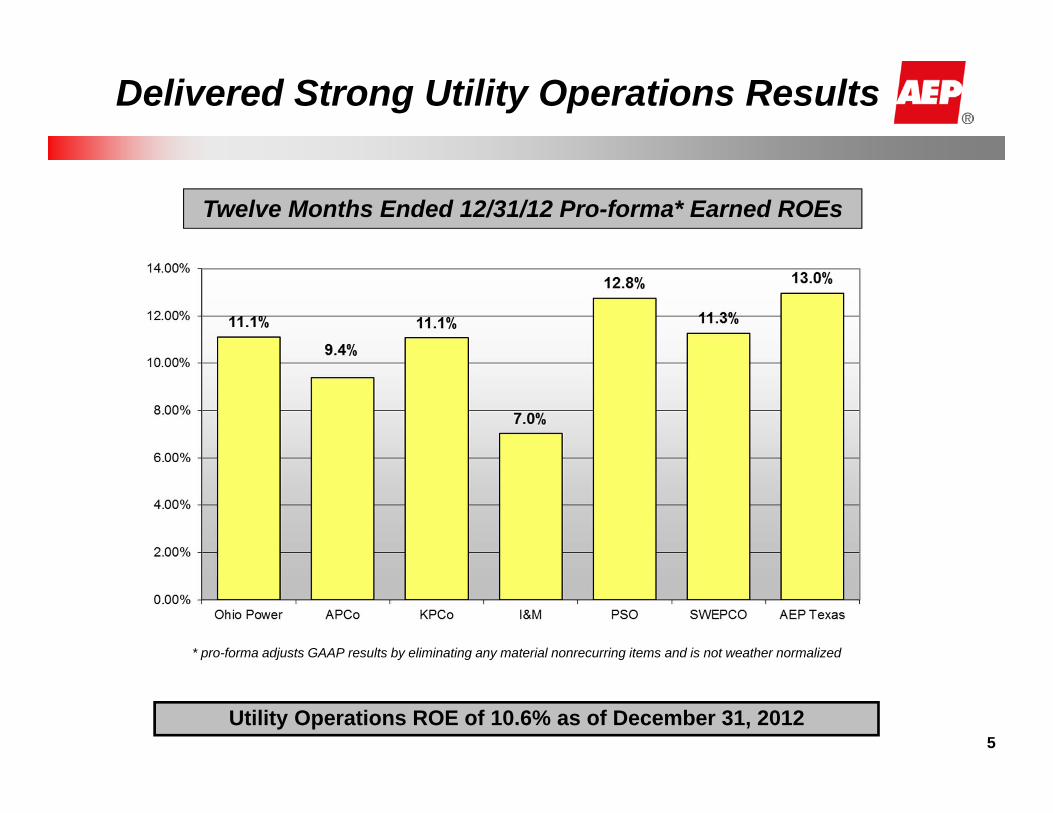
Twelve Months Ended 12/31/12 Pro-forma* Earned ROEs
* pro-forma adjusts GAAP results by eliminating any material nonrecurring items and is not weather normalized
Utility Operations ROE of 10.6% as of December 31, 2012
Delivered Strong Utility Operations Results
5
6
Expected EPS Growth Rate
Expected Operating Earnings Per Share Growth Rate of 4-6%
3.05
3.15
3.25
3.35
3.45
3.55
2013E 2014E
4%
6%
$3.05 - $3.25
$3.15 - $3.45
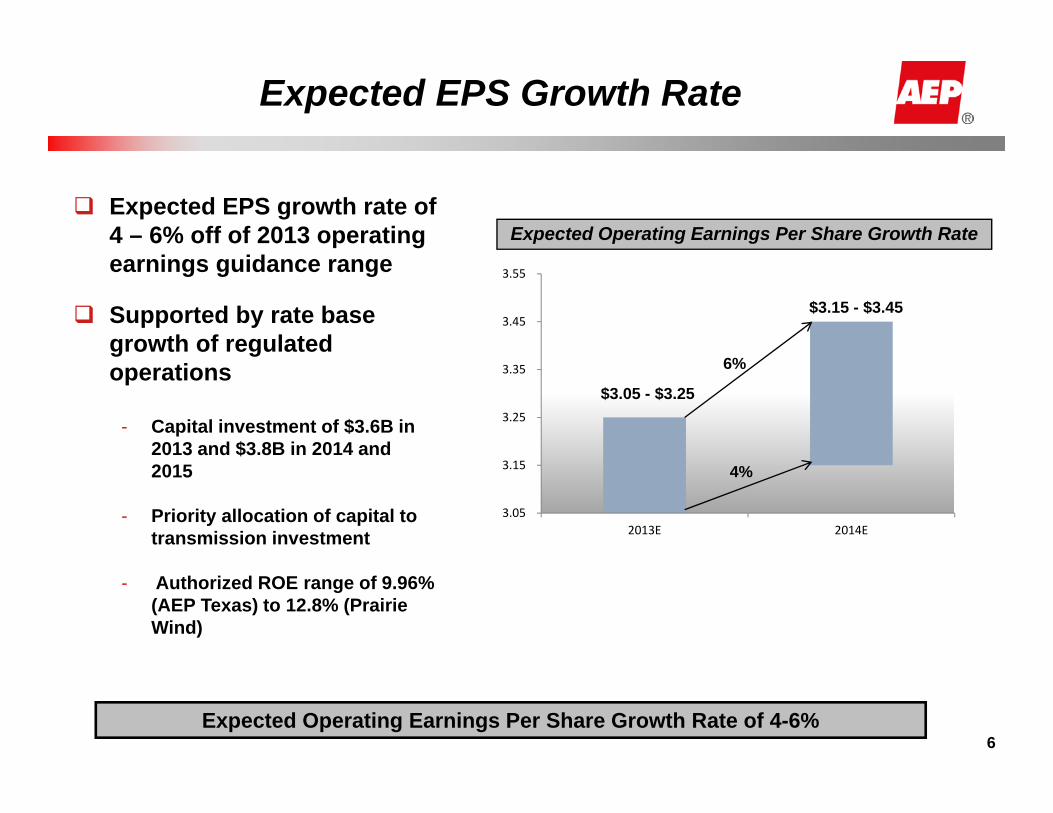
Expected Operating Earnings Per Share Growth Rate Expected EPS growth rate of
4 – 6% off of 2013 operating earnings guidance range
Supported by rate base growth of regulated operations
- Capital investment of $3.6B in 2013 and $3.8B in 2014 and 2015
- Priority allocation of capital to transmission investment
- Authorized ROE range of 9.96% (AEP Texas) to 12.8% (Prairie Wind)

7
$0.7
$1.4
$2.1
$2.4
$4.8
$7.5
$4.4
$2.8$1.3
$0.6
$0.4
$1.0
$0.0
$1.0
$2.0
$3.0
$4.0
$5.0
$6.0
$7.0
$8.0
$9.0
$10.0
2013E 2014E 2015E
$ in
bill
ions
Wires CompaniesTX Wires and Ohio Power Wires Rate recovery via trackers (OH) or TCOS (TX)ROEs range from 9.96% to 11.49%
7
Regulated Business Growth Forecast
Cumulative Change in Regulated Net Property, Plant & Equipment (PP&E)
Vertically Integrated UtilitiesD and G rate adjustments via base rate cases with certain tracker mechanisms for nuclear, environmental and reliability investments T Rate recovery via trackers in TN, VA, MI. Others in base rates ROEs range from 10.0% to 10.9%
AEP Transmission Holdco(excluding unconsolidated JVs)Transcos: Rate recovery via FERC formula rates ROEs 11.49% (PJM) / 11.20% (SPP)
Note: 2013 annual regulated depreciation is $1.3B; Transmission JV investments, other than Transource, are not reflected above as the ventures are not consolidated on AEP’s financial statements
2012 Net Regulated PP&E = $33.9B6.9% CAGR in Net Regulated PP&E
Growth in regulated PP&E supports overall earnings growth of 4-6%

8
$6 - 8$5 - 7
$4 – 5
$ in billions
Environmental Transition Capital Plan2012-2020
Generation fleet will move to a more balanced portfolio while controlling costs, complying with environmental rules and benefitting our customers
65% of our current fleet capacity comes from coal generation
Anticipated coal capacity of 50% of the fleet by 2020
Estimated capital spend of $4 - $5 billion between now and 2020 to make these remaining coal plants compliant with current and proposed EPA regulations, including MATS, coal combustion residuals and 316(b) and effluent guidelines
Diligence in finding the lowest cost and low risk compliance options have resulted in more retirements, lower cost retrofits and reduced capital expenditures
Fleet Transformation

Repositioned Cost Profile
Organizational and process optimization evaluation, including five ‘deep dive’ areas of focus
- Finance & Accounting- Information Technology- Procurement/Supply Chain- Generation- Organizational Effectiveness
Aligned AEP’s employee benefits with other companies in the sector
Study reinforced resource allocations throughout the company to provide better customer service
Repositioned cost profile will sustainably absorb new operations and other expense increases
Utility Operations O&M well controlled
$2,874 $2,937 $2,675 $2,631
$553 $607$636 $754
$0
$500
$1,000
$1,500
$2,000
$2,500
$3,000
$3,500
$4,000
2010A 2011A 2012A 2013E
$ in
mill
ions
Items withEarningsOffsets
Base UtilityO&M
Utility O&M Trend
9
10
Dividend Policy
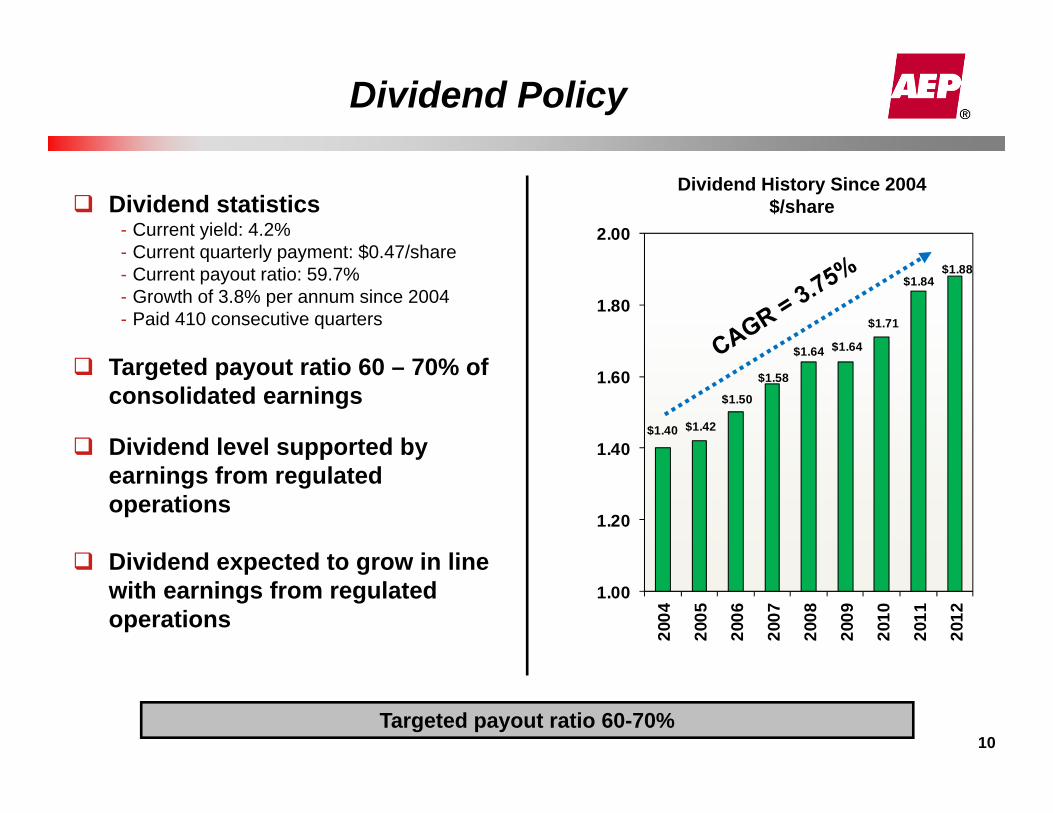
Dividend statistics- Current yield: 4.2%- Current quarterly payment: $0.47/share- Current payout ratio: 59.7%- Growth of 3.8% per annum since 2004- Paid 410 consecutive quarters
Targeted payout ratio 60 – 70% of consolidated earnings
Dividend level supported by earnings from regulated operations
Dividend expected to grow in line with earnings from regulated operations
Targeted payout ratio 60-70%
Dividend History Since 2004$/share
$1.40 $1.42
$1.50
$1.58
$1.64 $1.64
$1.71
$1.84 $1.88
1.00
1.20
1.40
1.60
1.80
2.00
2004
2005
2006
2007
2008
2009
2010
2011
2012

11
PJM SPP ERCOT TotalNew / Enhanced Stations 340 71 68 479
Transformation Capacity 17,900 MVA 2,500 MVA 1,300 MVA 21,700 MVA
New Transmission Lines 260 miles 175 miles 1,350 miles 1,785 miles
Rebuilt Transmission Lines 2,675 miles 425 miles 775 miles 3,875 milesCommunication and Control
Major Infrastructure Improvements
Rebuild or replace obsolete communication circuits and pilot wire protection, expand SCADA and add new equipment condition
Transmission Outlook
2013 – 2015 Earnings Forecast Based on Approved Projects
Post 2015 Investment Opportunities Drive Additional Future Earnings Growth
Largest transmission construction program in the country
*

Transmission ROEs and Incentives
Actual Project ROEs are a Function of the Base ROE PLUS Applicable Project Incentives
Transco & Operating Company ROEs are in the middle of the current range of ROEs in PJM and SPP
*includes 50 bps RTO adder
12
AEP has a track record of prudently requesting and receiving incentives that are commensurate with the risk of each project
Range of ROEs in PJM*AEP East OPCO& Transco ROEs
10.5% 12.4%11.49%
10.77%
Range of ROEs in SPP*AEP West OPCO& Transco ROEs
12.8%11.20%
Project/Joint Venture
Requested Incentives(ROE adder) Incentives Granted
TransourceMissouri
100 bps for Sibley-Nebraska City 0 bps for Iatan-Nashua project50 bps RTO adder for all projects
100 bps for Sibley-Nebraska City 0 bps for Iatan-Nashua project50 bps RTO adder for all projects
RITELine Overall risk adder of 200 bps 50 bps RTO adder100 bps Risk Adder
Prairie Wind 150 bps Risk Adder50 bps RTO adder
150 bps Risk Adder50 bps RTO adder
Pioneer 150 bps Risk Adder50 bps RTO adder
150 bps Risk Adder50 bps RTO adder

1313
Transmission Holdco Business Growth
Cumulative Transmission Holdco Net Property, Plant & Equipment
Note: 2013 annual depreciation is $9M; Transmission JV investments, other than Transource, are not reflected in PP&E above as the ventures are not consolidated on AEP’s financial statements; EPS represents AEPTHC, which includes all transcos and JVs
2010 Net PP&E = $50M124% CAGR in Net Transmission Holdco PP&E
Expected growth in EPS contribution closely tied to growing capital investment
$0.3
$0.7
$1.4
$2.2
$2.8
AEP Transmission Holdco(excluding unconsolidated JVs)
Transcos and TransourceRegulated by FERC
Revenue requirement reset annually based on prior year’s activity plus the current year’s projected plant-in-service balances, reducing regulatory lag
Transcos: ROEs 11.49% (PJM) 11.20% (SPP)
Transource: 86% ownership; capital investment begins in 2014
14
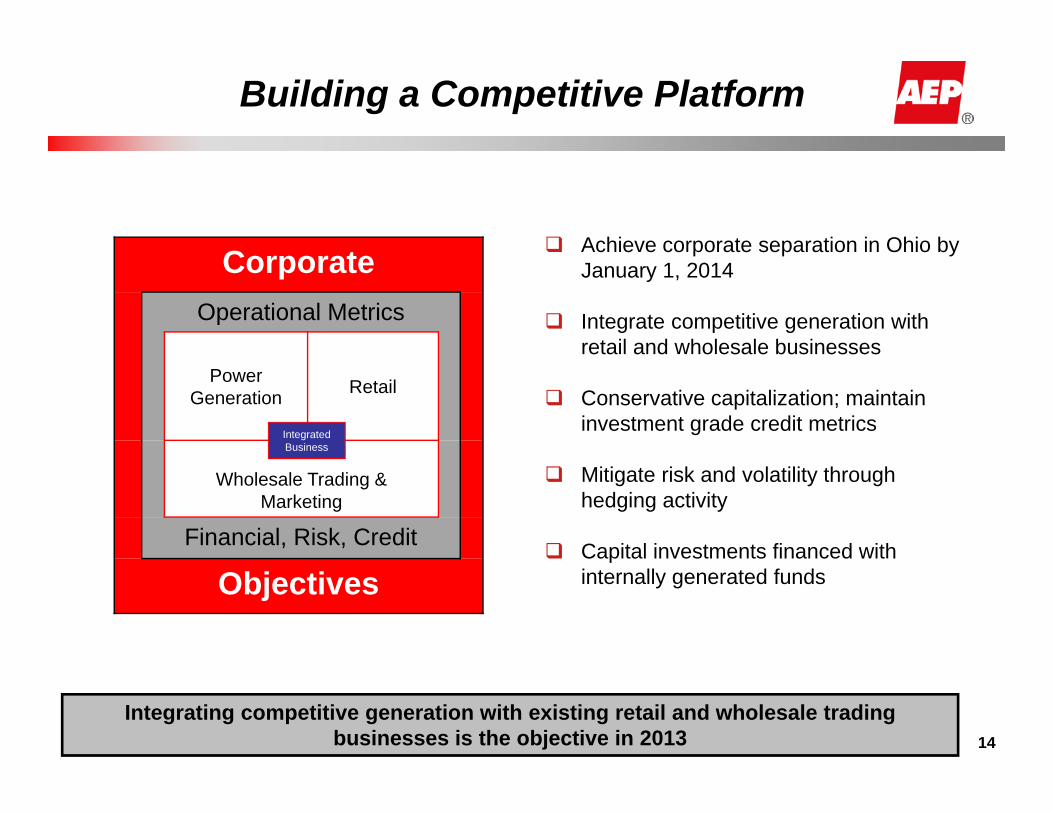
Building a Competitive Platform
Achieve corporate separation in Ohio by January 1, 2014
Integrate competitive generation with retail and wholesale businesses
Conservative capitalization; maintain investment grade credit metrics
Mitigate risk and volatility through hedging activity
Capital investments financed with internally generated funds
CorporateOperational Metrics
Power Generation Retail
Wholesale Trading & Marketing
Financial, Risk, Credit
Objectives
Integrated Business
Integrating competitive generation with existing retail and wholesale trading businesses is the objective in 2013

1515
AEP Generation Resources Footprint
AEP Generation Resources has the competitive advantage of fuel and operational diversity
Fuel Profile (2015)
Geographic Profile
8,876 MW
Capacity Profile (MW)
16
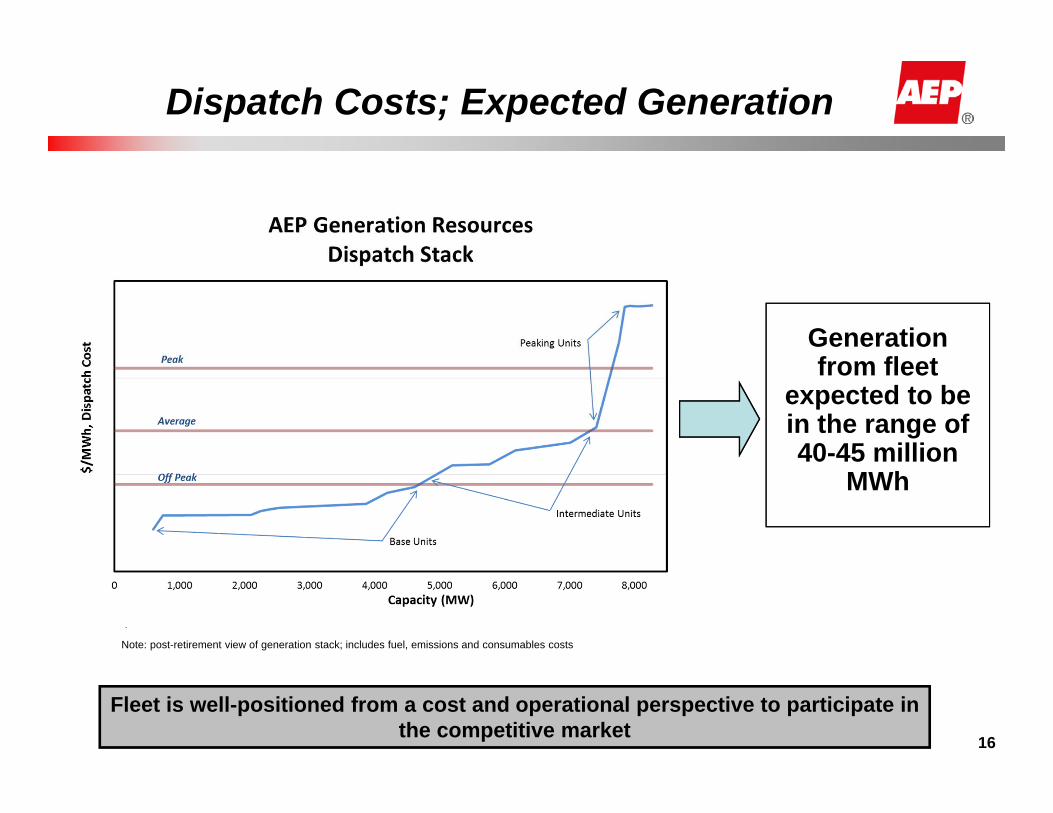
Dispatch Costs; Expected Generation
Fleet is well-positioned from a cost and operational perspective to participate in the competitive market
Generation from fleet
expected to be in the range of 40-45 million
MWh
Note: post-retirement view of generation stack; includes fuel, emissions and consumables costs

1717
Business As Usual (BAU) -Transition - Market
Capacity
SSO Load
Fuel Clause
Off-system Energy
2013 20142015
2016
BAU
BAU
10% slice of system auction
(Q3 ‘13-May ‘14)
FRR Capacity
revenue per ESP
60% slice of system auction
(Jun-Dec)
Per ESP
No SSO obligation
100% slice of system auction
FRR Capacity
revenue per ESP
Jan-May June-Dec
PJM RPM
Market
Excess energy sold in
retail and wholesale markets
All energy sold in
retail and wholesale markets
No SSO obligation
Blue – represents market exposureRed – According to ESP order from PUCO
PJM RPM
Market
All energy sold in
retail and wholesale markets
All energy sold in
retail and wholesale markets
Recovered through market sales
Recovered through market sales
Per ESP
FRR Capacity
revenue per ESP
1818
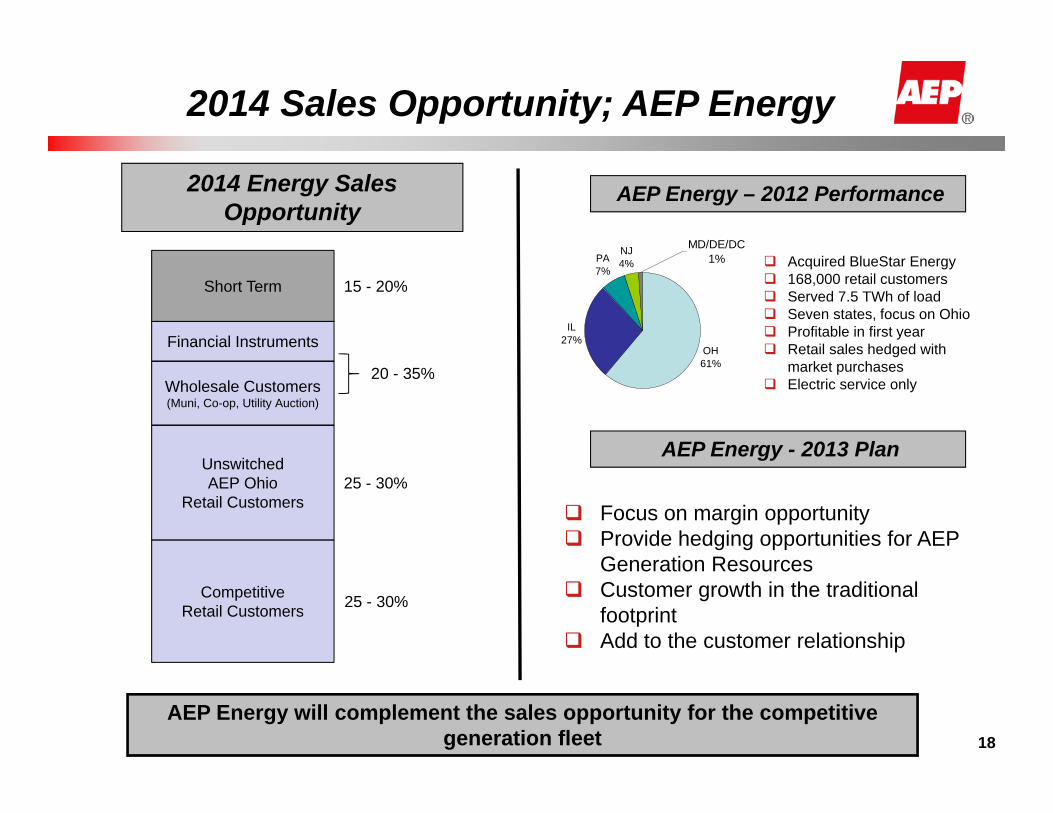
2014 Sales Opportunity; AEP Energy
AEP Energy – 2012 Performance
AEP Energy will complement the sales opportunity for the competitive generation fleet
IL27%
PA7%
NJ4%
OH61%
MD/DE/DC1% Acquired BlueStar Energy
168,000 retail customers Served 7.5 TWh of load Seven states, focus on Ohio Profitable in first year Retail sales hedged with
market purchases Electric service only
AEP Energy - 2013 Plan
Focus on margin opportunity Provide hedging opportunities for AEP
Generation Resources Customer growth in the traditional
footprint Add to the customer relationship
2014 Energy Sales Opportunity
Competitive Retail Customers
UnswitchedAEP Ohio
Retail Customers
Wholesale Customers (Muni, Co-op, Utility Auction)
Financial Instruments
Short Term
25 - 30%
25 - 30%
20 - 35%
15 - 20%
19
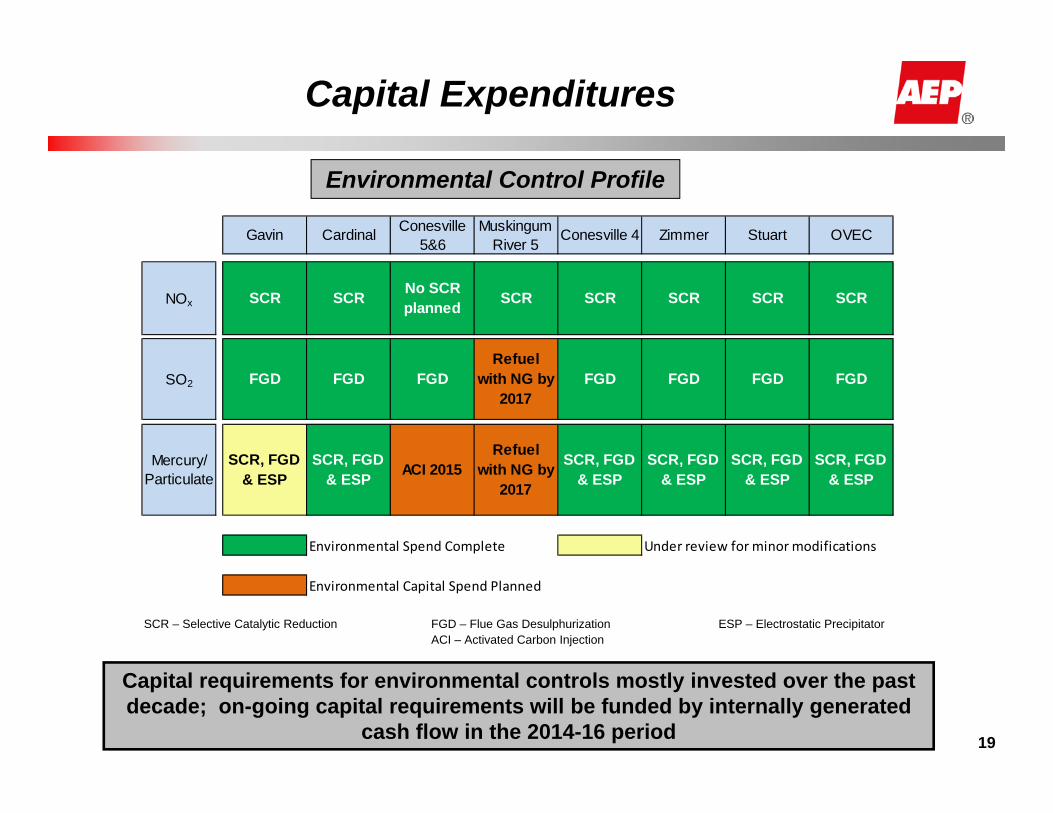
Capital requirements for environmental controls mostly invested over the past decade; on-going capital requirements will be funded by internally generated
cash flow in the 2014-16 period
Capital Expenditures
Environmental Control Profile
SCR – Selective Catalytic Reduction FGD – Flue Gas Desulphurization ESP – Electrostatic PrecipitatorACI – Activated Carbon Injection
Gavin Cardinal Conesville 5&6
Muskingum River 5
Conesville 4 Zimmer Stuart OVEC
NOx SCR SCR No SCR planned SCR SCR SCR SCR SCR
SO2 FGD FGD FGDRefuel
with NG by 2017
FGD FGD FGD FGD
Mercury/ Particulate
SCR, FGD & ESP
SCR, FGD & ESP ACI 2015
Refuel with NG by
2017
SCR, FGD & ESP
SCR, FGD & ESP
SCR, FGD & ESP
SCR, FGD & ESP
Environmental Spend Complete Under review for minor modifications
Environmental Capital Spend Planned

20AEP Generation Resources will be conservatively financed
Financing AEP Generation Resources
Debt 35% - 40%
Equity 60% - 65%
Total $3.1B
Expected Initial Capitalization
Closed on 27-month $1B bank loan to fund Ohio Power maturities this year
Expect AEP Generation Resources to be capitalized conservatively; company will look investment grade but will not be rated initially
Initial debt financing will be an inter-company loan from the parent; permanent financing will take place in the 2014/15 timeframe
Liquidity backstop provided through $3.5B in AEP core credit facilities; recently extended expiration dates into 2016/17 timeframe

21
2013 Operating Earnings Guidance
2013 Operating Earnings Guidance Range: $3.05 - $3.25 per share
2012A 2013E

22
Detailed Operating Earnings Guidance
2012A: $3.09 2013E: $3.05 - $3.25
($ millions) ($ millions)
UTILITY OPERATIONS:Gross Margin:
1 East Regulated Integrated Utilities 65,819 GWh 2,991 66,842 GWh 3,116 2 Ohio Companies 50,294 GWh 2,456 48,481 GWh 2,207 3 West Regulated Integrated Utilities 42,234 GWh 1,396 42,473 GWh 1,539 4 Texas Wires 29,039 GWh 642 28,785 GWh 659 5 Off-System Sales 324 311 6 Transmission Revenue - 3rd Party 500 595 7 Other Operating Revenue 506 552 8 Utility Gross Margin 8,815 8,979
9 Operations & Maintenance (3,311) (3,385) 10 Depreciation & Amortization (1,734) (1,694) 11 Taxes Other than Income Taxes (827) (855) 12 Interest Expense (882) (906) 13 Other Income & Deductions 139 62 14 Income Taxes (683) (787) 15 Utility Operations Operating Earnings 1,517 1,414
16 Transmission Operations Operating Earnings 44 67 NON-UTILITY OPERATIONS:
17 AEP River Operations 15 35 18 Generation & Marketing 7 24
19 Parent & Other Operating Earnings (86) (5)
20 OPERATING EARNINGS 1,497 1,535
American Electric PowerFinancial Results for 2012 Actual Vs 2013 Guidance
2012 Actual 2013 GuidancePerformance Driver Performance Driver
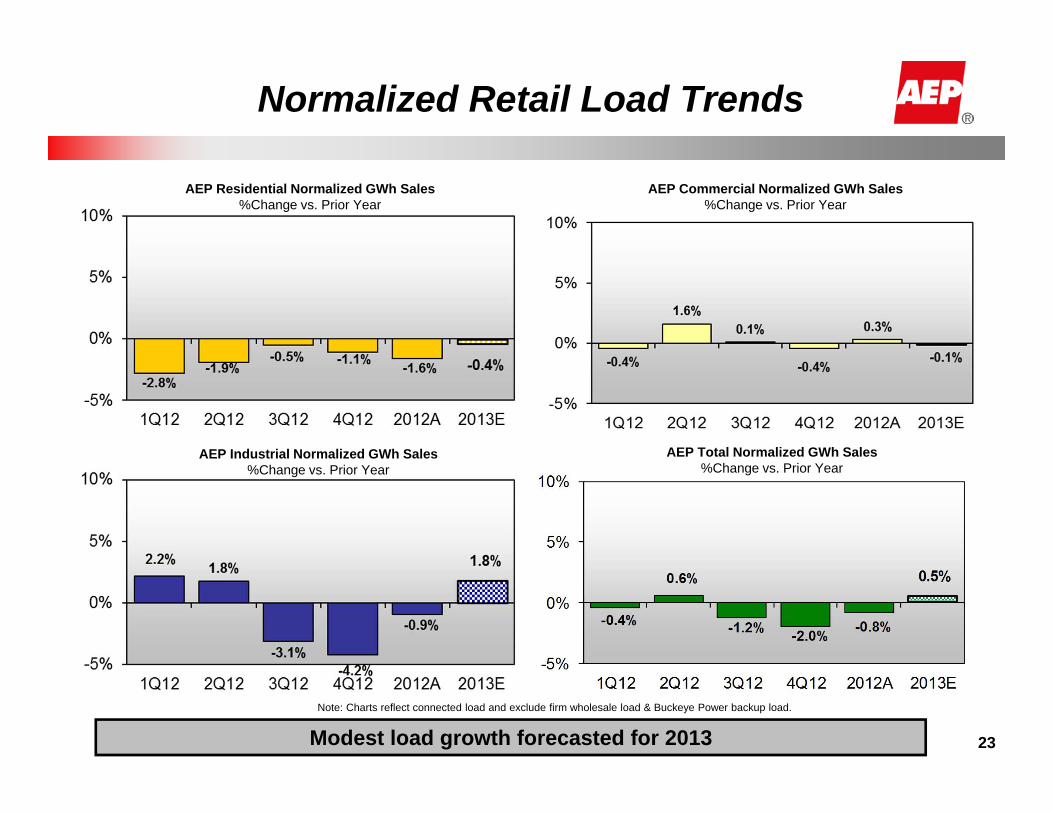
-0.4%
0.6%
-1.2% -2.0% -0.8%
0.5%
-5%
0%
5%
10%
1Q12 2Q12 3Q12 4Q12 2012A 2013E
Normalized Retail Load Trends
AEP Residential Normalized GWh Sales%Change vs. Prior Year
AEP Commercial Normalized GWh Sales%Change vs. Prior Year
AEP Industrial Normalized GWh Sales%Change vs. Prior Year
AEP Total Normalized GWh Sales%Change vs. Prior Year
Note: Charts reflect connected load and exclude firm wholesale load & Buckeye Power backup load.
Modest load growth forecasted for 2013 23

Identified Load Increases
Shale gas expansion is a fundamental positive for the AEP territory24
Jurisdiction IndustryMonthly GWh
ImpactDate of
ExpansionOhio Power Gas Transmission 7.7 Mar-13
Coating Services 9.0 Mar-13Gas Transmission 10.3 May-13Gas Transmission 15.3 Jul-13Gas Transmission 15.3 Sep-13Gas Transmission 7.7 Oct-13
Wheeling Power Gas Transmission 31.0 Mar-13Coal Mining 5.5 Apr-13Gas Transmission 3.0 Apr-13Gas Transmission 9.3 Jul-13Coal Mining 8.0 Jul-13Gas Transmission 3.0 Aug-13
TCC Steel 4.3 Jul-13PSO Gas Transmission 11.2 Oct-13
Gas Transmission 8.5 Oct-13
Expected Monthly Addition 149.0
2013Expansions

25
2012 and 2013 Capital & Equity Contributions
Incremental capital allocated to transmission and regulated utility investment opportunities
$ in millions
2013E: $3.6B2012A: $3.1B
New Generation spend decreasing 88%
Environmental spend increasing 126%
$ in millions
Excluding AFUDCExcluding AFUDC
Transco/JV spend increasing 48%
Nuclear spend increasing 42%

26
2013 Capital by Operating Company
Note: Ohio Power includes $136M related to Amos 3 and Mitchell plants to be transferred from Ohio Power to APCo and KPCo

27
2013 Key Assumptions & Sensitivities
Sensitivities OSS Assumptions, net of sharing
26,715 GWH
33,600 GWH
Sensitivity EPS
Retail Sales 0.5% +/- 0.04
Customer Switching in Ohio (net of capacity deferral) 4.0% +/- 0.03
Wholesale Market Prices $1 MWh +/- 0.03
O&M Expense (excludes O&M w ith offsets) 1.0% +/- 0.04
2013 Effective Tax rate @ 35.8% 1.0% +/- 0.05
Note: A $7.5M change in pre-tax earnings equals $0.01/share.
AD Hub ATC Price - $32.50
Henry Hub NG Price - $3.53

28
MATS Environmental Investments & Retirements
Projected Plant Retirements through 2016Potential Environmental Investments
ACI – Activated Carbon InjectionDSI – Dry Sorbent InjectionFGD – Flue Gas DesulfurizationSCR – Selective Catalytic Reduction
Operating Company Plant MW
Potential Type of retrofit
AEP Ohio(1) Conesville 5 & 6 800 ACIMuskingum River 5(2) 578 Refuel with Natural GasGavin 1 & 2 2,640 ACI
APCO Clinch River 1(3) 242 Refuel with Natural GasClinch River 2(3) 242 Refuel with Natural Gas
I&M Tanners Creek 4(4) 482 Refuel with Natural GasRockport(5) 2,620 DSI, SCR
KPCO Big Sandy 1(6) 278 Refuel with Natural Gas
PSO Oklaunion 101 FGD upgrade, ACINortheastern 3(5) 470 ACI, DSI, Baghouse
SWEPCO Welsh 1 528 ACI, DSI, BaghouseWelsh 3 528 ACI, DSI, BaghousePirkey 580 ACIDolet Hills 262 ACI, BaghouseFlint Creek(5) 264 FGD, ACI
TNC Oklaunion 377 FGD upgrade, ACIGrand Total MW 10,992
(1) Assumes investment is able to clear the market(2) Existing Coal Plant 585MW(3) Existing Coal Plant 235MW(4) Existing Coal Plant 500MW(5) Subject to regulatory and other approvals(6) Pending outcome of RFP process
Operating Company Plant MW
Expected Retirement
APCO Glen Lyn 5 95 2015Glen Lyn 6 240 2015Clinch River 3 235 2015Sporn 1 150 2015Sporn 3 150 2015Kanawha River 1 200 2015Kanawha River 2 200 2015Total MW 1,270
I&M Tanners Creek 1 145 2015Tanners Creek 2 145 2015Tanners Creek 3 205 2015Total MW 495
AEP Ohio Muskingum River 1-4 840 2015Picway 5 100 2015Sporn 2-4 300 2015Kammer 1-3 630 2015Beckjord 53 2015Total MW 1,923
KPCo Big Sandy 2 800 2015Total MW 800
SWEPCO Welsh 2 528 2014Total MW 528
PSO Northeastern 4 460 2016Total MW 460
Total Retirements = 5,476MW

29
Pension & OPEB Liabilities Well Managed
75% 74%
82%
88%
92%
70%
80%
90%
100%
2008 2009 2010 2011 2012
Qualified Pension Liability Funding
OPEB Assets and Liabilities
$1,000
$1,500
$2,000
$2,500
Dec-11 Feb-12 Apr-12 Jun-12 Aug-12 Oct-12 Dec-12
OPEB AssetsOPEB Liability
OPEBs Funded Status at December 31, 2012 is 90.8%
Contributions(in millions) $500 $450 $200
In addition to balance sheet deleveraging, significant funds were committed to improve the funded status of pension liabilities
Discount rate for 2013 is 3.95% for both pension and OPEB; assumed rate of return on assets is 6.50% for pension and 7.00% for OPEB
Modified post employment medical benefits for current employees, resulting in a reduction in the OPEB liability of $460M, or 21%
Expect combined pension and OPEB costs (O&M and capital) to decrease by about $60M pre-tax from 2012 to 2013
$ - $ -
Pension and OPEB funding and expense requirements significantly reduced

30
Forecasted Cash Flows and Financial Metrics
Cash needs are met through debt capital, securitization, bonus depreciation and the Dividend Reinvestment Plan
A:B:
Bonus Depreciation $ 952M
Securitization $1,192MOH distribution assets ($320M)WV ENEC ($422M)OH deferred fuel ($450M)
DRP/401k $ 300M
3-Year Total $2,444M
Cash inflowsfinance capital investment:
A:
B:
C:
C:
$ in millions 2013 2014 2015
Cash from Operations - Excluding Bonus Depreciation Impact 3,038 3,580 3,500
Bonus Depreciation Impact 792 160 -
Cash from Securitization 742 450 -
Capital & JV Equity Contributions (3,600) (3,800) (3,800)
Other Investing Activities (180) (280) (215)
Common Dividends @ $1.88/share (916) (921) (926)
Excess (Required) Capital (124) (811) (1,441)
Financing ($ in millions) 2013 2014 2015
Excess (Required) Capital (124) (811) (1,441)
Debt Maturities (Senior Notes, PCRBs) (1,649) (995) (1,155)
Securitzation Amortizations (280) (350) (330)
Interim Credit Facility 1,000 - -
Equity (DRP/401k) 100 100 100
Debt Capital Market Needs (New) (953) (2,056) (2,826)
Financial Metrics 2013 2014 2015
Debt to Capitalization Target
FFO/Total Debt Target
Mid 50s
Mid -to- upper teens

31
AEP’s Financial Strength
AEP Corporate Credit Ratings
S&P Moody's FitchBBB (Stable) Baa2 (Stable) BBB (Negative)
Balance sheet remains stable at mid-50% debt to capitalization ratio
12/31/2012
4.5x
18.7%
4.6x
19.9%
Credit Metrics
Debt to Capitalization 55.3% 55.2%
12/31/2011 FFO to Interest
Coverage
FFO to Debt
On February 13, 2013, AEP: Repriced, upsized by $250 million and
extended by one year the previous $1.5 billion core credit facility due June 23, 2015
Repriced and extended by one year the previous $1.75 billion core credit facility due July 26, 2016
Obtained a 27-month $1 billion unsecured delayed draw term loan facility for Ohio Power / AEP Generation Resources transition
Liquidity increased and extended
$‐
$250
$500
$750
$1,000
$1,250
$1,500
$1,750
$2,000
2015 2016 2017
$ in m
illions
Year of Facility Expiration
Previous Renewed (as of 2/13/13) Ohio Transition Facility
Liquidity Summary
New

Long-term Debt Maturity Profile
32
Year 2013 2014 2015 2016 2017
AEP, Inc. - - - - $550AEP Generating Company - $45 - - -Appalachian Power $470 $204 $500 $65 $250Indiana Michigan Power $98 $308 $265 $182 -Kentucky Power - - - - $325Ohio Power $856 $404 $86 $350 -Public Service of Oklahoma - $34 - $150 -Southwestern Electric Power - - $304 - $250Texas Central Company * $143 - $250 $192 $349Texas North Company $225 - - - -Total $1,792 $995 $1,405 $939 $1,724
* Includes $892 million of amortizing Texas Securitization Bonds based upon scheduled final payment date
Includes mandatory tenders (put bonds)
Data as of December 31, 2012
($ in millions)

33
Credit Metrics
Trailing Twelve Months 12/31/2012
FFO Interest Coverage FFO to Debt
GAAP Debt to Capitalization
Senior Unsecured
Credit Ratings*
American Electric Power Company 4.56 19.9% 55.2% Baa2/BBB-/BBB
Appalachian Power Company 4.34 17.0% 55.9% Baa2/BBB/BBB
Indiana Michigan Power Company 4.53 21.4% 53.4% Baa2/BBB/BBB
Kentucky Power Company 3.79 18.1% 54.0% Baa2/BBB/BBB
Ohio Power Company 5.23 24.0% 46.0% Baa1/BBB/A-
Public Service Company of Oklahoma 5.84 28.3% 50.9% Baa1/BBB/BBB+
Southwestern Electric Power Company 5.26 26.7% 50.3% Baa3/BBB/BBB
AEP Texas Central Company 4.77 23.0% 82.1%** Baa2/BBB/A-
AEP Texas North Company 4.82 20.1% 55.6% Baa2/BBB/A-* Moody’s/S&P/Fitch ** Includes securitization debt
34
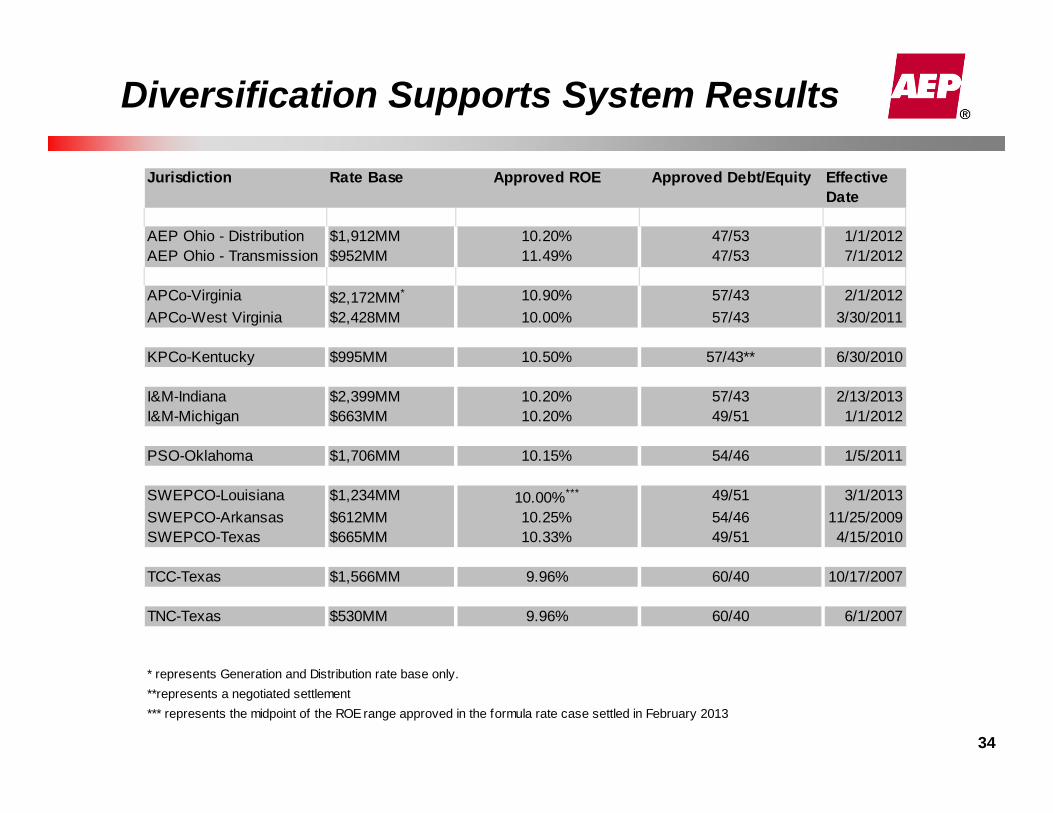
Diversification Supports System Results
Jurisdiction Rate Base Approved ROE Approved Debt/Equity Effective Date
AEP Ohio - Distribution $1,912MM 10.20% 47/53 1/1/2012AEP Ohio - Transmission $952MM 11.49% 47/53 7/1/2012
APCo-Virginia $2,172MM* 10.90% 57/43 2/1/2012APCo-West Virginia $2,428MM 10.00% 57/43 3/30/2011
KPCo-Kentucky $995MM 10.50% 57/43** 6/30/2010
I&M-Indiana $2,399MM 10.20% 57/43 2/13/2013I&M-Michigan $663MM 10.20% 49/51 1/1/2012
PSO-Oklahoma $1,706MM 10.15% 54/46 1/5/2011
SWEPCO-Louisiana $1,234MM 10.00%*** 49/51 3/1/2013SWEPCO-Arkansas $612MM 10.25% 54/46 11/25/2009SWEPCO-Texas $665MM 10.33% 49/51 4/15/2010
TCC-Texas $1,566MM 9.96% 60/40 10/17/2007
TNC-Texas $530MM 9.96% 60/40 6/1/2007
* represents Generation and Distribution rate base only.
*** represents the midpoint of the ROE range approved in the formula rate case settled in February 2013**represents a negotiated settlement