Morgan Sonderegger Jane Stuart-Smith Thea Knowles
32
94 STRUCTURED HETEROGENEITY IN SCOTTISH STOPS OVER THE TWENTIETH CENTURY Morgan Sonderegger Jane Stuart-Smith Thea Knowles McGill University and University of Glasgow University of Buffalo Centre for Research on Brain, Language, and Music Rachel Macdonald Tamara Rathcke University of Glasgow University of Kent How and why speakers differ in the phonetic implementation of phonological contrasts, and the relationship of this ‘structured heterogeneity’ to language change, has been a key focus over fifty years of variationist sociolinguistics. In phonetics, interest has recently grown in uncovering ‘structured variability’—how speakers can differ greatly in phonetic realization in nonrandom ways—as part of the long-standing goal of understanding variability in speech. The English stop voicing contrast, which combines extensive phonetic variability with phonological stability, pro- vides an ideal setting for an approach to understanding structured variation in the sounds of a com- munity’s language that illuminates both synchrony and diachrony. This article examines the voicing contrast in a vernacular dialect (Glasgow Scots) in spontaneous speech, focusing on indi- vidual speaker variability within and across cues, including over time. Speakers differ greatly in the use of each of three phonetic cues to the contrast, while reliably using each one to differentiate voiced and voiceless stops. Interspeaker variability is highly structured: speakers lie along a con- tinuum of use of each cue, as well as correlated use of two cues—voice onset time and closure voicing—along a single axis. Diachronic change occurs along this axis, toward a more aspiration- based and less voicing-based phonetic realization of the contrast, suggesting an important connec- tion between synchronic and diachronic speaker variation.* Keywords: phonetic variation, sound change, structured variability, sociolinguistics, stop voicing, individual differences, Scottish English 1. Introduction. The recognition of observable structured linguistic variation, structured heterogeneity, as an essential fact of language, inherently providing order to linguistic systems at any one time and the impetus for language change over mul- tiple time points, was first advanced by Weinreich et al. (1968) to heal the rift between historical and synchronic linguistics. Weinreich et al. argued for a refocusing on struc- tured variation within and across speakers in their communities, constrained by linguis- tic and social factors, as the locus to seek empirical evidence for language change. While their manifesto was explicitly directed toward enabling explanations for language change, it was also a more general call to integrate synchronic and diachronic approaches to language study by focusing on empirical observation of structured heterogeneity (Weinreich et al. 1968:101). The English stop voicing contrast provides an ideal phenomenon for returning to Weinreich et al.’s vision, in which the description of structured heterogeneity in a com- * We thank three anonymous referees, Megan Crowhurst, and Khalil Iskarous for helpful comments on this article, as well as Joseph Salmons, Meghan Clayards, James Tanner, and audiences at NWAV 2015 and LAN- CHART (University of Copenhagen, September 2015) for feedback on this project. We thank Cordelia Klein and Misha Schwartz for research assistance. Construction and preliminary analysis of the Sounds of the City corpus were funded by the Leverhulme Trust (#RPG-142). Work reported in this article was supported by the Social Sciences and Research Council of Canada (#430-2014-00018, #435-2017-0925) and the Fonds de Recherche du Québec Société et Culture (#183356). Data and analysis scripts for this article are archived in an Open Science Framework project (Sonderegger et al. 2019). Printed with the permission of Morgan Sonderegger, Jane Stuart-Smith, Thea Knowles, Rachel Macdonald, & Tamara Rathcke. © 2020.
Transcript of Morgan Sonderegger Jane Stuart-Smith Thea Knowles

94
STRUCTURED HETEROGENEITY IN SCOTTISH STOPS OVER THETWENTIETH CENTURY
Morgan Sonderegger Jane Stuart-Smith Thea Knowles
McGill University and University of Glasgow University of BuffaloCentre for Research on Brain,
Language, and Music
Rachel Macdonald Tamara Rathcke
University of Glasgow University of KentHow and why speakers differ in the phonetic implementation of phonological contrasts, and the
relationship of this ‘structured heterogeneity’ to language change, has been a key focus over fiftyyears of variationist sociolinguistics. In phonetics, interest has recently grown in uncovering‘structured variability’—how speakers can differ greatly in phonetic realization in nonrandomways—as part of the long-standing goal of understanding variability in speech. The English stopvoicing contrast, which combines extensive phonetic variability with phonological stability, pro-vides an ideal setting for an approach to understanding structured variation in the sounds of a com-munity’s language that illuminates both synchrony and diachrony. This article examines thevoicing contrast in a vernacular dialect (Glasgow Scots) in spontaneous speech, focusing on indi-vidual speaker variability within and across cues, including over time. Speakers differ greatly inthe use of each of three phonetic cues to the contrast, while reliably using each one to differentiatevoiced and voiceless stops. Interspeaker variability is highly structured: speakers lie along a con-tinuum of use of each cue, as well as correlated use of two cues—voice onset time and closurevoicing—along a single axis. Diachronic change occurs along this axis, toward a more aspiration-based and less voicing-based phonetic realization of the contrast, suggesting an important connec-tion between synchronic and diachronic speaker variation.* Keywords: phonetic variation, sound change, structured variability, sociolinguistics, stop voicing,individual differences, Scottish English
1. Introduction. The recognition of observable structured linguistic variation,structured heterogeneity, as an essential fact of language, inherently providingorder to linguistic systems at any one time and the impetus for language change over mul-tiple time points, was first advanced by Weinreich et al. (1968) to heal the rift betweenhistorical and synchronic linguistics. Weinreich et al. argued for a refocusing on struc-tured variation within and across speakers in their communities, constrained by linguis-tic and social factors, as the locus to seek empirical evidence for language change. Whiletheir manifesto was explicitly directed toward enabling explanations for languagechange, it was also a more general call to integrate synchronic and diachronic approachesto language study by focusing on empirical observation of structured heterogeneity(Weinreich et al. 1968:101).
The English stop voicing contrast provides an ideal phenomenon for returning toWeinreich et al.’s vision, in which the description of structured heterogeneity in a com-
* We thank three anonymous referees, Megan Crowhurst, and Khalil Iskarous for helpful comments on thisarticle, as well as Joseph Salmons, Meghan Clayards, James Tanner, and audiences at NWAV 2015 and LAN-CHART (University of Copenhagen, September 2015) for feedback on this project. We thank Cordelia Kleinand Misha Schwartz for research assistance. Construction and preliminary analysis of the Sounds of the Citycorpus were funded by the Leverhulme Trust (#RPG-142). Work reported in this article was supported by theSocial Sciences and Research Council of Canada (#430-2014-00018, #435-2017-0925) and the Fonds deRecherche du Québec Société et Culture (#183356). Data and analysis scripts for this article are archived inan Open Science Framework project (Sonderegger et al. 2019).
Printed with the permission of Morgan Sonderegger, Jane Stuart-Smith, Thea Knowles, Rachel Macdonald,& Tamara Rathcke. © 2020.
Structured heterogeneity in Scottish stops over the twentieth century 95
munity’s language gives insights for synchrony and diachrony together (Purnell et al.2005). The West Germanic stop voicing contrast has been largely stable at a phonolog-ical level for a long time, yet its phonetic realization is variable both within and acrosstime periods and languages/varieties (e.g. Honeybone 2005, Purnell et al. 2005,Salmons 2020). Research on production of the English stop voicing contrast, largelythrough controlled phonetic studies of read speech, has found that many acoustic cuessignal the contrast (Klatt 1975, Lisker 1986), especially voice onset time (VOT), butalso voicing during closure, closure duration, and others (e.g. Abramson & Whalen2017, Byrd 1993, Davidson 2016, 2017, Lisker & Abramson 1964). And, as Purnell etal. (2005) observe in their study of changes to the Wisconsin English word-final stopcontrast, the ‘trading relations’ (Repp 1982) inherent between these cues to laryngealtiming provide an effective vehicle that is exploited for change to take place.
Recent phonetic studies have begun to focus on a specific aspect of stop variation.‘Structured variability’ (Chodroff et al. 2015) refers to the observation that individualspeakers may differ from each other in the nature and range of their phonetic variation,in ways that are not random. Speakers can differ significantly from each other in the useof one or more phonetic cues in ways that are in part explicable (e.g. by speaking style:Clayards 2018); they can show covariation in the use of a single cue to signal linguisticcontrasts across different phonological categories (Chodroff & Wilson 2017, Theodoreet al. 2009) or covariation in the use of multiple cues to signal the same linguistic con-trast (Bang 2017, Clayards 2018, Shultz et al. 2012). Relatively little of the possiblestructured variability in the English stop voicing contrast has been mapped out: how andwhy individual speakers vary in their realizations of one or more cues for single stop cat-egories, or the stop voicing contrast itself, is still far from clear. Phonetic studies in thisarea have also largely not considered spontaneous speech, where individual variability ina phonetic cue’s realization must be disentangled from the many linguistic and prosodicfactors (e.g. place of articulation, speech rate) that affect cues in natural speech.
This article offers an integrated account of an English stop voicing contrast whichshows that speakers exhibit structured variability in multiple cues, and that a subspaceof this variability acts as the multidimensional axis along which diachronic change isprogressing, thus exploiting in the change the ‘trading relations’ between the cues tovoicing. We examine English stop voicing in a specific sociolinguistic context—spon-taneous Glasgow Scots vernacular over the course of the twentieth century—which isinteresting and informative for three reasons:
ii(i) Phonetic realization: Scots shows a more recessive version of the En-glish stop voicing contrast, with relatively more voicing in voiced stops andshorter-lag voiceless stops (e.g. Scobbie 2006). Few studies have consideredindividual speaker variability in the Scottish English stops, and none haveconsidered more than one cue.
i(ii) Speech style: Naturally occurring spontaneous speech data is available. Al-most all previous studies of the English stop voicing contrast have been ondifferent forms of read speech, and have also given hints that phonetic cuesto voicing are enhanced in controlled speech. Our study is the first to sys-tematically examine structured variability for English stop voicing in casualspeech.
(iii) Time: Previous work suggests a shift in Scots from a more voicing-basedstop contrast to a more aspiration-based contrast over the course of the twen-tieth century. Our data are drawn from a real-time corpus of Glasgow ver-nacular with an effective real- and apparent-time span of around 100 years.
Most studies of English stop voicing have considered recordings from speak-ers of the same age made at the same time point, and no previous studieshave examined multiple cues to the voicing contrast by sampling sponta-neous speech over real time.
We analyze three temporal phonetic cues to the Glaswegian stop voicing contrast—(positive) VOT, the degree of voicing during closure, and closure duration—with par-ticular focus on the ways in which individual speakers vary within and across cues,including over time.
(1) Research question 1: Do individual speakers differ in their use of singlephonetic cues to realize Scottish stop voicing?
(2) Research question 2: How do individual speakers coordinate multiplephonetic cues to realize this contrast?
(3) Research question 3: Is the use of individual speakers’ cues also structuredby decade of recording, suggesting change in phonetic realization in Scottishstops over time?
We take structured variability in the realization of the stop voicing contrast as a spe-cific instantiation of structured heterogeneity. We define phonetic variation as struc-tured if we observe individual differences in how speakers use one or more cues torealize the voicing contrast that are demonstrably nonrandom: speaker differences inhow a single cue is used to signal both voiced and voiceless categories or the contrastbetween them (research question 1 (RQ1)), covariation across speakers in how they usemultiple cues (RQ2), or individual differences that are explained by the social factor oftime for this community (RQ3).
The article is organized as follows. After considering relevant literature (§2), we de-scribe our speaker sample and semi-automated methods for measuring the three acousticcues (§3) to stop voicing. We then identify individual speaker variation for each cue andacross multiple cues, treating the data set as a quasi-synchronic sample. Section 4 showsthat all speakers use each cue to realize the voicing contrast, above and beyond key lin-guistic and prosodic factors, but with significant interspeaker variation (RQ1). Section 5finds that these speaker differences are related: the two cues used most to realize the voic-ing contrast, (positive) VOT and voicing during closure (RQ2), are correlated across in-dividual speakers. Section 6 uncovers a small but real shift in the trading relation betweenthe cues, toward a more aspiration-based realization for the stop voicing contrast(RQ3)—exactly the multidimensional axis along which interspeaker variability was ob-served synchronically.
2. Background.2.1. Cues to english stop voicing. The English stop system continues that of West
Germanic (Salmons 2020). Phonologically there are two series, referred to here as‘voiceless’ and ‘voiced’ (phonemic /p t k/, /b d g/), differing in one phonological feature.There is debate about whether that feature is [voice] or [spread] glottis (see Honeybone2005). The ‘laryngeal realism’ view (e.g. Iverson & Salmons 1999, Salmons 2020), infavor of [spread], is motivated both by phonological processes and by phonetic realiza-tion of the two stop series in many English dialects as voiceless aspirated [ph th kh] andvoiceless unaspirated stops [p t k], especially in stressed syllable-initial position.
Within these phonological categories, the phonetic realization of voiced and voice-less stops varies by dialect and time (§2.5). While VOT is the most widely studied,there are many other spectral and temporal cues to the voicing contrast (Lisker 1986).We review the findings for the three temporal cues analyzed here: VOT, voicing during
96 LANGUAGE, VOLUME 96, NUMBER 1 (2020)

Structured heterogeneity in Scottish stops over the twentieth century 97
closure, and closure duration. All studies referred to examine British English (Docherty1992, Sonderegger et al. 2017, Stuart-Smith et al. 2015, Summerfield 1975) or Ameri-can English (all others).Voice onset time, the time between the stop release and the initiation of glottal
pulsing, has been shown to be the most important cue to the English stop voicing con-trast, especially in word-initial position, from many studies on read standard varieties ofEnglish (beginning with Liberman et al. 1958, Lisker & Abramson 1964) and a fewstudies of spontaneous English (Baran et al. 1977, Sonderegger et al. 2017, Stuart-Smith et al. 2015, Yao 2009). Voiceless stops show positive VOT values (long lag),whereas voiced stops show either shorter positive VOT values (short lag) and/or nega-tive VOT (voicing lead), reflecting the presence of voicing during closure and beforestop release. VOT is also affected by linguistic and prosodic constraints, includingplace of articulation (Docherty 1992, Lisker & Abramson 1964), speech rate (differ-ently for voiced/voiceless stops: e.g. Kessinger & Blumstein 1997, Summerfield 1975),phrasal accent (Cole et al. 2007), and position in the phrase (Yao 2009).
English stop voicing during closure, the duration of glottal pulsing between stop-closure onset and the burst, has to our knowledge been studied exclusively in readspeech. Davidson (2016, 2017) provides the most recent detailed phonetic examination,for American English stops. For voiced stops, full voicing during closure is more likelyin labial than velar stops (Docherty 1992), in phrase-medial/final position (Docherty1992, Lisker & Abramson 1964, 1967), in word-medial position (cf. Keating 1984),when closure duration is shorter (cf. Westbury & Keating 1986), and when the precedingsound is (phonologically) voiced (cf. Docherty 1992, Lisker & Abramson 1964). Voic-ing in voiceless stops follows similar constraints, occurring more in phrase-medial/finalposition, in word-medial position, and following a vowel or approximant (Docherty1992). ‘Negative VOT’ is often observed for voiced stops in phrase-initial position (e.g.Keating 1984, Lisker & Abramson 1964, 1967), but there is no established way to extendthis concept to phrase-medial stops, where it overlaps with ‘voicing during closure’. Acommon operationalization is that VOT is ‘negative’ if voicing begins after the onset ofclosure and continues past the release; a more recent proposal is that VOT be defined asnegative when the closure is less than 50% voiced (Abramson & Whalen 2017). Usingthe first definition, Davidson (2016) found negative VOT in only 1% of voiced stops.
English stop closure duration has also been examined largely in read speech (ex-cept Yao 2007, on spontaneous speech). Several studies have found shorter closure du-ration for voiced stops (e.g. Chen 1970, Luce & Charles-Luce 1985), though not all(Crystal & House 1988); Byrd (1993) finds the voiced/voiceless difference is modu-lated by place of articulation (1–6 ms for different places). Zue (1976) and Yao (2007)consider voiceless stops alone; Yao finds effects of place of articulation, precedingphone, and speech rate.
2.2. Individual speaker variation for single cues to english stop voicing.Early work on English VOT already noted that individual speakers vary systematicallyin how VOT is used to signal the voicing contrast (Lisker & Abramson 1964:395).1 Allenet al. (2003) established individual speaker differences in VOT in read monosyllables,which remained after controlling for an individual’s speech rate. Theodore et al. (2009)
1 We do not consider here individual speaker variation in phonetic realization, including change over time,for stop contrasts in languages other than English.

replicated this finding and showed that individual speakers’ VOT values for /p/ and /k/were tightly correlated, such that each speaker distinguished place of articulation.
Chodroff and Wilson (2017) extended this finding of structured variability to lesscontrolled speech in their analysis of positive VOT in voiced and voiceless stops, from180 speakers of different ages and American English dialects, in two speech styles (readmonosyllables, read sentences). Speakers’ VOT values for nearly all pairs of stops withthe same voicing (e.g. /p/ ~ /t/, /g/ ~ /b/) were positively correlated in both speechstyles, with the result that each speaker reliably distinguished place of articulation. Sim-ilarly, individual speakers tended to distinguish voiced and voiceless stops (e.g. positive/p/ ~ /b/ correlation) more clearly in read sentences than in isolated words. The samespeakers showed structured variability for two additional cues: following vowel funda-mental frequency at onset (here ‘onset f0’) and burst spectral center (Chodroff & Wil-son 2018). While Chodroff and Wilson (2017:44–45) report a preliminary extension tospontaneous speech, whether similar structured speaker variation holds in spontaneousspeech—or for voicing and closure duration—is unknown.
2.3. Individual speaker variation across multiple cues to english stop voic-ing. Perceptual studies on multiple cues to English stop voicing have mainly examinedVOT and onset f0 in word-initial stops. VOT always emerges as the primary cue,though its relationship with onset f0 varies according to the voicing of the stop and thevariety of English (e.g. Francis et al. 2008, Schertz et al. 2015). Less is known aboutproduction of multiple cues to English stop voicing by individual speakers.
The few recent studies suggest that, as for single cues, individual speakers can sys-tematically differ from each other in how they use multiple cues to contrast Englishstops. Both Shultz et al. (2012; read monosyllables) and Bang (2017; read sentences)found significant correlations for VOT and onset f0, showing that the more a speakerused VOT to cue the voicing contrast, the less they used f0, suggesting a trade-off at thelevel of individual speakers. Schertz et al. (2015) considered the relative contribution ofVOT, onset f0, and closure duration in read minimal pairs for L2 Korean English speak-ers. Individual speakers did not all show the same pattern of cue use to mark the con-trast, perhaps because it is a nonnative variety. Clayards (2018) also analyzed three cuesto stop voicing—VOT, onset f0, and relative vowel duration following the stop—inAmerican English speakers reading minimal pairs. She found systematic talker differ-ences in use of the three cues for each stop, consistent with a strong effect of speechstyle—hyperarticulation from reading minimal pairs—which seemed to induce proto-typical stop productions for some speakers.
These studies show both that speakers vary in the coordination of multiple cues tosignal stop contrasts and that structures are present within this variation. The focus todate has been on structure relating to the maintenance of linguistic contrasts in highlycontrolled speech styles. Reasons why speakers might differ from each other, while re-taining linguistic contrasts, are not explored, though speaker dialect is sometimes men-tioned and speech style seems likely for Clayards (2018). Chodroff and Wilson (2018)point to diachronic variation as a possible factor, though there has been little considera-tion of sound change in multiple cues to English stop voicing. To our knowledge thereis only Purnell et al.’s (2005) qualitative analysis of voicing in Wisconsin English stopsand fricatives, which shows shifts in individual speakers’ relative use of voicing duringclosure and preceding-vowel duration, exploiting the inherent trading relation betweenthese cues, across a real- and apparent-time span of over 100 years.
2.4. Speech style and stop voicing. It has been long noted that speech style affectsEnglish stop voicing, even in read speech. Lisker and Abramson (1967) examined
98 LANGUAGE, VOLUME 96, NUMBER 1 (2020)
Structured heterogeneity in Scottish stops over the twentieth century 99
speech style as one contextual factor affecting VOT. In isolated words, stops had longerVOTs, but there was even better separation of voiced and voiceless stops in minimalpairs (‘enhancement’), compared to read sentences. Similarly, Baran et al. (1977) foundthe voiced/voiceless VOT difference to be reduced in conversational versus citation-form speech for three speakers, while Chodroff and Wilson (2017) found shorter VOTmeans in read sentences than in monosyllables. Chodroff and Wilson were also struckby the persistence of strong interspeaker covariation patterns in connected speechwhere many more factors influence VOT. Our study of cue covariation in spontaneousspeech permits examination of whether speakers maintain contrasts in a much less con-trolled speech style.
2.5. Changing stops in scottish english. Scottish English is a sociolinguisticcontinuum, from broad Scots, which continues forms of Northern Anglian and is spo-ken by working-class speakers, to Scottish Standard English, which continues earlyseventeenth-century Southern English and is spoken by middle-class speakers (e.g.Aitken 1979). Scottish Standard English voiceless stops have been reported to be pho-netically less aspirated than those in Southern British Standard English since at least theturn of the twentieth century (Grant 1913:80, Wells 1982). Masuya’s (1997) small-scalestudy shows shorter VOT in Standard Scottish English than in Anglo-English. Pre-Sec-ond World War descriptions of Scots also report unaspirated syllable-initial voicelessstops (Johnston 1997:505). Scobbie’s (2006) study of speakers in Shetland demon-strates the social-dialectal range, with less/more aspirated /p/ and more/less voiced /b/,depending on Shetlandic/mainland-Scottish heritage.
Phonologically, there is debate about whether the ‘more voiced’ nature of stop real-ization in traditional Scots reflects a difference in phonological representation frommost dialects of English. Iverson and Salmons (1999) and Salmons (2020) argue, basedon both phonetic realization and phonological processes, that under ‘laryngeal realism’the voicing contrast in traditional Scots is in [voice], in contrast to [spread] in other En-glish dialects. The traditional view would be that Scots and all other English varietieshave a [voice] contrast, with dialect-specific phonetic implementation.
Two changes are claimed to be taking place at either end of the Scottish English con-tinuum. First, Scottish Standard English stops may be becoming more aspirated, as inAnglo-English varieties (Masuya 1997). Docherty et al.’s (2011) study of VOT fromread word-lists in 159 speakers from the Scottish-English border found longer VOT andless-frequent use of negative VOT in younger speakers, with further patterning accord-ing to affiliation with Scottish identity. Second, stops in Scots may also be becomingmore aspirated, due to leveling toward Scottish Standard English (Johnston 1980:78 inScobbie 2006:374). Stuart-Smith et al. (2015) found significantly longer positive VOTin a real- and apparent-time study of stops in spontaneous Glaswegian Scots, with atwist: the youngest speakers, born in the 1990s, showed a reversal, with short VOTsmatching those of much older/earlier-born speakers.
Thus it appears that the Scots stop voicing contrast is shifting from a recessive, morevoicing-based system to a more aspiration-based system. But previous studies of Scot-tish English have been limited to a single cue (VOT), were largely restricted to readspeech, and have mostly focused on the group rather than individual speakers. We donot know what degree of structured variability may exist for individual speakers acrossstop voicing cues in spontaneous speech. We address these issues here with an exami-nation of the Scots end of the Glaswegian Scottish English continuum.
3. Methodology.We analyzed three temporal acoustic cues to the Glaswegian stopvoicing contrast in stressed syllable-initial stops: positive VOT (VOT), degree of voic-
ing during closure (VDC), and closure duration (CD). We first describe the speech cor-pus used, then turn to the data sets of the three acoustic cues, each of which was built‘semi-automatically’, through automatic measurement followed by manual correction.
3.1. Sample. We examined speech from the Sounds of the City corpus of Glasgowvernacular (e.g. Stuart-Smith et al. 2017, Stuart-Smith & Lawson 2017). This corpusconsists of audio recordings and orthographic transcripts, stored and force-aligned atthe segment level using LaBB-CAT (Fromont & Hay 2012), from over 140 working-class speakers. The corpus is structured by decade of recording (1970s, 1980s, 1990s,and 2000s) and by speaker age (old: aged sixty-seven to ninety; middle-aged: agedforty to fifty-five; young: aged ten to seventeen),2 which allows investigation of soundchange across the twentieth century in real and apparent time.
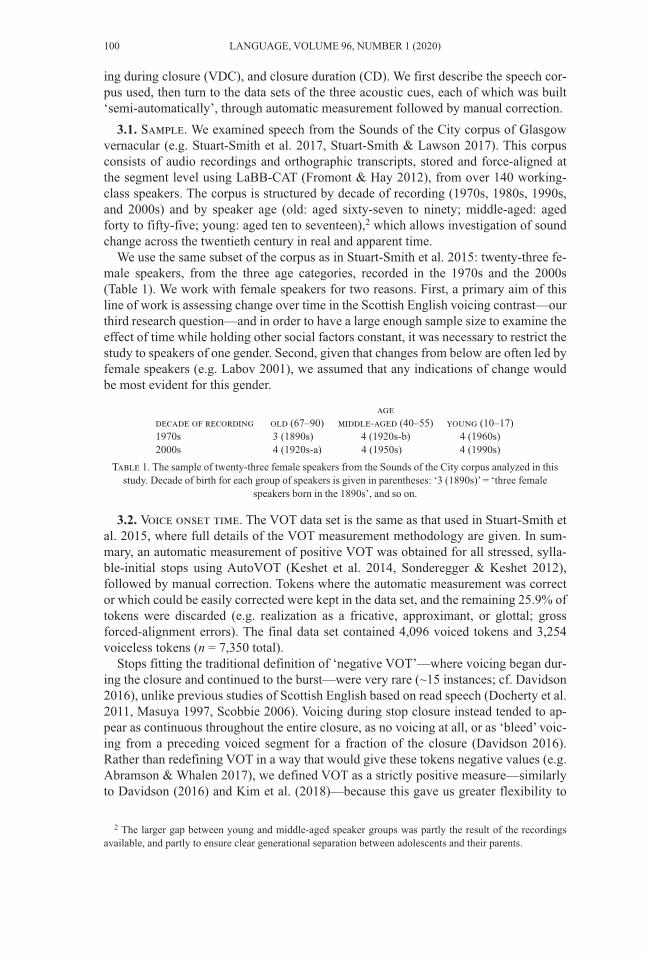
We use the same subset of the corpus as in Stuart-Smith et al. 2015: twenty-three fe-male speakers, from the three age categories, recorded in the 1970s and the 2000s(Table 1). We work with female speakers for two reasons. First, a primary aim of thisline of work is assessing change over time in the Scottish English voicing contrast—ourthird research question—and in order to have a large enough sample size to examine theeffect of time while holding other social factors constant, it was necessary to restrict thestudy to speakers of one gender. Second, given that changes from below are often led byfemale speakers (e.g. Labov 2001), we assumed that any indications of change wouldbe most evident for this gender.
2 The larger gap between young and middle-aged speaker groups was partly the result of the recordingsavailable, and partly to ensure clear generational separation between adolescents and their parents.
100 LANGUAGE, VOLUME 96, NUMBER 1 (2020)
agedecade of recording old (67–90) middle-aged (40–55) young (10–17)1970s 3 (1890s)-a 4 (1920s-b) 4 (1960s)2000s 4 (1920s-a) 4 (1950s)-a 4 (1990s)
Table 1. The sample of twenty-three female speakers from the Sounds of the City corpus analyzed in thisstudy. Decade of birth for each group of speakers is given in parentheses: ‘3 (1890s)’ = ‘three female
speakers born in the 1890s’, and so on.
3.2. Voice onset time. The VOT data set is the same as that used in Stuart-Smith etal. 2015, where full details of the VOT measurement methodology are given. In sum-mary, an automatic measurement of positive VOT was obtained for all stressed, sylla-ble-initial stops using AutoVOT (Keshet et al. 2014, Sonderegger & Keshet 2012),followed by manual correction. Tokens where the automatic measurement was corrector which could be easily corrected were kept in the data set, and the remaining 25.9% oftokens were discarded (e.g. realization as a fricative, approximant, or glottal; grossforced-alignment errors). The final data set contained 4,096 voiced tokens and 3,254voiceless tokens (n = 7,350 total).
Stops fitting the traditional definition of ‘negative VOT’—where voicing began dur-ing the closure and continued to the burst—were very rare (~15 instances; cf. Davidson2016), unlike previous studies of Scottish English based on read speech (Docherty et al.2011, Masuya 1997, Scobbie 2006). Voicing during stop closure instead tended to ap-pear as continuous throughout the entire closure, as no voicing at all, or as ‘bleed’ voic-ing from a preceding voiced segment for a fraction of the closure (Davidson 2016).Rather than redefining VOT in a way that would give these tokens negative values (e.g.Abramson & Whalen 2017), we defined VOT as a strictly positive measure—similarlyto Davidson (2016) and Kim et al. (2018)—because this gave us greater flexibility to
Structured heterogeneity in Scottish stops over the twentieth century 101
describe laryngeal timing for the Scottish stop contrast. We could measure (positive)VOT for all stops and have this be an independent dimension to ‘voicing’, which we ex-amined through the degree of VDC (see Cho et al. 2019).
3.3. Voicing during closure and closure duration. VDC and CD were also de-tected using a semi-automatic process, with automatic measurement followed by man-ual correction. Unlike AutoVOT for VOT measurement, no specialized algorithm existsfor VDC/CD measurement. Thus, semi-automatic measurement for VDC and CD wasmore time consuming than that for VOT, and annotating the entire set of stops anno-tated for VOT was not feasible. We therefore limited the sample for VDC and CD to asubset of stressed syllable-initial stops: those that had a valid VOT measurement, werephrase-medial following a vowel or a fricative, and had automatically measured CD ofat least 30 ms. These two preceding environments were selected to give a range of pho-netic-context effects on stop voicing (vowel/voiceless fricative → more/less VDC; e.g.Davidson 2016, 2017, Iverson & Salmons 1995). Stop closures less than 30 ms wereproblematic for automatic voicing measurement.VDC/CD step 1: automatic measurement. Stop closure durations were automati-
cally measured as the interval between closure onset—the force-aligned left boundary ofthe stop associated with the labeled VOT—and closure offset—the onset of the VOT in-terval. The amount of voicing during the closure was automatically measured using acustom Praat script (Boersma & Weenink 2001). For each stop token, the script extractedthe full stop segment plus a margin of 500 ms on either side, which was found to givevoicing detection closer to human annotators’ judgments. Voicing was extracted in thisregion by detecting a pitch track (cross-correlation method), inferring a point process ofglottal pulses using this pitch track and the audio, then defining VDC as the interval be-tween the last pulse and closure onset. This procedure resulted in three qualitative typesof VDC pattern: no closure voicing, full closure voicing, and perseverative voicing.Other patterns were extremely rare (e.g. ‘negative VOT’, noted above) and were not al-lowed as automatic predictions. Because ‘no’ and ‘full-closure’ voicing were so commonrelative to perseverative voicing, we realized early on that the analysis would use only athree-way division of VDC (None/Some/All), and manual correction corrected VDC ina way that maximized the number of tokens for analysis using this division.VDC/CD step 2: manual correction. Manual inspection, correction, and coding of
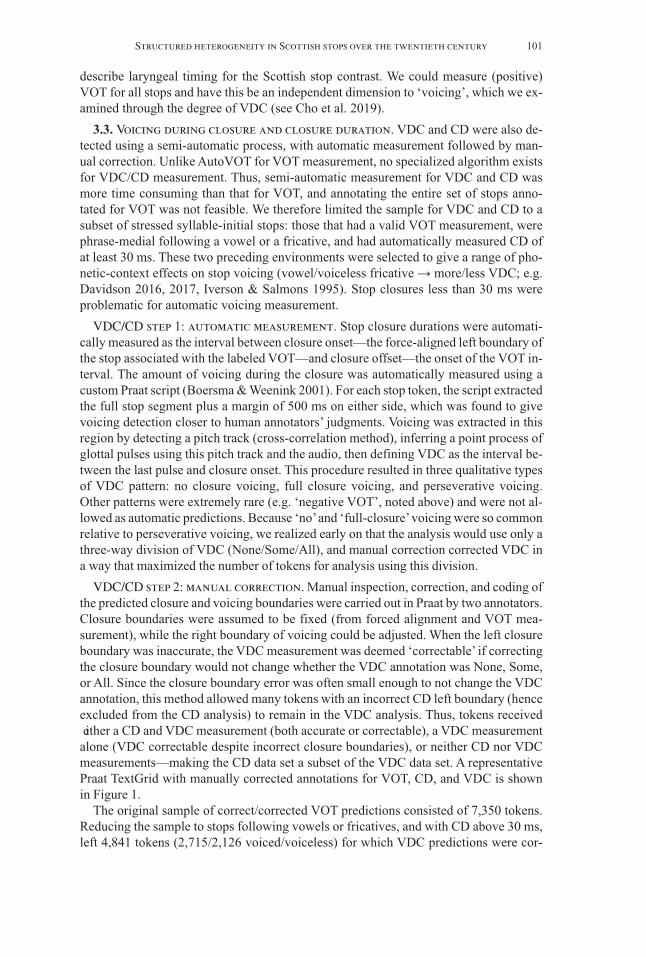
the predicted closure and voicing boundaries were carried out in Praat by two annotators.Closure boundaries were assumed to be fixed (from forced alignment and VOT mea -surement), while the right boundary of voicing could be adjusted. When the left closureboundary was inaccurate, the VDC measurement was deemed ‘correctable’ if correctingthe closure boundary would not change whether the VDC annotation was None, Some,or All. Since the closure boundary error was often small enough to not change the VDCannotation, this method allowed many tokens with an incorrect CD left boundary (henceexcluded from the CD analysis) to remain in the VDC analysis. Thus, tokens received either a CD and VDC measurement (both accurate or correctable), a VDC measurementalone (VDC correctable despite incorrect closure boundaries), or neither CD nor VDCmeasurements—making the CD data set a subset of the VDC data set. A representativePraat TextGrid with manually corrected annotations for VOT, CD, and VDC is shown in Figure 1.
The original sample of correct/corrected VOT predictions consisted of 7,350 tokens.Reducing the sample to stops following vowels or fricatives, and with CD above 30 ms,left 4,841 tokens (2,715/2,126 voiced/voiceless) for which VDC predictions were cor-
rected. Of these, 1,593 (844/749) did not have valid or correctable voicing intervals; theremaining 1,871 voiced and 1,377 voiceless tokens made up the data set used to modelVDC (n = 3,248). Of the original 4,841 tokens, 3,098 (1,701/1,397 voiced/voiceless)had invalid closure boundary or boundaries; the remaining 1,014 voiced and 729 voice-less tokens made up the data set used to model CD (n = 1,743).
4. Analysis 1: individual speaker variation within phonetic cues.4.1. Preliminaries. For each acoustic cue (VOT, VDC, CD), the goal of analysis 1
was to determine each speaker’s characteristic values after controlling for other majorfactors affecting the cue. The outcome is two values per speaker: the intercept (e.g. av-erage VOT for voiced and voiceless stops) and slope (e.g. the difference between VOTfor voiceless and voiced stops), corresponding to each speaker’s ‘overall’ cue value andthe size of the voicing contrast in the cue. These two values can also be used to deter-mine a speaker’s cue values for voiceless and voiced stops separately.
For VOT and CD, the statistical models below use the log-transformed value of thecue (log-transformed to bring model residuals closer to normality). We analyze VDCcoded as a ternary variable, with levels None, Some, and All (0%, 1–99%, 100% of clo-sure voiced), because most tokens (80.5%) had close to none or all of the closurevoiced. This choice follows Davidson’s (2016, 2017) analyses of VDC in American En-glish stops.4
4.2. Statistical models. We model each cue using mixed-effects models, using thelme4 package (Bates et al. 2015) in R, including fixed-effects terms to model the effectof stop voicing (voiced vs. voiceless) and to control for other factors affecting the cue,and modeling speaker variability using random-effect terms.
3 This figure is presented in color in the electronic versions of this article.4 With the proviso that Davidson (2016) uses 10–90% as the ‘some voicing’ category, rather than 1–99% as
used here.
102 LANGUAGE, VOLUME 96, NUMBER 1 (2020)
Figure 1. Part of Praat TextGrid showing VOT, CD, and VDC measurements for /d/ in ‘didnae’.3
Structured heterogeneity in Scottish stops over the twentieth century 103
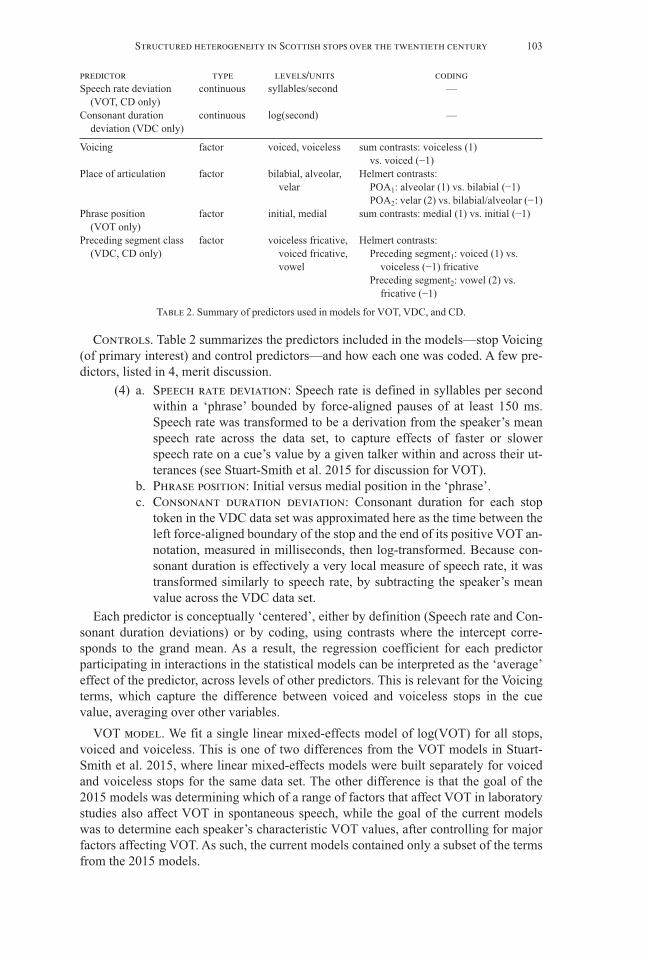
Controls. Table 2 summarizes the predictors included in the models—stop Voicing(of primary interest) and control predictors—and how each one was coded. A few pre-dictors, listed in 4, merit discussion.
(4) a. Speech rate deviation: Speech rate is defined in syllables per secondwithin a ‘phrase’ bounded by force-aligned pauses of at least 150 ms.Speech rate was transformed to be a derivation from the speaker’s meanspeech rate across the data set, to capture effects of faster or slowerspeech rate on a cue’s value by a given talker within and across their ut-terances (see Stuart-Smith et al. 2015 for discussion for VOT).
b. Phrase position: Initial versus medial position in the ‘phrase’.c. Consonant duration deviation: Consonant duration for each stop
token in the VDC data set was approximated here as the time between theleft force-aligned boundary of the stop and the end of its positive VOT an-notation, measured in milliseconds, then log-transformed. Because con-sonant duration is effectively a very local measure of speech rate, it wastransformed similarly to speech rate, by subtracting the speaker’s meanvalue across the VDC data set.
Each predictor is conceptually ‘centered’, either by definition (Speech rate and Con-sonant duration deviations) or by coding, using contrasts where the intercept corre-sponds to the grand mean. As a result, the regression coefficient for each predictorparticipating in interactions in the statistical models can be interpreted as the ‘average’effect of the predictor, across levels of other predictors. This is relevant for the Voicingterms, which capture the difference between voiced and voiceless stops in the cuevalue, averaging over other variables.
VOT model. We fit a single linear mixed-effects model of log(VOT) for all stops,voiced and voiceless. This is one of two differences from the VOT models in Stuart-Smith et al. 2015, where linear mixed-effects models were built separately for voicedand voiceless stops for the same data set. The other difference is that the goal of the2015 models was determining which of a range of factors that affect VOT in laboratorystudies also affect VOT in spontaneous speech, while the goal of the current modelswas to determine each speaker’s characteristic VOT values, after controlling for majorfactors affecting VOT. As such, the current models contained only a subset of the termsfrom the 2015 models.
predictor type levels/units codingSpeech rate deviation continuous syllables/second —
(VOT, CD only)Consonant duration continuous log(second) —
deviation (VDC only)
Voicing factor voiced, voiceless sum contrasts: voiceless (1) vs. voiced (−1)
Place of articulation factor bilabial, alveolar, Helmert contrasts:velar POA1: alveolar (1) vs. bilabial (−1)
POA2: velar (2) vs. bilabial/alveolar (−1) Phrase position factor initial, medial sum contrasts: medial (1) vs. initial (−1)
(VOT only) Preceding segment class factor voiceless fricative, Helmert contrasts:
(VDC, CD only) voiced fricative, Preceding segment1: voiced (1) vs. vowel voiceless (−1) fricative
Preceding segment2: vowel (2) vs. fricative (−1)
Table 2. Summary of predictors used in models for VOT, VDC, and CD.
Fixed effects were included for Voicing of the stop, as well as every term that signif-icantly affected VOT for either voiced or voiceless stops in Stuart-Smith et al. 2015, inorder to control for major factors affecting VOT (see §2.1): Speech rate deviation,Phrase position, and Place of articulation (POA), as well as interactions of Voicing withthese three variables and a three-way Voicing : Speech rate : POA interaction. Theseterms account for the fact that: VOT reduces with increasing speech rate and is lowerphrase-medially than phrase-initially (each effect possibly differing by voicing), andVOT is strongly conditioned by place of articulation, with the effect modulated byspeech rate and stop voicing.
For random effects, the VOT model included a by-speaker random intercept and by-speaker random slope for Voicing, as well as the correlation between them. These termsare of key interest for our goal of capturing interspeaker variation in overall VOT andthe size of the voicing contrast. The model also included a by-word random intercept inorder to account for differences between words (beyond variables included in themodel) and all possible by-speaker and by-word random slopes (Barr et al. 2013).
To avoid overparametrized models, for all statistical models (VOT, VDC1, VDC2,CD; see below) correlations between random-effect terms were omitted and zero ran-dom-effect terms were iteratively excluded until the fit was nonsingular. The resultingrandom-effect structures are shown in the online supplemental materials.5
VDC models. Conceptually, the levels of the ternary VDC variable follow an order:None < Some < All. We therefore use a mixed-effects ordinal regression, which modelsa multinomial outcome whose levels are ordered. We use a variant of this method thatmodels two ‘continuation ratios’ (Agresti 2002:§7.4, §12.5): the probability of one levelversus the higher levels. In our case, these are two binary mixed-effects logistic regres-sions, one that models None versus Some/All (the probability of any closure voicing)and one that models Some versus All (the probability of full closure voicing, given that> 0% of the closure is voiced). We call these the None/Any and Some/All models, orthe VDC1 and VDC2 models. For example, the voicing coefficient for the None/Any re-gression captures the following: How much higher are the log-odds of there being anyVDC, versus no VDC, for voiced stops compared to voiceless stops? Together, thesetwo models describe the likelihood of each VDC profile (None/Some/All) as a functionof consonant voicing, control predictors, and speaker/word variability.
A continuation-ratio ordinal regression is one of a family of similar methods formodeling multinomial outcomes (Agresti 2002:Chs. 7, 12, Gelman & Hill 2007:Ch. 6),including the more common ‘multinomial logistic regression’ used by Davidson (2016),where the probabilities of each outcome versus a fixed baseline (one level, or all levelstogether) are modeled. We used a continuation-ratio model because it was easier to fitand allowed us more flexibility in model specification, but our results should not differfrom a multinomial logistic regression.6
The control predictors included in the models were POA, Preceding segment class,and Consonant duration deviation—all of which were expected to affect the degree ofclosure voicing (see §2.1) and significantly contributed to the likelihood of at least one
5 The supplemental materials referenced here and elsewhere are available in the OSF project for this article(Sonderegger et al. 2019).
6 Fitting a multinomial model requires jointly fitting several component regression models for binary data.Jointly fitting models is computationally difficult and not possible using standard mixed-modeling packagesin R (e.g. lme4). In a continuation-ratio model, the outcomes of the binary regressions are orthogonal, whichmeans that fitting the binary regressions separately (which is easy in lme4) should give equivalent results tofitting them jointly (Agresti 2002:§7.4, §12.5).
104 LANGUAGE, VOLUME 96, NUMBER 1 (2020)
Structured heterogeneity in Scottish stops over the twentieth century 105
VDC model. Other variables we considered that could plausibly affect VDC, such asphrase-level speech rate and position of the stop in the word, did not significantly im-prove model likelihood.
Fixed effects were included for these three predictors in both VDC models. Becausethere was no a priori reason to expect different effects for voiced and voiceless stops,interactions of control predictors with Voicing were included only if they significantlyimproved model likelihood. The None/Any model included Voicing : Preceding seg-ment class and Voicing : POA terms, and the Some/All model included a Voicing : Con-sonant duration deviation interaction.
For random effects, both VDC models included a by-speaker random intercept andby-speaker random slope for voicing, as well as the correlation between them, and a by-word random intercept, all motivated identically to the VOT model. Each model in-cluded by-speaker random slopes only for fixed effects that were significant ( p < 0.05);these terms were then pruned to give a nonsingular fit, as for the VOT model.
CD model. We modeled CD using a linear mixed-effects model of log(CD) for bothvoiced and voiceless stops. Fixed effects were included for Voicing and for control pre-dictors expected to affect CD, based on previous work (see §2.1): POA, Preceding segment class, and Speech rate deviation. Fixed effects were also included for the inter-action of POA with Voicing (Byrd 1993) and for the interaction of Preceding segmentclass with Voicing, as this significantly improved model likelihood. We did not includeany other interactions because there was no a priori reason to expect them and they didnot significantly improve model likelihood.
For random effects, the model included a by-speaker random intercept and by-speaker random slope for Voicing, as well as the correlation between them, and a by-word random intercept, motivated similarly as for VOT and VDC. Each model alsoincluded all possible by-speaker and by-word random slopes, pruned to avoid a singu-lar fit.
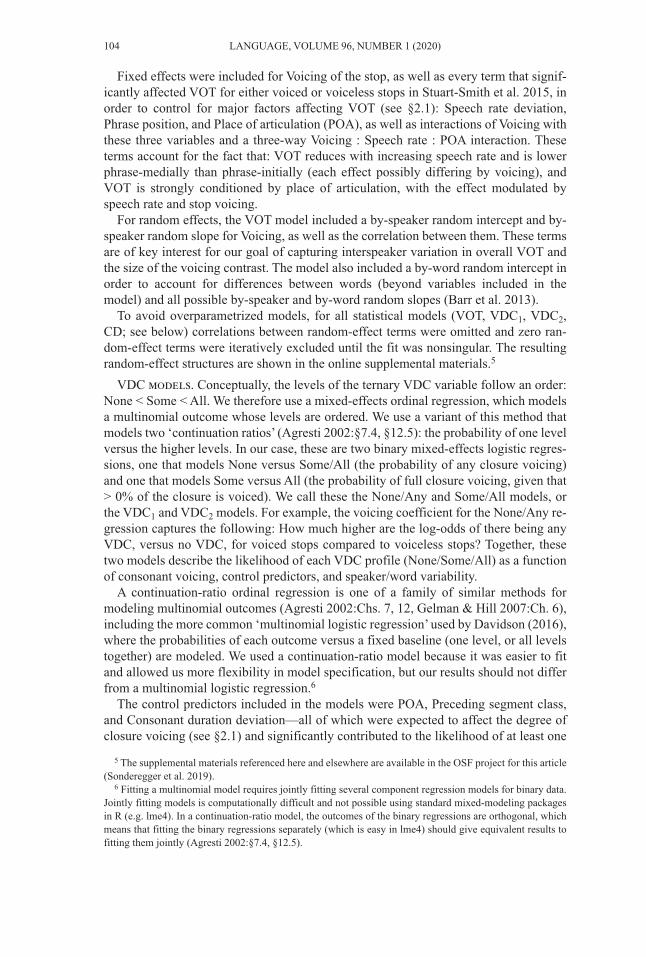
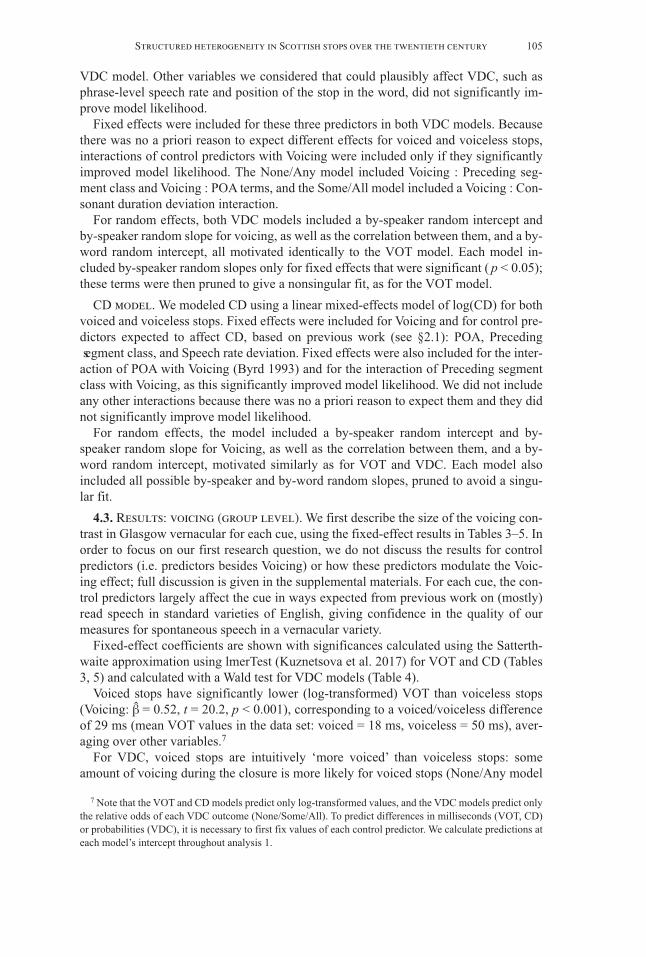
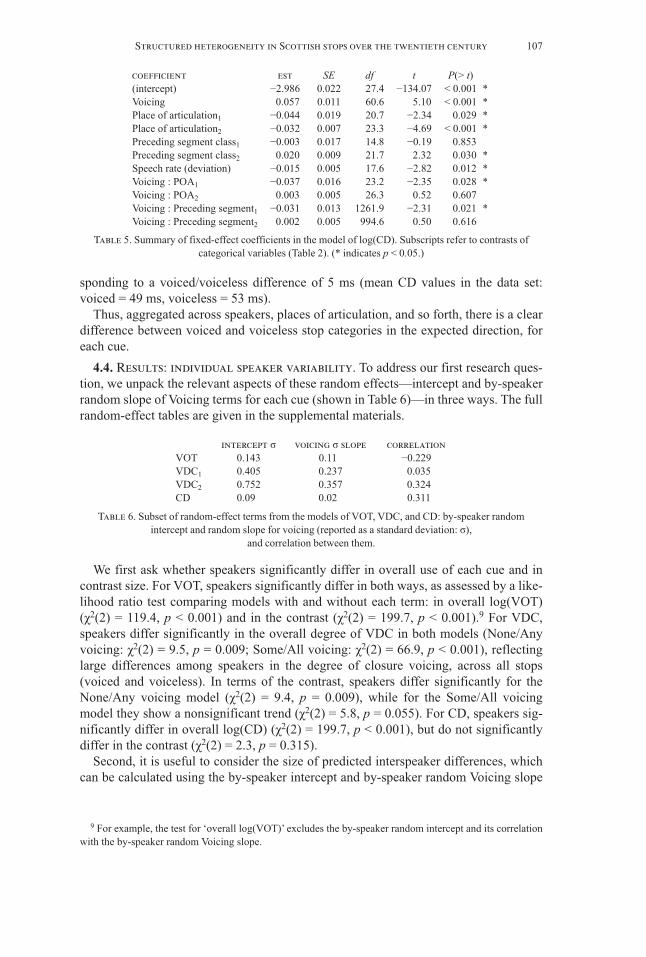
4.3. Results: voicing (group level). We first describe the size of the voicing con-trast in Glasgow vernacular for each cue, using the fixed-effect results in Tables 3–5. Inorder to focus on our first research question, we do not discuss the results for controlpredictors (i.e. predictors besides Voicing) or how these predictors modulate the Voic-ing effect; full discussion is given in the supplemental materials. For each cue, the con-trol predictors largely affect the cue in ways expected from previous work on (mostly)read speech in standard varieties of English, giving confidence in the quality of ourmeasures for spontaneous speech in a vernacular variety.
Fixed-effect coefficients are shown with significances calculated using the Satterth-waite approximation using lmerTest (Kuznetsova et al. 2017) for VOT and CD (Tables3, 5) and calculated with a Wald test for VDC models (Table 4).
Voiced stops have significantly lower (log-transformed) VOT than voiceless stops(Voicing: β̂ = 0.52, t = 20.2, p < 0.001), corresponding to a voiced/voiceless differenceof 29 ms (mean VOT values in the data set: voiced = 18 ms, voiceless = 50 ms), aver-aging over other variables.7
For VDC, voiced stops are intuitively ‘more voiced’ than voiceless stops: someamount of voicing during the closure is more likely for voiced stops (None/Any model
7 Note that the VOT and CD models predict only log-transformed values, and the VDC models predict onlythe relative odds of each VDC outcome (None/Some/All). To predict differences in milliseconds (VOT, CD)or probabilities (VDC), it is necessary to first fix values of each control predictor. We calculate predictions ateach model’s intercept throughout analysis 1.
Voicing: β̂ = −0.51, z = −4.04, p < 0.001), as is full closure voicing compared to partialvoicing (Some/All model Voicing: β̂ = −0.24, z = −1.9, p = 0.06), though the latter resultis above the significance threshold. Averaging over other variables, no, partial, and fullclosure voicing is predicted to occur for 78.3%, 8.7%, and 3% of voiceless stops, re-spectively (proportions in data set: 56.9%, 20%, and 23%), and 56.8%, 12.6%, and30.6% of voiced stops, respectively (proportions in data set: 27.6%, 19%, and 53.3%).8
For CD, voiceless stops have significantly higher (log-transformed) CD than voicedstops, averaging across other variables (Voicing: β̂ = 0.06, t = 5.1, p < 0.001), corre-
8 About 80% of tokens are postvocalic (where closure voicing is more likely), while model predictions av-erage over all preceding contexts (vowel, voiced fricative, voiceless fricative), leading to the discrepancy be-tween empirical proportions and model predictions.
106 LANGUAGE, VOLUME 96, NUMBER 1 (2020)
coefficient est SE df t P(> t) (intercept) −3.616 0.032 25.7 −112.91 < 0.001 * Place of articulation1 0.173 0.018 29.4 9.44 < 0.001 * Place of articulation2 0.098 0.011 37.5 9.28 < 0.001 * Voicing 0.522 0.026 27.9 20.20 < 0.001 * Speech rate (deviation) −0.018 0.006 19.8 −3.03 0.007 * Phrase position −0.044 0.010 23.7 −4.24 < 0.001 * POA1 : Voicing −0.021 0.014 25.8 −1.49 0.149 POA2 : Voicing −0.037 0.009 38.4 −4.08 < 0.001 * Voicing : Speech rate −0.005 0.008 23.9 −0.65 0.519 Voicing : Phrase position 0.018 0.013 21.0 1.39 0.180 POA1 : Speech rate −0.004 0.006 26.0 −0.59 0.557 POA2 : Speech rate −0.008 0.004 24.7 −2.12 0.044 * POA1 : Voicing : Speech rate −0.003 0.007 24.4 −0.48 0.637 POA2 : Voicing : Speech rate 0.003 0.004 24.8 0.81 0.425
Table 3. Summary of fixed-effect coefficients in the model of log(VOT). Subscripts refer to contrasts ofcategorical variables (Table 2). (* indicates p < 0.05.)
VDC1 model: None (0) vs. Some/All (1)coefficient est SE z P(> z)(intercept) −0.78 0.14 −5.48 < 0.001 * Voicing −0.51 0.13 −4.04 < 0.001 * Preceding segment class1 0.56 0.19 3.01 0.003 * Preceding segment class2 0.81 0.08 10.41 < 0.001 * Place of articulation1 0.16 0.07 2.36 0.018 * Place of articulation2 −0.05 0.04 −1.19 0.232 Consonant duration (deviation) 0.42 0.21 1.98 0.048 * Voicing : Preceding segment1 −0.43 0.15 −2.98 0.003 * Voicing : Preceding segment2 −0.26 0.05 −4.97 < 0.001 * Voicing : POA1 0.02 0.07 0.32 0.746 Voicing : POA2 0.12 0.04 3.18 0.001 *
VDC2 model: Some (0) vs. All (1)coefficient est SE z P(> z) (intercept) 0.65 0.26 2.50 0.013 * Voicing −0.24 0.13 −1.90 0.057 Preceding segment class1 0.00 0.29 0.01 0.994 Preceding segment class2 0.06 0.10 0.59 0.558 Place of articulation1 0.04 0.08 0.52 0.602 Place of articulation2 −0.02 0.05 −0.37 0.715 Consonant duration (deviation) −1.70 0.32 −5.28 < 0.001 * Voicing : Consonant duration 0.84 0.36 2.37 0.018 *
Table 4. Summary of fixed-effect coefficients in models of VDC. Coefficient subscripts refer to contrasts ofcategorical variables (Table 2). (* indicates p < 0.05.)
Structured heterogeneity in Scottish stops over the twentieth century 107
sponding to a voiced/voiceless difference of 5 ms (mean CD values in the data set:voiced = 49 ms, voiceless = 53 ms).
Thus, aggregated across speakers, places of articulation, and so forth, there is a cleardifference between voiced and voiceless stop categories in the expected direction, foreach cue.
4.4. Results: individual speaker variability. To address our first research ques-tion, we unpack the relevant aspects of these random effects—intercept and by-speakerrandom slope of Voicing terms for each cue (shown in Table 6)—in three ways. The fullrandom-effect tables are given in the supplemental materials.
9 For example, the test for ‘overall log(VOT)’ excludes the by-speaker random intercept and its correlationwith the by-speaker random Voicing slope.
coefficient est SE df t P(> t) (intercept) −2.986 0.022 27.4 −134.07 < 0.001 * Voicing 0.057 0.011 60.6 5.10 < 0.001 * Place of articulation1 −0.044 0.019 20.7 −2.34 0.029 * Place of articulation2 −0.032 0.007 23.3 −4.69 < 0.001 * Preceding segment class1 −0.003 0.017 14.8 −0.19 0.853 Preceding segment class2 0.020 0.009 21.7 2.32 0.030 * Speech rate (deviation) −0.015 0.005 17.6 −2.82 0.012 * Voicing : POA1 −0.037 0.016 23.2 −2.35 0.028 * Voicing : POA2 0.003 0.005 26.3 0.52 0.607 Voicing : Preceding segment1 −0.031 0.013 1261.9 −2.31 0.021 * Voicing : Preceding segment2 0.002 0.005 994.6 0.50 0.616
Table 5. Summary of fixed-effect coefficients in the model of log(CD). Subscripts refer to contrasts ofcategorical variables (Table 2). (* indicates p < 0.05.)
intercept σ voicing σ slope correlation VOT 0.143 0.110 −0.229 VDC1 0.405 0.237 0.035 VDC2 0.752 0.357 0.324 CD 0.090 0.020 0.311
Table 6. Subset of random-effect terms from the models of VOT, VDC, and CD: by-speaker randomintercept and random slope for voicing (reported as a standard deviation: σ),
and correlation between them.
We first ask whether speakers significantly differ in overall use of each cue and incontrast size. For VOT, speakers significantly differ in both ways, as assessed by a like-lihood ratio test comparing models with and without each term: in overall log(VOT)(χ2(2) = 119.4, p < 0.001) and in the contrast (χ2(2) = 199.7, p < 0.001).9 For VDC,speakers differ significantly in the overall degree of VDC in both models (None/Anyvoicing: χ2(2) = 9.5, p = 0.009; Some/All voicing: χ2(2) = 66.9, p < 0.001), reflectinglarge differences among speakers in the degree of closure voicing, across all stops(voiced and voiceless). In terms of the contrast, speakers differ significantly for theNone/Any voicing model (χ2(2) = 9.4, p = 0.009), while for the Some/All voicingmodel they show a nonsignificant trend (χ2(2) = 5.8, p = 0.055). For CD, speakers sig-nificantly differ in overall log(CD) (χ2(2) = 199.7, p < 0.001), but do not significantlydiffer in the contrast (χ2(2) = 2.3, p = 0.315).
Second, it is useful to consider the size of predicted interspeaker differences, whichcan be calculated using the by-speaker intercept and by-speaker random Voicing slope

terms from the statistical model for each cue; the intercept plus or minus twice the ran-dom slope value describes the predicted range of values for 95% of speakers.
For VOT, most speakers (95%) have an overall value between 20 and 36 ms, com-pared to the population mean of 27 ms, and a voiced/voiceless VOT contrast of 16–44ms. For VDC, for simplicity we quantify only the degree of interspeaker variability inwhether any VDC is present (None/Any model). Most speakers show some degree ofVDC between 17% and 50.7% of the time, compared to the population mean of 31.4%.For the contrast, speakers vary roughly between a 0.01 and a 0.4 difference in probabil-ity of Any voicing. For CD, most speakers have an overall value between 42 and 60 ms,compared to the population mean of 50 ms. Speakers do not differ significantly in CDcontrast size.
Third, we can extract estimates of the predicted cue values for voiced and voicelessstops for each speaker (‘BLUPs’: Pinheiro & Bates 2000:§2.2, Gelman & Hill 2007),controlling for other variables, to get a sense of what interspeaker differences are pre-dicted at the level of individuals. For VOT (Figure 2a), we see that despite substantialinterspeaker variability in the overall value, each speaker makes a clear contrast, withVOT higher for voiceless than for voiced stops.
For VDC, Figure 3 shows the predicted probability of each voicing class (None/Some/All) for each speaker, for voiced and voiceless stops. There are large differencesin how much speakers voice during closure overall, as reflected in the different heights
108 LANGUAGE, VOLUME 96, NUMBER 1 (2020)
10
20
30
40
50
60
35 40 45 50 55
VOT (ms): voiceless
VO
T (
ms)
: voi
ced
0.2
0.3
0.4
0.5
0.6
0.7
0.15 0.20 0.25 0.30 0.35
% with any VDC: voiceless
% w
ith a
ny V
DC
: voi
ced
0.3
0.4
0.5
0.6
0.7
0.8
0.3 0.4 0.5 0.6 0.7 0.8
% with full vs. some VDC: voiceless
% w
ith fu
ll vs
. som
e V
DC
: voi
ced
40
45
50
55
60
45 50 55 60
Closure Duration (ms): voiceless
Clo
sure
Dur
atio
n (m
s): v
oice
d
c. VDC2: P(All) / (P(Some) + P(All)). d. CD.
Figure 2. Model-predicted cue values for voiceless and voiced stops for each speaker (one point perspeaker). Dotted line is y = x, that is, where the value for voiced stops equals that for voiceless stops.
VOT and CD on log scale; VDC probabilities on log-odds scale.
a. VOT. b. VDC1: P(Some) + P(All).
Structured heterogeneity in Scottish stops over the twentieth century 109
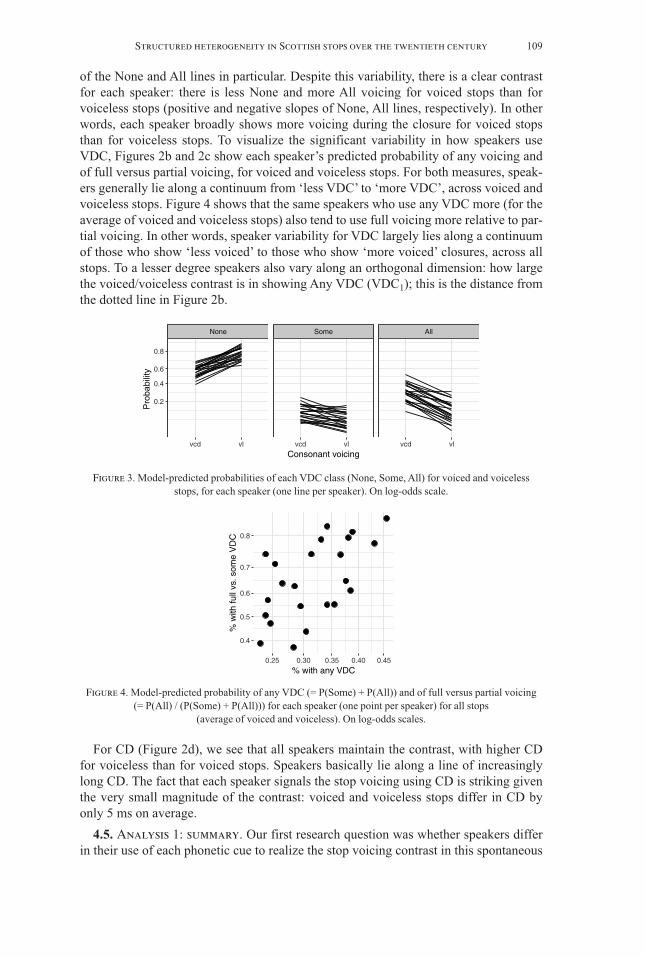
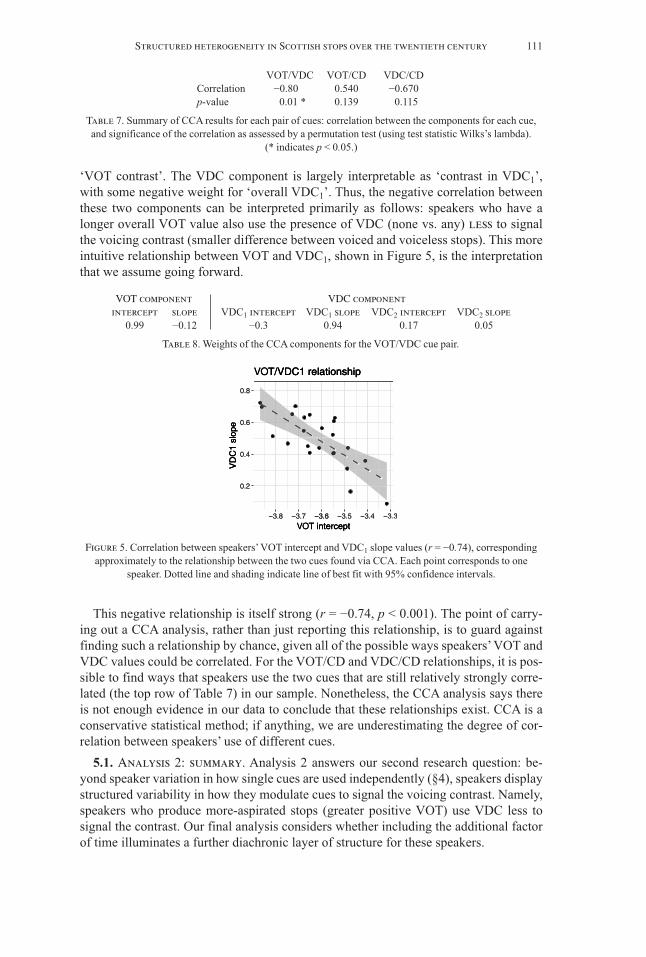
of the None and All lines in particular. Despite this variability, there is a clear contrastfor each speaker: there is less None and more All voicing for voiced stops than forvoiceless stops (positive and negative slopes of None, All lines, respectively). In otherwords, each speaker broadly shows more voicing during the closure for voiced stopsthan for voiceless stops. To visualize the significant variability in how speakers useVDC, Figures 2b and 2c show each speaker’s predicted probability of any voicing andof full versus partial voicing, for voiced and voiceless stops. For both measures, speak-ers generally lie along a continuum from ‘less VDC’ to ‘more VDC’, across voiced andvoiceless stops. Figure 4 shows that the same speakers who use any VDC more (for theaverage of voiced and voiceless stops) also tend to use full voicing more relative to par-tial voicing. In other words, speaker variability for VDC largely lies along a continuumof those who show ‘less voiced’ to those who show ‘more voiced’ closures, across allstops. To a lesser degree speakers also vary along an orthogonal dimension: how largethe voiced/voiceless contrast is in showing Any VDC (VDC1); this is the distance fromthe dotted line in Figure 2b.
For CD (Figure 2d), we see that all speakers maintain the contrast, with higher CDfor voiceless than for voiced stops. Speakers basically lie along a line of increasinglylong CD. The fact that each speaker signals the stop voicing using CD is striking giventhe very small magnitude of the contrast: voiced and voiceless stops differ in CD byonly 5 ms on average.
4.5. Analysis 1: summary. Our first research question was whether speakers differin their use of each phonetic cue to realize the stop voicing contrast in this spontaneous
None Some All
vcd vl vcd vl vcd vl
0.2
0.4
0.6
0.8
Consonant voicing
Pro
babi
lity
Figure 3. Model-predicted probabilities of each VDC class (None, Some, All) for voiced and voicelessstops, for each speaker (one line per speaker). On log-odds scale.
0.4
0.5
0.6
0.7
0.8
0.25 0.30 0.35 0.40 0.45
% with any VDC
% w
ith fu
ll vs
. som
e V
DC
Figure 4. Model-predicted probability of any VDC (= P(Some) + P(All)) and of full versus partial voicing (= P(All) / (P(Some) + P(All))) for each speaker (one point per speaker) for all stops
(average of voiced and voiceless). On log-odds scales.
speech data set. After controlling for key linguistic and prosodic factors for each cue(VOT, VDC, CD), we find that speakers do show substantial differences in their ‘over-all’ use of each—reflecting structured variability in how speakers realize the voiced andvoiceless categories for each cue. Speakers also differ to a smaller extent in the size ofthe contrast they make with each cue (for VOT and VDC only). At the same time, evenin this least-controlled speech style, every speaker maintains the stop voicing contrastin the expected direction for each cue.
5. Analysis 2: individual speaker variation across phonetic cues. We haveshown that individual speakers differ in their use of each cue to the stop voicing con-trast and also in how they realize this contrast using VOT and the presence of AnyVDC. We now ask: Is the use of individual speakers’ cues correlated in the realizationof the stop voicing contrast?
The models fitted above resulted in a description of how individuals realize the con-trast, as ‘intercept’ (average of voiced and voiceless) and ‘slope’ (voiceless minusvoiced) values, for each cue. Individual speaker variability can be described in terms ofthree sets of coefficients.10
(5) a. VOT: intercept, slope (voiceless-voiced)b. VDC: intercept, slope (voiced-voiceless) for None versus Any VDC; in-
tercept, slope for Some versus All VDCc. CD: intercept, slope (voiceless-voiced)
We now assess for each pair of cues (VOT, VDC, CD) whether interspeaker vari-ability in the two cues is correlated and how. One way of doing this would be to exam-ine every possible correlation (e.g. VOT intercept with VDC1 slope, etc.), but thismethod presumes that intercept and slope are the right variables to consider. In the ab-sence of any previous work that considers the relationships between the cues, we do notknow this. While we have good reason to suspect that some kind of interspeaker corre-lation could exist based on previous work (see §2.3), our search for interspeaker corre-lations is fundamentally exploratory and should be as flexible as possible. We thereforeask for each pair of sets in 5a–c: What is the linear combination of intercept(s) andslope(s), for each cue, that is best correlated with some combination of the intercept(s)and slope(s) for the other cue? This question is answered by canonical correlationanalysis (CCA; González et al. 2008). CCA gives, for two sets of variables measuredon the same set of observations (here, individual speakers), a linear combination foreach set of variables (‘component’) that show the maximum correlation. Since somesuch correlation will likely be observed by chance, a permutation test can be used to as-sess the significance of the association between the two sets of variables.
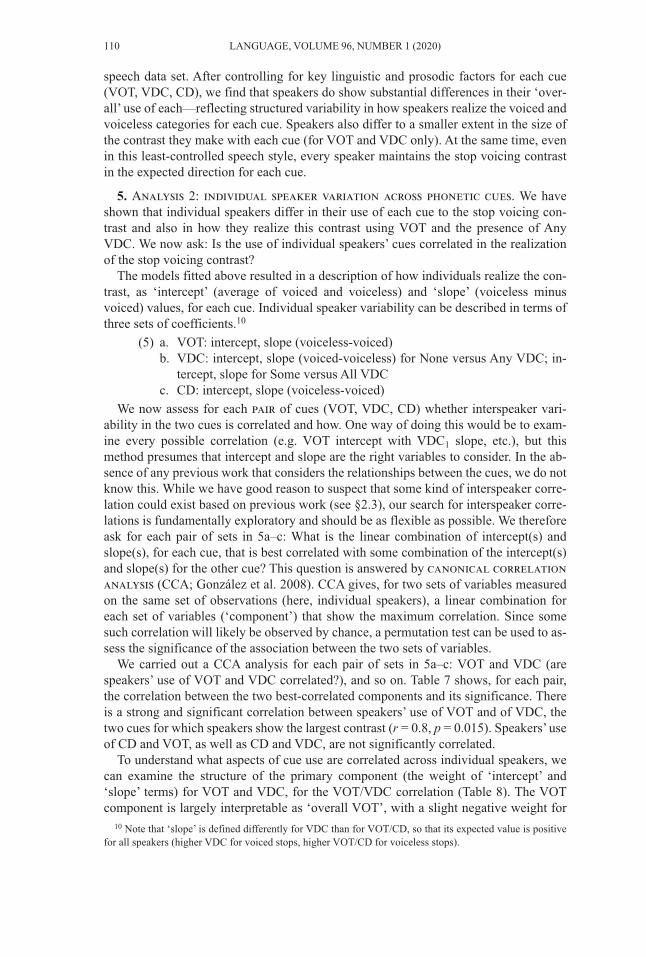
We carried out a CCA analysis for each pair of sets in 5a–c: VOT and VDC (arespeakers’ use of VOT and VDC correlated?), and so on. Table 7 shows, for each pair,the correlation between the two best-correlated components and its significance. Thereis a strong and significant correlation between speakers’ use of VOT and of VDC, thetwo cues for which speakers show the largest contrast (r = 0.8, p = 0.015). Speakers’ useof CD and VOT, as well as CD and VDC, are not significantly correlated.
To understand what aspects of cue use are correlated across individual speakers, wecan examine the structure of the primary component (the weight of ‘intercept’ and‘slope’ terms) for VOT and VDC, for the VOT/VDC correlation (Table 8). The VOTcomponent is largely interpretable as ‘overall VOT’, with a slight negative weight for
110 LANGUAGE, VOLUME 96, NUMBER 1 (2020)
10 Note that ‘slope’ is defined differently for VDC than for VOT/CD, so that its expected value is positivefor all speakers (higher VDC for voiced stops, higher VOT/CD for voiceless stops).
Structured heterogeneity in Scottish stops over the twentieth century 111
‘VOT contrast’. The VDC component is largely interpretable as ‘contrast in VDC1’,with some negative weight for ‘overall VDC1’. Thus, the negative correlation betweenthese two components can be interpreted primarily as follows: speakers who have alonger overall VOT value also use the presence of VDC (none vs. any) less to signalthe voicing contrast (smaller difference between voiced and voiceless stops). This moreintuitive relationship between VOT and VDC1, shown in Figure 5, is the interpretationthat we assume going forward.
VOT component VDC component intercept slope VDC1 intercept VDC1 slope VDC2 intercept VDC2 slope
0.99 −0.12 −0.3 0.94 0.17 0.05
Table 8. Weights of the CCA components for the VOT/VDC cue pair.
0.2
0.4
0.6
0.8
−3.8 −3.7 −3.6 −3.5 −3.4 −3.3
VOT intercept
VD
C1
slop
e
VOT/VDC1 relationship
0.8
0.6
T/VDC1 relationshipOV
VD
C1
slop
e
T/VDC1 relationship
0.4
0.2
VD
C1
slop
e
T interceptOV−3.6−3.7−3.8
T intercept3−3.3−3.4−3.5−3.6
Figure 5. Correlation between speakers’ VOT intercept and VDC1 slope values (r = −0.74), correspondingapproximately to the relationship between the two cues found via CCA. Each point corresponds to one
speaker. Dotted line and shading indicate line of best fit with 95% confidence intervals.
This negative relationship is itself strong (r = −0.74, p < 0.001). The point of carry-ing out a CCA analysis, rather than just reporting this relationship, is to guard againstfinding such a relationship by chance, given all of the possible ways speakers’ VOT andVDC values could be correlated. For the VOT/CD and VDC/CD relationships, it is pos-sible to find ways that speakers use the two cues that are still relatively strongly corre-lated (the top row of Table 7) in our sample. Nonetheless, the CCA analysis says thereis not enough evidence in our data to conclude that these relationships exist. CCA is aconservative statistical method; if anything, we are underestimating the degree of cor-relation between speakers’ use of different cues.
5.1. Analysis 2: summary. Analysis 2 answers our second research question: be-yond speaker variation in how single cues are used independently (§4), speakers displaystructured variability in how they modulate cues to signal the voicing contrast. Namely,speakers who produce more-aspirated stops (greater positive VOT) use VDC less tosignal the contrast. Our final analysis considers whether including the additional factorof time illuminates a further diachronic layer of structure for these speakers.
VOT/VDC VOT/CD VDC/CD Correlation −0.80 * 0.540 −0.670 p-value 0.01 * 0.139 0.115
Table 7. Summary of CCA results for each pair of cues: correlation between the components for each cue,and significance of the correlation as assessed by a permutation test (using test statistic Wilks’s lambda).
(* indicates p < 0.05.)
6. Analysis 3: across cues, across speakers, over time. Analyses 1 and 2 showsubstantial structured interspeaker variability in how the Glaswegian voicing contrast isrealized in spontaneous speech. Speakers vary greatly in the use of all three cues, andspeakers’ use of two of these cues is correlated. What could explain why individualsvary in overall values and contrast sizes for a given phonetic cue? If we work under theassumption of structured heterogeneity binding synchronic and diachronic language de-scription together (Weinreich et al. 1968), several possibilities present themselves, in-cluding contrast maintenance, differences in speaking style, or social factors (e.g.gender, identity construction); here we examine the possibility of change over time(Bang 2017). In analysis 3, we ask: Is the use of individual speakers’ cues for the stopvoicing contrast structured according to decade of recording, and thus consistent withchange over time?
6.1. Analysis 3: method. We address this question through quantitative (§§6.2–6.4)and qualitative (§6.5) analyses. The quantitative analyses use statistical models thatconsider speakers in terms of groups by decade of birth. Recall that speakers in oursample fall into six groups, corresponding to old, middle-aged, and young speakersfrom two recording decades (1970s, 2000s); see Table 1 above. We define the factordecade of birth to track which group a speaker belongs to.
For each model of the phonetic cues described in analysis 1, we fit an identicalmodel, but with fixed-effect terms added for Decade of birth and its interaction withVoicing.11 This tests whether there has been change in the overall cue value, and its usein the voicing contrast, over time. The updated model now estimates the cue value forvoiced and voiceless stops for speakers with each Decade of birth, after accounting forcontrols and variability between speakers (beyond decade of birth). The updated modelis then used to estimate the degree of real-time change in each age cohort, in overallcue use and in contrast size, giving a total of six estimates.
(6) a. Change in ‘average of voiced and voiceless’ for Old speakers from 1970sto 2000s
b. Change in ‘voiceless minus voiced’ for Old speakers from 1970s to 2000sc. Change in ‘average of voiced and voiceless’ for Middle-aged speakers
from 1970s to 2000sd. Change in ‘voiceless minus voiced’ for Middle-aged speakers from 1970s
to 2000se. Change in ‘average of voiced and voiceless’ for Young speakers from
1970s to 2000sf. Change in ‘voiceless minus voiced’ for Young speakers from 1970s to
2000sFor each model, we estimate these six values using the emmeans package (Lenth
2018). To assess whether the estimates are significantly different from zero, correspon-ding p-values are also calculated using emmeans (using Satterthwaite approximation/Wald tests as for the mixed-effects models).
6.2. VOT: by group over time. Stuart-Smith et al. (2015) conducted a real- and apparent-time analysis of this VOT data set. This analysis did not consider voiced andvoiceless stops together, as we do here in order to assess change in overall VOT value
11 Note that the models including Decade of birth could not themselves be used for analysis 1, because in-clusion of this term means the by-speaker random effects no longer have the interpretation needed for analy-sis 1 (each speaker’s characteristic value for the cue’s intercept/slope).
112 LANGUAGE, VOLUME 96, NUMBER 1 (2020)
Structured heterogeneity in Scottish stops over the twentieth century 113
and contrast size. For simplicity of presentation and comparability with the VDC and CDanalyses, the current analysis does not account for interactions with place of articulation.
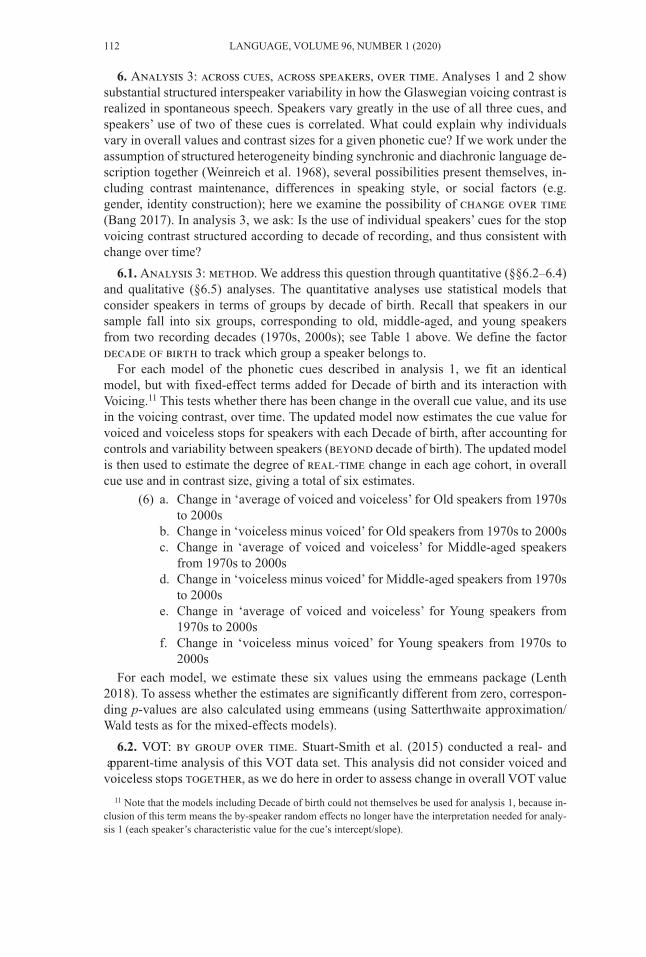
Figure 6 shows empirical trends in VOT by Decade of birth, for voiced and voicelessstops. As we consider possible evidence for real-time change in each cue, it is useful torefer to the empirical trend plot to understand the corresponding model’s predictions.Real-time comparisons for a given age group correspond to comparing the left and rightsides of an age panel.
Thus, VOT increases over real time for Old speakers (and possibly Middle-agedspeakers), decreases over time for Young speakers, and shows no significant change incontrast size. Recall that speakers differed significantly in both overall VOT and in con-trast size (analysis 1). Thus, how VOT varies over time is a subspace of how it variesamong speakers in the population, along the axis of ‘how aspirated’ stops are.
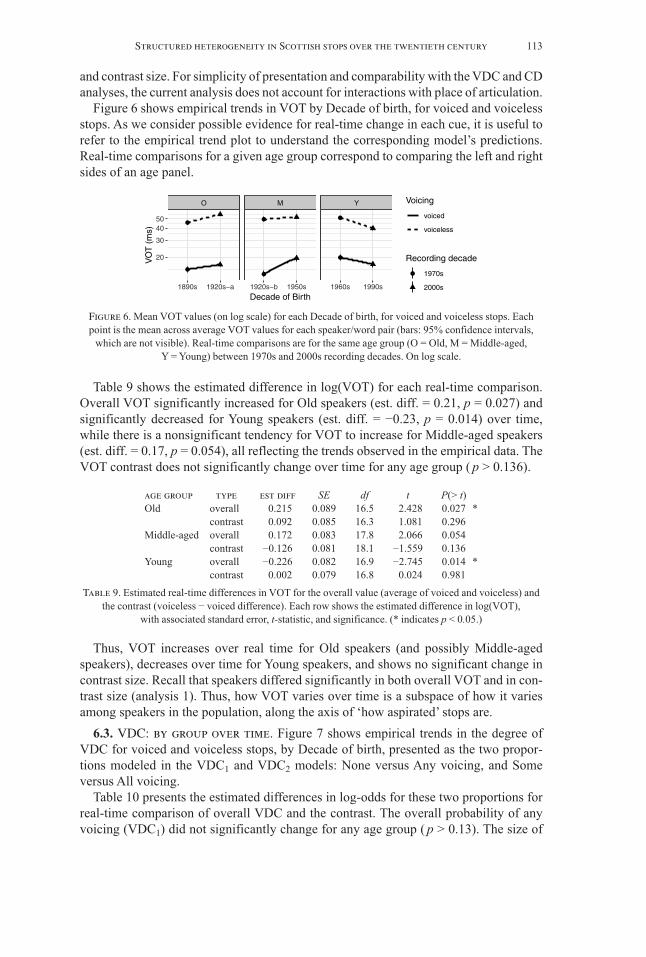
6.3. VDC: by group over time. Figure 7 shows empirical trends in the degree ofVDC for voiced and voiceless stops, by Decade of birth, presented as the two propor-tions modeled in the VDC1 and VDC2 models: None versus Any voicing, and Someversus All voicing.
Table 10 presents the estimated differences in log-odds for these two proportions forreal-time comparison of overall VDC and the contrast. The overall probability of anyvoicing (VDC1) did not significantly change for any age group (p > 0.13). The size of
O M Y
1890s 1920s−a 1920s−b 1950s 1960s 1990s
20
30
4050
Decade of Birth
VO
T (
ms)
Voicing
voiced
voiceless
Recording decade
1970s
2000s
Figure 6. Mean VOT values (on log scale) for each Decade of birth, for voiced and voiceless stops. Eachpoint is the mean across average VOT values for each speaker/word pair (bars: 95% confidence intervals,
which are not visible). Real-time comparisons are for the same age group (O = Old, M = Middle-aged, Y = Young) between 1970s and 2000s recording decades. On log scale.
Table 9 shows the estimated difference in log(VOT) for each real-time comparison.Overall VOT significantly increased for Old speakers (est. diff. = 0.21, p = 0.027) andsignificantly decreased for Young speakers (est. diff. = −0.23, p = 0.014) over time,while there is a nonsignificant tendency for VOT to increase for Middle-aged speakers(est. diff. = 0.17, p = 0.054), all reflecting the trends observed in the empirical data. TheVOT contrast does not significantly change over time for any age group ( p > 0.136).
age group type est diff SE df t P(> t) Old overall 0.215 0.089 16.5 2.428 0.027 *
contrast 0.092 0.085 16.3 1.081 0.296 Middle-aged overall 0.172 0.083 17.8 2.066 0.054
contrast −0.126 0.081 18.1 −1.559 0.136 Young overall −0.226 0.082 16.9 −2.745 0.014 *
contrast 0.002 0.079 16.8 0.024 0.981
Table 9. Estimated real-time differences in VOT for the overall value (average of voiced and voiceless) andthe contrast (voiceless − voiced difference). Each row shows the estimated difference in log(VOT),
with associated standard error, t-statistic, and significance. (* indicates p < 0.05.)
the voiceless/voiced difference decreased for Old speakers (p = 0.001) and Middle-aged speakers (p = 0.03), in line with the empirical trends in Fig. 7 (top). For the prob-ability of full versus partial voicing (VDC2), only Young speakers show significantchange: the voiceless/voiced difference strongly increases (β = −0.8, p = 0.006) (cor -responding to a negative change, because voiceless < voiced), and the overall proba -bility of full voicing shows a nonsignificant tendency to decrease (est. diff. = −1.08, p = 0.054). Both changes are essentially due to a large decrease in the probability of fullvoicing for voiceless stops (Fig. 7, lower right).
In sum, VDC is used less over real time for the contrast by Old and Middle-agedspeakers, and used more for the contrast by Young speakers. The overall use of VDC,across voiced and voiceless stops, shows little change. Recall that speakers differed sig-
114 LANGUAGE, VOLUME 96, NUMBER 1 (2020)
O M Y
1890s 1920s−a 1920s−b 1950s 1960s 1990s
0.30.40.50.60.70.8
Decade of Birth%
with
any
voi
cing
Voicing
voiced
voiceless
Recording decade
1970s
2000s
VDC1
O M Y
1890s 1920s−a 1920s−b 1950s 1960s 1990s
0.2
0.40.6
0.8
Decade of Birth
% w
ith fu
ll vo
icin
g vs
. par
tial
Voicing
voiced
voiceless
Recording decade
1970s
2000s
VDC2
Figure 7. Mean proportion of each kind of VDC for each Decade of birth, for voiced and voiceless stops.Top: any voicing (= P(Some) + P(All)). Bottom: all voicing versus partial voicing (= P(All) / (P(Some) +
P(All))). Each point is the mean across average proportions for each speaker/word pair (bars: 95%confidence intervals). Real-time comparisons are as in Fig. 6. On log-odds scale.
VDC1 model: None vs. Some/Allage group type est diff SE z P(> z) Old overall −0.584 0.381 −1.532 0.126
contrast 0.516 0.157 3.281 0.001 * Middle-aged overall 0.139 0.380 0.366 0.714
contrast 0.434 0.201 2.159 0.031 * Young overall −0.352 0.372 −0.949 0.343
contrast −0.298 0.210 −1.424 0.154
VDC2 model: Some vs. Allage group type est diff SE z P(> z) Old overall −0.541 0.599 −0.903 0.367
contrast 0.082 0.220 0.372 0.710 Middle-aged overall 0.171 0.579 0.296 0.767
contrast 0.483 0.323 1.494 0.135 Young overall −1.085 0.563 −1.926 0.054
contrast −0.801 0.291 −2.748 0.006 *
Table 10. Estimated real-time differences in VDC for the overall value (average of voiced and voiceless) andthe contrast (voiceless − voiced difference). Each row shows the estimated difference in log-odds for VDC1
or VDC2 model, with associated standard error, z-statistic, and significance. (* indicates p < 0.05.)
Structured heterogeneity in Scottish stops over the twentieth century 115
nificantly in ‘how voiced’ stop closures were overall and showed a small difference inthe contrast size for VDC1 (and possibly VDC2). Thus, how VDC varies over time is asubspace of how it varies among speakers in the population.
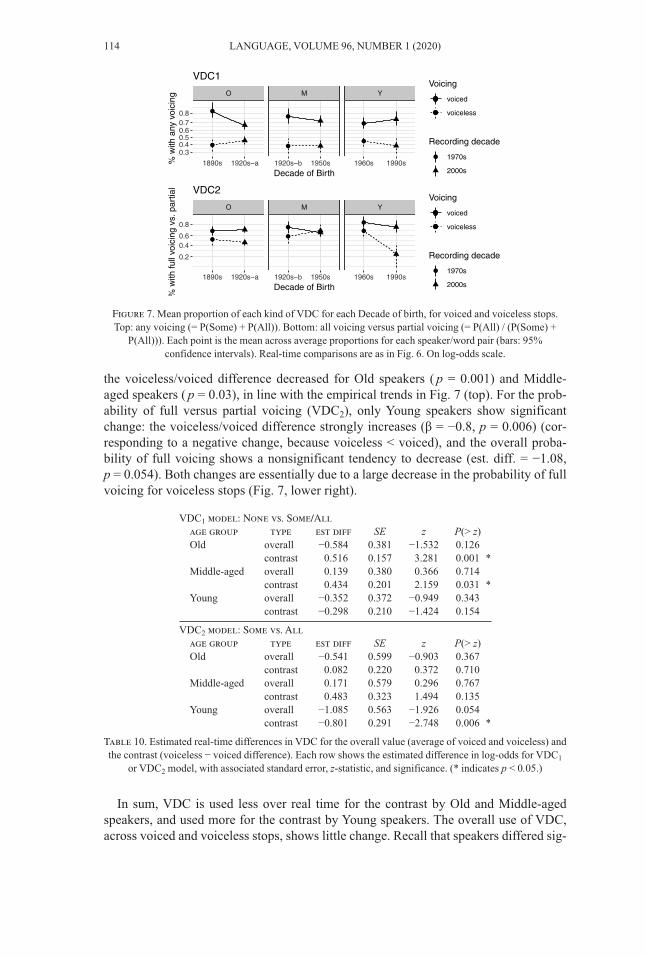
6.4. CD: by group over time. Figure 8 shows empirical trends in CD (log-trans-formed) for voiced and voiceless stops, by Decade of birth. Table 11 presents the esti-mated differences in overall log(CD) and the contrast for each real-time comparison,with significances calculated as for VOT. The overall CD significantly decreases forOld speakers (β = −0.27, p < 0.001), as is reflected in the empirical data (Fig. 8, left).Neither changes in overall CD for Middle-aged and Young speakers nor change in thecontrast for any age group reaches significance. Thus, there is little change over time inCD (Old speakers only); what change there is occurs along the same direction as varia-tion across speakers (analysis 1), where speakers differed significantly in overall CDvalue but not in contrast size.
6.5. By individuals, across cues, over time. Analysis 3 shows some evidence forreal-time change for two cues, primarily VOT and VDC (mainly None vs. Any). Thequestion remains as to what is happening for individual speakers over time. Figure 9shows a figure similar to Fig. 5, in a series of panels, plotting each speaker’s estimatedoverall VOT value (in ms) versus how much more likely any voicing during the closureis (odds ratio) for voiced than for voiceless stops—which is a more interpretable way tothink about the contrast in VDC1. Thus, a speaker at the top left of a panel has less-as-pirated stops and uses VDC more to signal the contrast, and vice versa. Like Purnell etal. (2005), we provide a qualitative, visual display of diachronic and synchronic infor-mation for individual speakers together, which also shows the shift in the ‘trading rela-tion’ between the cues over time.
Panel 1 shows the earliest-born group (circles): Old speakers born in the 1890s,recorded in the 1970s. These three speakers show the most use of VDC (largest voiced/voiceless difference) and the least aspiration, although with interspeaker differences inhow conservative they are. Panel 2 adds the Old speakers born in the 1920s, recorded inthe 2000s (triangles). There is a clear real-time shift both in the reduction of use of VDC
O M Y
1890s 1920s−a 1920s−b 1950s 1960s 1990s
45
50
55
60
Decade of Birth
Clo
sure
dur
atio
n (m
s)
Voicing
voiced
voiceless
Recording decade
1970s
2000s
Figure 8. Mean CD values (on log scale) for each Decade of birth for voiced and voiceless stops. Each pointis the mean across average CD values for each speaker/word pair (bars: 95% confidence intervals).
Real-time comparisons are as in Fig. 6. On log scale.
age group type est diff SE df t P(> t) Old overall −0.267 0.050 14.8 −5.295 < 0.001 *
contrast −0.005 0.026 9.9 −0.203 0.843 Middle-aged overall −0.004 0.047 18.5 −0.081 0.936
contrast 0.020 0.030 24.9 0.684 0.500 Young overall −0.079 0.047 17.6 −1.680 0.111
contrast −0.029 0.032 27.8 −0.925 0.363
Table 11. Estimated real-time differences in CD (on log scale), as in Table 9. (* indicates p < 0.05.)
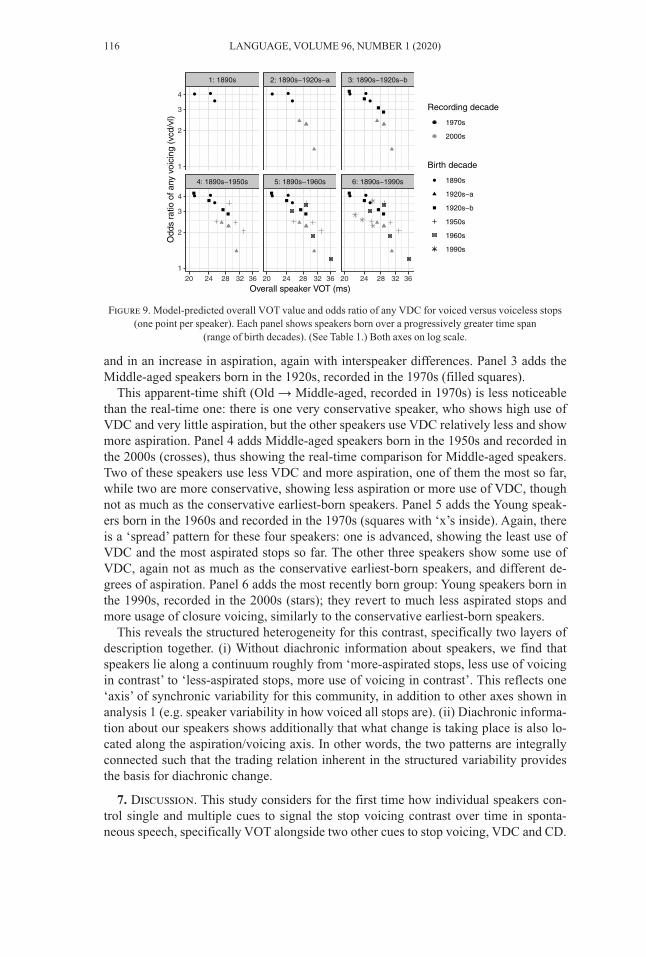
and in an increase in aspiration, again with interspeaker differences. Panel 3 adds theMiddle-aged speakers born in the 1920s, recorded in the 1970s (filled squares).
This apparent-time shift (Old → Middle-aged, recorded in 1970s) is less noticeablethan the real-time one: there is one very conservative speaker, who shows high use ofVDC and very little aspiration, but the other speakers use VDC relatively less and showmore aspiration. Panel 4 adds Middle-aged speakers born in the 1950s and recorded inthe 2000s (crosses), thus showing the real-time comparison for Middle-aged speakers.Two of these speakers use less VDC and more aspiration, one of them the most so far,while two are more conservative, showing less aspiration or more use of VDC, thoughnot as much as the conservative earliest-born speakers. Panel 5 adds the Young speak-ers born in the 1960s and recorded in the 1970s (squares with ‘x’s inside). Again, thereis a ‘spread’ pattern for these four speakers: one is advanced, showing the least use ofVDC and the most aspirated stops so far. The other three speakers show some use ofVDC, again not as much as the conservative earliest-born speakers, and different de-grees of aspiration. Panel 6 adds the most recently born group: Young speakers born inthe 1990s, recorded in the 2000s (stars); they revert to much less aspirated stops andmore usage of closure voicing, similarly to the conservative earliest-born speakers.
This reveals the structured heterogeneity for this contrast, specifically two layers ofdescription together. (i) Without diachronic information about speakers, we find thatspeakers lie along a continuum roughly from ‘more-aspirated stops, less use of voicingin contrast’ to ‘less-aspirated stops, more use of voicing in contrast’. This reflects one‘axis’ of synchronic variability for this community, in addition to other axes shown inanalysis 1 (e.g. speaker variability in how voiced all stops are). (ii) Diachronic informa-tion about our speakers shows additionally that what change is taking place is also lo-cated along the aspiration/voicing axis. In other words, the two patterns are integrallyconnected such that the trading relation inherent in the structured variability providesthe basis for diachronic change.
7. Discussion. This study considers for the first time how individual speakers con-trol single and multiple cues to signal the stop voicing contrast over time in sponta-neous speech, specifically VOT alongside two other cues to stop voicing, VDC and CD.
116 LANGUAGE, VOLUME 96, NUMBER 1 (2020)
4: 1890s−1950s 5: 1890s−1960s 6: 1890s−1990s
1: 1890s 2: 1890s−1920s−a 3: 1890s−1920s−b
20 24 28 32 36 20 24 28 32 36 20 24 28 32 36
1
2
3
4
1
2
3
4
Overall speaker VOT (ms)
Odd
s ra
tio o
f any
voi
cing
(vc
d/vl
)
Recording decade
1970s
2000s
Birth decade
1890s
1920s−a
1920s−b
1950s
1960s
1990s
Figure 9. Model-predicted overall VOT value and odds ratio of any VDC for voiced versus voiceless stops(one point per speaker). Each panel shows speakers born over a progressively greater time span
(range of birth decades). (See Table 1.) Both axes on log scale.

Structured heterogeneity in Scottish stops over the twentieth century 117
We structure our discussion around our research questions: the evidence for structuredvariability in speakers’ use of single (§7.1) and multiple (§7.2) phonetic cues, and addi-tional structure with respect to time (§7.3).
7.1. Structured variability in single phonetic cues for scottish stop voic-ing. Substantial interspeaker differences have been found in several cues for AmericanEnglish word-initial stops in different kinds of read speech, specifically VOT (Allen etal. 2003, Chodroff & Wilson 2017, 2018), following vowel duration, and onset f0 (Cla-yards 2018). These interspeaker differences are further structured, such that eachspeaker maintains stop contrasts for place of articulation and voicing (Chodroff & Wil-son 2017, 2018, Theodore et al. 2009). Until now, structured variability for these cueshas not been examined for spontaneous English, and VDC and CD have not been con-sidered at all.
We find significant differences between individual speakers’ use of VOT, presence ofVDC, use of full versus partial voicing, and CD, after controlling for linguistic factors.While speakers differ substantially in the use of each cue, every speaker uses each cueto signal the contrast between voiced and voiceless stops (Fig. 2). The plots revealstructured patterns of interspeaker variation across categories: speakers lie on a contin-uum of ‘overall’ values of each cue used to signal the stop contrast, including in ‘howvoiced’ stops are in general (Fig. 4). We also find that speakers differ in the size of thevoicing contrast made using VOT and the presence of VDC.
Thus, these Scottish English speakers exhibit structured variability in spontaneousspeech, for all three cues to stop voicing. Our findings are consistent with Chodroff and Wilson’s (2018) suggestion that the presence of structured variation within phoneticcues helps listeners discern linguistic contrasts, while other speaker variation facilitatesrecognition of interspeaker differences in phonetic realization, both personal (Goldinger1998, Kleinschmidt 2019) and systematic, such as social-indexical contrasts (Docherty& Foulkes 2000). Speakers both are signaling the stop voicing contrast with each of thethree cues and systematically differ from each other with respect to age and time in howthey use the cues to realize the contrast.
That we have uncovered such robust evidence for structured variability for each cue,even in this least-controlled speech style, is perhaps less surprising than it might seem.Most speech communication takes place in exactly this way; producing words as mini-mal pairs in citation forms, word-lists, or in read sentences is much less usual. There arehints throughout the literature that the stop voicing contrast in particular is realized in aphonetically less usual way in read citation forms. Lisker and Abramson (1967) specif-ically note the increased use of voicing lead, and very long VOT, in isolated words, andeven more so in minimal pairs, and suggest that this is due to an ‘enhancement effect’.Chodroff and Wilson (2017:41) were surprised by their finding that individual speakersmaintain the voicing contrast more in connected speech, where so many other factorscan also affect VOT values, than in isolated words. Clayards (2018) also found that producing minimal pairs provoked phonetically prototypical realizations of both stopcategories and, interestingly, found weaker—rather than stronger—evidence for intra -speaker covariation of multiple cues for stop voicing. Our results for single and multi-ple cues suggest that we should perhaps take an alternative perspective. We might wantto start by assuming that spontaneous speech is the speaker norm, during which talkersneed to communicate linguistic and social-indexical contrasts together effectively(Docherty & Foulkes 2000, Docherty et al. 1997); our findings are consistent with themdoing just this. More-controlled speech styles, which are crucial for the careful teasing
out of many aspects of phonetic and phonological phenomena, may sometimes end upinhibiting individual speaker behavior.
7.2. Structured variability in multiple phonetic cues for scottish stopvoicing. Three previous studies have shown that speakers exhibit structured variabilityfor multiple cues to stop voicing in English read speech, where these cues are VOT andf0 at vowel onset (Shultz et al. 2012), plus CD (Schertz et al. 2015) or following vowelduration (Clayards 2018). Previous results from experimental work on the three cuesconsidered here (§2.1) show the following overall relationships for English: voicelessstops have longer VOT, are less likely to show VDC, and have longer CD; voiced stopshave shorter VOT, are more likely to show stop voicing, and have shorter CD. A patternsimilar to a subset of these results also emerged for our spontaneous Scottish Englishspeakers. In analysis 2, we ran a canonical correlation analysis that identified whichpairs of cues are correlated for individual speakers. The two cues that are used most bythese individual speakers to realize the voicing contrast, namely VOT and VDC, arealso significantly correlated: the higher the speaker’s value for VOT for the voicingcontrast, the less that speaker will use VDC. This means that individual speakers’ use oftwo cues is coordinated along an axis that is a subspace of the way speakers vary in sig-naling the voicing contrast, in general: speakers who show more/less-aspirated stopswill also use VDC to a lesser/greater extent. This intraspeaker consistency of phonetic-cue coordination seems striking especially because our speech sample is spontaneousvernacular Glaswegian. But, as noted above, perhaps it was easier for us to discernthese relationships precisely because our data were more, rather than less, naturalistic(Clayards 2018). The availability of increasingly large spontaneous data sets means thatour assertion can be tested in future work.
7.3. The scottish stop voicing contrast is changing. Previous work has sug-gested that Scottish English stops are becoming more aspirated, as part of a generalshift from a more voicing-based system to a more aspiration-based system (Johnston1997, Stuart-Smith et al. 2015). The current study provides the first real-time evidencefrom Scottish spontaneous speech consistent with the assumption that shifts in VOT(reflecting aspiration) are also accompanied by shifts in stop voicing. Analysis 3 con-sidered the evidence for change for each cue across all stops when speakers weregrouped by Age and Decade of birth.
VOT and VDC both show evidence consistent with change over time. Inspection ofthe correlated use of VOT and VDC by individual speakers provides greater resolutionof the progression of the change in terms of a shift in the trading relation between thecues (cf. Purnell et al. 2005). We find general confirmation of the group results in termsof increasing VOT and reduction of use of VDC to make the contrast, except for the1990s-born adolescents, who revert to more use of VDC and less-aspirated stops. Wealso observe that each Age/Decade of birth group contains both conservative and moreinnovative speakers with respect to their use of more VOT/less VDC. This is exactly thekind of differentiated behavior we expect from members of a community undergoingsound change (Milroy & Milroy 1985, Stuart-Smith & Timmins 2010).
Two other factors may be important in shaping our interpretation. The first is speechstyle. Inference of real-time change depends on the samples from which speakers aredrawn. Our sample is drawn from a trend corpus, which includes samples from differ-ent speakers of similar ages from the same community recorded at different times. Theconstruction of such a corpus depends on available recordings, and there are numerouslikely differences between samples, beyond those relating to language change (Tillery& Bailey 2003), including recording context.
118 LANGUAGE, VOLUME 96, NUMBER 1 (2020)

Structured heterogeneity in Scottish stops over the twentieth century 119
We cannot rule out the possibility that the increase in aspiration/decrease in stopvoicing found in the older women results at least partly from style-shifting toward morestandard Scottish English in the oral interview context in which they were recorded.However, all but one of the older women, from both time periods, were recorded in in-terviews, which makes it more difficult to ascribe the differences between the twogroups to contextual shifting.
The middle-aged women present a more complex situation: the 1970s recordings areinterviews, but those made in the 2000s are casual conversations with a friend, likely toinduce more Scots variants, thus less-aspirated/more-voiced stops. But we find the op-posite pattern: stops with lengthened VOT and less VDC in highly vernacular speech.This supports our inference of a general shift in increased aspiration and reduction ofstop voicing after the period of urban regeneration in Glasgow, in the mid-1970s andpossibly later (cf. Stuart-Smith et al. 2013, Stuart-Smith et al. 2017).
The second factor is age grading. Sociolinguistic accounts of language change (e.g.Sankoff & Blondeau 2007) note that real-time changes often include patterns that arerepeatedly observed as characteristic of a particular age group. For example, manychanges show an ‘adolescent peak’, whereby adolescents show increased use of inno-vative variants compared to younger and older speakers (Tagliamonte & D’Arcy 2009).Here we find that, against a trajectory of real-time change toward more-aspirated/less-voiced stops, the young 1990s-born speakers show a reversal. Rather than a peak ofgreater aspiration/less voicing, these speakers show an adolescent trough, returning toVOT values typical of the earliest-born speakers, and much more VDC.
This pattern of reversal to vernacular variants in adolescents born since Glasgow’surban regeneration, that is, during and after the mid-1970s, is found in other variablesas well. For example, young women from the same period show a similar trough in thespectral frequency of /s/, shifting back to productions similar to, but different in con-striction shape from, those of women born two generations before (Stuart-Smith 2020).These speakers are also leading in the adoption of innovative variants such as th-fronting (Stuart-Smith et al. 2013).
Thus this realization of the stop voicing contrast forms part of a wider stylistic con-struction of sociolinguistic identity (Eckert 2012), which exploits vernacular featuresand selected innovations for a ‘new-old Glaswegian’, reminiscent of Watt’s (2002)young Geordies, who reject the ‘flat cap and clogs’ stereotypes of Newcastle but capital-ize on the some of the desired characteristics of the ‘toon’, including linguistically. Here,Glasgow vernacular is being restyled and reinvented, combining ideologies of ‘old’, tra-ditional Glasgow (steel and shipyards, classic Billy Connolly) with those of supralocal,postmodern innovations (cf. Stuart-Smith et al. 2007). Such ‘boomerang’ (Benor 2015)changes have been observed in other sociolinguistic contexts for other features, includ-ing the reappearance of Yiddish loanwords in American English (Benor 2015) and the in-creased stopping of interdental fricatives in Cajun English (Dubois & Horvath 1998). Ashere, the enregisterment of the linguistic variation with local identity is a recurring traitof such reversals (cf. Agha 2003). Their mechanism is unclear, but they may result fromthe fact that speakers’ perceptual memories are deeper than their productive repertoires:that is, speakers hold exemplars from their grandparents’ generation as well (cf. Hay &Foulkes 2016), which are then available for stylistic exploitation.
Returning to phonology, the evidence for real-time change in our speaker sample isconsistent with the assumption that the stop contrast is stable at a structural level andthat its phonetic realization is changing over time, toward greater aspiration and less useof VDC. Exactly how to phonologically characterize this change is an interestingissue. Under a ‘traditional’ view of laryngeal phonology, where both Scots and other

English varieties have a [voice] contrast with differing phonetic realization, what wehave observed is purely phonetic change in realization of the [voice] feature. But underthe ‘laryngeal realism’ view, where traditional Scots uses [voice] while other Englishdialects use [spread] to realize the voicing contrast, the change we observe may reflectsomething deeper—change in the feature carrying the contrast, from [voice] to[spread]. By the logic of laryngeal realism (e.g. Salmons 2020), changes in phonetic re-alization like we observe here are a necessary, but not sufficient, condition for demon-strating such a shift. The crucial evidence would come from phonological processes(e.g. assimilation), which is an interesting direction for future work in this or anotherdia chronic corpus of Scots.
8. Conclusion.Weinreich et al. (1968:99) claimed that identifying and accounting forlinguistic variation—crucially in its social environment—can lead to a ‘more adequatedescription of linguistic competence’. The quest to pin down structured heterogeneityhas driven the agenda for the last fifty years of variationist sociolinguistics. Purnell et al.(2005) explicitly took this agenda forward, in order to understand better the fate of stopvoicing in Wisconsin English. Their study, on read speech, had a clear diachronic focus.Accounting for the phonetic and linguistic factors that condition speech variation is coreto phonetics, and more recently interest has shifted to uncovering ‘structured variability’:how and why speakers differ in how they realize phonological contrasts in nonrandomways (Chodroff & Wilson 2017, 2018). Here we draw together phonetics and variation-ist sociolinguistics to offer an integrated account of some of the structured heterogeneitythat exists for the stop voicing contrast in spontaneous speech from Glaswegian femalespeakers, over an effective time span of 100 years.
By working with this stop contrast in its natural habitat, we offer findings that to-gether are relevant to synchronic and diachronic perspectives on the phenomenon. Weshow that individual speakers control both linguistic and social-indexical contrasts.Speakers use all three cues separately, and to an extent together, to signal the stop voic-ing contrast, but they differ from each other in systematic ways. Most interesting is themultidimensional quasi-synchronic axis along which interspeaker variability is ob-served, which is at the same time the axis for diachronic change in this community.
A consideration of synchronic variability illuminates diachronic change, and viceversa, as predicted in the original manifesto by Weinreich et al. (1968). Moreover, andlike Purnell et al. (2005), we see that this change exploits the inherent trading relationsfor stop voicing. It is also an excellent example of how sound change arises from syn-chronic variation (Ohala 1989), though we do not attempt here to specify possiblemechanisms.
We also note some caveats and future directions. Our study is necessarily limited. Wedo not consider other cues to stop voicing, such as f0 at vowel onset or following vowelduration, which may enhance or change our interpretations. We also require additionalsocial information; here we look only at one ‘corner’ of this dialect. Our description,and inferences, require the inclusion of gender and social class. The former may giveinsight into the propagation of the change through the community, and the latter isknown to exacerbate sociolinguistic polarization and change in this and other BritishEnglish dialects. Finally, our assertions concerning the role of speech style in structuredvariability need testing for this contrast for other dialects, for other languages, withinspontaneous speech, and within and across different speech styles from the same speak-ers. The current availability of high-quality acoustic analysis for increasingly largespontaneous speech corpora means that we may not need to wait too long.
120 LANGUAGE, VOLUME 96, NUMBER 1 (2020)
Structured heterogeneity in Scottish stops over the twentieth century 121
REFERENCESAbramson, Arthur S., and Douglas H. Whalen. 2017. Voice onset time (VOT) at 50:
Theoretical and practical issues in measuring voicing distinctions. Journal of Phonetics63.75–86. DOI: 10.1016/j.wocn.2017.05.002.
Agha, Asif. 2003. The social life of cultural value. Language & Communication 23.231–73. DOI: 10.1016/S0271-5309(03)00012-0.
Agresti, Alan. 2002. Categorical data analysis. 2nd edn. Hoboken, NJ: Wiley.Aitken, Adam J. 1979. Scottish speech: A historical view with special reference to the Stan-
dard English of Scotland. Languages of Scotland, ed. by Adam J. Aitken and TomMcArthur, 85–118. London: Chambers.
Allen, Sean; Joanne L. Miller; and David DeSteno. 2003. Individual talker differ-ences in voice-onset-time. The Journal of the Acoustical Society of America 113.544–52. DOI: 10.1121/1.1528172.
Bang, Hye-Young. 2017. The structure of multiple cues to stop categorization and its im-plications for sound change. Montreal: McGill University dissertation.
Baran, Jane A.; Marsha Zlatin Laufer; and Ray Daniloff. 1977. Phonological con-trastivity in conversation: A comparative study of voice onset time. Journal of Phonet-ics 5.339–50. DOI: 10.1016/S0095-4470(19)31204-5.
Barr, Dale J.; Roger Levy; Christoph Scheepers; and Harry J. Tily. 2013. Randomeffects structure for confirmatory hypothesis testing: Keep it maximal. Journal of Mem-ory and Language 68.255–78. DOI: 10.1016/j.jml.2012.11.001.
Bates, Douglas; Martin Mächler; Ben Bolker; and Steve Walker. 2015. Fitting lin-ear mixed-effects models using lme4. Journal of Statistical Software 67.1–48. DOI:10.18637/jss.v067.i01.
Benor, Sarah. 2015. How synagogues became shuls: The boomerang effect in Yiddish-influenced English, 1895–2010. Germanic heritage languages in North America, ed. byJanne Bondi Johannessen and Joseph C. Salmons, 217–33. Amsterdam: John Benjamins.
Boersma, Paul, and David Weenink. 2001. Praat, a system for doing phonetics by com-puter. GLOT International 5.341–45.
Byrd, Dani. 1993. 54,000 American stops. UCLA Working Papers in Phonetics 83.97–116.Chen, Matthew. 1970. Vowel length duration as a function of the voicing of the consonant
environment. Phonetica 22.129–59. DOI: 10.1159/000259312.Cho, Taehong; Douglas H. Whalen; and Gerard Docherty. 2019. Voice onset time
and beyond: Exploring laryngeal contrast in 19 languages. Journal of Phonetics 72.52–65. DOI: 10.1016/j.wocn.2018.11.002.
Chodroff, Eleanor; John Godfrey; Sanjeev Khudanpur; and Colin Wilson. 2015.Structured variability in acoustic realization: A corpus study of voice onset time in Amer-ican English stops. Proceedings of the 18th International Congress of Phonetic Sciences(ICPhS), Glasgow, paper 632. Online: https://www.internationalphoneticassociation.org/icphs-proceedings/ICPhS2015/Papers/ICPHS0632.pdf.
Chodroff, Eleanor, and Colin Wilson. 2017. Structure in talker-specific phonetic real-ization: Covariation of stop consonant VOT in American English. Journal of Phonetics61.30–47. DOI: 10.1016/j.wocn.2017.01.001.
Chodroff, Eleanor, and Colin Wilson. 2018. Predictability of stop consonant phoneticsacross talkers: Between-category and within-category dependencies among cues forplace and voice. Linguistics Vanguard 4(s2):20170047. DOI: 10.1515/lingvan-2017-0047.
Clayards, Meghan. 2018. Individual talker and token covariation in the production ofmultiple cues to stop voicing. Phonetica 75.1–23. DOI: 10.1159/000448809.
Cole, Jennifer; Heejin Kim; Hansook Choi; and Mark Hasegawa-Johnson. 2007.Prosodic effects on acoustic cues to stop voicing and place of articulation: Evidencefrom Radio News speech. Journal of Phonetics 35.180–209. DOI: 10.1016/j.wocn.2006.03.004.
Crystal, Thomas H., and Arthur S. House. 1988. Segmental durations in connected-speech signals: Current results. The Journal of the Acoustical Society of America 83.1553–73. DOI: 10.1121/1.395911.
Davidson, Lisa. 2016. Variability in the implementation of voicing in American English ob-struents. Journal of Phonetics 54.35–50. DOI: 10.1016/j.wocn.2015.09.003.

Davidson, Lisa. 2017. Phonation and laryngeal specification in American English voicelessobstruents. Journal of the International Phonetic Association 48.331–56. DOI: 10.1017/S0025100317000330.
Docherty, Gerard J. 1992. The timing of voicing in British English obstruents. Dordrecht:Foris.
Docherty, Gerard J., and Paul Foulkes. 2000. Speaker, speech, and knowledge ofsounds. Phonological knowledge: Conceptual and empirical issues, ed. by Noel Bur-ton-Roberts, Philip Carr, and Gerard Docherty, 105–29. Oxford: Oxford UniversityPress.
Docherty, Gerard J.; Paul Foulkes; James Milroy; Lesley Milroy; and David Wal-shaw. 1997. Descriptive adequacy in phonology: A variationist perspective. Journal ofLinguistics 33.275–310. DOI: 10.1017/S002222679700649X.
Docherty, Gerard J.; Dominic Watt; Carmen Llamas; Damien Hall; and JenniferNycz. 2011. Variation in voice onset time along the Scottish-English border. Proceed-ings of the 17th International Congress of Phonetic Sciences (ICPhS), Hong Kong,591–94. Online: https://www.internationalphoneticassociation.org/icphs-proceedings/ICPhS2011/OnlineProceedings/RegularSession/Docherty/Docherty.pdf.
Dubois, Sylvie, and Barbara M. Horvath. 1998. Let’s tink about dat: Interdental frica-tives in Cajun English. Language Variation and Change 10.245–61. DOI: 10.1017/S0954394500001320.
Eckert, Penelope. 2012. Three waves of variation study: The emergence of meaning in thestudy of sociolinguistic variation. Annual Review of Anthropology 41.87–100. DOI:10.1146/annurev-anthro-092611-145828.
Francis, Alexander L.; Natalya Kaganovich; and Courtney Driscoll-Huber. 2008.Cue-specific effects of categorization training on the relative weighting of acousticcues to consonant voicing in English. The Journal of the Acoustical Society of America124.1234–51. DOI: 10.1121/1.2945161.
Fromont, Robert, and Jennifer Hay. 2012. LaBB-CAT: An annotation store. Proceedingsof the Australasian Language Technology Association Workshop 2012, 113–17. Online:https://www.aclweb.org/anthology/U12-1015/.
Gelman, Andrew, and Jennifer Hill. 2007. Data analysis using regression and multi-level/hierarchical models. Cambridge: Cambridge University Press.
Goldinger, Stephen D. 1998. Echoes of echoes? An episodic theory of lexical access.Psychological Review 105.251–79. DOI: 10.1037/0033-295X.105.2.251.
González, Ignacio; Sébastien Déjean; Pascal G. P. Martin; and Alain Baccini.2008. CCA: An R package to extend canonical correlation analysis. Journal of Statisti-cal Software 23.1–14. DOI: 10.18637/jss.v023.i12.
Grant, William. 1913. The pronunciation of English in Scotland. Cambridge: CambridgeUniversity Press.
Hay, Jennifer, and Paul Foulkes. 2016. The evolution of medial /t/ over real and remem-bered time. Language 92.298–330. DOI: 10.1353/lan.2016.0036.
Honeybone, Patrick. 2005. Diachronic evidence in segmental phonology: The case of obstruent laryngeal specifications. The internal organization of phonological segments,ed. by Marc van Oostendorp and Jeroen van de Weijer, 319–54. Berlin: Mouton deGruyter.
Iverson, Gregory K., and Joseph C. Salmons. 1995. Aspiration and laryngeal representa-tion in Germanic. Phonology 12.369–96. DOI: 10.1017/S0952675700002566.
Iverson, Gregory K., and Joseph C. Salmons. 1999. Glottal spreading bias in Germanic.Linguistische Berichte 178.135–51.
Johnston, Paul A. 1980. A synchronic and historical view of border area bimoraic vowelsystems. Edinburgh: University of Edinburgh, ms.
Johnston, Paul A. 1997. Regional variation. The Edinburgh history of the Scots language,ed. by Charles Jones, 433–513. Edinburgh: Edinburgh University Press.
Keating, Patricia A. 1984. Phonetic and phonological representation of stop consonantvoicing. Language 60.286–319. DOI: 10.2307/413642.
Keshet, Joseph; Morgan Sonderegger; and Thea Knowles. 2014. AutoVOT: A tool forautomatic measurement of voice onset time using discriminative structured prediction.Version 0.91. Online: https://github.com/mlml/autovot/.
122 LANGUAGE, VOLUME 96, NUMBER 1 (2020)
Structured heterogeneity in Scottish stops over the twentieth century 123
Kessinger, Rachel H., and Sheila E. Blumstein. 1997. Effects of speaking rate onvoice-onset time in Thai, French, and English. Journal of Phonetics 25.143–68. DOI:10.1006/jpho.1996.0039.
Kim, Sahyang; Jiseung Kim; and Taehong Cho. 2018. Prosodic-structural modulation ofstop voicing contrast along the VOT continuum in trochaic and iambic words in Amer-ican English. Journal of Phonetics 71.65–80. DOI: 10.1016/j.wocn.2018.07.004.
Klatt, Dennis H. 1975. Voice onset time, frication, and aspiration in word-initial conso-nant clusters. Journal of Speech and Hearing Research 18.686–706. DOI: 10.1044/jshr.1804.686.
Kleinschmidt, Dave F. 2019. Structure in talker variability: How much is there and howmuch can it help? Language, Cognition and Neuroscience 34.43–68. DOI: 10.1080/23273798.2018.1500698.
Kuznetsova, Alexandra; Per B. Brockhoff; and Rune H. B. Christensen. 2017.lmerTest package: Tests in linear mixed effects models. Journal of Statistical Software82.1–26. DOI: 10.18637/jss.v082.i13.
Labov, William. 2001. Principles of linguistic change, vol. 2: Social factors. Oxford:Blackwell.
Lenth, Russell. 2018. emmeans: Estimated marginal means, aka least-squares means. Rpackage version 1.3.1. Online: https://CRAN.R-project.org/package=emmeans.
Liberman, Alvin M.; Pierre C. Delattre; and Franklin S. Cooper. 1958. Some cuesfor the distinction between voiced and voiceless stops in initial position. Language andSpeech 1.153–67. DOI: 10.1177/002383095800100301.
Lisker, Leigh. 1986. ‘Voicing’ in English: A catalogue of acoustic features signaling /b/versus /p/ in trochees. Language and Speech 29.3–11. DOI: 10.1177/002383098602900102.
Lisker, Leigh, and Arthur S. Abramson. 1964. A cross-language study of voicing in ini-tial stops: Acoustical measurements. Word 20.384–422. DOI: 10.1080/00437956.1964.11659830.
Lisker, Leigh, and Arthur S. Abramson. 1967. Some effects of context on voice onsettime in English stops. Language and Speech 10.1–28. DOI: 10.1177/002383096701000101.
Luce, Paul A., and Jan Charles-Luce. 1985. Contextual effects on vowel duration, clo-sure duration, and the consonant/vowel ratio in speech production. The Journal of theAcoustical Society of America 78.1949–57. DOI: 10.1121/1.392651.
Masuya, Yoshiro. 1997. Voice onset time of the syllable initial /p/, /t/ and /k/ followed byan accented vowel in Lowland Scottish English. Phonetics and phonology: Selectedpapers, 139–72. Tokyo: Kobian Shobo.
Milroy, James, and Lesley Milroy. 1985. Authority in language: Investigating languageprescription and standardisation. London: Routledge.
Ohala, John J. 1989. Sound change is drawn from a pool of synchronic variation. Lan-guage change: Contributions to the study of its causes, ed. by Leiv Egil Breivik andErnst Håkon Jahr, 173–98. Berlin: Mouton de Gruyter.
Pinheiro, Jose C., and Douglas M. Bates. 2000. Mixed-effects models in S and S-PLUS.New York: Springer.
Purnell, Thomas; Joseph Salmons; Dilara Tepeli; and Jennifer Mercer. 2005. Struc-tured heterogeneity and change in laryngeal phonetics: Upper Midwestern final obstru-ents. Journal of English Linguistics 33.307–38. DOI: 10.1177/0075424205285637.
Repp, Bruno H. 1982. Phonetic trading relations and context effects: New experimental ev-idence for a speech mode of perception. Psychological Bulletin 92.81–110. DOI: 10.1037/0033-2909.92.1.81.
Salmons, Joseph. 2020. Germanic laryngeal phonetics and phonology. The Cambridgehandbook of Germanic linguistics, ed. by Michael T. Putnam and B. Richard Page.Cambridge: Cambridge University Press, to appear.
Sankoff, Gillian, and Hélène Blondeau. 2007. Language change across the lifespan: /r/in Montreal French. Language 83.560–88. DOI: 10.1353/lan.2007.0106.
Schertz, Jessamyn; Taehong Cho; Andrew Lotto; and Natasha Warner. 2015. Indi-vidual differences in phonetic cue use in production and perception of a non-nativesound contrast. Journal of Phonetics 52.183–204. DOI: 10.1016/j.wocn.2015.07.003.

Scobbie, James M. 2006. Flexibility in the face of incompatible English VOT systems. Lab-oratory phonology 8: Varieties of phonological competence, ed. by Louis Goldstein,Douglas H. Whalen, and Catherine Best, 367–92. Berlin: Mouton de Gruyter.
Shultz, Amanda A.; Alexander L. Francis; and Fernando Llanos. 2012. Differentialcue weighting in perception and production of consonant voicing. The Journal of theAcoustical Society of America 132.EL95–EL101. DOI: 10.1121/1.4736711.
Sonderegger, Morgan; Max Bane; and Peter Graff. 2017. The medium-term dynam-ics of accents on reality television. Language 93.598–640. DOI: 10.1353/lan.2017.0038.
Sonderegger, Morgan, and Joseph Keshet. 2012. Automatic measurement of voice onsettime using discriminative structured prediction. The Journal of the Acoustical Society ofAmerica 132.3965–79. DOI: 10.1121/1.4763995.
Sonderegger, Morgan; Jane Stuart-Smith; Thea Knowles; Rachel Macdonald;and Tamara Rathcke. 2019. Structured heterogeneity in Scottish stops over the twen-tieth century. Open Science Foundation project. DOI: 10.17605/OSF.IO/JCHUP.
Stuart-Smith, Jane. 2020. Changing perspectives on /s/ and gender over time in Glasgow.Linguistics Vanguard 6(s1):20180064. DOI: 10.1515/lingvan-2018-0064.
Stuart-Smith, Jane; Brian José; Tamara Rathcke; Rachel Macdonald; and EleanorLawson. 2017. Changing sounds in a changing city: An acoustic phonetic investigationof real-time change over a century of Glaswegian. Language and a sense of place: Stud-ies in language and region, ed. by Chris Montgomery and Emma Moore, 38–65. Cam-bridge: Cambridge University Press. DOI: 10.1017/9781316162477.004.
Stuart-Smith, Jane, and Eleanor Lawson. 2017. Scotland: Glasgow and the Central Belt.Listening to the past: Audio records of accents of English, ed. by Raymond Hickey,171–98. Cambridge: Cambridge University Press.
Stuart-Smith, Jane; Gwilym Pryce; Claire Timmins; and Barrie Gunter. 2013. Tele-vision can also be a factor in language change: Evidence from an urban dialect. Lan-guage 89.501–36. DOI: 10.1353/lan.2013.0041.
Stuart-Smith, Jane; Morgan Sonderegger; Rachel Macdonald; and TamaraRathcke. 2015. The private life of stops: VOT in a real-time corpus of spontaneousGlaswegian. Laboratory Phonology 6.505–49. DOI: 10.1515/lp-2015-0015.
Stuart-Smith, Jane, and Claire Timmins. 2010. The role of the individual in languagechange. Language and identities, ed. by Carmen Llamas and Dominic Watt, 39–54. Ed-inburgh: Edinburgh University Press.
Stuart-Smith, Jane; Claire Timmins; and Fiona Tweedie. 2007. ‘Talkin’ Jockney’?Variation and change in Glaswegian accent. Journal of Sociolinguistics 11.221–60.DOI: 10.1111/j.1467-9841.2007.00319.x.
Summerfield, Quentin. 1975. Aerodynamics versus mechanics in the control of voicingonset in consonant-vowel syllables. Speech Perception 2.61–72.
Tagliamonte, Sali A., and Alexandra D’Arcy. 2009. Peaks beyond phonology: Adoles-cence, incrementation, and language change. Language 85.58–108. DOI: 10.1353/lan.0.0084.
Theodore, Rachel M.; Joanne L. Miller; and David DeSteno. 2009. Individual talkerdifferences in voice-onset-time: Contextual influences. The Journal of the AcousticalSociety of America 125.3974–82. DOI: 10.1121/1.3106131.
Tillery, Jan, and Guy Bailey. 2003. Approaches to real time in dialectology and sociolin-guistics. World Englishes 22.351–65. DOI: 10.1111/j.1467-971X.2003.00305.x.
Watt, Dominic. 2002. ‘I don’t speak with a Geordie accent, I speak, like, the Northern ac-cent’: Contact-induced levelling in the Tyneside vowel system. Journal of Sociolin-guistics 6.44–63. DOI: 10.1111/1467-9481.00176.
Weinreich, Uriel; William Labov; and Marvin I. Herzog. 1968. Empirical foundationsfor a theory of language change. Directions for historical linguistics, ed. by Winfred P.Lehmann and Yakov Malkiel, 95–195. Austin: University of Texas Press.
Wells, John C. 1982. Accents of English 2: The British Isles. Cambridge: Cambridge Uni-versity Press.
Westbury, John R., and Patricia A. Keating. 1986. On the naturalness of stop consonantvoicing. Journal of Linguistics 22.145–66. DOI: 10.1017/S0022226700010598.
124 LANGUAGE, VOLUME 96, NUMBER 1 (2020)

Structured heterogeneity in Scottish stops over the twentieth century 125
Yao, Yao. 2007. Closure duration and VOT of word-initial voiceless plosives in English inspontaneous connected speech. UC Berkeley Phonology Lab Annual Report 3.183–225. Online: https://escholarship.org/uc/item/1hs7h769.
Yao, Yao. 2009. Understanding VOT variation in spontaneous speech. Current numbers inunity and diversity of languages, ed. by Miok Pak, 1122–37. Seoul: Linguistic Societyof Korea.
Zue, Victor. 1976. Acoustic characteristics of stop consonants: A controlled study. Bloom-ington: Indiana University Linguistics Club.
[[email protected]] (Sonderegger) [Received 11 February 2019;[[email protected]] (Stuart-Smith) revision invited 8 June 2019;[[email protected]] (Knowles) revision received 5 July 2019;[[email protected]] (Macdonald) accepted 18 August 2019][[email protected]] (Rathcke)