MORE THAN MINING - Royal Bafokeng Platinum · > MORE THAN MINING ROYAL ... > Linda de Beer ......
76
Annual Financial Statements 2016 MORE THAN MINING
Transcript of MORE THAN MINING - Royal Bafokeng Platinum · > MORE THAN MINING ROYAL ... > Linda de Beer ......

> MO
RE TH
AN
MIN
ING
RO
YAL B
AFO
KEN
G PLATIN
UM
AN
NU
AL FIN
AN
CIA
L STATEMEN
TS 2016
Annual Financial Statements 2016
MORE THAN MINING


ContentsGROUP AND COMPANY REPORTS
Statement of responsibility by the Board of Directors
2
Certificate of the Company Secretary 2
Audit and Risk Committee report 3 — 4
Directors’ report for the Group and Company 5 — 8
INDEPENDENT AUDITOR’S REPORT 9 — 13
CONSOLIDATED ANNUAL FINANCIAL STATEMENTS 14 — 62
Consolidated statement of financial position
14
Consolidated statement of comprehensive income
15
Consolidated statement of changes in equity
16
Consolidated statement of cash flows 17
Notes to the consolidated annual financial statements including accounting policies, critical accounting estimates and judgements
18 — 62
COMPANY ANNUAL FINANCIALSTATEMENTS, ACCOUNTING POLICIES AND NOTES
63 — 70
NON-IFRS MEASURES 71
ROYAL BAFOKENG PLATINUM GROUP STRUCTURE 72
ADMINISTRATION IBC
RISK
Financial risk management 53
UNRECOGNISED ITEMS
Guarantees 37
Operating and capital commitments 38
Contingent liabilities 38
ENVIRONMENTAL REHABILITATION
Environmental trust deposits 27
Restoration and rehabilitation provision 36
Guarantees issued 37
HOW NUMBERS ARE CALCULATED
Segment information 58 — 61
OTHER INFORMATION
Related party transactions 47
Share-based payments 41 — 44
Impairment 46
Dividend per share 53
Earnings per share 62
Group structure 72
RBPLAT EMPLOYEE HOUSING
Employee housing loan receivable 28
Employee housing benefit 29
Insurance investment 29
Employee housing assets 29
PIC housing facility 35
Net finance income 41
Royal Bafokeng Platinum Annual Financial Statements 2016 I 1

Statement of responsibility by the Board of Directors
Certificate of the Company Secretary
The directors are responsible for the preparation, integrity and fair presentation of the annual financial statements of the Royal Bafokeng Platinum Group. The financial statements presented on pages 14 to 70 have been prepared in accordance with International Financial Reporting Standards as issued by the International Accounting Standards Board (IASB) and IFRIC interpretations (collectively IFRS), the SAICA Financial Reporting Guidelines as issued by the Accounting Practices Committee, Financial Pronouncements as issued by the Financial Reporting Standards Council and the Companies Act 71 of 2008 of South Africa and include amounts based on judgements and estimates made by management.
The directors consider that in preparing the financial statements they have used the most appropriate accounting policies, consistently applied and supported by reasonable and prudent judgements and estimates. The directors are satisfied that the information contained in the financial statements fairly presents the results of operations for the year and the financial position of the Group at year-end.
The directors have responsibility for ensuring that proper records are kept to enable the preparation of the financial statements in compliance with relevant legislation.
The going concern basis of accounting has been adopted in preparing the financial statements. The directors have no reason to believe that the Company and the Group will not be a going concern in the foreseeable future.
The annual financial statements were audited by PricewaterhouseCoopers Inc. who expressed an unqualified opinion thereon.
Board approval of annual financial statementsThe annual financial statements for the year ended 31 December 2016 are set out on pages 14 to 70. The preparation thereof was supervised by the Financial Director, Martin Prinsloo, who is a qualified chartered accountant CA(SA), and approved by the Board of Directors on 21 February 2017 and are signed on its behalf by:
KD Moroka SC SD PhiriChairman Chief Executive Officer
I, the undersigned, certify that to the best of my knowledge and in my capacity as the Company Secretary, the Company has lodged all such returns with the Companies Intellectual and Property Commission in compliance with the Companies Act 71 of 2008.
All the filed required returns and notices are true, correct and up to date.
LC JoosteCompany Secretary
21 February 2017
2 I Royal Bafokeng Platinum Annual Financial Statements 2016
Audit and Risk Committee report
This report is provided by RBPlat’s independent Audit and Risk Committee for the financial year ended 31 December 2016.
The Committee has discharged its responsibilities as mandated by the Board, its statutory duties in compliance with the Companies Act 71 of 2008, and the King IV principles applicable to audit committees. The Committee’s terms of reference, which can be found on the Company’s website, www.bafokengplatinum.co.za, are aligned with the above legislation, regulations and principles.
Composition, meetings and assessmentThe Committee’s membership was made up of four independent non-executive directors during the year under review, namely: > Linda de Beer (Chairman) > Robin Mills > Mark Moffett > Louisa Stephens.
A brief profile of each of the members can be viewed on page 62 of the 2016 integrated report and the Company’s website. The Committee met on six occasions during the year under review and all members were present at each of these scheduled meetings.
Key members of management attend meetings of the Committee by invitation. During the year, closed sessions were also held for Committee members only, as well as with internal audit, external audit, risk, finance and management.
The Committee and its Chairman are assessed annually. In this regard an independent evaluation was undertaken by the Institute of Directors in 2016.
Execution of functionsThe Committee has executed its duties and responsibilities during the financial year in accordance with its mandate as it relates to the Group’s accounting, internal auditing, internal control, risk management and financial reporting practices.
The key areas of responsibility are: > performing its statutory duties as prescribed by the Companies Act > considering the performance of the Company on a quarterly basis > considering the solvency and liquidity of the Company, on a quarterly basis, for recommendation to the Board > overseeing, assessing and approving the internal and external audit appointments, scope of work planned for the year, effectiveness and independence
> considering the enterprise risk management framework and policy, risk appetite and tolerances as well as the risk profile and recommending to the Board for approval
> overseeing the governance in respect of reporting, assurance, IT, risk and compliance. This includes a specific duty to ensure integrated/combined assurance over the integrated report and integrated reporting process
> overseeing and assessing corporate governance, including the effectiveness of the internal control environment > considering the skills and resources of the finance function in general and the Financial Director specifically > recommending to the Board for approval, the interim and annual financial statements as well as the integrated report.
In addition, the full Board also holds an annual workshop in January of each year to satisfy itself of the integrity of the integrated report.
In carrying out these responsibilities, the Committee is satisfied that it has fulfilled its duty to the Board and has assisted the Board in carrying out the related areas of duties to all stakeholders. Areas of specific focus are listed below:
Committee activitiesThe principal matters attended to by the Committee during the year included: > Annual financial statements and integrated reportThe Committee recommended the annual financial statements and the 2016 integrated report to the Board for approval.
> Independence and reappointment of the external auditorThe Committee is satisfied that the external audit firm and engagement partner is independent. To this end the Committee considered fees for non-audit services paid to the external auditor, in terms of its non-audit services policy. During 2016 PwC was reappointed as external auditors after a tender process.
> Independence and reappointment of the internal auditorEY was appointed as internal auditors. However, the Committee reconsidered this appointment mid-year and reappointed KPMG as internal auditors to complete the approved 2016 Internal Audit Plan.
> Evaluation of the expertise and experience of the Financial Director and the finance functionThe Committee is satisfied with the experience, expertise and adequacy of resources within the finance function and of the Financial Director.
Royal Bafokeng Platinum Annual Financial Statements 2016 I 3

Audit and Risk Committee report continued
> Solvency and liquidityBased on the quarterly solvency and liquidity tests performed, the Committee was comfortable in its declaration to the Board that the Company and the Group is a going concern.
> Effectiveness of internal controlsUsing the Company’s combined assurance model and the related assurance obtained from the various assurance providers in the three lines of defence as basis, the Committee recommended to the Board that it issues a statement as to the adequacy of the Company’s internal control environment.
> Information technology (IT) governanceThe Committee provides oversight on IT governance and oversaw the implementation and review of all relevant IT governance policies, processes and control frameworks while ensuring compliance with all the standards adopted by the Group during the year under review.
Comments on key audit matters, addressed by PwC in its external auditor’s reportIn order to provide stakeholders with further insights into its activities and considerations around key audit matters as reported by the external auditors, the Committee wishes to elaborate on these important aspects.
Impairment of goodwillIn 2015, when an impairment amounting to R4.5 billion was made, significant Committee time and effort was afforded to the matter and the Committee was comfortable at the time that the quantum of the impairment was adequate. Goodwill is tested annually for impairment and therefore the Committee again focused on this area in 2016, recognising that there were no structural changes either to the business, which was performing better than in 2015, the industry, or the long-term view on the basket price, despite its sensitivity, particularly the Rand/Dollar exchange rate portion thereof, to short-term political and economic influences. Consideration was also given to the placing of RBPlat on the cost curve and alignment was sought with other industry players’ assessment of these assumptions, as well as the fact that in principle Styldrift I and II also justify joint consideration as it operates under a single mining licence.
The Committee assessed the methodology, assumptions and judgements applied by management as set out in Note 5 of the annual financial statements. Furthermore the Committee discussed the matter with the external auditors to understand their related audit processes and views. Following our assessment of the impairment indicators, we concluded that no impairment was required in 2016.
Cut-off development and production phase of miningManagement developed an IFRS compliant accounting policy on the recognition of capital versus operational expenditure. Styldrift I is currently in development phase with costs and related incidental revenue being capitalised to the capital work in progress asset. The assessment as to whether Styldrift I is ready to operate as intended by management requires judgement in evaluating the commercial production indicators (as detailed in Note 3 to the annual financial statements). The Committee will pay close attention to this assessment over the next 12 to 18 months.
L de BeerChairman of the Audit and Risk Committee
21 February 2017
4 I Royal Bafokeng Platinum Annual Financial Statements 2016

Directors’ report for Group and Company
Principal activities and profileRBPlat was incorporated in July 2008 by Royal Bafokeng Holdings (RBH), the investment arm of the Royal Bafokeng Nation (RBN). When the Bafokeng Rasimone Platinum Mine Joint Venture (BRPM JV) between RBH and Anglo American Platinum Limited was restructured in 2009, operational control of the Joint Venture vested in RBPlat. RBPlat, through the BRPM JV, operates BRPM and is developing the Styldrift I project. RBPlat’s significant reserves and resources can sustain operations for at least the next 60 years.
Results and dividendThe Group’s and Company’s financial results are set out on pages 14 to 70. These annual financial statements have been prepared using appropriate accounting policies, in accordance with International Financial Reporting Standards as issued by the International Accounting Standards Board (IASB) and IFRIC interpretations (collectively IFRS), the SAICA Financial Reporting Guidelines as issued by the Accounting Practices Committee, financial pronouncements as issued by the Financial Reporting Standards Council (FRSC) and the Companies Act 71 of 2008, the JSE Listings Requirements and include amounts based on judgements and estimates made by management.
We do not intend declaring a dividend until Styldrift I is operating at a steady state. Thereafter, a market-related dividend cover ratio is anticipated.
Review of the business, future developments and post-statement of financial position eventsThe operating context on page 66 of our 2016 integrated report provides details of the Group’s operating environment. The Group’s operational performance for 2016 is discussed on pages 86 to 144 and information on our future outlook can be found throughout the 2016 integrated report. The Financial capital section on pages 86 to 95 of the 2016 integrated report, together with these annual financial statements, provide a full description of our financial performance for the year.
Going concernThe directors believe that the Group and the Company have sufficient resources to continue as a going concern in the foreseeable future.
Corporate governanceA report on our corporate governance and our application of the principles of King IV is included in our 2016 integrated reporting.
Health, safety, environment and communityInformation on our health, safety and environmental performance and community participation is provided under the Natural, Human and Social capitals in our 2016 integrated report.
Employee policies and involvementThe Group’s policies and performance regarding employee involvement, disabled employees, labour relations and employee share schemes are provided under Remuneration on pages 54 to 59 of our 2016 integrated report.
Material borrowingsFor material borrowings and facilities please refer to Notes 14 and 19 of the annual financial statements on pages 32 and 35.
Royal Bafokeng Platinum Annual Financial Statements 2016 I 5

Directors’ report for Group and Company continued
DirectorateThe directors for the year under review were:
Director Position First appointed
Standing for re-election and election
Elected or re-elected at the last AGM
David Wilson Non-executive director 29 May 2014 YesKgomotso Moroka Chairman and independent
non-executive director1 June 2010 Yes
Linda de Beer Independent non-executive director 1 June 2010 YesLouisa Stephens Independent non-executive director 22 September 2014 YesMark Moffett Independent non-executive director 22 September 2014 YesMartin Prinsloo Executive director 1 March 2009Mike Rogers Independent non-executive director 7 December 2009 YesRobin Mills Independent non-executive director 20 September 2010Steve Phiri Executive director 1 April 2010Thoko Mokgosi-Mwantembe Independent non-executive director 5 November 2014 YesVelile Nhlapo Non-executive director 24 November 2015 Yes
Directors’ and officers’ disclosure of interests in contractsDuring the period under review and at the time of signing off the 2016 integrated report, no contracts were entered into in which directors and officers of the Company had an interest and which would affect the business of the Group.
Service contracts of directors and prescribed officersThe Company has not entered into any contracts other than the normal employment service contracts with executive directors and other prescribed officers.
Special resolutionsDetails of the ordinary and special resolutions to be approved by shareholders at the next Annual General Meeting (AGM) are outlined in the Notice of Annual General Meeting (pages 172 to 180 of the 2016 integrated annual report) and are available online. Furthermore, shareholders authorised the directors, by way of an ordinary resolution, to control all unissued ordinary shares and to allot and issue up to 5% of such shares subject to the limitations specified in the Memorandum of Incorporation (MOI) and the JSE Listings Requirements. A special resolution to authorise directors will again be tabled at the next AGM.
Shareholders approved a new two-year special resolution governing financial assistance to companies within the RBPlat Group effective from 13 April 2016.
The Company has not exercised the general authority granted to it by shareholders to buy back issued ordinary shares. Shareholders will be requested to renew this authority at the next AGM.
Power of the BoardSubject to RBPlat’s MOI, South African legislation and to any directions given by special resolution, the business of the Group is managed by the Board which may exercise all the powers of the Group. The MOI contains specific provisions concerning the power of RBPlat to borrow money and also the power to purchase its own shares. The Board has been authorised to allot and issue ordinary shares up to a maximum of 5% of the issued share capital of the Company and a further 10% of the issued share capital in return for cash.
These powers are exercised in terms of its MOI and resolutions passed at the AGM held on 13 April 2016. No shares have been issued under this authority in 2016.
RBPlat subsidiary companiesThe following companies are wholly owned subsidiaries of Royal Bafokeng Platinum Limited: > Royal Bafokeng Resources Proprietary Limited (RBR) > Royal Bafokeng Platinum Management Services Proprietary Limited (RBP MS) > Bafokeng Rasimone Management Services Proprietary Limited (100% held indirectly via RBR) > Royal Bafokeng Resources Properties (RF) Proprietary Limited (RBRP) (100% held indirectly via RBR).
6 I Royal Bafokeng Platinum Annual Financial Statements 2016

Directors’ remunerationDetails of directors’ remuneration and related payments can be found in Note 31 of the notes to the annual financial statements on page 48.
Share capitalFull details of the authorised and issued share capital of the Company are set out in Note 15 to the annual financial statements. As at 31 December 2016, there were 195 836 465 ordinary shares in issue at a par value of R0.01. Treasury shares held by the Company are outlined in the notes to the annual financial statements on page 33.
Major shareholdersThe following shareholders were the registered beneficial holders of 5% or more of the issued ordinary shares in the Company at 31 December 2016:
Beneficial shareholders holding of 5% or moreNumber of
shares %
Royal Bafokeng Platinum Holdings Proprietary Limited 101 333 105 51.74Rustenburg Platinum Mines Limited 22 404 550 11.44Kagiso Asset Management Proprietary Limited 14 514 797 7.41
Directors' interests in Royal Bafokeng Platinum Limited
Number of shares
2016 beneficial 2015 beneficial
Direct Indirect Direct Indirect
Steve Phiri* 160 513 536 965 173 013 232 897 Martin Prinsloo* 91 270 355 142 141 270 145 847Total 251 783 892 107 314 283 378 744* Executive directors
There has been no change to directors’ interests since the year-end of the Company and the issuing of this report.
Share dealingsDuring the year under review directors and Company Secretary disposed of RBPlat shares on the market as follows:
Sharessold
Share price Date
Steve Phiri 41 486 R37.51 1 April 20166 500 R49.17 2 September 20166 000 R49.50 5 September 2016
Martin Prinsloo 32 690 R37.51 1 April 201650 000 R53.03 2 August 2016
Exercised 80 350 share options at a strike price of R36.30 80 350 R52.61 2 August 2016Share dealings by directors of a major subsidiary*Neil Carr (Executive Head: Operations)* 23 909 R37.51 1 April 2016
12 000 R50.00 20 September 2016Vicky Tlhabanelo (Executive: Human Resources)* 25 568 R37.51 1 April 2016
20 000 R50.00 7 September 2016Lester Jooste (Company Secretary) 12 045 R37.51 1 April 2016
Significant agreementsAmended BRPM Joint Venture AgreementThe BRPM Joint Venture Agreement was entered into on 12 August 2009 by the RBN, RBR and Rustenburg Platinum Mines (RPM). It replaced the previous Joint Venture Agreement concluded in August 2002. It sets out the terms and conditions on which the BRPM JV will operate and deals with matters such as establishment, duration and dissolution of the Joint Venture, the participating interests of the Joint Venture parties and their contributions to the Joint Venture, including mining infrastructure and mineral rights, management and control of the Joint Venture, minority protection for RPM, operational concerns such as the appointment of the operator, tailings, insurance, mine health and safety, environmental issues, how RPM’s share of concentrate is dealt with, funding of the Joint Venture, the distribution policy, accounting and financial concerns, warranties, restrictions on disposals of participation interests and mining rights, dispute resolution and general or miscellaneous concerns. The BRPM JV includes the BRPM operations, Styldrift I and Styldrift II. RBR has a 67% participation interest in the BRPM JV and RPM has the remaining 33% participation interest in the BRPM JV. The BRPM JV is an unincorporated joint venture and is consolidated into the Group results.
Royal Bafokeng Platinum Annual Financial Statements 2016 I 7

Directors’ report for Group and Company continued
Services agreementAs part of the BRPM JV restructuring a services agreement was entered into between RBP MS, RBR and RPM on 9 September 2009 in terms of which RBP MS was appointed as operator of BRPM JV in place of Anglo Platinum Management Services Proprietary Limited (AMS) with effect from 4 January 2010. In terms of this agreement RBP MS was appointed to provide mining services as an independent contractor and as an agent of the Joint Venture parties.
Disposal of concentrate agreementThe Disposal of Concentrate Agreement regulates the terms on which RBR disposes of its share of the concentrate produced by the BRPM JV to RPM. The agreement provides for RBR’s share of the concentrate produced by the BRPM JV to be sold to, and processed by RPM. RBR is responsible for delivery of the concentrate to RPM’s smelting and refining facility situated at Rustenburg, the costs of which are borne by the BRPM JV. Risk and ownership passes to RPM once the concentrate leaves the gates of the concentrator plant.
RBR is obliged to sell and RPM is obliged to purchase 50% of the concentrate of the BRPM JV up until 11 August 2022, the optional termination date in terms of the disposal of concentrate agreement. Thereafter, while RBR retains the right to sell 50% of the BRPM JV concentrate to RPM for the life of BRPM JV, it is also entitled to terminate the relationship on 11 August 2022 by giving written notice by no later than 11 August 2020. Subsequent to this date it is also entitled to terminate the relationship by providing written notice two years prior to each fifth anniversary of 11 August 2022. In respect of 17% of RBR’s 67% share of the concentrate, RPM is entitled to terminate the relationship after 11 August 2012 on the occurrence of certain events. None of these events have occurred or are expected to occur in the near term.
Impala Platinum royalty agreementsThese agreements regulate the terms on which RBR and RPM dispose of their respective shares of the UG2 ore mined by Impala Platinum from its 6 and 8 shafts and the UG2 and Merensky ore mined from its 20 shaft. A royalty equivalent to 17.5% of gross PGM, gold, nickel and copper revenue will be paid for the UG2 and Merensky ore mined from the 20 shaft area. The 6 and 8 shaft royalty agreement was renegotiated in 2013 and is linked to market conditions and therefore the profitability of the Impala Rustenburg operations. In terms of the amended royalty agreement for 6 and 8 shafts, Impala will pay the BRPM JV a royalty that is based upon a factor that is linked to the Impala Rustenburg operations’ gross margin with a minimum of 5% and a maximum of 25% of gross PGM, gold, nickel and copper revenue.
The mining area covered by the royalty arrangement has expanded during the year by the incorporation of an additional area to access and mine from Impala’s 6 shaft extending the duration of the royalty income stream mined from 6 shaft area by five years.
No further royalties will be received from the 8 shaft agreement on the royalty area as it was mined out in 2016.
We anticipate earning royalties from the 6 shaft agreement up to 2026 and from the 20 shaft agreement for approximately 30 years.
8 I Royal Bafokeng Platinum Annual Financial Statements 2016
Independent auditor’s report to the shareholders of Royal Bafokeng Platinum Limitedfor the year ended 31 December 2016
Report on the audit of the consolidated and separate financial statements Our opinion In our opinion, the consolidated and separate financial statements present fairly, in all material respects, the consolidated and separate financial position of Royal Bafokeng Platinum Limited (the Company) and its subsidiaries (together the Group) as at 31 December 2016, and its consolidated and separate financial performance and its consolidated and separate cash flows for the year then ended in accordance with International Financial Reporting Standards (IFRS) and the requirements of the Companies Act of South Africa.
What we have auditedRoyal Bafokeng Platinum Limited’s consolidated and separate financial statements, set out on pages 14 to 70, comprise: > the consolidated and separate statements of financial position as at 31 December 2016 > the consolidated and separate statements of comprehensive income for the year then ended > the consolidated and separate statements of changes in equity for the year then ended > the consolidated and separate statements of cash flows for the year then ended > the notes to the consolidated and separate financial statements, which include a summary of significant accounting policies.
Basis for opinion We conducted our audit in accordance with International Standards on Auditing (ISAs). Our responsibilities under those standards are further described in the Auditor’s Responsibilities for the Audit of the Consolidated and Separate Financial Statements section of our report.
We believe that the audit evidence we have obtained is sufficient and appropriate to provide a basis for our opinion.
IndependenceWe are independent of the Group in accordance with the Independent Regulatory Board for Auditors Code of Professional Conduct for Registered Auditors (IRBA Code) and other independence requirements applicable to performing audits of financial statements in South Africa. We have fulfilled our other ethical responsibilities in accordance with the IRBA Code and in accordance with other ethical requirements applicable to performing audits in South Africa. The IRBA Code is consistent with the International Ethics Standards Board for Accountants Code of Ethics for Professional Accountants (Parts A and B).
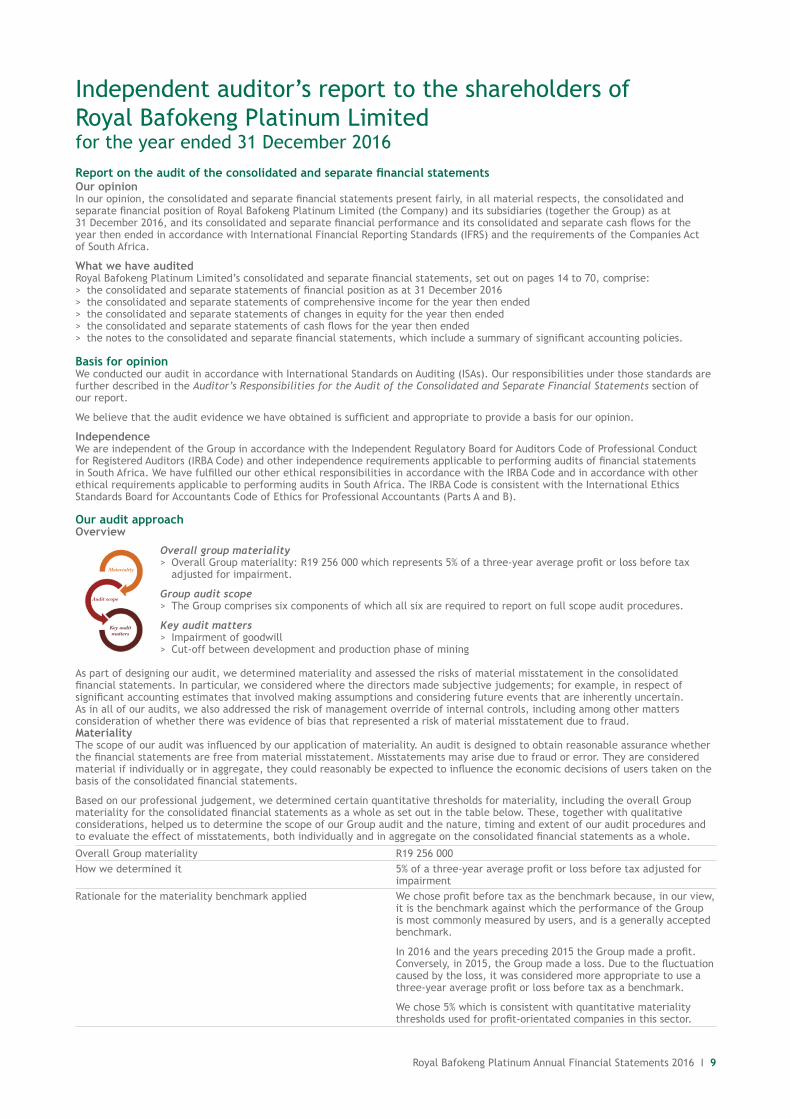
Our audit approachOverview
Overall group materiality > Overall Group materiality: R19 256 000 which represents 5% of a three-year average profit or loss before tax adjusted for impairment.
Group audit scope > The Group comprises six components of which all six are required to report on full scope audit procedures.
Key audit matters > Impairment of goodwill > Cut-off between development and production phase of mining
As part of designing our audit, we determined materiality and assessed the risks of material misstatement in the consolidated financial statements. In particular, we considered where the directors made subjective judgements; for example, in respect of significant accounting estimates that involved making assumptions and considering future events that are inherently uncertain. As in all of our audits, we also addressed the risk of management override of internal controls, including among other matters consideration of whether there was evidence of bias that represented a risk of material misstatement due to fraud.MaterialityThe scope of our audit was influenced by our application of materiality. An audit is designed to obtain reasonable assurance whether the financial statements are free from material misstatement. Misstatements may arise due to fraud or error. They are considered material if individually or in aggregate, they could reasonably be expected to influence the economic decisions of users taken on the basis of the consolidated financial statements.
Based on our professional judgement, we determined certain quantitative thresholds for materiality, including the overall Group materiality for the consolidated financial statements as a whole as set out in the table below. These, together with qualitative considerations, helped us to determine the scope of our Group audit and the nature, timing and extent of our audit procedures and to evaluate the effect of misstatements, both individually and in aggregate on the consolidated financial statements as a whole.
Overall Group materiality R19 256 000How we determined it 5% of a three-year average profit or loss before tax adjusted for
impairmentRationale for the materiality benchmark applied We chose profit before tax as the benchmark because, in our view,
it is the benchmark against which the performance of the Group is most commonly measured by users, and is a generally accepted benchmark.
In 2016 and the years preceding 2015 the Group made a profit. Conversely, in 2015, the Group made a loss. Due to the fluctuation caused by the loss, it was considered more appropriate to use a three-year average profit or loss before tax as a benchmark.
We chose 5% which is consistent with quantitative materiality thresholds used for profit-orientated companies in this sector.
Materiality
Audit scope
Key auditmatters
Royal Bafokeng Platinum Annual Financial Statements 2016 I 9
Independent auditor’s report to the shareholders of Royal Bafokeng Platinum Limited continuedfor the year ended 31 December 2016
How we tailored our Group audit scope We tailored the scope of our audit in order to perform sufficient work to enable us to provide an opinion on the consolidated financial statements as a whole, taking into account the structure of the Group, the accounting processes and controls, and the industry in which the Group operates.
The Group consists of six components which are considered to be within the full scope audit requirements. The components within the scope of our work can be summarised in the table below which depicts the percentage contribution to the Group’s results: > Group revenue 100% > Group profit before tax 100% > Group assets 100%.
Key audit matters Key audit matters are those matters that, in our professional judgement, were of most significance in our audit of the consolidated and separate financial statements of the current period. These matters were addressed in the context of our audit of the consolidated and separate financial statements as a whole, and in forming our opinion thereon, and we do not provide a separate opinion on these matters.
The following key audit matters relate to the consolidated financial statements. We have determined that there are no key audit matters in respect of the separate financial statements to communicate in our report.
Key audit matters How our audit addressed the key audit matter
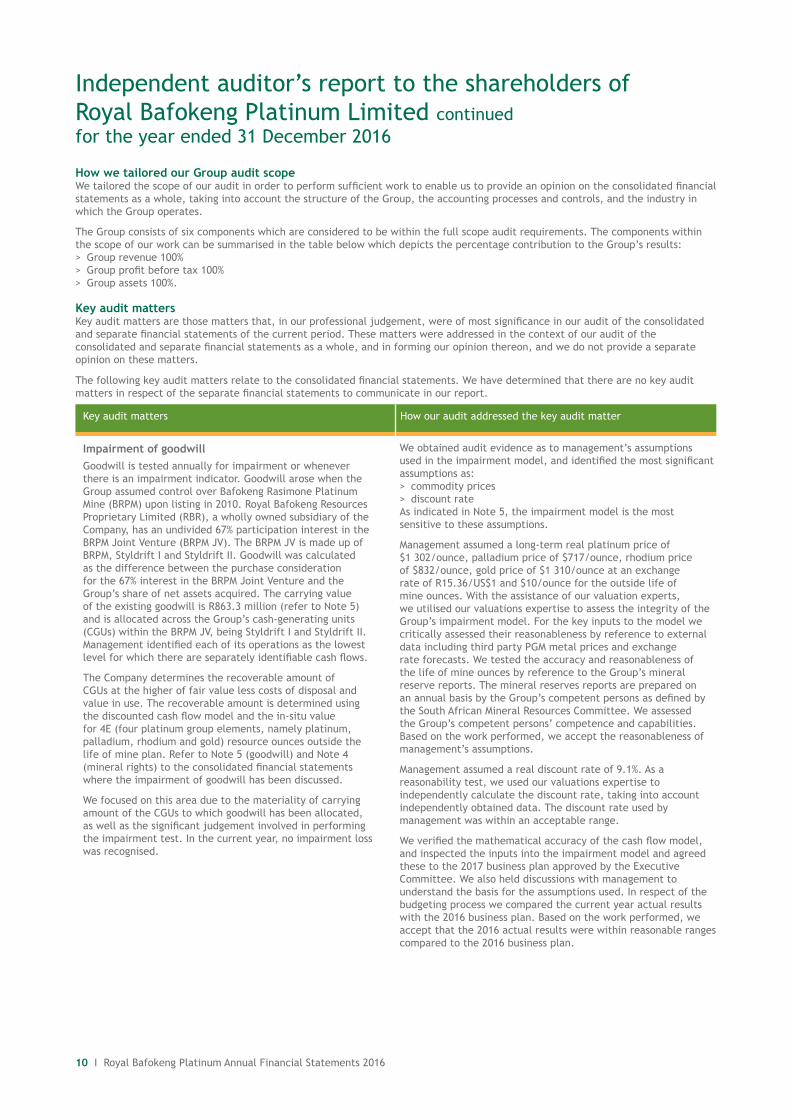
Impairment of goodwill We obtained audit evidence as to management’s assumptions used in the impairment model, and identified the most significant assumptions as: > commodity prices > discount rate
As indicated in Note 5, the impairment model is the most sensitive to these assumptions.
Management assumed a long-term real platinum price of $1 302/ounce, palladium price of $717/ounce, rhodium price of $832/ounce, gold price of $1 310/ounce at an exchange rate of R15.36/US$1 and $10/ounce for the outside life of mine ounces. With the assistance of our valuation experts, we utilised our valuations expertise to assess the integrity of the Group’s impairment model. For the key inputs to the model we critically assessed their reasonableness by reference to external data including third party PGM metal prices and exchange rate forecasts. We tested the accuracy and reasonableness of the life of mine ounces by reference to the Group’s mineral reserve reports. The mineral reserves reports are prepared on an annual basis by the Group’s competent persons as defined by the South African Mineral Resources Committee. We assessed the Group’s competent persons’ competence and capabilities. Based on the work performed, we accept the reasonableness of management’s assumptions.
Management assumed a real discount rate of 9.1%. As a reasonability test, we used our valuations expertise to independently calculate the discount rate, taking into account independently obtained data. The discount rate used by management was within an acceptable range.
We verified the mathematical accuracy of the cash flow model, and inspected the inputs into the impairment model and agreed these to the 2017 business plan approved by the Executive Committee. We also held discussions with management to understand the basis for the assumptions used. In respect of the budgeting process we compared the current year actual results with the 2016 business plan. Based on the work performed, we accept that the 2016 actual results were within reasonable ranges compared to the 2016 business plan.
Goodwill is tested annually for impairment or whenever there is an impairment indicator. Goodwill arose when the Group assumed control over Bafokeng Rasimone Platinum Mine (BRPM) upon listing in 2010. Royal Bafokeng Resources Proprietary Limited (RBR), a wholly owned subsidiary of the Company, has an undivided 67% participation interest in the BRPM Joint Venture (BRPM JV). The BRPM JV is made up of BRPM, Styldrift I and Styldrift II. Goodwill was calculated as the difference between the purchase consideration for the 67% interest in the BRPM Joint Venture and the Group’s share of net assets acquired. The carrying value of the existing goodwill is R863.3 million (refer to Note 5) and is allocated across the Group’s cash-generating units (CGUs) within the BRPM JV, being Styldrift I and Styldrift II. Management identified each of its operations as the lowest level for which there are separately identifiable cash flows.
The Company determines the recoverable amount of CGUs at the higher of fair value less costs of disposal and value in use. The recoverable amount is determined using the discounted cash flow model and the in-situ value for 4E (four platinum group elements, namely platinum, palladium, rhodium and gold) resource ounces outside the life of mine plan. Refer to Note 5 (goodwill) and Note 4 (mineral rights) to the consolidated financial statements where the impairment of goodwill has been discussed.
We focused on this area due to the materiality of carrying amount of the CGUs to which goodwill has been allocated, as well as the significant judgement involved in performing the impairment test. In the current year, no impairment loss was recognised.
10 I Royal Bafokeng Platinum Annual Financial Statements 2016

Key audit matters How our audit addressed the key audit matter
Cut-off between development and production phase of mining
We evaluated management’s assertion that Styldrift I is not yet in a condition necessary for it to be capable of operating in the manner intended by management by visiting the underground mine towards the end of the year and inspecting the current development, noting the infrastructure and development which is still required to enable the mine to reach commercial levels of production. We compared the current level of expenditure on the project to the total budgeted cost. We compared the current pre-production output versus intended production capacity of Styldrift I and evaluated whether the Styldrift I mine had been fully transferred over to the operational team.
We tested the costs capitalised to PPE in order to determine whether these are directly attributable to bringing the asset to the condition necessary for it to be capable of operating in the manner intended by management and whether the costs incurred were subjected to the necessary internal approval process. This was done by agreeing such costs to supporting documentation such as invoices and capital vote approval forms.
We agreed the incidental revenue tonnes to external confirmation and recalculated the incidental revenue credited against capitalised costs. We also tested the reasonability of the commodity prices and foreign exchange rates used in the incidental revenue calculation by comparing these to independently obtained information such as market quoted prices.
Based on the results of our testing, we accepted management’s conclusion that, as at 31 December 2016, the project meets the IAS 16 capitalisation criteria.
Management has concluded that Styldrift I is currently in the development phase. When in the ramp-up phase, judgement will be applied in order to determine whether the mine is ready to operate as intended by management. The commercial production indicators which will be taken into account are detailed in Note 3 (Accounting treatment of Styldrift I project expenditure) to the consolidated financial statements.
It is the Group’s accounting policy that during development and ramp-up phase, all costs directly attributable to developing the mine will be capitalised, including development taking place on-reef. Revenue generated during these phases has been credited against the capitalised cost of the asset. When the commercial production indicators are met the mine will move to the production phase. At this stage, revenue and operating costs relating to the production from the mine will be recognised in the statement of comprehensive income.
We focused on this area as the cut-off between development and production phase of mining continues to be a significant area as Styldrift I gets closer to reaching commercial levels of production. Thus, more judgement is involved in assessing whether the criteria for capitalisation have been met, as per the requirements of IAS 16: Property, plant and equipment. This has been considered a focus area as the cut-off could have a significant impact on the financial statements, due to the materiality of costs capitalised.
Royal Bafokeng Platinum Annual Financial Statements 2016 I 11

Independent auditor’s report to the shareholders of Royal Bafokeng Platinum Limited continuedfor the year ended 31 December 2016
Other information The directors are responsible for the other information. The other information comprises the directors’ report, the Audit Committee’s report and the Company Secretary’s certificate as required by the Companies Act of South Africa, which we obtained prior to the date of this auditor’s report, and the Integrated annual report, which is expected to be made available to us after that date. Other information does not include the consolidated and separate financial statements and our auditor’s report thereon.
Our opinion on the consolidated and separate financial statements does not cover the other information and we do not express an audit opinion or any form of assurance conclusion thereon.
In connection with our audit of the consolidated and separate financial statements, our responsibility is to read the other information identified above and, in doing so, consider whether the other information is materially inconsistent with the consolidated and separate financial statements or our knowledge obtained in the audit, or otherwise appears to be materially misstated. If, based on the work we have performed on the other information that we obtained prior to the date of this auditor’s report, we conclude that there is a material misstatement of this other information, we are required to report that fact. We have nothing to report in this regard.
Responsibilities of the directors for the consolidated and separate financial statementsThe directors are responsible for the preparation and fair presentation of the consolidated and separate financial statements in accordance with International Financial Reporting Standards and the requirements of the Companies Act of South Africa, and for such internal control as the directors determine is necessary to enable the preparation of consolidated and separate financial statements that are free from material misstatement, whether due to fraud or error.
In preparing the consolidated and separate financial statements, the directors are responsible for assessing the Group’s and the Company’s ability to continue as a going concern, disclosing, as applicable, matters related to going concern and using the going concern basis of accounting unless the directors either intend to liquidate the Group and/or Company to cease operations, or have no realistic alternative but to do so.
Auditor’s responsibilities for the audit of the consolidated and separate financial statementsOur objectives are to obtain reasonable assurance about whether the consolidated and separate financial statements as a whole are free from material misstatement, whether due to fraud or error, and to issue an auditor’s report that includes our opinion. Reasonable assurance is a high level of assurance, but is not a guarantee that an audit conducted in accordance with ISAs will always detect a material misstatement when it exists. Misstatements can arise from fraud or error and are considered material if, individually or in the aggregate, they could reasonably be expected to influence the economic decisions of users taken on the basis of these consolidated and separate financial statements.
As part of an audit in accordance with ISAs, we exercise professional judgement and maintain professional scepticism throughout the audit. We also: > identify and assess the risks of material misstatement of the consolidated and separate financial statements, whether due to fraud or error, design and perform audit procedures responsive to those risks, and obtain audit evidence that is sufficient and appropriate to provide a basis for our opinion. The risk of not detecting a material misstatement resulting from fraud is higher than for one resulting from error, as fraud may involve collusion, forgery, intentional omissions, misrepresentations, or the override of internal control
> obtain an understanding of internal control relevant to the audit in order to design audit procedures that are appropriate in the circumstances, but not for the purpose of expressing an opinion on the effectiveness of the Group’s and Company’s internal control
> evaluate the appropriateness of accounting policies used and the reasonableness of accounting estimates and related disclosures made by the directors
> conclude on the appropriateness of the directors’ use of the going concern basis of accounting and, based on the audit evidence obtained, whether a material uncertainty exists related to events or conditions that may cast significant doubt on the Group’s and Company’s ability to continue as a going concern. If we conclude that a material uncertainty exists, we are required to draw attention in our auditor’s report to the related disclosures in the consolidated and separate financial statements or, if such disclosures are inadequate, to modify our opinion. Our conclusions are based on the audit evidence obtained up to the date of our auditor’s report. However, future events or conditions may cause the Group and/or the Company to cease to continue as a going concern
> evaluate the overall presentation, structure and content of the consolidated and separate financial statements, including the disclosures, and whether the consolidated and separate financial statements represent the underlying transactions and events in a manner that achieves fair presentation
> obtain sufficient appropriate audit evidence regarding the financial information of the entities or business activities within the Group to express an opinion on the consolidated financial statements. We are responsible for the direction, supervision and performance of the Group audit. We remain solely responsible for our audit opinion.
12 I Royal Bafokeng Platinum Annual Financial Statements 2016

We communicate with the directors regarding, among other matters, the planned scope and timing of the audit and significant audit findings, including any significant deficiencies in internal control that we identify during our audit.
We also provide the directors with a statement that we have complied with relevant ethical requirements regarding independence, and to communicate with them all relationships and other matters that may reasonably be thought to bear on our independence, and where applicable, related safeguards.
From the matters communicated with the directors, we determine those matters that were of most significance in the audit of the consolidated and separate financial statements of the current period and are therefore the key audit matters. We describe these matters in our auditor’s report unless law or regulation precludes public disclosure about the matter or when, in extremely rare circumstances, we determine that a matter should not be communicated in our report because the adverse consequences of doing so would reasonably be expected to outweigh the public interest benefits of such communication.
Report on other legal and regulatory requirementsIn terms of the IRBA Rule published in Government Gazette Number 39475 dated 4 December 2015, we report that PricewaterhouseCoopers Inc. has been the auditor of Royal Bafokeng Platinum Limited for eight years.
PricewaterhouseCoopers Inc.Director: TD ShangoRegistered Auditor
2 Eglin RoadSunninghill2157
24 February 2017
Royal Bafokeng Platinum Annual Financial Statements 2016 I 13

Consolidated statement of financial positionas at 31 December 2016
Group
Notes2016
R (million)2015
R (million)
AssetsNon-current assets 17 614.3 17 148.8
Property, plant and equipment 3 10 587.2 10 129.7
Mineral rights 4 5 729.3 5 766.0
Goodwill 5 863.3 863.3
Environmental trust deposits, guarantees and investments 6 147.0 114.9
Employee housing loan receivable 7 167.2 157.7
Employee housing benefit 8 46.5 51.4
Insurance investment 9 35.0 31.0
Deferred tax asset 18 38.8 34.8
Current assets 2 703.6 2 610.5
Employee housing benefit 8 4.2 4.3
Employee housing assets 10 377.3 264.2
Inventories 11 79.4 55.1
Trade and other receivables 12 1 405.6 1 365.7
Current tax receivable 13 1.6 3.6
Cash and cash equivalents 14 835.5 917.6
Total assets 20 317.9 19 759.3
Equity and liabilitiesTotal equity 14 813.9 14 484.3
Share capital 15 1.9 1.9
Share premium 15 9 400.8 9 366.1
Retained earnings 1 454.2 1 285.9
Share-based payment reserve 16 216.2 194.7
Non-distributable reserve 17 82.5 71.8
Non-controlling interest 3 658.3 3 563.9
Non-current liabilities 4 165.0 4 125.7
Deferred tax liability 18 3 635.3 3 663.7
PIC housing facility 19 434.0 366.9
Restoration and rehabilitation provision and other 20 95.7 95.1
Current liabilities 1 339.0 1 149.3
Trade and other payables 22 449.3 388.4
RPM payable 889.7 760.9
Total equity and liabilities 20 317.9 19 759.3
The notes on pages 18 to 62 form an integral part of these consolidated annual financial statements.
14 I Royal Bafokeng Platinum Annual Financial Statements 2016

Consolidated statement of comprehensive incomefor the year ended 31 December 2016
Group
Notes2016
R (million)2015
R (million)
Revenue 23 3 342.2 3 044.7
Cost of sales 26 (3 101.5) (3 084.5)
Gross profit/(loss) 240.7 (39.8)
Other income 24 88.1 68.7
Administration expenses (155.6) (164.1)
Corporate office 26 (138.4) (126.3)
Housing project 26 (17.2) (37.8)
Impairment of non-financial assets 27 (2.6) (4 466.2)
Finance income 25.1 91.8 106.2
Finance cost 25.2 (7.4) (25.1)
Profit/(loss) before tax 255.0 (4 520.3)
Income tax credit 28 7.7 753.3
Income tax expense 28 (24.7) (76.9)
Deferred tax credit 28 32.4 830.2
Net profit/(loss) for the year 262.7 (3 767.0)
Other comprehensive income — —
Total comprehensive income/(loss) 262.7 (3 767.0)
Total comprehensive income/(loss) attributable to:
Owners of the Company 168.3 (3 044.8)
Non-controlling interest 94.4 (722.2)
Basic earnings/(loss) per share (cents/share) 35 87.6 (1 589.2)
Diluted earnings/(loss) per share (cents/share) 35 87.5 (1 589.2)
The notes on pages 18 to 62 form an integral part of these consolidated annual financial statements.
Royal Bafokeng Platinum Annual Financial Statements 2016 I 15
Consolidated statement of changes in equityfor the year ended 31 December 2016
Number of shares
issued*
Ordinary shares
R(million)
Share premium
R(million)
Share-based
payment reserve
R(million)
Non-distri-
butable reserves
R(million)
Retained earnings
R(million)
Attribu-table to owners of the
CompanyR
(million)
Non-con-
trolling interest
R(million)
TotalR
(million)
2016
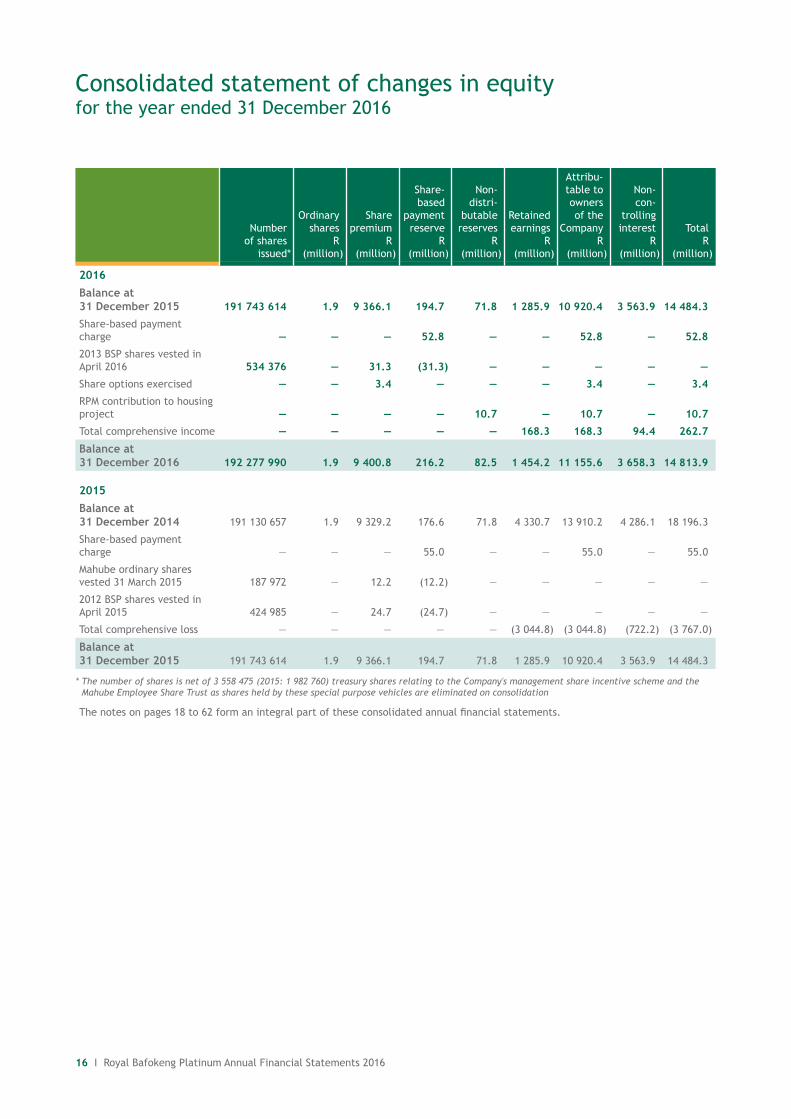
Balance at 31 December 2015 191 743 614 1.9 9 366.1 194.7 71.8 1 285.9 10 920.4 3 563.9 14 484.3
Share-based payment charge — — — 52.8 — — 52.8 — 52.8
2013 BSP shares vested in April 2016 534 376 — 31.3 (31.3) — — — — —
Share options exercised — — 3.4 — — — 3.4 — 3.4
RPM contribution to housing project — — — — 10.7 — 10.7 — 10.7
Total comprehensive income — — — — — 168.3 168.3 94.4 262.7
Balance at 31 December 2016 192 277 990 1.9 9 400.8 216.2 82.5 1 454.2 11 155.6 3 658.3 14 813.9
2015
Balance at 31 December 2014 191 130 657 1.9 9 329.2 176.6 71.8 4 330.7 13 910.2 4 286.1 18 196.3
Share-based payment charge — — — 55.0 — — 55.0 — 55.0
Mahube ordinary shares vested 31 March 2015 187 972 — 12.2 (12.2) — — — — —
2012 BSP shares vested in April 2015 424 985 — 24.7 (24.7) — — — — —
Total comprehensive loss — — — — — (3 044.8) (3 044.8) (722.2) (3 767.0)
Balance at 31 December 2015 191 743 614 1.9 9 366.1 194.7 71.8 1 285.9 10 920.4 3 563.9 14 484.3
* The number of shares is net of 3 558 475 (2015: 1 982 760) treasury shares relating to the Company's management share incentive scheme and the Mahube Employee Share Trust as shares held by these special purpose vehicles are eliminated on consolidation
The notes on pages 18 to 62 form an integral part of these consolidated annual financial statements.
16 I Royal Bafokeng Platinum Annual Financial Statements 2016

Consolidated statement of cash flowsfor the year ended 31 December 2016
Group
Notes2016
R (million)2015
R (million)
Cash flows from operating activitiesCash generated by operations 29 528.8 601.9
Interest paid (0.2) (0.6)
Interest received 74.4 86.4
Dividend received 5.0 9.7
Tax refund 13 2.5 0.4
Tax paid 13 (25.2) (78.6)
Net cash flow generated by operating activities 585.3 619.2
Cash flows from investing activities
Proceeds from disposal of property, plant and equipment 47.2 0.4
Acquisition of property, plant and equipment 3 (1 136.5) (2 018.4)
Styldrift on-reef development revenue receipts 273.9 —
Acquisition of employee housing assets 10 (83.2) (262.5)
Acquisition of insurance investment 9 (2.9) (30.0)
Increase in environmental trust deposits and investments 6 (20.1) (2.8)
Call option premiums paid — (9.2)
Net cash flow utilised by investing activities (921.6) (2 322.5)
Cash flows from financing activities
Increase in amounts owing to RPM 128.8 436.4
Drawdown of PIC housing facility 19 40.0 326.9
RPM contribution to housing fund received 82.5 —
Proceeds from share options exercised 2.9 —
Decrease in employee housing facility — (6.6)
Net cash flow generated by financing activities 254.2 756.7
Net decrease in cash and cash equivalents (82.1) (946.6)
Cash and cash equivalents at beginning of year 14 917.6 1 864.2
Cash and cash equivalents at end of year 835.5 917.6
The notes on pages 18 to 62 form an integral part of these consolidated annual financial statements.
Royal Bafokeng Platinum Annual Financial Statements 2016 I 17

Summary of the general accounting policies for the year ended 31 December 2016
1. General information The annual financial statements have been prepared in accordance with International Financial Reporting Standards (IFRS).
“Group” in the annual financial statements refers to the economic entity which includes the Company, its subsidiaries and controlled special purpose entities.
Summary of significant accounting policies The principal accounting policies and critical estimates and assumptions adopted in the preparation of these consolidated
annual financial statements are set out in detail in the relevant notes to the annual financial statements. The policies have been consistently applied to all the years presented, unless otherwise stated.
Basis of presentation The Group annual financial statements have been prepared in accordance with IFRS as issued by the International Accounting
Standards Board (IASB), including IFRIC interpretations (collectively IFRS), the SAICA Financial Reporting Guidelines as issued by the Accounting Practices Committee, financial pronouncements as issued by the Financial Reporting Standards Council (FRSC) and the requirements of the South African Companies Act 71 of 2008 of South Africa.
The Group annual financial statements have been prepared under the historic cost convention except for certain financial assets, which are measured at fair value.
The preparation of the Group annual financial statements in accordance with IFRS requires the use of estimates and assumptions that affect the reported amounts of assets and liabilities at the date of the financial statements and the reported amounts of revenues and expenses during the reporting period based on management and the Board's best knowledge of current events and actions. Actual results may ultimately differ from these estimates. The areas involving a higher degree of judgement or complexity, or areas where assumptions and estimates are significant to the consolidated annual financial statements are detailed in the relevant notes to the annual financial statements.
Functional and presentation currency These consolidated annual financial statements are presented in South African Rand, which is the Company’s functional
currency. All financial information is presented in Rand million, unless otherwise stated.
Standards, amendments and interpretations to existing standards that are not yet effective and have not been early adopted by the Group
The following standards, amendments to standards and interpretations for existing standards may possibly have an impact on the Group: > IFRS 15: Revenue from Contracts with Customers effective 1 January 2018. The FASB and IASB issued their long awaited converged standard on revenue recognition on 29 May 2014. It is a single, comprehensive revenue recognition model for all contracts with customers to achieve greater consistency in the recognition and presentation of revenue. Revenue is recognised based on the satisfaction of performance obligations, which occurs when control of good or service transfers to a customer.
The impact of the standard is currently being assessed by management. Initial assessments indicated that the standard would not have a significant impact on the financial statements based on the Group’s existing operations and processes in place.
> IFRS 9: Financial Instruments (2009 and 2010) effective 1 January 2018— Financial liabilities— Derecognition of financial instruments— Financial assets— General hedge accounting— Expected credit loss model for the impairment of financial assets.
This IFRS is part of the IASB’s project to replace IAS 39. IFRS 9 addresses classification and measurement of financial assets and replaces the multiple classification and measurement models in IAS 39 with a single model that has only two classification categories: amortised cost and fair value. The IASB has updated IFRS 9: Financial Instruments to include guidance on financial liabilities and derecognition of financial instruments. The accounting and presentation for financial liabilities and for derecognising financial instruments has been relocated from IAS 39: Financial Instruments: Recognition and Measurement, without change, except for financial liabilities that are designated at fair value through profit or loss.
The impact of the standard has not yet been assessed by management.
> IFRS 16: Leases effective 1 January 2019. After 10 years of joint drafting by the IASB and FASB they decided that lessees should be required to recognise assets and liabilities arising from all leases (with limited exceptions) on the balance sheet. Lessor accounting has not substantially changed in the new standard. The model reflects that, at the start of a lease, the lessee obtains the right to use an asset for a period of time and has an obligation to pay for that right. In response to concerns expressed about the cost and complexity to apply the requirements to large volumes of small assets, the IASB decided not to require a lessee to recognise assets and liabilities for short-term leases (less than 12 months), and leases for which the underlying asset is of low value (such as laptops and office furniture). A lessee measures lease liabilities at the present value of future lease payments. A lessee measures lease assets, initially at the same amount as lease liabilities, and also includes costs directly related to entering into the lease. Lease assets are amortised in a similar way to other assets such as property, plant and equipment. This approach will result in a more faithful representation of a lessee’s assets and liabilities and, together with enhanced disclosures, will provide greater transparency of a lessee’s financial leverage and capital employed. One of the implications of the new standard is that there will be a change to key financial ratios derived from a lessee’s assets and liabilities (for example, leverage and performance ratios). IFRS 16 supersedes IAS 17: Leases, IFRIC 4: Determining whether an Arrangement contains a Lease, SIC 15: Operating Leases — Incentives and SIC 27: Evaluating the Substance of Transactions Involving the Legal Form of a Lease.
18 I Royal Bafokeng Platinum Annual Financial Statements 2016

1. General information continued The impact of the standard is currently being assessed by management. Initial assessments indicated that the standard would
not have a significant impact on the financial statements based on the Group’s existing operations and processes in place.
> Amendment to IAS 12: Income Taxes effective 1 January 2017. The amendments were issued to clarify the requirements for recognising deferred tax assets on unrealised losses. The amendments clarify the accounting for deferred tax where an asset is measured at fair value and that fair value is below the asset’s tax base. They also clarify certain other aspects of accounting for deferred tax assets.
The amendments clarify the existing guidance under IAS 12. They do not change the underlying principles for the recognition of deferred tax assets.
The impact of the amendment is currently being assessed by management.
> Amendment to IAS 7: Cash Flow Statements effective 1 January 2017. In January 2016, the International Accounting Standards Board (IASB) issued an amendment to IAS 7 introducing an additional disclosure that will enable users of financial statements to evaluate changes in liabilities arising from financing activities.
The amendment responds to requests from investors for information that helps them better understand changes in an entity’s debt. Management has not yet assessed how to best present the additional information to explain the changes in liabilities arising from financing activities.
2. Group accounting policies 2.1 Group and Company annual financial statements These consolidated annual financial statements incorporate the Company, its subsidiaries and interest and controlled
special purpose entities using uniform accounting policies.
Subsidiaries Subsidiaries are all entities (including special purpose entities) over which the Group has control. The Group controls an
entity when the Group is exposed to, or has rights to variable returns from its involvement with the entity and has the ability to affect these returns through its power over the entity. Subsidiaries are fully consolidated from the date on which control is transferred to the Group. They are deconsolidated from the date that control ceases.
The Group uses the acquisition method of accounting to account for business combinations. The consideration transferred for the acquisition of a subsidiary is the fair values of the assets transferred, the liabilities incurred and the equity interests issued by the Group. The consideration transferred includes the fair value of any asset or liability resulting from a contingent consideration arrangement. Acquisition-related costs are expensed as incurred. Identifiable assets acquired and liabilities and contingent liabilities assumed in a business combination are measured initially at their fair values at the acquisition date.
On an acquisition-by-acquisition basis, the Group recognises any non-controlling interest in the acquiree either at fair value or at the non-controlling interest’s proportionate share of the acquiree’s net assets.
The excess of the consideration transferred, the amount of any non-controlling interest in the acquiree and the acquisition-date fair value of any previous equity interest in the acquiree over the fair value of the Group’s share of the identifiable net assets acquired is recorded as goodwill. If this is less than the fair value of the net assets of the subsidiary acquired in the case of a bargain purchase, the difference is recognised directly in the statement of comprehensive income.
Goodwill is tested annually for impairment or whenever there is an impairment indicator. Goodwill is carried at cost less accumulated impairment losses. Gains or losses on the disposal of an entity include the carrying amount of goodwill relating to the entity sold.
Intercompany transactions, balances and unrealised gains on transactions between Group companies are eliminated. Unrealised losses are also eliminated. Accounting policies of subsidiaries have been changed where necessary to ensure consistency with the policies adopted by the Group.
Royal Bafokeng Resources Proprietary Limited (RBR), a wholly owned subsidiary of the Company, has an undivided 67% participation interest in the Bafokeng Rasimone Platinum Mine Joint Venture (BRPM JV). Rustenburg Platinum Mines Limited (RPM) owns the remaining 33% participation interest in the BRPM JV.
The Group consolidates the unincorporated BRPM JV.
Royal Bafokeng Platinum Annual Financial Statements 2016 I 19

Summary of the general accounting policies continuedfor the year ended 31 December 2016
2. Group accounting policies continued 2.1 Group and Company annual financial statements continued Changes in ownership interests in subsidiaries without change in control Transactions with non-controlling interests that do not result in loss of control are accounted for as equity transactions,
that is, as transactions with the owners in their capacity as owners. The Group treats transactions with non-controlling interests as transactions with equity owners of the Group. For purchases from non-controlling interests, the difference between any consideration paid and the relevant share acquired of the carrying amount of net assets of the subsidiary is recorded in equity. Gains or losses on disposals to non-controlling interests are also recorded in equity.
In the Company financial statements, investments in subsidiaries are accounted for at cost less impairment. Cost is adjusted to reflect changes in consideration arising from contingent consideration amendments. Cost also includes directly attributable costs of investment.
Disposal of subsidiaries When the Group ceases to have control then any retained interest in the entity is remeasured to its fair value at the date
when control is lost, with the change in carrying amount recognised in profit or loss. The fair value is the initial carrying amount for the purposes of subsequently accounting for the retained interest as an associate, joint venture or financial asset. In addition, any amounts previously recognised in other comprehensive income in respect of that entity are accounted for as if the Group had directly disposed of the related assets or liabilities. This may mean that amounts previously recognised in other comprehensive income are reclassified to profit or loss.
2.2 General 2.2.1 Financial instruments Financial assets comprise environmental trust deposits, trade and other receivables (excluding prepaid expenses and
VAT receivable), cash and cash equivalents and the employee housing loan receivable.
The Group classifies its financial assets at fair value through profit or loss and loans and receivables. The classification depends on the purpose for which the financial assets were acquired. Management determines the classification of its financial assets at initial recognition.
Financial liabilities comprise borrowings, shareholder loan and trade and other payables. The Group classifies its financial liabilities as liabilities at amortised cost and at fair value through profit or loss.
2.2.2 Fair value estimation The fair value of financial instruments traded in active markets is based on quoted market prices at the reporting
date.
The nominal value less estimated credit adjustments of trade receivables and payables is assumed to approximate their fair values. The fair value of financial liabilities for disclosure purposes is estimated by discounting the future contractual cash flows at the current market interest rate that is available to the Group for similar financial instruments.
The carrying amounts of current financial assets and current financial liabilities approximate their fair values.
2.2.3 Offset Financial assets and financial liabilities are offset and the net amount reported in the statement of financial position
only when the Group has a legally enforceable right to set off the recognised amounts and intends either to settle on a net basis or to realise the asset and liability simultaneously.
20 I Royal Bafokeng Platinum Annual Financial Statements 2016

Notes to the consolidated annual financial statements and related accounting policiesfor the year ended 31 December 2016
3. Property, plant and equipment Items of property, plant and equipment are measured at cost less accumulated depreciation and impairment. Cost includes
expenditure that is directly attributable to the acquisition of the asset.
Pre-production expenditure, incurred to establish or expand productive capacity, to support and maintain that productive capacity incurred on mines, is capitalised to property, plant and equipment. The recognition of costs in the carrying amount of the asset ceases when the item is in the location and condition necessary to operate as intended by management. Any net income earned while the item is not yet capable of operating as intended, reduces the capital amount. Interest on borrowings, specifically to finance the establishment of mining assets, is capitalised during the construction phase.
Items of mine property, plant and equipment, excluding capitalised mine development and infrastructure costs, are depreciated on a straight-line basis over their expected useful lives. Capitalised mine development and infrastructure costs (shown as mining assets in this note) are depreciated on a unit-of-production basis. Depreciation is charged on mining assets from the date on which the assets are available for use as intended by management.
Non-mining assets are measured at historical cost less accumulated depreciation. Depreciation is charged on the straight-line basis over the useful lives of these assets. Non-mining assets include corporate office and RBRP property, plant and equipment.
The present value of the decommissioning cost, which is the dismantling and removal of the asset included in the environmental rehabilitation obligation, is included in the cost of the related assets and changes in the liability resulting from changes in the estimates are accounted for as follows: > Any decrease in the liability reduces the cost of the asset. The decrease in the asset is limited to its carrying amount and any excess is accounted for in profit or loss
> Any increase in the liability increases the carrying amount of the asset. An increase to the cost of the asset is tested for impairment when there is an indication of impairment
> These assets are depreciated over their useful lives and are expensed in profit and loss as a cost of production.
Depreciation is calculated to write off the cost of each asset to its residual value over its estimated useful life and residual value as reassessed on an annual basis and approximates the following:
Buildings 5 — 30 years (straight-line) Computer equipment and software 3 — 5 years (straight-line) Furniture and fittings 4 — 10 years (straight-line) Plant and machinery 5 — 30 years (straight-line) Vehicles and equipment 6 years (straight-line) Mining assets (shaft and development) Units-of-production Mineral rights Units-of-production
Depreciation periods are assessed annually and adjusted if and where appropriate.
Where the carrying amount of an asset is greater than its estimated recoverable amount, it is written down immediately to its recoverable amount. Gains or losses on disposal of property, plant and equipment are determined by comparing proceeds on disposal with carrying amounts and are included in operating profit.
Impairment An impairment review of property, plant and equipment is carried out when there is an indication that these assets may be
impaired by comparing the carrying amount thereof to its recoverable amount.
The recoverable amount of property, plant and equipment is determined as the higher of the fair value less cost to sell and its value in use. For mining assets this is determined based on the present value of the estimated future cash flows arising from the use of the asset.
Where the recoverable amount is less than the carrying amount, the impairment charge will reduce the carrying amount of property, plant and equipment to its recoverable amount. The adjusted carrying amount is depreciated over the remaining useful life of property, plant and equipment.
When an impairment loss subsequently reverses, the carrying amount of the asset is increased to the revised estimate of its recoverable amount, but so that the increased carrying amount does not exceed the carrying amount that would have been determined had no impairment loss been recognised for the asset in prior years. A reversal of an impairment loss is recognised immediately in profit or loss.
Royal Bafokeng Platinum Annual Financial Statements 2016 I 21

Notes to the consolidated annual financial statements and related accounting policies continuedfor the year ended 31 December 2016
3. Property, plant and equipment continued Capital work in progress
Development costs are capitalised and transferred to the appropriate category of property, plant and equipment when available for use. Capitalised development costs include expenditure to develop new operations and to expand existing capacity.
Accounting treatment of the Styldrift l project expenditure Styldrift I is currently in the development phase, the decision as to when to stop capitalising development costs and start
expensing costs at the Styldrift I project requires judgement. The accounting is dependent on where the project is in terms of the following phases:
Phase 1: Development phase The cost of an item of property, plant and equipment comprises any costs directly attributable to bringing the asset to the
location and condition necessary for it to be capable of operating in the manner intended by management.
The development phase includes the construction of the main infrastructure of the mine, which includes the mine rooms, footwall infrastructure, ventilation shafts, services shaft, silos and the spillage handling ramp. These components are necessary for the mine to be capable of operating in a manner intended by management.
All costs directly attributable to developing the mine will be capitalised, including development taking place on-reef. Incidental revenue generated during the development phase is credited against the capitalised cost of the asset.
Phase 2: Ramp-up phase Recognition of costs in the carrying amount of an item of property, plant and equipment ceases when the item is in the location
and condition necessary for it to be capable of operating in the manner intended by management.
In order to determine whether the Styldrift I mine is ready to operate as intended by management, judgement will be applied taking into account commercial production indicators such as the level of expenditure incurred compared to the total capital cost to completion, pre-production output has reached a nominated percentage, the internal project management team has transferred the mine to the operational team, the majority of the assets necessary for the mining project are substantially complete and ready for use and the project’s ability to sustain commercial levels of production. These indicators will provide guidance to recognise when the mine development phase will cease and the production phase will commence.
During ramp-up phase all costs that are directly attributable to developing the mine will be capitalised and the incidental revenue generated will be credited against the capital cost up to the date when the commercial production indicators are met.
During this phase the mine is not in a condition necessary for it to be capable of operating in the manner as intended by management.
Phase 3: Production phase When the commercial production indicators are met the mine moves to the production phase. Revenue will be recognised in
the statement of comprehensive income as well as operating costs relating to the production from the mine.
Critical accounting estimates and assumptions The recoverability of the BRPM and Styldrift mining assets was assessed using the higher of fair value less cost to sell or value in
use methodology based on the net present value of the current life of mine plan and an in-situ value for 4E resource ounces outside the life of mine plan. Refer to Note 5 for detail of assumptions and estimates used in our impairment assessment.
Mineral reserves The estimation of reserves impacts the depreciation of property, plant and equipment, the recoverable amount of property,
plant and equipment and the timing of rehabilitation expenditure.
Management uses past experience and assessment of future conditions, together with external sources of information, such as consensus global assumptions regarding commodity prices and exchange rates, to assign value to the key assumptions.
Factors impacting the determination of proved and probable reserves are as follows: > The grade of mineral reserves may vary significantly from time to time (i.e. differences between actual grades mined and resource model grades)
> Differences between actual commodity prices and commodity price assumptions > Unforeseen operational matters/difficulties at mine sites > Changes in capital, operating, mining, processing and reclamation costs, discount rates and foreign exchange rates.
Asset lives The Group’s assets, excluding mining assets and mineral rights, are depreciated over their expected useful lives which are
reviewed annually to ensure its appropriateness. In assessing useful lives, technological innovation, product life cycles, physical condition of the assets and maintenance programmes are taken into consideration.
Mining assets and mineral rights are depreciated/amortised on a unit-of-production (UOP) basis. The UOP method is based on the actual production of economically recoverable proved and probable mineral reserves over expected estimated economically recoverable proved and probable mineral reserves to be produced or concentrated by that asset.
22 I Royal Bafokeng Platinum Annual Financial Statements 2016

3. Property, plant and equipment continued
BuildingsR (million)
Furniture and fittings
and computer
equipmentR (million)
Mining assets
(including decommis-
sioning asset)
R (million)
Capital work in
progressR (million)
Plant and
machineryR (million)
Vehicles and
equipmentR (million)
TotalR (million)
Property, plant and equipment2016At 1 January 2016 97.7 52.6 3 049.3 5 923.3 999.9 6.9 10 129.7Additions 2.6 2.8 — 777.8 — 0.2 783.4Change in estimates of decommissioning asset — — (6.7) — — — (6.7)Disposals — — — (40.3) — — (40.3)Impairment (refer to Note 27) — — — (0.9) — (0.9) (1.8)Depreciation (4.6) (25.3) (116.7) — (127.5) (3.0) (277.1)Transfers 1.1 8.8 87.0 (183.5) 86.6 — —
At 31 December 2016 96.8 38.9 3 012.9 6 476.4 959.0 3.2 10 587.2
Cost or valuation 124.7 186.3 6 558.7 6 498.8 1 775.2 33.0 15 176.7Accumulated depreciation and impairment (27.9) (147.4) (3 545.8) (22.4) (816.2) (29.8) (4 589.5)
At 31 December 2016 96.8 38.9 3 012.9 6 476.4 959.0 3.2 10 587.2
2015At 1 January 2015 81.1 75.5 5 120.8 4 581.1 1 022.1 8.9 10 889.5
Additions 6.2 0.1 — 1 964.1 — — 1 970.4
Impairment (refer to Note 27) — — (2 340.8) (21.5) — — (2 362.3)
Depreciation (4.2) (36.8) (184.6) — (138.9) (3.4) (367.9)
Transfers 14.6 13.8 453.9 (600.4) 116.7 1.4 —
At 31 December 2015 97.7 52.6 3 049.3 5 923.3 999.9 6.9 10 129.7
Cost or valuation 121.0 174.7 6 478.4 5 944.8 1 688.6 32.8 14 440.3
Accumulated depreciation and impairment (23.3) (122.1) (3 429.1) (21.5) (688.7) (25.9) (4 310.6)
At 31 December 2015 97.7 52.6 3 049.3 5 923.3 999.9 6.9 10 129.7
RBR has the life of mine right to use, but not ownership of assets with a carrying amount of R941 708 980 (2015: R1 009 698 583) which is included in the balances above.
Exploration and evaluation costs relating to Styldrift II incurred in the current year and included in capital work in progress additions, were R4.1 million (2015: R12.4 million). Included in the 2016 additions are non-cash amounts of R7.7 million (2015: R6.5 million) which relate to Styldrift I project share-based payment charges capitalised (refer to Note 16) and R2.5 million (2015: nil) which relates to buildings for the housing project.
For the 2016 financial year Styldrift on-reef development revenue of R363.3 million (2015: R54.5 million) was credited against the capital work in progress additions.
Royal Bafokeng Platinum Annual Financial Statements 2016 I 23

4. Mineral rights Exploration and evaluation assets
Exploration and evaluation assets acquired are initially recognised at cost. Once commercial reserves are found, exploration and evaluation assets are transferred to assets under construction. No amortisation is charged during the exploration, evaluation and development phase.
For the purposes of assessing impairment, the exploration and evaluation assets subject to testing are grouped with existing cash-generating units of operating mines that are located in the same geographical region. Where assets are not associated with a specific cash-generating unit, the recoverable amount is assessed using fair value less cost to sell for the specific exploration area.
All exploration and evaluation costs incurred as part of normal operations are expensed until the Board concludes that a future economic benefit is more likely than not to be realised, i.e. probable. While the criterion for concluding that expenditure should be capitalised is always the probability of future benefits, the information that the Board uses to make that determination depends on the level of exploration. > Exploration and evaluation expenditure on greenfields sites, being those where the Group does not have any mineral deposits which are already being mined or developed, is expensed as incurred until a final feasibility study has been completed, after which the expenditure is capitalised within development costs, if the final feasibility study demonstrates that future economic benefits are probable
> Exploration and evaluation expenditure on brownfields sites, being those adjacent to mineral deposits which are already being mined or developed, is expensed as incurred until the Board is able to demonstrate that future economic benefits are probable through the completion of a pre-feasibility study, after which the expenditure is capitalised as a mine development cost. A ‘pre-feasibility study’ consists of a comprehensive study of the viability of a mineral project that has advanced to a stage where the mining method, in the case of underground mining, or the pit configuration, in the case of an open pit, has been established, and which, if an effective method of mineral processing has been determined, includes a financial analysis based on reasonable assumptions of technical, engineering, operating economic factors and the evaluation of other relevant factors. The pre-feasibility study, when combined with existing knowledge of the mineral property that is adjacent to mineral deposits that are already being mined or developed, allows the directors to conclude that it is more likely than not that the Group will obtain future benefits from the expenditures
> Exploration and evaluation expenditure relating to extensions of mineral deposits which are already being mined or developed, including expenditure on the definition of mineralisation of such mineral deposits, is capitalised as a mine development cost following the completion of an economic evaluation equivalent to a pre-feasibility study. This economic evaluation is distinguished from a pre-feasibility study in that some of the information that would normally be determined in a pre-feasibility study is instead obtained from the existing mine or development. This information when combined with existing knowledge of the mineral property already being mined or developed allows the Board to conclude that it is more likely than not that the Group will obtain future economic benefits from the expenditures.
The recoverability of the long-term mining assets is based on estimates of future discounted cash flows. These estimates are subject to risks and uncertainties including future metal prices and exchange rates. It is therefore possible that changes can occur which may affect the recoverability of the mining assets. Where the recoverable amount is less than the carrying amount, the impairment is charged against income to reduce the carrying amount to the recoverable amount of the asset. The revised carrying amounts are depreciated over the remaining lives of such affected assets. For the purpose of assessing impairment, assets are grouped at the lowest levels for which there are separately identifiable cash flows (cash-generating units).
An impairment previously recognised will be reversed when changes in circumstances that have an impact on estimates occur after the impairment was recognised. The reversal of an impairment will be limited to the lower of the newly calculated recoverable amount or the carrying amount that would have existed if the impairment had not been recognised. The reversal of an impairment is recognised in the statement of comprehensive income.
Critical accounting estimates and assumptions For BRPM and Styldrift, the recoverability of the non-financial assets was assessed using the higher of fair value less cost to sell
or value in use methodology based on the net present value of the current life of mine plan and an in-situ value for 4E resource ounces outside the life of mine plan. The Styldrift mineral right includes the Styldrift I and Styldrift II project areas. Refer to Note 5 for details of the estimates and assumptions used in our impairment assessment.
Notes to the consolidated annual financial statements and related accounting policies continuedfor the year ended 31 December 2016
24 I Royal Bafokeng Platinum Annual Financial Statements 2016

4. Mineral rights continued Exploration and evaluation assets continued Amortisation of mineral rights is provided on a units-of-production basis.
Group
2016R (million)
2015R (million)
Mineral rightsOpening balance at 1 January 5 766.0 6 518.4
Less: Amortisation (included in cost of sales refer to Note 26) (36.7) (62.3)
Less: Impairment (refer to Note 27) — (690.1)
Closing balance at 31 December 5 729.3 5 766.0
Cost 6 767.0 6 767.0
Accumulated amortisation and impairment (1 037.7) (1 001.0)
Closing balance at 31 December 5 729.3 5 766.0
In terms of the joint venture agreement between RPM and RBR, RPM contributed its Boschkoppie mineral right and the Frischgewaagd prospecting right while RBR contributed its Styldrift mineral right to the BRPM JV for the full BRPM life of mine. RBR therefore has an undivided 67% participation interest in these rights while RPM has an undivided 33% participation interest in these rights.
5. Goodwill Goodwill is tested annually for impairment. Goodwill is allocated to the BRPM operations and Styldrift cash-generating-units
(CGUs) for the purpose of impairment testing. The recoverable amount of the CGU to which goodwill has been allocated is based on the higher of fair value less cost to sell or value in use derived from reserve and resource ounce valuations. An impairment is recognised immediately in the statement of comprehensive income. Impairment write downs on goodwill may not be reversed.
Critical accounting estimates and assumptions Goodwill was calculated as the difference between the purchase consideration for the 67% interest in the BRPM JV and the
Group’s share of net assets acquired when the Group assumed control over the BRPM JV upon listing on 8 November 2010. The BRPM JV consists of the BRPM operations and Styldrift and goodwill was allocated across these CGUs as the difference between the purchase considerations allocated to each CGU and the net assets per CGU. No goodwill was attributed to non-controlling interest.
For the BRPM operations and Styldrift, the recoverability of the non-financial assets was assessed using the higher of fair value less cost to sell or value in use methodology based on the net present value of the current life of mine plan and an in-situ value for 4E resource ounces outside the life of mine plan.
Mineral rights inside life of mine plan The following key assumptions were used in the impairment calculation of the BRPM operations and Styldrift:
> Long-term real platinum US$1 302 per ounce (2015: US$1 270 per ounce) > Long-term real palladium US$717 per ounce (2015: US$700 per ounce) > Long-term real gold US$1 310 per ounce (2015: USS1 278 per ounce) > Long-term real rhodium US$832 per ounce (2015: US$812 per ounce) > A long-term real Rand:US$ exchange rate of R15.36:US$ (2015: R14.60:US$) > A real discount rate of 9.1% (2015: 8.5%) > Life of mine of 30 years (2015: 30 years) > Production volumes are based on a detailed life of mine plan.
Mineral rights outside the life of mine plan For in-situ 4E resource ounces a value of US$10 per 4E ounce (2015: US$10 per 4E ounce) was used to calculate the recoverable
amount of outside life of mine 4E ounces for the BRPM operations and Styldrift.
Sensitivity analysis in respect of the most significant assumptions applied in the impairment model > BRPM operations
If all assumptions remain unchanged, a 5% decrease in the average Rand basket over the life of mine will result in an impairment of R10.3 million. A 4.9% decrease in the average Rand basket over the life of mine will result in a break-even position. If all assumptions remain unchanged, a 1% increase in the real discount rate to 10.1% would not result in an impairment. 14.6% is the real break-even discount rate.
> Styldrift I If all assumptions remain unchanged, a 5% decrease in the average Rand basket over the life of mine will result in an
impairment of R1.1 billion. A 1.3% decrease in the average Rand basket over the life of project will result in a break-even position. If all assumptions remain unchanged, a 1% increase in the real discount rate to 10.1% would result in an impairment of R557 million. 9.5% is the real break-even discount rate.
> For Styldrift II, a 5% decrease in the in-situ 4E ounce value will result in an impairment of R27 million.
Royal Bafokeng Platinum Annual Financial Statements 2016 I 25

5. Goodwill continued
BRPM operationsR (million)
Styldrift IR (million)
Styldrift IIR (million)
TotalR (million)
Goodwill
2016
Opening balance at 1 January — 240.1 623.2 863.3
Less: Impairment (refer to Note 27) — — — —
Closing balance at 31 December — 240.1 623.2 863.3
Cost 134.6 1 517.3 623.2 2 275.1
Less: Accumulated impairment (134.6) (1 277.2) — (1 411.8)
Closing balance at 31 December — 240.1 623.2 863.3
2015Opening balance at 1 January 134.6 1 517.3 623.2 2 275.1
Less: Impairment (refer to Note 27) (134.6) (1 277.2) — (1 411.8)
Closing balance at 31 December — 240.1 623.2 863.3
Cost 134.6 1 517.3 623.2 2 275.1
Less: Accumulated impairment (134.6) (1 277.2) — (1 411.8)
Closing balance at 31 December — 240.1 623.2 863.3
6. Environmental trust deposits, guarantees and investments Contributions are made to the Bafokeng Rasimone Platinum JV Environmental Rehabilitation Trust, created in accordance with
statutory requirements to provide for the estimated cost of rehabilitation during and at the end of the life of BRPM JV.
Environmental trust deposits held in the Nedbank equity-linked deposits are carried in the statement of financial position at fair value and deposits held in the Nedbank and Standard Bank accounts are carried at amortised cost. Contributions are based on the estimated environmental obligations over the life of mine. Interest earned on monies paid to the trust is accounted for as finance income and income earned linked to the performance of the equity-linked component of the investment is included in other income.
The Company has control over the trust and the special purpose entity is consolidated in the Company.
Financial assets at fair value through profit or loss Initial recognition
Financial assets at fair value through profit or loss are financial assets held for trading. A financial asset is classified in this category if acquired principally for the purpose of selling in the short term. Assets in this category are classified as current assets, except for the environmental deposit which is classified as a non-current asset. Financial assets at fair value through profit or loss are initially recognised at fair value. Nedbank equity-linked deposits are treated at fair value through profit or loss.
Bafokeng Rasimone Platinum JV Environmental Rehabilitation Trust The Bafokeng Rasimone Platinum JV Environmental Rehabilitation Trust was created to fund the estimated cost of pollution
control, rehabilitation and mine closure at the end of the lives of the Group’s mines. The Group funds its environmental obligations through a combination of funding the Bafokeng Rasimone Platinum JV Environmental Rehabilitation Trust and providing guarantees to the Department of Mineral Resources. Contributions made are determined on the basis of the estimated environmental obligation over the life of a mine and are reflected in non-current assets under environmental trust deposits. Refer to Note 20 for details of the environmental rehabilitation provision.
Gains or losses Gains or losses arising from changes in the fair value of the financial assets at fair value through profit or loss category are
presented in the statement of comprehensive income within other income, in the period in which they arise.
Notes to the consolidated annual financial statements and related accounting policies continuedfor the year ended 31 December 2016
26 I Royal Bafokeng Platinum Annual Financial Statements 2016

6. Environmental trust deposits, guarantees and investments continued Subsequent measurement
Financial assets at fair value through profit or loss are subsequently measured at the quoted current bid prices. If the market for a financial asset is not active (and for unlisted securities), the Group establishes fair value by using valuation techniques. These include the use of recent arm’s length transactions, reference to other instruments that are substantially the same, discounted cash flow analysis and option pricing models, making maximum use of market inputs and relying as little as possible on entity-specific inputs.
Loans and receivables are non-derivative financial assets with fixed or determinable payments that are not quoted in an active market. The environmental trust deposit held in the Standard Bank account forms part of loans and receivables and is treated at amortised cost. Loans and receivables are initially recognised at cost.
Group
2016R (million)
2015R (million)
Environmental trust deposits
Held in Standard Bank accountOpening balance at 1 January 7.5 4.7
Plus: Interest earned on environmental trust deposit (refer to Note 25.1) 0.5 0.1
Plus: Increase in cash deposit during the year 2.9 2.7
Closing balance at 31 December 10.9 7.5
Held in Nedbank equity-linked deposit accountsOpening balance at 1 January 107.4 108.9
Less: Equity-linked deposit matured in 2016 — funds placed on call (24.2) —
Plus: Fair value adjustment of the Nedbank equity-linked deposits (refer to Note 24) 11.7 (1.5)
Fair value at 31 December 94.9 107.4
Held in Nedbank call accountOpening balance at 1 January — —
Plus: Equity-linked deposit matured in 2016 — funds placed on call 24.2 —
Plus: Interest earned on environmental trust deposit (refer to Note 25.1) 0.4 —
Closing balance at 31 December 24.6 —
Total environmental trust deposits at 31 December 130.4 114.9
Environmental trust guarantees and investmentsOpening balance at 1 January — —
Plus: Contributions made during the year 16.3 —
Plus: Fair value adjustments 0.3 —
Closing balance at 31 December 16.6 —
Total environmental trust deposits, guarantees and investments at 31 December 147.0 114.9
According to the terms of the Nedbank equity-linked deposit, the deposit amount is guaranteed and will earn a guaranteed 3% per annum (naca) interest. In addition, there is a variable return component linked to the Coreshares Green Exchange Traded Fund (previously the Bettabeta CIS BGreen portfolio exchange traded fund) performance and the FTSE/JSE Shareholder Weighted Top 40 Index performance. The variable return is capped based on a participation interest percentage of the growth in the relevant index to maturity. The Nedbank equity-linked deposits have been invested for a one/two/three/four/five-year period to ensure flexibility for when the cash will be required for rehabilitation.
R51.8 million (2015: R57.2 million) of the R94.9 million (2015: R107.4 million) Nedbank equity-linked deposits is invested in the Coreshares Green Exchange Traded Fund and R43.1 million (2015: R50.2 million) is invested in the FTSE/JSE Shareholder Weighted Top 40 Index equity-linked deposits.
The Nedbank equity-linked deposits environmental trust guarantees and investments are fair valued every month and the fair value adjustment is taken through the statement of comprehensive income as an adjustment to other income.
The guarantees and investments will be applied solely for the BRPM JV’s restoration and rehabilitation obligation.
Royal Bafokeng Platinum Annual Financial Statements 2016 I 27

7. Employee housing loan receivable Initial recognition
When a house is sold to an employee, the Group recognises a financial asset receivable from the employee at fair value. The best evidence of the receivable’s fair value on initial recognition is the transaction price. However, due to the employees paying a preferential interest rate of CPI plus 1%, the fair value may differ from the transaction price. The Group therefore determined a market-related rate for the financial asset based on an average credit profile per band of employees to determine the effective interest rate for this receivable. The Group recognises the difference between fair value at initial recognition and the transaction price as an employee benefit.
Subsequent measurement The financial asset receivable from the employee is accounted for at amortised cost (recognised at fair value on initial recognition
and transaction costs) less provision for impairment, using the appropriate effective interest rate as determined above.
For the financial asset receivable from the employee, the portion to be realised within 12 months from the reporting period is presented as part of current assets, the balance of the amount is presented as a non-current asset in the statement of financial position.
A provision made for impairment of the employee housing loan receivable is established when there is objective evidence (for example when instalments are overdue for a significant period of time) that the Group will not be able to collect all amounts due according to the original terms of the sale agreement. The amount of the provision is the difference between the asset’s carrying amount and the recoverable amount, being the present value of expected cash flow, discounted at the original effective interest rates. The carrying amount of the asset is reduced through the use of an allowance account, and the amount of the loss is recognised in the statement of comprehensive income as an administrative expense.
Critical accounting estimates and assumptions Employee home ownership scheme
The employee home ownership scheme arrangement was concluded in May 2014 and involves the construction of approximately 3 500 houses for eligible employees over a five-year period. Phase 1 of the housing project consisted of the construction of 422 houses in 2015 of which 417 were sold to employees in 2015. During 2016 we had four cancellations of sale agreements and two houses were allocated to property, plant and equipment as they are used as an office and a clinic. This resulted in seven of the Phase 1 houses being in stock and available for sale at 31 December 2016.
RBRP, a wholly owned subsidiary of RBR, is a property company which was created in 2013 for the purpose of the housing scheme. All unsold houses are classified as inventory in the books of RBRP and on sale of the houses, revenue is recognised. On Group level, however, unsold houses are classified as non-current assets. On sale of the houses, an employee receivable is recognised.
Employee housing loan receivable The fair value of the employee housing receivable is determined using a discounted cash flow model.
The following key assumptions were used in determining the fair value of the employee housing loan receivable: > Instalment
― Instalment of R3 125 from 1 July 2016 to 30 June 2017 (2015: R2 721 from 1 July 2015 to 30 June 2016) ― Instalment increases on 1 July of each year and is fixed for a period of 12 months
> Interest accruals ― Interest is charged at 7.1% (2015: 7.0%) based on the May CPI rate of the current period plus 1% with a floor rate of 7% (CPI as at May of the current period is 6.1% (2015: 4.6%))
― Interest rates are adjusted annually effective from 1 July of each calendar year and remain fixed for a period of 12 months ― The default interest rate for any employee who fails to make a monthly repayment of the instalment is set at the prime interest rate plus 2%
― The prime lending rate (defined as the “benchmark rate at which private banks lend out to the public”) will be used as the base discount rate with an adjustment for counterparty credit risk (relative to the prime lending rate). This adjustment will be varied by risk grades (i.e. average credit profile per band)
> Payment period ― The initial repayment period for the loans is 209 months ― The repayment period, however, is adjusted based on interest rate movements.
Group
2016R (million)
2015R (million)
Employee housing loan receivableOpening balance at 1 January 157.7 108.8
(Less)/plus: (Cancellation of sales)/houses sold to employees during the year (2.0) 61.1
Plus: Interest capitalised 0.3 1.9
Plus: Fair value adjustment — interest received 11.2 8.2
Less: Settlement of employee housing loan receivable — (0.5)
Less: Impairment (refer to Note 27) — (0.1)
Less: Employee housing benefit reallocation* — (21.7)
Closing balance at 31 December 167.2 157.7
* Fair value adjustment (refer to Note 8)
Notes to the consolidated annual financial statements and related accounting policies continuedfor the year ended 31 December 2016
28 I Royal Bafokeng Platinum Annual Financial Statements 2016

8. Employee housing benefit The Group recognises the difference between the fair value of the employee housing receivable at initial recognition and
the transaction price as an employee benefit. The initial difference is amortised over the shorter of the service period of the employee or the loan period. If the employee’s service period differs from the initial expectation on occupation date, the change in expectation is recognised as a profit or loss in the statement of comprehensive income. The portion of the short-term employee benefit to be realised within 12 months from the reporting date is presented as part of current assets, the balance of the amount is presented as a non-current asset in the statement of financial position.
Group
2016R (million)
2015R (million)
Employee housing benefitOpening balance at 1 January 55.7 39.9 Plus: Additions for the year (reallocations from employee housing loan receivable — refer to Note 7) — 21.7Less: Amortisation charge for the year (4.2) (4.0)Less: Impairment* (refer to Note 27) (0.8) (1.9)
Closing balance at 31 December 50.7 55.7
Split between:Non-current portion of employee housing benefit 46.5 51.4
Current portion of employee housing benefit 4.2 4.3
* The impairment is as a result of agreements being terminated due to dismissals, resignations or cancellations
9. Insurance investmentThe insurance investment is classified at fair value through profit or loss (FVTPL). These assets are recognised at fair value and any subsequent gains or losses are recognised in the statement of comprehensive income and shown under other income.
The insurance investment relates to a cell captive set up to cover retrenchment for employees having an employee housing loan.Group
2016R (million)
2015R (million)
Insurance investment relating to the RBPlat housing projectOpening balance at 1 January 31.0 — Plus: Additions for the year 2.9 30.0 Plus: Fair value adjustments 1.1 1.0
Closing balance at 31 December 35.0 31.0
10. Employee housing assets Employee housing assets are recognised at cost which consists of the cost of the land and the cost to construct the houses. No
depreciation is recognised on the employee houses as the intention is to sell the houses within a short period of time after their construction.
When the employee housing assets are sold to employees, the carrying amount of the house is derecognised. The difference between the proceeds received and the carrying amount of the house is recognised in profit or loss as a gain or loss on disposal of employee housing.
The employee housing assets are held for the purpose of trading and are classified as current assets.
Group
2016R (million)
2015R (million)
Employee housing assetsOpening balance 264.2 54.8
Additions of houses for the year (includes cancellation of sale agreements) 1.7 2.1
Additions to land purchased for Phase 2 of the housing project — 260.4
Additions due to construction of houses for Phase 2 of the housing project 83.2 —
Houses sold to employees during the year (exclusive of VAT) — (53.1)
Transfer of house to property, plant and equipment (0.4) —
Interest on PIC housing facility capitalised (refer to Note 19) 28.6 —
Closing balance 377.3 264.2
Royal Bafokeng Platinum Annual Financial Statements 2016 I 29

Notes to the consolidated annual financial statements and related accounting policies continuedfor the year ended 31 December 2016
11. Inventories Stores and materials (consumables) are valued at the lower of cost or net realisable value, on a weighted average basis.
Obsolete, redundant and slow-moving stores are identified and written down to their net realisable values. Net realisable value is the estimated selling price in the ordinary course of business, less selling expenses. This write-down is reflected in cost of sales.
Product inventory consists of stockpiles of ore mined for processing at a later stage. Stockpiles are stated at the lower of cost or net realisable value. Cost is determined using the weighted average cost method. The cost of stockpiles comprises directly attributable mining costs including depreciation. It excludes borrowing costs. Net realisable value is the estimated selling price in the ordinary course of business, less the costs of processing to concentrate as final product and selling expenses.
Group
2016R (million)
2015R (million)
InventoriesConsumables 51.7 41.5
Stockpiles 27.7 13.6
Closing balance at 31 December 79.4 55.1
All inventories are carried at cost. There is no inventory write-down to net realisable value.
12. Trade and other receivables Trade receivables are recognised initially at fair value and subsequently measured at amortised cost using the effective interest
method, less provision for impairment. A provision made for impairment of trade receivables is established when there is objective evidence (e.g. when amounts are overdue for a significant period of time) that the Group will not be able to collect all amounts due according to the original terms of the receivables. The amount of the provision is the difference between the asset’s carrying amount and the recoverable amount, being the present value of expected cash flows, discounted at the original effective interest rates. The carrying amount of the asset is reduced through the use of an allowance account, and the amount of the loss is recognised in the statement of comprehensive income as an administrative expense.
Loans and receivables are non-derivative financial assets with fixed or determinable payments that are not quoted in an active market. They are included in current assets except for maturities greater than 12 months after the statement of financial position date. Loans and receivables comprise trade and other receivables in the statement of financial position excluding prepaid tax, prepaid expenses and VAT receivable. Loans and receivables are initially recognised at cost.
Financial assets are classified at fair value through profit or loss (FVTPL) when the asset is either held for trading or is a derivative that does not satisfy the criteria for hedge accounting or is designated at FVTPL.
Group
2016R (million)
2015R (million)
Trade and other receivablesTrade receivables (RPM concentrate debtors — refer to Note 30) 1 313.0 1 181.5
Impala royalty receivable (refer to Note 24) 22.2 12.7
VAT receivable 13.9 20.4
RPM capital contribution to housing costs — 71.8
Forward exchange contracts and call options — 11.9
Other receivables 56.5 67.4
Closing balance at 31 December 1 405.6 1 365.7
RBR entered into a disposal of concentrate agreement with RPM during 2002 in terms of which RBR’s share of the concentrate of the PGMs produced by the BRPM JV will be treated by RPM.
In terms of the agreement, the commodity prices used in the calculation of the concentrate payments are based on the average daily rates for the third month following the month of delivery. Payment is due on the last day of the fourth month following delivery (refer to Note 33.1.1 for sensitivity analysis).
Concentrate debtors is fair valued every month following delivery until the price is fixed at the end of the third month. The fair value adjustment is recognised in the statement of comprehensive income as an adjustment to revenue.
30 I Royal Bafokeng Platinum Annual Financial Statements 2016

13. Current tax receivableGroup
2016R (million)
2015R (million)
Current tax receivableOpening balance at 1 January 3.6 2.3
Income tax charge (refer to Note 28) (24.7) (76.9)
Refund received (2.5) (0.4)
Payments made 25.2 78.6
Closing balance at 31 December 1.6 3.6
14. Cash and cash equivalents Cash and cash equivalents are recognised in the statement of financial position at cost. For the purposes of the cash flow
statement, cash and cash equivalents comprise cash on hand, deposits held on call with banks, money market investments and other short-term highly liquid investments with original maturities of three months or less. Bank overdrafts are shown within borrowings in current liabilities on the statement of financial position.
Group
2016R (million)
2015R (million)
Cash and cash equivalentsCash at bank and on hand 65.3 312.5
Short-term deposits 770.2 605.1
Closing balance at 31 December 835.5 917.6
The cash and cash equivalents above are split as follows:
Cash and cash equivalents — 100% BRPM JV 370.5 326.1
Cash and cash equivalents — RBPlat corporate office 426.0 531.0
Cash and cash equivalents — RBRP (housing project ring-fenced cash) 39.0 60.5
Closing balance at 31 December 835.5 917.6
Royal Bafokeng Platinum Annual Financial Statements 2016 I 31

14. Cash and cash equivalents continued Facilities
During 2016, RBR extended its R500 million revolving credit facility (RCF) with Nedbank repayable by 31 December 2016 to 30 June 2017. Interest on this RCF is based on JIBAR plus a margin of 2.85% nacq in arrears. There is a commitment fee of 0.8% per annum on the available amount.
The R458 million general banking facilities (GBF) which were repayable by 31 December 2016 were also extended to 30 June 2017. The general banking facilities are split between a R252 million (2015: R258 million) overdraft facility and R206 million (2015: R200 million) letters of guarantee and bear interest at the prime rate. There are commitment fees of 0.8% per annum on the unutilised portion of these working capital facilities.
The security provided in connection with the RCF and GBF includes a limited guarantee by the Company in favour of Nedbank a cession and pledge of the Company’s shares in and claims against RBR as security for its obligations under the limited guarantee and a subordination by the Company of its claims against RBR in favour of Nedbank. RBR also provides a cession in security pursuant to which it cedes and pledges its rights, title and interest in respect of, or connected with, BRPM and the joint venture agreement. RBR can voluntarily prepay and cancel the facility at any time without penalty.
RBR may also not, without the prior written approval of Nedbank, inter alia: > encumber any of its assets > make any substantial change to the nature of its business > dispose of any assets or enter into an amalgamation, demerger, merger or corporate reconstruction (other than certain permitted disposals)
> enter into a transaction or acquisition classified as a Category 1 transaction under the JSE Listings Requirements > amend any material term of a material contract including the joint venture agreement and the disposal of concentrate agreement, although in the latter three cases Nedbank’s consent may not be unreasonably withheld.
If RBR undertakes any of these actions without Nedbank’s prior written consent, it is obliged, if Nedbank so requires, to immediately repay the RCF and GBF.
At year-end RBR utilised R201.2 million (2015: R158.5 million) of its R450 million working capital facility for guarantees. RBP MS utilised R0.8 million (2015: R0.4 million) of its working capital facility of R5 million for guarantees. RBPlat has a R3 million working capital facility which is unutilised at year-end. Refer to Note 21 for further details.
The Group's utilised and available facilities are shown in the table below:
Facility amountR (million)
Utilised amountR (million)
Available fundsR (million)
Repayment dateR (million)
Committed facilities
2016Revolving credit facility 500.0 — 500.0 30 June 2017
General banking facilities 458.0 (202.0) 256.0 30 June 2017
PIC housing facility 2 200.0 (389.2) 1 810.8 Refer Note 19
Total 3 158.0 (591.2) 2 566.8
2015General banking facilities 458.0 (158.9) 299.1 31 December 2015
PIC housing facility 2 200.0 (349.2) 1 850.8 Refer Note 19
Total 2 658.0 (508.1) 2 149.9
The revolving credit and working capital facilities commitment fees as well as administration fees on guarantees are recognised in corporate office administration expenses.
15. Share capital and share premium Ordinary shares are classified as equity.
Incremental costs directly attributable to the issue of new ordinary shares or options are shown in equity as a deduction, net of tax, from the proceeds.
The carrying value of the Company’s shares held by the Mahube Trust and the Company’s subsidiaries in respect of the Group’s share option and bonus share schemes are reflected as treasury shares and shown as a reduction in shareholders’ equity.
When share options are exercised, the Company issues new shares or issues shares from the treasury shares. The proceeds received net of any directly attributable transaction costs are credited to share capital and share premium when options are exercised.
Notes to the consolidated annual financial statements and related accounting policies continuedfor the year ended 31 December 2016
32 I Royal Bafokeng Platinum Annual Financial Statements 2016

15. Share capital and share premium continued Group
2016R
2015R
Share capital and share premiumAuthorised share capital
250 000 000 (2015: 250 000 000) ordinary shares with a par value of R0.01 each 2 500 000 2 500 000
1 500 000 (2015: 1 500 000) “A1” ordinary shares with a par value of R0.01 each 15 000 15 000
1 500 000 (2015: 1 500 000) “A2” ordinary shares with a par value of R0.01 each 15 000 15 000
1 500 000 (2015: 1 500 000) “A3” ordinary shares with a par value of R0.01 each 15 000 15 000
Total authorised share capital 2 545 000 2 545 000
Issued ordinary share capital
The movement in the issued share capital of the Company is as follows:
Opening balance of 191 743 614 (2015: 191 130 657) ordinary shares with a par value of R0.01 1 917 436 1 911 306
2 110 091 (2015: 833 085) ordinary shares issued as part of management share incentive schemes 21 101 8 331
187 971 Mahube shares vested in March 2015 — 1 880
424 985 BSP shares vested in April 2015 — 4 250
534 376 BSP shares vested April 2016 5 343 —
Less: Treasury shares 2 110 091 (2015: 833 085) ordinary shares issued as part of management share incentive schemes (21 101) (8 331)
Total 192 277 990 (2015: 191 743 614) ordinary shares 1 922 779 1 917 436
Issued “A1”, “A2” and “A3” ordinary share capital
Opening balance of nil (2015: 281 957) “A” ordinary shares — 2 821
281 957 “A2” ordinary shares repurchased and cancelled in 2014 — —
281 957 “A3” ordinary shares repurchased and cancelled in 2015 — (2 821)
Closing balance of nil “A” ordinary shares issued to Mahube Trust — —
At 31 December 2016, the treasury shares outstanding amounted to 3 558 475 (2015: 1 982 760) ordinary shares.
Share premium R (million) R (million)
Opening balance 9 366.1 9 329.2
2 110 091 (2015: 833 085) ordinary shares issued as part of management share incentive schemes 81.8 47.2
Mahube shares vested in March — 12.2
424 985 BSP shares vested in April 2015 — 24.7
534 376 BSP shares vested in April 2016 31.3 —
Share options exercised 3.4 —
Less: Treasury shares
2 110 091 (2015: 833 085) ordinary shares issued as part of management share incentive schemes (81.8) (47.2)
Total share premium 9 400.8 9 366.1
The “A” ordinary shares were issued to the Mahube Trust as part of the Company's employee share ownership plan and these “A” ordinary shares are not listed.
The “A” ordinary shares are treated as treasury shares as the Mahube Trust is consolidated as a special purpose vehicle.
During the year 2 110 091 (2015: 833 085) ordinary shares were issued as part of the Company's employee incentive schemes.
Royal Bafokeng Platinum Annual Financial Statements 2016 I 33

16. Share-based payment reserveGroup
2016R (million)
2015R (million)
Share-based payment reserveOpening balance at 1 January 194.7 176.6
Share-based payment expense to statement of comprehensive income 45.1 48.5
Share-based payment expense capitalised to Styldrift I project (refer Note 3) 7.7 6.5
Mahube ordinary shares vested in March — (12.2)
BSP shares vested (31.3) (24.7)
Closing balance at 31 December 216.2 194.7
17. Non-distributable reserveGroup
2016R (million)
2015R (million)
Capital contribution from RPM relating to the housing projectOpening balance 71.8 71.8
Increase in contribution 10.7 —
Closing balance at 31 December 82.5 71.8
18. Deferred tax Deferred tax assets and liabilities are determined using the liability method for all timing differences arising between the tax
bases of assets and liabilities and their carrying amounts for financial reporting purposes. Deferred tax is determined using tax rates that have been enacted or substantially enacted before the statement of financial position date and are expected to apply when the related deferred tax asset is realised or the deferred tax liability is settled.
Deferred tax assets are recognised to the extent that it is probable that future taxable profits will be available, against which the temporary differences can be utilised.
Deferred tax assets and liabilities are only offset when they relate to income taxes levied by the same tax authority and the Group intends to settle its current tax assets and liabilities on a net basis.
Group
2016R (million)
2015R (million)
Deferred tax comprises:
Deferred tax asset (38.8) (34.8)
Deferred tax liability 3 635.3 3 663.7
Closing balance at 31 December 3 596.5 3 628.9
Mineral rights
R (million)
Property, plant and
equipmentR (million)
ProvisionsR (million)
Other R (million)
TotalR (million)
Deferred tax
2016At 1 January 2016 1 614.5 1 902.2 (56.1) 168.3 3 628.9
Charged to statement of comprehensive income (10.3) 56.0 (10.8) (67.3) (32.4)
At 31 December 2016 1 604.2 1 958.2 (66.9) 101.0 3 596.5
2015At 1 January 2015 1 825.1 2 593.5 (29.0) 69.5 4 459.1
Charged to statement of comprehensive income (210.6) (691.3) (27.1) 98.8* (830.2)
At 31 December 2015 1 614.5 1 902.2 (56.1) 168.3 3 628.9
* Includes R60 million prior year adjustment relating to RBR's 2008, 2009 and 2010 tax settlement
Tax losses included in RBP MS and RBRP, which are not recognised as deferred tax assets, amount to R151 million (2015: R141 million) and R31 million (2015: R17 million) respectively. RBR has an unredeemed capital allowance of R2 225 million (2015: R1 931 million) which will be carried forward to 2017. No deferred tax asset is recognised on this balance. Of the deferred tax liability, approximately R3 267 million (2015: R3 281 million) will realise after 12 months.
Notes to the consolidated annual financial statements and related accounting policies continuedfor the year ended 31 December 2016
34 I Royal Bafokeng Platinum Annual Financial Statements 2016

19. PIC housing facility During the period under review the PIC housing facility was utilised to fund the construction of houses for Phase 2 of the housing
project as well as the insurance investment referred to in Notes 9 and 10. The PIC housing facility is a R2.2 billion facility accruing interest at CPI plus a margin of 1%. Security for the PIC housing facility is ring-fenced to the housing project assets with no recourse to the BRPM JV business.
The PIC housing facility was initially recognised at the fair value of the consideration received, net of transaction costs incurred. In subsequent periods, borrowings are stated at amortised cost using the effective interest rate method. Any difference between proceeds (net of transaction costs) and the redemption value is recognised in the statement of comprehensive income over the period of the borrowing.
The effective interest method is a method of calculating the amortised cost of a financial asset or a financial liability (or group of financial assets or liabilities) and of allocating the interest income or interest expense over the relevant period. The effective interest rate is the rate that discounts estimated future cash payments or receipts through the expected life of the financial instrument or, where appropriate, a shorter period to the net carrying amount of the financial asset or liability. When calculating the effective interest rate, the Group estimates cash flows, considering all the contractual terms of the financial instrument but does not consider future credit losses.
The calculation includes all fees paid or received between the parties to the contract that are an integral part of the effective interest rate, transaction costs, and all other premiums or discounts. There is a presumption that the cash flows and the expected life of a group of similar financial instruments can be estimated reliably. However, in those rare cases when it is not possible to estimate reliably the cash flows or the expected life of a financial instrument (or group of financial instruments), the Group shall use the contractual cash flows over the full contractual term of the financial instrument (or group of financial instruments).
Initial recognition The best evidence of the PIC housing facility’s fair value on initial recognition is the transaction price. However, due to RBRP
paying a preferential interest rate of CPI plus 1%, the fair value may differ from the transaction price. The Group therefore determined a market-related rate for the financial liability based on the rate of debt funding available to the Group at that specific point in time. The Group recognises the difference between fair value at initial recognition and the transaction price as a fair value adjustment to loan. The initial difference is amortised over the term of the PIC housing facility.
Subsequent measurement The financial liability payable to the PIC is accounted for at amortised cost (recognised at fair value at initial recognition) using
the appropriate effective interest rate as determined above.
The PIC housing facility is not repayable within 12 months from the reporting period and is presented as part of non-current liabilities in the statement of financial position.
General and specific borrowing costs that are directly attributable to the acquisition, construction or production of a qualifying asset are capitalised during the period of time that is required to complete and prepare the asset for its intended use or sale. On this basis, the interest expense on the PIC housing facility is capitalised to employee housing assets from 2016 (refer to Note 10).
Group
2016R (million)
2015R (million)
PIC housing facilityOpening balance at 1 January 366.9 — Plus: Drawdowns 40.0 326.9Plus: Transaction costs capitalised to loan — 22.3Plus: Contractual interest charges capitalised to loan (refer to Note 10) 24.2 15.1Plus: Fair value interest charges capitalised to loan (refer to Note 10) 4.4 3.7
Less: Amortisation of fair value adjustment to loan (1.5) (1.1)
Closing balance at 31 December 434.0 366.9
Royal Bafokeng Platinum Annual Financial Statements 2016 I 35

20. Restoration and rehabilitation provision Long-term obligations comprising pollution control, rehabilitation and mine closure result from environmental disturbances
associated with the Group’s mining operations. Estimates are determined by independent environmental specialists in accordance with environmental regulations.
Decommissioning costs This cost will arise from rectifying damage caused before production commences. The net present value of future
decommissioning cost estimates as at year-end is recognised and provided for in full in the financial statements. The estimates are reviewed annually to take into account the effects of changes in the estimates. Estimated cash flows have been adjusted to reflect risks and timing specific to the rehabilitation liability. Pre-tax risk-free discount rates that reflect current market assessments of the time value of money are utilised in calculating the present value.
Changes in the measurement of the liability, apart from unwinding the discount, which is recognised in profit or loss as a finance cost, are capitalised to the environmental rehabilitation asset. Decommissioning assets are amortised on a straight-line basis over the lesser of 30 years or the expected benefit period.
Restoration costs Changes in the discounted amount of estimated restoration costs are charged to profit or loss during the period in which such
changes occur. Estimated restoration costs are reviewed annually and discounted using a pre-tax risk-free rate that reflects market assessments of the value of money. The increase in restoration provisions owing to the passage of time is charged to finance costs. All other charges in the carrying amount of the provision subsequent to initial recognition are included in profit or loss in the period in which they are incurred.
Changes in the open pit accrual are recognised in the statement of comprehensive income as part of cost of sales.
Ongoing rehabilitation cost The cost of ongoing current programmes to prevent and control pollution is recognised as an expense when incurred.
Critical accounting estimates and assumptions Environmental rehabilitation obligations
The Group’s mining and exploration activities are subject to various laws and regulations governing the protection of the environment. The Group recognises management’s best estimate for asset retirement obligations in the period in which they are incurred. Actual costs incurred and actual timing thereof in future periods can differ materially from the estimates. Additionally, future changes to environmental laws and regulations, life of mine estimates and discount rates can affect the carrying amount of this provision.
Estimated long-term environmental provisions, comprising pollution control, rehabilitation and mine closure, are based on the Group’s environmental policy taking into account current technological, environmental and regulatory requirements. Provisions for future rehabilitation costs have been determined, based on calculations which require the use of estimates.
Key assumptions used were:
2016 2015
Current cost estimate R (million) 229.2 216.6
Real pre-tax risk-free discount rate (%) 4 4
Group
2016R (million)
2014R (million)
Restoration and rehabilitation provisionOpening balance at 1 January 95.1 88.2
Unwinding of discount (refer to Note 25) 7.2 5.7
Change in estimate of provision taken to statement of comprehensive income (1.4) 1.2
Change in estimate of provision taken to decommissioning asset (6.7) —
Restoration and rehabilitation provision closing balance at 31 December 94.2 95.1
Plus: Other long-term provisions 1.5 —
Closing balance at 31 December 95.7 95.1
Refer to Note 6 for the environmental trust deposits made to fund this estimate and Note 21 for guarantees issued to fund the remainder.
Notes to the consolidated annual financial statements and related accounting policies continuedfor the year ended 31 December 2016
36 I Royal Bafokeng Platinum Annual Financial Statements 2016

21. Contingencies and commitmentsGroup
2016R (million)
2015R (million)
Guarantees and commitments
21.1 Guarantees issuedRoyal Bafokeng Resources Proprietary Limited, a wholly owned subsidiary of RBPlat, granted the following guarantees:
Eskom to secure power supply for Styldrift I project (guarantee 30823102) 17.1 17.1
Eskom early termination guarantee for the Styldrift I project (guarantee 31160603) 17.5 17.5
Eskom connection charges guarantee for the Styldrift I project (guarantee 31173918) 40.0 40.0
Anglo American Platinum for the rehabilitation of land disturbed by mining activities and BRPM (guarantee 31247601) 82.6 82.6
Department of Mineral Resources for the rehabilitation of land disturbed by prospecting/mining (guarantee 32388608) 1.3 1.3
Eskom security guarantee for power supply to Styldrift I project (guarantee 34058907) 42.7 —
Royal Bafokeng Platinum Management Services Proprietary Limited, a wholly owned subsidiary of RBPlat, granted the following guarantees:
Tsogo Sun guarantee arising from lease agreement (2016: guarantee 34045600) (2015: guarantee 33465401) 0.7 0.3
Tsogo Sun guarantee arising from lease agreement (2016: guarantee 34045708) (2015: guarantee 31100309) 0.1 0.1
Total bank guarantees issued at 31 December 202.0 158.9
Department of Mineral Resources for prospecting, exploration, mining or production operations for Styldrift II project (demand insurance guarantee Q/G/30286/0416/001) 45.7 —
Total insurance guarantees issued at 31 December 45.7 —
21.2 Guarantees received from Anglo American PlatinumFor Anglo American Platinum’s 33% share of the Eskom guarantee to secure power supply for Styldrift I project (guarantee M523084) (5.6) (5.6)
For Anglo American Platinum’s 33% share of the Eskom early termination guarantee for the Styldrift I project (guarantee M529349) (5.8) (5.8)
For Anglo American Platinum’s 33% share of the Eskom connection charges guarantee for the Styldrift I project (guarantee M529350) (13.2) (13.2)
Total guarantees received at 31 December (24.6) (24.6)
Royal Bafokeng Platinum Annual Financial Statements 2016 I 37

21. Contingencies and commitments continuedGroup
2016R (million)
2015R (million)
21.3 Capital commitments in respect of property, plant and equipmentCapital commitments relate to the Styldrift I and BRPM Phase III projects
Contracted commitments 485.3 608.7
Approved expenditure not yet contracted for 3 311.3 4 523.0
Total 3 796.6 5 131.7
The capital commitments reflect 100% of the BRPM JV project commitments. In terms of the BRPM JV agreement, RBR must fund 67% thereof and RPM the remaining 33%.
Should either party elect not to fund its share, its interest will be diluted according to the terms of the BRPM JV agreement.
21.4 Operating commitments Leases Determining whether an arrangement is, or contains, a lease is based on the substance of the arrangement, and
requires an assessment of whether fulfilment of the arrangement is dependent on the use of a specific asset or assets and whether the arrangement conveys the right to control the asset.
Leases of assets under which substantially all the benefits and risks of ownership are effectively retained by the lessor are classified as operating leases. Payments made under operating leases are expensed to profit or loss on the straight-line basis over the life of the lease. When an operating lease is terminated before the lease period has expired, any payment required to be made by the lessor by way of a penalty is recognised as an expense in the period in which the termination takes place.
The Group leases offices for its corporate office in Johannesburg. The corporate office lease term is five years and is renewable at the end of the lease period at market rates. The lease expired at the end of September 2016 and was renewed for a further five years.
Minimum lease payments on the corporate office operating lease are charged against administration expenses for corporate office on a straight-line basis over the lease term.
The Group leases drill and support rigs for a three-year period under an operating lease. Minimum lease payments on the drill and support rigs lease are charged against material and other mining costs for the BRPM JV.
Group
2016R (million)
2015R (million)
The future aggregate lease payments under our operating leases are as follows:
No later than one year 4.0 4.7
Later than one year and no later than five years 10.6 1.1
Total 14.6 5.8
21.5 Contingent liability The BRPM JV may have a potential exposure to remediate groundwater and soil pollution that may exist where the
JV operates. The operations continue to monitor and mitigate impacts if and when they arise. Our groundwater pollution plume model will be updated in 2017 to quantify the size and rate of the plume movement. This will assist us in determining appropriate remediation actions.
The ultimate outcome of the matter cannot presently be determined and no liability has been raised in the annual financial statements. BRPM constructed a water treatment plant in 2015 which has reduced our dependence on Magalies Water.
Notes to the consolidated annual financial statements and related accounting policies continuedfor the year ended 31 December 2016
38 I Royal Bafokeng Platinum Annual Financial Statements 2016

22. Trade and other payables Trade payables are recognised initially at fair value and subsequently measured at amortised cost.
Provisions are recognised when the Group has a present legal or constructive obligation as a result of past events, when it is probable that an outflow of resources embodying economic benefits will be required to settle the obligation and when a reliable estimate of the amount of the obligation can be made.
Provisions are measured using the best estimate of expenditure required to settle the obligation, i.e. the amount that the Group would rationally pay to settle the obligation or transfer to a third party.
Where the effect of discounting is material, provisions are discounted to reflect the present value. The discount rate used is a pre-tax rate that reflects current market assessments of the time value of money and, where appropriate, the risks specific to the obligation. Provisions are not recognised for future operational losses.
Financial liabilities at FVTPL are recognised at fair value and any subsequent gains or losses are recognised in the statement of comprehensive income and shown under other income. The forward exchange contracts entered into to pay Euros for equipment imported from Europe for the Styldrift I project are designated as financial liabilities held for trading (at FVTPL) as they are not designated as hedges.
Group
2016R (million)
2015R (million)
Trade and other payablesTrade payables 113.6 155.1
Payroll accruals and provisions 45.8 17.9
Housing project accruals and provisions 26.1 3.9
BRPM and Styldrift I accruals and provisions 117.0 103.9
Leave pay provisions 127.0 107.0
VAT payable 17.1 0.6
Forward exchange contracts 2.7 —
Total 449.3 388.4
23. Revenue Revenue is recognised on an accrual basis both when it is probable that the economic benefits associated with the transaction
will flow to the Group and when the amount of the revenue can be measured reliably.
Revenue from the sale of products and services is brought to account when the risks and rewards of ownership transfer and it is both probable that the economic benefits associated with the transaction will flow to the Group and the amount of the revenue can be measured reliably, net of value added tax (VAT) and discounts. In terms of the Group’s concentrate offtake agreement revenue is therefore recognised on the delivery of concentrate to RPM.
In terms of the agreement, the commodity prices used in the calculation of the concentrate payment are based on the average daily prices for the third month following the month of delivery. Payment is due on the last day of the fourth month following the month of delivery. The adjustment to the trade debtors to reflect the actual amount to be received for concentrate sold is recognised through revenue.
Group
2016R (million)
2015R (million)
RevenueRevenue from concentrate sales — production from BRPM concentrator 2 928.3 2 619.5
Revenue from UG2 toll concentrate 343.7 438.0
Revaluation of revenue (prior year October, November and December deliveries prices finalised) 70.2 (12.8)
Total 3 342.2 3 044.7
Revenue and concentrate trade debtors are fair valued every month following the month of delivery of concentrate to RPM until the price is fixed in the third month following delivery. The fair value adjustment is recognised in revenue.
This means that revenue reflected for the financial years above includes the revaluation of the October, November and December deliveries of the previous year and the current year’s October, November and December concentrate deliveries are remeasured at year-end at the average prices for December. The realised prices for a specific financial year will only be finalised in January, February and March of the following financial year as the prices for deliveries for the last three months of the financial year are then fixed.
Royal Bafokeng Platinum Annual Financial Statements 2016 I 39

23. Revenue continued Group
2016R (million)
2015R (million)
Revenue per metalPlatinum 2 146.3 1 952.1
Palladium 597.7 524.3
Rhodium 140.0 147.8
Gold 122.0 104.0
Nickel 204.4 197.3
Other 131.8 119.2
Total revenue 3 342.2 3 044.7
2016
64.2% ■ Platinum
17.9% ■ Palladium
3.7% ■ Gold
4.2% ■ Rhodium
1.2% ■ Iridium
0.4% ■ Ruthenium
6.1% ■ Nickel
1.9% ■ Copper
0.4% ■ Cobalt
Revenue contribution 2016
24. Other income Income is recognised on an accrual basis when it is both probable that the economic benefits associated with the transaction
will flow to the Group and the amount of the revenue can be measured reliably.
Levy income from housing assets is recognised on an accrual basis as it is invoiced every month and is classified as other income for the Group.
Foreign currency transactions are translated into the functional currency using the exchange rates prevailing at the dates of the transactions or valuation where the items are remeasured. Foreign exchange gains or losses resulting from the settlement of such transactions and from the translation at year-end exchange rates of monetary assets and liabilities denominated in foreign currencies, are recognised in other income.
The forward exchange contracts and call options entered into to pay Euros for equipment imported from Europe for our Styldrift I project are initially recognised at fair value and subsequent gains or losses are recognised in other income.
Group
2016R (million)
2015R (million)
Other incomeImpala royalty (Group resources mined by Impala Platinum Limited) 65.7 46.7
Fair value adjustment of the Nedbank equity-linked deposit (refer to Note 6) 11.7 (1.5)
Levy and other income from housing assets 2.7 1.8
Realised and unrealised gains and losses on fair value of forward exchange contracts and call options 1.3 21.4
Other income 6.7 0.3
Total 88.1 68.7
The Impala royalty consists of royalties received from Impala for mining from its 6 and 8 shafts and 20 shaft area. The 6 and 8 shafts royalty is calculated by applying a factor that is linked to the Impala Rustenburg operations’ gross profit margin with a minimum of 5% and a maximum of 25% of revenue. Impala pays a 17.5% of revenue royalty to the BRPM JV for the 20 shaft area.
During the year R35.1 million (2015: R40.0 million) royalty income was received for the 6 and 8 shaft areas and R30.6 million (2015: R6.7 million) for the 20 shaft area.
Notes to the consolidated annual financial statements and related accounting policies continuedfor the year ended 31 December 2016
2015
64.1%
17.2%
3.4%
4.9%
1.1%
0.4%
6.5%
2.0%
0.4%
Revenue contribution 2015
■ Platinum
■ Palladium
■ Gold
■ Rhodium
■ Iridium
■ Ruthenium
■ Nickel
■ Copper
■ Cobalt
Revenue contribution 2015
40 I Royal Bafokeng Platinum Annual Financial Statements 2016

25. Net finance income Interest income is recognised on a time proportion basis, taking account of the principal outstanding and the effective rate over
the period of maturity, when it is probable that such income will accrue to the Group.
The effective interest rate for the receivable from employees for housing assets is based on a market-related interest rate based on the average credit profile per band of employees.
Dividend income is recognised when the right to receive payment is established.
Borrowing costs are charged to interest expense. The effective interest rate for the interest payable on the PIC housing facility is based on a market-related interest rate based on the rate of the revolving credit facility available to the Group.
Group
2016
R (million)2015
R (million)
25.1 Finance income consists of the following:Interest received on environmental trust deposits (refer to Note 6) 0.9 0.1Interest received on investments 59.8 74.6Interest received on employee housing receivable 26.1 21.8Dividend income on investments 5.0 9.7Total finance income 91.8 106.2
25.2 Finance cost consists of the following:Interest expense (0.2) (0.6)Interest expense — PIC housing facility (refer to Note 19) — (18.8)Unwinding of discount on decommissioning and restoration provision (Refer to Note 20) (7.2) (5.7)
Total finance cost (7.4) (25.1)
Net finance income 84.4 81.1
26. Profit/(loss) before tax Short-term employee benefits
Remuneration to employees is charged to profit or loss on an ongoing basis. Provision is made for accumulated leave, incentive bonuses and other short-term employee benefits.
Termination benefits Termination benefits are payable when employment is terminated by the Group before the normal retirement date, or whenever
an employee accepts voluntary redundancy in exchange for these benefits. The Group recognises termination benefits at the earlier of the following dates: > When the Group can no longer withdraw the offer of those benefits > When the entity recognises costs for a restructuring that is within the scope of IAS 37 and involves the payment of termination benefits.
In the case of an offer made to encourage voluntary redundancy, the termination benefits are measured based on the number of employees expected to accept the offer. Benefits falling due more than 12 months after the end of the reporting date are discounted to present value.
Defined contribution retirement plans Employee benefit schemes are funded through payments to trustee-administered funds, determined by periodic actuarial
calculations.
A defined contribution plan is a pension scheme under which the Group pays fixed contributions into a separate entity. The Group has no legal or constructive obligation to pay further contributions if the fund does not hold sufficient assets to pay all the employees the benefits relating to employees’ service in the current and prior periods.
The Group operates or participates in defined contribution retirement plans for its employees. The pension plans are funded by payments from employees and by the relevant Group companies’ trustee-administered funds, and contributions to these funds are expensed as incurred. The assets of the different plans are held by independently managed trust funds. The funds are governed by the South African Pension Funds Act of 1956.
Bonus provision The Group recognises a provision for bonuses based on a formula that takes into consideration production and safety
performance. The Group recognises a provision when contractually obliged or where there is a past practice that has created a constructive obligation.
Share-based payments The Group operates a number of equity-settled, share-based compensation plans, under which the entity receives services from
employees as consideration for equity instruments (options) of the Group. The fair value of the employee services received in exchange for the grant of the options is recognised as an expense. The total amount to be expensed is determined by reference to the fair value of the options granted: > including any market performance conditions (for example, an entity’s share price) > excluding the impact of any service and non-market performance vesting conditions (for example, profitability, production targets and remaining an employee of the entity over a specified time period)
> including the impact of any non-vesting conditions (for example, the requirement for employees to save).
Royal Bafokeng Platinum Annual Financial Statements 2016 I 41

26. Profit/(loss) before tax continued Share-based payments continued Non-market vesting conditions are included in assumptions about the number of options that are expected to vest. The total
expense is recognised over the vesting period, which is the period over which all of the specified vesting conditions are to be satisfied. At the end of each reporting period, the entity revises its estimates of the number of options that are expected to vest based on the non-market vesting conditions. It recognises the impact of the revision to original estimates, if any, in the statement of comprehensive income, with a corresponding adjustment to equity.
Critical accounting estimates and assumptions Share-based payments
The Group has various share-based payment plans in place. All share-based payment schemes are treated as equity-settled and therefore valued on grant date.
Bonus share plan The Company has established a bonus share plan (BSP) for its executive directors and senior managers, which is linked to the
employee’s annual cash bonus. The Remuneration Committee of the Company is responsible for operating the BSP.
Following the announcement of the Company’s annual results, employees participating in the BSP are awarded a number of bonus shares, which constitute a specified percentage of the employee’s annual cash bonus (dependent on job category). Such bonus shares are held on the employee’s behalf by an escrow agent for a period of three years after their award. These bonus shares will be forfeited should an employee leave before the three-year period.
Shares issued in terms of this scheme are accounted for as equity-settled share-based payments.
The grant date fair value is based on the closing price the day prior to the Remuneration Committee approval of the awards.
Forfeitable share plan The Company has established a forfeitable share plan (FSP) for its executive directors and senior managers. The FSP is linked
to future performance of the Company as compared to its peers, utilising the total shareholder return (TSR) as a measure of performance. The Remuneration Committee is responsible for managing the FSP.
Employees participating in the FSP are awarded a number of forfeitable shares, based on their level and responsibility. The Remuneration Committee decides the award policy, which in 2016 was a multiple of TGP. The shares are held in escrow until they vest. The shares vest in equal tranches on the third, fourth and fifth anniversary of award. The proportion of shares that vest is based on the Company’s performance on the third anniversary. The employee has to stay in the employment of the Company for the period and the performance criteria have to be met for the shares to vest. On the vesting date, the employee receives shares. The forfeitable shares will be forfeited should an employee leave before the three year period.
Shares issued in terms of this scheme are accounted for as equity-settled share-based payments.
The grant date fair value is based on the closing price the day prior to the Remuneration Committee approval of the awards.
Forfeitable share plan — retention The Company established a forfeitable share plan — retention (FSP — retention) for its executive directors and senior managers
in 2016. The FSP — retention is linked to future performance of the Company.
Employees participating in the FSP — retention are awarded a number of forfeitable shares, based on their level of responsibility. The Remuneration Committee decides the award policy which in 2016 was a multiple of total group package (TGP). The shares are held in escrow until they vest. The shares vest in one tranche on the third anniversary. The employee has to stay in the employment of the Company for the period and the performance criteria have to be met for the shares to vest. On the vesting date, the employees receive shares. The forfeitable shares-retention will be forfeited should an employee leave before the three-year period.
Shares issued in terms of this scheme are accounted for as equity-settled share-based payments.
The grant date fair value is based on the closing price the day prior to the Remuneration Committee approval of the awards.
2010 share option plan Certain directors and senior managers of the Company (including all of the current executives of the Company) have been
granted options to acquire shares. The options were granted at an initial price, which is linked to the J153 Platinum Index when hired. The strike price of the options was adjusted on the listing of the holding company, RBPlat, in accordance with a specified formula and was linked to RBPlat’s share price. Post RBPlat’s listing, share options are granted at the RBPlat share price on date of grant. The fair value of options granted is determined using the binomial model. The volatility is measured based on the RBPlat share price. The share options vest from years three to five from when they were granted in three equal tranches.
Notes to the consolidated annual financial statements and related accounting policies continuedfor the year ended 31 December 2016
42 I Royal Bafokeng Platinum Annual Financial Statements 2016

26. Profit/(loss) before tax continued Share-based payments continued Mahube Trust Employee Share Scheme
The Royal Bafokeng Platinum Mahube Trust (Mahube Trust) has been implemented to replace the value forfeited by qualifying Bafokeng Rasimone Management Services Proprietary Limited (BRMS) employees as a result of no longer qualifying as beneficiaries of the Anglo Platinum Group Employee Share Participation Scheme (Kotula).
Permanent employees of the BRPM JV are employed by BRMS. Prior to the listing of RBPlat, BRMS was a wholly owned subsidiary of RPM and qualifying BRMS employees were beneficiaries of Kotula. In terms of the rules of Kotula and as a result of the listing of RBPlat, qualifying BRMS employees forfeited all their benefits under Kotula once ownership of BRMS was transferred from RPM to RBR since BRMS was no longer a member of the Anglo American Platinum group of companies. The RBPlat Group created the Mahube Trust, an employee share ownership scheme for the benefit of qualifying BRMS employees to replicate the terms and structure, to the extent possible, of Kotula. Permanent employees who do not benefit from any other share schemes qualify for the Mahube Trust Employee Share Scheme. The beneficiary has to be in the employment of the Company on each distribution date. On distribution date, a third of Mahube’s interest in RBPlat vests and is distributed to the beneficiaries. The first distribution took place on 31 March 2013 and the final capital distribution took place on 31 March 2015.
Initial public offering bonus shares The Company invited each of the executive directors and certain other employees of the Company to participate in the share
offer on listing, on the basis that for each share that they subscribe for, the Company will issue them with an additional share free of charge (with the Company paying for the par value of such shares). The additional shares issued by the Company vested 18 months after the listing. The maximum number of shares for which each director and employee could subscribe to benefit from this scheme was limited based on the specific job grade.
The value of the various share-based payment schemes was calculated using the following inputs:
Bonus share plan2016 2015 2014 2013 2012 2011
Weighted average share price on grant date (R) 38.79 56.70 64.90 58.50 57.99 64.12Vesting years 2019 2018 2017 2016 2015 2014
Forfeitable share plan2016 2015 2014 2013 2012 2011
Weighted average share price on grant date (R) 38.79 56.70 71.90 — — —Vesting years 2019 to 2021 2018 to 2020 2017 to 2019 — — —
Forfeitable share plan — retention2016 2015 2014 2013 2012 2011
Weighted average share price on grant date (R) 38.79 — — — — —Vesting years 2019 — — — — —
Rights offer2016 2015 2014 2013 2012 2011
Weighted average share price on grant date (R) — — 55.00 55.00 55.00 —Vesting years — — 2017 2016 2015 —
2010 share option plan2016 2015 2014 2013 2012 2011
Weighted average option value on grant date (R) 19.69 20.91 37.10 37.41 29.07 —Weighted average share price on grant date (R) 39.44 44.23 66.83 57.61 57.47 —Weighted average exercise price (R) 39.44 44.23 66.83 57.61 57.47 —Volatility (%) 30.76 to 34.25 26.54 to 28.55 26.22 to 26.73 47.2 to 57.61 49.5 to 47.8 —Dividend yield — — — — — —Risk-free interest rate (%) 8.13 to 9.79 6.58 to 7.81 7.11 to 8.31 6.08 to 8.51 7.18 to 8.01 —Vesting years 2019 to 2021 2018 to 2020 2017 to 2019 2016 to 2018 2015 to 2017 2014 to 2016
The expected price volatility is (based on the historic volatility taking into account the remaining life of the options) adjusted for any expected changes to future volatility due to publicly available information.
Royal Bafokeng Platinum Annual Financial Statements 2016 I 43

26. Profit/(loss) before tax continued Share-based payments continued
Mahube Trust Employee
Share Scheme
Initial public offering
bonus shares
Weighted average option value on grant date (R) 44.67 64.90Weighted average share price on grant date (R) 65.12 64.90Volatility (%) 39.8 to 47.8 47.90Dividend yield — —Risk-free interest rate (%) 7.75 to 7.83 7.52Vesting years 2013 to 2015 8 May 2012
Refer to Note 31 for outstanding shares.
Activity on awards outstandingForfeitable share plan
retention Forfeitable share plan
Number of shares
Weighted average
award price
RNumber
of shares
Weighted average
award price
R
For the year ended 31 December 2016At 1 January 2016 — — 488 013 62.95Granted 1 153 147 38.79 642 357 38.79Forfeited — — — —Exercised/vested — — — —Expired — — — —At 31 December 2016 1 153 147 38.79 1 130 370 49.22For the year ended 31 December 2015At 1 January 2015 — — 200 670 71.91 Granted — — 287 343 56.70Forfeited — — — —Exercised/vested — — — —Expired — — — —At 31 December 2015 — — 488 013 62.95
Activity on awards outstanding
2010 share option plan Bonus share planMahube Trust
Employee Share Scheme
Number of options
Weighted average
option price
RNumber of
shares
Weighted average
award price
RNumber of
shares
Weighted average
award price
R
For the year ended 31 December 2016At 1 January 2016 5 031 262 56.35 1 333 397 59.72 — —Granted 1 895 514 38.75 69 019 38.79 — —Forfeited (257 839) 46.48 (31 255) 55.04 — —Exercised/vested (80 350) 36.30 (451 490) 58.59 — —Expired — — — — — —At 31 December 2016 6 588 587 50.28 919 671 55.23 — —For the year ended 31 December 2015At 1 January 2015 4 473 589 59.29 1 157 585 60.17 469 929 46.08 Granted 770 502 30.03 545 742 56.70 — —Forfeited (212 829) 53.97 (20 138) 55.32 — —Exercised/vested — — (349 792) 57.99 — —Expired — — — — (469 929) 70.57At 31 December 2015 5 031 262 56.35 1 333 397 59.72 — —
Notes to the consolidated annual financial statements and related accounting policies continuedfor the year ended 31 December 2016
44 I Royal Bafokeng Platinum Annual Financial Statements 2016

26. Profit/(loss) before tax continued Group
2016R (million)
2015R (million)
Included in the profit/(loss) before tax are the following items:On-mine costs: > Labour* 1 072.4 946.3 > Utilities 252.5 233.5 > Contractor costs 701.6 633.4 > Movement in inventories (14.1) 15.1 > Materials and other mining costs 695.8 694.5Materials and other mining costs for BRPM JV 738.2 734.7Elimination of intergroup management fee (42.4) (40.2)
State royalties 12.4 10.4Depreciation — property, plant and equipment 275.3 366.9Amortisation — mineral rights 36.7 62.3Share-based payment expense 27.4 29.5Social and labour plan expenditure 35.6 63.8Styldrift incidental expenses — 5.5Retrenchment costs — 20.5Other 5.9 2.8Total cost of sales 3 101.5 3 084.5Included in corporate office administrative expenses:Advisory fees 9.7 9.3Legal fees 2.3 2.4Employee costs** (including directors’ emoluments) 76.4 76.7Retrenchment costs — 1.8Mahube Trust expenditure 0.6 1.0Depreciation of RBP MS property, plant and equipment 1.6 1.0Revolving credit facility and working capital facility commitment fees and arranging fees 7.2 1.8Fees for guarantees 2.4 2.0Share-based payment expense 17.7 19.0Industry membership contributions 7.1 4.8Rent for corporate office 2.9 2.3Other 10.5 4.2Total corporate office administrative expenses 138.4 126.3Included in housing project administrative expenses:Legal fees 1.3 3.0PIC housing facility participation fee — 22.3Property rates and taxes, and water and electricity 3.0 2.8Security 2.3 1.4Maintenance 0.7 3.0Depreciation of RBRP property, plant and equipment 0.2 —Amortisation of employee housing benefit and fair value adjustment to loan 2.7 2.9Insurance expenditure 1.2 —Salaries and wages 2.5 0.4Other 3.3 2.0Total housing project administrative expenses 17.2 37.8External and internal audit fees for the GroupExternal and internal audit fees included in profit before tax:External audit fees > Fees for audit 1.7 1.4 > Other fees 0.1 0.6
Total external audit fees 1.8 2.0Internal audit fees > Fees for internal audit 2.4 1.7 > Other fees 1.0 —
Total internal audit fees 3.4 1.7* Included in labour costs are pension and provident fund contributions of R74.7 million (2015: R75.6 million)** Included in corporate office employee costs are provident fund contributions of R4.4 million (2015: R7.1 million)
Significant judgement is required in determining the provision for mining royalties. These include many transactions and calculations for which the ultimate mining royalties determination is uncertain during the ordinary course of business. Where the final outcome is different from the amounts initially recorded, such differences will impact the mining royalties, income tax and deferred tax provision in the period in which such determinations are made.
Royal Bafokeng Platinum Annual Financial Statements 2016 I 45

27. Impairment of non-financial assets The impairment charge is made up as follows:
Group
2016R (million)
2015R (million)
Impairment of non-financial assetsImpairment of property, plant and equipment (fair value) — refer to Note 3 — 2 340.8Impairment of property, plant and equipment (book value) — refer to Note 3 1.8 21.5Impairment of mineral rights (fair value) — refer to Note 4 — 690.1Impairment of goodwill — refer to Note 5 — 1 411.8Impairment of employee housing loan receivable and benefit — refer to Notes 7 and 8 0.8 2.0Total gross impairment 2.6 4 466.2Less: Tax effect (0.5) (854.7)Less: Non-controlling interest (0.4) (725.3)Net impairment 1.7 2 886.2
With the listing of the Company in 2010 the property, plant and equipment and mineral rights were fair valued and goodwill was recognised for RBR’s 67% interest in the BRPM JV for each cash-generating unit under the BRPM JV, being the BRPM operations Styldrift I and Styldrift II. No goodwill was attributed to non-controlling interest.
The cash-generating units within the BRPM JV and the remaining goodwill allocated to each of these cash-generating units following the impairments accounted for in 2015, were assessed for impairment by comparing the respective recoverable amounts to the carrying amounts for each cash-generating unit. The recoverable amount for the BRPM operations is R5.2 billion (2015: R4.6 billion). The recoverable amount for Styldrift I is R7.2 billion (2015: R6.0 billion) and the recoverable amount for Styldrift II is R3.6 billion. There was no impairment of goodwill allocated to Styldrift I and II in 2016. The recoverable amounts have been determined on a fair value less costs to sell basis using the assumptions per Note 5 in discounted cash flow models and attributable resource values. This is a fair value measurement classified as level 3.
28. Income tax credit Current tax comprises tax payable calculated on the basis of the expected taxable income for the year, using the tax rates
enacted at the statement of financial position date, and any adjustment of tax payable for previous years.
Critical estimates and assumptions Significant judgement is required in determining the provision for income taxes. There are many transactions and calculations
for which the ultimate tax determination is uncertain during the ordinary course of business. Where the final tax outcome is different from the amounts that were initially recorded, such differences will impact the income and deferred tax provisions in the period in which such determinations are made.
Group2016
R (million)2015
R (million)
Income tax creditIncome tax expense (24.7) (76.9)
Current year (24.7) (21.2)Prior year — (55.7)
Deferred tax credit 32.4 830.2 Current year 30.8 882.9Prior year 1.6 (52.7)
Total income tax credit 7.7 753.3
Tax rate reconciliation:Profit/(loss) before tax 255.0 (4 520.3)Tax (expense)/credit calculated at a tax rate of 28% (2015: 28%) (71.4) 1 265.7 Non-taxable income 17.7 2.7 Non-deductible expenses (0.3) (399.9)
Impairment of goodwill — (395.3)Other (0.3) (4.6)
Housing contribution 70.0 —Tax losses not recognised (6.7) (6.8)Prior year adjustments (1.6) (108.4)*
7.7 753.3
Effective tax rate (%) 3.0 16.7
* R110 million of the prior year tax adjustments relate to the 2008, 2009, 2010 RBR tax settlement
Notes to the consolidated annual financial statements and related accounting policies continuedfor the year ended 31 December 2016
46 I Royal Bafokeng Platinum Annual Financial Statements 2016
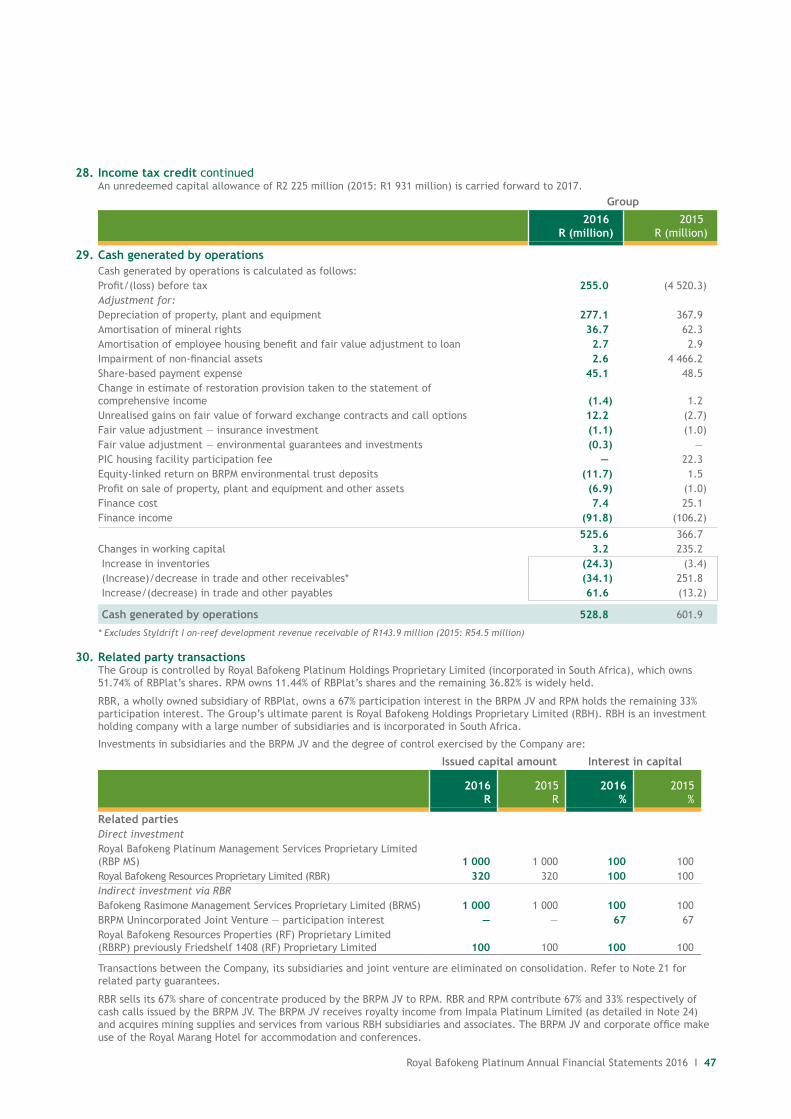
28. Income tax credit continued An unredeemed capital allowance of R2 225 million (2015: R1 931 million) is carried forward to 2017.
Group
2016R (million)
2015R (million)
29. Cash generated by operationsCash generated by operations is calculated as follows:Profit/(loss) before tax 255.0 (4 520.3)Adjustment for:Depreciation of property, plant and equipment 277.1 367.9Amortisation of mineral rights 36.7 62.3Amortisation of employee housing benefit and fair value adjustment to loan 2.7 2.9Impairment of non-financial assets 2.6 4 466.2Share-based payment expense 45.1 48.5Change in estimate of restoration provision taken to the statement of comprehensive income (1.4) 1.2Unrealised gains on fair value of forward exchange contracts and call options 12.2 (2.7)Fair value adjustment — insurance investment (1.1) (1.0)Fair value adjustment — environmental guarantees and investments (0.3) —PIC housing facility participation fee — 22.3Equity-linked return on BRPM environmental trust deposits (11.7) 1.5Profit on sale of property, plant and equipment and other assets (6.9) (1.0)Finance cost 7.4 25.1Finance income (91.8) (106.2)
525.6 366.7Changes in working capital 3.2 235.2Increase in inventories (24.3) (3.4)(Increase)/decrease in trade and other receivables* (34.1) 251.8Increase/(decrease) in trade and other payables 61.6 (13.2)
Cash generated by operations 528.8 601.9
* Excludes Styldrift I on-reef development revenue receivable of R143.9 million (2015: R54.5 million)
30. Related party transactions The Group is controlled by Royal Bafokeng Platinum Holdings Proprietary Limited (incorporated in South Africa), which owns
51.74% of RBPlat’s shares. RPM owns 11.44% of RBPlat’s shares and the remaining 36.82% is widely held.
RBR, a wholly owned subsidiary of RBPlat, owns a 67% participation interest in the BRPM JV and RPM holds the remaining 33% participation interest. The Group’s ultimate parent is Royal Bafokeng Holdings Proprietary Limited (RBH). RBH is an investment holding company with a large number of subsidiaries and is incorporated in South Africa.
Investments in subsidiaries and the BRPM JV and the degree of control exercised by the Company are:
Issued capital amount Interest in capital
2016
R2015
R2016
%2015
%
Related partiesDirect investmentRoyal Bafokeng Platinum Management Services Proprietary Limited (RBP MS) 1 000 1 000 100 100 Royal Bafokeng Resources Proprietary Limited (RBR) 320 320 100 100Indirect investment via RBRBafokeng Rasimone Management Services Proprietary Limited (BRMS) 1 000 1 000 100 100 BRPM Unincorporated Joint Venture — participation interest — — 67 67 Royal Bafokeng Resources Properties (RF) Proprietary Limited (RBRP) previously Friedshelf 1408 (RF) Proprietary Limited 100 100 100 100
Transactions between the Company, its subsidiaries and joint venture are eliminated on consolidation. Refer to Note 21 for related party guarantees.
RBR sells its 67% share of concentrate produced by the BRPM JV to RPM. RBR and RPM contribute 67% and 33% respectively of cash calls issued by the BRPM JV. The BRPM JV receives royalty income from Impala Platinum Limited (as detailed in Note 24) and acquires mining supplies and services from various RBH subsidiaries and associates. The BRPM JV and corporate office make use of the Royal Marang Hotel for accommodation and conferences.
Royal Bafokeng Platinum Annual Financial Statements 2016 I 47

30. Related party transactions continued The following transactions were carried out with related parties:
Group
2016R (million)
2015R (million)
Related party transactionsBRPM JV balances at 31 December: Amount owing by RPM for concentrate sales (refer to Note 12) 1 313.0 1 181.5Amount owing to RPM for contribution to BRPM (refer to Note 34) 1 051.0 839.7Amount owing by RPM for housing project — 71.8BRPM JV transactions: Concentrate sales to RPM (refer to Note 3 and Note 23) 3 705.5 3 099.3Associate of holding company (RBH) balances at 31 December: Amount owing by Impala Platinum Limited for the fourth quarter royalty (refer to Note 12) 22.2 12.7Fellow subsidiary and associates of holding company (RBH) transactions: Fraser Alexander for rental of mining equipment, maintenance of tailings dam and operation of sewage plant (a subsidiary of RBH) 8.4 10.3Impala Platinum Limited for royalties received (an associate of RBH) (refer to Note 24 and Directors’ report) 65.7 46.7Geoserve Exploration Drilling Company for exploration drilling on Boschkoppie and Styldrift (a subsidiary of RBH) 3.4 7.9Trident South Africa Proprietary Limited for steel supplies (a subsidiary of RBH) 4.4 3.6Mtech Industrial for supply and installation of heat pumps (a subsidiary of RBH) 0.4 1.3Royal Marang Hotel for accommodation and conferences (a subsidiary of RBH) 0.6 0.4Praxima Holding for payroll administration fees (an associate of RBH) 0.1 0.1Fees paid to non-executive directors (RBH/MOGS) 0.7 0.7
Directors, other executives and prescribed officers’ remuneration Details relating to key management remuneration (prescribed officers), share options and shareholdings in the Company are
disclosed in Note 31.
31. Remuneration 31.1 Directors, other executives and prescribed officers’ remuneration
Directors’ remuneration and related payments for 2016
Date appointed
Directors’ fees
R
Basic salary
R
Retirement benefits
R
Other benefits
R
Discre-tionary perfor-mance
bonusesR
TotalR
2016
Executive directorsSteve Phiri 1 Apr ’10 — 3 988 154 899 640 110 206 — 4 998 000
Martin Prinsloo 1 Mar ’09 — 3 059 829 280 000 160 171 — 3 500 000
Non-executive directors*Linda de Beer 1 Jun ’10 604 674 — — — — 604 674
Robin Mills 20 Sep ’10 541 618 — — — — 541 618
Mark Moffett 22 Sep ’14 415 558 — — — — 415 558
Thoko Mokgosi-Mwantembe 5 Nov ’14 540 922 — — — — 540 922
Kgomotso Moroka 1 Jun ’10 1 333 217 — — — — 1 333 217
Velile Nhlapo** 24 Nov ’15 321 785 — — — — 321 785
Mike Rogers 7 Dec ’09 573 332 — — — — 573 332
Louisa Stephens** 22 Sep ’14 431 558 — — — — 431 558
David Wilson** 29 Apr ’14 390 480 — — — — 390 480
Total 5 153 144 7 047 983 1 179 640 270 377 — 13 651 144* Non-executive director fees are paid on a quarterly basis and their fees accrued for the year were approved at the Annual General
Meeting held on 13 April 2016 ** Fees paid to Prime Select Holdings Proprietary Limited (Louisa Stephens), Royal Bafokeng Holdings Proprietary Limited (David Wilson
and Velile Nhlapo). Refer to Note 30
Notes to the consolidated annual financial statements and related accounting policies continuedfor the year ended 31 December 2016
48 I Royal Bafokeng Platinum Annual Financial Statements 2016

31. Remuneration continued 31.1 Directors, other executives and prescribed officers’ remuneration continued
Other executives and prescribed officers’ remuneration and related payments for 2016
Date appointed
Basic salary
R
Retirement benefits
R
Other benefits
R
Discre-tionary perfor-mance
bonuses*R
Under-ground market
premiumR
TotalR
2016
Other executives and prescribed officersNeil Carr 1 Dec ’10 2 681 795 578 000 140 205 — — 3 400 000
Reginald Haman 1 Oct ’12 2 341 984 183 943 101 833 — — 2 627 760
Glenn Harris 4 Jan ’10 2 862 720 370 992 78 720 — 171 227 3 483 659
Mpueleng Pooe 1 Oct ’13 2 070 811 186 201 70 496 — — 2 327 508
Vicky Tlhabanelo 1 Apr ’10 2 035 283 454 958 37 302 — — 2 527 543
Lindiwe Montshiwagae** 1 Jun ’10 1 400 069 115 587 135 582 — — 1 651 238
Total 13 392 662 1 889 681 564 138 — 171 227 16 017 708* No discretionary performance bonuses were paid in 2016** Appointed to RBPlat Exco on 1 August 2016
Directors’ remuneration and related payments for 2015
Date appointed
Resignation date
Directors’ fees
R
Basic salary
R
Retirement benefits
R
Other benefits
R
Discre-tionary perfor-mance
bonusesR
TotalR
2015
Executive directorsSteve Phiri 1 Apr ’10 — 3 962 244 899 640 136 116 3 748 360 8 746 360
Martin Prinsloo 1 Mar ’09 — 3 072 416 280 000 147 584 2 752 000 6 252 000
Non-executive directors*Linda de Beer 1 Jun ’10 568 551 — — — — 568 551
Robin Mills 20 Sep ’10 497 495 — — — — 497 495
Mark Moffett 22 Sep ’14 395 435 — — — — 395 435
Thoko Mokgosi-Mwantembe 5 Nov ’14 504 799 — — — — 504 799
Kgomotso Moroka 1 Jun ’10 1 333 217 — — — — 1 333 217
Lucas Ndala** 28 May ’13 24 Nov ’15 338 368 — — — — 338 368
Velile Nhlapo** 24 Nov ’15 22 358 — — — — 22 358
Mike Rogers 7 Dec ’09 521 209 — — — — 521 209
Louisa Stephens** 22 Sep ’14 483 719 — — — — 483 719
David Wilson** 29 Apr ’14 370 357 — — — — 370 357
Total 5 035 508 7 034 660 1 179 640 283 700 6 500 360 20 033 868
* Non-executive director fees are paid on a quarterly basis and their fees accrued for the year were approved at the Annual General Meeting held on 14 April 2015
** Fees paid to MOGS Proprietary Limited (Lucas Ndala), Prime Select Holdings Proprietary Limited (Louisa Stephens), Royal Bafokeng Holdings Proprietary Limited (David Wilson and Velile Nhlapo). Refer to Note 30
Royal Bafokeng Platinum Annual Financial Statements 2016 I 49

31. Remuneration continued 31.1 Directors, other executives and prescribed officers’ remuneration continued
Other executives and prescribed officers’ remuneration and related payments for 2015
Date appointed
Basic salary
R
Retirement benefits
R
Other benefits
R
Discre-tionary perfor-mance
bonuses*R
Under-ground market
premiumR
TotalR
2015Other executives and prescribed officersNeil Carr 1 Dec ’10 2 699 472 578 000 122 528 2 583 000 — 5 983 000Reginald Haman 1 Oct ’12 2 325 570 197 082 105 109 2 053 092 — 4 680 853Glenn Harris 4 Jan ’10 2 871 840 370 992 69 600 2 466 200 171 227 5 949 859Mpueleng Pooe 1 Oct ’13 2 071 284 186 201 70 023 1 650 679 — 3 978 187Vicky Tlhabanelo 1 Apr ’10 2 035 867 454 958 36 718 2 045 657 — 4 573 200Total 12 004 033 1 787 233 403 978 10 798 628 171 227 25 165 099
* Discretionary performance bonuses were considered when the 2014 financial results were finalised in February 2015
31.1.1 Share options awarded to directors and senior management
Share options
awarded*Award
date
Strike price
R
Award value
R Vesting dates
Vested to date
%
Share options
exercised Balance
As at 31 December 2016Executive and non-executive directorsSteve Phiri 297 521 1 Apr ’10 60.50 18 000 021 1 Apr ’13, ’14, ’15 100 — 297 521Martin Prinsloo 241 047 1 Mar ’09 36.30 8 750 006 1 Mar ’12, ’13, ’14 100 80 350** 160 697Other executives and prescribed officersVicky Tlhabanelo 121 288 1 Apr ’10 60.50 7 337 924 1 Apr ’13, ’14, ’15 100 — 121 288Glenn Harris 87 789 4 Jan ’10 60.50 5 311 235 4 Jan ’13, ’14, ’15 100 — 87 789Neil Carr 116 030 1 Dec ’10 65.50 7 599 965 1 Dec ’13, ’14, ’15 100 — 116 030Reginald Haman 163 599 1 Oct ’12 48.90 7 999 991 1 Oct ’15, ’16, ’17 67 — 163 599Mpueleng Pooe 136 770 1 Oct ’13 61.42 8 400 413 1 Oct ’16, ’17, ’18 33 — 136 770Lindiwe Montshiwagae 39 753 1 Jun ’10 59.74 2 374 844 1 Jun ’13, ’14, ’15 100 — 39 753Lester Jooste (Company Secretary) 40 756 1 Jul ’10 55.21 2 250 139 1 Jul ’13, ’14, ’15 100 — 40 756* Share options are issued to eligible employees at the date of joining the Company at the applicable market valuation or
market share price** The share options were exercised on 2 August 2016 at a market price of R52.61
31.1.2 Forfeitable bonus shares and rights offer shares awarded to directors, other executives and prescribed officers
Forfeitable share plan
— retentionForfeitable share plan
Bonus share plan
Award date
Issue priceR
Award value
RVesting
dates
Vesting amount
%
As at 31 December 2016Executive and non-executive directorsSteve Phiri — 26 106 1 Apr ’14 71.91 1 877 282 1 Apr ’17 100
— 33 054 1 Apr ’15 56.70 1 874 162 1 Apr ’18 100
56 443 — 1 Apr ’14 71.91 4 058 8161 Apr ’17,
18, 19 33.3*
75 808 — 1 Apr ’15 56.70 4 298 3141 Apr ’18,
19, 20 33.3*
— 162 435 — 1 Apr ’16 38.79 6 300 8541 Apr ’19,
20, 21 33.3*183 119 — — 1 Apr ’16 38.79 7 103 186 1 Apr ’19 100
Martin Prinsloo — 19 040 1 Apr ’14 71.91 1 369 166 1 Apr ’17 100 — 24 268 1 Apr ’15 56.70 1 375 996 1 Apr ’18 100
29 725 — 1 Apr ’14 71.91 2 137 5251 Apr ’17,
18, 19 33.3*
40 124 — 1 Apr ’15 56.70 2 275 0311 Apr ’18,
19, 20 33.3*
— 113 750 — 1 Apr ’16 38.79 4 412 3631 Apr ’19,
20, 21 33.3*128 235 — — 1 Apr ’16 38.79 4 974 236 1 Apr ’19 100
Notes to the consolidated annual financial statements and related accounting policies continuedfor the year ended 31 December 2016
50 I Royal Bafokeng Platinum Annual Financial Statements 2016

31. Remuneration continued 31.1 Directors, other executives and prescribed officers’ remuneration continued
31.1.2 Forfeitable bonus shares and rights offer shares awarded to directors, other executives and prescribed officers continued
Forfeitable share plan
— retentionForfeitable share plan
Bonus share plan
Award date
Issue priceR
Award value
RVesting
dates
Vesting amount
%
As at 31 December 2016Other executives and prescribed officersVicky Tlhabanelo — 13 704 1 Apr ’14 71.91 985 455 1 Apr ’17 100
— 18 039 1 Apr ’15 56.70 1 022 811 1 Apr ’18 100
19 655 — 1 Apr ’14 71.91 1 413 3911 Apr ’17,
18, 19 33.3*
24 072 — 1 Apr ’15 56.70 1 364 8821 Apr ’18,
19, 20 33.3*
— 50 551 — 1 Apr ’16 38.79 1 960 8731 Apr ’19,
20, 21 33.3*46 303 — — 1 Apr ’16 38.79 1 796 093 1 Apr ’19 100
Neil Carr — 14 829 1 Apr ’14 71.91 1 066 353 1 Apr ’17 100 — 22 778 1 Apr ’15 56.70 1 291 513 1 Apr ’18 100
20 621 — 1 Apr ’14 71.91 1 482 8561 Apr ’17,
18, 19 33.3*
38 978 — 1 Apr ’15 56.70 2 210 0531 Apr ’18,
19, 20 33.3*
— 85 000 1 Apr ’16 38.79 3 297 1501 Apr ’19,
20, 21 33.3*103 809 — — 1 Apr ’16 38.79 4 026 751 1 Apr ’19 100
Glenn Harris — 15 280 1 Apr ’14 71.91 1 098 785 1 Apr ’17 100 — 21 748 1 Apr ’15 56.70 1 233 112 1 Apr ’18 100
20 621 — 1 Apr ’14 71.91 1 482 8561 Apr ’17,
18, 19 33.3*
37 974 — 1 Apr ’15 56.70 2 153 1261 Apr ’18,
19, 20 33.3*
— 82 811 — 1 Apr ’16 38.79 3 212 2391 Apr ’19,
20, 21 33.3*101 135 — 1 Apr ’16 38.79 3 923 027 1 Apr ’19 100
Reginald Haman — 14 694 1 Apr ’14 71.91 1 056 646 1 Apr ’17 100— 18 105 1 Apr ’15 56.70 1 026 554 1 Apr ’18 100
20 434 — 1 Apr ’14 71.91 1 469 4091 Apr ’17,
18, 19 33.3*
25 027 — 1 Apr ’15 56.70 1 419 0311 Apr ’18,
19, 20 33.3*
— 52 555 — 1 Apr ’16 38.79 2 038 6081 Apr ’19,
20, 21 33.3*64 185 — — 1 Apr ’16 38.79 2 489 736 1 Apr ’19 100
Mpueleng Pooe — 14 556 1 Apr ’15 56.70 825 325 1 Apr ’18 100
17 474 — 1 Apr ’14 71.91 1 256 5551 Apr ’17,
18, 19 33.3*
22 167 — 1 Apr ’15 56.70 1 256 8691 Apr ’18,
19, 20 33.3*
— 46 550 — 1 Apr ’16 38.79 1 805 6751 Apr ’19,
20, 21 33.3*42 638 — — 1 Apr ’16 38.79 1 653 928 1 Apr ’19 100
Lindiwe Montshiwagae** — 10 214 1 Apr ’14 71.91 734 489 1 Apr ’17 100— 12 962 1 Apr ’15 56.70 734 945 1 Apr ’18 100
27 626 — — 1 Apr ’16 38.79 1 071 613 1 Apr ’19 100Lester Jooste (Company Secretary) — 10 164 1 Apr ’14 71.91 730 893 1 Apr ’17 100
— 12 890 1 Apr ’15 56.70 730 863 1 Apr ’18 10028 145 — — 1 Apr ’16 38.79 1 091 745 1 Apr ’19 100
* 33% over a period of three years** Appointed to RBPlat Exco on 1 August 2016
Royal Bafokeng Platinum Annual Financial Statements 2016 I 51

31. Remuneration continued 31.1 Directors, other executives and prescribed officers’ remuneration continued
31.1.3 IPO scheme shares awarded to directors, other executives and prescribed officers
IPO scheme shares
matched by the
CompanyAward
date
Deemed issue price
R
Rights offer
sharesR
Issue price
R
Award values
R
Shares sold
2013R
Shares sold
2014R
Shares sold
2015R
Shares sold
2016R
Balance of
sharesR
Value of balance
of shares
R
As of 31 December 2015Executive directorsSteve Phiri 99 174 8 Nov ’10 60.5 12 165 55.00 6 669 102 25 000 — — 86 339 5 156 602
Martin Prinsloo 76 272 8 Nov ’10 60.5 10 615 55.00 5 198 281 10 000 13 724 10 000 53 163 3 157 979
Other executives and prescribed officersVicky Tlhabanelo 27 273 8 Nov ’10 60.5 3 546 55.00 1 845 047 11 300 — — 19 519 1 161 397
Glenn Harris 31 405 8 Nov ’10 60.5 — — 1 900 002 31 405 — — — —
Lester Jooste (Company Secretary) 11 901 8 Nov ’10 60.5 1 841 55.00 821 266 1 350 — — 12 392 739 591
31.2 Group incentive share scheme Total Group share incentive scheme shares issued to date
Opening balance
Cumulative closing
balance
Deemed strike price
R Issue dates
Vested/ exercised
and forfeited (cumulative)
Vesting dates
Vesting %
IPO scheme shares 417 416 417 416 60.50 8 Nov ’10 417 416 8 May ’12 100
Share options issued to date 5 031 262 6 588 587 * * 1 557 325** *
33.3 over three years
Bonus scheme shares
2009 allocation — 55 589 57.48 3 Dec ’09 55 589 3 Dec ’12 100
2010 allocations — BSP 55 589 133 432 65.00 1 Dec ’10 77 843 1 Dec ’13 100
2011 allocations — BSP 133 432 463 953 66.9218 Feb ’11 and
1 Apr ’11 330 521 18 Feb ’14 and
1 Apr ’14 100
2012 allocations — BSP 463 953 888 938 57.99 1 Apr ’12 424 985 1 Apr ’15 100
2013 allocations — BSP 888 958 1 423 314 58.50 1 Apr ’13 118 652 1 Apr ’16 100
2014 allocations — BSP 1 423 314 1 778 970 71.91 1 Apr ’14 25 633 1 Apr ’17 100
2014 allocations — FSP 1 778 970 2 014 165 71.91 1 Apr ’14 34 525 1 Apr ’17,18, 19
33.3 overthree years
2014 share issues*** 2 014 165 2 398 382 — — 384 217
2015 allocations — BSP 2 398 382 2 944 124 56.70 1 Apr ’15 7 310 1 Apr ’18 100
2015 allocations — FSP 2 944 124 3 231 467 56.70 1 Apr ’15 — 1 Apr ’18,19, 20
33.3 overthree years
2016 allocation — BSP 3 231 467 3 300 486 38.79 1 Apr ’16 — 1 Apr ’19 100
2016 allocations — FSP 3 300 486 3 942 843 38.79 1 Apr ’16 — 1 Apr ’19,’20, ’21
33.3 overthree years
2016 allocations — FSP retention
3 942 843 5 341 558 38.79 1 Apr ’16 — 1 Apr ’19 100
Mahube share incentive scheme shares
563 914 — 65.12 27 Jan ’10 563 914 31 Mar ’13, ’14, ’15
33.3 overthree years
* Share options are issued to eligible employees at the date of joining the Company at the applicable market-related share price and therefore range from R23.00 to R74.39 from January 2009 to December 2016. The options vest at a rate of one-third after the third, fourth and fifth anniversary dates
** This net movement includes 1 805 778 share options issued in 2016 (2015: 770 503)
At the AGM held on 13 April 2016, shareholders approved ordinary resolution number 14, which authorises the Company to utilise up to 11 623 582 ordinary shares in respect of all employee share incentive schemes. With a total of 9 515 800 securities already being utilised, 2 107 782 shares remain available to the RBPlat employee share schemes.
Notes to the consolidated annual financial statements and related accounting policies continuedfor the year ended 31 December 2016
52 I Royal Bafokeng Platinum Annual Financial Statements 2016

32. Dividends No dividends have been declared or proposed in the current year (2015: nil).
33. Financial risk management 33.1 Financial risk factors
The Group’s activities expose it to a variety of strategic and financial risks, including market risk (which covers currency risk, fair value interest rate risk, cash flow interest rate risk and price risk), credit risk and liquidity risk. The Group’s overall risk management programme focuses on the broader business environment, especially the unpredictability of the financial markets, and seeks to minimise potential adverse effects on the Group’s financial performance.
Risk management is carried out in terms of the enterprise risk framework and related policies approved by the Audit and Risk Committee and the Board, which set the overall risk appetite and related financial risk tolerances. The Audit and Risk Committee and the Board provide principles for risk management, as well as policies and guidelines covering specific areas, such as foreign exchange risk, interest rate risk, and credit risk, use of derivative financial instruments and non-derivative instruments, and investment of excess liquidity.
Categories of financial instruments and fair valuesThe following table represents the Group’s assets and liabilities that are measured at fair value (all financial instruments are carried at amortised cost except for the Nedbank equity-linked deposits in the environmental trust deposits and the insurance investment which are carried at fair value):
Carrying amount Fair values
Notes2016
R (million)2015
R (million)2016
R (million)2015
R (million)
Financial assets Financial assets at fair value through profit or lossEnvironmental trust deposits 6 94.9 107.4 94.9 107.4Environmental guarantees and investments 6 16.6 — 16.6 —Insurance investment 9 35.0 31.0 35.0 31.0Forward exchange contracts and call options 12 — 11.9 — 11.9Loans and receivablesEnvironmental trust deposits 6 35.5 7.5 35.5 7.5Employee housing receivable 7 209.2 210.9 167.2 157.7Trade and other receivables (excluding VAT) 12 1 391.7 1 333.4 1 391.7 1 333.4Cash and cash equivalents 14 835.5 917.6 835.5 917.6Total financial assets 2 618.4 2 619.7 2 576.4 2 566.5Financial liabilities Financial liabilities at fair value through profit or lossForward exchange contracts 22 2.7 — 2.7 —Financial liabilities at amortised costPIC housing facility 19 431.1 364.3 434.0 366.9RPM payable 889.7 760.9 889.7 760.9Trade and other payables (excluding VAT and payroll accruals) 22 383.7 369.9 383.7 369.9Total financial liabilities 1 707.2 1 495.1 1 710.1 1 497.7
33.1.1 Market risk Foreign exchange risk
The Group is exposed to foreign exchange risk arising from various currency exposures, primarily with respect to the US Dollar as the concentrate revenue is impacted by the ZAR:US$ exchange rate. Foreign exchange risk arises when future commercial transactions or recognised assets and liabilities are denominated in a currency that is not the entity’s functional currency.
RBR entered into a disposal of concentrate agreement with RPM during 2002 in terms of which RBR’s 67% share of the concentrate of the PGMs produced by BRPM JV will be treated by RPM.
In terms of the disposal of concentrate agreement, the commodity prices used in the calculation of the concentrate payment are based on the average prices for the third month following the month of delivery. Payment is due on the last day of the fourth month following the month of delivery.
Revenue and concentrate debtors are remeasured every month following the month of delivery until the price is fixed in the third month. The remeasurement is recognised in revenue.
Royal Bafokeng Platinum Annual Financial Statements 2016 I 53

33. Financial risk management continued 33.1 Financial risk factors continued
33.1.1 Market risk continuedForeign exchange risk continuedSensitivity analysisForeign exchange risk sensitivity analysis presents the effect of a 10% change in the year-end exchange rate on financial instruments in the statement of financial position, statement of comprehensive income and therefore equity.
Statement of financial position
Statement of comprehensive income
Notes2016
R (million)2015
R (million)2016
R (million)2015
R (million)
Financial assets Trade and other receivables still subject to price fluctuations 899.8 809.2 ±89.9 ±80.9
Trade and other receivables not subject to price fluctuations 413.2 372.3 — —
Total 12 1 313.0 1 181.5 ±89.9 ±80.9
Commodity price riskCommodity price risk refers to the risk of changes in fair value or cash flows of financial instruments as a result of changes in commodity prices. It is specifically applicable to the concentrate debtor (RPM).
In terms of the concentrate agreement between RBR and RPM, the commodity prices used in the calculation of the concentrate payment are based on the average prices for the third month following the month of delivery, leaving the Group exposed to the commodity price and exchange rate fluctuations until the price is fixed in the third month following the delivery month. Payment is due on the last day of the fourth month following the delivery month. Revenue and concentrate debtors are remeasured every month following the delivery month until the prices are fixed in the third month. The remeasurement is recognised in revenue.
Sensitivity analysisCommodity price risk sensitivity analysis presents the effect of a 10% change in the year-end commodity price on financial instruments in the statement of financial position, statement of comprehensive income and therefore equity.
Statement of
financial positionStatement of
comprehensive income
Notes2016
R (million)2015
R (million)2016
R (million)2015
R (million)
Financial assets Trade and other receivables still subject to price fluctuations 899.8 809.2 ±89.9 ±80.9
Trade and other receivables not subject to price fluctuations 413.2 372.3 — —
Total 12 1 313.0 1 181.5 ±89.9 ±80.9
Notes to the consolidated annual financial statements and related accounting policies continuedfor the year ended 31 December 2016
54 I Royal Bafokeng Platinum Annual Financial Statements 2016

33. Financial risk management continued 33.1 Financial risk factors continued
33.1.1 Market risk continued Equity price riskThe Group is exposed to equity price risk in respect of the environmental trust deposits invested in the Nedbank equity-linked deposits. Refer to Note 6.
Sensitivity analysisEquity price risk sensitivity analysis presents the effect of a 5% change in the Bettabeta CIS BGreen portfolio exchange traded fund and FTSE/JSE shareholder weighted Top 40 Index performance for the year.
Statement of financial position
Statement of comprehensive income
Notes2016
R (million)2015
R (million)2016
R (million)2015
R (million)
Financial assets
Environmental trust deposits 6 94.9 107.4 ±1.9 ±1.7
Cash flow and fair value interest rate riskThe Group is exposed to cash flow interest rate risk in respect of its floating rate financial assets and liabilities. The Group monitors its exposure to fluctuating interest rates. Cash and cash equivalents are primarily invested with short-term maturity dates, which expose the Group to cash flow interest rate risk. The Group does not have any fixed rate financial instruments which could expose it to fair value interest rate risk.
Sensitivity analysisInterest rate risk sensitivity analysis presents the effect of 100 basis points up and down in the interest rate in the financial instruments in the statement of comprehensive income.
Statement of financial position
Statement of comprehensive income
Notes2016
R (million)2015
R (million)2016
R (million)2015
R (million)
Financial assets Environmental trust deposits 6 35.5 7.5 ±0.1 —
Employee housing receivable 7 167.2 157.7 ±2.0 ±2.0
Cash and cash equivalents 14 835.5 917.6 ±10.0 ±12.2
Total financial assets 1 038.2 1 082.8 ±12.1 ±14.2
Financial liabilities PIC housing facility 19 434.0 366.9 ±2.9 ±2.0
Total financial liabilities 434.0 366.9 ±2.9 ±2.0
Royal Bafokeng Platinum Annual Financial Statements 2016 I 55

33. Financial risk management continued 33.1 Financial risk factors continued
33.1.2 Credit risk Credit risk arises from the risk that the financial asset counterparty may default or not meet its obligations timeously. The maximum exposure to the credit risk is represented by the carrying amount of all the financial assets. The potential concentration of credit risk could arise in cash and cash equivalents, trade receivables, the employee housing receivable and other financial assets and financial guarantees. Refer to Note 21 for financial guarantees.
The Group’s trade debtor credit risk is limited to one customer as all metals in concentrate are sold to RPM. RPM has never defaulted on meeting its obligation. The value of the receivable at year-end was R1 313 million (2015: R1 181.5 million) (Refer to Note 12). The credit risk relates to overall risk of the Anglo American Platinum group, the world’s largest platinum producer.
Management conducted a net assessment for each of the local banking service providers. These included the big five banks in South Africa being Absa, Standard Bank, FNB, Nedbank and Investec. Based on the outcome, we ranked the institutions, categorising them and limiting the investments to be made in each instance based on risk.
In addition to bank investments, RBPlat may invest in collective investment schemes, for example, money market investments. The following limits apply: > RBPlat’s investment may not exceed 20% of the total fund size > The fund must have a minimum Fitch rating of A > Minimum Fitch rating of BBB– for individual assets held in the fund.
The limits per bank are applied on a see through basis, taking account of direct investments and indirect investments held via money market fund investments.
With regard to the employee housing receivable, the Group is exposed to the credit risk of employees as houses are sold to employees on credit. The value of the receivable at year-end is R167.2 million (2015: R157.7 million).
Default for reporting purposes is measured as payments outstanding for more than four months. Interest is charged at prime rate on late payments. Default for the employee housing receivable is measured as payments outstanding for more than one month. Where employees have missed one or more instalments, interest is charged at prime rate plus 2%. At year-end, none of the employees have defaulted on meeting their obligation.
No financial assets were past due for the current or the comparative periods under review. No terms relating to financial assets have been renegotiated resulting in assets not being past due.
Notes to the consolidated annual financial statements and related accounting policies continuedfor the year ended 31 December 2016
56 I Royal Bafokeng Platinum Annual Financial Statements 2016

33. Financial risk management continued 33.1 Financial risk factors continued
33.1.3 Liquidity riskPrudent liquidity risk management implies maintaining sufficient cash and cash equivalents, the availability of funding through an adequate amount of committed credit facilities and the ability to close out market positions. Due to the dynamic nature of the underlying businesses, the Board aims to maintain flexibility in funding by keeping committed and uncommitted credit lines available. Management monitors rolling forecasts of the Group’s liquidity reserve (comprising undrawn borrowing facilities and cash and cash investments) (Note 14) on the basis of expected cash flows.
The table below analyses the Group’s financial liabilities into the relevant maturity groupings based on the remaining period at the reporting date to the contractual maturity date. The amounts disclosed in the table are the contractual undiscounted cash flows. Balances due within one year equal their carrying amounts as the impact of discounting is insignificant.
Notes
Less than one year
R (million)
Between one and
two yearsR (million)
Between two and
five yearsR (million)
Over five years
R (million)
2016RPM payable — — — 889.7
Trade and other payables 22 429.5 — — —
Financial guarantees 21.1 — — 0.8 201.2
PIC housing facility 19 — — — 434.0
2015RPM payable — — — 760.9
Trade and other payables 22 387.8 — — —
Financial guarantees 21.1 0.4 — — 158.5
PIC housing facility 19 — — — 366.9
33.1.4 Capital risk managementThe Group defines total capital as equity plus debt in the statement of financial position. The Group’s objectives when managing capital are to safeguard its ability to continue as a going concern in order to provide returns for shareholders and benefits for other stakeholders and to maintain an optimal capital structure in order to reduce the cost of capital.
33.1.5 Fair value determinationThe table below analyses financial instruments carried at fair value, by valuation method. The different levels have been defined as follows: > Quoted prices (unadjusted) in active markets for identical assets and liabilities (level 1) > Inputs other than quoted prices included within level 1 that are observable for the asset or liability, either directly (that is, as prices) or indirectly (that is, derived from prices) (level 2)
> Inputs for the asset or liability that are not based on observable market data (that is, unobservable inputs) (level 3).
Royal Bafokeng Platinum Annual Financial Statements 2016 I 57

33. Financial risk management continued 33.1 Financial risk factors continued 33.1.5 Fair value determination continued The following table presents the financial assets that are measured at fair value as well as the financial
assets and financial liabilities measured at amortised cost but for which fair value disclosure are provided at 31 December:
NotesLevel 1
R (million)Level 2
R (million)Level 3
R (million)
2016
Financial assets at fair value through profit or lossEnvironmental trust deposits1 6 — 94.9 —
Insurance investment2 9 — 35.0 —
Loans and receivablesEmployee housing receivable4 7 — — 167.2
Financial liabilities at fair value through profit or lossForward exchange contracts3 22 — 2.7 —
Financial liabilities at amortised costPIC housing facility5 19 — — 434.0
2015
Financial assets at fair value through profit or lossEnvironmental trust deposits1 6 — 107.4 —
Insurance investment2 9 — 31.0 —
Forward exchange contracts and call options3 12 — 11.9 —
Loans and receivablesEmployee housing receivable4 7 — — 157.7
Financial liabilities at amortised costPIC housing facility5 19 — — 366.91. This was valued using the level 2 fair values which are directly derived from the Shareholders Weighted Top 40 Index
(SWIX 40) on the JSE and the Coreshares Green Exchange Traded Fund2. The fair value was determined using market prices for listed investments and discounted cash flow models for unlisted
investments3. The fair values of the forward exchange contracts and call options are based on mark-to-market values4. The fair value was determined using a discounted cash flow model. Refer to Note 7 for inputs used to determine the fair
value measurement5. The fair value was determined using a discounted cash flow model. Refer to Note 19 for inputs used to determine the fair value measurements
34. Segmental reporting Operating segments are reported in a manner consistent with the internal reporting provided to the chief operating decision-
maker. The chief operating decision-maker, who is responsible for allocating resources and assessing performance of the operating segments, has been identified as the Executive Committee that makes strategic decisions.
The Group is currently operating one mine with two decline shafts and the Styldrift I project. These operations are located in the North West province of South Africa, 120 kilometres from Johannesburg, 30 kilometres from Rustenburg and 17 kilometres from Phokeng. BRPM and Styldrift (Styldrift I and II) are shown as separate segments. In addition, due to the different nature and significance of the employee home ownership scheme, it was decided to show housing as a separate segment. Currently Styldrift I and II are aggregated into a single reportable segment as it is one mining right. The Styldrift II pre-feasibility study has been completed. Once the feasibility study is completed it will move into development phase and will then be reported on as a separate segment.
Notes to the consolidated annual financial statements and related accounting policies continuedfor the year ended 31 December 2016
58 I Royal Bafokeng Platinum Annual Financial Statements 2016

For
the
year
end
ed 3
1 De
cem
ber
2016
For
the
year
end
ed 3
1 De
cem
ber
2015
BRPM
m
inin
g se
gmen
t (A)
R (m
illio
n)
Styl
drift
m
inin
g se
gmen
t (B)
R (m
illio
n)
BRPM
JV
min
ing
segm
ent
(A +
B)
R (m
illio
n)
RBPl
at
hous
ing
segm
ent
R (m
illio
n)
Corp
orat
e of
fice
and
cons
oli-
datio
n ad
just
-m
ent
R (m
illio
n)To
tal
R (m
illio
n)
BRPM
m
inin
g se
gmen
t (A)
R (m
illio
n)
Styl
drift
m
inin
g se
gmen
t (B)
R (m
illio
n)
BRPM
JV
min
ing
segm
ent
(A +
B)
R (m
illio
n)
RBPl
at
hous
ing
segm
ent
R (m
illio
n)
Corp
orat
e of
fice
and
cons
oli-
dati
on
adju
st-
men
tR
(mill
ion)
Tota
lR
(mill
ion)
Conc
entr
ate
sale
s3
342.
2—
3 34
2.2
——
3 34
2.2
3 03
4.0
10.7
3 04
4.7
——
3 04
4.7
Cost
of
sale
s(3
129
.2)
(0.3
)(3
129
.5)
—28
.0(3
101
.5)
(2 9
33.8
)(6
.1)
(2 9
39.9
)—
(144
.6)
(3 0
84.5
)
Cash
cos
t of
sa
les
excl
udin
g de
prec
iati
on a
nd
amor
tisa
tion
(2 8
68.3
)—
(2 8
68.3
)—
64.7
(2 8
03.6
)(2
664
.5)
(5.5
)(2
670
.0)
—29
.8(2
640
.2)
Depr
ecia
tion
(275
.0)
(0.3
)(2
75.3
)—
—(2
75.3
)(2
54.2
)(0
.6)
(254
.8)
——
(254
.8)
Amor
tisa
tion
and
fai
r va
lue
depr
ecia
tion
——
——
(36.
7)(3
6.7)
——
——
(174
.4)
(174
.4)
Mov
emen
t in
in
vent
orie
s14
.1—
14.1
——
14.1
(15.
1)—
(15.
1)—
—(1
5.1)
Gros
s pr
ofit/
(loss
) per
se
gmen
t an
d to
tal
213.
0(0
.3)
212.
7—
28.0
240.
710
0.2
4.6
104.
8—
(144
.6)
(39.
8)
Oth
er in
com
e75
.18.
984
.02.
71.
488
.167
.1(1
.0)
66.1
2.8
(0.2
)68
.7
Tota
l adm
inis
trat
ion
expe
ndit
ure
——
—(1
7.2)
(138
.4)
(155
.6)
——
—(3
7.8)
(126
.3)
(164
.1)
Adm
inis
trat
ion
expe
ndit
ure
——
—(1
4.3)
(136
.8)
(151
.1)
——
—(3
4.9)
(125
.3)
(160
.2)
Depr
ecia
tion
—
——
(0.2
)(1
.6)
(1.8
)—
——
—(1
.0)
(1.0
)
Amor
tisa
tion
of
empl
oyee
hou
sing
be
nefit
and
fai
r va
lue
adju
stm
ent
to lo
an—
——
(2.7
)—
(2.7
)—
——
(2.9
)—
(2.9
)
Impa
irm
ent
of
non-
finan
cial
ass
ets
(0.9
)(0
.9)
(1.8
)(0
.8)
—(2
.6)
(3 0
52.4
)—
(3 0
52.4
)(2
.0)
(1 4
11.8
)(4
466
.2)
Net
finan
ce in
com
e10
.8—
10.8
28.6
45.0
84.4
8.4
0.3
8.7
6.6
65.8
81.1
Fina
nce
inco
me
16.6
1.4
18.0
28.6
45.2
91.8
13.2
1.4
14.6
26.2
65.4
106.
2
Fina
nce
cost
(5.8
)(1
.4)
(7.2
)—
(0.2
)(7
.4)
(4.8
)(1
.1)
(5.9
)(1
9.6)
0.4
(25.
1)
Profi
t/(lo
ss) b
efor
e ta
x pe
r se
gmen
t an
d to
tal
298.
07.
730
5.7
13.3
(64.
0)25
5.0
(2 8
76.7
)3.
9(2
872
.8)
(30.
4)(1
617
.1)
(4 5
20.3
)
Taxa
tion
7.7
753.
3
Profi
t/(lo
ss) a
fter
tax
262.
7(3
767
.0)
Attr
ibut
able
to
owne
rs o
f th
e Co
mpa
ny16
8.3
(3 0
44.8
)
Attr
ibut
able
to
non-
cont
rolli
ng in
tere
st94
.4(7
22.2
)
34. Segmental reporting continued 34.1 Segmental statement of comprehensive income
Royal Bafokeng Platinum Annual Financial Statements 2016 I 59

34. Segmental reporting continued 34.2 Segmental statement of financial position
As a
t 31
Dec
embe
r 20
16As
at
31 D
ecem
ber
2015
BRPM
m
inin
g se
gmen
t (A)
R (m
illio
n)
Styl
drift
m
inin
g se
gmen
t (B)
R (m
illio
n)
BRPM
JV
min
ing
segm
ent
(A +
B)
R (m
illio
n)
RBPl
at
hous
ing
segm
ent
R (m
illio
n)
Corp
orat
e of
fice
and
cons
oli-
datio
n ad
just
-m
ent
R (m
illio
n)To
tal
R (m
illio
n)
BRPM
m
inin
g se
gmen
t (A)
R (m
illio
n)
Styl
drift
m
inin
g se
gmen
t (B)
R (m
illio
n)
BRPM
JV
min
ing
segm
ent
(A +
B)
R (m
illio
n)
RBPl
at
hous
ing
segm
ent
R (m
illio
n)
Corp
orat
e of
fice
and
cons
oli-
dati
on
adju
st-
men
tR
(mill
ion)
Tota
lR
(mill
ion)
Non-
curr
ent
asse
ts4
262.
56
628.
010
890
.525
2.5*
*6
471.
317
614
.34
794.
05
585.
210
379
.224
0.6*
*6
529.
017
148
.8
Allo
catio
n of
min
eral
ri
ghts
and
seg
men
ts95
5.3
4 77
4.0*
5 72
9.3
—(5
729
.3)
—99
2.0
4 77
4.0*
5 76
6.0
—(5
766
.0)
—
Non-
curr
ent
asse
ts
afte
r al
loca
tion
of
min
eral
rig
hts
5 21
7.8
11 4
02.0
16 6
19.8
252.
574
2.0
17 6
14.3
5 78
6.0
10 3
59.2
16 1
45.2
240.
676
3.0
17 1
48.8
Curr
ent
asse
ts
1 58
7.1
249.
21
836.
342
8.3
439.
02
703.
61
553.
910
1.1
1 65
5.0
342.
061
3.5
2 61
0.5
Empl
oyee
hou
sing
cu
rren
t as
sets
——
—38
1.5
—38
1.5
——
—26
8.5
—26
8.5
Inve
ntor
ies
56.3
23.1
79.4
——
79.4
37.3
17.8
55.1
——
55.1
Trad
e an
d ot
her
rece
ivab
les
1 16
0.3
226.
11
386.
47.
811
.41
405.
61
190.
583
.31
273.
813
.078
.91
365.
7
Curr
ent
tax
rece
ivab
le—
——
—1.
61.
6—
——
—3.
63.
6
Cash
and
cas
h eq
uiva
lent
s37
0.5
—37
0.5
39.0
426.
083
5.5
326.
1—
326.
160
.553
1.0
917.
6
Tota
l ass
ets
per
stat
emen
t of
fina
ncia
l po
sitio
n6
804.
911
651
.218
456
.168
0.8
1 18
1.0
20 3
17.9
7 33
9.9
10 4
60.3
17 8
00.2
582.
61
376.
519
759
.3
Non-
curr
ent
liabi
litie
s81
.712
.594
.243
5.5
3 63
5.3
4 16
5.0
82.0
13.1
95.1
366.
93
663.
74
125.
7
Defe
rred
tax
liab
ility
——
——
3 63
5.3
3 63
5.3
——
——
3 66
3.7
3 66
3.7
PIC
hous
ing
faci
lity
——
—43
4.0
—43
4.0
——
—36
6.9
—36
6.9
Rest
orat
ion
and
reha
bilit
atio
n pr
ovis
ion
and
othe
r81
.712
.594
.21.
5—
95.7
82.0
13.1
95.1
——
95.1
Curr
ent
liabi
litie
s3
334.
277
.93
412.
126
.1(2
099
.2)
1 33
9.0
3 14
8.4
108.
13
256.
525
9.5
(2 3
66.7
)1
149.
3
Trad
e an
d ot
her
paya
bles
149.
477
.922
7.3
26.1
195.
944
9.3
603.
810
8.1
711.
925
9.5
(583
.0)
388.
4
RBR
paya
ble
2 13
3.8
—2
133.
8—
(2 1
33.8
)—
1 70
4.9
—1
704.
9—
(1 7
04.9
)—
RPM
pay
able
1 05
1.0
—1
051.
0—
(161
.3)
889.
783
9.7
—83
9.7
—(7
8.8)
760.
9
Tota
l lia
bilit
ies
per
stat
emen
t of
fina
ncia
l po
sitio
n3
415.
990
.43
506.
346
1.6
1 53
6.1
5 50
4.0
3 23
0.4
121.
23
351.
662
6.4
1 29
7.0
5 27
5.0
* In
clud
es S
tyld
rift
II e
xplo
rati
on a
nd e
valu
atio
n co
sts
**
Empl
oyee
hou
sing
loa
n re
ceiv
able
is
clas
sifi
ed a
s no
n-cu
rren
t as
rep
aym
ent
of t
he c
apit
al p
orti
on o
f th
ese
rece
ivab
les
is e
xpec
ted
to c
omm
ence
aft
er 1
2 m
onth
s fr
om d
ate
of t
he
stat
emen
t of
fina
ncia
l po
siti
on**
* R1
.3 b
illi
on o
f th
e de
ferr
ed t
ax l
iabi
lity
is
attr
ibut
able
to
BRPM
min
ing
segm
ent
and
R2.3
bil
lion
to
Styl
drif
t m
inin
g se
gmen
t (S
tyld
rift
I an
d St
yldr
ift
II)
Notes to the consolidated annual financial statements and related accounting policies continuedfor the year ended 31 December 2016
60 I Royal Bafokeng Platinum Annual Financial Statements 2016

34. Segmental reporting continued 34.3 Segmental statement of cash flows
For
the
year
end
ed 3
1 De
cem
ber
2016
For
the
year
end
ed 3
1 De
cem
ber
2015
BRPM
m
inin
g se
gmen
t (A)
R (m
illio
n)
Styl
drift
m
inin
g se
gmen
t (B)
R (m
illio
n)
BRPM
JV
min
ing
segm
ent
(A +
B)
R (m
illio
n)
RBPl
at
hous
ing
segm
ent
R (m
illio
n)
Corp
orat
e of
fice
and
cons
oli-
datio
n ad
just
-m
ent
R (m
illio
n)To
tal
R (m
illio
n)
BRPM
m
inin
g se
gmen
t (A)
R (m
illio
n)
Styl
drift
m
inin
g se
gmen
t (B)
R (m
illio
n)
BRPM
JV
min
ing
segm
ent
(A +
B)
R (m
illio
n)
RBPl
at
hous
ing
segm
ent
R (m
illio
n)
Corp
orat
e of
fice
and
cons
oli-
dati
on
adju
st-
men
tR
(mill
ion)
Tota
lR
(mill
ion)
Net
cas
h fl
ow g
ener
ated
/(u
tilis
ed)
by o
pera
ting
ac
tivi
ties
518.
51.
451
9.9
25.7
39.7
585.
362
2.5
44.9
667.
4(1
1.5)
(36.
7)61
9.2
Cash
flow
s fr
om in
vest
ing
acti
viti
es
Proc
eeds
fro
m d
ispo
sal o
f pr
oper
ty,
plan
t an
d eq
uipm
ent
2.1
45.1
47.2
——
47.2
0.4
—0.
4—
—0.
4
Acqu
isit
ion
of p
rope
rty,
pla
nt
and
equi
pmen
t(1
55.0
)(1
011
.8)
(1 1
66.8
)(1
.1)
31.4
(1 1
36.5
)(3
17.0
)(1
746
.5)
(2 0
63.5
)—
45.1
(2 0
18.4
)
Styl
drif
t on
-ree
f de
velo
pmen
t re
venu
e re
ceip
ts—
273.
927
3.9
——
273.
9—
——
——
—
Acqu
isit
ion
of e
mpl
oyee
ho
usin
g as
sets
——
—(8
3.2)
—(8
3.2)
——
—(2
62.5
)—
(262
.5)
Acqu
isit
ion
of in
sura
nce
inve
stm
ent
——
—(2
.9)
—(2
.9)
——
—(3
0.0)
—(3
0.0)
Incr
ease
in e
nvir
onm
enta
l tru
st
depo
sits
(20.
1)—
(20.
1)—
—(2
0.1)
(2.8
)—
(2.8
)—
—(2
.8)
Call
opti
on p
rem
ium
pai
d—
——
——
——
(9.2
)(9
.2)
——
(9.2
)
Net
cas
h fl
ow (
utili
sed)
/ge
nera
ted
by in
vest
ing
acti
viti
es(1
73.0
)(6
92.8
)(8
65.8
)(8
7.2)
31.4
(921
.6)
(319
.4)
(1 7
55.7
)(2
075
.1)
(292
.5)
45.1
(2 3
22.5
)
Cash
flow
s fr
om fi
nanc
ing
acti
viti
es
Cash
inve
stm
ents
by/
(dis
trib
utio
ns t
o) B
RPM
JV
shar
ehol
ders
(51.
1)69
1.4
640.
3—
(511
.5)
128.
8(3
88.4
)1
710.
81
322.
4—
(886
.0)
436.
4
Dra
wdo
wns
of
PIC
hous
ing
faci
lity
——
—40
.0—
40.0
——
—32
6.9
—32
6.9
(Dec
reas
e)/i
ncre
ase
in
inte
rcom
pany
loan
s—
——
(250
.0)
250.
0—
——
—34
.7(3
4.7)
—
RPM
con
trib
utio
n to
hou
sing
fu
nd r
ecei
ved
(250
.0)
—(2
50.0
)25
0.0
82.5
82.5
——
——
——
Proc
eeds
fro
m s
hare
opt
ions
ex
erci
sed
——
——
2.9
2.9
——
——
——
Incr
ease
/(de
crea
se)
in
empl
oyee
hou
sing
fac
ility
——
——
——
——
——
(6.6
)(6
.6)
Net
cas
h fl
ow (
utili
sed)
/ge
nera
ted
by fi
nanc
ing
acti
viti
es(3
01.1
)69
1.4
390.
340
.0(1
76.1
)25
4.2
(388
.4)
1 71
0.8
1 32
2.4
361.
6(9
27.3
)75
6.7
Net
incr
ease
/(de
crea
se)
in c
ash
and
cash
equ
ival
ents
44.4
—44
.4(2
1.5)
(105
.0)
(82.
1)(8
5.3)
—(8
5.3)
57.6
(918
.9)
(946
.6)
Cash
and
cas
h eq
uiva
lent
s at
be
ginn
ing
of y
ear
326.
1—
326.
160
.553
1.0
917.
6 4
11.4
—
411
.4
2.9
1
449
.9
1 8
64.2
Cash
and
cas
h eq
uiva
lent
s at
en
d of
yea
r37
0.5
—37
0.5
39.0
426.
083
5.5
326.
1—
326.
160
.553
1.0
917.
6
Royal Bafokeng Platinum Annual Financial Statements 2016 I 61

35. Earnings per share The weighted average number of ordinary shares in issue outside the Group for purposes of basic earnings per share and the
weighted average number of ordinary shares for diluted earnings per share are calculated as follows:Group
2016 2015
Number of shares issued 195 836 465 193 726 374
Mahube Trust — —
Management incentive schemes (4 092 851) (2 595 717)
Number of shares issued outside the Group 191 743 614 191 130 657
Adjusted for weighted shares issued during the year 401 513 461 403
Weighted average number of ordinary shares in issue for earnings per share 192 145 127 191 592 060
Dilutive potential ordinary shares relating to management incentive schemes 186 357 25 136
Weighted average number of potential dilutive ordinary shares in issue 192 331 484 191 617 196
Profit/(loss) attributable to owners of the Company R (million) 168.3 (3 044.8)
Basic earnings/(loss) per share (cents/share) 87.6 (1 589.2)
Basic earnings/(loss) per share is calculated by dividing the profit attributable to owners of the Company for the year by the weighted average number of ordinary shares in issue for earnings per share.
Diluted earnings/(loss) per share (cents/share) 87.5 (1 589.2)
Diluted earnings/(loss) per share is calculated by adjusting the weighted number of ordinary shares outstanding to assume conversion of all diluted potential ordinary shares.
Group
2016R (million)
2015R (million)
Gross Net Gross Net
Headline earnings/(loss) Profit/(loss) attributable to owners of the Company R (million) 168.3 (3 044.8)
Adjustments:
Profit on disposal of property, plant and equipment and other assets R (million) 6.9 (3.3) (1.0) (1.0)
Impairment of non-financial assets R (million) 2.6 1.7 4 466.2 2 886.2
Headline earnings/(loss) R (million) 166.7 (159.6)
Basic headline earnings/(loss) per share (cents/share) 86.7 (83.2)
Diluted headline earnings/(loss) per share (cents/share) 86.6 (83.2)
Notes to the consolidated annual financial statements and related accounting policies continuedfor the year ended 31 December 2016
62 I Royal Bafokeng Platinum Annual Financial Statements 2016

Company statement of financial positionas at 31 December 2016
Company
Notes2016
R (million)
2015Restated
R (million)
2014 Restated
R (million)
AssetsNon-current assets 9 394.0 9 205.6 8 192.3
Investment in subsidiaries 3 6 819.2 6 819.2 6 819.2
Intercompany loans 4 2 574.8 2 386.4 1 373.1
Current assets 400.8 515.2 1 442.9
Other receivables 1.0 — 7.1
Current tax receivable 5 0.2 0.8 0.3
Cash and cash equivalents 399.6 514.4 1 435.5
Total assets 9 794.8 9 720.8 9 635.2
Equity and liabilitiesTotal equity 9 794.2 9 718.9 9 635.1
Share capital 6 1.9 1.9 1.9
Share premium 6 9 424.1 9 389.4 9 364.7
Share-based payment reserve 7 190.0 168.5 139.4
Retained earnings 178.2 159.1 129.1
Current liabilities 0.6 1.9 0.1
Accruals and provisions 0.6 1.9 0.1
Total equity and liabilities 9 794.8 9 720.8 9 635.2
The notes on pages 67 to 70 form an integral part of these annual financial statements.
Royal Bafokeng Platinum Annual Financial Statements 2016 I 63

Company statement of comprehensive incomefor the year ended 31 December 2016
Company
Note2016
R (million)2015
R (million)
Dividend income 4.1 9.6
Finance income 38.9 54.0
Other income 0.9 —
Administrative expenses (19.4) (22.6)
Profit before tax 24.5 41.0
Income tax expense 8 (5.4) (11.0)
Net profit for the year 19.1 30.0
Other comprehensive income — —
Total comprehensive income 19.1 30.0
The notes on pages 67 to 70 form an integral part of these annual financial statements.
64 I Royal Bafokeng Platinum Annual Financial Statements 2016

Company statement of changes in equityfor the year ended 31 December 2016
Number of shares
issued
Ordinary shares
R(million)
Share premium
R(million)
Share-based
payment reserve
R(million)
Retained earnings
R(million)
TotalR
(million)
2016
Restated balance at 31 December 2015 191 743 614 1.9 9 389.4 168.5 159.1 9 718.9
Share-based payment charge — — — 52.8 — 52.8
2013 BSP shares vested in April 2016 534 376 — 31.3 (31.3) — —
Share options exercised — — 3.4 — — 3.4
Total comprehensive income — — — — 19.1 19.1
Balance at 31 December 2016 192 277 990 1.9 9 424.1 190.0 178.2 9 794.2
2015
Restated balance at 31 December 2014 191 600 586 1.9 9 364.7 139.4 129.1 9 635.1
Share-based payment charge — — — 53.8 — 53.8
"A2" ordinary shares repurchased and cancelled (281 957) — — — — —
2012 BSP shares vested in April 2015 424 985 — 24.7 (24.7) — —
Total comprehensive income — — — — 30.0 30.0
Restated balance at 31 December 2015 191 743 614 1.9 9 389.4 168.5 159.1 9 718.9
The notes on pages 67 to 70 form an integral part of these annual financial statements.
Royal Bafokeng Platinum Annual Financial Statements 2016 I 65

Company statement of cash flowsfor the year ended 31 December 2016
Company
Note2016
R (million)2015
R (million)
Cash flows from operating activitiesCash utilised by operations 9 (20.8) (13.7)
Finance income 38.9 54.0
Dividend received 4.1 9.6
Tax refund received 5 0.3 —
Tax paid 5 (5.1) (11.5)
Net cash flow generated by operating activities 17.4 38.4
Cash flows from financing activities
Related party loans granted* (1 406.6) (1 565.2)
Proceeds on related party loans* 1 271.5 605.7
Proceeds from share option vested and exercised 2.9 —
Net cash flow generated by financing activities (132.2) (959.5)
Net decrease in cash and cash equivalents (114.8) (921.1)
Cash and cash equivalents at beginning of year 514.4 1 435.5
Cash and cash equivalents at end of year 399.6 514.4
* Adjusted for non-cash items
The notes on pages 67 to 70 form an integral part of these annual financial statements.
66 I Royal Bafokeng Platinum Annual Financial Statements 2016

Notes to the Company annual financial statements and related accounting policiesfor the year ended 31 December 2016
1. General information and basis of preparation and accounting policies The general information and basis of preparation are disclosed on pages 18 to 20. Accounting policies specific to the items in the notes to the financial statements have been included in the individual notes.
2. Critical estimates, judgements and errorsCorrection of error in accounting for share-based payment reserve and related intercompany receivableDuring 2016 the Company performed a detailed review of the accounting for share-based payments. An error was identified whereby the share-based payment for BRMS was not recorded in the separate financial statements of the Company. RBPlat Company is settling the share-based transaction with its own equity and should therefore have recognised the share-based payment reserve. Although this has been accounted for correctly on a Group level, IFRS 2 requires this to be done on a Company level.
The grant by RBPlat of share schemes over its equity to the employees of subsidiary undertakings is treated as a capital contribution.
RBPlat has an agreement with its subsidiary companies to recharge the subsidiaries for the share schemes granted to the subsidiaries’ employees. It is RBPlat’s policy to account for the recharge as a deduction of the capital contribution over the vesting period.
The error has been corrected by restating each of the affected financial statement line items for the prior periods and the impact is as follows:
Balance sheet extract31 December
2015 Increase
31 December 2015
(Restated)31 December
2014 Increase
1 January 2015
(Restated)
Intercompany loans 2 260.8 125.6 2 386.4 1 282.3 90.8 1 373.1
Net assets 9 593.3 125.6 9 718.9 9 544.3 90.8 9 635.1
Share-based payment reserve 42.9 125.6 168.5 48.6 90.8 139.4
Total equity 9 593.3 125.6 9 718.9 9 544.3 90.8 9 635.1
3. Investment in subsidiariesCompany
2016R (million)
2015R (million)
Investments in subsidiaries are accounted for at cost less impairment.
Investment in subsidiaries is accounted for at cost less any impairment provision in the Company's financial statements.
Investments in unlisted companies at cost:
Direct investment in subsidiaries consists of:
> 1 000 ordinary shares with a par value of R1 each in Royal Bafokeng Platinum Management Services Proprietary Limited (100% interest) — —
> 320 ordinary shares with a par value of R1 each in Royal Bafokeng Resources Proprietary Limited (100% interest) 6 819.2 6 819.2
Closing balance at 31 December 6 819.2 6 819.2
Indirect investment in subsidiaries consists of:
> Bafokeng Rasimone Management Services Proprietary Limited (100% interest) > Royal Bafokeng Resources Properties (RF) Proprietary Limited (100% interest).All subsidiaries are incorporated in South Africa. The 67% participation interest in the BRPM JV is held by Royal Bafokeng Resources Proprietary Limited.There was no impairment of the investment in subsidiaries in the current financial year (2015: nil).
4. Intercompany loansCompany
2016R (million)
2015Restated
R (million)
Intercompany loans are carried at cost and included in non-current assets as their maturities are greater than 12 months after the statement of financial position date.
> Royal Bafokeng Platinum Management Services Proprietary Limited 190.1 176.0> Royal Bafokeng Resources Proprietary Limited 2 300.2 2 084.8> Bafokeng Rasimone Management Services Proprietary Limited 84.5 125.6
Closing balance at 31 December 2 574.8 2 386.4
The intercompany loans bear no interest and have no fixed terms of repayment.
Royal Bafokeng Platinum Annual Financial Statements 2016 I 67

5. Current tax receivable Company
2016R (million)
2015R (million)
The movement in the balance can be explained as follows:
Opening balance (0.8) (0.3)
Income tax charge 5.4 11.0
Refund received 0.3 —
Payment made (5.1) (11.5)
Closing balance at 31 December (0.2) (0.8)
6. Share capital and share premium Ordinary shares are classified as equity. Incremental costs directly attributable to the issue of new ordinary shares or options are shown in equity as a deduction, net of tax, from the proceeds.
The carrying value of the Company's shares held by the Mahube Trust and the Company's subsidiaries in respect of share schemes are shown as a reduction in shareholders' equity. When share options are exercised, the Company issues new shares or issues shares from treasury shares. The proceeds received net of any directly attributable transaction costs are credited to share capital and share premium when options are exercised.
Company
2016R (million)
2015R (million)
Share capital and share premium The authorised and issued share capital of the Company is as follows:
Authorised share capital250 000 000 (2015: 250 000 000) ordinary shares with a par value of R0.01 each 2 500 000 2 500 000
1 500 000 (2015: 1 500 000) “A1” ordinary shares with a par value of R0.01 each 15 000 15 000
1 500 000 (2015: 1 500 000) “A2” ordinary shares with a par value of R0.01 each 15 000 15 000
1 500 000 (2015: 1 500 000) “A3” ordinary shares with a par value of R0.01 each 15 000 15 000
Total authorised share capital 2 545 000 2 545 000
R R
Issued ordinary share capitalOpening balance 191 743 614 (2015: 191 318 629) ordinary shares with a par value of R0.01 1 917 435 1 913 185
2 110 091 (2015: 833 085) ordinary shares issued as part of management share incentive scheme 21 101 8 331
534 376 BSP shares vested in April 2016 5 344 —
424 985 BSP shares vested in April 2015 — 4 250
Less: Treasury shares
2 110 091 (2015: 833 085) ordinary shares issued as part of management share incentive scheme (21 101) (8 331)
Total 1 922 779 (2015: 191 743 614) ordinary shares 1 922 779 1 917 435
Issued “A1”, “A2” and “A3” ordinary share capital
Opening balance nil (2015: 281 957) “A” ordinary shares — 2 821
281 957 “A2” ordinary shares repurchased and cancelled in 2014 — —
281 957 “A3” ordinary shares repurchased and cancelled in 2015 — (2 821)
Closing balance nil “A” ordinary shares — —
Notes to the Company annual financial statements and related accounting policies continuedfor the year ended 31 December 2016
68 I Royal Bafokeng Platinum Annual Financial Statements 2016
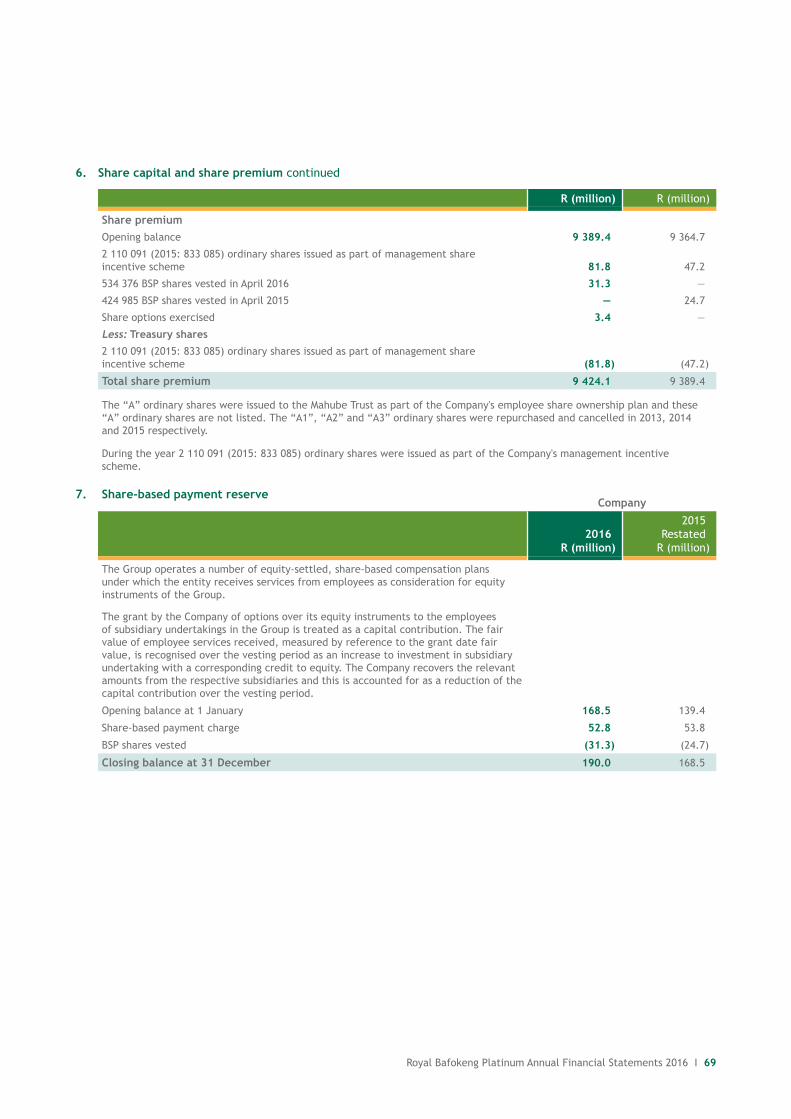
6. Share capital and share premium continued
R (million) R (million)
Share premiumOpening balance 9 389.4 9 364.7
2 110 091 (2015: 833 085) ordinary shares issued as part of management share incentive scheme 81.8 47.2
534 376 BSP shares vested in April 2016 31.3 —
424 985 BSP shares vested in April 2015 — 24.7
Share options exercised 3.4 —
Less: Treasury shares
2 110 091 (2015: 833 085) ordinary shares issued as part of management share incentive scheme (81.8) (47.2)
Total share premium 9 424.1 9 389.4
The “A” ordinary shares were issued to the Mahube Trust as part of the Company's employee share ownership plan and these “A” ordinary shares are not listed. The “A1”, “A2” and “A3” ordinary shares were repurchased and cancelled in 2013, 2014 and 2015 respectively.
During the year 2 110 091 (2015: 833 085) ordinary shares were issued as part of the Company's management incentive scheme.
7. Share-based payment reserve Company
2016R (million)
2015Restated
R (million)
The Group operates a number of equity-settled, share-based compensation plans under which the entity receives services from employees as consideration for equity instruments of the Group.
The grant by the Company of options over its equity instruments to the employees of subsidiary undertakings in the Group is treated as a capital contribution. The fair value of employee services received, measured by reference to the grant date fair value, is recognised over the vesting period as an increase to investment in subsidiary undertaking with a corresponding credit to equity. The Company recovers the relevant amounts from the respective subsidiaries and this is accounted for as a reduction of the capital contribution over the vesting period.
Opening balance at 1 January 168.5 139.4
Share-based payment charge 52.8 53.8
BSP shares vested (31.3) (24.7)
Closing balance at 31 December 190.0 168.5
Royal Bafokeng Platinum Annual Financial Statements 2016 I 69

Notes to the Company annual financial statements and related accounting policies continuedfor the year ended 31 December 2016
8. Income tax expenseCompany
2016R (million)
2015R (million)
Current tax expense comprises tax payable calculated on the basis of the expected taxable income for the year, using the tax rates enacted at the statement of financial position date, and any adjustment of tax payable for previous years.
Income tax 5.4 11.0
Tax rate reconciliation
Profit before tax 24.5 41.0
Tax calculated at a tax rate of 28% (6.8) (11.5)
Non-taxable income 1.4 2.7
Non-deductible expenditure — (2.2)
(5.4) (11.0)
Effective tax rate (%) 22.0 26.8
9. Cash utilised by operationsCompany
2016R (million)
2015R (million)
Profit before tax 24.5 41.0
Finance income (43.0) (63.6)
Changes in working capital (2.3) 8.9
(Decrease)/increase in accruals (1.3) 1.8
(Increase)/decrease in other receivables (1.0) 7.1
Cash utilised by operations (20.8) (13.7)
70 I Royal Bafokeng Platinum Annual Financial Statements 2016

Non-IFRS measuresfor the year ended 31 December 2016
The Company utilises certain non-IFRS performance measures and ratios in managing the business and may provide users of the financial information with additional meaningful comparisons between current results and results in the prior period. Non-IFRS financial measures should be viewed in addition to and not as an alternative for the reported operating results or cash flow from operations or any other measure of performance prepared in accordance with IFRS. In addition, these measures may not be comparable to similarly titled measures used by other companies.
Normalised headline earnings and normalised HEPS Normalised headline earnings and normalised HEPS are non-IFRS measures used by the Group in evaluating the Group's performance against its competitors. This supplements the IFRS measures as normalised headline earnings and normalised HEPS are calculated by adjusting the basic earnings and EPS for the year with:> profit or loss on disposal of property, plant and equipment > the fair value depreciation of property, plant and equipment that arose as a consequence of the purchase price allocations
completed in terms of IFRS 3: Business Combinations > the fair value amortisation of mineral rights that arose as a consequence of the purchase price allocations completed in terms
of IFRS 3: Business Combinations > impairment of non-financial assets > tax implications of above adjustments> once-off tax adjustments.
The reconciliation of basic earnings to normalised headline earnings is shown below:
2016R (million)
2015R (million)
Basic earnings/(loss) attributable to owners of the Company 168.3 (3 044.8)
Fair value depreciation and amortisation — 91.5
Tax impact of above adjustments — (25.6)
Once-off tax adjustment (46.9) 110.1
Normalised basic earnings/(loss) 121.4 (2 868.8)
Impairment of non-financial assets 1.7 2 886.2
Profit on disposal of assets (3.3) (1.0)
Normalised headline earnings 119.8 16.4
The reconciliation of normalised EPS to the relevant IFRS EPS is shown below:
2016 2015
EPS/(LPS) (cents per share) 87.6 (1 589.2)
Impairment of non-financial assets (cents per share) — 1 506.5
Profit on disposal of assets (cents per share) (0.9) (0.5)
HEPS/(HLPS) (cents per share) 86.7 (83.2)
Fair value depreciation and amortisation (cents per share) — 47.8
Tax impact of above adjustments (cents per share) — (13.4)
Once-off tax adjustment (cents per share) (24.4) 57.5
Normalised HEPS (cents per share) 62.3 8.7
EBITDA Earnings before interest, tax, depreciation and amortisation (EBITDA). The EBITDA gives an indication of the current operational profitability of the business.
The reconciliation of EBITDA to the relevant IFRS profit before tax is shown below:
2016R (million)
2015R (million)
Profit/(loss) before tax 255.0 (4 520.3)
Less: Finance income (91.8) (106.2)
Plus: Finance cost 7.4 25.1
Plus: Impairment of non-financial assets 2.6 4 466.2
Plus: Depreciation of assets 277.1 367.9
Plus: Amortisation (mineral rights, employee housing receivables and benefits) 39.4 65.2
EBITDA 489.7 297.9
Royal Bafokeng Platinum Annual Financial Statements 2016 I 71

Royal Bafokeng Platinum Group structure at 31 December 2016
11.44% 51.74% 36.82%
100%100%
67%
* Incorporates the mining of the Boschkoppie and Styldrift mineral rights
100% 100%
Rustenburg Platinum Mines Limited
Royal Bafokeng Platinum Management Services Proprietary Limited
Bafokeng Rasimone Platinum Mine
Unincorporated Joint Venture*
Royal Bafokeng Holdings Proprietary Limited
Royal Bafokeng Platinum Limited
Royal Bafokeng Resources Proprietary Limited
Bafokeng Rasimone Management Services Proprietary Limited
Free float
Royal Bafokeng Resources Properties (RF)
Proprietary Limited
33%
72 I Royal Bafokeng Platinum Annual Financial Statements 2016

Administration
Shareholders’ diaryFinancial year-end:31 December of each year
Interim period-end:30 June of each year
Integrated report and annual financial statements(mailed to shareholders)7 March 2017
AdministrationCompany registered officeRoyal Bafokeng Platinum LimitedRegistration number: 2008/015696/06Share code: RBPISIN: ZAE000149936
The PivotNo 1 Monte Casino BoulevardBlock C4th FloorFourwaysJohannesburg2021South Africa
PO Box 2283Fourways2055South Africa
Company SecretaryLester JoosteEmail: [email protected]: +27 10 590 4519Telefax: +27 086 572 8047
Investor relationsLindiwe MontshiwagaeEmail: [email protected]: +27 10 590 4517Telefax: +27 086 219 5131
Public OfficerReginald HamanEmail: [email protected]: +27 10 590 4533Telefax: +27 086 219 5131
Independent external auditorsPricewaterhouseCoopers Inc.2 Eglin RoadSunninghillJohannesburg2157South Africa
Transfer secretariesComputershare Investor Services Proprietary LimitedRosebank Towers15 Biermann AvenueRosebankJohannesburg2196
PO Box 61051Marshalltown 2107South AfricaTelephone: +27 11 370 5000Telefax: + 27 11 688 5200
SponsorMerrill Lynch South Africa Proprietary Limited1 Sandton DriveSandhurstJohannesburg2196South Africa
BASTION GRAPHICS

> MO
RE TH
AN
MIN
ING
RO
YAL B
AFO
KEN
G PLATIN
UM
AN
NU
AL FIN
AN
CIA
L STATEMEN
TS 2016
www.bafokengplatinum.co.za
MORE THAN MINING
Annual Financial Statements 2016