Morbidity and Mortality Weekly Report - cdc.gov · Morbidity and Mortality Weekly Report ... John...
32
Morbidity and Mortality Weekly Report Weekly January 7, 2005 / Vol. 53 / Nos. 51 & 52 depar depar depar depar department of health and human ser tment of health and human ser tment of health and human ser tment of health and human ser tment of health and human services vices vices vices vices Centers for Disease Control and Prevention Centers for Disease Control and Prevention Centers for Disease Control and Prevention Centers for Disease Control and Prevention Centers for Disease Control and Prevention Transmission of Malaria in Resort Areas — Dominican Republic, 2004 Malaria is caused by any of four Plasmodium parasites car- ried by Anopheles mosquitoes and usually is transmitted by the bite of an infective female Anopheles. In rural areas of the Dominican Republic, P. falciparum malaria is endemic, with the highest risk in the far western region of the country, and prophylactic medication with chloroquine is recommended for incoming travelers. Conversely, urban and resort areas in the Dominican Republic have been considered nonmalarious, and prophylactic medication has not been recommended for persons traveling to these areas (1). However, since Novem- ber 2004, CDC has received reports of three malaria cases in U.S. travelers returning from areas in La Altagracia and Duarte provinces (Figure) previously considered nonmalarious. An additional 14 cases of malaria in La Altagracia Province, in the far eastern region of the country, have been reported in European and Canadian travelers. This report describes three of these 17 malaria cases and summarizes the overall investi- gation, which led to expansion of CDC recommendations for chloroquine prophylaxis to include all of La Altagracia and Duarte provinces. Case Reports Case 1. During the third week of November 2004, a woman aged 47 years was admitted to an intensive care unit (ICU) in the United States with multisystem organ failure, including acute respiratory distress syndrome and renal failure. She had a 6-day history of fever, chills, abdominal pain, headache, nausea, and vomiting that began 24–36 hours after returning from a 1-week vacation to a resort in Punta Cana in La Altagracia Province. The patient had been examined twice by a health-care provider in an outpatient setting and sent home. Two days before hospital admission, she had jaundice. On admission, the patient had P. falciparum malaria on blood smear (35% parasitemia), anemia (hemoglobin: 10.4 g/dL [normal: 12–18 g/dL]), leukocytosis (white blood cell count: 35,000/μL [normal: 5,000–10,000/μL]), severe thrombocy- topenia (platelet count: 5,000/ μL [normal: 130,000–400,000/ μL]), and was obtunded. The patient was started on intravenous FIGURE. Provinces with resort and urban areas where malaria is not endemic but where 17 cases were reported — Dominican Republic, 2004 HAITI DOMINICAN REPUBLIC Santo Domingo San Francisco de Macor s í Duarte Province La Altagracia Province Atlantic Ocean Punta Cana Caribbean Sea 1198 Fatal Rat-Bite Fever — Florida and Washington, 2003 1202 Tularemia Associated with a Hamster Bite — Colorado, 2004 1203 Notice to Readers INSIDE QuickGuide Recommended Childhood and Adolescent Immunization Schedule — United States, 2005
Transcript of Morbidity and Mortality Weekly Report - cdc.gov · Morbidity and Mortality Weekly Report ... John...

Morbidity and Mortality Weekly Report
Weekly January 7, 2005 / Vol. 53 / Nos. 51 & 52
depardepardepardepardepartment of health and human sertment of health and human sertment of health and human sertment of health and human sertment of health and human servicesvicesvicesvicesvicesCenters for Disease Control and PreventionCenters for Disease Control and PreventionCenters for Disease Control and PreventionCenters for Disease Control and PreventionCenters for Disease Control and Prevention
Transmission of Malaria in Resort Areas — Dominican Republic, 2004Malaria is caused by any of four Plasmodium parasites car-
ried by Anopheles mosquitoes and usually is transmitted bythe bite of an infective female Anopheles. In rural areas of theDominican Republic, P. falciparum malaria is endemic, withthe highest risk in the far western region of the country, andprophylactic medication with chloroquine is recommendedfor incoming travelers. Conversely, urban and resort areas inthe Dominican Republic have been considered nonmalarious,and prophylactic medication has not been recommended forpersons traveling to these areas (1). However, since Novem-ber 2004, CDC has received reports of three malaria cases inU.S. travelers returning from areas in La Altagracia and Duarteprovinces (Figure) previously considered nonmalarious. Anadditional 14 cases of malaria in La Altagracia Province, inthe far eastern region of the country, have been reported inEuropean and Canadian travelers. This report describes threeof these 17 malaria cases and summarizes the overall investi-gation, which led to expansion of CDC recommendations forchloroquine prophylaxis to include all of La Altagracia andDuarte provinces.
Case ReportsCase 1. During the third week of November 2004, a woman
aged 47 years was admitted to an intensive care unit (ICU) inthe United States with multisystem organ failure, includingacute respiratory distress syndrome and renal failure. She hada 6-day history of fever, chills, abdominal pain, headache,nausea, and vomiting that began 24–36 hours after returningfrom a 1-week vacation to a resort in Punta Cana in LaAltagracia Province. The patient had been examined twice bya health-care provider in an outpatient setting and sent home.Two days before hospital admission, she had jaundice. Onadmission, the patient had P. falciparum malaria on blood
smear (35% parasitemia), anemia (hemoglobin: 10.4 g/dL[normal: 12–18 g/dL]), leukocytosis (white blood cell count:35,000/µL [normal: 5,000–10,000/µL]), severe thrombocy-topenia (platelet count: 5,000/µL [normal: 130,000–400,000/µL]),and was obtunded. The patient was started on intravenous
FIGURE. Provinces with resort and urban areas where malariais not endemic but where 17 cases were reported — DominicanRepublic, 2004
HAITIDOMINICANREPUBLIC
Santo Domingo
San Franciscode Macor sí
Duarte Province
La AltagraciaProvince
Atlantic Ocean
PuntaCana
Caribbean Sea
1198 Fatal Rat-Bite Fever — Florida and Washington, 20031202 Tularemia Associated with a Hamster Bite — Colorado,
20041203 Notice to Readers
INSIDE
QuickGuide
Recommended Childhoodand Adolescent Immunization
Schedule — United States, 2005

1196 MMWR January 7, 2005
SUGGESTED CITATIONCenters for Disease Control and Prevention. [Article Title].MMWR 2005;53:[inclusive page numbers].
The MMWR series of publications is published by theCoordinating Center for Health Information and Service,*Centers for Disease Control and Prevention (CDC), U.S.Department of Health and Human Services, Atlanta, GA 30333.
Centers for Disease Control and Prevention
Julie L. Gerberding, MD, MPHDirector
Dixie E. Snider, MD, MPHChief of Science
Tanja Popovic, MD, PhD(Acting) Associate Director for Science
Coordinating Center for Health Informationand Service*
Blake Caldwell, MD, MPH, and Edward J. Sondik, PhD(Acting) Directors
National Center for Health Marketing*
Steven L. Solomon, MD(Acting) Director
Division of Scientific Communications*
John W. Ward, MD(Acting) Director
Editor, MMWR Series
Suzanne M. Hewitt, MPAManaging Editor, MMWR Series
Douglas W. Weatherwax(Acting) Lead Technical Writer-Editor
Stephanie M. MalloyJude C. RutledgeTeresa F. Rutledge
Writer-Editors
Lynda G. CupellMalbea A. LaPete
Visual Information Specialists
Kim L. Bright, MBAQuang M. Doan, MBA
Erica R. ShaverInformation Technology Specialists
Notifiable Disease Morbidity and 122 Cities Mortality DataPatsy A. Hall Donna EdwardsDeborah A. Adams Mechelle HesterFelicia J. Connor Tambra McGeeRosaline Dhara Pearl C. Sharp
* Proposed.
quinidine gluconate, and the parasitemia cleared in 2 days.On the fifth day of hospitalization, the quinidine was discon-tinued, and the patient was placed on doxycycline. Thepatient underwent hemodialysis for renal failure; she improvedand was discharged to a rehabilitation center, where sheremained as of December 30, 2004. Her husband reportedthat they had stayed at an all-inclusive resort in Punta Canaduring their entire week in the Dominican Republic and didnot travel to other areas. In addition, the patient had not trav-eled to any other malarious areas nor received any bloodtransfusions during the preceding year.
Case 2. In late November, a man aged 71 years visited anemergency department in Canada 10 days after returning homefrom a week at a resort in Punta Cana and after 4 days offever, myalgias, and malaise. Viral infection was diagnosed,and the man was discharged home. The next day, he saw hisfamily doctor, who also diagnosed a viral illness. The follow-ing day, the patient’s condition deteriorated substantially, andhe was admitted to the hospital with hypotension, hypoxia,acute renal failure, and respiratory failure requiring mechani-cal ventilation. Two days after admission, the patient had ablood smear that demonstrated a 9% P. falciparum parasitemia.He was treated with intravenous quinidine and doxycyclineand underwent hemodialysis. The patient reported taking aday trip to Santo Domingo while in the Dominican Republicbut reported no other travel. During the preceding year, hehad not traveled to any other malarious areas nor received anyblood transfusions. As of December 30, the patient remainedhospitalized.
Case 3. In late November, a man aged 39 years was admit-ted to an ICU in Canada 12 days after returning home from aresort in Punta Cana, where he had stayed for 2 weeks. Thepatient reported having fevers and chills for 9 days and laterhad jaundice. One day after admission, he had a blood smearrevealing 2% P. falciparum parasitemia and was treated withchloroquine and quinine. The patient was anemic and hadacute respiratory distress syndrome, acute renal failure, andcerebral malaria; he underwent exchange transfusion. Duringthe preceding year, the patient had not traveled to any othermalarious areas nor received any blood transfusions. As ofDecember 30, the patient remained hospitalized.
Epidemiologic InvestigationAfter receiving reports of malaria in two U.S. travelers to
the Dominican Republic, CDC contacted the Pan AmericanHealth Organization, World Health Organization, and Min-istry of Health (MoH) in the Dominican Republic, whichinitiated investigations. Seventeen patients (i.e., three fromthe United States, six from Canada, and eight from European

Vol. 53 / Nos. 51 & 52 MMWR 1197
countries) were identified*; P. falciparum malaria was con-firmed in all of them. Sixteen of the patients had traveled toPunta Cana resorts in La Altagracia Province and one to SanFrancisco de Macorís in Duarte Province. Sixteen returnedhome during November 3–16, and one returned December20; all were admitted to hospitals, and six required treatmentin ICUs. As of December 30, no deaths had been reported;three patients remained hospitalized. Seven of the patients con-firmed that they had not traveled to any other malarious areasnor received any blood transfusions during the preceding year.
Prevention and Control MeasuresOn November 24, CDC expanded its recommendations
for chloroquine prophylaxis for travelers to the DominicanRepublic to include all of La Altagracia and Duarte provinces,in addition to rural areas countrywide (2). The revised rec-ommendations advise clinicians and travelers about theexpanded malaria risk area so that any febrile persons whohave visited these areas will receive prompt diagnosis and treat-ment to avoid severe complications. Major networks of bloodcollection agencies and the Food and Drug Administrationalso were contacted. Similar alerts were issued by health offi-cials in Europe and by the Public Health Agency of Canada.
The MoH investigation included active case detection andentomologic investigations in La Altagracia and Duarte prov-inces. In Duarte Province, officials confirmed that no othercases had been reported during 2003–2004. Nonetheless,MoH is taking precautionary measures, including enhancedsurveillance. In La Altagracia Province, MoH surveillance datahave identified an increase in cases of malaria beginning inNovember 2004 among migrant workers in the Bavaro Zone,10 miles from the Punta Cana resort area. MoH intensifiedcontrol measures in the Bavaro Zone, which include 1) pre-sumptive treatment of all construction and hotel workers byusing directly observed therapy with chloroquine and pri-maquine, and 2) mosquito control through residual and spa-tial insecticide spraying and application of larvicide tosuspected breeding sites. Measures instituted in the Punta Canaresort area include intensified surveillance and larvicideapplication.Reported by: C Kay, MD, D Patrick, MD, British Columbia Centrefor Disease Control, Vancouver; J Keystone, MD, Univ Health Network/GeoSentinel, Toronto; M Bodie-Collins, Public Health Agency of
Canada. C Riera, MD, Pan American Health Organization; J Puello,MD, Ministry of Health, Dominican Republic. T Jelinek, MD, BerlinInstitute of Tropical Medicine, Germany. D Freedman, MD, GeoSentinelGlobal Surveillance Network of the International Society of TravelMedicine, Stone Mountain, Georgia. P Kozarsky, MD, C Reed, MD,Div of Global Migration and Quarantine; M Parise, MD, P Nguyen-Dinh, MD, R Steketee, MD, Div of Parasitic Diseases, National Centerfor Infectious Diseases; M Eliades, MD, EIS Officer, CDC.
Editorial Note: This report describes an outbreak of malariain areas in the Dominican Republic previously thought to benonmalarious. P. falciparum is the only malaria parasite in theDominican Republic and has remained susceptible to chloro-quine. Because P. falciparum malaria can be rapidly fatal, trav-elers should be aware of risk areas so that they can takeappropriate preventive measures; clinicians should considermalaria in their diagnosis and treatment of febrile illness intravelers. Malaria can be prevented by taking an antimalarialdrug and by preventing mosquito bites. Chloroquine is therecommended drug for malaria prevention for persons travel-ing to the Dominican Republic and is highly efficacious andwell tolerated by most travelers. To prevent mosquito bites,travelers should use insect repellent containing up to 50%DEET and wear long-sleeved clothing; if not staying inscreened or air-conditioned housing, they should sleep undera net, preferably one treated with insecticide. Rapid interven-tion is crucial for ill travelers with suspected malaria (3). Innearly all cases in this outbreak, delays in diagnosis and treat-ment occurred; in certain cases, delays contributed toserious illness.
During July 1999–March 2000, a previous outbreak in theDominican Republic occurred among European travelers toPunta Cana, principally in the Bavaro Zone. Factors identi-fied as contributing to that outbreak were 1) the increasedbreeding of A. albimanus mosquitoes, the predominantmalaria vector in the Dominican Republic, in the wake ofHurricanes Mitch and George and 2) malaria-infectedmigrant workers. In 1999, approximately 3,000 malaria caseswere reported in the Dominican Republic, a 50% increaseover the number of cases in 1998 (4). During the 1999–2000outbreak, CDC travel recommendations were temporarilyexpanded to recommend chloroquine prophylaxis for allareas in La Altagracia Province; this recommendation wasrescinded 2 months later after MoH increased surveillanceand controlled the outbreak.
In September 2004, Hurricane Jeanne struck the Domini-can Republic. The east coast, including Punta Cana and theBavaro Zone, received heavy rains and flooding, which mighthave resulted in increased breeding of mosquitoes. In addi-tion, construction in Punta Cana and the Bavaro Zone hasbrought in many migrant workers from areas where malaria is
* The first U.S. patient was reported through the Emerging Infections Network,a provider-based sentinel network developed by the Infectious Disease Societyof America. The other two U.S. patients were reported through the CDCMalaria Hotline. The Public Health Agency of Canada, the GeoSentinelNetwork, and the European Network on Imported Infectious DiseaseSurveillance reported six cases in travelers from Canada and eight cases intravelers from Europe.

1198 MMWR January 7, 2005
endemic. The ongoing MoH investigation will attempt todetermine whether these factors have contributed to therecent increased transmission. MoH surveillance data indi-cate that, on average, approximately 1,500–2,500 malaria casesare reported annually in the Dominican Republic; in 2004, atotal of 2,012 cases had been reported through November.
Effective surveillance systems and rapid communicationamong surveillance networks are crucial to detecting cases ofmalaria and intervening in areas that are usually nonmalarious.During this outbreak, rapid communication among surveil-lance networks in North America, Europe, and the Carib-bean led to prompt diagnoses and timely public healthinterventions to prevent additional cases among residents ofand travelers to the Dominican Republic.References1. CDC. The yellow book: health information for international travel,
2003–2004. Atlanta, GA: US Department of Health and HumanServices, CDC; 2003.
2. CDC. Outbreak notice: advice for travelers about revised recommenda-tions for malaria prophylaxis in Dominican Republic; updated Decem-ber 17, 2004. Atlanta, GA: US Department of Health and HumanServices, CDC; 2004. Available at http://www.cdc.gov/travel/other/malaria_dr_2004.htm.
3. Newman RD, Parise ME, Barber AM, Steketee RW. Malaria-relateddeaths among U.S. travelers, 1963–2001. Ann Intern Med2004;141:547–55.
4. Jelinek T, Grobusch M, Harms-Zwingenberger G, Kollaritsch H,Richter J, Zieger B. Falciparum malaria in European tourists to theDominican Republic. Emerg Infect Dis 2000;6:537–8.
Fatal Rat-Bite Fever — Floridaand Washington, 2003
Rat-bite fever (RBF) is a rare, systemic illness caused byinfection with Streptobacillus moniliformis. RBF has a case-fatality rate of 7%–10% among untreated patients (1).S. moniliformis is commonly found in the nasal and oropha-ryngeal flora of rats. Human infection can result from a biteor scratch from an infected or colonized rat, handling of aninfected rat, or ingestion of food or water contaminated withinfected rat excreta (1). An abrupt onset of fever, myalgias,arthralgias, vomiting, and headache typically occurs within2–10 days of exposure and is usually followed by a maculo-papular rash on the extremities (1). This report summarizesthe clinical course and exposure history of two rapidly fatalcases of RBF identified by the CDC Unexplained Deaths andCritical Illnesses (UNEX) Project in 2003. These casesunderscore the importance of 1) including RBF in the differ-ential diagnoses of acutely ill patients with reported rat expo-sures and 2) preventing zoonotic infections among personswith occupational or recreational exposure to rats.
Case ReportsFlorida. In early September 2003, a previously healthy
woman aged 52 years visited an emergency department (ED)with a 2-day history of headache, abdominal pain, diarrhea,lethargy, right axillary lymphadenopathy, progressive myalgias,and pain in her distal extremities. On physical examination,she was afebrile and hypotensive (blood pressure: 82/40mmHg) with left-sided abdominal tenderness and scleral ict-erus; no rash was noted. Laboratory tests indicated a mildlyelevated white blood cell count of 13,800 cells/µL (normal:5,000–10,000 cells/µL), thrombocytopenia (71,000 platelets/µL[normal: 130,000–500,000 platelets/µL]), elevated alanineaminotransferase of 112 U/L (normal: 20–52 U/L), elevatedaspartate aminotransferase of 154 U/L (normal: <40 U/L),elevated total bilirubin of 5.8 mg/dL (normal: 0.2–1.2 mg/dL),elevated blood urea nitrogen of 55 mg/dL (normal: 7–23 mg/dL), and elevated creatinine of 2.9 mg/dL (normal: 0.7–1.5mg/dL).
The patient was admitted to the intensive care unit, whereshe became increasingly hypoxic with marked anemia (hemo-globin: 8.6 g/dL [normal: 12–16 g/dL]) and increasinglysevere thrombocytopenia (32,000 platelets/µL). She wastreated with ciprofloxacin, metronidazole, and vancomycinfor possible gram-negative sepsis and received two blood trans-fusions; however, she died approximately 12 hours afteradmission. A maculopapular rash was noted postmortem. Noautopsy was performed.
Peripheral blood smears obtained before death revealedabundant neutrophils and intracellular collections of filamen-tous bacteria (Figure). Premortem blood from a tube contain-ing no additives or separators was inoculated onto a bloodagar plate and incubated in CO2 at 95ºF (35ºC). After72 hours, the culture demonstrated slight growth of gram-negative filamentous bacteria. UNEX was contacted for assis-tance, and diagnostic specimens were submitted to CDC forfurther laboratory evaluation. At CDC, the isolate was sub-cultured onto media enriched with 20% solution of sterilenormal rabbit serum and incubated in a candle jar for 48 hours.Biochemical analyses identified the bacterial isolate asS. moniliformis. The 16S rRNA gene sequences amplified fromDNA extracted from the patient’s blood and the bacterialisolate were consistent with S. moniliformis.
The patient had been employed at a pet store. She was bit-ten on her right index finger by a rat in the store 2 days beforesymptom onset and 4 days before arriving at the ED. She self-treated the wound by using antiseptic ointmentimmediately after being bitten. In addition, she had regularcontact with several pet rats, cats, a dog, and an iguana at herhome; however, no bites from these animals were reported.None of the animals were tested for S. moniliformis.

Morbidity and Mortality Weekly Report
Recommendations and Reports
September 13, 2002 / Vol. 51 / No. RR-13
Centers for Disease Control and Prevention
Centers for Disease Control and Prevention
Centers for Disease Control and Prevention
Centers for Disease Control and Prevention
Centers for Disease Control and Prevention
SAFER • HEAL
SAFER • HEAL
SAFER • HEAL
SAFER • HEAL
SAFER • HEALTHIER • PEOPLE
THIER • PEOPLE
THIER • PEOPLE
THIER • PEOPLE
THIER • PEOPLE TM
Folic Acid and Prevention
of Spina Bifida and Anencephaly
10 Years After the U.S. Public Health
Service Recommendation
know what matters.
trust • wor • thy: adj 1 : worthy of belief
2 : capable of being depended upon;
see also MMWR.
('tr st-"w r-the)e e

1200 MMWR January 7, 2005
Washington. In late November 2003, a previously healthywoman aged 19 years was pronounced dead on arrival at ahospital ED. No laboratory studies were performed in theED. An acquaintance reported that the patient had experi-enced a 3-day history of fever, headache, myalgias, nausea,and profound weakness without cough, vomiting, diarrhea,or rash. Before her transport to the ED, she exhibited anxiety,confusion, and labored breathing. ED staff noted that sheappeared jaundiced. The body was transported to the coroner’soffice, where an autopsy was performed.
Cultures of blood and tissue from autopsy were negative forpathogenic organisms. A toxicology screen was negative.Serologic assays for leptospirosis, Epstein-Barr virus, cytome-galovirus, and viral hepatitis were negative for recent infec-tion. Histopathology revealed findings suggestive of a systemicinfectious process that included disseminated intravascularcoagulopathy and inflammatory cell infiltrates in the liver,heart, and lungs. UNEX was contacted for assistance, andproject staff facilitated the submission of diagnostic specimensto CDC for further laboratory evaluation. Immunohis-tochemical assays performed at CDC for Leptospira spp.,Bartonella quintana, spotted fever and typhus group rickett-siae, flaviviruses, hantaviruses, and influenza viruses were nega-tive. Clusters of filamentous bacteria were identified in sectionsof the liver and kidney by using a silver stain. The 16S rRNAgene sequence amplified from DNA extracted from paraffin-embedded, formalin-fixed samples of liver and kidney wasconsistent with S. moniliformis.
The patient worked as a dog groomer and lived in an apart-ment with nine pet rats. One pet rat with respiratory symp-toms had recently been prescribed oral doxycycline after havingbeen evaluated at a veterinary clinic. Doxycycline was subse-quently used to treat a second ill rat. None of the rats were
tested for S. moniliformis. The patient had no known animalbites during the 2 weeks preceding her death.Reported by: WJ Pollock, MD, R Cunningham, Baptist Hospital;J Lanza, MD, S Buck, MD, PA Williams, Escambia County HealthDept, Pensacola; JJ Hamilton, MPH, R Sanderson, MA, Bur ofEpidemiology, Florida Dept of Health. D Selove, MD, T Harper,Thurston County Coroner’s Office; DT Yu, MD, Thurston County Deptof Health, Olympia; M Leslie, DVM, J Hofmann, MD, WashingtonDept of Health. S Reagan, MPH, M Fischer, MD, A Whitney, MS,C Sacchi, PhD, P Levett, PhD, M Daneshvar, PhD, L Helsel, R Morey,Div of Bacterial and Mycotic Diseases; S Zaki, MD, C Paddock, MD,W Shieh, MD, J Sumner, J Guarner, MD, Div of Viral and RickettsialDiseases, National Center for Infectious Diseases; D Gross, DVM, EISOfficer, CDC.
Editorial Note: Although rapidly fatal pediatric cases of RBFhave been described previously (2,3), similar mortality amongadults has not been reported. Mortality attributed to severesystemic complications (e.g., endocarditis, myocarditis, men-ingitis, pneumonia, or multiple organ failure) has been docu-mented in certain adult patients (1,4). Both patients describedin this report died within 12 hours of presentation, allowinglittle opportunity for assessment and treatment. These casereports demonstrate that infection with S. moniliformis cancause fulminant sepsis and death in previously healthy adults.As a result, prevention of severe disease might depend onincreasing the awareness of appropriate risk-reduction activi-ties and possible symptoms of RBF among persons who haveexposure to rats. Intravenous penicillin is the treatment ofchoice, and prompt therapy can prevent severe complications(1). Because rapid laboratory confirmation of infection withS. moniliformis might not be possible, clinicians should con-sider initiating empiric therapy for patients with a compatibleclinical presentation and exposure history.
Clinicians should consider RBF in the differential diagno-sis for unexplained febrile illness or sepsis in patients report-ing rat exposure. Initial symptoms might be nonspecific (Box),but a maculopapular rash and septic arthritis commonlydevelop (1,5). However, as demonstrated by the cases in thisreport, patients can have severe disease before the onset oftypical symptoms. Despite its name, approximately 30% ofpatients with RBF do not report having been bitten orscratched by a rat (1,5). Risk factors for RBF include han-dling rats at home and in the workplace (e.g., laboratories orpet stores). RBF is rare in the United States, with only a fewcases documented each year (1,6,7). However, because RBFis not a nationally notifiable disease, its actual incidence hasnot been well described.
In the cases described here, diagnosis of RBF was delayed inpart because of the inability to rapidly isolate or identifyS. moniliformis. If infection with S. moniliformis is suspected,
FIGURE. Streptobacillus moniliformis bacilli in a neutrophil(peripheral blood smear, Wright stain, original magnification:100X)
Photo/CDC

Vol. 53 / Nos. 51 & 52 MMWR 1201
BOX. Epidemiology, clinical findings, diagnosis, treatment, andprevention and reporting of rat-bite fever (RBF) caused byStreptobacillus moniliformis
Epidemiology/Ecology• Zoonotic disease caused by infection with
S. moniliformis, a fastidious gram-negative bacillus.• Spirillum minus also causes RBF outside the United States.• S. moniliformis is part of the normal respiratory flora of
rats. Other rodents might also be reservoirs.• Transmitted to humans by contact with infected rats or
by ingestion of rat excreta. Person-to-person transmissionhas not been reported.
• Incubation period: 2–10 days.• Cases are rare, but disease incidence is not well characterized.• Case-fatality rate as high as 10% in untreated patients.Clinical Findings• Initial symptoms are nonspecific and include fever, chills,
myalgias, arthralgias, headache, and vomiting.• Patients can have a maculopapular rash on the extremi-
ties or septic arthritis 2–4 days after fever onset.• Severe manifestations can include endocarditis,
myocarditis, meningitis, pneumonia, sepsis, and death.Diagnosis• Blood or synovial fluid culture, collected in tubes with-
out sodium polyanethol sulfonate (SPS). Inoculate intomedia supplemented with 20% solution of sterile nor-mal rabbit serum and incubate in humid environmentwith 5%–10% CO2 at 98.6ºF (37ºC). Hold cultures>5 days.
• Pleomorphic bacilli in Gram-, Wright-, or silver-stainedblood smears or tissues supports diagnosis.
• For assistance, contact a state public health laboratoryor CDC Meningitis and Special Pathogens Branch,telephone 404-639-3158.
Treatment• Intravenous penicillin, 1.2 million units/day for 5–7
days, followed by oral penicillin or ampicillin 500 mgfour times a day for 7 days if improvement is observed.
• Oral tetracycline 500 mg four times a day or intramuscu-lar streptomycin 7.5 mg/kg twice daily are alternatives.
Prevention and Reporting• Wear protective gloves, practice regular hand washing,
and avoid hand-to-mouth contact when handling ratsor cleaning rat cages.
• Adults should closely supervise children aged <5 yearsto prevent bites and hand-to-mouth contact.
• If bitten by a rat, promptly clean and disinfect thewound.
• Efficacy of antimicrobial prophylaxis is unknown.• Not a notifiable disease; however, unexplained deaths
and critical illnesses or rare diseases of public healthimportance might be reportable in certain states.
specific media and incubation conditions should be used (8)(Box). In the absence of a positive culture, identification ofpleomorphic gram-negative bacilli in appropriate specimensmight support a preliminary diagnosis (1). In the event of anunexplained death in a person with rat exposure, performingan autopsy might also be critical to identifying an etiology.
Because of the high prevalence of colonization and asymp-tomatic infection with S. moniliformis among rodents (Box),testing and treatment of rats is not practical. Disease preven-tion should center on risk reduction among persons with fre-quent rat exposure. Adherence to simple precautions whilehandling rats can reduce the risk for RBF and other potentialrodent-borne zoonotic infections, wound infections, andinjuries. Persons should wear gloves, practice regular handwashing, and avoid hand-to-mouth contact when handlingrats or cleaning rat cages (1,9). If bitten by a rat, persons shouldpromptly clean and disinfect the wound, seek medical atten-tion, and report their exposure history. A tetanus toxoid boostershould be administered if >10 years have lapsed since the lastdose (9,10).
Clinicians should contact their state health departments forassistance with diagnosis of unexplained deaths or critical ill-nesses and cases or clusters of suspected RBF or other zoonoticinfections. UNEX coordinates surveillance for unexplaineddeaths possibly attributed to infection throughout the UnitedStates. Cases are reported by a network of health departments,medical examiners/coroners, pathologists, and clinicians. Epi-demiologic and clinical data are collected, and available clini-cal and pathologic specimens are obtained for reference anddiagnostic testing at state, CDC, and other laboratories. Stateand local health departments may contact UNEX for assis-tance with the evaluation of unexplained deaths that occur intheir jurisdictions.References1. Washburn RG. Streptobacillus moniliformis (rat-bite fever). In: Mandell
GL, Bennett JE, Dolin R, eds. Principles and practice of infectiousdiseases. 5th ed. New York, NY: Churchill Livingstone; 2000:2422–4.
2. McHugh TP, Bartlett RL, Raymond JI. Rat-bite fever: report of a fatalcase. Ann Emerg Med 1985;14:1116–8.
3. Sens MA, Brown EW, Wilson LR, Crocker TP. Fatal Streptobacillusmoniliformis infection in a two-month-old infant. Am J Clin Pathol1989;91:612–6.
4. Shvartsblat SS, Kochie M, Harber P, Howard J. Fatal rat-bite fever in apet shop employee. Am J Ind Med 2004;45:357–60.
5. Graves MH, Janda MJ. Rat-bite fever (Streptobacillus moniliformis): apotential emerging disease. Int J Infect Dis 2001;5:151–4.
6. CDC. Rat-bite fever in a college student—California. MMWR1984;33:318–20.
7. CDC. Rat-bite fever—New Mexico, 1996. MMWR 1998;47:89–91.8. Weyant RS, Moss CW, Weaver RE, et al. Identification of unusual
pathogenic gram-negative aerobic and facultatively anaerobic bacte-ria. 2nd ed. Baltimore, MD: The Williams & Wilkins Co; 1996.

1202 MMWR January 7, 2005
9. National Association of State Public Health Veterinarians. Compen-dium of measures to prevent disease and injury associated withanimals in public settings. St. Paul, MN: National Association ofState Public Health Veterinarians; 2004. Available at http://s94745432.onlinehome.us/AnimalsInPublic2004.pdf.
10. Weber EJ, Callaham ML. Mammalian bites. In: Marx JA, HockenbergerRS, Walls RM, et al., eds. Rosen’s emergency medicine: concepts andclinical practice. 5th ed. St. Louis, MO: Mosby; 2002:775–85.
Brief Report
Tularemia Associated with a Hamster Bite —Colorado, 2004
In April 2004, the Colorado Department of Public Healthand Environment (CDPHE) was notified about a boy aged3 years with diagnosed tularemia associated with a hamsterbite. Tularemia has not been associated previously with pethamsters. CDPHE conducted an investigation to determinewhether other owners of hamsters were at risk. Clinicians andpublic health officials should be aware that pet hamsters are apotential source of tularemia.
During January 2–February 8, the boy was exposed to sixhamsters that his family had purchased from a pet store in theDenver metropolitan area. Each hamster reportedly died from“wet tail disease” (i.e., diarrhea) within 1 week of purchase.One hamster bit the child on the left ring finger shortly before itdied. Seven days later, the child had fever, malaise, painful leftaxillary lymphadenopathy, and skin sloughing at the bite site.After treatment with amoxicillin clavulanate failed, thepatient underwent excisional biopsy of a left axillary lymphnode 49 days after symptom onset for persistent painful lym-phadenopathy and intermittent fever. Tissue culture yielded asuspected Francisella tularensis isolate, which was confirmedby real-time polymerase chain reaction and timed-release fluo-rescence at the CDPHE laboratory. Convalescent serology waspositive at a titer of 4,096, and the isolate was identified byCDC as type B. No other risk factors for tularemia exposurewere identified, including no other animal contact, no expo-sure to game meat, and no known mosquito, tick, or fly bites.The patient improved after treatment with ciprofloxacin.
Workers at the pet store reported an unusual number ofdeaths among hamsters but not other animals during January–February; no carcasses were available for testing. One of twocats kept as store pets had a positive serologic test for F. tularensisat a titer of 256. Neither cat had appeared ill to store employees.
Lists of employees, pet suppliers, and customers who pur-chased hamsters during December 2003–February 2004 wereobtained from the store owner. Fifteen of 18 customers werelocated and interviewed. Eight of these had hamsters that died
within 2 weeks of purchase, but all carcasses had been dis-posed of and were unavailable for testing. One customer andone employee who had febrile illness after being bitten byhamsters from the store were negative for F. tularensis by sero-logic testing. The same customer’s hamster was available, andit was also negative for F. tularensis by serology and culture.
Approximately 80% of the 50 hamsters at the pet store camefrom customers who had pets with unanticipated litters. Theother 20% were purchased from two small-pet breeders. Thesebreeders were contacted, and neither reported an unusuallyhigh number of deaths of hamsters or other animals. Onebreeder also supplied animals to two pet stores in Wyoming.The Wyoming Department of Health had not been notifiedof any tularemia cases linked to these stores.
Confirmation of a hamster as the infectious source was lim-ited by the delay between the patient’s illness onset and diag-nosis and subsequent lack of availability of implicated hamstersfor testing. Nonetheless, the hamster that bit the patient wasthe most likely cause of infection because no other exposuresor risk factors were identified. The positive serologic test forF. tularensis in a pet cat at the store suggested that other ani-mals in the store might have been exposed to F. tularensis. Inaddition, the proximity of the onset of the patient’s illness tothe timing of the hamster bite, reports of illness among ham-sters, and the deaths of hamsters at the pet store indicated aninfected hamster as the likely source of illness. A possible sce-nario, similar to an outbreak of tularemia that involved zooprimates (1), is that infected wild rodents infested the storeand spread the infection to hamsters by urinating and def-ecating through metal screens covering hamster cages. Theinfected cat might have had a subclinical or unrecognizedillness after catching or eating an infected wild rodent.
The storeowner was advised to set traps for wild rodentsand to inform the state health department of any recurrentanimal deaths or reports of ill customers or staff. No othercases have been identified.
Although tularemia has been associated with hamster hunt-ing in Russia (2), it has not been associated previously withpet hamsters in the United States. However, clinicians andpublic health officials should be aware that pet hamsters mightbe a potential source of tularemia. Moreover, becauseF. tularensis is a potential agent of biologic terrorism (3), clini-cians should have a heightened awareness of tularemia.Reported by: J Pape, K Gershman, MD, Colorado Dept of PublicHealth and Environment. J Petersen, PhD, Div of Vector-Borne InfectiousDiseases, National Center for Infectious Diseases; DD Ferguson, MD,JE Staples, MD, EIS officers, CDC.

Vol. 53 / Nos. 51 & 52 MMWR 1203
AcknowledgmentsThis report is based, in part, on contributions by S Dolan,
Children’s Hospital, Denver; S Leach, Colorado Dept of Agricul-ture; staff of the Colorado Dept of Public Health and Environmentlaboratory.
References1. Calle PP, Bowerman DL, Pape WJ. Nonhuman primate tularemia
(Francisella tularensis) epizootic in a zoological park. J Zoo Wildlife Med1993;24:459–68.
2. Munnich D, Lakatos M. Clinical, epidemiological, and therapeuticalexperience with human tularemia. Infection 1979;7:61–3.
3. Dennis DT, Inglesby TV, Henderson DA, et al. Tularemia as a biologi-cal weapon: medical and public health management. JAMA2001;285:2763–73.
Notice to Readers
National Birth Defects Prevention Monthand National Folic Acid Awareness WeekJanuary is National Birth Defects Prevention Month, and
January 24–30 is National Folic Acid Awareness Week. Birthdefects affect approximately 120,000 (one in 33) newbornsin the United States each year; they are the leading cause ofinfant mortality and contribute substantially to illness andlong-term disability. Lifetime costs for those infants born in asingle year with one or more of the 17 most clinically impor-tant birth defects has been estimated to total $6 billion (1).
Health-care professionals can help prevent birth defects byencouraging women of childbearing age to follow healthypreconceptional and prenatal practices, including takingmultivitamins containing folic acid and avoiding alcoholconsumption. Taking the B vitamin folic acid before and dur-ing early pregnancy can prevent serious birth defects of thespine and brain (i.e., neural tube defects). The rates of suchbirth defects declined 26% after folic acid was first added to
cereal-grain products in 1998. However, approximately 3,000pregnancies each year in the United States continue to be af-fected by these defects (2). Similarly, alcohol consumption inpregnancy is widely known as a cause of fetal alcohol spec-trum disorders, yet some women continue to consume alco-hol during pregnancy (3).
Information on CDC activities regarding birth defects isavailable at http://www.cdc.gov/ncbddd. Information on BirthDefects Prevention Month is available from the March ofDimes (http://www.marchofdimes.com) and the NationalBirth Defects Prevention Network (http://www.nbdpn.org/nbdpn/bdpm2005.html). Information on National Folic AcidAwareness Week is available from the National Council onFolic Acid (http://www.folicacidinfo.org).References1. CDC. Economic costs of birth defects and cerebral palsy—United States,
1992. MMWR 1995;44:694–9.2. CDC. Spina bifida and anencephaly before and after folic acid man-
date—United States, 1995–1996 and 1999–2000. MMWR2004;53:362–5.
3. CDC. Alcohol consumption among women who are pregnant or whomight become pregnant—United States, 2002. MMWR 2004;53:1178–81.
Errata: Vol. 52, No. RR-11In the MMWR Recommendations and Reports, “Treatment
of Tuberculosis: American Thoracic Society, CDC, and Infec-tious Diseases Society of America,” two errors occurred. InTable 3 (pages 4–5), the subheading of the second columnunder “Doses” should read, “1x/wk.” On page 25, column 2,in section 3.2.1 Cycloserine, the adult dosage should read,“Serum concentration measurements aiming for a peak con-centration of 20–35 mg/l are often useful in determining theoptimum dose for a given patient.”
enr0
Highlight
enr0
Highlight
enr0
Highlight
enr0
Highlight

1204 MMWR January 7, 2005
* No rubella cases were reported for the current 4-week period yielding a ratio for week 51 of zero (0).† Ratio of current 4-week total to mean of 15 4-week totals (from previous, comparable, and subsequent 4-week periods for the past 5 years). The point where the hatched area
begins is based on the mean and two standard deviations of these 4-week totals.
-: No reported cases.* Incidence data for reporting years 2003 and 2004 are provisional and cumulative (year-to-date).†
Not notifiable in all states.§
Updated weekly from reports to the Division of Vector-Borne Infectious Diseases, National Center for Infectious Diseases (ArboNet Surveillance).¶
Updated monthly from reports to the Division of HIV/AIDS Prevention — Surveillance and Epidemiology, National Center for HIV, STD, and TB Prevention.Last update November 28, 2004.
** Updated weekly from reports to the Division of Viral and Rickettsial Diseases, National Center for Infectious Diseases.††
Of 37 cases reported, 14 were indigenous, and 23 were imported from another country.§§
Of 54 cases reported, 31 were indigenous, and 23 were imported from another country.¶¶
Not previously notifiable.
TABLE I. Summary of provisional cases of selected notifiable diseases, United States, cumulative, week ending December 25, 2004 (51st Week)*
Cum. Cum. Cum. Cum.2004 2003 2004 2003
FIGURE I. Selected notifiable disease reports, United States, comparison of provisional 4-week totals December 25, 2004, withhistorical data
DISEASE DECREASE INCREASECASES CURRENT
4 WEEKS
Ratio (Log scale)†
Beyond historical limits
4210.50.250.125
165
306
30
87
2
40
14
1,155
0
Hepatitis A, acute
Hepatitis B, acute
Hepatitis C, acute
Legionellosis
Measles, total
Mumps
Pertussis
Rubella
Meningococcal disease
0.06250.03125
*
Anthrax - - HIV infection, pediatric†¶ 149 197Botulism: - - Influenza-associated pediatric mortality** - NA
foodborne 23 19 Measles, total 37†† 54§§
infant 76 75 Mumps 231 217other (wound & unspecified) 17 30 Plague 2 1
Brucellosis† 117 96 Poliomyelitis, paralytic - -Chancroid 42 54 Psittacosis† 10 12Cholera 4 1 Q fever† 71 65Cyclosporiasis† 212 73 Rabies, human 7 2Diphtheria - 1 Rubella 12 7Ehrlichiosis: - - Rubella, congenital syndrome - 1
human granulocytic (HGE)† 394 327 SARS-associated coronavirus disease† ** - 8human monocytic (HME)† 321 272 Smallpox† ¶¶ - NAhuman, other and unspecified 34 47 Staphylococcus aureus: - -
Encephalitis/Meningitis: - - Vancomycin-intermediate (VISA)† ¶¶ - NACalifornia serogroup viral† § 91 108 Vancomycin-resistant (VRSA)† ¶¶ 1 NAeastern equine† § 6 14 Streptococcal toxic-shock syndrome† 99 152Powassan† § - - Tetanus 24 19St. Louis† § 8 41 Toxic-shock syndrome 119 117western equine† § - - Trichinosis 7 6
Hansen disease (leprosy)† 81 85 Tularemia† 106 83Hantavirus pulmonary syndrome† 20 24 Yellow fever - -Hemolytic uremic syndrome, postdiarrheal† 144 166

Vol. 53 / Nos. 51 & 52 MMWR 1205
N: Not notifiable. U: Unavailable. -: No reported cases. C.N.M.I.: Commonwealth of Northern Mariana Islands.* Incidence data for reporting years 2003 and 2004 are provisional and cumulative (year-to-date).† Chlamydia refers to genital infections caused by C. trachomatis.§ Updated weekly from reports to the Division of Vector-Borne Infectious Diseases, National Center for Infectious Diseases (ArboNet Surveillance).¶ Updated monthly from reports to the Division of HIV/AIDS Prevention — Surveillance and Epidemiology, National Center for HIV, STD, and TB Prevention. Last update
November 28, 2004.** Contains data reported through National Electronic Disease Surveillance System (NEDSS).
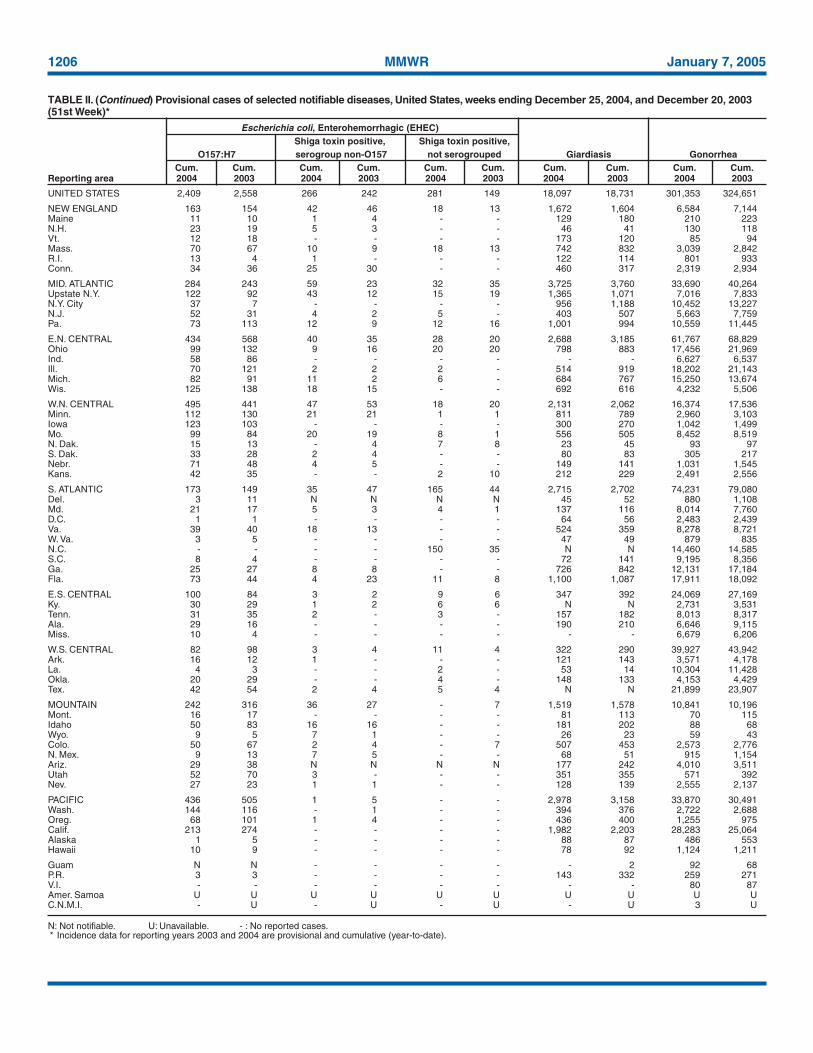
TABLE II. Provisional cases of selected notifiable diseases, United States, weeks ending December 25, 2004, and December 20, 2003(51st Week)*
Encephalitis/MeningitisAIDS Chlamydia† Coccidioidomycosis Cryptosporidiosis West Nile§
Cum. Cum. Cum. Cum. Cum. Cum. Cum. Cum. Cum. Cum.Reporting area 2004¶ 2003 2004 2003 2004 2003 2004 2003 2004 2003
UNITED STATES 39,097 42,812 850,325 848,663 5,888 4,079 3,305 3,354 888 2,866
NEW ENGLAND 1,318 1,546 28,838 27,316 - - 166 189 - 31Maine 48 52 2,075 1,983 N N 20 20 - -N.H. 44 38 1,692 1,571 - - 30 25 - 2Vt.** 16 16 1,006 1,035 - - 26 32 - -Mass. 495 709 13,163 10,876 - - 59 78 - 12R.I. 131 101 3,326 2,934 - - 4 16 - 5Conn. 584 630 7,576 8,917 N N 27 18 - 12
MID. ATLANTIC 9,011 9,726 104,919 105,360 - - 525 440 17 223Upstate N.Y. 1,406 978 22,126 19,794 N N 180 131 5 -N.Y. City 4,804 5,211 32,620 34,152 - - 113 125 2 57N.J. 1,360 1,488 14,063 15,685 - - 33 19 1 21Pa. 1,441 2,049 36,110 35,729 N N 199 165 9 145
E.N. CENTRAL 3,311 3,899 145,523 154,220 13 7 943 1,000 64 150Ohio 617 778 33,537 41,409 N N 222 171 11 84Ind. 364 517 17,851 16,678 N N 85 105 8 15Ill. 1,559 1,708 41,145 46,925 - - 93 99 28 30Mich. 614 708 36,564 31,765 13 7 151 146 12 14Wis. 157 188 16,426 17,443 - - 392 479 5 7
W.N. CENTRAL 802 787 51,847 50,344 6 4 416 577 85 696Minn. 206 160 10,048 10,426 N N 135 150 13 48Iowa 65 83 5,900 6,300 N N 89 122 13 81Mo. 338 363 19,633 17,989 3 1 78 50 26 39N. Dak. 18 3 1,434 1,586 N N 12 14 2 94S. Dak. 11 14 2,535 2,540 - - 43 45 6 151Nebr.** 54 49 4,960 4,551 3 3 28 24 7 194Kans. 110 115 7,337 6,952 N N 31 172 18 89
S. ATLANTIC 11,845 11,989 164,300 158,541 - 5 510 390 59 191Del. 143 213 2,918 2,961 N N - 4 - 12Md. 1,363 1,571 19,191 16,328 - 5 24 28 8 49D.C. 911 991 3,334 3,097 - - 13 13 1 3Va. 615 850 20,940 18,761 - - 58 44 4 19W. Va. 86 85 2,727 2,518 N N 6 4 - 1N.C. 1,080 1,042 27,865 25,201 N N 76 51 3 16S.C.** 709 790 18,786 14,308 - - 18 10 - 3Ga. 1,558 1,829 27,506 34,816 - - 177 118 12 27Fla. 5,380 4,618 41,033 40,551 N N 138 118 31 61
E.S. CENTRAL 1,833 1,910 55,898 53,739 4 1 121 128 60 91Ky. 232 222 6,392 7,875 N N 45 24 1 11Tenn.** 722 811 21,346 19,927 N N 29 40 13 21Ala. 442 442 10,688 13,994 - - 24 54 15 25Miss. 437 435 17,472 11,943 4 1 23 10 31 34
W.S. CENTRAL 4,332 4,939 101,412 105,719 2 - 119 124 215 611Ark. 184 188 7,138 7,719 1 - 17 20 12 23La. 865 608 21,371 20,134 1 - 7 5 81 101Okla. 202 203 9,766 10,722 N N 20 20 14 56Tex.** 3,081 3,940 63,137 67,144 N N 75 79 108 431
MOUNTAIN 1,415 1,465 49,632 47,655 3,779 2,377 163 134 234 871Mont. 6 13 2,329 2,363 N N 34 18 2 75Idaho 18 25 2,555 2,366 N N 27 27 - -Wyo. 18 6 1,069 930 2 1 4 5 2 92Colo. 313 352 11,773 12,696 N N 58 37 39 621N. Mex. 178 99 6,128 7,238 21 10 13 14 31 74Ariz. 550 634 16,542 12,669 3,660 2,322 19 6 129 7Utah 72 69 3,663 3,724 37 9 6 19 6 -Nev. 260 267 5,573 5,669 59 35 2 8 25 2
PACIFIC 5,230 6,551 147,956 145,769 2,084 1,685 342 372 154 2Wash. 373 490 17,275 16,292 N N 40 58 - -Oreg. 282 242 8,277 7,375 - - 32 36 - -Calif. 4,383 5,691 114,102 113,071 2,084 1,685 268 277 154 2Alaska 56 19 3,436 3,674 - - - 1 - -Hawaii 136 109 4,866 5,357 - - 2 - - -
Guam 2 5 560 584 - - - - - -P.R. 642 1,024 3,494 2,653 N N N N - -V.I. 18 33 272 406 - - - - - -Amer. Samoa U U U U U U U U U UC.N.M.I. 2 U 32 U - U - U - U
1206 MMWR January 7, 2005
N: Not notifiable. U: Unavailable. - : No reported cases.* Incidence data for reporting years 2003 and 2004 are provisional and cumulative (year-to-date).
TABLE II. (Continued) Provisional cases of selected notifiable diseases, United States, weeks ending December 25, 2004, and December 20, 2003(51st Week)*
Escherichia coli, Enterohemorrhagic (EHEC)Shiga toxin positive, Shiga toxin positive,
O157:H7 serogroup non-O157 not serogrouped Giardiasis GonorrheaCum. Cum. Cum. Cum. Cum. Cum. Cum. Cum. Cum. Cum.
Reporting area 2004 2003 2004 2003 2004 2003 2004 2003 2004 2003
UNITED STATES 2,409 2,558 266 242 281 149 18,097 18,731 301,353 324,651
NEW ENGLAND 163 154 42 46 18 13 1,672 1,604 6,584 7,144Maine 11 10 1 4 - - 129 180 210 223N.H. 23 19 5 3 - - 46 41 130 118Vt. 12 18 - - - - 173 120 85 94Mass. 70 67 10 9 18 13 742 832 3,039 2,842R.I. 13 4 1 - - - 122 114 801 933Conn. 34 36 25 30 - - 460 317 2,319 2,934
MID. ATLANTIC 284 243 59 23 32 35 3,725 3,760 33,690 40,264Upstate N.Y. 122 92 43 12 15 19 1,365 1,071 7,016 7,833N.Y. City 37 7 - - - - 956 1,188 10,452 13,227N.J. 52 31 4 2 5 - 403 507 5,663 7,759Pa. 73 113 12 9 12 16 1,001 994 10,559 11,445
E.N. CENTRAL 434 568 40 35 28 20 2,688 3,185 61,767 68,829Ohio 99 132 9 16 20 20 798 883 17,456 21,969Ind. 58 86 - - - - - - 6,627 6,537Ill. 70 121 2 2 2 - 514 919 18,202 21,143Mich. 82 91 11 2 6 - 684 767 15,250 13,674Wis. 125 138 18 15 - - 692 616 4,232 5,506
W.N. CENTRAL 495 441 47 53 18 20 2,131 2,062 16,374 17,536Minn. 112 130 21 21 1 1 811 789 2,960 3,103Iowa 123 103 - - - - 300 270 1,042 1,499Mo. 99 84 20 19 8 1 556 505 8,452 8,519N. Dak. 15 13 - 4 7 8 23 45 93 97S. Dak. 33 28 2 4 - - 80 83 305 217Nebr. 71 48 4 5 - - 149 141 1,031 1,545Kans. 42 35 - - 2 10 212 229 2,491 2,556
S. ATLANTIC 173 149 35 47 165 44 2,715 2,702 74,231 79,080Del. 3 11 N N N N 45 52 880 1,108Md. 21 17 5 3 4 1 137 116 8,014 7,760D.C. 1 1 - - - - 64 56 2,483 2,439Va. 39 40 18 13 - - 524 359 8,278 8,721W. Va. 3 5 - - - - 47 49 879 835N.C. - - - - 150 35 N N 14,460 14,585S.C. 8 4 - - - - 72 141 9,195 8,356Ga. 25 27 8 8 - - 726 842 12,131 17,184Fla. 73 44 4 23 11 8 1,100 1,087 17,911 18,092
E.S. CENTRAL 100 84 3 2 9 6 347 392 24,069 27,169Ky. 30 29 1 2 6 6 N N 2,731 3,531Tenn. 31 35 2 - 3 - 157 182 8,013 8,317Ala. 29 16 - - - - 190 210 6,646 9,115Miss. 10 4 - - - - - - 6,679 6,206
W.S. CENTRAL 82 98 3 4 11 4 322 290 39,927 43,942Ark. 16 12 1 - - - 121 143 3,571 4,178La. 4 3 - - 2 - 53 14 10,304 11,428Okla. 20 29 - - 4 - 148 133 4,153 4,429Tex. 42 54 2 4 5 4 N N 21,899 23,907
MOUNTAIN 242 316 36 27 - 7 1,519 1,578 10,841 10,196Mont. 16 17 - - - - 81 113 70 115Idaho 50 83 16 16 - - 181 202 88 68Wyo. 9 5 7 1 - - 26 23 59 43Colo. 50 67 2 4 - 7 507 453 2,573 2,776N. Mex. 9 13 7 5 - - 68 51 915 1,154Ariz. 29 38 N N N N 177 242 4,010 3,511Utah 52 70 3 - - - 351 355 571 392Nev. 27 23 1 1 - - 128 139 2,555 2,137
PACIFIC 436 505 1 5 - - 2,978 3,158 33,870 30,491Wash. 144 116 - 1 - - 394 376 2,722 2,688Oreg. 68 101 1 4 - - 436 400 1,255 975Calif. 213 274 - - - - 1,982 2,203 28,283 25,064Alaska 1 5 - - - - 88 87 486 553Hawaii 10 9 - - - - 78 92 1,124 1,211
Guam N N - - - - - 2 92 68P.R. 3 3 - - - - 143 332 259 271V.I. - - - - - - - - 80 87Amer. Samoa U U U U U U U U U UC.N.M.I. - U - U - U - U 3 U

Vol. 53 / Nos. 51 & 52 MMWR 1207
N: Not notifiable. U: Unavailable. -: No reported cases.* Incidence data for reporting years 2003 and 2004 are provisional and cumulative (year-to-date).
TABLE II. (Continued) Provisional cases of selected notifiable diseases, United States, weeks ending December 25, 2004, and December 20, 2003(51st Week)*
Haemophilus influenzae, invasive Hepatitis
All ages Age <5 years (viral, acute), by type
All serotypes Serotype b Non-serotype b Unknown serotype ACum. Cum. Cum. Cum. Cum. Cum. Cum. Cum. Cum. Cum.
Reporting area 2004 2003 2004 2003 2004 2003 2004 2003 2004 2003
UNITED STATES 1,773 1,832 15 25 107 105 156 205 5,538 7,330
NEW ENGLAND 158 146 1 2 6 5 4 5 1,008 347Maine 13 4 - - - - - 1 11 20N.H. 19 13 - 1 2 - 1 - 25 18Vt. 8 10 - - - - 1 - 8 6Mass. 62 73 1 1 - 5 2 3 874 201R.I. 6 9 - - 1 - - 1 23 15Conn. 50 37 - - 3 - - - 67 87
MID. ATLANTIC 389 384 1 3 5 4 38 49 677 1,795Upstate N.Y. 125 134 1 3 5 4 6 9 114 133N.Y. City 78 70 - - - - 14 13 270 446N.J. 73 70 - - - - 4 11 138 208Pa. 113 110 - - - - 14 16 155 1,008
E.N. CENTRAL 291 304 2 3 8 6 37 56 523 667Ohio 107 72 1 - 2 1 16 12 50 166Ind. 53 51 - - 4 - 1 9 95 70Ill. 70 107 - - - - 13 24 184 183Mich. 21 26 1 3 2 5 4 1 142 203Wis. 40 48 - - - - 3 10 52 45
W.N. CENTRAL 106 116 2 2 4 7 12 14 174 179Minn. 45 53 1 2 4 7 1 2 32 44Iowa 1 - 1 - - - - - 54 35Mo. 37 41 - - - - 7 11 44 59N. Dak. 4 4 - - - - - - 1 2S. Dak. - 1 - - - - - - 4 -Nebr. 10 2 - - - - 2 - 12 13Kans. 9 15 - - - - 2 1 27 26
S. ATLANTIC 404 412 1 2 26 19 25 24 986 1,679Del. - - - - - - - - 6 9Md. 68 101 - 1 6 8 - 1 105 177D.C. - 2 - - - - - - 7 43Va. 41 55 - - - - 1 6 135 101W. Va. 17 17 - - 1 - 3 - 6 14N.C. 62 41 1 - 7 3 1 2 103 124S.C. 6 7 - - - - - 2 26 41Ga. 100 77 - - - - 18 8 314 778Fla. 110 112 - 1 12 8 2 5 284 392
E.S. CENTRAL 68 83 1 1 2 3 9 10 144 264Ky. 13 7 - - 2 2 1 1 30 32Tenn. 38 52 - - - 1 6 6 80 192Ala. 14 22 1 1 - - 2 3 10 24Miss. 3 2 - - - - - - 24 16
W.S. CENTRAL 80 79 1 2 9 11 2 5 583 693Ark. 3 6 - - - 1 1 - 57 37La. 15 22 - - - 2 1 4 55 48Okla. 61 47 - - 9 8 - - 20 23Tex. 1 4 1 2 - - - 1 451 585
MOUNTAIN 182 164 4 6 27 23 22 18 451 461Mont. - - - - - - - - 8 8Idaho 5 6 - - - - 2 2 21 18Wyo. 1 2 - - 1 - - - 5 1Colo. 46 36 - - - - 6 6 53 63N. Mex. 37 20 1 - 8 4 6 2 23 24Ariz. 62 78 - 6 13 10 2 4 278 258Utah 18 12 2 - 2 5 5 4 49 38Nev. 13 10 1 - 3 4 1 - 14 51
PACIFIC 95 144 2 4 20 27 7 24 992 1,245Wash. 3 11 2 - - 7 1 3 60 68Oreg. 44 40 - - - - 3 4 67 61Calif. 35 58 - 4 20 20 1 10 833 1,094Alaska 4 21 - - - - 1 7 5 9Hawaii 9 14 - - - - 1 - 27 13
Guam - - - - - - - - 1 2P.R. - 1 - - - - - 1 26 86V.I. - - - - - - - - - -Amer. Samoa U U U U U U U U U UC.N.M.I. - U - U - U - U - U

1208 MMWR January 7, 2005
N: Not notifiable. U: Unavailable. -: No reported cases.* Incidence data for reporting years 2003 and 2004 are provisional and cumulative (year-to-date).
TABLE II. (Continued) Provisional cases of selected notifiable diseases, United States, weeks ending December 25, 2004, and December 20, 2003(51st Week)*
Hepatitis (viral, acute), by typeB C Legionellosis Listeriosis Lyme disease
Cum. Cum. Cum. Cum. Cum. Cum. Cum. Cum. Cum. Cum.Reporting area 2004 2003 2004 2003 2004 2003 2004 2003 2004 2003UNITED STATES 6,528 6,965 846 1,060 1,863 2,082 662 653 18,140 19,842
NEW ENGLAND 363 347 16 13 78 117 48 53 2,795 3,820Maine 4 1 - 2 - 2 7 7 53 166N.H. 41 23 - - 11 9 4 4 207 175Vt. 5 4 8 11 6 6 2 1 51 43Mass. 214 206 6 - 28 55 15 18 1,079 1,521R.I. 6 18 - - 18 17 2 1 234 581Conn. 93 95 2 - 15 28 18 22 1,171 1,334
MID. ATLANTIC 1,234 748 146 127 523 596 156 129 11,734 13,066Upstate N.Y. 91 94 18 17 109 151 50 35 4,098 4,333N.Y. City 126 190 - - 60 70 22 24 - 218N.J. 725 179 - - 94 90 26 23 3,209 2,874Pa. 292 285 128 110 260 285 58 47 4,427 5,641
E.N. CENTRAL 507 537 105 140 478 444 102 87 1,027 908Ohio 119 150 6 9 218 226 40 25 64 66Ind. 42 42 10 9 77 32 17 10 18 23Ill. 71 73 13 24 34 50 14 23 1 71Mich. 243 222 76 93 132 118 25 19 27 11Wis. 32 50 - 5 17 18 6 10 917 737
W.N. CENTRAL 317 338 54 264 62 72 22 19 790 470Minn. 49 37 18 9 7 5 6 6 679 342Iowa 14 14 - 1 6 11 3 1 44 52Mo. 190 234 35 251 34 36 8 6 55 69N. Dak. 4 2 - - 2 1 - - - -S. Dak. - 2 - - 5 2 2 - 1 1Nebr. 42 32 1 3 4 6 3 4 8 2Kans. 18 17 - - 4 11 - 2 3 4
S. ATLANTIC 1,908 1,969 195 151 394 517 117 134 1,523 1,305Del. 42 12 28 - 13 28 N N 301 208Md. 164 130 26 9 80 131 18 27 802 687D.C. 19 12 3 - 11 19 - 2 11 13Va. 278 189 17 11 53 94 19 12 174 160W. Va. 39 38 24 9 9 21 4 7 28 27N.C. 182 160 11 13 40 39 26 18 121 146S.C. 88 156 8 24 7 8 6 5 15 15Ga. 580 660 16 13 36 34 15 31 13 10Fla. 516 612 62 72 145 143 29 32 58 39
E.S. CENTRAL 419 487 91 91 88 101 21 32 48 61Ky. 73 74 23 22 40 43 4 9 15 15Tenn. 174 209 35 21 33 34 10 9 17 17Ala. 66 96 5 6 12 19 5 12 5 8Miss. 106 108 28 42 3 5 2 2 11 21
W.S. CENTRAL 606 1,140 129 153 76 79 34 50 92 92Ark. 77 83 3 3 - 2 2 1 8 -La. 63 114 69 100 6 1 3 5 5 7Okla. 47 57 3 2 8 7 1 3 - -Tex. 419 886 54 48 62 69 28 41 79 85
MOUNTAIN 526 555 36 53 86 75 28 32 32 14Mont. 2 16 2 4 3 4 1 2 - -Idaho 10 8 - 1 9 4 1 2 6 3Wyo. 9 31 2 - 7 2 - - 4 2Colo. 58 77 - 14 21 12 12 9 - -N. Mex. 13 35 7 - 4 4 1 3 1 1Ariz. 305 254 5 7 14 11 - 10 6 3Utah 58 50 5 - 24 27 5 2 14 2Nev. 71 84 15 27 4 11 8 4 1 3
PACIFIC 648 844 74 68 78 81 134 117 99 106Wash. 52 80 22 19 13 10 11 10 13 3Oreg. 110 117 15 15 N N 7 5 33 16Calif. 460 614 30 30 64 70 111 97 51 84Alaska 15 6 - - 1 - - - 2 3Hawaii 11 27 7 4 - 1 5 5 N N
Guam 6 10 - 5 - 1 - - - -P.R. 56 129 - - 2 - - - N NV.I. - - - - - - - - - -Amer. Samoa U U U U U U U U U UC.N.M.I. - U - U - U - U - U

QuickGuide
Weekly January 7, 2005 / Vol. 53 / Nos. 51 & 52
Recommended Childhood and AdolescentImmunization Schedule —
United States, 2005
Harmonized Childhood and AdolescentImmunization Schedule, 2005
The Advisory Committee on Immunization Practices(ACIP) periodically reviews the recommended childhood andadolescent immunization schedule to ensure that the sched-ule is current with changes in vaccine formulations andreflects revised recommendations for the use of licensed vac-cines, including those newly licensed. Recommendations andformat of the childhood and adolescent immunization sched-ule for July–December 2004 were approved by ACIP, theAmerican Academy of Family Physicians (AAFP), and theAmerican Academy of Pediatrics (AAP) and were publishedin April 2004 (1). That schedule updated previous ones byadding the recommendation that, beginning in fall 2004,healthy children aged 6–23 months, as well as household con-tacts and out-of-home caregivers for healthy children aged0–23 months, receive annual influenza vaccine (2).
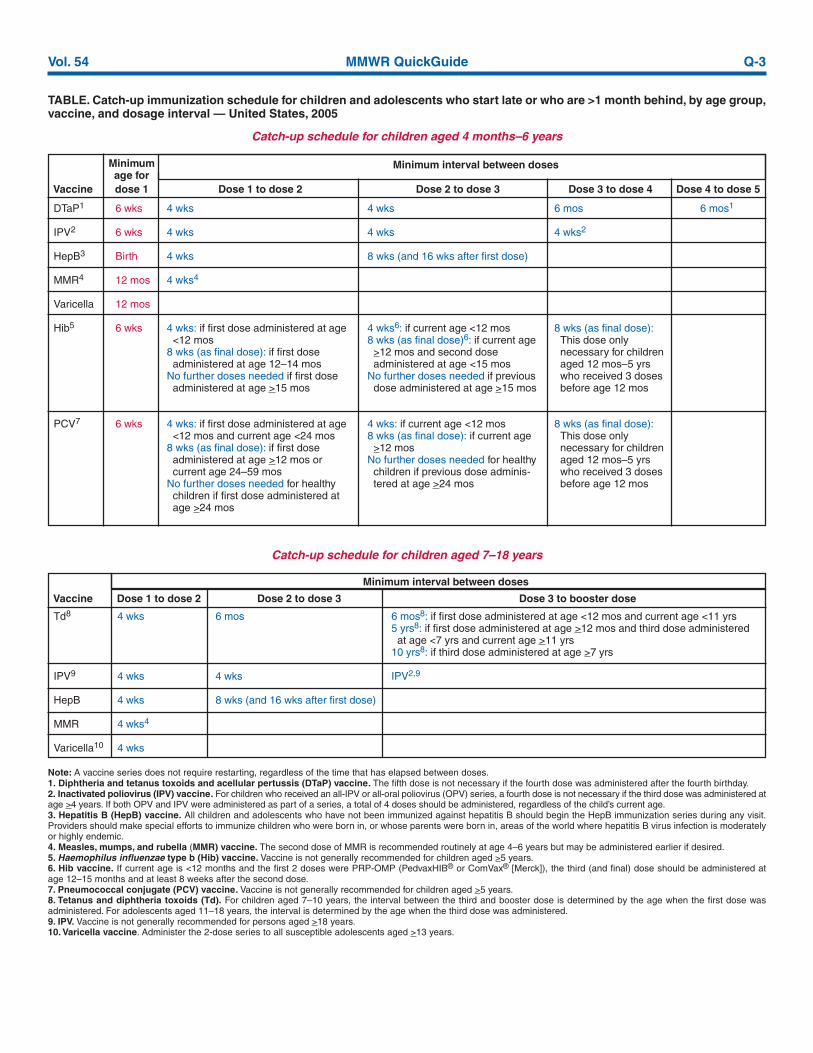
The childhood and adolescent immunization schedule for2005 is unchanged from that published in April 2004 (Figure).In addition, the catch-up immunization schedule for childrenand adolescents who start late or who are >1 month behindremains unchanged from that published in January 2004 andagain in April 2004 (Table). The childhood and adolescentimmunization schedule and the catch-up immunization sched-ule for 2005 have been approved by ACIP, AAFP, and AAP.
Vaccine Information StatementsThe National Childhood Vaccine Injury Act requires that
all health-care providers provide parents or patients with cop-ies of Vaccine Information Statements before administeringeach dose of the vaccines listed in the schedule. Additionalinformation is available from state health departments and athttp://www.cdc.gov/nip/publications/vis.
Detailed recommendations for using vaccines are availablefrom package inserts, ACIP statements on specific vaccines, andthe 2003 Red Book (3). ACIP statements for each recommendedchildhood vaccine can be viewed, downloaded, and printed fromthe CDC National Immunization Program website at http://www.cdc.gov/nip/publications/acip-list.htm. In addition, guid-ance on obtaining and completing a Vaccine Adverse EventReporting System form is available at http://www.vaers.orgor by telephone, 800-822-7967.References1. CDC. Recommended childhood and adolescent immunization sched-
ule—United States, July–December 2004. MMWR 2004;53:Q1–Q3.2. CDC. Prevention and control of influenza: recommendations of the
Advisory Committee on Immunization Practices (ACIP). MMWR2004;53(No. RR-6).
3. American Academy of Pediatrics. Active and passive immunization. In:Pickering LK, ed. 2003 red book: report of the Committee on Infec-tious Diseases. 26th ed. Elk Grove Village, IL: American Academy ofPediatrics; 2003.
The Recommended Childhood and Adolescent Immunization Schedule and the Catch-up Childhood and Immunization Schedule have been adopted by the Advisory Committeeon Immunization Practices, the American Academy of Pediatrics, and the AmericanAcademy of Family Physicians. The standard MMWR footnote format has been modifiedfor publication of this schedule.
Suggested citation: Centers for Disease Control and Prevention. Recommended childhoodand adolescent immunization schedule—United States, 2005. MMWR 2005;53(Nos. 51&52):Q1–Q3.

Q-2 MMWR QuickGuide January 7, 2005
FIGURE. Recommended childhood and adolescent immunization schedule,1 by vaccine and age — United States, 2005
HepB #1Hepatitis B2
Diphtheria,tetanus, pertussis3
Haemophilusinfluenzae type b4
Inactivatedpoliovirus
Measles, mumps,rubella5
Varicella6
Pneumococcal7
Influenza8
Hepatitis A9
Birth1 2 4 6 12 15 18 24 4–6 11–12 13–18
mo mos mos mos mos mos mos mos yrs yrs yrs
DTaPDTaP DTaP DTaP
HibHib Hib
IPVIPV IPV
Hib4
PCV
MMR #1
PCV PCV PCV
DTaP
IPV
MMR #2
Td Td
#2HepB #3 HepB series
MMR #2
Varicella
Influenza (yearly)
Varicella
PPV
Hepatitis A series
PCV
Vaccine
Influenza (yearly)
HepB #2
Vaccines below red line are for selected populations
Range of recommended ages Catch-up immunization Preadolescent assessment
only if mother HBsAg (-)
1. This schedule indicates the recommended ages for routine administration ofcurrently licensed childhood vaccines, as of December 1, 2004, for children aged<18 years. Any dose not administered at the recommended age shouldbe administered at any subsequent visit when indicated and feasible. Indicatesage groups that warrant special effort to administer those vaccines not previouslyadministered. Additional vaccines might be licensed and recommended during theyear. Licensed combination vaccines may be used whenever any components of thecombination are indicated and other components of the vaccine are notcontraindicated. Providers should consult package inserts for detailedrecommendations. Clinically significant adverse events that follow immunization shouldbe reported to the Vaccine Adverse Event Reporting System; guidance is availableat http://www.vaers.org or by telephone, 800-822-7967.2. Hepatitis B (HepB) vaccine. All infants should receive the first dose of HepBvaccine soon after birth and before hospital discharge; the first dose may also beadministered by age 2 months if the mother is hepatitis B surface antigen (HBsAg)negative. Only monovalent HepB may be used for the birth dose. Monovalent orcombination vaccine containing HepB may be used to complete the series. Fourdoses of vaccine may be administered when a birth dose is administered. The seconddose should be administered at least 4 weeks after the first dose, except forcombination vaccines, which cannot be administered before age 6 weeks. The thirddose should be administered at least 16 weeks after the first dose and at least 8weeks after the second dose. The final dose in the vaccination series (third or fourthdose) should not be administered before age 24 weeks. Infants born to HBsAg-positive mothers should receive HepB and 0.5 mL of hepatitis B immune globulin(HBIG) at separate sites within 12 hours of birth. The second dose is recommendedat age 1–2 months. The final dose in the immunization series should not beadministered before age 24 weeks. These infants should be tested for HBsAg andantibody to HBsAg at age 9–15 months. Infants born to mothers whose HBsAgstatus is unknown should receive the first dose of the HepB series within 12 hoursof birth. Maternal blood should be drawn as soon as possible to determine the mother’sHBsAg status; if the HBsAg test is positive, the infant should receive HBIG as soonas possible (no later than age 1 week). The second dose is recommended at age 1–2 months. The last dose in the immunization series should not be administered beforeage 24 weeks.3. Diphtheria and tetanus toxoids and acellular pertussis (DTaP) vaccine. Thefourth dose of DTaP may be administered as early as age 12 months, provided 6months have elapsed since the third dose and the child is unlikely to return at age15–18 months. The final dose in the series should be administered at age >4 years.Tetanus and diphtheria toxoids (Td) is recommended at age 11–12 years if at least5 years have elapsed since the last dose of tetanus and diphtheria toxoid-containingvaccine. Subsequent routine Td boosters are recommended every 10 years.
4. Haemophilus influenzae type b (Hib) conjugate vaccine. Three Hib conjugatevaccines are licensed for infant use. If PRP-OMP (PedvaxHIB®
or ComVax® [Merck])
is administered at ages 2 and 4 months, a dose at age 6 months is not required.DTaP/Hib combination products should not be used for primary immunization in infantsat ages 2, 4, or 6 months but can be used as boosters after any Hib vaccine. The finaldose in the series should be administered at age >12 months.5. Measles, mumps, and rubella (MMR) vaccine. The second dose of MMR isrecommended routinely at age 4–6 years but may be administered during any visit,provided at least 4 weeks have elapsed since the first dose and both doses areadministered beginning at or after age 12 months. Those who have not previouslyreceived the second dose should complete the schedule by age 11–12 years.6. Varicella vaccine. Varicella vaccine is recommended at any visit at or after age 12months for susceptible children (i.e., those who lack a reliable history of chickenpox).Susceptible persons aged >13 years should receive 2 doses administered at least 4weeks apart.7. Pneumococcal vaccine. The heptavalent pneumococcal conjugate vaccine(PCV) is recommended for all children aged 2–23 months and for certain childrenaged 24–59 months. The final dose in the series should be administered at age >12months. Pneumococcal polysaccharide vaccine (PPV) is recommended in additionto PCV for certain groups at high risk. See MMWR 2000;49(No. RR-9).8. Influenza vaccine. Influenza vaccine is recommended annually for children aged>6 months with certain risk factors (including, but not limited to, asthma, cardiacdisease, sickle cell disease, human immunodeficiency virus [HIV], and diabetes),health-care workers, and other persons (including household members) in closecontact with persons in groups at high risk (see MMWR 2004;53[No. RR-6]). In addition,healthy children aged 6–23 months and close contacts of healthy children aged 0–23months are recommended to receive influenza vaccine because children in this agegroup are at substantially increased risk for influenza-related hospitalizations. Forhealthy persons aged 5–49 years, the intranasally administered, live, attenuatedinfluenza vaccine (LAIV) is an acceptable alternative to the intramuscular trivalentinactivated influenza vaccine (TIV). See MMWR 2004;53(No. RR-6). Children receivingTIV should be administered a dosage appropriate for their age (0.25 mL if aged 6–35months or 0.5 mL if aged >3 years). Children aged <8 years who are receiving influenzavaccine for the first time should receive 2 doses (separated by at least 4 weeks forTIV and at least 6 weeks for LAIV).9. Hepatitis A vaccine. Hepatitis A vaccine is recommended for children andadolescents in selected states and regions and for certain groups at high risk; consultyour local public health authority. Children and adolescents in these states, regions,and groups who have not been immunized against hepatitis A can begin the hepatitisA immunization series during any visit. The 2 doses in the series should beadministered at least 6 months apart. See MMWR 1999;48(No. RR-12).
Approved by the Advisory Committee on Immunization Practices (http://www.cdc.gov/nip/acip), the American Academy of Pediatrics (http://www.aap.org), and theAmerican Academy of Family Physicians (http://www.aafp.org). Additional information about vaccines, including precautions and contraindications for vaccination andvaccine shortages, is available at http://www.cdc.gov/nip or from the National Immunization Information Hotline, 800-232-2522 (English) or 800-232-0233 (Spanish).
Vol. 54 MMWR QuickGuide Q-3
TABLE. Catch-up immunization schedule for children and adolescents who start late or who are >1 month behind, by age group,vaccine, and dosage interval — United States, 2005
Catch-up schedule for children aged 4 months–6 years
Minimumage for
Minimum interval between doses
Vaccine dose 1 Dose 1 to dose 2 Dose 2 to dose 3 Dose 3 to dose 4 Dose 4 to dose 5
DTaP1
IPV2
HepB3
MMR4
Varicella
Hib5
PCV7
6 wks
6 wks
Birth
12 mos
12 mos
6 wks
6 wks
4 wks
4 wks
4 wks
4 wks4
4 wks: if first dose administered at age<12 mos
8 wks (as final dose): if first doseadministered at age 12–14 mos
No further doses needed if first doseadministered at age >15 mos
4 wks: if first dose administered at age<12 mos and current age <24 mos
8 wks (as final dose): if first doseadministered at age >12 mos orcurrent age 24–59 mos
No further doses needed for healthychildren if first dose administered atage >24 mos
4 wks
4 wks
8 wks (and 16 wks after first dose)
4 wks6: if current age <12 mos8 wks (as final dose)6: if current age
>12 mos and second doseadministered at age <15 mos
No further doses needed if previousdose administered at age >15 mos
4 wks: if current age <12 mos8 wks (as final dose): if current age
>12 mosNo further doses needed for healthy
children if previous dose adminis-tered at age >24 mos
6 mos
4 wks2
8 wks (as final dose):This dose onlynecessary for childrenaged 12 mos–5 yrswho received 3 dosesbefore age 12 mos
8 wks (as final dose):This dose onlynecessary for childrenaged 12 mos–5 yrswho received 3 dosesbefore age 12 mos
6 mos1
Catch-up schedule for children aged 7–18 years
Td8
IPV9
HepB
MMR
Varicella10
4 wks
4 wks
4 wks
4 wks4
4 wks
6 mos
4 wks
8 wks (and 16 wks after first dose)
6 mos8: if first dose administered at age <12 mos and current age <11 yrs5 yrs8: if first dose administered at age >12 mos and third dose administeredat age <7 yrs and current age >11 yrs
10 yrs8: if third dose administered at age >7 yrs
IPV2,9
Minimum interval between doses
Vaccine Dose 1 to dose 2 Dose 2 to dose 3 Dose 3 to booster dose
Note: A vaccine series does not require restarting, regardless of the time that has elapsed between doses.1. Diphtheria and tetanus toxoids and acellular pertussis (DTaP) vaccine. The fifth dose is not necessary if the fourth dose was administered after the fourth birthday.2. Inactivated poliovirus (IPV) vaccine. For children who received an all-IPV or all-oral poliovirus (OPV) series, a fourth dose is not necessary if the third dose was administered atage >4 years. If both OPV and IPV were administered as part of a series, a total of 4 doses should be administered, regardless of the child’s current age.3. Hepatitis B (HepB) vaccine. All children and adolescents who have not been immunized against hepatitis B should begin the HepB immunization series during any visit.Providers should make special efforts to immunize children who were born in, or whose parents were born in, areas of the world where hepatitis B virus infection is moderatelyor highly endemic.4. Measles, mumps, and rubella (MMR) vaccine. The second dose of MMR is recommended routinely at age 4–6 years but may be administered earlier if desired.5. Haemophilus influenzae type b (Hib) vaccine. Vaccine is not generally recommended for children aged >5 years.6. Hib vaccine. If current age is <12 months and the first 2 doses were PRP-OMP (PedvaxHIB® or ComVax® [Merck]), the third (and final) dose should be administered atage 12–15 months and at least 8 weeks after the second dose.7. Pneumococcal conjugate (PCV) vaccine. Vaccine is not generally recommended for children aged >5 years.8. Tetanus and diphtheria toxoids (Td). For children aged 7–10 years, the interval between the third and booster dose is determined by the age when the first dose wasadministered. For adolescents aged 11–18 years, the interval is determined by the age when the third dose was administered.9. IPV. Vaccine is not generally recommended for persons aged >18 years.10. Varicella vaccine. Administer the 2-dose series to all susceptible adolescents aged >13 years.


Vol. 53 / Nos. 51 & 52 MMWR 1209
N: Not notifiable. U: Unavailable. - : No reported cases.* Incidence data for reporting years 2003 and 2004 are provisional and cumulative (year-to-date).
TABLE II. (Continued) Provisional cases of selected notifiable diseases, United States, weeks ending December 25, 2004, and December 20, 2003(51st Week)*
Meningococcal Rocky MountainMalaria disease Pertussis Rabies, animal spotted fever
Cum. Cum. Cum. Cum. Cum. Cum. Cum. Cum. Cum. Cum.Reporting area 2004 2003 2004 2003 2004 2003 2004 2003 2004 2003
UNITED STATES 1,284 1,309 1,224 1,620 18,245 10,098 5,790 6,630 1,497 959
NEW ENGLAND 84 65 68 73 1,848 1,856 682 587 27 9Maine 6 3 11 6 34 12 54 70 - -N.H. 5 6 7 5 96 98 30 29 - -Vt. 4 2 3 3 122 70 37 38 1 -Mass. 47 32 35 44 1,537 1,580 308 207 21 9R.I. 7 3 2 2 47 20 38 67 3 -Conn. 15 19 10 13 12 76 215 176 2 -
MID. ATLANTIC 337 352 154 200 2,822 1,421 927 897 100 40Upstate N.Y. 54 55 39 53 1,859 769 509 419 5 -N.Y. City 179 192 25 41 161 145 13 6 24 13N.J. 58 61 34 29 244 183 - 62 33 16Pa. 46 44 56 77 558 324 405 410 38 11
E.N. CENTRAL 107 107 178 249 5,618 1,317 161 170 24 22Ohio 30 23 70 57 693 314 76 53 12 10Ind. 18 4 30 44 293 69 10 30 6 1Ill. 24 45 18 72 497 134 51 24 2 5Mich. 21 24 45 46 280 134 15 49 4 6Wis. 14 11 15 30 3,855 666 9 14 - -
W.N. CENTRAL 66 52 83 124 2,399 522 553 630 134 65Minn. 25 23 23 26 480 146 89 41 4 2Iowa 4 6 18 26 274 155 104 103 1 2Mo. 20 7 20 49 525 150 59 43 106 51N. Dak. 3 1 2 1 745 7 62 56 - -S. Dak. 1 3 2 1 73 5 90 131 4 5Nebr. 4 - 4 7 72 15 53 98 19 4Kans. 9 12 14 14 230 44 96 158 - 1
S. ATLANTIC 330 318 211 264 711 691 1,892 2,600 766 585Del. 6 2 3 9 5 9 9 63 6 1Md. 76 74 10 27 137 88 323 347 79 105D.C. 13 15 4 5 9 3 - - - 1Va. 53 40 20 25 233 91 464 513 38 31W. Va. 2 4 6 6 24 26 69 81 5 5N.C. 22 25 35 36 101 137 577 765 522 321S.C. 9 4 12 22 50 194 151 245 23 43Ga. 54 65 16 33 22 35 298 398 67 64Fla. 95 89 105 101 130 108 1 188 26 14
E.S. CENTRAL 28 30 61 92 278 156 136 206 174 126Ky. 4 9 12 19 83 47 23 37 2 3Tenn. 7 7 15 30 135 75 36 101 88 69Ala. 12 7 17 20 43 19 66 64 48 21Miss. 5 7 17 23 17 15 11 4 36 33
W.S. CENTRAL 108 132 120 182 944 742 1,048 1,135 239 101Ark. 8 4 18 18 78 45 49 25 154 44La. 5 5 36 42 12 11 - 5 5 1Okla. 7 4 10 21 33 92 103 196 71 42Tex. 88 119 56 101 821 594 896 909 9 14
MOUNTAIN 51 45 63 97 1,834 987 215 176 28 10Mont. 1 - 3 6 74 5 26 21 3 1Idaho 1 1 7 9 37 75 8 15 4 2Wyo. 1 2 3 2 35 130 6 6 5 2Colo. 16 23 15 27 1,024 362 43 38 1 3N. Mex. 4 3 9 12 145 74 5 5 2 1Ariz. 13 8 12 29 233 182 114 72 4 -Utah 9 6 7 4 238 124 10 14 9 1Nev. 6 2 7 8 48 35 3 5 - -
PACIFIC 173 208 286 339 1,791 2,406 176 229 5 1Wash. 20 30 32 41 752 748 - - - -Oreg. 18 11 56 61 504 438 6 7 3 -Calif. 130 160 187 217 498 1,142 162 213 2 1Alaska 2 1 3 7 12 66 8 9 - -Hawaii 3 6 8 13 25 12 - - - -
Guam - 1 1 - - 1 - - - -P.R. - 2 11 12 7 4 60 67 N NV.I. - - - - - - - - - -Amer. Samoa U U U U U U U U U UC.N.M.I. - U - U - U - U - U

1210 MMWR January 7, 2005
N: Not notifiable. U: Unavailable. - : No reported cases.* Incidence data for reporting years 2003 and 2004 are provisional and cumulative (year-to-date).
TABLE II. (Continued) Provisional cases of selected notifiable diseases, United States, weeks ending December 25, 2004, and December 20, 2003(51st Week)*
Streptococcus pneumoniae, invasiveStreptococcal disease, Drug resistant,
Salmonellosis Shigellosis invasive, group A all ages Age <5 yearsCum. Cum. Cum. Cum. Cum. Cum. Cum. Cum. Cum. Cum.
Reporting area 2004 2003 2004 2003 2004 2003 2004 2003 2004 2003
UNITED STATES 39,598 42,008 12,454 22,568 4,377 5,493 2,067 1,988 719 740
NEW ENGLAND 1,994 2,070 282 340 178 450 73 104 73 9Maine 90 138 9 7 11 29 2 - 3 -N.H. 135 140 10 9 19 33 - - N NVt. 63 73 4 8 9 19 14 9 3 5Mass. 1,132 1,206 171 230 118 198 38 N 57 NR.I. 136 125 20 20 21 16 19 10 10 4Conn. 438 388 68 66 - 155 - 85 U U
MID. ATLANTIC 5,337 4,816 1,113 2,328 692 924 138 134 123 108Upstate N.Y. 1,218 1,145 404 583 227 343 58 72 87 76N.Y. City 1,183 1,294 380 413 103 144 U U U UN.J. 948 850 228 356 147 173 - - 7 4Pa. 1,988 1,527 101 976 215 264 80 62 29 28
E.N. CENTRAL 4,737 5,473 1,105 1,834 818 1,252 488 440 176 318Ohio 1,197 1,305 171 298 220 283 342 285 81 98Ind. 615 542 216 177 94 119 146 155 43 30Ill. 1,315 1,918 321 993 166 333 - - 13 130Mich. 792 785 224 233 282 350 N N N NWis. 818 923 173 133 56 167 N N 39 60
W.N. CENTRAL 2,430 2,420 449 777 288 331 24 20 105 78Minn. 632 554 66 102 139 159 - - 70 55Iowa 425 388 66 86 N N N N N NMo. 624 868 179 354 58 77 19 16 14 3N. Dak. 42 39 3 10 15 17 - 3 4 7S. Dak. 137 119 13 17 21 22 5 1 - -Nebr. 178 164 40 87 14 27 - - 7 5Kans. 392 288 82 121 41 29 N N 10 8
S. ATLANTIC 10,910 10,882 2,709 6,658 840 907 997 1,051 62 18Del. 101 100 9 164 3 7 4 1 N NMd. 804 838 149 576 180 223 - 26 46 -D.C. 62 51 40 73 10 10 8 1 3 7Va. 1,147 1,072 165 425 70 99 N N N NW. Va. 225 124 9 - 25 36 106 80 13 11N.C. 1,648 1,392 473 985 125 103 N N U US.C. 914 811 314 516 38 39 71 142 N NGa. 1,840 2,027 612 1,150 169 182 245 236 N NFla. 4,169 4,467 938 2,769 220 208 563 565 N N
E.S. CENTRAL 2,451 2,894 768 1,027 190 201 124 146 6 -Ky. 345 395 74 129 58 48 30 23 N NTenn. 523 743 327 393 132 153 93 123 N NAla. 739 766 319 334 - - - - N NMiss. 844 990 48 171 - - 1 - 6 -
W.S. CENTRAL 3,995 5,944 3,286 5,728 286 296 70 78 130 138Ark. 571 796 78 103 17 6 10 22 8 8La. 815 870 277 441 3 2 60 56 26 29Okla. 396 463 490 836 63 90 N N 46 65Tex. 2,213 3,815 2,441 4,348 203 198 N N 50 36
MOUNTAIN 2,348 2,228 836 1,261 517 509 50 11 42 71Mont. 184 111 4 2 - 1 - - - -Idaho 145 172 13 35 9 19 N N N NWyo. 53 76 6 8 10 2 12 10 - -Colo. 532 490 157 327 136 139 - - 39 53N. Mex. 267 289 122 270 82 119 5 - - 12Ariz. 749 692 420 504 232 193 N N N NUtah 238 223 49 49 44 34 31 1 3 6Nev. 180 175 65 66 4 2 2 - - -
PACIFIC 5,396 5,281 1,906 2,615 568 623 103 4 2 -Wash. 569 583 111 166 59 74 - - N NOreg. 399 423 80 209 N N N N N NCalif. 3,998 3,958 1,664 2,183 375 415 N N N NAlaska 60 94 6 11 - - - - N NHawaii 370 223 45 46 134 134 103 4 2 -
Guam 26 43 33 41 - - - - - -P.R. 308 726 11 27 N N N N N NV.I. - - - - - - - - - -Amer. Samoa U U U U U U U U U UC.N.M.I. 3 U - U - U - U - U

Vol. 53 / Nos. 51 & 52 MMWR 1211
N: Not notifiable. U: Unavailable. - : No reported cases.* Incidence data for reporting years 2003 and 2004 are provisional and cumulative (year-to-date).
TABLE II. (Continued) Provisional cases of selected notifiable diseases, United States, weeks ending December 25, 2004, and December 20, 2003(51st Week)*
Syphilis VaricellaPrimary & secondary Congenital Tuberculosis Typhoid fever (Chickenpox)Cum. Cum. Cum. Cum. Cum. Cum. Cum. Cum. Cum. Cum.
Reporting area 2004 2003 2004 2003 2004 2003 2004 2003 2004 2003UNITED STATES 7,235 6,896 306 425 10,984 12,072 278 347 18,422 17,294
NEW ENGLAND 175 211 5 1 378 410 21 28 722 3,386Maine 2 8 - - - 21 - - 311 781N.H. 4 19 3 - 18 13 - 4 - -Vt. 1 1 - - 4 9 - - 411 907Mass. 112 130 - - 251 217 14 15 - 147R.I. 22 25 1 - 30 45 1 2 - 5Conn. 34 28 1 1 75 105 6 7 - 1,546
MID. ATLANTIC 968 876 39 66 1,972 2,138 61 79 87 42Upstate N.Y. 96 44 4 13 276 285 8 12 - -N.Y. City 603 509 15 31 950 1,078 22 36 - -N.J. 145 168 19 22 413 444 16 21 - -Pa. 124 155 1 - 333 331 15 10 87 42
E.N. CENTRAL 850 876 60 75 1,174 1,184 17 33 6,514 6,242Ohio 226 193 1 3 194 201 5 2 1,521 1,241Ind. 55 50 9 16 125 133 - 4 139 -Ill. 362 370 18 21 534 569 - 17 2 -Mich. 175 247 32 34 234 217 9 10 4,224 4,026Wis. 32 16 - 1 87 64 3 - 628 975
W.N. CENTRAL 139 147 5 6 444 460 12 6 130 81Minn. 20 44 1 - 181 194 8 2 - -Iowa 5 12 - - 42 32 - 2 N NMo. 85 58 2 4 114 110 2 1 5 1N. Dak. - 2 - - 4 4 - - 82 80S. Dak. - 2 - - 8 20 - - 43 -Nebr. 6 6 - 1 36 27 2 1 - -Kans. 23 23 2 1 59 73 - - - -
S. ATLANTIC 1,902 1,810 52 81 2,498 2,493 44 55 2,228 2,193Del. 9 6 1 - 17 23 - - 5 29Md. 355 306 9 12 250 246 11 11 - 1D.C. 93 48 1 - 71 - - - 26 31Va. 102 79 3 1 277 272 10 14 612 523W. Va. 2 2 - - 24 21 - - 1,276 1,325N.C. 186 148 12 19 334 362 8 9 N NS.C. 113 94 8 14 167 168 - - 309 284Ga. 341 494 2 13 402 513 5 6 - -Fla. 701 633 16 22 956 888 10 15 - -
E.S. CENTRAL 376 315 19 12 538 688 7 8 - -Ky. 47 33 1 1 122 124 3 1 - -Tenn. 123 134 8 2 230 218 4 3 - -Ala. 156 112 8 7 153 236 - 4 - -Miss. 50 36 2 2 33 110 - - - -
W.S. CENTRAL 1,144 920 50 80 1,042 1,801 27 30 6,167 4,634Ark. 39 50 - 3 111 105 - - - -La. 267 172 - 1 - - - - 51 16Okla. 24 63 2 1 146 153 1 1 - -Tex. 814 635 48 75 785 1,543 26 29 6,116 4,618
MOUNTAIN 333 332 45 35 509 445 8 8 2,574 716Mont. 3 - - - 14 5 - - - -Idaho 22 15 2 3 4 8 - 1 - -Wyo. 3 - - - 5 4 - - 56 110Colo. 40 37 1 3 112 106 3 4 1,947 -N. Mex. 63 70 1 10 35 48 - 1 103 4Ariz. 156 185 41 19 222 213 2 2 - -Utah 8 13 - - 37 39 1 - 468 602Nev. 38 12 - - 80 22 2 - - -
PACIFIC 1,348 1,409 31 69 2,429 2,453 81 100 - -Wash. 144 77 - - 230 241 6 4 - -Oreg. 27 45 - - 74 103 2 4 - -Calif. 1,165 1,272 30 67 1,979 1,943 67 91 - -Alaska 5 1 - - 35 55 - - - -Hawaii 7 14 1 2 111 111 6 1 - -
Guam - 1 - - 15 53 - - 112 153P.R. 165 203 5 14 84 100 - - 276 597V.I. 4 1 - - - - - - - -Amer. Samoa U U U U U U U U U UC.N.M.I. 2 U - U 10 U - U - U

1212 MMWR January 7, 2005
U: Unavailable. -:No reported cases.* Mortality data in this table are voluntarily reported from 122 cities in the United States, most of which have populations of >100,000. A death is reported by the place of its
occurrence and by the week that the death certificate was filed. Fetal deaths are not included.† Pneumonia and influenza.§ Because of changes in reporting methods in this Pennsylvania city, these numbers are partial counts for the current week. Complete counts will be available in 4 to 6 weeks.¶ Total includes unknown ages.
TABLE III. Deaths in 122 U.S. cities,* week ending December 25, 2004 (51st Week)All causes, by age (years) All causes, by age (years)
All P&I† All P&I†
Reporting Area Ages >65 45–64 25–44 1–24 <1 Total Reporting Area Ages >65 45–64 25–44 1–24 <1 Total
NEW ENGLAND 436 318 89 18 8 3 39Boston, Mass. 108 74 25 4 3 2 7Bridgeport, Conn. 40 32 6 1 1 - 2Cambridge, Mass. 21 18 2 1 - - 4Fall River, Mass. 27 20 4 1 2 - 1Hartford, Conn. U U U U U U ULowell, Mass. 25 21 4 - - - 6Lynn, Mass. 7 5 2 - - - -New Bedford, Mass. 23 19 1 3 - - 1New Haven, Conn. 19 13 6 - - - 2Providence, R.I. 47 30 13 2 1 1 6Somerville, Mass. 5 1 4 - - - -Springfield, Mass. 18 14 3 1 - - -Waterbury, Conn. 35 24 8 3 - - 5Worcester, Mass. 61 47 11 2 1 - 5
MID. ATLANTIC 1,897 1,408 339 114 15 18 132Albany, N.Y. 45 33 10 1 1 - 6Allentown, Pa. 23 21 - 2 - - 1Buffalo, N.Y. 86 69 11 3 1 2 8Camden, N.J. U U U U U U UElizabeth, N.J. 16 11 4 1 - - 1Erie, Pa. 50 38 10 2 - - 2Jersey City, N.J. 30 15 11 4 - - -New York City, N.Y. 964 706 181 60 8 9 69Newark, N.J. 53 24 15 7 2 2 4Paterson, N.J. 4 2 1 1 - - -Philadelphia, Pa. 224 164 42 17 - 1 11Pittsburgh, Pa.§ 19 14 4 - - 1 1Reading, Pa. 32 26 5 1 - - 2Rochester, N.Y. 160 129 22 5 2 2 15Schenectady, N.Y. 28 24 2 2 - - 1Scranton, Pa. 38 33 4 1 - - 1Syracuse, N.Y. 76 61 11 3 - 1 6Trenton, N.J. 13 9 2 2 - - -Utica, N.Y. 14 12 2 - - - 3Yonkers, N.Y. 22 17 2 2 1 - 1
E.N. CENTRAL 1,666 1,078 360 95 33 41 121Akron, Ohio 48 36 7 - - 5 5Canton, Ohio 29 20 7 2 - - 7Chicago, Ill. 342 165 74 23 6 16 12Cincinnati, Ohio 54 37 11 4 - 1 4Cleveland, Ohio 184 130 45 6 2 1 17Columbus, Ohio 98 68 17 6 3 4 13Dayton, Ohio 69 49 15 3 1 1 6Detroit, Mich. 162 82 51 16 9 4 12Evansville, Ind. U U U U U U UFort Wayne, Ind. 61 39 14 5 1 2 4Gary, Ind. 13 8 3 1 1 - -Grand Rapids, Mich. 44 34 7 1 2 - 4Indianapolis, Ind. 154 103 40 7 2 2 10Lansing, Mich. 46 34 8 3 1 - 4Milwaukee, Wis. 97 77 14 6 - - 6Peoria, Ill. 43 35 5 3 - - 2Rockford, Ill. 59 42 10 4 - 3 4South Bend, Ind. 37 29 6 1 1 - 3Toledo, Ohio 69 53 13 - 1 2 6Youngstown, Ohio 57 37 13 4 3 - 2
W.N. CENTRAL 663 422 145 51 25 18 48Des Moines, Iowa 65 49 12 4 - - 5Duluth, Minn. 23 17 4 1 1 - 2Kansas City, Kans. 22 10 7 3 1 1 3Kansas City, Mo. 83 50 19 4 6 3 4Lincoln, Nebr. 8 8 - - - - -Minneapolis, Minn. 60 38 15 3 1 3 7Omaha, Nebr. 89 65 13 7 1 3 4St. Louis, Mo. 173 90 46 17 13 6 12St. Paul, Minn. 58 40 12 4 1 1 5Wichita, Kans. 82 55 17 8 1 1 6
S. ATLANTIC 598 356 160 45 21 16 37Atlanta, Ga. U U U U U U UBaltimore, Md. 181 97 63 12 6 3 12Charlotte, N.C. 90 51 27 6 3 3 4Jacksonville, Fla. U U U U U U UMiami, Fla. U U U U U U UNorfolk, Va. 40 22 8 5 2 3 5Richmond, Va. 39 27 7 3 1 1 3Savannah, Ga. 20 14 3 1 1 1 4St. Petersburg, Fla. 47 31 11 3 1 1 3Tampa, Fla. 165 102 38 14 7 4 6Washington, D.C. U U U U U U UWilmington, Del. 16 12 3 1 - - -
E.S. CENTRAL 750 496 180 42 16 15 52Birmingham, Ala. 140 93 36 4 3 4 14Chattanooga, Tenn. 61 35 18 3 2 3 2Knoxville, Tenn. 95 60 25 4 4 1 -Lexington, Ky. 25 17 5 3 - - 2Memphis, Tenn. 230 161 45 16 3 5 18Mobile, Ala. 65 43 18 3 1 - 5Montgomery, Ala. 40 28 9 2 - 1 5Nashville, Tenn. 94 59 24 7 3 1 6
W.S. CENTRAL 1,223 779 277 96 37 34 59Austin, Tex. 69 48 13 3 2 3 5Baton Rouge, La. 59 45 11 1 2 - -Corpus Christi, Tex. 77 48 19 8 2 - -Dallas, Tex. 158 86 46 19 6 1 9El Paso, Tex. 92 58 18 11 2 3 4Ft. Worth, Tex. 110 69 26 5 4 6 3Houston, Tex. 276 166 68 23 9 10 14Little Rock, Ark. 18 14 - 2 2 - 1New Orleans, La. 46 31 12 3 - - -San Antonio, Tex. 210 143 44 12 5 6 19Shreveport, La. 51 36 8 3 1 3 4Tulsa, Okla. 57 35 12 6 2 2 -
MOUNTAIN 854 582 171 72 19 9 62Albuquerque, N.M. 120 87 20 9 3 1 9Boise, Idaho 44 33 8 2 1 - 3Colo. Springs, Colo. 77 48 19 8 2 - -Denver, Colo. U U U U U U ULas Vegas, Nev. 226 144 57 21 4 - 21Ogden, Utah 21 16 2 3 - - 1Phoenix, Ariz. 75 45 16 9 4 - 3Pueblo, Colo. 15 15 - - - - 2Salt Lake City, Utah 123 89 17 10 2 5 14Tucson, Ariz. 153 105 32 10 3 3 9
PACIFIC 1,194 835 232 80 24 22 98Berkeley, Calif. 13 7 5 - - 1 3Fresno, Calif. U U U U U U UGlendale, Calif. 4 4 - - - - 1Honolulu, Hawaii 58 45 10 2 - 1 4Long Beach, Calif. 33 26 6 1 - - 2Los Angeles, Calif. 102 60 24 9 4 5 7Pasadena, Calif. 41 29 6 3 1 2 4Portland, Oreg. 95 61 25 7 - 1 6Sacramento, Calif. 156 116 23 11 3 3 19San Diego, Calif. 142 99 25 9 6 3 12San Francisco, Calif. 99 68 21 9 - 1 7San Jose, Calif. 213 153 36 13 7 4 17Santa Cruz, Calif. 21 15 6 - - - 3Seattle, Wash. 99 69 21 8 1 - 6Spokane, Wash. 57 41 10 5 1 - 5Tacoma, Wash. 61 42 14 3 1 1 2
TOTAL 9,281¶ 6,274 1,953 613 198 176 648

Vol. 53 / Nos. 51 & 52 MMWR 1213
* No rubella cases were reported for the current 4-week period yielding a ratio for week 52 of zero (0).† Ratio of current 4-week total to mean of 15 4-week totals (from previous, comparable, and subsequent 4-week periods for the past 5 years). The point where the hatched area
begins is based on the mean and two standard deviations of these 4-week totals.
-: No reported cases.* Incidence data for reporting years 2003 and 2004 are provisional and cumulative (year-to-date).†
Not notifiable in all states.§
Updated weekly from reports to the Division of Vector-Borne Infectious Diseases, National Center for Infectious Diseases (ArboNet Surveillance).¶
Updated monthly from reports to the Division of HIV/AIDS Prevention — Surveillance and Epidemiology, National Center for HIV, STD, and TB Prevention.Last update November 28, 2004.
** Updated weekly from reports to the Division of Viral and Rickettsial Diseases, National Center for Infectious Diseases.††
Of 37 cases reported, 14 were indigenous, and 23 were imported from another country.§§
Of 55 cases reported, 31 were indigenous, and 24 were imported from another country.¶¶
Not previously notifiable.
TABLE I. Summary of provisional cases of selected notifiable diseases, United States, cumulative, week ending January 1, 2005 (52nd Week)*
Cum. Cum. Cum. Cum.2004 2003 2004 2003
FIGURE I. Selected notifiable disease reports, United States, comparison of provisional 4-week totals January 1, 2005, with historicaldata
DISEASE DECREASE INCREASECASES CURRENT
4 WEEKS
Ratio (Log scale)†
Beyond historical limits
4210.50.250.125
164
285
32
96
2
38
14
1,194
0
Hepatitis A, acute
Hepatitis B, acute
Hepatitis C, acute
Legionellosis
Measles, total
Mumps
Pertussis
Rubella
Meningococcal disease
0.06250.03125
*
Anthrax - - HIV infection, pediatric†¶ 149 197Botulism: - - Influenza-associated pediatric mortality** - NA
foodborne 23 19 Measles, total 37†† 55§§
infant 76 76 Mumps 236 219other (wound & unspecified) 17 30 Plague 3 1
Brucellosis† 123 100 Poliomyelitis, paralytic - -Chancroid 42 54 Psittacosis† 10 12Cholera 4 2 Q fever† 70 67Cyclosporiasis† 212 75 Rabies, human 7 2Diphtheria - 1 Rubella 12 7Ehrlichiosis: - - Rubella, congenital syndrome - 1
human granulocytic (HGE)† 400 336 SARS-associated coronavirus disease† ** - 8human monocytic (HME)† 331 281 Smallpox† ¶¶ - NAhuman, other and unspecified 35 48 Staphylococcus aureus: - -
Encephalitis/Meningitis: - - Vancomycin-intermediate (VISA)† ¶¶ - NACalifornia serogroup viral† § 92 108 Vancomycin-resistant (VRSA)† ¶¶ 1 NAeastern equine† § 6 14 Streptococcal toxic-shock syndrome† 101 155Powassan† § - - Tetanus 26 19St. Louis† § 9 41 Toxic-shock syndrome 119 118western equine† § - - Trichinosis 7 6
Hansen disease (leprosy)† 82 93 Tularemia† 107 88Hantavirus pulmonary syndrome† 20 26 Yellow fever - -Hemolytic uremic syndrome, postdiarrheal† 147 170

1214 MMWR January 7, 2005
N: Not notifiable. U: Unavailable. -: No reported cases. C.N.M.I.: Commonwealth of Northern Mariana Islands.* Incidence data for reporting years 2003 and 2004 are provisional and cumulative (year-to-date).† Chlamydia refers to genital infections caused by C. trachomatis.§ Updated weekly from reports to the Division of Vector-Borne Infectious Diseases, National Center for Infectious Diseases (ArboNet Surveillance).¶ Updated monthly from reports to the Division of HIV/AIDS Prevention — Surveillance and Epidemiology, National Center for HIV, STD, and TB Prevention. Last update
November 28, 2004.** Contains data reported through National Electronic Disease Surveillance System (NEDSS).
TABLE II. Provisional cases of selected notifiable diseases, United States, weeks ending January 1, 2005, and December 27, 2003(52nd Week)*
Encephalitis/MeningitisAIDS Chlamydia† Coccidioidomycosis Cryptosporidiosis West Nile§
Cum. Cum. Cum. Cum. Cum. Cum. Cum. Cum. Cum. Cum.Reporting area 2004¶ 2003 2004 2003 2004 2003 2004 2003 2004 2003
UNITED STATES 39,097 43,687 866,234 862,440 6,056 4,184 3,372 3,406 894 2,866
NEW ENGLAND 1,318 1,546 29,523 27,754 - - 167 189 - 31Maine 48 52 2,118 1,999 N N 20 20 - -N.H. 44 38 1,749 1,599 - - 30 25 - 2Vt.** 16 16 1,020 1,049 - - 26 32 - -Mass. 495 709 13,324 11,077 - - 60 78 - 12R.I. 131 101 3,404 2,939 - - 4 16 - 5Conn. 584 630 7,908 9,091 N N 27 18 - 12
MID. ATLANTIC 9,011 9,869 106,272 108,852 - - 535 444 17 223Upstate N.Y. 1,406 978 22,473 21,363 N N 181 134 5 -N.Y. City 4,804 5,211 32,882 34,765 - - 113 126 2 57N.J. 1,360 1,488 14,218 15,925 - - 33 19 1 21Pa. 1,441 2,192 36,699 36,799 N N 208 165 9 145
E.N. CENTRAL 3,311 3,900 151,045 155,961 13 7 964 1,005 64 150Ohio 617 779 36,488 41,998 N N 225 171 11 84Ind. 364 517 18,437 16,828 N N 86 105 8 15Ill. 1,559 1,708 41,600 47,587 - - 97 101 28 30Mich. 614 708 37,792 31,848 13 7 152 149 12 14Wis. 157 188 16,728 17,700 - - 404 479 5 7
W.N. CENTRAL 802 805 52,213 50,973 6 4 419 586 85 696Minn. 206 177 10,315 10,527 N N 135 152 13 48Iowa 65 83 5,900 6,369 N N 90 122 13 81Mo. 338 363 19,633 18,296 3 1 79 51 26 39N. Dak. 18 3 1,511 1,613 N N 12 14 2 94S. Dak. 11 14 2,535 2,572 - - 43 48 6 151Nebr.** 54 49 4,982 4,600 3 3 29 26 7 194Kans. 110 116 7,337 6,996 N N 31 173 18 89
S. ATLANTIC 11,845 12,194 167,099 160,798 - 5 528 415 59 191Del. 143 213 2,954 2,992 N N - 4 - 12Md. 1,363 1,571 19,842 16,601 - 5 25 28 8 49D.C. 911 991 3,383 3,145 - - 13 13 1 3Va. 615 907 21,298 19,162 - - 60 54 4 19W. Va. 86 93 2,764 2,541 N N 6 4 - 1N.C. 1,080 1,043 27,986 25,654 N N 76 51 3 16S.C.** 709 790 19,221 14,340 - - 19 10 - 3Ga. 1,558 1,829 27,898 35,287 - - 180 122 12 27Fla. 5,380 4,757 41,753 41,076 N N 149 129 31 61
E.S. CENTRAL 1,833 1,974 56,679 54,474 4 1 121 132 60 91Ky. 232 224 6,470 7,906 N N 45 24 1 11Tenn.** 722 829 21,453 20,380 N N 29 42 13 21Ala. 442 484 10,963 14,117 - - 24 56 15 25Miss. 437 437 17,793 12,071 4 1 23 10 31 34
W.S. CENTRAL 4,332 5,378 103,801 107,025 2 - 123 125 221 611Ark. 184 188 7,205 7,788 1 - 17 20 12 23La. 865 1,038 21,764 20,488 1 - 7 5 81 101Okla. 202 212 9,882 10,830 N N 20 21 14 56Tex.** 3,081 3,940 64,950 67,919 N N 79 79 114 431
MOUNTAIN 1,415 1,466 50,403 48,379 3,932 2,429 163 136 234 871Mont. 6 13 2,371 2,511 N N 34 18 2 75Idaho 18 25 2,555 2,366 N N 27 27 - -Wyo. 18 6 1,082 943 2 1 4 5 2 92Colo. 313 352 11,986 12,856 N N 58 37 39 621N. Mex. 178 99 6,128 7,364 21 10 13 16 31 74Ariz. 550 635 16,799 12,777 3,813 2,374 19 6 129 7Utah 72 69 3,690 3,811 37 9 6 19 6 -Nev. 260 267 5,792 5,751 59 35 2 8 25 2
PACIFIC 5,230 6,555 149,199 148,224 2,099 1,738 352 374 154 2Wash. 373 490 17,638 16,649 N N 40 58 - -Oreg. 282 243 8,277 7,587 - - 32 36 - -Calif. 4,383 5,694 114,918 114,838 2,099 1,738 278 279 154 2Alaska 56 19 3,500 3,732 - - - 1 - -Hawaii 136 109 4,866 5,418 - - 2 - - -
Guam 2 5 560 591 - - - - - -P.R. 642 1,024 3,628 2,690 N N N N - -V.I. 18 33 272 410 - - - - - -Amer. Samoa U U U U U U U U U UC.N.M.I. 2 U 32 U - U - U - U

Vol. 53 / Nos. 51 & 52 MMWR 1215
N: Not notifiable. U: Unavailable. - : No reported cases.* Incidence data for reporting years 2003 and 2004 are provisional and cumulative (year-to-date).
TABLE II. (Continued) Provisional cases of selected notifiable diseases, United States, weeks ending January 1, 2005, and December 27, 2003(52nd Week)*
Escherichia coli, Enterohemorrhagic (EHEC)Shiga toxin positive, Shiga toxin positive,
O157:H7 serogroup non-O157 not serogrouped Giardiasis GonorrheaCum. Cum. Cum. Cum. Cum. Cum. Cum. Cum. Cum. Cum.
Reporting area 2004 2003 2004 2003 2004 2003 2004 2003 2004 2003
UNITED STATES 2,436 2,603 270 247 287 153 18,498 19,195 307,845 329,717
NEW ENGLAND 165 160 43 46 18 13 1,709 1,622 6,748 7,247Maine 11 11 1 4 - - 129 182 212 227N.H. 23 19 5 3 - - 47 43 134 122Vt. 12 18 - - - - 174 121 86 96Mass. 71 71 10 9 18 13 757 845 3,077 2,868R.I. 13 4 1 - - - 122 114 808 947Conn. 35 37 26 30 - - 480 317 2,431 2,987
MID. ATLANTIC 286 253 59 24 32 36 3,804 3,972 34,101 41,386Upstate N.Y. 122 102 43 13 15 20 1,389 1,244 7,112 8,376N.Y. City 37 7 - - - - 982 1,200 10,531 13,459N.J. 53 31 4 2 5 - 416 520 5,688 7,854Pa. 74 113 12 9 12 16 1,017 1,008 10,770 11,697
E.N. CENTRAL 443 572 40 35 31 20 2,807 3,224 64,475 69,774Ohio 102 132 9 16 21 20 812 895 18,860 22,296Ind. 62 86 - - - - - - 6,854 6,601Ill. 72 122 2 2 4 - 525 931 18,440 21,482Mich. 82 92 11 2 6 - 700 771 15,984 13,804Wis. 125 140 18 15 - - 770 627 4,337 5,591
W.N. CENTRAL 496 443 48 54 18 21 2,175 2,079 16,431 17,804Minn. 112 130 21 21 1 1 834 796 3,012 3,144Iowa 123 104 - - - - 301 273 1,042 1,519Mo. 99 84 21 20 8 1 575 508 8,452 8,684N. Dak. 15 13 - 4 7 8 23 45 96 99S. Dak. 33 29 2 4 - - 80 84 305 220Nebr. 72 48 4 5 - - 150 142 1,033 1,570Kans. 42 35 - - 2 11 212 231 2,491 2,568
S. ATLANTIC 173 163 36 50 167 46 2,765 2,809 75,523 80,155Del. 3 11 N N N N 45 55 894 1,115Md. 21 18 5 3 4 1 146 117 8,284 7,874D.C. 1 1 - - - - 64 58 2,511 2,478Va. 39 50 18 15 - - 530 423 8,425 8,855W. Va. 3 6 - - - - 47 53 892 841N.C. - - - - 152 36 N N 14,508 14,816S.C. 8 4 - - - - 73 141 9,376 8,371Ga. 25 27 8 8 - - 731 848 12,338 17,438Fla. 73 46 5 24 11 9 1,129 1,114 18,295 18,367
E.S. CENTRAL 101 85 3 2 9 6 350 409 24,513 27,528Ky. 30 29 1 2 6 6 N N 2,758 3,547Tenn. 31 35 2 - 3 - 157 193 8,059 8,519Ala. 30 17 - - - - 193 216 6,905 9,201Miss. 10 4 - - - - - - 6,791 6,261
W.S. CENTRAL 86 99 4 4 12 4 325 292 40,826 44,455Ark. 16 12 1 - - - 121 144 3,603 4,197La. 4 3 - - 2 - 53 14 10,497 11,611Okla. 20 29 1 - 4 - 151 134 4,228 4,479Tex. 46 55 2 4 6 4 N N 22,498 24,168
MOUNTAIN 242 319 36 27 - 7 1,534 1,598 11,069 10,345Mont. 16 17 - - - - 81 113 69 122Idaho 50 85 16 16 - - 181 206 88 68Wyo. 9 5 7 1 - - 27 23 59 45Colo. 50 67 2 4 - 7 512 461 2,647 2,805N. Mex. 9 13 7 5 - - 68 54 915 1,162Ariz. 29 38 N N N N 180 243 4,060 3,564Utah 52 70 3 - - - 357 359 582 403Nev. 27 24 1 1 - - 128 139 2,649 2,176
PACIFIC 444 509 1 5 - - 3,029 3,190 34,159 31,023Wash. 149 118 - 1 - - 409 378 2,805 2,728Oreg. 68 101 1 4 - - 438 403 1,255 987Calif. 216 276 - - - - 2,012 2,229 28,483 25,515Alaska 1 5 - - - - 90 88 492 560Hawaii 10 9 - - - - 80 92 1,124 1,233
Guam N N - - - - - 2 92 68P.R. 3 3 - - - - 143 333 270 274V.I. - - - - - - - - 80 87Amer. Samoa U U U U U U U U U UC.N.M.I. - U - U - U - U 3 U

1216 MMWR January 7, 2005
N: Not notifiable. U: Unavailable. -: No reported cases.* Incidence data for reporting years 2003 and 2004 are provisional and cumulative (year-to-date).
TABLE II. (Continued) Provisional cases of selected notifiable diseases, United States, weeks ending January 1, 2005, and December 27, 2003(52nd Week)*
Haemophilus influenzae, invasive Hepatitis
All ages Age <5 years (viral, acute), by type
All serotypes Serotype b Non-serotype b Unknown serotype ACum. Cum. Cum. Cum. Cum. Cum. Cum. Cum. Cum. Cum.
Reporting area 2004 2003 2004 2003 2004 2003 2004 2003 2004 2003
UNITED STATES 1,814 1,898 16 25 114 107 156 215 5,609 7,465
NEW ENGLAND 162 155 1 2 7 5 4 6 1,021 358Maine 13 4 - - - - - 1 11 20N.H. 19 13 - 1 2 - 1 - 26 18Vt. 8 11 - - - - 1 1 8 6Mass. 64 79 1 1 1 5 2 3 884 209R.I. 6 9 - - 1 - - 1 23 15Conn. 52 39 - - 3 - - - 69 90
MID. ATLANTIC 399 403 1 3 5 4 39 50 688 1,813Upstate N.Y. 128 152 1 3 5 4 6 10 117 141N.Y. City 79 70 - - - - 15 13 274 450N.J. 77 70 - - - - 4 11 140 208Pa. 115 111 - - - - 14 16 157 1,014
E.N. CENTRAL 296 307 2 3 8 6 37 57 527 673Ohio 106 74 1 - 2 1 16 13 50 169Ind. 54 51 - - 4 - 1 9 96 70Ill. 75 108 - - - - 13 24 184 186Mich. 21 26 1 3 2 5 4 1 145 203Wis. 40 48 - - - - 3 10 52 45
W.N. CENTRAL 111 116 2 2 4 7 12 14 175 182Minn. 45 53 1 2 4 7 1 2 32 44Iowa 1 - 1 - - - - - 55 37Mo. 39 41 - - - - 7 11 44 59N. Dak. 4 4 - - - - - - 1 2S. Dak. - 1 - - - - - - 4 -Nebr. 13 2 - - - - 2 - 12 14Kans. 9 15 - - - - 2 1 27 26
S. ATLANTIC 412 436 1 2 28 20 24 29 1,006 1,733Del. - - - - - - - - 6 9Md. 71 105 - 1 6 9 - 1 107 178D.C. - 2 - - - - - - 7 43Va. 41 68 - - - - 1 9 137 141W. Va. 17 17 - - 1 - 3 - 6 15N.C. 62 41 1 - 7 3 1 2 106 124S.C. 6 7 - - - - - 2 26 41Ga. 101 78 - - - - 18 9 315 788Fla. 114 118 - 1 14 8 1 6 296 394
E.S. CENTRAL 68 89 1 1 2 3 9 10 144 268Ky. 13 7 - - 2 2 1 1 30 32Tenn. 38 55 - - - 1 6 6 80 196Ala. 14 25 1 1 - - 2 3 10 24Miss. 3 2 - - - - - - 24 16
W.S. CENTRAL 82 79 1 2 9 11 2 5 589 701Ark. 4 6 - - - 1 1 - 57 37La. 15 22 - - - 2 1 4 55 48Okla. 62 47 - - 9 8 - - 20 23Tex. 1 4 1 2 - - - 1 457 593
MOUNTAIN 187 168 4 6 31 24 22 20 453 466Mont. - - - - - - - - 8 8Idaho 5 7 - - - - 2 3 21 18Wyo. 1 2 - - 1 - - - 5 2Colo. 46 38 - - - - 6 7 53 63N. Mex. 39 21 1 - 10 5 6 2 23 24Ariz. 65 78 - 6 15 10 2 4 280 261Utah 18 12 2 - 2 5 5 4 49 39Nev. 13 10 1 - 3 4 1 - 14 51
PACIFIC 97 145 3 4 20 27 7 24 1,006 1,271Wash. 4 11 3 - - 7 1 3 60 68Oreg. 45 41 - - - - 3 4 69 62Calif. 35 58 - 4 20 20 1 10 845 1,118Alaska 4 21 - - - - 1 7 5 10Hawaii 9 14 - - - - 1 - 27 13
Guam - - - - - - - - 1 2P.R. - 1 - - - - - 1 26 86V.I. - - - - - - - - - -Amer. Samoa U U U U U U U U U UC.N.M.I. - U - U - U - U - U

Vol. 53 / Nos. 51 & 52 MMWR 1217
N: Not notifiable. U: Unavailable. -: No reported cases.* Incidence data for reporting years 2003 and 2004 are provisional and cumulative (year-to-date).
TABLE II. (Continued) Provisional cases of selected notifiable diseases, United States, weeks ending January 1, 2005, and December 27, 2003(52nd Week)*
Hepatitis (viral, acute), by typeB C Legionellosis Listeriosis Lyme disease
Cum. Cum. Cum. Cum. Cum. Cum. Cum. Cum. Cum. Cum.Reporting area 2004 2003 2004 2003 2004 2003 2004 2003 2004 2003UNITED STATES 6,632 7,118 866 1,092 1,917 2,139 682 676 18,523 20,738
NEW ENGLAND 367 355 16 14 92 117 48 53 2,859 3,831Maine 4 1 - 2 - 2 7 7 53 169N.H. 41 24 - - 11 9 4 4 216 178Vt. 5 4 8 12 6 6 2 1 51 43Mass. 217 210 6 - 34 55 15 18 1,134 1,524R.I. 6 18 - - 18 17 2 1 234 581Conn. 94 98 2 - 23 28 18 22 1,171 1,336
MID. ATLANTIC 1,268 769 149 139 539 622 160 136 11,968 13,903Upstate N.Y. 92 107 19 26 112 171 51 41 4,156 5,102N.Y. City 129 193 - - 62 71 22 24 - 220N.J. 747 183 - - 100 94 28 24 3,271 2,887Pa. 300 286 130 113 265 286 59 47 4,541 5,694
E.N. CENTRAL 515 543 107 142 484 446 109 89 1,033 909Ohio 121 155 6 9 220 226 40 26 61 66Ind. 48 42 10 9 78 32 18 10 22 23Ill. 71 73 13 24 35 50 18 23 1 71Mich. 243 222 78 95 134 120 26 20 27 11Wis. 32 51 - 5 17 18 7 10 922 738
W.N. CENTRAL 316 345 55 270 63 73 22 20 848 474Minn. 49 39 18 11 7 5 6 6 735 345Iowa 15 14 - 1 6 11 3 1 45 53Mo. 189 239 36 255 35 37 8 6 56 69N. Dak. 4 2 - - 2 1 - - - -S. Dak. - 2 - - 5 2 2 - 1 1Nebr. 41 32 1 3 4 6 3 4 8 2Kans. 18 17 - - 4 11 - 3 3 4
S. ATLANTIC 1,934 2,022 198 156 400 538 119 146 1,541 1,346Del. 42 13 28 - 13 28 N N 301 209Md. 169 130 26 9 82 132 19 27 809 689D.C. 19 12 3 - 11 19 - 2 11 13Va. 280 227 17 15 53 109 20 18 179 195W. Va. 39 38 24 9 9 21 4 7 28 27N.C. 182 160 12 13 40 41 26 18 123 146S.C. 90 159 8 24 8 8 6 5 16 15Ga. 587 662 17 13 37 34 15 31 13 10Fla. 526 621 63 73 147 146 29 38 61 42
E.S. CENTRAL 419 497 91 93 88 103 21 33 48 63Ky. 73 74 23 22 40 43 4 9 15 15Tenn. 174 217 35 23 33 35 10 9 17 19Ala. 66 96 5 6 12 20 5 13 5 8Miss. 106 110 28 42 3 5 2 2 11 21
W.S. CENTRAL 617 1,157 136 155 78 80 40 50 92 92Ark. 77 84 3 3 - 2 2 1 8 -La. 63 116 69 100 6 1 3 5 5 7Okla. 47 57 3 3 8 7 1 3 - -Tex. 430 900 61 49 64 70 34 41 79 85
MOUNTAIN 539 567 36 53 94 79 28 32 33 14Mont. 2 16 2 4 3 4 1 2 - -Idaho 10 8 - 1 9 7 1 2 6 3Wyo. 9 31 2 - 7 2 - - 4 2Colo. 59 78 - 14 21 12 12 9 - -N. Mex. 15 36 7 - 4 4 1 3 1 1Ariz. 315 261 5 7 22 11 - 10 7 3Utah 58 51 5 - 24 27 5 2 14 2Nev. 71 86 15 27 4 12 8 4 1 3
PACIFIC 657 863 78 70 79 81 135 117 101 106Wash. 53 82 22 19 14 10 12 10 14 3Oreg. 110 120 15 16 N N 7 5 33 16Calif. 468 626 33 31 64 70 111 97 52 84Alaska 15 8 - - 1 - - - 2 3Hawaii 11 27 8 4 - 1 5 5 N N
Guam 6 10 - 5 - 1 - - - -P.R. 58 129 - - 2 - - - N NV.I. - - - - - - - - - -Amer. Samoa U U U U U U U U U UC.N.M.I. - U - U - U - U - U

1218 MMWR January 7, 2005
N: Not notifiable. U: Unavailable. - : No reported cases.* Incidence data for reporting years 2003 and 2004 are provisional and cumulative (year-to-date).
TABLE II. (Continued) Provisional cases of selected notifiable diseases, United States, weeks ending January 1, 2005, and December 27, 2003(52nd Week)*
Meningococcal Rocky MountainMalaria disease Pertussis Rabies, animal spotted fever
Cum. Cum. Cum. Cum. Cum. Cum. Cum. Cum. Cum. Cum.Reporting area 2004 2003 2004 2003 2004 2003 2004 2003 2004 2003
UNITED STATES 1,300 1,350 1,254 1,654 18,957 10,670 5,851 6,712 1,514 968
NEW ENGLAND 85 66 70 75 1,905 1,912 702 594 27 9Maine 6 3 11 6 34 12 55 70 - -N.H. 5 6 7 5 98 99 31 29 - -Vt. 4 2 4 3 125 71 40 38 1 -Mass. 48 32 36 45 1,589 1,633 320 211 21 9R.I. 7 3 2 2 47 20 38 68 3 -Conn. 15 20 10 14 12 77 218 178 2 -
MID. ATLANTIC 341 364 157 206 2,896 1,717 936 916 102 40Upstate N.Y. 55 63 39 55 1,880 1,041 518 427 5 -N.Y. City 181 194 25 43 179 150 13 6 24 13N.J. 59 61 37 31 247 188 - 62 33 16Pa. 46 46 56 77 590 338 405 421 40 11
E.N. CENTRAL 107 108 190 251 5,896 1,338 163 170 24 22Ohio 30 23 73 58 764 317 77 53 12 10Ind. 18 4 31 44 293 69 11 30 6 1Ill. 24 45 22 72 503 138 51 24 2 5Mich. 21 25 49 47 288 136 15 49 4 6Wis. 14 11 15 30 4,048 678 9 14 - -
W.N. CENTRAL 66 53 83 126 2,490 550 561 631 134 65Minn. 25 24 23 26 497 146 90 41 4 2Iowa 4 6 18 27 308 156 104 103 1 2Mo. 20 7 20 49 553 174 59 43 106 51N. Dak. 3 1 2 1 754 7 69 56 - -S. Dak. 1 3 2 1 73 7 90 132 4 5Nebr. 4 - 4 8 75 16 53 98 19 4Kans. 9 12 14 14 230 44 96 158 - 1
S. ATLANTIC 334 341 215 271 752 825 1,897 2,636 780 592Del. 6 2 3 9 5 9 9 64 6 1Md. 78 74 11 27 139 90 323 351 79 105D.C. 13 15 4 5 9 3 - - - 1Va. 53 59 20 28 261 219 464 542 38 34W. Va. 2 4 6 6 24 27 69 81 5 5N.C. 23 25 36 36 101 137 581 767 535 322S.C. 10 4 12 22 57 194 151 245 24 43Ga. 54 66 16 34 23 35 298 398 67 64Fla. 95 92 107 104 133 111 2 188 26 17
E.S. CENTRAL 29 30 61 95 284 163 136 210 174 128Ky. 5 9 12 21 87 48 23 39 2 3Tenn. 7 7 15 30 135 81 36 103 88 71Ala. 12 7 17 21 45 19 66 64 48 21Miss. 5 7 17 23 17 15 11 4 36 33
W.S. CENTRAL 112 134 124 186 972 752 1,059 1,145 240 101Ark. 8 4 20 18 78 45 49 25 154 44La. 5 5 36 43 16 11 - 5 5 1Okla. 7 4 10 22 33 92 104 199 71 42Tex. 92 121 58 103 845 604 906 916 10 14
MOUNTAIN 51 45 63 98 1,902 1,000 217 178 28 10Mont. 1 - 3 6 74 5 26 21 3 1Idaho 1 1 7 9 37 82 8 15 4 2Wyo. 1 2 3 2 35 130 7 6 5 2Colo. 16 23 15 27 1,072 366 43 38 1 3N. Mex. 4 3 9 12 146 75 5 5 2 1Ariz. 13 8 12 29 240 183 115 74 4 -Utah 9 6 7 5 250 124 10 14 9 1Nev. 6 2 7 8 48 35 3 5 - -
PACIFIC 175 209 291 346 1,860 2,413 180 232 5 1Wash. 20 30 32 42 765 748 - - - -Oreg. 18 11 58 61 535 438 6 7 3 -Calif. 132 161 189 223 521 1,149 166 216 2 1Alaska 2 1 3 7 12 66 8 9 - -Hawaii 3 6 9 13 27 12 - - - -
Guam - 1 1 - - 1 - - - -P.R. - 2 11 12 7 4 61 70 N NV.I. - - - - - - - - - -Amer. Samoa U U U U U U U U U UC.N.M.I. - U - U - U - U - U

Vol. 53 / Nos. 51 & 52 MMWR 1219
N: Not notifiable. U: Unavailable. - : No reported cases.* Incidence data for reporting years 2003 and 2004 are provisional and cumulative (year-to-date).
TABLE II. (Continued) Provisional cases of selected notifiable diseases, United States, weeks ending January 1, 2005, and December 27, 2003(52nd Week)*
Streptococcus pneumoniae, invasiveStreptococcal disease, Drug resistant,
Salmonellosis Shigellosis invasive, group A all ages Age <5 yearsCum. Cum. Cum. Cum. Cum. Cum. Cum. Cum. Cum. Cum.
Reporting area 2004 2003 2004 2003 2004 2003 2004 2003 2004 2003
UNITED STATES 40,252 42,731 12,735 22,846 4,461 5,604 2,119 2,043 734 761
NEW ENGLAND 2,024 2,081 286 344 178 462 77 105 75 9Maine 90 139 9 7 11 29 2 - 3 -N.H. 138 142 10 9 19 34 - - N NVt. 65 73 4 8 9 19 14 9 3 5Mass. 1,142 1,214 175 233 118 205 42 N 59 NR.I. 136 125 20 20 21 16 19 10 10 4Conn. 453 388 68 67 - 159 - 86 U U
MID. ATLANTIC 5,412 4,944 1,133 2,382 712 943 141 148 127 118Upstate N.Y. 1,233 1,249 408 628 230 357 58 85 89 86N.Y. City 1,203 1,301 391 416 104 146 U U U UN.J. 968 857 231 360 156 174 - - 7 4Pa. 2,008 1,537 103 978 222 266 83 63 31 28
E.N. CENTRAL 4,846 5,521 1,134 1,845 830 1,272 503 440 180 321Ohio 1,208 1,318 171 299 221 284 353 285 80 98Ind. 637 542 225 177 101 119 150 155 46 30Ill. 1,357 1,936 330 1,001 170 343 - - 14 133Mich. 812 795 234 234 282 353 N N N NWis. 832 930 174 134 56 173 N N 40 60
W.N. CENTRAL 2,459 2,454 463 783 294 334 28 20 105 80Minn. 633 562 66 102 141 159 - - 70 55Iowa 429 394 66 91 N N N N N NMo. 641 872 186 354 60 77 23 16 14 3N. Dak. 42 42 3 10 15 17 - 3 4 9S. Dak. 137 128 13 17 21 25 5 1 - -Nebr. 185 166 47 88 16 27 - - 7 5Kans. 392 290 82 121 41 29 N N 10 8
S. ATLANTIC 11,109 11,205 2,762 6,742 851 944 1,018 1,087 64 18Del. 101 102 9 164 3 7 4 1 N NMd. 809 845 151 577 185 226 - 27 48 -D.C. 62 52 40 73 10 10 8 1 3 7Va. 1,159 1,187 166 453 70 111 N N N NW. Va. 225 134 9 1 25 36 106 82 13 11N.C. 1,648 1,408 476 985 125 103 N N U US.C. 956 812 326 517 39 39 71 142 N NGa. 1,869 2,042 620 1,160 169 189 248 244 N NFla. 4,280 4,623 965 2,812 225 223 581 590 N N
E.S. CENTRAL 2,480 2,941 773 1,042 191 208 124 148 6 -Ky. 353 397 75 129 59 48 30 24 N NTenn. 523 759 327 396 132 160 93 124 N NAla. 760 792 323 342 - - - - N NMiss. 844 993 48 175 - - 1 - 6 -
W.S. CENTRAL 4,079 5,972 3,413 5,770 292 300 72 80 133 144Ark. 575 796 81 104 17 6 10 22 8 8La. 815 872 278 443 3 2 62 58 26 29Okla. 404 468 526 838 66 90 N N 47 67Tex. 2,285 3,836 2,528 4,385 206 202 N N 52 40
MOUNTAIN 2,366 2,272 843 1,293 535 517 50 11 42 71Mont. 184 112 4 2 - 1 - - - -Idaho 145 180 13 36 9 19 N N N NWyo. 54 77 6 8 10 2 12 10 - -Colo. 536 497 158 329 138 144 - - 39 53N. Mex. 271 294 122 272 83 122 5 - - 12Ariz. 757 711 425 530 247 193 N N N NUtah 239 224 50 50 44 34 31 1 3 6Nev. 180 177 65 66 4 2 2 - - -
PACIFIC 5,477 5,341 1,928 2,645 578 624 106 4 2 -Wash. 581 596 115 169 59 74 - - N NOreg. 404 424 81 211 N N N N N NCalif. 4,057 4,000 1,679 2,208 383 416 N N N NAlaska 64 96 6 11 - - - - N NHawaii 371 225 47 46 136 134 106 4 2 -
Guam 26 44 33 41 - - - - - -P.R. 309 730 11 27 N N N N N NV.I. - - - - - - - - - -Amer. Samoa U U U U U U U U U UC.N.M.I. 3 U - U - U - U - U

1220 MMWR January 7, 2005
N: Not notifiable. U: Unavailable. - : No reported cases.* Incidence data for reporting years 2003 and 2004 are provisional and cumulative (year-to-date).
TABLE II. (Continued) Provisional cases of selected notifiable diseases, United States, weeks ending January 1, 2005, and December 27, 2003(52nd Week)*
Syphilis VaricellaPrimary & secondary Congenital Tuberculosis Typhoid fever (Chickenpox)Cum. Cum. Cum. Cum. Cum. Cum. Cum. Cum. Cum. Cum.
Reporting area 2004 2003 2004 2003 2004 2003 2004 2003 2004 2003UNITED STATES 7,352 7,004 312 434 11,178 12,541 283 352 18,718 17,698
NEW ENGLAND 175 215 6 1 408 435 23 28 722 3,411Maine 2 8 - - - 21 - - 311 781N.H. 4 19 3 - 18 13 - 4 - -Vt. 1 1 - - 4 9 - - 411 907Mass. 112 130 - - 273 236 15 15 - 147R.I. 22 29 2 - 38 45 1 2 - 5Conn. 34 28 1 1 75 111 7 7 - 1,571
MID. ATLANTIC 976 901 41 74 2,067 2,181 62 80 91 42Upstate N.Y. 99 50 5 20 279 285 8 12 - -N.Y. City 607 525 15 31 1,003 1,111 23 37 - -N.J. 147 168 20 23 440 452 16 21 - -Pa. 123 158 1 - 345 333 15 10 91 42
E.N. CENTRAL 871 883 61 75 1,203 1,202 17 33 6,580 6,397Ohio 229 196 1 3 208 209 5 2 1,572 1,267Ind. 59 50 10 16 127 134 - 4 139 -Ill. 374 372 18 21 541 569 - 17 2 -Mich. 176 249 32 34 240 224 9 10 4,239 4,126Wis. 33 16 - 1 87 66 3 - 628 1,004
W.N. CENTRAL 143 149 5 6 446 467 12 6 130 82Minn. 24 46 1 - 181 198 8 2 - -Iowa 5 12 - - 42 33 - 2 N NMo. 85 58 2 4 116 110 2 1 5 1N. Dak. - 2 - - 4 4 - - 82 81S. Dak. - 2 - - 8 20 - - 43 -Nebr. 6 6 - 1 36 27 2 1 - -Kans. 23 23 2 1 59 75 - - - -
S. ATLANTIC 1,951 1,840 53 82 2,512 2,748 45 59 2,251 2,357Del. 9 6 1 - 17 23 - - 5 29Md. 363 312 9 12 250 261 12 11 - 1D.C. 92 48 1 - 71 - - - 26 31Va. 114 79 3 1 277 328 10 16 626 682W. Va. 2 2 - - 24 21 - - 1,276 1,330N.C. 186 148 13 19 334 374 8 9 N NS.C. 113 94 8 14 167 169 - - 318 284Ga. 361 508 2 13 416 526 5 8 - -Fla. 711 643 16 23 956 1,046 10 15 - -
E.S. CENTRAL 385 317 19 12 539 694 7 8 - -Ky. 47 33 1 1 123 128 3 1 - -Tenn. 123 135 8 2 230 218 4 3 - -Ala. 165 113 8 7 153 238 - 4 - -Miss. 50 36 2 2 33 110 - - - -
W.S. CENTRAL 1,156 936 51 80 1,055 1,824 27 30 6,354 4,667Ark. 39 51 - 3 118 110 - - - -La. 268 178 - 1 - - - - 51 16Okla. 24 64 2 1 152 155 1 1 - -Tex. 825 643 49 75 785 1,559 26 29 6,303 4,651
MOUNTAIN 340 334 45 35 515 527 8 8 2,590 742Mont. 3 - - - 14 5 - - - -Idaho 22 15 2 3 4 8 - 1 - -Wyo. 3 - - - 5 4 - - 56 110Colo. 40 38 1 3 111 106 3 4 1,958 -N. Mex. 66 70 1 10 35 48 - 1 104 4Ariz. 157 186 41 19 229 295 2 2 - -Utah 10 13 - - 37 39 1 - 472 628Nev. 39 12 - - 80 22 2 - - -
PACIFIC 1,355 1,429 31 69 2,433 2,463 82 100 - -Wash. 150 81 - - 234 241 6 4 - -Oreg. 27 48 - - 74 106 3 4 - -Calif. 1,165 1,285 30 67 1,979 1,943 67 91 - -Alaska 6 1 - - 35 56 - - - -Hawaii 7 14 1 2 111 117 6 1 - -
Guam - 1 - - 15 53 - - 112 153P.R. 179 204 5 14 84 115 - - 278 602V.I. 4 1 - - - - - - - -Amer. Samoa U U U U U U U U U UC.N.M.I. 2 U - U 10 U - U - U

Vol. 53 / Nos. 51 & 52 MMWR 1221
U: Unavailable. -:No reported cases.* Mortality data in this table are voluntarily reported from 122 cities in the United States, most of which have populations of >100,000. A death is reported by the place of its
occurrence and by the week that the death certificate was filed. Fetal deaths are not included.† Pneumonia and influenza.§ Because of changes in reporting methods in this Pennsylvania city, these numbers are partial counts for the current week. Complete counts will be available in 4 to 6 weeks.¶ Total includes unknown ages.
TABLE III. Deaths in 122 U.S. cities,* week ending January 1, 2005 (52nd Week)All causes, by age (years) All causes, by age (years)
All P&I† All P&I†
Reporting Area Ages >65 45–64 25–44 1–24 <1 Total Reporting Area Ages >65 45–64 25–44 1–24 <1 Total
NEW ENGLAND 385 276 75 27 3 4 38Boston, Mass. U U U U U U UBridgeport, Conn. 34 29 4 1 - - 2Cambridge, Mass. 29 22 6 - - 1 3Fall River, Mass. 25 17 5 3 - - 2Hartford, Conn. 56 37 16 3 - - 6Lowell, Mass. 19 12 6 1 - - 1Lynn, Mass. 10 8 1 1 - - -New Bedford, Mass. 26 20 4 1 - 1 4New Haven, Conn. 63 46 9 8 - - 11Providence, R.I. U U U U U U USomerville, Mass. 2 - 1 1 - - -Springfield, Mass. 37 22 7 4 3 1 1Waterbury, Conn. 32 25 6 1 - - 4Worcester, Mass. 52 38 10 3 - 1 4
MID. ATLANTIC 1,912 1,353 387 120 27 24 130Albany, N.Y. 40 28 8 2 1 1 3Allentown, Pa. 22 20 2 - - - 2Buffalo, N.Y. 121 83 27 5 4 2 11Camden, N.J. 31 19 6 4 1 1 3Elizabeth, N.J. 23 20 3 - - - 5Erie, Pa. 43 34 5 3 1 - 4Jersey City, N.J. 17 8 8 1 - - -New York City, N.Y. 784 565 150 51 9 9 42Newark, N.J. 45 21 17 6 1 - 2Paterson, N.J. 20 12 3 3 1 1 1Philadelphia, Pa. 347 209 92 32 8 5 21Pittsburgh, Pa.§ 32 24 5 2 1 - 2Reading, Pa. 21 17 3 1 - - 3Rochester, N.Y. 141 107 28 4 - 2 14Schenectady, N.Y. 28 23 4 1 - - 1Scranton, Pa. 28 26 2 - - - 1Syracuse, N.Y. 96 81 10 2 - 3 9Trenton, N.J. 22 17 4 1 - - -Utica, N.Y. 21 16 4 1 - - 3Yonkers, N.Y. 30 23 6 1 - - 3
E.N. CENTRAL 1,820 1,250 384 113 37 35 127Akron, Ohio 51 35 13 1 1 1 10Canton, Ohio 39 34 5 - - - 4Chicago, Ill. 302 181 76 30 11 3 9Cincinnati, Ohio 59 46 7 3 - 3 8Cleveland, Ohio 174 125 35 7 3 4 13Columbus, Ohio 197 145 33 10 6 3 15Dayton, Ohio 94 66 19 6 3 - 7Detroit, Mich. 162 86 45 18 8 5 10Evansville, Ind. 31 24 4 3 - - 3Fort Wayne, Ind. 68 54 12 1 - 1 5Gary, Ind. 6 3 1 2 - - -Grand Rapids, Mich. 51 38 9 - 1 3 3Indianapolis, Ind. 151 95 38 14 - 4 6Lansing, Mich. 38 25 8 2 1 2 3Milwaukee, Wis. 93 60 25 4 2 2 6Peoria, Ill. 72 56 13 3 - - 8Rockford, Ill. 64 48 14 1 1 - 8South Bend, Ind. 46 39 2 4 - 1 3Toledo, Ohio 79 55 18 4 - 2 5Youngstown, Ohio 43 35 7 - - 1 1
W.N. CENTRAL 481 323 100 23 21 13 41Des Moines, Iowa 30 22 6 2 - - 3Duluth, Minn. 20 17 3 - - - -Kansas City, Kans. 27 15 9 2 1 - 1Kansas City, Mo. 65 39 13 3 6 4 7Lincoln, Nebr. 47 31 11 2 3 - 3Minneapolis, Minn. 43 27 10 1 4 1 6Omaha, Nebr. 60 46 13 1 - - 4St. Louis, Mo. 42 25 9 2 2 3 2St. Paul, Minn. 44 34 6 2 - 2 4Wichita, Kans. 103 67 20 8 5 3 11
S. ATLANTIC 1,058 695 234 80 24 25 48Atlanta, Ga. 170 109 40 19 - 2 11Baltimore, Md. 159 98 44 15 1 1 7Charlotte, N.C. 92 72 12 4 1 3 5Jacksonville, Fla. 139 88 38 7 4 2 2Miami, Fla. 60 39 12 5 4 - 1Norfolk, Va. 32 20 4 4 1 3 -Richmond, Va. 49 35 9 2 2 1 4Savannah, Ga. 88 57 20 7 1 3 -St. Petersburg, Fla. 26 22 2 1 1 - 2Tampa, Fla. 131 88 25 10 5 3 12Washington, D.C. 100 62 22 6 4 6 4Wilmington, Del. 12 5 6 - - 1 -
E.S. CENTRAL 634 425 139 47 10 13 42Birmingham, Ala. 152 108 27 13 1 3 14Chattanooga, Tenn. 66 58 7 1 - - 5Knoxville, Tenn. 69 47 18 4 - - 1Lexington, Ky. 62 33 18 6 3 2 6Memphis, Tenn. 38 22 14 2 - - 1Mobile, Ala. 56 43 7 4 - 2 3Montgomery, Ala. 58 37 14 4 2 1 5Nashville, Tenn. 133 77 34 13 4 5 7
W.S. CENTRAL 1,283 818 320 82 33 29 74Austin, Tex. 70 45 12 11 1 1 5Baton Rouge, La. 61 44 13 2 1 1 3Corpus Christi, Tex. U U U U U U UDallas, Tex. 176 97 55 13 8 3 12El Paso, Tex. 59 42 14 2 - 1 4Ft. Worth, Tex. 95 63 22 5 2 3 5Houston, Tex. 346 206 96 20 14 9 12Little Rock, Ark. 73 41 25 4 1 2 4New Orleans, La. 53 34 13 4 2 - -San Antonio, Tex. 200 138 43 11 1 7 14Shreveport, La. 34 25 4 3 2 - 2Tulsa, Okla. 116 83 23 7 1 2 13
MOUNTAIN 873 608 167 58 20 20 64Albuquerque, N.M. 112 80 25 4 - 3 12Boise, Idaho 35 21 4 3 5 2 2Colo. Springs, Colo. 47 40 5 2 - - 3Denver, Colo. 65 35 14 9 2 5 5Las Vegas, Nev. 249 170 57 15 4 3 14Ogden, Utah 30 21 6 2 - 1 2Phoenix, Ariz. 64 41 12 7 3 1 6Pueblo, Colo. 34 26 5 1 1 1 1Salt Lake City, Utah 120 86 19 9 2 4 10Tucson, Ariz. 117 88 20 6 3 - 9
PACIFIC 1,159 801 239 76 17 24 87Berkeley, Calif. U U U U U U UFresno, Calif. U U U U U U UGlendale, Calif. 9 8 1 - - - 1Honolulu, Hawaii 56 45 8 2 1 - 2Long Beach, Calif. 92 57 21 8 1 5 8Los Angeles, Calif. 246 173 45 20 6 2 26Pasadena, Calif. 17 8 6 2 - 1 -Portland, Oreg. 84 49 23 7 2 1 4Sacramento, Calif. U U U U U U USan Diego, Calif. 132 94 22 12 1 3 10San Francisco, Calif. 99 68 25 3 - 3 14San Jose, Calif. 127 85 32 4 4 2 6Santa Cruz, Calif. 35 29 4 2 - - 6Seattle, Wash. 90 58 17 10 - 5 -Spokane, Wash. 54 41 9 2 2 - 5Tacoma, Wash. 118 86 26 4 - 2 5
TOTAL 9,605¶ 6,549 2,045 626 192 187 651

MMWR
The Morbidity and Mortality Weekly Report (MMWR) Series is prepared by the Centers for Disease Control and Prevention (CDC) and is available free of chargein electronic format and on a paid subscription basis for paper copy. To receive an electronic copy each week, send an e-mail message to [email protected]. Thebody content should read SUBscribe mmwr-toc. Electronic copy also is available from CDC’s World-Wide Web server at http://www.cdc.gov/mmwr or from CDC’sfile transfer protocol server at ftp://ftp.cdc.gov/pub/publications/mmwr. To subscribe for paper copy, contact Superintendent of Documents, U.S. GovernmentPrinting Office, Washington, DC 20402; telephone 202-512-1800.
Data in the weekly MMWR are provisional, based on weekly reports to CDC by state health departments. The reporting week concludes at close of business onFriday; compiled data on a national basis are officially released to the public on the following Friday. Address inquiries about the MMWR Series, including materialto be considered for publication, to Editor, MMWR Series, Mailstop E-96, CDC, 1600 Clifton Rd., N.E., Atlanta, GA 30333; telephone 888-232-3228.
All material in the MMWR Series is in the public domain and may be used and reprinted without permission; citation as to source, however, is appreciated.
All MMWR references are available on the Internet at http://www.cdc.gov/mmwr. Use the search function to find specific articles.
Use of trade names and commercial sources is for identification only and does not imply endorsement by the U.S. Department of Health and Human Services.
References to non-CDC sites on the Internet are provided as a service to MMWR readers and do not constitute or imply endorsement of these organizations ortheir programs by CDC or the U.S. Department of Health and Human Services. CDC is not responsible for the content of these sites. URL addresses listed inMMWR were current as of the date of publication.
✩U.S. Government Printing Office: 2005-733-116/00065 Region IV ISSN: 0149-2195
1222 January 7, 2005