
Mood Detection and memory performance evalua - IARIA · Slide 2 JJ1 Mood detectors can be found in...
29
MOOD DETECTION AND MEMORY PERFORMANCE EVALUATION WITH BODY SENSORS Jonathan Bohbot Prof.Zeljko Zilic McGill University McGill University j[email protected] z[email protected]
Transcript of Mood Detection and memory performance evalua - IARIA · Slide 2 JJ1 Mood detectors can be found in...

MOOD DETECTION ANDMEMORY PERFORMANCEEVALUATION WITH BODYSENSORS
Jonathan Bohbot Prof.Zeljko Zilic
McGill University McGill University

Mood Detectors
They can be found inmodern computers,
laptops,smartphones, skin
sensors, voice sensors,and more.
They can be carriedeverywhere and
accessed anytime.
They feature lowercosts, high speed,
low powerconsumption, etc.
JJ1

Slide 2
JJ1 Mood detectors can be found in modern computers, laptops, smartphones, skin sensors, voice sensors, and more. They can be carried everywhere and accessed anytime.They feature low costs, high speed, low power consumption, etc. They can be integrated in our daily lives to analyze mood and save lives.Jonathan Jonathan, 2/26/2017

THE SYSTEM
The system requiresBLE to work
Mood is measuredusing brain and
heart sensors, so it isvery accurate
Mood data anduser data is sent to
the web on aDropbox web
server, which is safe
Mood data can becompared
between users
Mood data foreach user can be
graphed
JJ2

Slide 3
JJ2 The system is an Android application written in Android Studio which is connected to body sensors communicating with it via Bluetooth Low Energy. The system requiresBLE to work. Mood is measured using brain and heart sensors, so it is very accurate. Mood data and user data is sent to the web on a Dropbox web server, which is safeand secure. Mood data can be compared between users. Mood data for each user is graphed, so it makes it easy for the user to compare his/her mood on a daily basis.Jonathan Jonathan, 2/26/2017
BACKGROUND
Mood and MemoryPerformance
AlgorithmsData Processing Resting Heart Rate
Heart RateVariability
Valence/ArousalModel
JJ3

Slide 4
JJ3 The background is composed of the following sections: Mood and Memory Performance Algorithms, Data Processing, Resting Heart Rate, Heart Rate Variability, and theValence/Arousal Model.Jonathan Jonathan, 2/26/2017

ALGORITHMS AND DATA PROCESSING
Algorithms
Record Resting HR
Record HRV
Process EEG Data
Data Processing
DC Offset Removed
Tapered Window Function
Fast Fourier Transform
JJ4

Slide 5
JJ4 First, we record the resting HR of the participants. Second, we record the heart rate variability of the participants. Third, we process the EEG data using the proceduresdescribed in the next subsections. Data processing works as follows: we remove the DC offset and slow drift of the raw signal. The data segment is then multiplied by atapered window function. The FFT algorithm is then executed.Jonathan Jonathan, 2/26/2017

RESTING HR AND HRV
Resting HR
60-100 bpm
<60 bpm
>100 bpm
HRV
SDNN
RMS-SD
MRR
JJ5
Slide 6
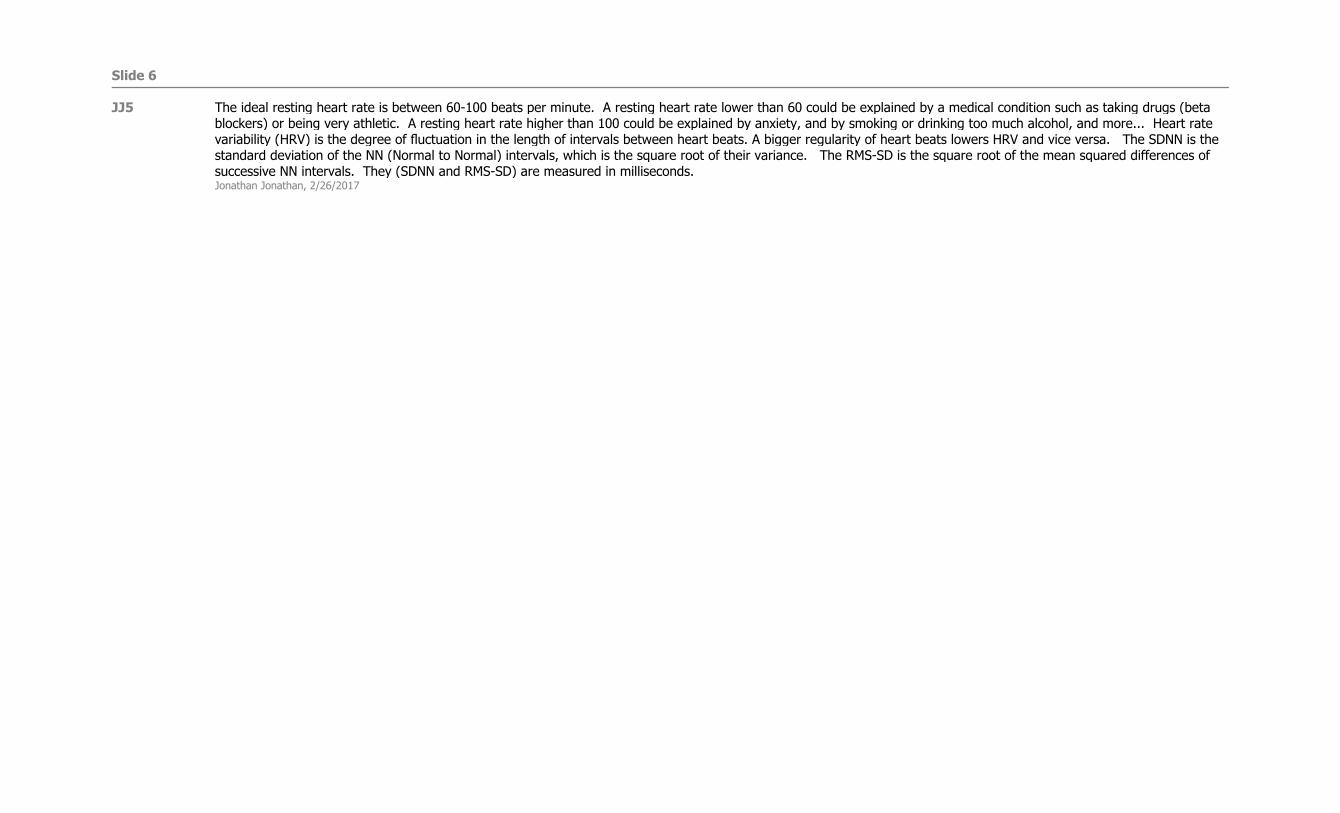
JJ5 The ideal resting heart rate is between 60-100 beats per minute. A resting heart rate lower than 60 could be explained by a medical condition such as taking drugs (betablockers) or being very athletic. A resting heart rate higher than 100 could be explained by anxiety, and by smoking or drinking too much alcohol, and more... Heart ratevariability (HRV) is the degree of fluctuation in the length of intervals between heart beats. A bigger regularity of heart beats lowers HRV and vice versa. The SDNN is the standard deviation of the NN (Normal to Normal) intervals, which is the square root of their variance. The RMS-SD is the square root of the mean squared differences ofsuccessive NN intervals. They (SDNN and RMS-SD) are measured in milliseconds.Jonathan Jonathan, 2/26/2017

VALENCE/AROUSAL MODEL
Valence/ArousalModel
2D Valence/Arousal Model
Arousal Level
Valence Level
JJ6

Slide 7
JJ6 The 2D Valence/Arousal model is used to characterize emotions such as: happy, sad, relaxed, and angry. Emotions are characterized based on their valence and arousalvalues. High arousal (excitation) is characterized by a high alpha power and a low beta power (a high alpha activity and a low beta activity). The ratio of the beta to thealpha power characterizes the arousal level of a person (Arousal = beta/alpha). To determine the valence level, we compare the activation levels of the two corticalhemispheres. Left frontal inactivation is an indicator of a withdrawal response, which is often linked to a negative emotion. On the other hand, right frontal inactivation maybe associated with an approach response, or positive emotion.Jonathan Jonathan, 2/26/2017
EXPERIMENTAL STUDY
The SystemSubjects and
StimulusTesting Procedure
Results Discussion
JJ7

Slide 8
JJ7 The experimental study consists of the system, the subjects and stimulus, the testing procedure, the results, and the discussion.Jonathan Jonathan, 2/26/2017

THE SYSTEM, SUBJECTS, AND STIMULUS
The System
External Sensors
Cloud
Subjects and Stimulus
16 Subjects: 12 M/4 F
Pictures and Music
Neural Brain Activity
JJ8

Slide 9
JJ8 The system is composed of external sensors, such as the Texas Instrument Sensor Tag, the Polar H7 heart rate sensor, and the Emotiv Insight brain sensor. The Cloud,where the Dropbox Core Api is used to store the users’ data and access it anytime needed. Sixteen subjects (ages 22-80, 12 males and 4 females) performed theexperiment,whichconsisted in evaluating their mood and memory performance levels while their heart and brain data was recorded. Both pictures and music were used tobe the stimulus to elicit emotion. This procedure achieved stimulation by increasing and decreasing the neural activity of the brain.Jonathan Jonathan, 2/26/2017

TESTING PROCEDURE
Mood Detection
Polar H7 and Emotiv
Resting HR Recorded
Stimulus
Memory Evaluation
3 Sets of 4-6 Letters
3 Probes
Emotiv
JJ9JJ10

Slide 10
JJ9 Jonathan Jonathan, 2/26/2017
JJ10 When relaxed, the participant’s resting heart rate was recorded. Then, for each stimulus composed of pictures and sounds (each representing a particular mood such asrelaxed, engaged, stressed, happy, angry, aroused, and sad) which was displayed on a laptop screen, the data was recorded on a tablet before evoking the stimulus, thestimulus was evoked, and the data was recorded on a tablet after evoking the stimulus. At the end of each stimulus, there was a relaxation period of 1 minute. The first partof the experiment took 35 minutes. In the second part of the experiment, the subject was first given a 1-minute resting period. The memory test was given immediately afterward, and the test subject’s memory performance level was recorded. For the memory test, the participant was shown three sets of 4-6 letters displayed on a laptopscreen. After being shown each set of letters, the participant was given a brief moment (2-5 seconds) to memorize the set of letters. The participant was then shown aletter which may or may not be part of the set of letters previously shown to him/her. The participant was asked to state whether or not this letter belongs to the set ofletters. There were three sets of letters and three probes in the memory experiment. EEG data was recorded twice per set of letters: before showing the set of letters to theparticipant and just after showing the set of letters to the participant while he/she was busy memorizing them. The second part of the experiment took 10 minutes.Jonathan Jonathan, 2/26/2017
RESULTS
Results Temperature, humidity, and air pressure recorded
Relaxed, seated, with minimum head movement
Mood/Memory Level
JJ11
Slide 11
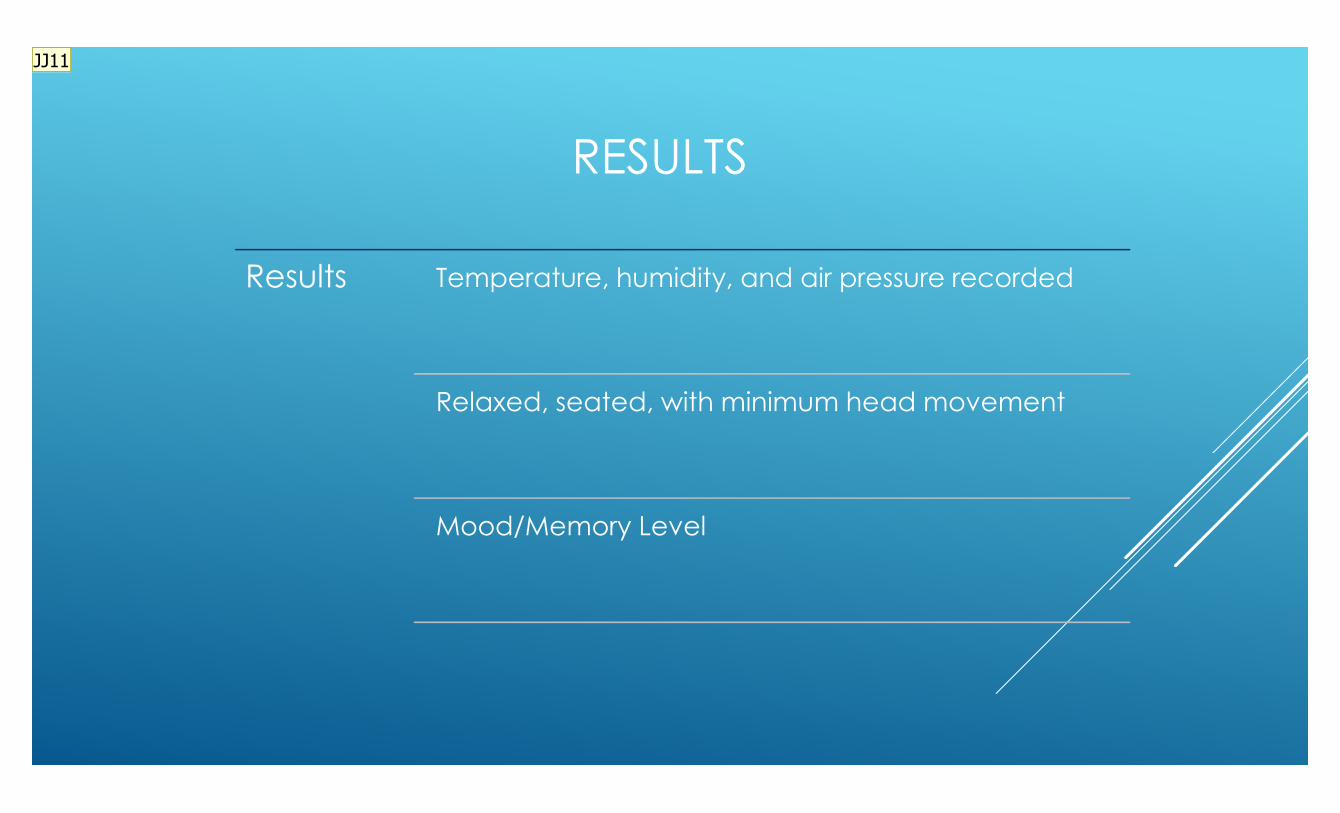
JJ11 Results were gathered from the participants’ brain and heart data under the following environmental conditions: the temperature ranged from 60.28 deg/F to 67.57 deg/F,the humidity ranged from 32.25 %rH to 48.18 %rH, and the pressure ranged from 999.70 nPA to 1032.32 nPA. All participants confirmed that they were relaxed at the beginning of the experiment. All participants remained seated and did not move their heads for the entire duration of the experiment. Mood and memory performancelevels are in percent. A mood level of 0% suggests that the participant is not feeling at all in that particular mood, and a mood level of 100% suggests that theparticipant is feeling very strongly in that particular mood. A memory performance level close to 100% may be associated with strong memory activity, whereas a very lowmemory performance level, approaching 0%, may be associated with no memory activity.Jonathan Jonathan, 2/26/2017

DISCUSSION
Mood Detection
Younger relax more quicklythan older
Taller relax more quicklythan shorterTaller and younger relaxmore quickly than shorterand older
Memory Evaluation
Positive memory activity forthe majority of participants
81% success rate
Head hair and thickness ofscalp account for EEGsignal loss
JJ12JJ17

Slide 12
JJ12 Mood Detection: the results reveal that the ability of the participants to relax quickly in response to a conducive stimulus is greater for younger individuals than for olderones. Also, taller participants are better able to relax quickly than shorter participants. In general, taller and younger participants are better able to relax quickly thanshorter and older participants. Memory Evaluation: the first, second, and third trial memory performance levels before and after memorizing the set of letters for each participant show that the experiment has been successful at raising the memory performance levels of the participants. Almost all participants had higher memoryperformance levels after memorizing the set of letters as compared to before memorizing the set of letters which is associated with positive memory activity. The successrates of all trials are 81%. Head hair and thickness of scalp account for EEG signal loss.Jonathan Jonathan, 2/26/2017
JJ17 the majority of tall participants (those with height ranging from 175 to 185 cm) are 20 to 30 years old (7 participants with heights ranging from 175 to 185 cm versus 2participants with the same height range who are 50 to 70 years old). The results mean that in general taller and younger participants are better able to relax quickly thanshorter and older participants.Jonathan Jonathan, 2/26/2017

DISCUSSION - MOOD GRAPHSJJ13JJ14

Slide 13
JJ13 Top left graph: about 56% of all participants had a higher relaxation level after the stimulus as compared to before the stimulus. The 44% remaining participants werefound to have varying reactions when exposed to such stimulus: some of the 44% may have had other thoughts or emotions during the experiment, and may have beenpreoccupied with other matters, thereby negating any effect of the relaxation stimulus on them. Another problem potentially accounting for the variation in results is the factthat the brain sensor’s EEG data had to travel from the brain cortex to the electrodes of the brain sensor. During its travel, the signal may have been attenuated ordampened as a result of traveling through many brain regions. Thus, the quality of the signal using this method is not optimal, and results in a lower-quality EEG signal.Top right graph: thegraphrevealsthatalmostallparticipantshad positive or neutral changes in relaxation levels and that mostparticipants with the greatest positive changes in relaxation levels (higher than 40%) are the younger participants, those aged 22 to 30. The older population, those aged40 to 80, had the most participants with negative changes in relaxation levels (3 participants aged 50-80 versus 1 participant aged 26). The results reveal that the ability ofthe participants to relax quickly in response to a conducive stimulus is greater for younger individuals than for older ones. Bottom left graph: The change in relaxation levelwas plotted against the height of all participants. The results reveal that the tallest individuals (heights ranging from 175 to 185 cm) had the majority of valuescorresponding to the highest changes (higher than 40%) in relaxation levels (5 individuals with heights ranging from 175 to 185 cm versus 1 individual with a height of 165cm). The participants with all values corresponding to negative changes in relaxation levels are the shortest individuals (4 individuals with heights ranging from 165 to 175cm). The results mean that taller participants are better able to relax quickly than shorter participantsJonathan Jonathan, 2/26/2017
JJ14 The graph showing the change in relaxation level against the weight of participants reveals that the majority of individuals with the greatest changes in relaxation levels arethose with weights ranging from 60-90 kg. The graph also shows that the individuals from the same weight range have all values associated with negative changes inrelaxation levels. Therefore, the results stating that participants with a weight range of 60-90 kg are better able to relax quickly than the other participants are inconclusiveJonathan Jonathan, 2/26/2017
DISCUSSION – MEMORY GRAPHS
JJ15

Slide 14
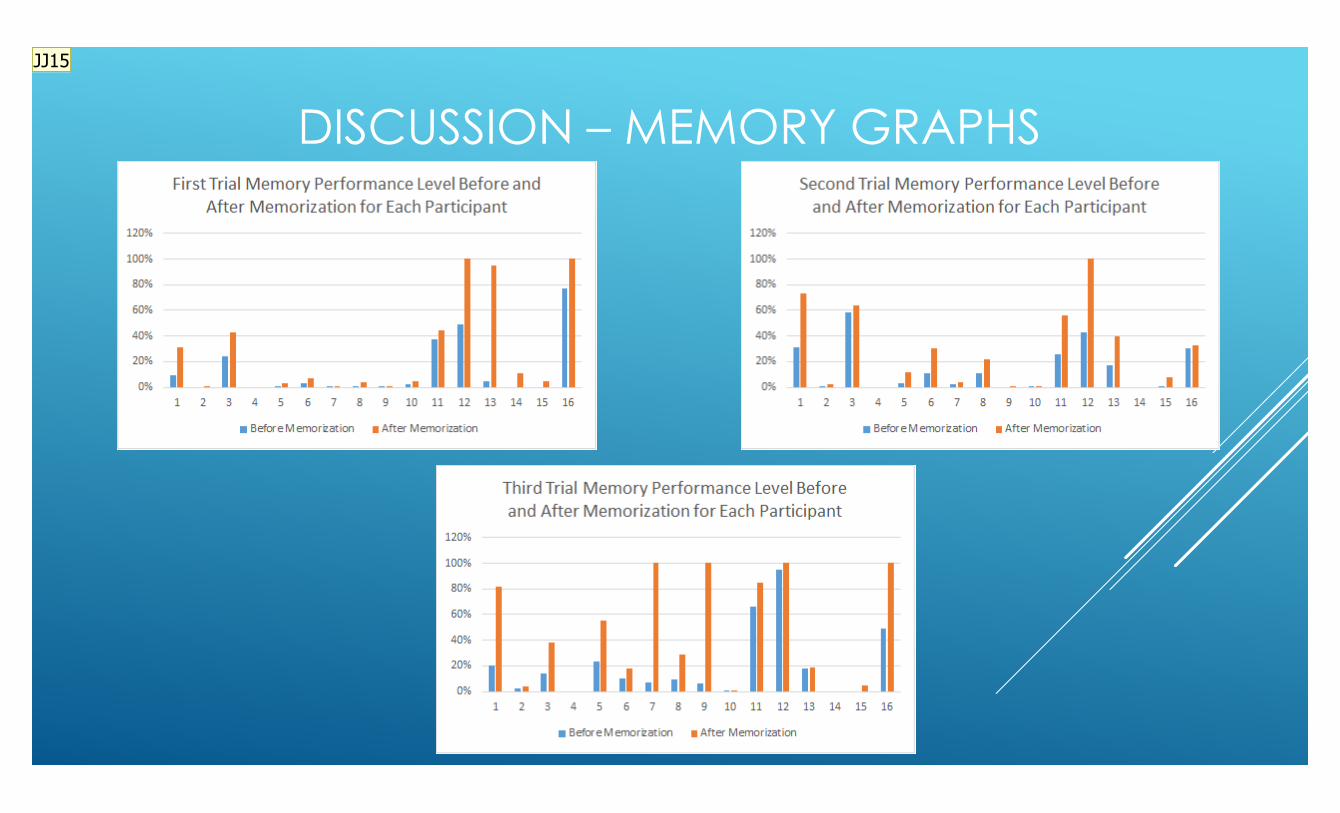
JJ15 The first, second, and third trial memory performance levels before and after memorizing the set of letters for each participant show that the experiment has been successful at raising the memory performance levels of the participants. Almost all participants had higher memory performance levels after memorizing the set of letters ascompared to before memorizing the set of letters which is associated with positive memory activity. The success rates of all trials are 81%. The 19% remaining participantsfor each trial had memory performance levels lower or equal after memorizing the set of letters as compared to before memorizing the set of letters. An explanation of thevariation in results is the fact that the brain sensor’s EEG data had to travel from the brain cortex to the electrodes of the brain sensor. During its travel, the signal may havebeen attenuated or dampened as a result of traveling through many brain regions before reaching the brain sensor’s electrodes. It is very likely that the more head hair aparticipant had, the more attenuated or dampened the signal was when reaching the electrodes of the brain sensor.Jonathan Jonathan, 2/26/2017

CONCLUSION
Skin and infrared sensors
fMRI and MEG
Disciplines affected: biomedicine,computer engineering, and more.
JJ16

Slide 15
JJ16 Skin and infrared sensors could be used to increase the accuracy of mood detection. To evaluate memory, we could use more sophisticated devices such as fMRI(Functional Magnetic Resonance Imaging) and MEG (Magnetoencephalography) to get a better view of brain activity. In order to acquire such devices, experience andfunding would be required. We hope that our contribution can make difference in many fields of study, especially in computer engineering, biomedicine, mental health and other medical specialties.Jonathan Jonathan, 2/26/2017