
Monthly Report July 2017 - bsp-southpool.com · (BSP website) Day-Ahead Volumes and Prices ... 641...
4
For informational purposes only. Monthly Report – July 2017 Record trading month on MI Auctions – 57 GWh Total trading volume for July reached 594 GWh A 19% Y/Y increase in trading volume for the first 7 months July Overall Day-Ahead Further Day-Ahead Auction Info. (BSP website) Further Intraday Trading info. (BSP website) Day-Ahead Volumes and Prices Intraday Daily Volumes Total 513.745 ▲ 3,4% Max. Daily Min. Daily Spec. Daily Volatility Avg. daily 16.572 ▲ 0,0% Base 50,00 ▲13,0% 66,79 31,67 7,7% Max. daily 20.356 ▼ 11,8% Euro-Peak 55,89 ▲12,7% 83,49 32,96 11,6% Min. daily 12.323 ▲ 0,0% Avg. Daily Volume (MWh) Price (€/MWh) MI2 45.876 ▲ 35,2% 49,84 ▲ 13,5% MI6 11.279 ▲ 10,1% 50,64 ▲ 12,7% Continuous 23.037 ▲ 71,9% / Volume (MWh) Avg. Price (€/MWh) Intraday
Transcript of Monthly Report July 2017 - bsp-southpool.com · (BSP website) Day-Ahead Volumes and Prices ... 641...

For informational purposes only.
Monthly Report – July 2017
Record trading month on MI Auctions – 57 GWh
Total trading volume for July reached 594 GWh
A 19% Y/Y increase in trading volume for the first 7 months
July Overall
Day-Ahead
Further Day-Ahead Auction Info. (BSP website)
Further Intraday Trading info. (BSP website)
Day-Ahead Volumes and Prices
Intraday Daily Volumes
Total 513.745▲ 3,4% Max. Daily Min. Daily Spec. Daily Volatility
Avg. daily 16.572▲ 0,0% Base 50,00▲13,0% 66,79 31,67 7,7%
Max. daily 20.356▼ 11,8% Euro-Peak 55,89▲12,7% 83,49 32,96 11,6%
Min. daily 12.323▲ 0,0%
Avg. Daily
Volume (MWh) Price (€/MWh)
MI2 45.876 ▲ 35,2% 49,84▲ 13,5%
MI6 11.279 ▲ 10,1% 50,64▲ 12,7%
Continuous 23.037 ▲ 71,9% /
Volume (MWh) Avg. Price (€/MWh)
Intraday

For informational purposes only.
Day-Ahead further info.
Daily volatility of base price
Day-Ahead Auction
Average Hourly Prices
Cross-Zonal Capacities
Daily Volatility of Base Price
Methodology used for calculation of volatility.
MI2 & MI6 Implicit Auctions
Allocated CZC Values on Slovenian-Italian Border Cross-Zonal-Capacities
Read more about European Pilot Project
Implicit Intraday Auctions (MI2 & MI6)
Intraday Continuous Trading
Volumes by Products
Hour (AM) 1 2 3 4 5 6 7 8 9 10 11 12
Volume (MWh) 641 630 640 634 616 642 610 621 675 731 726 749
Base price (€/MWh) 44,13 40,46 36,72 34,81 35,05 36,79 42,21 49,49 54,73 56,64 55,50 56,55
Hour (PM) 13 14 15 16 17 18 19 20 21 22 23 24
Volume (MWh) 786 766 766 765 753 724 691 702 695 706 702 599
Base price (€/MWh) 56,00 55,89 56,44 57,30 56,29 54,95 54,57 55,78 56,18 57,02 50,60 45,89
Total
Offered (MWh) 359.273 469.480 996.308 115.592 1.940.653
Allocated (MWh) 114.770 150.896 1.203 106.912 373.781
% Allocated 31,95% 32,14% 0,12% 92,49% /
SI→AT AT→SISI→IT IT→SI
Offered (MWh)
Allocated (MWh)
% Allocated 4,37% 8,65% /
SI-IT IT-SI Total
395.398
17.279
251.794
21.790
647.192
39.069
For informational purposes only.
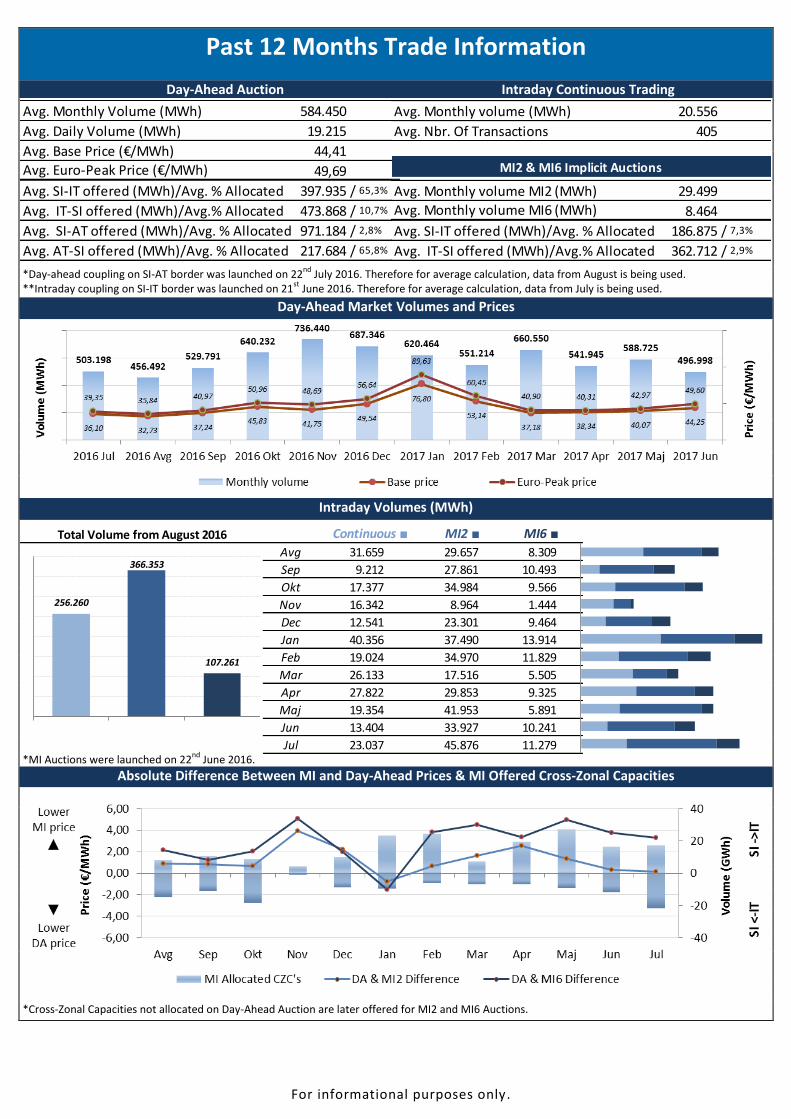
Past 12 Months Trade Information
Day-Ahead Auction Intraday Continuous Trading
*Day-ahead coupling on SI-AT border was launched on 22nd
July 2016. Therefore for average calculation, data from August is being used. **Intraday coupling on SI-IT border was launched on 21
st June 2016. Therefore for average calculation, data from July is being used.
Day-Ahead Market Volumes and Prices
Intraday Volumes (MWh)
*MI Auctions were launched on 22
nd June 2016.
Absolute Difference Between MI and Day-Ahead Prices & MI Offered Cross-Zonal Capacities
*Cross-Zonal Capacities not allocated on Day-Ahead Auction are later offered for MI2 and MI6 Auctions.
Avg. Monthly Volume (MWh) 584.450
Avg. Daily Volume (MWh) 19.215
Avg. Base Price (€/MWh) 44,41
Avg. Euro-Peak Price (€/MWh) 49,69
Avg. SI-IT offered (MWh)/Avg. % Allocated 397.935 / 65,3%
Avg. IT-SI offered (MWh)/Avg.% Allocated 473.868 / 10,7%
Avg. SI-AT offered (MWh)/Avg. % Allocated 971.184 / 2,8%
Avg. AT-SI offered (MWh)/Avg. % Allocated 217.684 / 65,8%
Avg. Monthly volume (MWh) 20.556
Avg. Nbr. Of Transactions 405
Avg. Monthly volume MI2 (MWh) 29.499
Avg. Monthly volume MI6 (MWh) 8.464
Avg. SI-IT offered (MWh)/Avg. % Allocated 186.875 / 7,3%
Avg. IT-SI offered (MWh)/Avg.% Allocated 362.712 / 2,9%
MI2 & MI6 Implicit Auctions
Avg 31.659 29.657 8.309
Sep 9.212 27.861 10.493
Okt 17.377 34.984 9.566
Nov 16.342 8.964 1.444
Dec 12.541 23.301 9.464
Jan 40.356 37.490 13.914
Feb 19.024 34.970 11.829
Mar 26.133 17.516 5.505
Apr 27.822 29.853 9.325
Maj 19.354 41.953 5.891
Jun 13.404 33.927 10.241
Jul 23.037 45.876 11.279
Total Volume from August 2016 Continuous ■ MI2 ■ MI6 ■
256.260
366.353
107.261

For informational purposes only.
BSP Energy Exchange LL C Dunajska 156 SI-1000 Ljubljana Slovenija
+386 1 620 76 76
+386 1 620 76 77
www.bsp-southpool.com