Monthly Bulletin October 2009 - European Central Bank · 0812009 0912009 1012009 1112009 1212009...
227
EUROPEAN CENTRAL BANK MONTHLY BULLETIN EN 1012009 0112009 0212009 0312009 0412009 0512009 0612009 0712009 0812009 0912009 1012009 1112009 1212009 MONTHLY BULLETIN OCTOBER
Transcript of Monthly Bulletin October 2009 - European Central Bank · 0812009 0912009 1012009 1112009 1212009...

EURO
PEAN
CEN
TRAL
BAN
K
MO
NTH
LY B
ULL
ETI
NEN
1012
009 0112009
02120090312009041200905120090612009071200908120090912009101200911120091212009
MONTHLY BULLET INOCTOBER
MONTHLY BULLET IN
OCTOBER 2009
In 2009 all ECB publications
feature a motif taken from the
€200 banknote.

© European Central Bank 2009
Address Kaiserstrasse 29
60311 Frankfurt am Main
Germany
Postal address Postfach 16 03 19
60066 Frankfurt am Main
Germany
Telephone +49 69 1344 0
Website http://www.ecb.europa.eu
Fax +49 69 1344 6000
This Bulletin was produced under the responsibility of the Executive Board of the ECB. Translations are prepared and published by the national central banks.
All rights reserved. Reproduction for educational and non-commercial purposes is permitted provided that the source is acknowledged.
The cut-off date for the statistics included in this issue was 7 October 2009.
ISSN 1561-0136 (print)
ISSN 1725-2822 (online)

3ECB
Monthly Bulletin
October 2009
EDITORIAL 5
ECONOMIC AND MONETARY
DEVELOPMENTS
The external environment of the euro area 9
Monetary and fi nancial developments 14
Prices and costs 37
Output, demand and the labour market 45
Exchange rate and balance of payments
developments 56
Boxes:
L1 oans to the non-fi nancial private sector
over the business cycle in the euro area 18
The results of the fi rst round of the 2
“Survey on the access to fi nance
of small and medium-sized enterprises
in the euro area” 33
Recent trends in the HICP excluding 3
food and energy 39
The effects of vehicle scrapping 4
schemes across euro area countries 46
Links between output and 5
unemployment in the euro area 52
ARTICLES
Monetary policy and loan supply
in the euro area 63
Recent developments in the balance
sheets of the Eurosystem, the Federal
Reserve System and the Bank of Japan 81
Financial development in emerging
economies – stock-taking and policy
implications 95
EURO AREA STATISTICS S1
ANNEXES
Chronology of monetary policy
measures of the Eurosystem I
Documents published by the European
Central Bank since 2008 V
Glossary XI I I
CONTENTS

4ECB
Monthly Bulletin
October 2009
ABBREVIATIONS
COUNTRIES LU Luxembourg
BE Belgium HU Hungary
BG Bulgaria MT Malta
CZ Czech Republic NL Netherlands
DK Denmark AT Austria
DE Germany PL Poland
EE Estonia PT Portugal
IE Ireland RO Romania
GR Greece SI Slovenia
ES Spain SK Slovakia
FR France FI Finland
IT Italy SE Sweden
CY Cyprus UK United Kingdom
LV Latvia JP Japan
LT Lithuania US United States
OTHERS
BIS Bank for International Settlements
b.o.p. balance of payments
BPM5 IMF Balance of Payments Manual (5th edition)
CD certifi cate of deposit
c.i.f. cost, insurance and freight at the importer’s border
CPI Consumer Price Index
ECB European Central Bank
EER effective exchange rate
EMI European Monetary Institute
EMU Economic and Monetary Union
ESA 95 European System of Accounts 1995
ESCB European System of Central Banks
EU European Union
EUR euro
f.o.b. free on board at the exporter’s border
GDP gross domestic product
HICP Harmonised Index of Consumer Prices
HWWI Hamburg Institute of International Economics
ILO International Labour Organization
IMF International Monetary Fund
MFI monetary fi nancial institution
NACE Rev. 1 Statistical classifi cation of economic activities in the European Community
NCB national central bank
OECD Organisation for Economic Co-operation and Development
PPI Producer Price Index
SITC Rev. 4 Standard International Trade Classifi cation (revision 4)
ULCM unit labour costs in manufacturing
ULCT unit labour costs in the total economy
In accordance with Community practice, the EU countries are listed in this Bulletin using the alphabetical order of the country names in the national languages.

5ECB
Monthly Bulletin
October 2009
On the basis of its regular economic and
monetary analyses, the Governing Council
decided at its meeting on 8 October 2009 to
leave the key ECB interest rates unchanged.
The current rates remain appropriate.
The incoming information and analyses since the
last meeting in early September have confi rmed
the Governing Council’s previous assessment.
While annual HICP infl ation was still slightly
negative in September, according to Eurostat’s
fl ash estimate, it is expected to turn positive
again in the coming months and to remain at
moderately positive rates over the policy-relevant
horizon. At the same time, the latest information
further supports the Governing Council’s view
that the euro area economy is stabilising and is
expected to recover at a gradual pace. However,
uncertainty remains high. As regards medium to
longer-term infl ation expectations, they remain
fi rmly anchored in line with the Governing
Council’s aim of keeping infl ation rates
below, but close to, 2% over the medium term.
The outcome of the monetary analysis confi rms
the assessment of low infl ationary pressure over
the medium term, as money and credit expansion
continues to moderate. Against this background,
the Governing Council expects price stability to
be maintained over the medium term, thereby
supporting the purchasing power of euro area
households.
With regard to the economic analysis, available
survey indicators continue to signal an ongoing
stabilisation of economic activity. In particular,
the euro area should benefi t from a recovery in
exports, the signifi cant macroeconomic stimulus
under way and the measures taken to restore the
functioning of the fi nancial system. In addition,
following the substantial negative contributions
in the fi rst half of 2009, the inventory cycle is
expected to contribute positively to real GDP
growth in the second half of the year. However,
uncertainty remains high and the volatility in
incoming data warrants a cautious interpretation
of the available information. Overall, the
recovery is expected to remain rather uneven. It
will be supported in the short term by a number
of temporary factors but is likely to be affected
over the medium term by the process of ongoing
balance sheet correction in the fi nancial and the
non-fi nancial sector of the economy, both inside
and outside the euro area.
In the view of the Governing Council, the
risks to this outlook remain broadly balanced.
On the upside, there may be stronger than
anticipated effects stemming from the extensive
macroeconomic stimulus being provided and
from other policy measures taken. Confi dence
may also improve more quickly, the labour
market deterioration may be less marked
than previously expected and foreign demand
may prove to be stronger than projected.
On the downside, concerns remain relating
to a stronger or more protracted negative
feedback loop between the real economy and
the fi nancial sector, renewed increases in oil and
other commodity prices, the intensifi cation of
protectionist pressures and the possibility of a
disorderly correction of global imbalances.
With regard to price developments, annual
HICP infl ation stood at -0.3% in September,
according to Eurostat’s fl ash estimate,
compared with -0.2% in August. The current
negative infl ation rates are in line with
previous expectations and refl ect largely
base effects resulting from the movements
in global commodity prices a year ago. Also
owing to base effects, annual infl ation rates are
projected to turn positive again in the coming
months. Thereafter, over the policy-relevant
horizon, infl ation is expected to remain in
positive territory, with overall price and cost
developments staying subdued refl ecting
ongoing sluggish demand in the euro area and
elsewhere. In this context, it is important to
re-emphasise that infl ation expectations over
the medium to longer term remain fi rmly
anchored in line with the Governing Council’s
aim of keeping infl ation rates below, but close
to, 2% over the medium term.
Risks to this outlook remain broadly balanced.
They relate, in particular, to the outlook for
economic activity and to the evolution of
commodity prices. Furthermore, increases in
indirect taxation and administered prices may
EDITORIAL

6ECB
Monthly Bulletin
October 2009
be stronger than currently expected owing to
the need for fi scal consolidation in the coming
years.
Turning to the monetary analysis, the latest data
confi rm that developments in broad money and
credit growth remain subdued. In August, the
annual growth of M3 and loans to the private
sector declined further to historically low rates
of 2.5% and 0.1% respectively. This parallel
deceleration in money and credit growth
confi rms the Governing Council’s previous
assessment of a moderate underlying pace
of monetary expansion and low infl ationary
pressures over the medium term.
The ongoing deceleration in annual M3 growth
has continued to be accompanied by a
strengthening in annual M1 growth, which in
August rose further to 13.6%. The strength of M1
refl ects the fact that narrower spreads between
the rates on different short-term deposits have
fostered shifts in the allocation of funds from,
in particular, short-term time deposits to overnight
deposits. At the same time, the steep slope of the
yield curve may have supported shifts from M3 to
longer-term deposits and securities outside M3.
The overall fl ow of bank loans to the
non-fi nancial private sector remained subdued
in August. In the case of households, the latest
data suggest that the decline in loan growth has
been levelling off at low rates of expansion.
In the case of non-fi nancial corporations,
following a few months of negative fl ows,
the fl ow of loans was again slightly positive
in August. Looking through the volatility in
monthly data, loan growth continues to be very
subdued. This is in line with the lag that normally
prevails between trends in economic activity
and developments in loans to enterprises. In this
respect, given the subdued levels of production
and trade, as well as the ongoing uncertainty
with regard to the business outlook, further
weak developments in loans to non-fi nancial
corporations in the coming months appear likely.
At the same time, the ongoing improvement in
fi nancing conditions should support the demand
for credit in the period ahead. Against the
background of highly demanding challenges,
banks should take appropriate measures to
strengthen further their capital bases and, where
necessary, take full advantage of government
measures to support the fi nancial sector,
particularly as regards recapitalisation.
To sum up, the current rates remain appropriate.
The incoming information and analyses since its
last meeting in early September have confi rmed
the Governing Council’s previous assessment.
While annual HICP infl ation was still slightly
negative in September, according to Eurostat’s
fl ash estimate, it is expected to turn positive
again in the coming months and to remain at
moderately positive rates over the policy-relevant
horizon. At the same time, the latest information
further supports the Governing Council’s view
that the euro area economy is stabilising and is
expected to recover at a gradual pace. However,
uncertainty remains high. As regards medium to
longer-term infl ation expectations, they remain
fi rmly anchored in line with the Governing
Council’s aim of keeping infl ation rates below,
but close to, 2% over the medium term. Cross-
checking the outcome of the economic analysis
with that of the monetary analysis confi rms the
assessment of low infl ationary pressure over the
medium term, as money and credit expansion
continues to moderate. Against this background,
the Governing Council expects price stability to
be maintained over the medium term, thereby
supporting the purchasing power of euro area
households.
As the transmission of monetary policy works
with lags, the Governing Council expects
that its policy action will progressively feed
through to the economy in full. Hence, with
all the measures taken, including the latest
12-month longer-term refi nancing operation
of 30 September, monetary policy is providing
strong ongoing support to the economy. Once
the macroeconomic environment improves,
the Governing Council will make sure that the
measures taken are unwound in a timely fashion
and that the liquidity provided is absorbed
in order to counter effectively any threat to
price stability over the medium to longer term.

7ECB
Monthly Bulletin
October 2009
EDITORIAL
By so doing, the Governing Council will
continue to ensure a fi rm anchoring of medium-
term infl ation expectations. Such anchoring is
indispensable to supporting sustainable growth
and employment and contributing to fi nancial
stability. Accordingly, the Governing Council
will continue to monitor very closely all
developments over the period ahead.
As regards fi scal policies, the need for ambitious
and realistic fi scal exit and consolidation
strategies is becoming increasingly pressing.
It is vital that governments put in place
concrete structural measures and convincingly
communicate that they are committed to
ensuring the sustainability of public fi nances.
Governments should design their consolidation
plans in line with the provisions of the Stability
and Growth Pact, ensuring that consolidation
starts as soon as possible and at the latest when
the recovery takes hold. These plans should also
be accompanied by a strengthening of national
budgetary frameworks. Consolidation efforts
should be stepped up in 2011 and will need to
exceed signifi cantly the benchmark of 0.5% of
GDP per annum set in the Stability and Growth
Pact. In countries with high defi cit and/or debt
ratios, the annual structural adjustment should
reach at least 1% of GDP. In view of the rapidly
increasing public expenditure ratios, as well as
projected further expenditure pressures owing to
higher interest burdens and ageing-related costs,
countries’ structural measures should focus on
the expenditure side.
Turning to structural reforms, in all countries
more efforts are crucial to support sustainable
growth and employment as it is likely that the
fi nancial crisis has affected the productive
capacity of the euro area economies. In
particular, appropriate wage-setting, suffi cient
labour market fl exibility and effective incentives
to work are required. At the same time, policies
that enhance competition and innovation are
urgently needed to speed up restructuring
and investment and to create the business
opportunities and productivity gains needed
to ensure a sustained recovery. An appropriate
restructuring and consolidation of the banking
sector should also play an important role. Sound
balance sheets, sound risk management, and
transparent as well as robust business models
are key to strengthening the fi nancial soundness
of banks and their resilience to shocks, thereby
laying the foundations for sustainable economic
growth and fi nancial stability.
This issue of the Monthly Bulletin contains
three articles. The fi rst article reviews monetary
policy and loan supply in the euro area. The
second article presents recent developments in
the balance sheets of the Eurosystem, the Federal
Reserve System and the Bank of Japan. The
third article addresses fi nancial development in
emerging economies and policy implications.


9ECB
Monthly Bulletin
October 2009
ECONOMIC AND MONETARYDEVELOPMENTS
The external
environment
of the euro area
Latest indicators are increasingly suggesting that the signifi cant contraction in economic activity has come to an end, notably in major emerging economies as well as in a number of advanced economies. At the same time, global infl ation rates remain low, owing to base effects related to commodity prices and substantial spare capacity. While uncertainty is still high, risks to the global economic outlook are viewed to be broadly balanced.
1.1 DEVELOPMENTS IN THE WORLD ECONOMY
Latest indicators are increasingly suggesting
that the signifi cant contraction in economic
activity has come to an end, notably in major
emerging economies as well as in a number of
advanced economies. In September, the global
Purchasing Managers’ Index (PMI) posted its
highest reading since December 2007, pointing
to an expansion in global economic activity.
Output in the manufacturing sector continued to
grow faster than in the services sector, although
it rose at a slower pace than in the previous
month.
Global infl ation rates remain low, owing to
base effects related to commodity prices and
substantial spare capacity. The headline CPI
in OECD countries fell by 0.3% in the year
to August 2009, compared with a fall of 0.6%
in July. Excluding food and energy, annual
CPI infl ation reached 1.5% in August 2009
(see Chart 1). As indicated by the global PMI input prices indices, purchase prices rose in the
manufacturing sector in September, while costs declined in the services sector.
UNITED STATES
In the United States, economic activity appears to have stabilised. According to revised estimates
by the Bureau of Economic Analysis, real GDP contracted by 0.7% in annualised terms in the
second quarter of 2009, less than previously estimated. The contraction in the second quarter,
which follows a much more pronounced fall of 6.4% in the fi rst quarter, was mostly due to negative
contributions from inventory investment, private fi xed investment and private consumption.
Government expenditure and decreasing imports contributed positively to growth in the second
quarter. Looking ahead, the outlook for GDP growth has been improving recently. While fi nancing
conditions remain tight and labour markets weak, recent data point to improvements in the housing
market and the manufacturing sector. Moreover, government stimulus measures continue to provide
substantial support to the economy.
As regards price developments, the US consumer price index declined by 1.5% in the year to
August 2009. This followed a decrease of 2.1% in the year to July. The negative headline infl ation
continues to be driven, for the most part, by the decline in energy prices compared with the previous
year. The annual rate of infl ation, excluding food and energy, reached 1.4% in August, down from
1.5% in July. Looking ahead, base effects related to energy prices will be gradually reversed over
ECONOMIC AND MONETARY DEVELOPMENTS
1 THE EXTERNAL ENVIRONMENT OF THE EURO AREA
Chart 1 International price developments
(monthly data; annual percentage changes)
-1
0
1
2
3
4
5
6
-1
0
1
2
3
4
5
6
2000 20011999 2002 2003 2004 2005 2006 2007 2008
OECD consumer prices (all items)
OECD consumer prices (all items excluding food
and energy)
Source: OECD.

10ECB
Monthly Bulletin
October 2009
the months to come and headline infl ation rates are likely to return to positive territory. However,
economic slack is expected to limit the upward pressure on prices.
On 23 September 2009 the US Federal Open Market Committee (FOMC) decided to keep its target
for the federal funds rate unchanged within a range of 0% to 0.25%. The FOMC’s post-meeting
statement acknowledged improved economic
prospects, noting that new information suggests
that economic activity has picked up following
its severe downturn.
JAPAN
In Japan, economic activity started to recover
in the second quarter of 2009, while annual
infl ation rates remained negative. According
to the second preliminary estimate by Japan’s
Cabinet Offi ce, real GDP grew by 0.6% quarter
on quarter in the second quarter of 2009. This
is less than previously estimated and compares
with a decline of 3.3% in the previous quarter.
The recovery stems primarily from higher
net exports. According to the Bank of Japan’s
Tankan survey, confi dence among manufacturers
improved notably in the third quarter, but
remained at low levels. The outlook for spending
and profi tability remained weak.
Annual CPI infl ation remained negative at -2.2%
in August, unchanged from July. This refl ects
the output gap and base effects stemming
from last year’s rise in energy prices. Annual
CPI infl ation, excluding food and energy, also
remained unchanged at -0.9% in August.
At its meeting on 17 September 2009, the Bank
of Japan decided to leave its target for the
uncollateralised overnight call rate unchanged
at 0.1%.
UNITED KINGDOM
In the United Kingdom, the decline in real
GDP moderated in the second quarter of 2009,
reaching -0.6% quarter on quarter compared with
-2.5% in the fi rst quarter. Private consumption
and gross fi xed capital formation continued to
contribute negatively to GDP growth, though
less so than in the fi rst quarter, whereas
government consumption, net exports, and
especially inventory accumulation contributed
positively. Short-term indicators suggest a
Chart 2 Main developments in major industrialised economies
euro area United StatesJapan United Kingdom
Output growth 1)
(quarter-on-quarter percentage changes; quarterly data)
-4.0
-3.0
-2.0
-1.0
0.0
1.0
2.0
-4.0
-3.0
-2.0
-1.0
0.0
1.0
2.0
3.0 3.0
2000 2002 2004 2006 2008
Inflation rates 2)
(consumer prices; annual percentage changes; monthly data)
-3
-2
-1
0
1
2
3
4
5
6
-3
-2
-1
0
1
2
3
4
5
6
2000 2002 2004 2006 2008
Sources: National data, BIS, Eurostat and ECB calculations.1) Eurostat data are used for the euro area and the United Kingdom; national data are used for the United States and Japan. GDP fi gures have been seasonally adjusted.2) HICP for the euro area and the United Kingdom; CPI for the United States and Japan.
11ECB
Monthly Bulletin
October 2009
ECONOMIC AND MONETARYDEVELOPMENTS
The external
environment
of the euro area
further improvement in economic activity in the third quarter. The conditions in the housing market
have improved in recent months. In particular, mortgage approvals have increased and house
prices have been rising slightly in month-on-month terms. Annual HICP infl ation decreased to
1.6% in August and the Bank of England expects infl ation to remain below the 2% target in the near
term. On 10 September the Monetary Policy Committee decided to maintain the offi cial Bank Rate
paid on commercial bank reserves at 0.5%. Furthermore, the Bank of England continued with the
GBP 175 billion asset purchase programme.
OTHER EUROPEAN COUNTRIES
The economic situation also improved in most other non-euro area EU countries in the second
quarter, with the pace of decline in real GDP moderating in most countries and some countries
registering positive growth. In Sweden, real GDP increased by 0.2% quarter on quarter in the
second quarter of 2009, a noticeable improvement compared with a 0.9% decline in the fi rst quarter.
In Denmark, however, real GDP contracted by 2.6% quarter on quarter in the second quarter
compared with a 1.3% decrease in the fi rst quarter. The stronger decline in GDP in the second
quarter was partly due to base effects stemming from a signifi cant one-off boost to gross fi xed
capital formation related to oil rig installations in the fi rst quarter. Overall, HICP infl ation has
decreased in both countries in recent months, standing at 1.9% in Sweden and 0.7% in Denmark in
August 2009. On 25 September 2009 Danmarks Nationalbank decided to lower its main policy rate
by 10 basis points to 1.25%.
In the largest central and eastern European EU Member States, recent indicators point to some
improvement in economic activity. In the second quarter of 2009, real GDP contracted at a slower pace
than in the previous quarter in Hungary and Romania – by -2.0% and -1.1% respectively, quarter on
quarter. Meanwhile, real GDP increased by 0.1% in the Czech Republic and by 0.5% in Poland. The
recent signs of stabilisation in economic activity partly refl ect temporary factors, such as the increase
in external demand related to the impact of car scrapping schemes in some euro area countries.
In August 2009 consumer prices were unchanged compared to one year ago in the Czech Republic,
whereas annual HICP infl ation in Hungary, Poland and Romania remained at levels between
4% and 5%. On 28 September 2009 the Magyar Nemzeti Bank decided to decrease its main policy
rate by 50 basis points to 7.5%.
EMERGING ASIA
The recovery has continued in emerging Asia, even though its pace seems to have slowed down
slightly in some economies recently. While fi scal stimuli, accommodative monetary policy and
higher asset prices have supported domestic demand, the recovery of foreign trade has been
considerably slower. Both imports and exports are clearly below the levels prevailing in the summer
of 2008. Furthermore, while annual changes in consumer prices were still in negative territory in a
number of countries, recent data point to a gradual return to positive infl ation rates.
In China, monthly indicators suggest that economic growth remained robust in the third quarter
of 2009. Although growth was largely dependent on the fi scal stimulus and the resulting boost
in infrastructure investment, growth in private investment also accelerated, mainly owing to the
improved outlook in the real estate sector. While investment growth increased commodity imports
in China, the recovery of exports has been much slower. Accommodative monetary policy and the
fi scal stimulus have been refl ected in heightened credit growth. In August 2009 the loan stock was
33% larger than a year earlier. Annual changes in consumer prices have continued to be negative,
although the pace of decline slowed from -1.8% in July to -1.2% in August.

12ECB
Monthly Bulletin
October 2009
LATIN AMERICA
While the overall economic situation in Latin America has been improving, there has been some
heterogeneity in the growth performance of major economies. At the same time, infl ationary
pressures have continued to recede in most economies.
In Brazil, economic activity recovered notably in the second quarter, with real GDP increasing
by 1.9% compared with the previous quarter. In August annual consumer price infl ation fell to
4.3%, compared with 4.5% in July. In Argentina, real GDP expanded by 1.1% year on year in the
second quarter, down from 2.6% in the fi rst quarter. Annual consumer price infl ation increased to
5.9% in August. In Mexico, activity appears to have reached an infl ection point following the sharp
contraction during the fi rst half of the year. Industrial production decreased in July by 7% year on
year, after having fallen at double-digit rates in the two previous months. Meanwhile, infl ationary
pressures declined further, with annual consumer price infl ation reaching 5.1% in August, down
from 5.4% in July.
1.2 COMMODITY MARKETS
Oil prices remained broadly stable in September and early October (see Chart 3). On 7 October
Brent crude oil prices stood at USD 68.9 per barrel (which is 74% higher than at the beginning
of 2009). Looking ahead, market participants expect higher oil prices in the medium term, with
futures contracts for December 2011 trading at around USD 78.
The projections for oil demand in 2009 and 2010, especially for North America and non-OECD
Asia, were repeatedly revised upwards by the International Energy Agency. However, the
expected improvement in global demand
conditions has not yet materialised into
an inventory drawdown and stocks are
still at record high levels, especially in the
United States. On the supply side, a moderate
decrease in non-OPEC oil production was offset
by higher output in OPEC countries.
The prices of non-energy commodities also
remained broadly stable in September. After
having moderated substantially in the past few
months, food prices posted some increases, led
by maize, which was affected by adverse weather
conditions in the US Midwest. By contrast, metal
prices moderated amid market concerns that the
restocking process in China that has supported
demand in recent months may have come to
an end. In aggregate terms, the price index for
non-energy commodities (denominated in US
dollars) was about 19% higher at the end of
September than at the beginning of the year.
Chart 3 Main developments in commodity markets
200930
40
50
60
70
80
90
100
110
120
130
140
150
120
135
150
165
180
195
210
225
240
255
270
285
300
Brent crude oil (USD/barrel; left-hand scale)
non-energy commodities (USD; index: 2000 = 100;
right-hand scale)
2008
Sources: Bloomberg and HWWI.

13ECB
Monthly Bulletin
October 2009
ECONOMIC AND MONETARYDEVELOPMENTS
The external
environment
of the euro area
1.3 OUTLOOK FOR THE EXTERNAL ENVIRONMENT
The most recent trade data indicate that world
trade is likely to have rebounded in the third
quarter, supporting the short-term prospects
for foreign demand for euro area goods and
services. Leading indicators also suggest that
global economic activity is showing signs
of recovery. In July the OECD’s composite
leading indicators (CLIs) pointed to broad
economic recovery in most OECD countries
(see Chart 4). For emerging economies, the
CLIs showed stronger signs of recovery than in
recent months.
Although global economic prospects remain
subject to high uncertainty, the risks to global
activity remain broadly balanced. On the upside,
there may be stronger than anticipated effects
stemming from the extensive macroeconomic
stimulus being provided as well as from other
policy measures taken. Confi dence may also
improve more quickly and the labour market deterioration may be less marked than previously
expected. On the downside, concerns remain relating to a stronger or more protracted negative
feedback loop between the real economy and the fi nancial sector, renewed increases in oil and other
commodity prices, the intensifi cation of protectionist pressures and the possibility of a disorderly
correction of global imbalances.
Chart 4 OECD composite leading indicator
(monthly data; amplitude-adjusted)
90
92
94
96
98
100
102
104
88
90
92
94
96
98
100
102
104
OECD
emerging markets
8820022001 2003 2004 2005 2006 2007 2008
Source: OECD.Note: The emerging market indicator is a weighted average of the composite leading indicator for Brazil, Russia and China.

14ECB
Monthly Bulletin
October 2009
2 MONETARY AND FINANCIAL DEVELOPMENTS
2.1 MONEY AND MFI CREDIT
The monetary data for August point to a continued parallel decline of the annual growth rate of both M3 and loans to the private sector, thus confi rming the moderation of the underlying rate of monetary growth. The fl ow of loans to the non-fi nancial private sector was positive but subdued in August. Thus far, the pattern of growth in loans to households and non-fi nancial corporations remained consistent with historical regularities with respect to the business cycle. As regards the funding situation of MFIs, developments in longer-term deposits and debt securities in August suggest that credit institutions have been able to obtain funding at longer maturities. Taking the three months to August together, the deleveraging of euro area MFIs appears to have lost some steam, although MFIs have continued to reduce their positions vis-à-vis one another.
THE BROAD MONETARY AGGREGATE M3
The annual growth rate of M3 continued to
decrease in August, to 2.5%, from 3.0% in July
(see Chart 5). On a month-on-month basis,
M3 remained unchanged in August and the
short-term growth rates of M3 appear to have
stabilised at a subdued level. The interest rate
confi guration continued to strongly infl uence
monetary developments. On the one hand,
the steepness of the yield curve is fostering
outfl ows from monetary assets and makes the
decline in M3 growth overstate the decline in
underlying monetary growth. On the other hand,
the declining spread between interest rates on
different short-term deposits is prompting shifts
from short-term time deposits and marketable
instruments into overnight deposits.
The annual growth rate of MFI loans to the
private sector also declined further in August.
The monthly fl ow was negative, but this
was due entirely to developments in loans
to non-monetary fi nancial intermediaries.
By contrast, lending to the non-fi nancial private sector was positive but subdued in August.
The pattern of loans to households and non-fi nancial corporations has thus far been consistent
with historical regularities regarding the relationship between MFI loans and the current stage
of the business cycle. Moreover, the weakness of MFI loans to the non-fi nancial private sector
largely refl ects the still high degree of uncertainty regarding business, income and housing market
prospects. These factors reduce the demand for loans, but also have a bearing on banks’ assessments
of borrowers’ creditworthiness and on their willingness and capacity to lend, as also confi rmed by
the results of the survey on the access to fi nance of small and medium-sized enterprises (SMEs)
in the euro area that was conducted by the ECB in cooperation with the European Commission
(see Box 2).
Chart 5 M3 growth
(percentage changes; adjusted for seasonal and calendar effects)
-2
0
2
4
6
8
10
12
14
-2
0
2
4
6
8
10
12
14
1999 2000 2001 2002 2003 2004 2005 2006 2007 2008 2009
M3 (annual growth rate)
M3 (three-month centred moving average
of the annual growth rate)
M3 (six-month annualised growth rate)
Source: ECB.

15ECB
Monthly Bulletin
October 2009
ECONOMIC AND MONETARYDEVELOPMENTS
Monetary and
financial
developments
With regard to credit institutions’ funding, the Eurosystem’s one-year liquidity-providing operations
provided banks with ample short-term liquidity and allowed them to focus on strengthening
longer-term funding. As regards such funding through the issuance of longer-term debt securities,
the Eurosystem’s programme for the purchase of covered bonds is likely to have had a benefi cial
effect. Mirroring the situation on the funding side, the main asset holdings of the MFI sector did not
contract in August. Taking the three months to August together, the deleveraging of euro area MFIs
appears to have lost some steam, although MFIs have continued to reduce their positions vis-à-vis
one another.
MAIN COMPONENTS OF M3
The decline observed in the annual growth rate of M3 in August was driven by lower growth of
both short-term deposits other than overnight deposits (i.e. M2-M1) and marketable instruments
(i.e. M3-M2). This was partly offset by a further increase in annual M1 growth (i.e. currency in
circulation and overnight deposits).
The annual growth rate of M1 rose further to 13.6% in August, from 12.1% in the previous
month (see Table 1). This increase refl ected another strong monthly infl ow into overnight deposits,
as well as a monthly infl ow into currency in circulation.
The annual growth rate of short-term deposits other than overnight deposits declined further to
stand at -4.1% in August, down from -2.7% in July. Developments in the sub-components of this
category of deposit continued to diverge. While the annual growth rate of deposits redeemable at
notice of up to three months (i.e. short-term savings deposits) increased further in August, this was
more than offset by a decline in the annual growth rate of deposits with an agreed maturity of up to
Table 1 Summary table of monetary variables
(quarterly fi gures are averages; adjusted for seasonal and calendar effects)
Outstanding amount as a
percentage of M3 1)
Annual growth rates
2008Q3
2008Q4
2009Q1
2009Q2
2009July
2009Aug.
M1 46.6 0.7 2.7 5.3 8.0 12.1 13.6Currency in circulation 7.9 7.5 12.4 13.6 13.2 12.5 13.2
Overnight deposits 38.8 -0.6 0.8 3.6 6.9 12.1 13.6
M2 - M1 (= other short-term deposits) 40.6 19.1 15.8 9.3 3.0 -2.7 -4.1
Deposits with an agreed maturity of up
to two years 22.1 37.6 29.0 12.9 -0.8 -12.1 -15.1
Deposits redeemable at notice of up to
three months 18.5 -1.7 -0.5 4.5 8.6 12.3 13.7
M2 87.2 9.2 8.9 7.2 5.5 4.7 4.6M3 - M2 (= marketable instruments) 12.8 8.9 4.1 -0.8 -2.5 -6.8 -9.9
M3 100.0 9.1 8.2 6.0 4.3 3.0 2.5
Credit to euro area residents 9.1 7.4 5.9 4.3 3.3 2.8Credit to general government 0.6 1.7 5.6 8.4 10.9 11.5
Loans to general government 2.1 2.9 2.3 1.5 2.4 3.6
Credit to the private sector 10.9 8.6 6.0 3.5 1.8 1.1
Loans to the private sector 9.1 7.4 4.6 2.2 0.7 0.1
Loans to the private sector adjusted
for sales and securitisation 10.1 8.5 6.1 3.6 1.9 1.3
Longer-term fi nancial liabilities (excluding capital and reserves) 3.3 1.2 1.8 2.7 3.2 3.8
Source: ECB.1) As at the end of the last month available. Figures may not add up due to rounding.

16ECB
Monthly Bulletin
October 2009
two years (i.e. short-term time deposits), which fell signifi cantly further to stand at -15.1%, down
from -12.1% in the previous month.
The developments in the various types of short-term deposit are in line with the declining spread
between the interest rates paid on these deposits. In particular, this fostered outfl ows from short-term
time deposits into both overnight deposits and short-term saving deposits. This can be explained by
the fact that, on the basis of the available data on MFI interest rates, the interest rate on short-term
time deposits has declined more sharply than that on the latter two types of deposit. There may also
have been an increase in the allocation of funds to fi nancial assets outside M3, as the steepening of
the yield curve since the end of last year has made these long-term instruments more attractive.
The annual growth rate of marketable instruments declined further to stand at -9.9% in August,
down from -6.8% in July. As regards the sub-components of marketable instruments, the annual
growth rate of the short-term MFI debt securities held by the money-holding sectors (i.e. debt
securities with a maturity of up to two years) moved further into negative territory, standing at
-43.9% in August, after -38.6% in July. On a monthly basis, euro area and non-euro area residents
reduced their holdings of these securities in August, while MFIs themselves increased their holdings.
Another signifi cant monthly decrease in the money-holding sectors’ holdings was also recorded in
the case of repurchase agreements. However, this decrease largely refl ected the reduction in the
volume of secured interbank transactions conducted through a central counterparty. The fact that
the latter is classifi ed as belonging to the other fi nancial intermediaries sector implies that these
transactions affect the repurchase agreement holdings of this sector. Finally, market fund shares/
units were the only marketable instrument for which a positive fl ow was recorded in August.
The annual growth rate of M3 deposits – which comprise short-term deposits and repurchase
agreements and represent the broadest monetary aggregate for which a sectoral breakdown is
reported – continued to decline in August, to 3.1%, from 3.6% in July. The household sector was
the main driver of this decline, although it still accounted for almost all of the annual growth of M3
deposits. By contrast, the contribution made by non-fi nancial corporations has increased in recent
months. On a monthly basis, a small infl ow into M3 deposits of the household sector was recorded
in August. At the same time, after a series of contractions around the turn of the year, non-fi nancial
corporations continued to increase their holdings of M3 deposits in August. Non-monetary fi nancial
intermediaries also expanded their M3 deposit holdings in August, following a large outfl ow in the
previous month.
MAIN COUNTERPARTS OF M3
Turning to the counterparts of M3, the annual growth rate of total MFI credit to euro area residents
declined to 2.8% in August, down from 3.3% in July (see Table 1). However, this development
masks a further strengthening in the annual growth of credit to general government, to 11.5% in
August, up from 10.9% in July, while the growth of credit to the private sector declined to 1.1%,
from 1.8% in the previous month. In both cases, August saw strong monthly fl ows related to
MFIs’ purchases of public and private sector debt securities.
The annual growth rate of MFI loans to the private sector, the largest component of credit to the
private sector, declined further to stand at 0.1% in August, down from 0.7% in the previous month.
On a monthly basis, the fl ow of MFI loans to the private sector was negative in August, refl ecting a
further contraction of lending to fi nancial intermediaries, while lending to the non-fi nancial private
sector expanded slightly.

17ECB
Monthly Bulletin
October 2009
ECONOMIC AND MONETARYDEVELOPMENTS
Monetary and
financial
developments
The month-on-month growth rates of loans to the private sector in recent months have been affected
only slightly by the distortionary impact of the derecognition of loans in the context of securitisation.
Indeed, true-sale securitisation activity has been subdued, after a period of intense activity at the
end of 2008, whereby originating credit institutions sold loans and acquired the securities issued
for use as collateral in Eurosystem credit operations. This decline in securitisation activity may be
attributable to an easing of credit institutions’ demand for central bank liquidity after the one-year
longer-term refi nancing operation conducted by the Eurosystem at the end of June, an operation that
replaced other types of liquid instruments. This notwithstanding, the impact of loan derecognition
continued to be prevalent in the annual growth rates, with the difference between the corrected and
uncorrected annual series standing at 1.3 percentage points in August, after 1.2 percentage points in
the previous month.
The annual growth rate of MFI loans to non-fi nancial corporations declined further to stand at
0.7% in August, down from 1.6% in July (see Table 2). The August data confi rm that, on balance,
the fl ows of loans with a longer maturity (above fi ve years) have remained positive and have partly
offset the contractions in the level of short and medium-term loans, although these data recorded a
fi rst small positive monthly infl ow in loans with a maturity of up to one year since November 2008.
The still subdued development of short-term loans could refl ect a process whereby fi rms are replacing
short-term bank loans with long-term loans – in order to lock-in the low level of long-term interest
rates – or (especially in the case of large fi rms) bank loans with a stronger market-based
security issuance.
The annual growth rate of loans to households declined to -0.2% in August, down from nil in July.
However, on a monthly basis, a clearly positive fl ow was recorded. The decrease in the annual
growth rate of loans to households continued to be driven by a decrease in the annual growth rate
of loans for house purchase, to -0.4% in August, after -0.1% in July, refl ecting, to a large extent,
the moderate house price dynamics in many euro area countries. This notwithstanding, the recent
developments confi rm that a levelling-off of the downward momentum of lending to households
has been taking place in recent months, which is in line with the current stage of the economic cycle
(see Box 1 below).
Table 2 MFI loans to the private sector
(quarterly fi gures are averages; adjusted for seasonal and calendar effects)
Outstanding amount as a percentage of the
total 1)
Annual growth rates2008
Q32008
Q42009
Q12009
Q22009 July
2009 Aug.
Non-fi nancial corporations 44.3 12.8 11.3 8.2 4.7 1.6 0.7 Up to one year 26.4 11.0 9.0 4.1 -2.4 -8.3 -8.9
Over one and up to fi ve years 20.2 18.6 16.0 12.5 9.9 6.1 3.9
Over fi ve years 53.4 11.8 10.8 8.8 6.8 5.5 5.0
Households 2) 45.6 3.9 2.8 1.0 0.0 -0.0 -0.2 Consumer credit 3) 12.9 4.4 3.2 1.3 -0.3 -1.0 -0.9
Lending for house purchase 3) 71.4 4.1 2.9 0.7 -0.2 -0.1 -0.4
Other lending 15.7 2.6 2.2 1.7 1.6 1.4 1.4
Insurance corporations and pension funds 0.9 -6.6 -6.5 -5.8 -2.4 -3.2 -8.2 Other non-monetary fi nancial intermediaries 9.3 22.3 14.5 7.6 1.0 -0.1 -1.0
Source: ECB.Notes: MFI sector including the Eurosystem; sectoral classifi cation based on the ESA 95. For further details, see the relevant technical notes.1) As at the end of the last month available. Sector loans as a percentage of total MFI loans to the private sector; maturity breakdown and breakdown by purpose as a percentage of MFI loans to the respective sector. Figures may not add up due to rounding.2) As defi ned in the ESA 95.3) The defi nitions of consumer credit and lending for house purchase are not fully consistent across the euro area.

18ECB
Monthly Bulletin
October 2009
Box 1
LOANS TO THE NON-FINANCIAL PRIVATE SECTOR OVER THE BUSINESS CYCLE IN THE EURO AREA
The annual growth in bank loans to the non-fi nancial private sector has continued to decelerate
in recent months. This development somewhat masks different tendencies across sectors.
In the case of non-fi nancial corporations, loan growth has remained on a downward path,
while in the case of households, the earlier downward movement in loan growth has been
levelling off in the most recent months. Differences in the timing of the turning-points of
sectoral loan developments over the business cycle would correspond to historical regularities.1
Available information suggests that the euro area economy is stabilising and expected to
recover at a gradual pace. It may therefore be particularly interesting at the current juncture to
review the empirical evidence on the evolution of loans in the past. Against this background,
this box presents some stylised facts about the business cycle behaviour of sectoral loan growth
and the uncertainties surrounding these facts.
The stylised facts of loan growth over the business cycle
Since the early 1980s, the evolution in the growth of real loans to non-fi nancial corporations and
households seems to have been closely aligned with that in growth of real GDP (see Chart A).
At the same time, there are clear differences in both the respective phases and the amplitudes of
these different series.
As is shown in the table, correlation analysis
suggests that in the case of households, the
strongest link between real GDP growth and
loan growth – a correlation coeffi cient of
67% – is established with an average lead of
one quarter for loan growth. In the case of non-
fi nancial corporations, the strongest link – a
correlation coeffi cient of 70% – prevails when
loan growth lags the cycle by, on average, three
quarters. These phase shifts also broadly hold
when looking more narrowly at the turning-
points. For household loans, for example, the
lead is one quarter for the overall correlation
and two for the turning-points. The lead in the
case of loans to households mainly comes from
the sub-component loans for housing purchase,
while consumer credit and other lending to
households seem to lag the cycle slightly.
The regularities refl ect the different demand
and supply factors which drive developments
in loans to households and non-fi nancial
corporations. For instance, the slightly leading
1 See also the box entitled “The cyclical pattern of loans to households and non-fi nancial corporations in the euro area” in the June 2007
issue of the Monthly Bulletin.
Chart A Growth in real loans to the non-financial private sector and in real GDP
(annual percentage changes)
-6
-4
-2
0
2
4
6
8
10
12
14
-6
-4
-2
0
2
4
6
8
10
12
14
1980 1984 1988 1992 1996 2000 2004 2008
real loans to non-financial corporations
real loans to households
real GDP
Sources: ECB and Eurostat.Notes: All variables are defl ated by the GDP defl ator. Quarterly data. The last observation is for the second quarter of 2009.

19ECB
Monthly Bulletin
October 2009
ECONOMIC AND MONETARYDEVELOPMENTS
Monetary and
financial
developments
behaviour of household loans may be explained by the fact that the decline in both house prices and
interest rates during slowdowns typically encourages some households to resume their demand for
housing loans when expectations for a recovery strengthen. By contrast, the lagging pattern of loans
to non-fi nancial corporations may refl ect the possibility that fi rms fi rst use their internal funds –
as cash fl ows improve during the recovery – and only later turn to external fi nancing. Finally,
some supply-side factors may also be relevant, such as the possible preference of banks
to increase their lending fi rst to households during a recovery rather than to fi rms, as household
loans, notably those for house purchase, are better collateralised.
Uncertainty surrounding the stylised facts
When applying the regularities discussed above
to the assessment of a specifi c situation, it is
important to know how frequent and marked
deviations from the average pattern can be. In
other words, it is necessary to assess how much
uncertainty characterises these regularities.
For this purpose, three measures are presented
below: (i) confi dence bands around the
correlation coeffi cients; (ii) rolling correlations;
and (iii) the pattern of the lead or lag in
turning-points over time.
The confi dence bands around the dynamic
correlations in Chart B confi rm that the
maximum correlation between real GDP
growth and the growth in real loans
to households, on the one hand, and
non-fi nancial corporations, on the other hand,
is signifi cantly positive (i.e. signifi cantly
greater than zero from a statistical point
of view).2 However, the maximum
correlation between real GDP growth and
growth in real loans to households leading
2 Confi dence bands were computed using the non-parametric method to obtain heteroskedasticity and autocorrelation consistent standard
errors as described in W. Newey and K. West, “Automatic lag selection in covariance matrix estimation”, Review of Economic Studies,
Vol. 61, 1994, pp. 631-653.
Chart B Correlations at different lead/lag shifts: growth in real loans to households and non-financial corporations relative to real GDP growth
(percentages)
-80
-60
-40
-20
0
20
40
60
80
100
-80
-60
-40
-20
0
20
40
60
80
100Real GDP lagsReal GDP leads
-8 -7 -6 -5 -4 -3 -2 -1 0 1 2 3 4 5 6 7 8
real loans to households
real loans to non-financial corporations
Sources: ECB and Eurostat.Notes: Based on annual growth rates from the second quarter of 1981 to the second quarter of 2009. The dotted lines refer to confi dence bands, computed as the correlation coeffi cient plus and minus the standard error (calculated using the optimal bandwidth procedure from Newey and West). See also footnote 2 in the text.
Stylised facts of loans to the non-financial private sector in the euro area
Variable Average annual growth rate
Correlation with real GDP Lead/lag (+/-) of turning-point relative to real GDP
(quarters)Maximum
correlation (%)Lead/lag (+/-)
(quarters)
Real GDP 2.0
Real loans to households 4.5 67 1 2
Real loans to non-fi nancial
corporations 4.5 70 -3 -3
Sources: ECB and Eurostat.Note: Results are derived for the period from the second quarter of 1980 to the second quarter of 2009 and are based on annual growth rates.
20ECB
Monthly Bulletin
October 2009
by one quarter is not statistically different
from the coincident correlation, as can be
seen by comparing the maximum correlation
value with the value of the higher confi dence
band of the contemporaneous correlation.
By contrast, the maximum correlation between
real GDP growth and growth in real loans to
non-fi nancial corporations lagging by three
quarters is statistically different from the
coincident correlation.3 Thus, while the growth
in real loans to non-fi nancial corporations can
safely be characterised as a lagging indicator of
real GDP growth from a statistical perspective,
this is not the case for the growth in real loans
to households as a leading indicator.
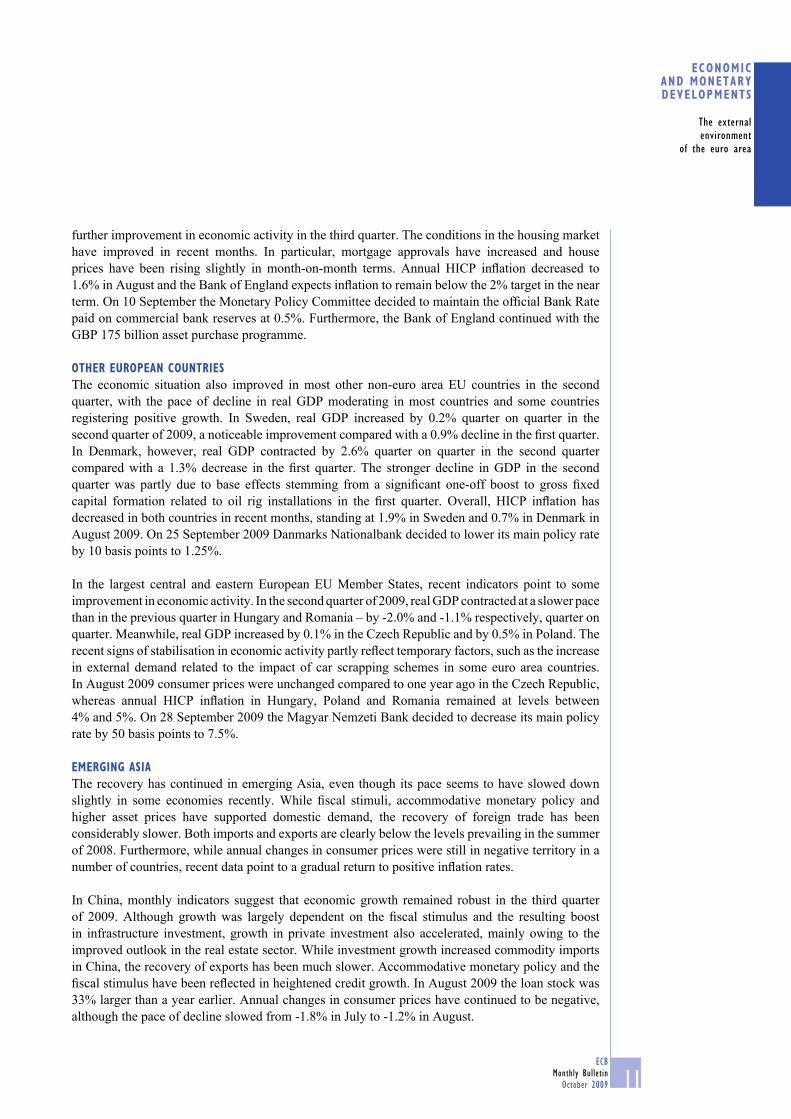
The rolling correlation coeffi cients in Chart C
suggest that there is a fair amount of stability in
the relationship between real GDP growth and
sectoral loan growth, given that the maximum
correlation for the individual time periods
has mostly been well above 60% since the
early 1980s.4 However, the leads and lags of
loan growth at which this maximum correlation
has been achieved seem to have changed more
substantially over time. During the second half of the 1990s, growth in real loans to households
appears to have moved more contemporaneously with real GDP growth, while it appears to have
led during the rest of the period. By contrast, growth in real loans to non-fi nancial corporations
appears to have been consistently lagging. These statistics suggest that the relationship between
loan growth and real GDP growth can at times deviate signifi cantly from average developments.
This fi nding is also supported by the fact that the lead/lag relationship in turning-points
varies over time (see Chart D). For example, while on average turning-points in the growth
of real loans to households tended to lead peaks and troughs in real GDP growth by almost
two quarters, this relationship varied between minus one (i.e. a lag of one quarter) to plus fi ve
(a lead of fi ve quarters).5 Similarly, while turning-points in the growth of real loans to
non-fi nancial corporations tended, on average, to lag peaks and troughs in real GDP growth
by about three quarters, this relationship varied between minus fi ve and plus three. Moreover,
in both cases some turning-points in real GDP growth were not associated with peaks and
troughs in loan growth (such as in the late 1990s and mid-2000s). There is no clear evidence
3 Note that these conclusions can be derived with reference to confi dence bounds relating to both plus and minus the standard error as
well as plus and minus twice the standard error.
4 The period for the rolling correlations is three years, which is the average peak-to-peak duration of cycles in the annual growth series
considered. Five-year averages were taken to show average developments over time.
5 Turning-points were determined using the so-called Bry-Boschan algorithm (see G. Bry and C. Boschan, “Cyclical analysis of
time series: selected procedures and computer programs”, NBER Technical Paper Series, No 20, National Bureau of Economic
Research, 1971). This algorithm is typically applied to indicators of levels to detect classical business cycle phases, i.e. expansions
and recessions. However, this algorithm also often produces reasonable results for growth rates. Very similar results are obtained
by identifying turning-points by means of simple rules of thumb (based on assumptions relating to the duration of expansions and
moderations) or more formal modelling approaches such as Markov-switching models.
Chart C Rolling correlations: growth in real loans to households and non-financial corporations relative to real GDP growth
(percentages; quarters)
-60
-40
-20
0
20
40
60
80
100
-6
-4
-2
0
2
4
6
8
10
maximum correlation loans to NFCs (left-hand scale)
maximum correlation loans to HHs (left-hand scale)
lead (+)/lag (-) of maximum correlation to NFCs
(right-hand scale)
lead (+)/lag (-) of maximum correlation to HHs
(right-hand scale)
1981 1985 1989 1993 1997 2001 2005 2009
Sources: ECB and Eurostat.Notes: All variables are defl ated by the GDP defl ator. Based on annual growth rates from the second quarter of 1981 to the second quarter of 2009. Five-year averages of three-year periods. “NFCs” stands for non-fi nancial corporations; “HHs” stands for households.

21ECB
Monthly Bulletin
October 2009
ECONOMIC AND MONETARYDEVELOPMENTS
Monetary and
financial
developments
Turning to the other counterparts of M3, the annual growth rate of MFIs’ longer-term fi nancial
liabilities excluding capital and reserves increased further in August, reaching 3.8%, up from
3.2% in July. In particular, longer-term deposits (i.e. those with an agreed maturity of over two
years and those redeemable at notice of over three months) have benefi ted from the steepened
yield curve, thus attracting at least part of the funds that have been fl owing out of short-term time
deposits. In addition, the money-holding sectors continued to purchase longer-term debt securities
in August, suggesting that MFIs are able to obtain long-term funding from non-banks by using this
instrument. While yield considerations are favouring this instrument as well, a stimulating effect
from the Eurosystem’s covered bond purchase programme is likely to also have played a role in
this development, as covered bond issuance, which is typically of long maturity, has picked up
markedly.
The annual growth rate of capital and reserves declined to 9.5% in August, down from 10.1% in
July, despite a relatively large positive monthly fl ow.
Finally, a further positive fl ow of €43 billion was recorded in the net external asset position of
the MFI sector in August, which brought the annual fl ow to €165 billion, after €127 billion in
of a relationship between the deviation from
the average lead or lag of turning-points and
the severity of economic downturns or the
strength of upturns. On the one hand, looking
at the early 1990s, which saw the most severe
recession from the early 1980s until the most
recent one in the euro area, the lead of the
turning-point in household loans (fi ve quarters)
and the lag in non-fi nancial corporation loans
(four quarters) mark the largest deviations
for troughs. On the other hand, the periods of
strongest expansion, such as those in the late
1980s and early 2000s (when annual real GDP
growth was close to 5%), do not seem to have
been characterised by exceptional deviations
in the lead and lag of the corresponding peaks
in loan variables.
Overall, average historical regularities suggest
that the annual growth of real loans to
households slightly leads real GDP growth,
but that growth in loans to non-fi nancial
corporations clearly lags growth in real GDP.
Thus, the view that the euro area economy is
stabilising and the anticipation of a gradual
recovery would be consistent with the current
levelling-off of household loan growth, but could also be expected to be accompanied by a
further moderation in the growth of loans to non-fi nancial corporations until at least early 2010.
However, these average regularities are surrounded by uncertainty, which is particularly marked
at the current juncture owing to still strained fi nancial markets.
Chart D Relationships between turning points in growthin real loans to households, growth in real loans to non-financial corporations and in real GDP growth
(quarters)
-6
-5
-4
-3
-2
-1
0
1
2
3
4
5
6
-6
-5
-4
-3
-2
-1
0
1
2
3
4
5
6
lead/lag (+/-) of real NFC loan growth turning-points
lead/lag (+/-) of real HH loan growth turning-points
no turning-point
in loan growth series
1 2 3 4 5 6 7 8 9 10 11 12 13 14
1 T early 1980s
2 P mid-1980s
3 T mid-1980s
4 P late 1980s
5 T early 1990s
6 P mid-1990s
7 T mid-1990s
8 P late 1990s
9 T late 1990s
10 P early 2000s
11 T early 2000s
12 P mid-2000s
13 T mid-2000s
14 P late 2000s
Source: ECB and Eurostat.Notes: Turning-points based on the Bry-Boschan algorithm. “NFC” stands for non-fi nancial corporations; “HH” stands for households. “P” refers to peak and “T” to trough.

22ECB
Monthly Bulletin
October 2009
the 12 months up to July (see Chart 6). This
development is the continuation of a pattern
observed since May, whereby MFIs have,
on a 12-month basis, reduced their liabilities
vis-à-vis non residents more than their assets.
To some extent, this reduction in both assets and
liabilities refl ects the global scaling-down of
interbank cross-border positions in the context
of deleveraging.
To sum up, the monetary data for August point
to a continued parallel deceleration of growth
in M3 and loans to the private sector, thus
confi rming the moderation in the underlying
rate of monetary growth. Lending to the
non-fi nancial private sector continued to be
subdued, to a large extent refl ecting the still
high degree of uncertainty surrounding business,
income and housing market prospects. This
uncertainty impacts not only on the demand
for MFI loans, but also on credit institutions’
willingness and capacity to lend. The data for
August, particularly when assessed together with
those for the two preceding months, also suggest
that the scaling-down of MFI balance sheets has
lost some steam. This notwithstanding, MFIs
continued to reduce their positions vis-à-vis
one another.
2.2 SECURITIES ISSUANCE
Overall debt securities issuance growth remained sustained in July 2009, albeit decelerating from the robust pace recorded since November 2008. In the non-fi nancial corporate sector, the momentum of securities issuance remained strong in July, driven mainly by long-term debt securities issuance. It is likely that this continued increase in debt securities issuance by the corporate sector to some extent refl ects the substitution of market-based fi nancing for bank fi nancing, given the more rapid decline in the cost of market-based debt than in bank lending rates since end-2008.
DEBT SECURITIES
The annual growth rate of debt securities issued by euro area residents edged downwards slightly
to 11.7% in July 2009, from 11.9% in the previous month (see Table 3), thereby confi rming a
stabilisation in the growth of debt securities issuance at a high level. This is also refl ected in the
seasonally adjusted six-month annualised growth rate of debt securities issuance, which has been
signalling a slight moderation in the ongoing robust growth of overall debt securities issued in
recent months (see Chart 7). The overall fi gure, however, conceals some differences in behaviour
across different maturities and types of issuer.
Chart 6 Counterparts of M3
(annual fl ows; EUR billions; adjusted for seasonal and calendar effects)
-800
-600
-400
-200
0
200
400
600
800
1,000
1,200
1,400
1,600
-800
-600
-400
-200
0
200
400
600
800
1,000
1,200
1,400
1,600
2009
credit to the private sector (1)
credit to general government (2)
net external assets (3)
longer-term financial liabilities (excluding capital
and reserves) (4)
other counterparts (including capital and reserves) (5)
M3
2004 2005 2006 2007 2008
Source: ECB.Notes: M3 is shown for reference only (M3 = 1+2+3-4+5). Longer-term fi nancial liabilities (excluding capital and reserves) are shown with an inverted sign, since they are liabilities of the MFI sector.

23ECB
Monthly Bulletin
October 2009
ECONOMIC AND MONETARYDEVELOPMENTS
Monetary and
financial
developments
Regarding maturities, the annual growth rate of issuance of short-term debt securities, while still
high, continued to decline rapidly, falling to 18.7% in July from 19.9% in the previous month.
At the same time, the growth in issuance of long-term debt securities remained strong and broadly
unchanged, at 10.8%. Issuance of longer-term debt securities may be broken down further into
securities at fl oating and fi xed rates. In recent months, issuers have clearly favoured the issuance
of fi xed rate long-term debt securities, which represent around 70% of the outstanding amount of
long-term debt securities issued. The annual growth rate of fi xed rate long-term debt securities issuance
surged from 5.4% at the beginning of the year
to 10.3% in July 2009. At the same time, the
annual growth rate of fl oating rate long-term debt
securities continued to decrease, falling to 12.5%.
Regarding sectoral issuance, the annual growth
rate of debt securities issued by non-fi nancial
corporations reached 12.6% in July 2009.
This is the highest growth rate observed since
June 2003. Monthly net issuance activity by
non-fi nancial corporations suggests that the
ability to raise short-term fi nance continued to be
hampered up until July 2009. Hence, the strong
momentum in corporate debt securities issuance
was mainly driven by long-term securities.
The surge in long-term net issuance, together
with the record volumes recorded at the turn
of 2009, points to renewed interest from
non-fi nancial corporations in the European
corporate bond market. Two factors may have
played a signifi cant role in providing an incentive
for corporate debt issuance. First, credit spreads
have been declining rapidly over recent months.
Table 3 Securities issued by euro area residents
Amount outstanding (EUR billions) Annual growth rates 1)
Issuing sector2009July
2008Q3
2008Q4
2009Q1
2009Q2
2009June
2009July
Debt securities 14,061 7.3 7.8 10.6 12.0 11.9 11.7MFIs 5,447 8.2 5.7 5.9 5.8 4.8 4.2
Non-monetary fi nancial corporations 2,153 22.9 23.7 31.1 32.7 30.0 31.0
Non-fi nancial corporations 763 4.1 5.0 7.7 10.0 11.4 12.6
General government 5,698 2.4 5.6 9.6 12.1 13.3 13.2
of which:Central government 5,344 2.4 5.7 9.9 12.2 13.6 13.4
Other general government 353 3.0 2.9 5.9 9.6 9.7 9.5
Quoted shares 3,815 0.6 0.8 1.2 1.9 2.7 2.7MFIs 509 2.8 4.9 7.2 8.7 9.8 9.5
Non-monetary fi nancial corporations 278 2.6 2.6 3.1 3.4 4.3 4.0
Non-fi nancial corporations 3,027 0.0 -0.1 0.0 0.8 1.5 1.6
Source: ECB.1) For details, see the technical notes for Sections 4.3 and 4.4 of the “Euro area statistics” section.
Chart 7 Sectoral breakdown of debt securities issued by euro area residents
(six-month annualised growth rates; seasonally adjusted)
-10
0
10
20
30
40
50
60
70
-10
0
10
20
30
40
50
60
70
totalmonetary financial institutions
non-monetary financial corporations
non-financial corporationsgeneral government
1999 2000 2001 2002 2003 2004 2005 2006 2007 2008
Source: ECB.

24ECB
Monthly Bulletin
October 2009
This has substantially lowered fi nancing costs in the issuance of debt fi nancing and has enabled
fi rms to secure relatively inexpensive funding. Since end-2008 there has been a greater decline in
the cost of market-based debt than in the costs of bank loan fi nancing. For instance, the real cost of
market-based debt fi nancing has dropped much more rapidly than MFIs’ lending rates. Second,
the momentum in debt issuance could also refl ect the deterioration of the availability of external
fi nancing through a tightening of terms and conditions for bank loans (see Box 2, which presents
the results of the recent survey on the access to fi nance of small and medium-sized enterprises in
the euro area). Since November 2008 the surge in issuance of corporate debt has led to a gradual
restructuring of the debt maturity structure, with non-fi nancial corporations increasingly relying
on longer-term funding. In November 2008 17% of the outstanding market-based debt held by
non-fi nancial corporations was short-term. In July 2009, this proportion had fallen to 11%.
Turning to the fi nancial sector, there was a further slowdown in the annual growth rate of debt
securities issuance by monetary fi nancial institutions, to 4.2% in July, from 4.8% in June. This
slowdown was driven by a rapid decline in the annual growth rate of short-term debt securities
issued, down to 1.8% in July, from 4.5% in June. Some moderation in the growth of long-term
debt securities issuance also continued in July, with the annual growth rate standing at 4.6%,
i.e. 0.2 percentage point lower than in the previous month.
By contrast, there was a slight pick-up in the annual growth rate of debt securities issued by
non-monetary fi nancial institutions, to 31% in July 2009, i.e. 1 percentage point higher than in
June. This is confi rmed by a stabilisation of the seasonally adjusted six-month annualised growth
rate in July 2009, after several months of rapid decline. The issuance activity of non-monetary
fi nancial institutions, as for other types of
issuer, continued to focus on longer-term
maturities.
Finally, the annual growth rate of debt securities
issued by the general government sector
remained strong, broadly unchanged from
the previous month, at 13.2% in July 2009.
A strong acceleration in the annual growth rate
of short-term debt securities issuance was more
than offset by a slowdown in the annual growth
rate of longer-term debt securities issued. The
strong momentum in the issuance of government
debt securities refl ects the continued substantial
funding needs of the euro area public sector.
QUOTED SHARES
The annual growth rate of quoted shares issued
by euro area residents remained unchanged at
2.7% in July 2009 (see Chart 8). The annual
growth rate of equity issuance by MFIs
remained high at 9.5%, refl ecting continued
efforts on the part of many euro area banks
Chart 8 Sectoral breakdown of quoted shares issued by euro area residents
(annual growth rates)
-4
-2
0
2
4
6
8
10
12
-4
-2
0
2
4
6
8
10
12
total
monetary financial institutions
non-monetary financial corporations
non-financial corporations
1999 2000 2001 2002 2003 2004 2005 2006 2007 2008
Source: ECB.Note: Growth rates are calculated on the basis of fi nancial transactions.
25ECB
Monthly Bulletin
October 2009
ECONOMIC AND MONETARYDEVELOPMENTS
Monetary and
financial
developments
to strengthen their balance sheets by bolstering their capital bases. Another notable feature
is the annual growth rate of quoted shares issued by non-fi nancial corporations, which rose
further to 1.6% in July 2009, possibly fostered by positive stock market developments in
recent months.
2.3 MONEY MARKET INTEREST RATES
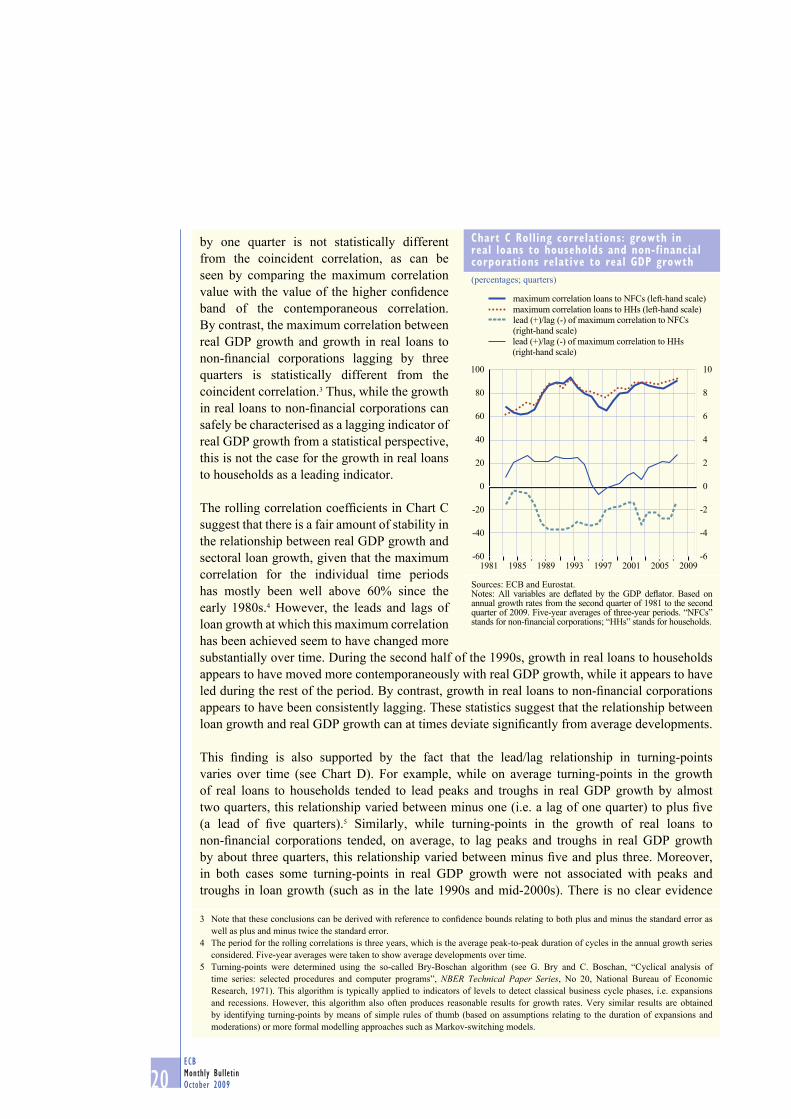
While unsecured money market interest rates declined in September and early October 2009, secured rates increased slightly. As a result, the spread between unsecured and secured interest rates with three-month maturity also declined slightly during that period. In September the Eurosystem continued to provide the fi nancial system with abundant amounts of liquidity by means of fi xed rate tender procedures with a full allotment of its main and longer-term refi nancing operations with maturities of up to one year. The amount allotted in the second one-year operation on 30 September was signifi cantly lower than that of the fi rst operation conducted in June. Furthermore, the Eurosystem continued to conduct outright purchases of covered bonds in the context of the covered bond purchase programme it had started on 6 July 2009.
Unsecured money market rates continued to decline in September and early October 2009, albeit
at a slower pace than in previous months. On 7 October the one-month, three-month, six-month
and twelve-month EURIBOR stood at 0.43%, 0.74%, 1.01% and 1.23% respectively. Compared
with the levels observed on 2 September, the one-month EURIBOR declined by 5 basis points,
while the rates for maturities of between three and twelve months declined by 7 basis points.
As a result, the spread between the twelve-month and one-month EURIBOR – an indicator of
the slope of the money market yield curve –
declined slightly to stand at 79 basis points on
7 October, compared with 82 basis points on
2 September (see Chart 9).
Secured money market rates derived from
the EONIA swap index increased slightly in
September, contributing to a decline in the
spread between unsecured rates and secured
rates. For the three-month segment, this
spread stood at 27 basis points on 7 October,
i.e. 14 basis points lower than the level observed
on 2 September.
The interest rates implied by the prices of
three-month EURIBOR futures maturing in
December 2009, March 2010 and June 2010
declined to stand at 0.785%, 0.965% and 1.225%
respectively on 7 October – i.e. 8, 9 and 15 basis
points respectively below the rates prevailing on
2 September.
The EONIA was broadly stable in September
and early October, standing at levels around
Chart 9 Money market interest rates
(percentages per annum; spread in percentage points; daily data)
-2.0
-1.5
-1.0
-0.5
0.0
0.5
1.0
1.5
2.0
2.5
3.0
3.5
4.0
4.5
5.0
5.5
6.0
0.0
0.5
1.0
1.5
2.0
2.5
3.0
3.5
4.0
Sep.
one-month EURIBOR (left-hand scale)
three-month EURIBOR (left-hand scale)
twelve-month EURIBOR (left-hand scale)
spread between twelve-month and one-month
EURIBOR (right-hand scale)
Nov.
2008 2009
Jan. Mar. May July Sep.
Sources: ECB and Reuters.

26ECB
Monthly Bulletin
October 2009
10 basis points above the deposit facility rate
of 0.25%, except on 8 and 30 September,
when it stood at 0.54% and 0.53% respectively
(see Chart 10). The fi rst exception coincided with
the last day of the maintenance period ending on
8 September, when the Eurosystem conducted
a liquidity-absorbing fi ne-tuning operation
and absorbed €195.1 billion in a variable rate
tender operation with a maximum rate of
1.00%, a marginal rate of 0.80% and a weighted
average rate of 0.73%. On 30 September the
EONIA rose to 0.53%, mainly on account of
end-of-quarter effects. The increase was
reversed on the following day, and the EONIA
stood at 0.34% on 7 October.
The volume of outstanding open market
operations which, owing to the Eurosystem’s
current liquidity management, is determined
solely by the bidding behaviour of counterparties,
declined until 30 September, when the second
one-year longer-term refi nancing operation
(LTRO) was settled. On 1 October the volume
of outstanding refi nancing operations in euro
was €742.7 billion, well below the record high
of €896.5 reached on 25 June, following the settlement of the fi rst one-year LTRO in the order of
€442.5 billion on 24 June. Since then, the liquidity term structure has lengthened signifi cantly, with
the main refi nancing operations only accounting for around 10% of total outstanding liquidity.
In the main refi nancing operations conducted on 1, 8, 15, 22 and 29 September, the ECB allotted
€72.1 billion, €93.3 billion, €87.8 billion, €85.0 billion, and €66.8 billion respectively. As regards
longer-term operations, the ECB conducted three special LTROs with maturities of one, three and
six months in September 2009, as well as the second of the three one-year LTROs announced
in May. The ECB allotted €10.6 billion in the special LTRO with a maturity of one month on
8 September, and €3.2 billion and €3.7 billion respectively in the special LTROs with maturities
of three and six months on 9 September. In the second one-year LTRO on 30 September, the ECB
allotted €75.2 billion, less than what had been expected by market participants.
In line with the decline in the allotment amounts in market operations, the liquidity surplus in the
euro area money markets declined gradually in the course of the month, as refl ected in the average
daily recourse to the deposit facility, which decreased from €136.7 billion in the maintenance period
ending on 8 September to €105.8 billion in the following period up to 7 October.
Furthermore, using its reciprocal currency arrangements (swap lines) with the Federal Reserve,
the Eurosystem continued to provide US dollar funding against collateral eligible for Eurosystem
operations, conducting operations with various maturities on 2, 9, 16, 23 and 30 September.
The ECB also continued to provide Eurosystem counterparties with Swiss franc funding against
euro cash via foreign exchange swap operations. On 24 September the Governing Council of
the ECB decided, in agreement with the Federal Reserve, to continue conducting US dollar
Chart 10 ECB interest rates and the overnight interest rate
(percentages per annum; daily data)
0
1
2
3
4
5
6
0
1
2
3
4
5
6
minimum bid rate/fixed rate in the main refinancing
operations
interest rate on the deposit facility
overnight interest rate (EONIA)
interest rate on the marginal lending facility
marginal rate in the main refinancing operations
Sep.Sep. Nov. Jan. Mar. May July2008 2009
Sources: ECB and Reuters.

27ECB
Monthly Bulletin
October 2009
ECONOMIC AND MONETARYDEVELOPMENTS
Monetary and
financial
developments
liquidity-providing operations with a maturity of seven days until January 2010. All other US dollar
liquidity-providing operations have been discontinued. On the same date, the Governing Council
of the ECB decided, in agreement with the Swiss National Bank, to continue conducting one-week
Swiss franc liquidity-providing swap operations until January 2010.
Finally, the Eurosystem has continued to purchase eligible covered bonds under the programme
started on 6 July. The total value of the covered bonds purchased between 6 July and 7 October
amounted to around €17 billion, as compared with the announced overall amount of direct purchases
of €60 billion.
2.4 BOND MARKETS
Long-term euro area government bond yields decreased slightly in September and in early October, despite the continued rally in the prices of risky assets. Intra-euro area government bond spreads remained broadly unchanged on account of both low liquidity premia and low perceived credit risk. This, together with the further narrowing of corporate bond spreads, appeared to partly refl ect an improvement in the macroeconomic outlook. However, the low level of money market rates is likely to have led many market participants to increase the risk exposure of their bond portfolios. Implied bond market volatility remained broadly unchanged in the euro area, while declining somewhat in the United States.
On 7 October ten-year government bond yields stood at 3.5% in the euro area and 3.2%
in the United States, 7 and 22 basis points below the levels observed at the end of August
(see Chart 11). Thus, the ten-year nominal
interest rate differential between US and
euro area government bonds stood at around
-28 basis points on that date. Ten-year
government bond yields also decreased in
Japan, standing at 1.3% on 7 October. Market
uncertainty concerning short-term developments
in bond yields, as measured by option-implied
volatility, remained broadly unchanged in the
euro area and decreased somewhat in the United
States, returning to the levels observed prior to
the bankruptcy of Lehman Brothers.
In early October euro area sovereign issuers
saw their spreads vis-à-vis German ten-year
government bond yields standing close to the
levels observed at the end of August. Although
those spreads decreased for all countries
throughout September, they then widened again
slightly in the fi nal days of the review period.
Overall, the level of euro area sovereign bond
spreads appears to refl ect not only the narrowing
of the liquidity premia differentials observed
in the last few months, but also low sovereign
Chart 11 Long-term government bond yields
(percentages per annum; daily data)
2.00
2.50
3.00
3.50
4.00
4.50
1.00
1.50
2.00
2.50
3.00
3.50
euro area (left-hand scale)
United States (left-hand scale)
Japan (right-hand scale)
Oct. Dec. Feb. Apr. June Aug. Oct.
2008 2009
Sources: Bloomberg and Reuters.Note: Long-term government bond yields refer to ten-year bonds or to the closest available bond maturity.

28ECB
Monthly Bulletin
October 2009
credit risk, as roughly indicated by CDS spreads. Moreover, the relatively subdued overall level
of long-term interest rates may in part refl ect banks’ strong demand for government bonds.
The low level of money market rates is likely to have led many market participants to increase the
risk exposure of their bond portfolios.
Yields on euro area fi ve-year infl ation-linked
government bonds declined by 21 basis points
to stand at 0.7% on 7 October, while ten-year
real yields declined by 16 basis points to stand
at 1.3% (see Chart 12). The fi ve-year forward
real yield fi ve years ahead decreased by 11 basis
points to stand at 1.9%. Recent developments in
euro area government bond markets – especially
liquidity premia returning to the levels observed
prior to the bankruptcy of Lehman Brothers –
point to a further normalisation of the pricing of
infl ation-linked instruments.
Market-based measures suggest that long-term
infl ation expectations in the euro area remain
well anchored. On 7 October the fi ve and
ten-year spot break-even infl ation rates stood at
1.8% and 2.2% respectively, up slightly from
the levels observed at the end of August. The
implied fi ve-year forward break-even infl ation
rate fi ve years ahead increased by 4 basis points
to stand at 2.6% (see Chart 13).
Chart 12 Euro area zero coupon inflation-linked bond yields
(percentages per annum; fi ve-day moving averages of daily data; seasonally adjusted)
0.5
1.0
1.5
2.0
2.5
3.0
3.5
0.5
1.0
1.5
2.0
2.5
3.0
3.5
Oct. Oct.Dec. Feb. Apr. June Aug.2008 2009
five-year forward inflation-linked bond yield
five years ahead
five-year spot inflation-linked bond yield
ten-year spot inflation-linked bond yield
Sources: Reuters and ECB calculations.
Chart 13 Euro area zero coupon break-even inflation rates
(percentages per annum; fi ve-day moving averages of daily data; seasonally adjusted)
0.4
0.8
1.2
1.6
2.0
2.4
2.8
0.4
0.8
1.2
1.6
2.0
2.4
2.8
five-year forward break-even inflation rate
five years ahead
five-year spot break-even inflation rate
ten-year spot break-even inflation rate
Oct. Dec.2008
Feb. Apr. June2009
Aug. Oct.
Sources: Reuters and ECB calculations.
Chart 14 Implied forward euro area overnight interest rates
(percentages per annum; daily data)
0
1
2
3
4
5
6
0
1
2
3
4
5
6
2009
7 October 2009
31 August 2009
2011 2013 2015 2017 2019
Sources: ECB, EuroMTS (underlying data) and Fitch Ratings (ratings).Notes: The implied forward yield curve, which is derived from the term structure of interest rates observed in the market, refl ects market expectations of future levels for short-term interest rates. The method used to calculate these implied forward yield curves is outlined in the “Euro area yield curve” section of the ECB’s website. The data used in the estimate are euro area AAA-rated government bond yields.

29ECB
Monthly Bulletin
October 2009
ECONOMIC AND MONETARYDEVELOPMENTS
Monetary and
financial
developments
The term structure of forward rates in the euro area shows how the overall behaviour of euro area
long-term yields can be decomposed into changes in interest rate expectations (and related risk
premia) at different horizons (see Chart 14). The implied forward overnight interest rate curve for
euro area government bonds steepened in early October as compared with the end of August. This
mainly refl ects the downward revision of interest rate expectations for medium maturities of the
forward curve.
Corporate bond spreads in the euro area declined further relative to their end-August levels, most
signifi cantly for lower investment-grade fi nancials and speculative-grade bonds. The spreads for
the highest rating class remained at a level corresponding to that observed in early 2008, while the
spreads for high-yield bonds returned to the levels prevailing prior to the bankruptcy of Lehman
Brothers. As in the case of stock prices, the continued narrowing of corporate bond spreads points
to further increases in investor confi dence and risk appetite amid exceptionally low short-term
interest rates.
2.5 INTEREST RATES ON LOANS AND DEPOSITS
In August 2009 further declines were recorded for most MFI interest rates on new loans to and deposits from households and non-fi nancial corporations, with the notable exception of short-term rates for consumer credit. The downward trend observed in MFI interest rates since November 2008 is consistent with the reductions in key ECB interest rates and the declines in money market rates and bond yields over this period. It shows a degree of pass-through which is broadly in line with past regularities.
In August 2009 most short-term MFI interest
rates on new loans and deposits were lower
than they had been in the previous month,
refl ecting the continued – albeit still partial –
pass-through of the substantial declines observed
in money market rates since November 2008
(see Chart 15).
Average MFI interest rates on small short-
term loans to non-fi nancial corporations
decreased by 15 basis points in August 2009,
while average rates on large short-term loans
to such corporations decreased by 6 basis
points. Average rates on overdrafts granted to
non-fi nancial corporations declined by 10 basis
points. At the same time, average rates on
short-term consumer credit granted to households
increased in August for the second consecutive
month, rising by a further 28 basis points, while
average rates on loans to households for house
purchase declined slightly. Looking beyond
the volatility of rates on short-term consumer
Chart 15 Short-term MFI interest rates and a short-term market rate
(percentages per annum; rates on new business)
0.0
1.0
2.0
3.0
4.0
5.0
6.0
7.0
8.0
9.0
10.0
0.0
1.0
2.0
3.0
4.0
5.0
6.0
7.0
8.0
9.0
10.0
20092003 2004 2005 2006 2007 2008
deposits from households redeemable at notice
of up to three months
deposits from households with an agreed maturity
of up to one year
overnight deposits from non-financial corporations
loans to households for consumption with a floating
rate and an initial rate fixation of up to one year
loans to households for house purchase with a floating
rate and an initial rate fixation of up to one year
loans to non-financial corporations of over
€1 million with a floating rate and an initial rate
fixation of up to one year
three-month money market rate
Source: ECB.
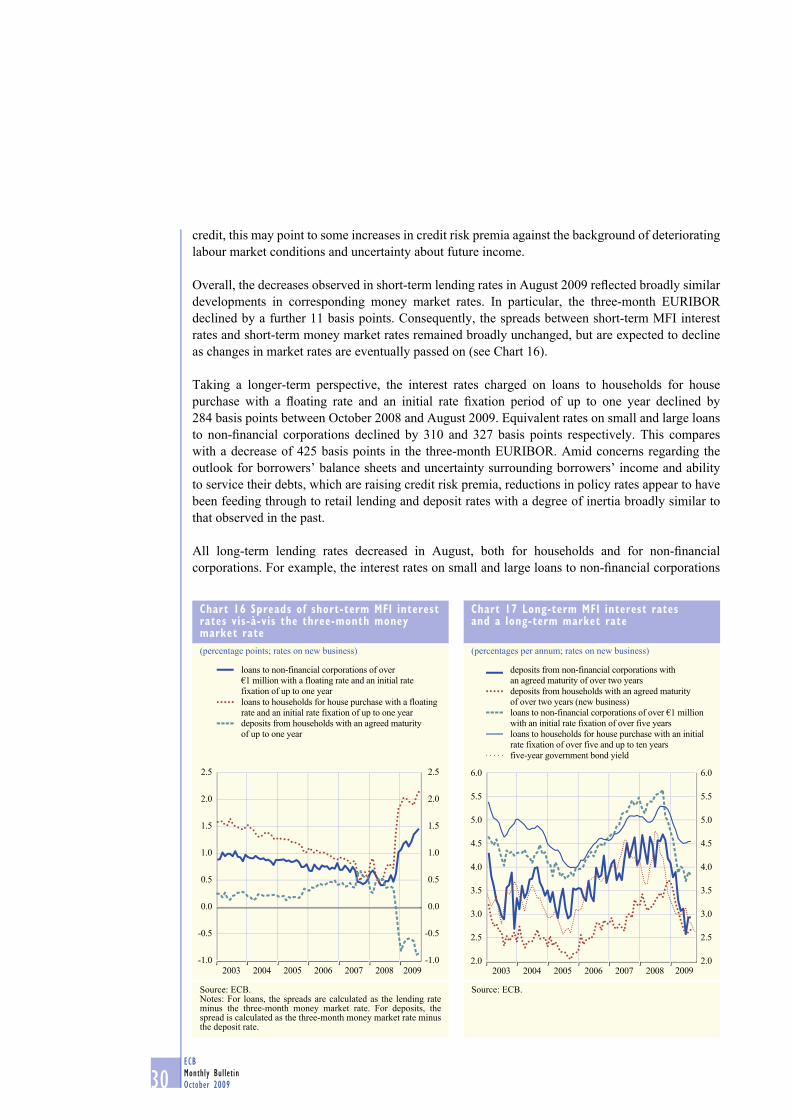
30ECB
Monthly Bulletin
October 2009
credit, this may point to some increases in credit risk premia against the background of deteriorating
labour market conditions and uncertainty about future income.
Overall, the decreases observed in short-term lending rates in August 2009 refl ected broadly similar
developments in corresponding money market rates. In particular, the three-month EURIBOR
declined by a further 11 basis points. Consequently, the spreads between short-term MFI interest
rates and short-term money market rates remained broadly unchanged, but are expected to decline
as changes in market rates are eventually passed on (see Chart 16).
Taking a longer-term perspective, the interest rates charged on loans to households for house
purchase with a fl oating rate and an initial rate fi xation period of up to one year declined by
284 basis points between October 2008 and August 2009. Equivalent rates on small and large loans
to non-fi nancial corporations declined by 310 and 327 basis points respectively. This compares
with a decrease of 425 basis points in the three-month EURIBOR. Amid concerns regarding the
outlook for borrowers’ balance sheets and uncertainty surrounding borrowers’ income and ability
to service their debts, which are raising credit risk premia, reductions in policy rates appear to have
been feeding through to retail lending and deposit rates with a degree of inertia broadly similar to
that observed in the past.
All long-term lending rates decreased in August, both for households and for non-fi nancial
corporations. For example, the interest rates on small and large loans to non-fi nancial corporations
Chart 16 Spreads of short-term MFI interest rates vis-à-vis the three-month money market rate
(percentage points; rates on new business)
-1.0
-0.5
0.0
0.5
1.0
1.5
2.0
2.5
-1.0
-0.5
0.0
0.5
1.0
1.5
2.0
2.5
loans to non-financial corporations of over
€1 million with a floating rate and an initial rate
fixation of up to one year
loans to households for house purchase with a floating
rate and an initial rate fixation of up to one year
deposits from households with an agreed maturity
of up to one year
2003 2004 2005 2006 2007 2008 2009
Source: ECB.Notes: For loans, the spreads are calculated as the lending rate minus the three-month money market rate. For deposits, the spread is calculated as the three-month money market rate minus the deposit rate.
Chart 17 Long-term MFI interest rates and a long-term market rate
(percentages per annum; rates on new business)
2.0
2.5
3.0
3.5
4.0
4.5
5.0
5.5
6.0
2.0
2.5
3.0
3.5
4.0
4.5
5.0
5.5
6.0
2003 2004 2005 2006 2007 2008 2009
deposits from non-financial corporations with
an agreed maturity of over two years
deposits from households with an agreed maturity
of over two years (new business)
loans to non-financial corporations of over €1 million
with an initial rate fixation of over five years
loans to households for house purchase with an initial
rate fixation of over five and up to ten years
five-year government bond yield
Source: ECB.

31ECB
Monthly Bulletin
October 2009
ECONOMIC AND MONETARYDEVELOPMENTS
Monetary and
financial
developments
fell by 9 and 7 basis points respectively. By comparison, the yield on fi ve-year government bonds
decreased by 5 percentage points.
Taking a longer-term perspective, the declines observed between August 2008 and August 2009
for long-term MFI interest rates on loans to households were around half of the 160 basis point
decline seen for government bond yields over that period. Long-term interest rates on small loans
to non-fi nancial corporations declined by 126 basis points between August 2008 and August 2009.
While these developments may primarily refl ect the typically sluggish adjustment of retail bank
interest rates to changes in market rates, they may also point to an increase in credit risk premia. By
contrast, long-term MFI rates on large loans to non-fi nancial corporations declined substantially,
falling by 174 basis points between August 2008 and August 2009.
The profi tability of euro area banks depends, among other things, on loan-deposit margins on
outstanding amounts and new business rates. Both measures remained broadly unchanged between
February and August 2009. This tends to confi rm that banks have passed on the recent reductions in
policy rates to their retail lending and deposit rates to a broadly similar degree.
2.6 EQUITY MARKETS
Euro area and US stock prices continued to increase for most of September and in early October, mainly for the non-fi nancial sector. At the same time, implied stock market volatility remained broadly unchanged. Expected growth in earnings per share 12 months ahead improved signifi cantly for the non-fi nancial sector in the euro area and turned positive for the fi rst time since November 2008. Overall, these developments seem to refl ect more optimistic market views on the outlook for growth. When considering these generally positive signals, the possibility cannot be ruled out that demand for risky assets has been stimulated by the liquidity situation in fi nancial markets.
Between the end of August and 7 October euro
area and US stock markets broadly continued
the rally observed since March, despite
experiencing a correction in the last week of
September. Euro area stock prices, as measured
by the broad-based Dow Jones EURO STOXX
index, and stock prices in the United States, as
measured by the Standard & Poor’s 500 index,
both increased by 4% between the end of
August and 7 October (see Chart 18). Over the
same period, stock prices in Japan, as measured
by the Nikkei 225 index, decreased by 7%.
While the price increases observed in previous
months had been most pronounced for fi nancial
stocks, the review period saw signifi cant gains
also for the non-fi nancial sector. Short-term
Chart 18 Stock price indices
(index: 1 October 2008 = 100; daily data)
55
60
65
70
75
80
85
90
95
100
105
55
60
65
70
75
80
85
90
95
100
105
euro areaUnited StatesJapan
Oct. Dec. Feb. Apr. June Aug. Oct.
2008 2009
Sources: Reuters and Thomson Financial Datastream.Note: The indices used are the Dow Jones EURO STOXX broad index for the euro area, the Standard & Poor’s 500 index for the United States and the Nikkei 225 index for Japan.

32ECB
Monthly Bulletin
October 2009
stock market uncertainty, as measured by
option-implied volatility, remained broadly
unchanged in the euro area, the United States
and Japan (see Chart 19). Although short-term
stock market uncertainty returned to the levels
prevailing prior to the intensifi cation of the
fi nancial crisis in September 2008, it remained
signifi cantly higher than before the onset of the
credit market turmoil in mid-2007.
Developments in euro area stock markets
appeared to refl ect a more optimistic outlook
for economic activity. Indeed, a number of
macroeconomic data releases were generally
viewed by market participants as better than
expected. Moreover, a further increase in investor
confi dence and a further decline in risk aversion
continued to support stock prices in all sectors.
In particular, September saw signifi cant gains
also for the stocks of non-fi nancial corporations.
In the euro area, the strongest gains were
recorded in the health care and industrial sectors
(both 6%).
While actual earnings growth for euro
area listed companies remained depressed
in September, expected earnings growth
increased, mainly as a result of a signifi cant improvement in expectations for the non-fi nancial
sector. Actual monthly earnings-per-share growth for the fi rms covered by the Dow Jones
EURO STOXX index stood at -3.7% in September, up from -3.9% in August. For the stocks of
the fi nancial sector, monthly earnings-per-share growth turned positive to stand at 0.6%. By
contrast, strong declines were observed for consumer services and basic materials (-17.7% and
-11.6% respectively). Analysts expected earnings per share 12 months ahead to increase by
11.5% (compared with 5.6% in August). This substantial increase in earnings growth expectations
is primarily due to the improved outlook for non-fi nancial corporations (for which expected earnings
growth stood at 6.4%, up from -0.7% in August), especially in the consumer services, industrial
and consumer goods sectors. It should be noted that in September, the expected growth of earnings
per share for the non-fi nancial sector turned positive for the fi rst time since November 2008. For
the fi nancial sector, earnings per share were expected to increase by 24.7% in the next 12 months
(up from 22.1% in August). The euro area price/earnings ratio continued to increase in September,
especially for the fi nancial sector, standing above its historical average for the fi rst time since
July 2007.
Notwithstanding the positive indications stemming from recent data releases and earnings
expectations, the possibility cannot be ruled out that the continuation of the rally in the prices of
risky assets has, to some extent, been stimulated by the liquidity situation in fi nancial markets.
The low level of money market rates may have led some investors to allocate a larger share of their
funds to riskier asset classes.
Chart 19 Implied stock market volatility
(percentages per annum; fi ve-day moving average of daily data)
10
20
30
40
50
60
70
80
90
100
10
20
30
40
50
60
70
80
90
100
euro area
United States
Japan
Oct. Oct.Dec. Feb. Apr. June Aug.2008 2009
Source: Bloomberg.Notes: The implied volatility series refl ects the expected standard deviation of percentage changes in stock prices over a period of up to three months, as implied in the prices of options on stock price indices. The equity indices to which the implied volatilities refer are the Dow Jones EURO STOXX 50 for the euro area, the Standard & Poor’s 500 for the United States and the Nikkei 225 for Japan.

33ECB
Monthly Bulletin
October 2009
ECONOMIC AND MONETARYDEVELOPMENTS
Monetary and
financial
developments
Box 2
THE RESULTS OF THE FIRST ROUND OF THE “SURVEY ON THE ACCESS TO FINANCE OF SMALL
AND MEDIUM-SIZED ENTERPRISES IN THE EURO AREA”
This box presents the results of the fi rst round of the “Survey on the access to fi nance of small and
medium-sized enterprises in the euro area”.1 The survey was conducted by the ECB in cooperation
with the European Commission between 17 June and 23 July 2009 and covered 6,000 small and
medium-sized enterprises (SMEs), as well as large fi rms, in the euro area.2 It provides evidence
on changes in the fi nancing conditions of euro area SMEs and large fi rms, with respect to the
previous six months, i.e. broadly corresponding to the fi rst half of 2009. Given that this is the
fi rst time the survey has been conducted, the results described below should be interpreted
with caution.
The fi nancial situation of euro area SMEs in the fi rst half of 2009
A net percentage 3 of around one-quarter of the respondent euro area SMEs (27%) reported a
decrease in their turnover in the fi rst half of 2009 (see Chart A), whereas large fi rms provided
a somewhat less negative assessment (15%).
At the same time, a net percentage of 23% of
the SMEs reported an increase in their labour
costs and a net 25% reported an increase in
other costs (e.g. material and energy costs).
These turnover and cost developments had a
negative impact on fi rms’ profi ts (net income
after taxes). In fact, a net percentage of 38%
of the SMEs and a somewhat lower 33% of the
large fi rms reported a decrease in their profi ts
in the fi rst half of 2009. Hence, it appears that
over the reporting period SMEs were somewhat
more affected by the economic downturn.
The survey results confi rm the weak overall
demand in the fi rst half of 2009. In fact, the
most pressing problem confronting euro area
SMEs during that period was to fi nd customers
(27% selected this reply). This was followed
by “access to fi nance”, which was reported as
the most pressing issue by 17% of the SMEs,
especially smaller ones. Competition (reported
by 14% of the SMEs as the most pressing
problem), production costs (notably labour
costs) and a lack of skilled workers were also
1 See European Central Bank (2009), “Survey on the access to fi nance of small and medium-sized enterprises in the euro area”,
September.
2 SMEs include micro fi rms (1-9 employees), small fi rms (10-49 employees) and medium-sized fi rms (50-249 employees). Large fi rms
are defi ned as fi rms with 250 or more employees.
3 The net percentage of fi rms reporting an increase (decrease) is calculated as the difference between the percentage of fi rms reporting
“increases” (“decreases”) and the percentage reporting “decreases” (“increases”).
Chart A Selected indicators of the financial situation of euro area firms, change over the preceding six months
(percentages of respondents)
100
90
80
70
60
50
40
30
20
10
0
100
90
80
70
60
50
40
30
20
10
0
1 Turnover
2 Labour costs
Large firmsSMEs
increased
remained unchanged
decreased
don’t know/no answer
3 Other costs
4 Profits
1 2 3 4 1 2 3 4
Source: ECB/European Commission survey on the access to fi nance of SMEs.

34ECB
Monthly Bulletin
October 2009
seen as most pressing issues (both of the latter
two were reported by 9% of the SMEs).
External fi nancing needs of euro area SMEs in the fi rst half of 2009
Nearly half of the fi rms (49% of the SMEs and
46% of large fi rms) reported that their need for
bank loans had remained unchanged in the fi rst
half of 2009 (see Chart B). At the same time,
the share of the SMEs reporting an increase
in their bank fi nancing needs was somewhat
higher than the share of those reporting a
decline. As a result, in net terms, 11% of the
SMEs reported an increase in their need for
bank loans, compared with 5% in the case of
large fi rms. Regarding trade credit, a net 4% of
the SMEs reported an increased need for trade
credit, while the net percentage for large fi rms
equalled 0%.
Fixed investment was regarded the most
important factor that contributed to increasing
fi nancing needs. A net percentage of 8% and
9% of the SMEs and large fi rms respectively
reported that fi xed investment had increased
their need for external fi nancing during the
preceding six months. External fi nancing
needs for inventories and working capital
appear to have increased somewhat as well.
Applications for external fi nancing
In the fi rst half of 2009, a minority of fi rms
(28% of the SMEs and 34% of the large
fi rms) reported that they had applied for bank
loans, i.e. either a new loan or a renewal of an
existing loan. The main reason for not applying
for a loan was suffi cient availability of internal
funds (reported by 37% of the SMEs and 38%
of the large fi rms). Only 5% of the SMEs
reported that they did not apply because they
thought their application might be rejected.
Of the SMEs that had applied for bank loans
in the fi rst half of 2009, 77% reported that they
had received all or part of the amount requested
(see Chart C). By contrast, 12% of the SMEs
Chart B External financing needs of euro area firms, change over the preceding six months
(percentages of respondents)
Bank loans Trade credit Bank loans Trade credit
SMEs Large firms
increased
remained unchanged
decreased
instrument is not applicable to my firm
don’t know/no answer
0
10
20
30
40
50
60
70
80
90
100
0
10
20
30
40
50
60
70
80
90
100
Source: ECB/European Commission survey on the access to fi nance of SMEs.
Chart C Outcome of the applications for external financing by euro area firms over the preceding six months
(percentages of fi rms that have applied for external fi nancing)
100
90
80
70
60
50
40
30
20
10
0
100
90
80
70
60
50
40
30
20
10
0
Large firmsSMEs
applied and got everything
applied but only got part of it
applied but refused because cost too high
applied but was rejected
don’t know/no answer
Bank loan
(new or
renewal)
Trade credit Bank loan
(new or
renewal)
Trade credit
Source: ECB/European Commission survey on the access to fi nance of SMEs.

35ECB
Monthly Bulletin
October 2009
ECONOMIC AND MONETARYDEVELOPMENTS
Monetary and
financial
developments
reported that their application had been rejected
by the bank. The larger and the older the fi rms,
the more successful they were in obtaining a
loan. For instance, only 5% of the large fi rms
had their loan applications rejected. Regarding
trade credit and other external fi nancing, the
picture is broadly similar. The majority of
fi rms that had applied for trade credit or other
external fi nancing in the fi rst half of 2009 had
received the full amount requested.
Availability of external fi nancing for euro area SMEs in the fi rst half of 2009
The fi rms that had applied for any category
of external fi nancing in the fi rst half of 2009
were also asked whether the availability of
the various external fi nancing alternatives
had improved or deteriorated over that period.
A net 33% of those SMEs reported a
deterioration in the availability of bank
loans (for new loans or the renewal of
an existing loan) in the fi rst half of 2009
(see Chart D). This net percentage was higher for large fi rms (41%). By contrast, for trade
credit a somewhat higher net percentage of the SMEs (20%) than of large fi rms (15%) reported
a deterioration.
The availability of external fi nancing depends on various factors, including the general
economic outlook, the fi rm-specifi c situation and the attitude of lenders. A sizeable net
percentage of 54% of the euro area SMEs considered that the general economic outlook had
had a negative impact on the availability of fi nancing, while a lower net percentage (27%)
of the SMEs assessed their fi rm-specifi c situation as having deteriorated in the fi rst half of
2009 (see Chart E). In addition, a net percentage of 10% and 6% respectively of the SMEs
reported that their fi rm’s own capital and credit history had deteriorated over the previous six
months. Overall, this indicates that the general economic situation in the fi rst half of 2009 was
the most important factor behind the deterioration in the availability of fi nancing. Regarding
the supply-side effects on the availability of external fi nancing, a net percentage of 25% of
the SMEs reported that banks’ willingness to provide a loan had decreased over the preceding
six months, while 37% of the SMEs reported that banks’ willingness had remained unchanged.
The smaller the fi rm, the larger was the net percentage reporting such a deterioration.
The willingness of business partners to provide trade credits or of investors to invest in equity
or debt securities was also judged to have decreased, although less markedly than that of banks.
Terms and conditions of bank loans
As regards the terms and conditions of bank loans, a net 5% of the SMEs reported that the level
of interest rates had increased in the fi rst half of 2009. Non-interest terms and conditions appear
to have played a more important role in the deterioration of the availability of external fi nancing.
Chart D Availability of external financing for euro area firms, change over the preceding six months
(percentages of fi rms that had applied for external fi nancing)
100
90
80
70
60
50
40
30
20
10
0
100
90
80
70
60
50
40
30
20
10
0Trade credit Trade creditBank loans Bank loans
Large firms
improved
remained unchanged
deteriorated
not applicable to my firm
don’t know/no answer
SMEs
Source: ECB/European Commission survey on the access to fi nance of SMEs.

36ECB
Monthly Bulletin
October 2009
The net percentage of SMEs reporting
an increase in the cost of fi nancing other
than interest rates (e.g. charges, fees and
commissions) was much higher (33%) than
that reporting an increase in interest rates. In
addition, a considerable net percentage of
the SMEs reported an increase in collateral
requirements (32%) and in other non-
price terms and conditions, such as loan
covenants and information requirements
(32%). A smaller net percentage of the
SMEs reported a decrease in the available
size of the loan or credit line (5%) or in the
available loan maturity (2%). At the same
time, the majority of the fi rms reported that
non-price terms and conditions had not
changed in the fi rst half of 2009.
Expectations regarding access to fi nancing
Looking forward, the majority of the SMEs
expected their access to fi nancing in the second
half of 2009 to remain broadly unchanged
across an array of fi nancing alternatives
(i.e. bank loans, trade credit, etc.). In addition,
the proportion of SMEs that expected the
availability of fi nancing to deteriorate was
only slightly larger than that expecting an
improvement. For example, a net percentage
of 2% of the SMEs expected the availability of internal fi nancing to deteriorate in the
second half of 2009; for bank loans, the corresponding fi gure was 4%. Large fi rms, by contrast,
were somewhat more optimistic in their expectations regarding their access to fi nance in the
second half of 2009. Regarding the growth outlook over the next two to three years, the SMEs
expected their average turnover growth to be lower, on balance, than the growth they had
experienced in the previous three years. At the same time, nearly 40% of the SMEs did not
foresee obstacles in obtaining the fi nancing for their medium-term growth aspirations.
Chart E Factors having an impact on the availability of financing to euro area SMEs, changes over the preceding six months
(percentages of respondents)
1 General economic outlook
2 Access to public financial support including guarantees
3 Your firm-specific outlook with respect to your sales and
profitability or business plan
4 Your firm’s own capital
5 Your firm’s credit history
6 Willingness of banks to provide a loan
7 Willingness of business partners to provide trade credit
8 Willingness of investors to invest in equity or debt
securities issued by firm
improved
remained unchanged
deteriorated
not applicable/did not want to use
don’t know/no answer
0
20
40
60
80
100
0
20
40
60
80
100
1 2 3 4 5 76 8
Source: ECB/European Commission survey on the access to fi nance of SMEs.
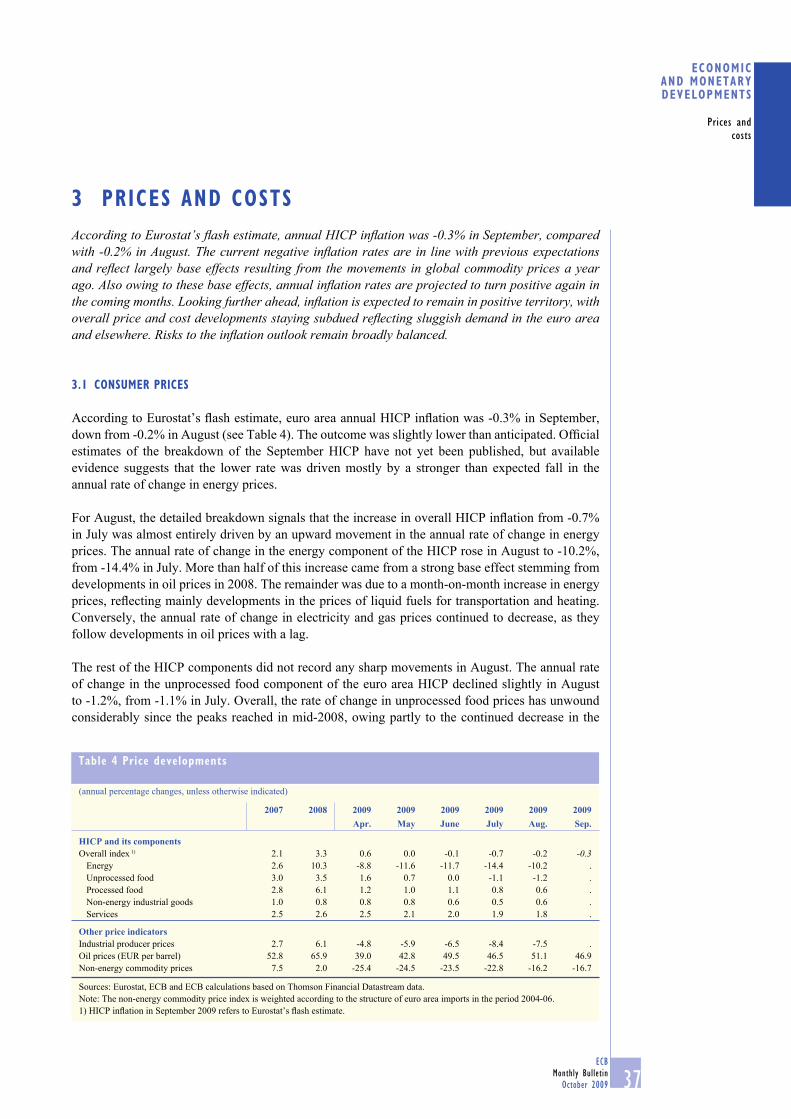
37ECB
Monthly Bulletin
October 2009
ECONOMIC AND MONETARYDEVELOPMENTS
Prices and
costs
According to Eurostat’s fl ash estimate, annual HICP infl ation was -0.3% in September, compared with -0.2% in August. The current negative infl ation rates are in line with previous expectations and refl ect largely base effects resulting from the movements in global commodity prices a year ago. Also owing to these base effects, annual infl ation rates are projected to turn positive again in the coming months. Looking further ahead, infl ation is expected to remain in positive territory, with overall price and cost developments staying subdued refl ecting sluggish demand in the euro area and elsewhere. Risks to the infl ation outlook remain broadly balanced.
3.1 CONSUMER PRICES
According to Eurostat’s fl ash estimate, euro area annual HICP infl ation was -0.3% in September,
down from -0.2% in August (see Table 4). The outcome was slightly lower than anticipated. Offi cial
estimates of the breakdown of the September HICP have not yet been published, but available
evidence suggests that the lower rate was driven mostly by a stronger than expected fall in the
annual rate of change in energy prices.
For August, the detailed breakdown signals that the increase in overall HICP infl ation from -0.7%
in July was almost entirely driven by an upward movement in the annual rate of change in energy
prices. The annual rate of change in the energy component of the HICP rose in August to -10.2%,
from -14.4% in July. More than half of this increase came from a strong base effect stemming from
developments in oil prices in 2008. The remainder was due to a month-on-month increase in energy
prices, refl ecting mainly developments in the prices of liquid fuels for transportation and heating.
Conversely, the annual rate of change in electricity and gas prices continued to decrease, as they
follow developments in oil prices with a lag.
The rest of the HICP components did not record any sharp movements in August. The annual rate
of change in the unprocessed food component of the euro area HICP declined slightly in August
to -1.2%, from -1.1% in July. Overall, the rate of change in unprocessed food prices has unwound
considerably since the peaks reached in mid-2008, owing partly to the continued decrease in the
3 PRICES AND COSTS
Table 4 Price developments
(annual percentage changes, unless otherwise indicated)
2007 2008 2009 2009 2009 2009 2009 2009Apr. May June July Aug. Sep.
HICP and its componentsOverall index 1) 2.1 3.3 0.6 0.0 -0.1 -0.7 -0.2 -0.3
Energy 2.6 10.3 -8.8 -11.6 -11.7 -14.4 -10.2 .
Unprocessed food 3.0 3.5 1.6 0.7 0.0 -1.1 -1.2 .
Processed food 2.8 6.1 1.2 1.0 1.1 0.8 0.6 .
Non-energy industrial goods 1.0 0.8 0.8 0.8 0.6 0.5 0.6 .
Services 2.5 2.6 2.5 2.1 2.0 1.9 1.8 .
Other price indicatorsIndustrial producer prices 2.7 6.1 -4.8 -5.9 -6.5 -8.4 -7.5 .
Oil prices (EUR per barrel) 52.8 65.9 39.0 42.8 49.5 46.5 51.1 46.9
Non-energy commodity prices 7.5 2.0 -25.4 -24.5 -23.5 -22.8 -16.2 -16.7
Sources: Eurostat, ECB and ECB calculations based on Thomson Financial Datastream data.
Note: The non-energy commodity price index is weighted according to the structure of euro area imports in the period 2004-06.
1) HICP infl ation in September 2009 refers to Eurostat’s fl ash estimate.

38ECB
Monthly Bulletin
October 2009
annual rate of change in meat prices, following the reversal of the food price shock on global
markets. The annual rate of growth in processed food prices declined from 0.8% in July to 0.6%
in August, its smallest rate of increase since 1999. This low rate was mostly the result of further
declines in the growth rates of the prices of cereals, dairy products and oils, as the strong rates of
growth observed last year unwound.
The annual rate of growth in non-energy industrial goods prices increased slightly in August to
0.6%, from 0.5% in July. This modest increase was due mostly to the contribution of clothing
prices and stemmed from the pattern of seasonal discounting. Overall, the annual infl ation rate of
non-energy industrial goods prices has been on a slightly downward trend over the past year, driven
primarily by durable goods – particularly cars – and to a lesser extent by semi-durable goods, which
mirrors mainly movements in the prices of clothing and footwear.
Services price infl ation edged down further to 1.8% in August, from 1.9% in July, mostly on account
of a decline in the infl ation rate of holiday-related services (such as restaurants, accommodation and
air transport). Weak consumer demand and the lagged pass-through of past declines in commodity
prices contributed to the declines in these items of the HICP services component.
Refl ecting offsetting developments in non-energy industrial goods and services price infl ation,
HICP infl ation excluding all food and energy items remained stable at 1.3% in August. Recent
developments in non-energy industrial goods prices and services prices are discussed in more detail
in Box 3.
Chart 20 Breakdown of HICP inflation: main components
(annual percentage changes; monthly data)
-3
-2
-1
0
1
2
3
4
5
-15
-10
-5
0
5
10
15
20
25
2004 2005 2006 2007 2008 2009
total HICP (left-hand scale)
unprocessed food (left-hand scale)
energy (right-hand scale)
-1
1
2
3
4
-2
2
4
6
8
2004 2005 2006 2007 2008 2009
0 0
total HICP excluding energy and unprocessed food
(left-hand scale)
processed food (right-hand scale)
non-energy industrial goods (left-hand scale)
services (left-hand scale)
Source: Eurostat.

39ECB
Monthly Bulletin
October 2009
ECONOMIC AND MONETARYDEVELOPMENTS
Prices and
costs
Box 3
RECENT TRENDS IN THE HICP EXCLUDING FOOD AND ENERGY
Most of the volatility observed in headline HICP infl ation in the recent past has been driven by
the contributions of its food (both processed and unprocessed) and energy components, which are
strongly infl uenced by external factors. By contrast, developments in the HICP excluding food
and energy, representing around 70% of the total index in terms of weighting, have shown a
much lower degree of volatility. This refl ects rather smooth developments in the prices of its two
components, non-energy industrial goods and services, which are to a greater extent determined
by factors related to economic fundamentals. At the current juncture, it is particularly insightful
to look at the less volatile components of the HICP in order to analyse the forces driving infl ation.
The negative gap between the annual rates of change in the overall HICP and in the HICP
excluding food and energy has been gradually increasing since the beginning of 2009, almost
amounting to -2 percentage points in July 2009 (see Chart A). This unprecedented large negative
gap can be attributed to the unusually strong developments in the food and energy components
of the HICP since mid-2007.1 While overall HICP infl ation was negative over the summer of
2009 and is expected to turn positive again in the coming months, the annual rate of change in
the HICP excluding food and energy has been on a downward path since mid-2008 and shows no
sign of reversing in the short-term.
Developments in the prices of the two less volatile components of the HICP, non-energy industrial
goods and services, are largely determined by the same main drivers. While external factors have
some infl uence, domestic factors, such as wages and profi t mark-ups, play a dominant role in
the determination of non-food, non-energy consumer price developments. Wage developments
typically depend on conditions in the labour market, productivity, and past and expected infl ation.
At the same time, domestic demand and
competition factors are crucial determinants of
the profi t mark-up.
From the external side, price developments
in the HICP excluding food and energy are
infl uenced by the transmission of changes in
prices of imported inputs along the domestic
chain of production. They are also affected
by the prices of goods and services directly
imported for fi nal consumption. In this
respect, the overall moderation in commodity
prices, the easing of global infl ation and the
recent strengthening of the euro have lowered
external price pressures and therefore have a
dampening impact on non-food, non-energy
consumer price developments. Beyond the
impact of external factors, the moderation in
1 For more information, see the box entitled “Recent developments in selected measures of underlying infl ation for the euro area” in the
June 2009 issue of the Monthly Bulletin.
Chart A Overall HICP and HICP excluding food and energy
(annual percentage changes)
5
4
3
2
1
0
-12002 2003 2004 2005 2006 20082007 2009
overall HICP (1) (left-hand scale)
HICP excluding food and energy (2) (left-hand scale)
gap between (1) and (2) (right-hand scale)
-2
0
2
4
6
8
10
Source: Eurostat.

40ECB
Monthly Bulletin
October 2009
HICP infl ation excluding food and energy since mid-2008 has, however, been due mostly to
the easing of domestic demand pressures. This can be shown by its close relationship with the
developments in the annual growth rate of the GDP defl ator, which is a summary indicator of
unit labour cost and profi t developments (see Chart B).
The annual growth rate of the GDP defl ator peaked at 2.5% in the last quarter of 2008 and
declined signifi cantly to 1.1% in the second quarter of 2009. This was almost entirely due to
the strong decrease in the contribution of unit profi t growth, which turned negative in the fi rst
quarter of 2009 (see Chart C), refl ecting the sharp drop in domestic demand. By contrast, over
the same period, the contribution of unit labour cost growth remained particularly strong. This
was due partly to the fact that several wage agreements were entered into before the worsening
of economic conditions in 2008. In addition, it refl ected a signifi cant drop in productivity as
employment reacted with a lag to the fall in GDP. Unit labour cost growth started to decrease,
however, in the second quarter of 2009 on account of a smaller decline in productivity growth
and a weakening of growth in compensation per employee.
The recent evolution of profi t mark-ups refl ects the depressed economic environment,
characterised by considerable slack and weak consumer demand. Indeed, downward shocks
to demand are an important factor in a decision to lower prices.2 This is consistent with a
relatively large share of price declines, in year-on-year terms, in items of the HICP excluding
food and energy through most of 2009 when compared with the average share of price declines
over the last ten years (see Chart D). This means that the prices of a number of HICP items –
for instance cars and passenger air transport – have been displaying negative annual rates of
growth for several consecutive months, which was not often the case in the past.
2 See the article entitled “Price-setting behaviour in the euro area” in the November 2005 issue of the Monthly Bulletin.
Chart B GDP deflator and the HICP excluding food and energy
(annual percentage changes)
0
1
2
3
0
1
2
3
HICP excluding food and energy (monthly data)
GDP deflator (quarterly data)
1996 1998 2000 2002 2004 2006 2008
Source: Eurostat.
Chart C Decomposition of the GDP deflator
(annual percentage changes; percentage points)
unit labour costs
unit profit
unit tax
GDP deflator
-2
-1
0
1
3
4
2002 2003 2004 2005 2006 2007 2008
2
-2
-1
0
1
2
3
4
Source: Eurostat.

41ECB
Monthly Bulletin
October 2009
ECONOMIC AND MONETARYDEVELOPMENTS
Prices and
costs
3.2 INDUSTRIAL PRODUCER PRICES
Supply chain price pressures remain very subdued. However, the annual rate of change in industrial
producer prices (excluding construction) rose in August to -7.5%, from -8.4% in July. This
development was largely driven by the energy component on account of positive base effects and
increased energy prices in August. As a result, the annual rate of change in the energy component
rose to -16.9% in August, from -19.9% in July. Excluding energy (and construction), annual
producer price infl ation decreased slightly further to -4.2% in August, compared with -4.1% in
the previous month, with sub-components presenting a mixed picture. The annual rate of change
in intermediate goods prices increased slightly to -7.4% in August, from -7.5% in July, owing to
higher industrial raw materials prices. Conversely, at the latter stages of the production chain, the
annual rates of change in capital goods and consumer goods prices declined further in August to
-0.2% and -2.6% respectively (see Chart 21).
Survey data on the price-setting behaviour of fi rms over recent months also indicates that downward
price pressures are moderating (see Chart 22). With regard to the Purchasing Managers’ Index, the
indices for input prices and prices charged in the manufacturing sector increased in September,
signalling an easing in downward price pressures. Conversely, for the services sector, the indices
declined somewhat compared with the previous month, possibly refl ecting increased competition.
The indices for both sectors signal downward pressures on prices compared with the previous
month, as they remain below 50.
Currently falling car prices, as recorded by the
HICP, are explained mainly by weak domestic
demand and strong competition. In the case
of air transport prices, domestic and external
factors are exerting a combined infl uence. The
annual rate of change in HICP passenger air
transport prices has been strongly decreasing
since mid-2008, turning negative in March
2009. In the second half of 2008, this
development was due mainly to the decrease
in oil prices, which seems to have been passed
through to consumer prices with a lag. More
recently, however, the weakness in demand
is likely to have played an important role,
affecting, in particular, holiday-related services
prices, in a very competitive environment.
Looking ahead, the expected developments in the drivers of infl ation in the HICP excluding food
and energy would suggest that the slight downward path in this measure will continue, with its
extent and duration depending crucially on the timing and strength of the recovery. Indeed, in
the current environment, downward pressures on infl ation from domestic factors should remain.
In particular, in the context of deteriorating labour markets, subdued wage developments should
reduce cost pressures. In the light of an expected increase in overall HICP infl ation, driven by
strong base effects, this suggests that the gap between overall HICP infl ation and HICP infl ation
excluding food and energy is likely to close in the near future.
Chart D Share of HICP excluding food and energy items with negative annual rates of change
(percentages)
Aug.JulyJuneMayApr.Mar.Feb.Jan.
25
20
15
10
5
0
25
20
15
10
5
0
2009average 1999-2008
Source: Eurostat. Note: The shares are calculated using the expenditure weights of the items included in the HICP excluding food and energy.

42ECB
Monthly Bulletin
October 2009
3.3 LABOUR COST INDICATORS
Labour cost growth, which had peaked at the end of 2008, continued on the whole to decline in the
second quarter of 2009, refl ecting both lower wage growth and fewer hours worked. Developments
in these two variables have caused some differences in the behaviour of the annual rates of growth in
negotiated wages, compensation per employee and hourly labour costs (see Chart 23 and Table 5).
The annual rate of growth in negotiated wages
in the euro area dropped from 3.2% in the fi rst
quarter of 2009 to 2.8% in the second quarter.
This fall is likely to have refl ected workers’
reduced bargaining power as a consequence of
the sharp downturn in activity, the increase in
unemployment and the steep fall in infl ation.
As negotiated wages capture agreed wage
increases through collective agreements,
this indicator tends to react to changes in
economic conditions with a lag. Indeed, the
annual rate of growth in negotiated wages in
the second quarter is higher than that registered
in any other quarter between 1997 and 2007.
Available information signals that the annual
rate of growth in negotiated wages may have
slowed further at the beginning of the third
quarter of 2009.
Chart 21 Breakdown of industrial producer prices
(annual percentage changes; monthly data)
-10
-8
-6
-4
-2
0
2
4
6
8
10
-25
-20
-15
-10
-5
0
5
10
15
20
25
total industry excluding construction (left-hand scale)
intermediate goods (left-hand scale)capital goods (left-hand scale)
consumer goods (left-hand scale)energy (right-hand scale)
2004 2005 2006 2007 2008 2009
Sources: Eurostat and ECB calculations.
Chart 22 Producer input and output price surveys
(diffusion indices; monthly data)
20
30
40
50
60
70
80
20
30
40
50
60
70
80
2009
manufacturing; input prices
manufacturing; prices charged
services; input prices
services; prices charged
2004 2005 2006 2007 2008
Source: Markit.Note: An index value above 50 indicates an increase in prices, whereas a value below 50 indicates a decrease.
Chart 23 Selected labour cost indicators
(annual percentage changes; quarterly data)
1.0
1.5
2.0
2.5
3.0
3.5
4.0
4.5
1.0
1.5
2.0
2.5
3.0
3.5
4.0
4.5
compensation per employee
negotiated wages
hourly labour costs
2002 2003 2004 2005 2006 2007 2008
Sources: Eurostat, national data and ECB calculations.

43ECB
Monthly Bulletin
October 2009
ECONOMIC AND MONETARYDEVELOPMENTS
Prices and
costs
The annual growth rate of compensation per employee declined further to 1.6% in the second
quarter of 2009, from 1.8% in the fi rst quarter. This deceleration was broad based in the euro area.
The further moderation in the annual growth rate of this indicator refl ected lower wage growth,
shorter working hours and cuts in fl exible pay elements. At 1.6%, euro area compensation per
employee grew in the second quarter of the year at its lowest annual rate since the beginning of
monetary union and was about 1 percentage point below its average since 1999. The sectoral
decomposition indicates that the slowdown in the growth of compensation per employee in the
second quarter of 2009 was mostly driven by developments in industry (excluding construction)
and non-market services. In industry, the annual rate of change in compensation per employee
became negative, while in market services the annual rate of growth in compensation per employee
increased after falling to a record low in the fi rst quarter (see Chart 24).
The annual growth rate of hourly labour costs in the euro area remained high at 4.0% in the second
quarter of 2009, rebounding somewhat from the weaker rate recorded in the fi rst quarter of the
year. The persistently strong growth in hourly labour costs is apparently still driven by the impact
of the various measures taken to reduce the number of hours worked per employee in several euro
area economies, as the reduction in hours worked is often accompanied by a less than proportional
Table 5 Labour cost indicators
(annual percentage changes, unless otherwise indicated)
2007 2008 2008Q2
2008Q3
2008Q4
2009Q1
2009Q2
Negotiated wages 2.1 3.2 2.9 3.4 3.6 3.2 2.8
Total hourly labour costs 2.5 3.4 2.5 3.6 4.2 3.6 4.0
Compensation per employee 2.5 3.2 3.1 3.5 2.9 1.8 1.6
Memo items:Labour productivity 1.0 -0.1 0.3 0.0 -1.7 -3.7 -3.1
Unit labour costs 1.5 3.2 2.8 3.5 4.6 5.8 4.8
Sources: Eurostat, national data and ECB calculations.
Chart 24 Sectoral labour cost developments
(annual percentage changes; quarterly data)
-1
0
1
2
3
4
5
6
7
-1
0
1
2
3
4
5
6
7
industry excluding construction, CPE
construction, CPE
market services, CPE
services, CPE
2002 2003 2004 2005 2006 2007 2008 2009-1
0
1
2
3
4
5
6
7
-1
0
1
2
3
4
5
6
7
industry excluding construction, hourly LCIconstruction, hourly LCI
market services, hourly LCI
2002 2003 2004 2005 2006 2007 2008 2009
Sources: Eurostat and ECB calculations.Note: CPE stands for “compensation per employee” and LCI stands for “labour cost index”.

44ECB
Monthly Bulletin
October 2009
decrease in remuneration.1 Owing to the fact that the industrial sector is most strongly affected
by such adjustment measures, in the second quarter of 2009 hourly labour costs increased more
in year-on-year terms in this sector – by 5.3%, compared with 4.5% in the construction sector
and 3.2% in the services sector. Moreover, the fact that Easter fell in the second quarter in 2009
(as opposed to the fi rst quarter in 2008) also implied a reduction in hours worked in year-on-year
terms, which boosted hourly labour costs in the second quarter of 2009.
Annual productivity in terms of output per employee contracted less in the second quarter of 2009
than in the fi rst quarter – by 3.1%, compared with 3.7%. This smaller fall in productivity, combined
with the slowdown in the annual rate of growth in compensation per employee, helped to ease
somewhat the annual growth in unit labour costs to 4.8% in the second quarter of 2009, from 5.8%
in the fi rst quarter. Considering that its average level since the start of monetary union is 1.8%,
annual unit labour cost growth remains, nevertheless, very high.
3.4 THE OUTLOOK FOR INFLATION
Over the short term, the outlook for annual HICP infl ation will continue to be shaped mainly
by base effects relating to energy price movements in 2008. Also owing to base effects, annual
infl ation rates are projected to turn positive in the coming months. Looking further ahead, infl ation
is expected to remain in positive territory, with overall price and cost developments remaining
subdued on account of ongoing sluggish demand in the euro area and elsewhere.
Risks to the outlook for price developments remain broadly balanced. They relate, in particular, to
the outlook for economic activity and to the evolution of commodity prices. Furthermore, increases
in indirect taxation and administered prices may be stronger than currently expected owing to the
need for fi scal consolidation in the coming years.
1 See also the box entitled “Labour market adjustments during the current contraction of economic activity” in the June 2009 issue of the
Monthly Bulletin.

45ECB
Monthly Bulletin
October 2009
ECONOMIC AND MONETARYDEVELOPMENTS
Output,
demand and the
labour market
4 OUTPUT, DEMAND AND THE LABOUR MARKET
Following the strong negative growth rates observed around the turn of the year, economic activity in the euro area declined only slightly in the second quarter of 2009. Available survey indicators continue to signal an ongoing stabilisation of economic activity. In particular, the euro area should benefi t from a recovery in exports, the signifi cant macroeconomic stimulus under way and the measures taken to restore the functioning of the fi nancial system. In addition, following the substantial negative contributions in the fi rst half of 2009, the inventory cycle is expected to contribute positively to real GDP growth in the second half of the year. Overall, the recovery is expected to remain rather uneven. It will be supported in the short term by a number of temporary factors, but is likely to be affected over the medium term by the process of ongoing balance sheet correction in the fi nancial and non-fi nancial sectors of the economy, both inside and outside the euro area. The risks to this outlook remain broadly balanced. However, uncertainty remains high and the persistent volatility in incoming data warrants a cautious interpretation of available information.
4.1 REAL GDP AND DEMAND COMPONENTS
The pace of the decline in euro area activity slowed markedly in the second quarter of 2009.
According to Eurostat’s second estimate, released on 7 October, euro area real GDP contracted by
0.2% (quarter on quarter) in the second quarter of 2009, after a decline of 2.5% in the fi rst quarter
of 2009 (see Chart 25).
Eurostat’s second estimate confi rmed that the fall in second quarter real GDP was driven
by a large negative contribution from inventories and a slight negative contribution from domestic
demand, which were largely offset by a positive contribution from net trade. The second quarter
release marks the fi rst improvement in euro
area quarterly GDP growth since the beginning
of 2008 and confi rms the view that economic
activity in the euro area tended to stabilise in the
spring, after the declines recorded in the previous
three quarters.
Private consumption growth returned to positive
territory in the second quarter of 2009 after
contracting sharply in the previous two quarters.
According to Eurostat’s second estimate, private
consumption grew by 0.1% (quarter on quarter)
in the second quarter.
Survey-based indicators of private consumption
continue to signal an improvement in consumer
sentiment. In fact, euro area consumer confi dence
continued to increase in September, rising for
the sixth consecutive month (see Chart 26).
Nonetheless, confi dence still remained at a level
below its long-term average in the third quarter
as a whole.
Chart 25 Real GDP growth and contributions
(quarter-on-quarter growth rate and quarterly percentage point contributions; seasonally adjusted)
-3.0
-2.5
-2.0
-1.5
-1.0
-0.5
0.0
0.5
1.0
-3.0
-2.5
-2.0
-1.5
-1.0
-0.5
0.0
0.5
1.0
Q2 Q3 Q4 Q1 Q2
domestic demand (excluding inventories)
changes in inventories
net exports
total GDP growth
2008 2009
Sources: Eurostat and ECB calculations.

46ECB
Monthly Bulletin
October 2009
As regards quantitative data on household spending, recent dynamics in retail trade point
to a bottoming-out of the downward trend observed since mid-2008. Retail sales (including sales of
fuels) contracted by 0.2% (month on month) in August, following a decline of the same magnitude
in the previous month.
The introduction of government-sponsored subsidies to encourage consumers to scrap old cars
and buy new ones provided relatively strong support for household spending in the second quarter
of 2009. Monthly data for July and August suggest that the subsidies have continued to buttress
demand. Against this background, Box 4 analyses the impact that car purchase subsidies have on
overall activity.
All in all, while recent dynamics in consumer surveys point to improved consumer sentiment, recent
data on retail trade and car sales are consistent with the assessment of relatively subdued consumer
spending in the latter part of 2009.
Box 4
THE EFFECTS OF VEHICLE SCRAPPING SCHEMES ACROSS EURO AREA COUNTRIES
In recent months, fi scal policies have focused on short-term measures to contain the impact that
the fi nancial market turmoil has had on the real economy. Specifi c vehicle scrapping schemes
have been implemented in many euro area countries in order to support production in the
automotive industry. This box presents an overview of the measures taken in various euro area
countries and discusses their potential economic impact.
The automotive industry represents a considerable part of the euro area economy, featuring
strong interlinkages with other important industries along the value chain. Having been exposed
to a weakening in demand, in particular for commercial vehicles, since the beginning of 2008,
it has been among those hardest hit by the fi nancial turmoil and the severe economic downturn.
Across the euro area, 11 countries have so far implemented or are about to implement vehicle
scrapping schemes to soften the impact of the downturn.1 The fi rst such schemes were
implemented in December 2008, and most schemes are planned to last until the end of 2009,
or in a few cases until September 2010. Financial support to consumers is typically conditional on
the scrapping of old cars and/or the purchase of new or nearly new vehicles, which are generally
less harmful to the environment. The budgetary cost of these car scrapping schemes is expected
to amount to less than 0.1% of GDP in the euro area as a whole in 2009-10.
The measures appear to have been successful insofar as they have supported short-term
demand for new cars. As can be seen from Chart A, new car registrations in the euro area
have risen markedly during the course of 2009, rebounding from a decline in 2008. New car
registrations rose most strongly in Germany, Austria and Slovakia during the fi rst eight months
of 2009, refl ecting relatively strong incentives in these countries. The upward impact of these
fi scal stimulus measures on demand for new cars has not been strong enough, however, to
compensate for the decline in overall demand for cars in the euro area, resulting in particular
1 For detailed information, see: ACEA (European Automobile Manufacturers’ Association), “Overview of vehicle scrapping schemes
in the EU”, 26 August 2009, http://www.acea.be/images/uploads/fi les/20090826_Fleet_renewal_schemes.pdf.
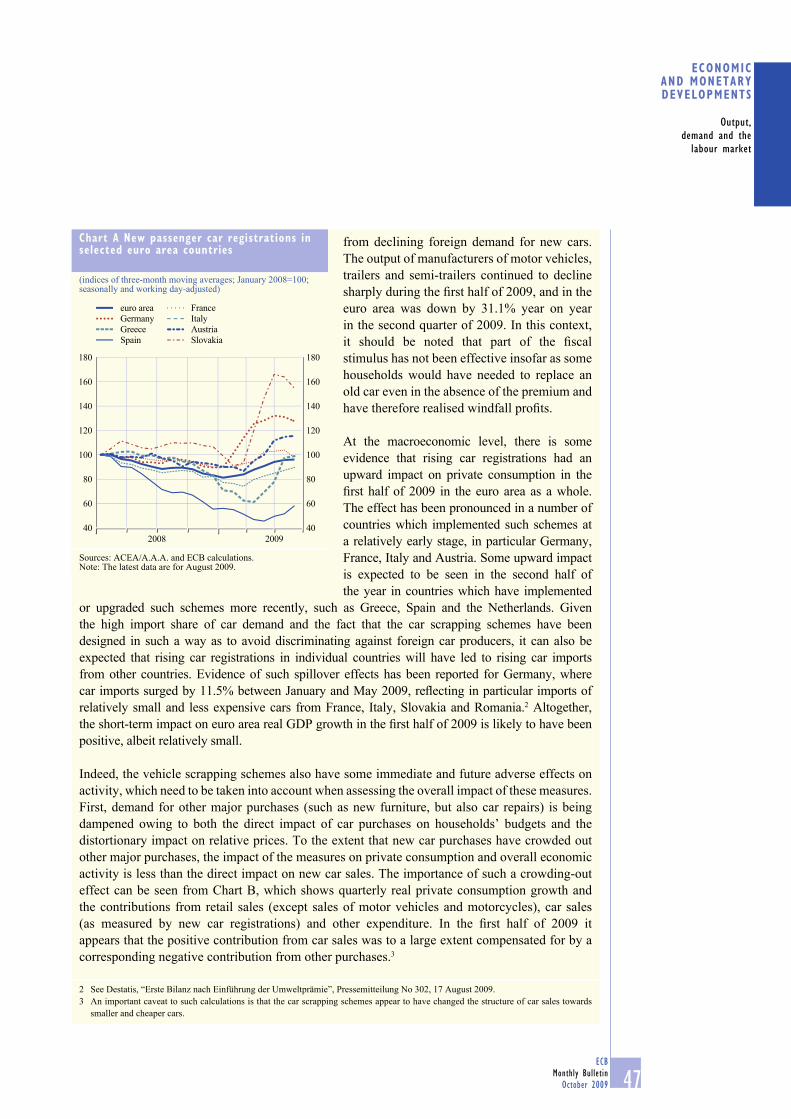
47ECB
Monthly Bulletin
October 2009
ECONOMIC AND MONETARYDEVELOPMENTS
Output,
demand and the
labour market
from declining foreign demand for new cars.
The output of manufacturers of motor vehicles,
trailers and semi-trailers continued to decline
sharply during the fi rst half of 2009, and in the
euro area was down by 31.1% year on year
in the second quarter of 2009. In this context,
it should be noted that part of the fi scal
stimulus has not been effective insofar as some
households would have needed to replace an
old car even in the absence of the premium and
have therefore realised windfall profi ts.
At the macroeconomic level, there is some
evidence that rising car registrations had an
upward impact on private consumption in the
fi rst half of 2009 in the euro area as a whole.
The effect has been pronounced in a number of
countries which implemented such schemes at
a relatively early stage, in particular Germany,
France, Italy and Austria. Some upward impact
is expected to be seen in the second half of
the year in countries which have implemented
or upgraded such schemes more recently, such as Greece, Spain and the Netherlands. Given
the high import share of car demand and the fact that the car scrapping schemes have been
designed in such a way as to avoid discriminating against foreign car producers, it can also be
expected that rising car registrations in individual countries will have led to rising car imports
from other countries. Evidence of such spillover effects has been reported for Germany, where
car imports surged by 11.5% between January and May 2009, refl ecting in particular imports of
relatively small and less expensive cars from France, Italy, Slovakia and Romania.2 Altogether,
the short-term impact on euro area real GDP growth in the fi rst half of 2009 is likely to have been
positive, albeit relatively small.
Indeed, the vehicle scrapping schemes also have some immediate and future adverse effects on
activity, which need to be taken into account when assessing the overall impact of these measures.
First, demand for other major purchases (such as new furniture, but also car repairs) is being
dampened owing to both the direct impact of car purchases on households’ budgets and the
distortionary impact on relative prices. To the extent that new car purchases have crowded out
other major purchases, the impact of the measures on private consumption and overall economic
activity is less than the direct impact on new car sales. The importance of such a crowding-out
effect can be seen from Chart B, which shows quarterly real private consumption growth and
the contributions from retail sales (except sales of motor vehicles and motorcycles), car sales
(as measured by new car registrations) and other expenditure. In the fi rst half of 2009 it
appears that the positive contribution from car sales was to a large extent compensated for by a
corresponding negative contribution from other purchases.3
2 See Destatis, “Erste Bilanz nach Einführung der Umweltprämie”, Pressemitteilung No 302, 17 August 2009.
3 An important caveat to such calculations is that the car scrapping schemes appear to have changed the structure of car sales towards
smaller and cheaper cars.
Chart A New passenger car registrations in selected euro area countries
(indices of three-month moving averages; January 2008=100; seasonally and working day-adjusted)
40
2008 2009
60
80
100
120
140
160
180
40
60
80
100
120
140
160
180
France
Slovakia
Greece
Spain
euro area
Austria
Germany Italy
Sources: ACEA/A.A.A. and ECB calculations. Note: The latest data are for August 2009.

48ECB
Monthly Bulletin
October 2009
Second, a negative impact on demand for
new cars can be expected once the measures
have been phased out. The car scrapping
schemes lower the price of current as opposed
to future car purchases and thereby lead
to a frontloading of private car purchases.
The more car purchases have been brought
forward into 2009 as a result of the measures,
the stronger this unwinding will be. In surveys
for Germany, around half of the respondents
report that they have brought forward car
purchases into 2009 owing to the premium.
In such a case, a substantial weakening of car
demand might be expected in early 2010.4
To the extent that the vehicle scrapping
premium has lowered the average age of the car
fl eet, an adverse effect on new car demand will
also prevail in the medium term. In addition,
if private households reduced their savings or
increased their borrowing to fi nance their new
car purchases, a negative impact on future
overall private consumption growth can be
expected to the extent that private households
need to reduce their borrowing and increase
savings again.
Finally, from a more general policy perspective, it should be borne in mind that fi scal measures
that benefi t a specifi c industry cause relative price distortions which may prevent necessary
structural adjustments, lead to increased pressures from lobbying groups to introduce additional
subsidies and distort the level playing fi eld for international competition. Moreover, the early
destruction of cars that are still in working order as a result of fi scal incentives to private
households reduces the economic wealth of an economy.
All in all, the vehicle scrapping schemes in euro area countries appear to have provided signifi cant
support to car production in the fi rst half of 2009 and are expected to continue to do so in the
second half of the year (albeit the largest impact on quarterly growth rates may have been seen in
the second quarter). However, the upward impact on overall euro area activity in 2009 is likely
to remain rather limited and may turn negative in 2010. In general, given their distortionary
effects, such measures should be implemented with caution, as they may hamper the effi ciency
of the functioning of a free market economy and may delay necessary structural change, thereby
undermining overall income and employment prospects in the longer term.
4 See Rheinisch-Westfälisches Institut für Wirtschaftsforschung, “Die Konjunktur im Inland”, Konjunkturbericht 2009-2,
September 2009, pp. 51-53.
Chart B Euro area private consumption and its main components
(quarter-on-quarter growth rate and quarterly percentage point contributions; seasonally and working day-adjusted)
-0.8
-0.6
-0.4
-0.2
0.0
0.2
0.4
0.6
0.8
-0.8
-0.6
-0.4
-0.2
0.0
0.2
0.4
0.6
0.8
other
car registrations
retail sales
private consumption (%)
2008 2009
Sources: Eurostat and ECB calculations.

49ECB
Monthly Bulletin
October 2009
ECONOMIC AND MONETARYDEVELOPMENTS
Output,
demand and the
labour market
In line with the pattern observed in previous
periods of economic recession, gross fi xed capital
formation has been one of the main drivers of
the current slowdown in economic activity.
In the second quarter of 2009 gross fi xed capital
formation declined by 1.5% (quarter on quarter).
The decline was, however, much less pronounced
than those seen in the fourth quarter of 2008
and the fi rst quarter of 2009, when investment
dropped by 3.5% and 5.4% respectively.
Eurostat’s second estimate confi rmed that
non-construction investment (mainly assets
intended for use in the production of goods
and services) accounted for the bulk of the
drop in aggregate investment, while the fall in
construction investment was less pronounced.
Investment growth is projected to remain in
negative territory in the second half of 2009.
With subdued fi nal demand, developments in
activity are expected to play a neutral role in
investment decisions. At the same time, with
profi t developments projected to continue to
decline, external fi nancing needs will probably
exert downward pressure on investment. On
the positive side, the decline in the real cost of
fi nancing over the past few quarters is expected
to be increasingly supportive for investment.
4.2 OUTPUT, SUPPLY AND LABOUR MARKET
DEVELOPMENTS
Eurostat’s second estimate of real value added
in the second quarter of 2009 showed a further
contraction in the industrial sector, while the
quarterly growth rate of the services sector
returned to positive territory after declining in
two consecutive quarters.
Monthly indicators suggest that activity
stabilised somewhat in the third quarter of 2009,
while euro area industrial production (excluding
construction) fell by 0.3% (month on month) in
July (see Chart 27). When monthly volatility
is averaged out, it appears that production has
stabilised in recent months. It is important to
note that indicators of short-term developments –
for example the monthly rates of change in
Chart 26 Retail sales and confidence in the retail trade and household sectors
(monthly data)
-3
-2
-1
0
1
2
3
4
-30
-20
-10
0
10
20
30
40
2009
total retail sales 1) (left-hand scale)
consumer confidence 2) (right-hand scale)
retail confidence 2) (right-hand scale)
2004 2005 2006 2007 2008
Sources: European Commission Business and Consumer Surveys and Eurostat.1) Annual percentage changes; three-month moving averages; working day-adjusted. Excludes fuel.2) Percentage balances; seasonally and mean-adjusted.
Chart 27 Industrial production growth and contributions
(growth rate and percentage point contributions; monthly data; seasonally adjusted)
-9.0
-6.0
-3.0
0.0
3.0
-9.0
-6.0
-3.0
0.0
3.0
capital goods
consumer goods
intermediate goods
energy
total excluding construction
2004 2005 2006 2007 2008 2009
Sources: Eurostat and ECB calculations.Note: Data shown are calculated as three-month moving averages against the corresponding average three months earlier.

50ECB
Monthly Bulletin
October 2009
seasonally adjusted series, such as industrial
production – should currently be interpreted
even more cautiously than in calmer economic
conditions.
Business surveys also point towards an ongoing
improvement in industrial activity, albeit from
a low level (see Chart 28). The Purchasing
Managers’ Index (PMI) for the manufacturing
sector continued to improve in September,
reaching a level close to 50 (a value above 50
indicating an increase in production and a
value below 50 indicating that production is
contracting). The increase in September refl ects
improvements across all components, with
the exception of the employment component,
which remained unchanged at a low level.
Other business surveys, such as the European
Commission Business Surveys, generally
confi rm the PMI data.
LABOUR MARKET
Conditions in euro area labour markets have
continued to deteriorate in recent months.
Eurostat’s second estimate confi rmed that euro
area employment decreased by 0.5% (quarter on
quarter) in the second quarter of 2009, marking the fourth consecutive quarterly decline (see Table 6).
The contraction in employment in the second quarter largely emanated from the industrial sector,
whereas employment in the services sector remained broadly unchanged.
Chart 28 Industrial production, industrial confidence and the PMI
(monthly data; seasonally adjusted)
-10
-9
-8
-7
-6
-5
-4
-3
-2
-1
0
1
2
3
-40
-36
-32
-28
-24
-20
-16
-12
-8
-4
0
4
8
12
2004 2005 2006 2007 2008 2009
industrial production ¹) (left-hand scale)industrial confidence ²) (right-hand scale)
PMI ³) (right-hand scale)
Sources: Eurostat, European Commission Business and Consumer Surveys, Markit and ECB calculations.Note: All series refer to manufacturing.1) Three-month-on-three-month percentage changes.2) Percentage balances.3) Purchasing Managers’ Index; deviations from an index value of 50.
Table 6 Employment growth
(percentage changes compared with the previous period; seasonally adjusted)
Annual rates Quarterly rates2007 2008 2008 2008 2008 2009 2009
Q2 Q3 Q4 Q1 Q2
Whole economy 1.8 0.8 0.1 -0.3 -0.3 -0.7 -0.5
of which:Agriculture and fi shing -1.5 -1.4 -1.1 -0.6 0.3 -0.7 -0.8
Industry 1.4 -0.8 -0.3 -1.0 -1.3 -1.7 -1.5
Excluding construction 0.3 -0.2 -0.1 -0.6 -1.0 -1.5 -1.5
Construction 3.9 -2.2 -0.9 -2.0 -2.1 -2.1 -1.5
Services 2.1 1.4 0.3 0.0 0.0 -0.4 -0.1
Trade and transport 2.0 1.3 0.1 -0.2 -0.4 -0.8 -0.5
Finance and business 4.1 2.2 0.0 0.0 -0.4 -0.8 -0.6
Public administration 1) 1.2 1.1 0.6 0.1 0.6 0.1 0.5
Sources: Eurostat and ECB calculations.1) Also includes education, health and other services.

51ECB
Monthly Bulletin
October 2009
ECONOMIC AND MONETARYDEVELOPMENTS
Output,
demand and the
labour market
Business surveys point to a further deterioration
in employment in the third quarter of 2009
(see Chart 29). In September employment
intentions reported in the PMI survey
remained at very low levels for both the
industrial and the services sectors. The latest
European Commission surveys on employment
intentions also suggest a subdued outlook for
employment.
As a result of the contraction in economic
activity and relatively resilient employment
growth over the past 12 months, labour
productivity (in terms of output per employee)
continued to contract in the second quarter
of 2009, falling by 3.1% year on year
(see Chart 30). The industrial sector accounted
for the bulk of the decline in labour productivity,
while the fall in services sector productivity
was relatively modest. Short-term dynamics
suggest that euro area labour productivity
improved in the second quarter, mainly owing
Chart 29 Employment growth and employment expectations
(annual percentage changes; percentage balances; seasonally adjusted)
-5.0
-4.5
-4.0
-3.5
-3.0
-2.5
-2.0
-1.5
-1.0
-0.5
0.0
0.5
1.0
1.5
2.0
-50
-45
-40
-35
-30
-25
-20
-15
-10
-5
0
5
10
15
20
2009
employment growth in industry excluding
construction (left-hand scale)employment expectations in manufacturing
(right-hand scale)
2002 2003 2004 2005 2006 2007 2008-30
-25
-20
-15
-10
-5
0
5
10
15
20
25
-30
-25
-20
-15
-10
-5
0
5
10
15
20
25
2009
employment expectations in construction
employment expectations in the retail trade
employment expectations in the services sector
2002 2003 2004 2005 2006 2007 2008
Sources: Eurostat and European Commission Business and Consumer Surveys.Note: Percentage balances are mean-adjusted.
Chart 30 Labour productivity
(annual percentage changes)
-14
-12
-10
-8
-6
-4
-2
0
2
4
6
-14
-12
-10
-8
-6
-4
-2
0
2
4
6
2002 2003 2004 2005 2006 2007 2008
whole economy
industry excluding construction
services
2009
Sources: Eurostat and ECB calculations.

52ECB
Monthly Bulletin
October 2009
to the fact that the economy has stabilised.
Looking ahead, productivity is expected to
recover gradually in the latter part of 2009,
driven by a combination of a further contraction
in employment and a gradual strengthening in
economic activity.
The unemployment rate in the euro area rose
to 9.6% in August (see Chart 31), an increase
of 0.1 percentage point compared with the
previous month. Euro area unemployment
currently stands at its highest level since
early 1999. For a more detailed analysis
of the links between changes in output and
unemployment in the euro area since the start of
Economic and Monetary Union, see Box 5.
Chart 31 Unemployment
(monthly data; seasonally adjusted)
-300
-150
0
150
300
450
600
7.0
7.5
8.0
8.5
9.0
9.5
10.0
monthly change in thousands (left-hand scale)
percentage of the labour force (right-hand scale)
2004 2005 2006 2007 2008 2009
Source: Eurostat.
Box 5
LINKS BETWEEN OUTPUT AND UNEMPLOYMENT IN THE EURO AREA
Euro area unemployment exhibited a downward trend from the introduction of the euro until
spring 2008, reaching a 25-year low of 7.2% in March 2008. With the onset of the fi nancial
turmoil and the associated sharp economic downturn, unemployment began to increase markedly.
In August 2009 the euro area unemployment rate stood at 9.6% – the highest rate recorded in
a decade. This box looks at the relationship between changes in output and unemployment in
the euro area since the introduction of the euro and examines the different experiences of the
euro area countries.
The relationship between contemporaneous changes in economic growth and unemployment
is widely recorded in the economic literature and is often referred to as “Okun’s Law”.
More of an empirical “rule of thumb” than a relationship grounded in theory, Okun’s Law
suggests that a 2-3% decline in output is associated with a 1 percentage point increase in the
aggregate unemployment rate.1
Developments at the euro area level
Chart A plots year-on-year changes in the euro area unemployment rate against contemporaneous
annual percentage changes in GDP, on the basis of quarterly data, from the launch of EMU
in 1999 to the second quarter of 2009. Focusing on the period up until the third quarter
of 2008, the data suggest that a 1% increase (or, conversely, a 1% fall) in euro area GDP has
been associated with a contemporaneous 0.4 percentage point decline (or, respectively,
1 Okun suggests a relationship of -0.3 between changes in GDP and unemployment for the United States over the period 1948-60 on the
basis of quarterly data. See A.M. Okun (1962), “Potential GNP: Its Measurement and Signifi cance”, American Statistical Association,
Proceedings of the Business and Economic Statistics Section, pp. 98-104.

53ECB
Monthly Bulletin
October 2009
ECONOMIC AND MONETARYDEVELOPMENTS
Output,
demand and the
labour market
a 0.4 percentage point increase) in the euro
area unemployment rate.2 This can be seen in
the bold trend line in Chart A estimated over
this period. The estimated relationship between
unemployment and GDP developments would
be considerably infl uenced by including the
last three observations, which cover the period
during which the downturn was most severe.
This would lower the estimated coeffi cient to 0.3
(as shown by the dotted line in Chart A).
As a consequence of the recent economic
downturn, between the second quarter of
2008 and the second quarter of 2009 euro
area GDP contracted by around 4.8%, while
unemployment rose by 1.9 percentage points.
This in part refl ects the measures taken in
several countries to reduce working hours per
employee, although there are considerable
differences across the euro area countries.
Developments at the country level
Chart B shows year-on-year percentage
point increases in unemployment rates and
contemporaneous annual percentage changes
in GDP for the euro area as a whole and for
the member countries from the second quarter
of 2008 to the second quarter of 2009. While
Chart B should be interpreted with caution –
not least given differences in the speed of
adjustment in unemployment across the
euro area countries – national labour markets
in the euro area appear to have reacted rather
differently to the recent downturn. Several euro
area economies appear to have experienced
relatively modest increases in unemployment
despite relatively large contractions in
GDP – most notably Germany, Italy and
the Netherlands. Others, by contrast, have
clearly experienced disproportionately large
increases in unemployment rates compared
with the euro area average – most notably
Spain and Ireland. In relation to the size of
2 A simple ordinary least squares (OLS) regression quantifi es the relationship ΔU = -0.40 ΔGDP (-10.4) + 0.60 (6.4) where
ΔU represents the absolute annual percentage point change in the harmonised euro area unemployment rate and ΔGDP measures the
annual percentage change in euro area GDP; t-statistics are given in parentheses; R² = 0.75 from 39 observations over the period from
the fi rst quarter of 1999 to the third quarter of 2008.
Chart A The relationship between changes in output and unemployment in the euro area since the introduction of the euro
(annual percentage changes; percentage points; quarterly data)
-1.5
-1.0
-0.5
0.0
0.5
1.0
1.5
2.0
2.5
-1.5
-1.0
-0.5
0.0
0.5
1.0
1.5
2.0
2.5
-6.0 -4.0 -2.0 0.0 2.0 4.0 6.0
x-axis: annual percentage changes in euro area GDP
y-axis: annual percentage point changes in the euro area
unemployment rate
Q1 1999 – Q2 2009
Q1 1999 – Q3 2008
Sources: Eurostat and ECB calculations.
Chart B Output losses and increases in unemployment from the second quarter of 2008 to the second quarter of 2009
(percentage points; percentage changes)
x-axis: annual percentage changes in GDP
y-axis: percentage point changes in the unemployment rate
0
1
2
3
4
5
6
7
8
0
1
2
3
4
5
6
7
8
-10 -9 -8 -7 -6 -5 -4 -3 -2 -1 0
ES
IE
CY
FI
SISK FRPT
LU
ITDE
MT
NLAT
BE
euro area
Sources: Eurostat and ECB calculations.Notes: Data for Greece are not available. Data for Luxembourg relate to the period from the fi rst quarter of 2008 to the fi rst quarter of 2009.

54ECB
Monthly Bulletin
October 2009
their respective GDP contractions, Cyprus and France have also experienced relatively large
increases in unemployment over the period.
There can be many reasons for the diversity observed across countries. Differences in labour
market policies and institutions across euro area countries are likely to affect the speed at which
labour markets adjust. Varying degrees of employment protection legislation and differences in
coverage across countries (i.e. whether such legislation is extended to all workers, or excludes
certain groups, such as young workers), variations in the shares of permanent and temporary
contracts, as well as differences in policy initiatives designed to deal with temporary output
fl uctuations (state-subsidised short-time working schemes, social security exemptions for
employers, etc.), undoubtedly infl uence labour market adjustment across countries.3 Similarly,
differences between wage-setting institutions, which infl uence the rate at which wages can adjust
in the face of output shocks, provide further scope for variation in labour market developments.
Moreover, evidence suggests that where such institutions reduce labour market fl exibility, there
may be more persistent effects on unemployment.4
Policy-makers in a number of euro area countries have devoted considerable efforts to
supporting employment over the course of the recent downturn, making use of a variety of
short-term working arrangements. To the extent that such measures hinder the reallocation
of workers from less to more productive sectors, or discourage the necessary restructuring
of euro area enterprises in the face of new economic challenges, the prolonged use of such schemes
may harm the euro area’s productivity growth and international competitiveness in the longer
term. Therefore, renewed efforts towards further structural reforms in euro area labour markets
would help to boost competitiveness and thus improve the longer-term prospects for euro area
employment growth. These efforts include: further reforms of employment protection legislation
once the economy returns to a steady recovery path, so as to overcome the segmentation of
labour markets and aid the sectoral reallocation of workers; reforms of tax and benefi t systems,
so as to improve incentives to work; and further efforts to enhance the fl exibility of wage-setting
arrangements.
3 See also the box entitled “Labour market adjustments during the current contraction of economic activity” in the June 2009 issue of the Monthly Bulletin.
4 See O. Blanchard and J. Wolfers (2000), “The role of shocks and institutions in the rise of European unemployment: the aggregate
evidence”, Royal Economic Society, Economic Journal, Vol. 100, pp. C1-33.
4.3 THE OUTLOOK FOR ECONOMIC ACTIVITY
Following the strong negative growth rates observed around the turn of the year, according
to Eurostat’s second estimate economic activity in the euro area declined only slightly in the
second quarter of 2009, contracting by 0.2% compared with the previous quarter. Available
survey indicators continue to signal an ongoing stabilisation of economic activity. In particular,
the euro area should benefi t from a recovery in exports, the signifi cant macroeconomic stimulus
under way and the measures taken to restore the functioning of the fi nancial system. In addition,
following the substantial negative contributions in the fi rst half of 2009, the inventory cycle is
expected to contribute positively to real GDP growth in the second half of the year. Overall,
the recovery is expected to remain rather uneven. It will be supported in the short term by a
number of temporary factors, but is likely to be affected over the medium term by the process of
ongoing balance sheet correction in the fi nancial and non-fi nancial sectors of the economy, both
inside and outside the euro area.

55ECB
Monthly Bulletin
October 2009
ECONOMIC AND MONETARYDEVELOPMENTS
Output,
demand and the
labour market
The risks to this outlook remain broadly balanced. On the upside, there may be stronger than
anticipated effects stemming from the extensive macroeconomic stimulus being provided and
from other policy measures taken. Confi dence may also improve more quickly, the labour market
deterioration may be less marked than previously expected and foreign demand may prove to be
stronger than projected. On the downside, concerns remain relating to a stronger or more protracted
negative feedback loop between the real economy and the fi nancial sector, renewed increases in
oil and other commodity prices, the intensifi cation of protectionist pressures and the possibility of
a disorderly correction of global imbalances. At the same time, the uncertainty surrounding this
outlook remains higher than usual.

56ECB
Monthly Bulletin
October 2009
5.1 EXCHANGE RATES
Following a period of stabilisation in the summer of 2009, the euro exchange rate strengthened in nominal effective terms in September, mainly as a result of the appreciation of the euro vis-à-vis the pound sterling and the US dollar. This was accompanied by a further decline in exchange rate volatility against a large set of currencies.
EFFECTIVE EXCHANGE RATE OF THE EURO
Following a period of stabilisation in the summer
of 2009, the nominal effective exchange rate of
the euro – as measured against the currencies
of 21 of the euro area’s most important
trading partners – appreciated in September.
On 7 October it was 1.8% stronger than at the
end of June and 2.8% stronger than its average
2008 level. Between the end of June and
7 October the appreciation was primarily driven
by the developments in the bilateral euro rates
vis-à-vis the pound sterling and the US dollar,
which were only partly offset by the depreciation
vis-à-vis the Japanese yen and some of the
EU Member States’ currencies (see Chart 32).
US DOLLAR/EURO
Over the last three months the euro has moderately
appreciated vis-à-vis the US dollar (see Chart 33).
The US dollar also weakened against a larger set
of currencies, reportedly as a result of the low
US interest rates and declining global risk
perceptions, which led to some unwinding of
the safe-haven fl ows that had supported the
US dollar after the onset of the global fi nancial
crisis. At the same time, the implied volatility
of the USD/EUR exchange rate continued to
decline, drawing close to its average level over
the past ten years. On 7 October 2009 the euro
was trading at USD 1.47, 4.0% higher than at
the end of June 2009 and broadly in line with its
2008 average.
JAPANESE YEN/EURO
Over the last three months the euro has fl uctuated
against the Japanese yen in a range between
JPY 128 and JPY 138, reportedly affected by
changes in the overall risk perception in fi nancial
5 EXCHANGE RATE AND BALANCE OF PAYMENTS DEVELOPMENTS
Chart 32 Euro effective exchange rate and its decomposition 1)
(daily data)
Index: Q1 1999 = 100
112
113
114
115
116
117
112
113
114
115
116
117
September
2009
July August
Contributions to EER changes 2)
From 30 June 2009 to 7 October 2009
(percentage points)
-1
0
1
2
-1
0
1
2
EER-21Other
USD JPY CHF OMSGBP CNY SEK
Contributions to EER changes 2)
From 3 January 2005 to 7 October 2009
(percentage points)
-1
0
1
2
3
4
5
6
7
8
-1
0
1
2
3
4
5
6
7
8
EER-21Other
USD JPY CHF OMSGBP CNY SEK
Source: ECB.1) An upward movement of the index represents an appreciation of the euro against the currencies of 21 of the most important trading partners of the euro area and all non-euro area EU Member States.2) Contributions to EER-21 changes are displayed individually for the currencies of the six main trading partners of the euro area. The category “Other Member States” (OMS) refers to the aggregate contribution of the currencies of the non-euro area Member States (except the pound sterling and the Swedish krona). The category “Other” refers to the aggregate contribution of the remaining six trading partners of the euro area in the EER-21 index. Changes are calculated using the corresponding overall trade weights in the EER-21 index.
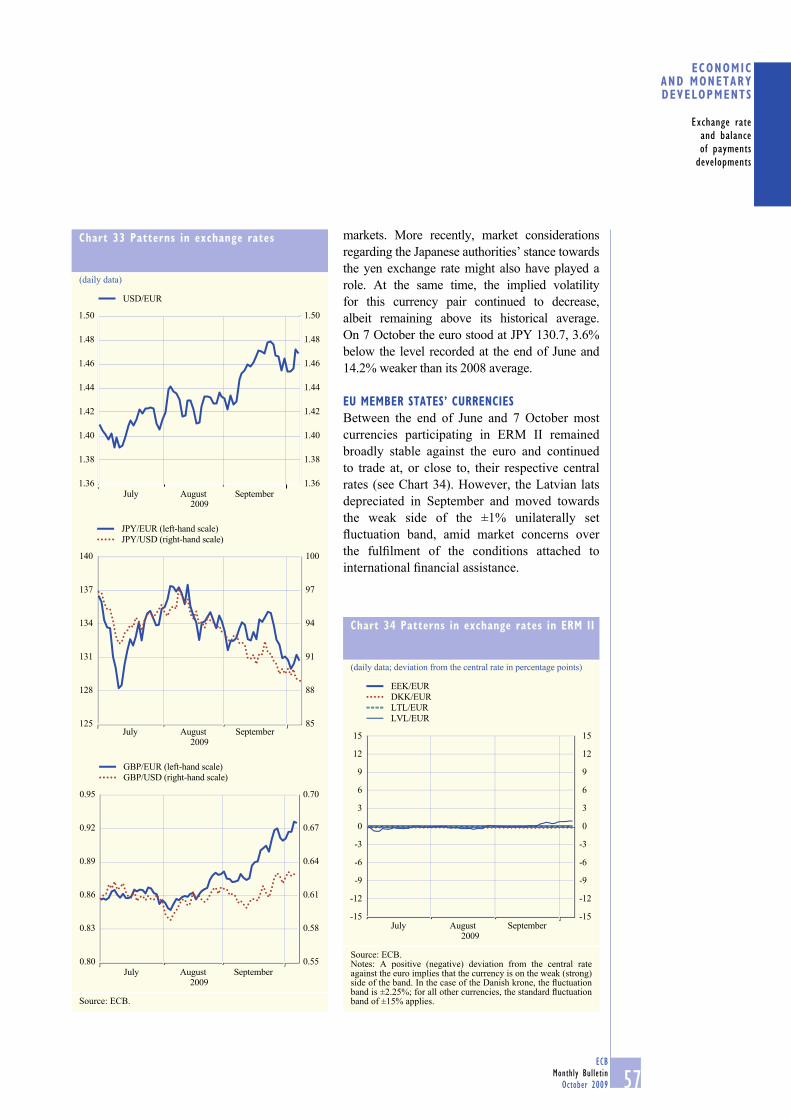
57ECB
Monthly Bulletin
October 2009
ECONOMIC AND MONETARYDEVELOPMENTS
Exchange rate
and balance
of payments
developments
markets. More recently, market considerations
regarding the Japanese authorities’ stance towards
the yen exchange rate might also have played a
role. At the same time, the implied volatility
for this currency pair continued to decrease,
albeit remaining above its historical average.
On 7 October the euro stood at JPY 130.7, 3.6%
below the level recorded at the end of June and
14.2% weaker than its 2008 average.
EU MEMBER STATES’ CURRENCIES
Between the end of June and 7 October most
currencies participating in ERM II remained
broadly stable against the euro and continued
to trade at, or close to, their respective central
rates (see Chart 34). However, the Latvian lats
depreciated in September and moved towards
the weak side of the ±1% unilaterally set
fl uctuation band, amid market concerns over
the fulfi lment of the conditions attached to
international fi nancial assistance.
Chart 33 Patterns in exchange rates
(daily data)
September2009
1.36
1.38
1.40
1.42
1.44
1.46
1.48
1.50
1.36
1.38
1.40
1.42
1.44
1.46
1.48
1.50
USD/EUR
July August
September2009
125
128
131
134
137
140
85
88
91
94
97
100
JPY/EUR (left-hand scale)
JPY/USD (right-hand scale)
July August
September2009
0.80
0.83
0.86
0.89
0.92
0.95
0.55
0.58
0.61
0.64
0.67
0.70
GBP/EUR (left-hand scale)
GBP/USD (right-hand scale)
July August
Source: ECB.
Chart 34 Patterns in exchange rates in ERM II
(daily data; deviation from the central rate in percentage points)
September2009
-15
-12
-9
-6
-3
0
3
6
9
12
15
-15
-12
-9
-6
-3
0
3
6
9
12
15
EEK/EUR
DKK/EUR
LTL/EUR
LVL/EUR
July August
Source: ECB.Notes: A positive (negative) deviation from the central rate against the euro implies that the currency is on the weak (strong) side of the band. In the case of the Danish krone, the fl uctuation band is ±2.25%; for all other currencies, the standard fl uctuation band of ±15% applies.

58ECB
Monthly Bulletin
October 2009
As regards the currencies of the EU Member States not participating in ERM II, the euro has
strengthened considerably against the pound sterling over the last three months. On 7 October
it was 8.5% stronger than at the end of June. The recent developments in the GBP/EUR
exchange rate were reportedly driven by market uncertainty over the economic outlook in the
United Kingdom. Over the same period, the pace of the euro’s depreciation against the Polish
zloty, the Hungarian forint and the Czech koruna – which had been almost uninterrupted since
early March 2009 – slowed. On 7 October the euro was respectively 5.3%, 1.3% and 0.8% weaker
vis-à-vis these three currencies compared with levels at the end of June. The euro also weakened
against the Swedish currency, by 4.2% over this period, apparently as a result of waning market
concerns over the economic outlook in certain Baltic States.
OTHER CURRENCIES
Between the end of June and 7 October the euro weakened by 0.8% against the Swiss franc, amid some
fl uctuations, following market reports about alleged intervention in the foreign exchange markets by
the Swiss National Bank. Over the same period the euro depreciated vis-à-vis the Australian dollar,
the South Korean won and the Canadian dollar by 4.9%, 4.6% and 4.5% respectively.
5.2 BALANCE OF PAYMENTS
Extra-euro area trade is showing increasing signs of stabilisation, with exports outpacing imports. Consequently, the 12-month cumulated current account defi cit of the euro area has narrowed over the last few months, to €108.7 billion in the year to July 2009 (1.2% of GDP). In the fi nancial account, the repercussions of the global fi nancial crisis have been gradually waning. The repatriation of funds has subsided and fi nancial transactions with the rest of the world appear to point to an attenuation of investors’ preferences for safe and liquid assets.
TRADE AND THE CURRENT ACCOUNT
Following the sharp contraction around the turn
of the year, extra-euro area trade is showing
increasing signs of stabilisation, particularly
on the export side. In the three-month period
to July 2009, exports of goods recorded their
fi rst – albeit rather small – increase since
September 2008, rising by 0.2% compared with
the previous three-month period (see Chart 35).
Exports were supported by strengthening
foreign demand and a gradual reactivation
of international supply chains, as economic
activity bottomed out in major export markets
and many fi rms replenished their inventories
in the light of the improved economic outlook.
The stabilisation of imports is lagging behind
that observed for exports. Goods imports
continued to decline, albeit at the more
moderate pace of 5.0%, in the three-month
period to July 2009 compared with the previous
three-month period.
Chart 35 Extra-euro area trade in goods
(EUR billions; three-month moving averages; monthly data; working day and seasonally adjusted)
80
90
100
110
120
130
140
2005 2006 2007 2008-8
-6
-4
-2
0
2
4
6
8
goods balance (right-hand scale)
goods imports (left-hand scale)
goods exports (left-hand scale)
Source: ECB.

59ECB
Monthly Bulletin
October 2009
ECONOMIC AND MONETARYDEVELOPMENTS
Exchange rate
and balance
of payments
developments
Owing to these developments in extra-euro area
trade, the goods balance and, consequently,
the current account improved gradually
(see Chart 36). In July 2009 the 12-month
cumulated goods balance shifted back into
surplus for the fi rst time since October 2008. At
the same time, the cumulated current account
defi cit narrowed to €108.7 billion (about 1.2%
of GDP), although it was still signifi cantly
higher than a year earlier.
Trade in services remained weak in the
three-month period to July 2009, with imports
and exports declining by 4.9% and 3.7%
respectively, compared with the previous three
months. This lacklustre performance mirrored
the fact that, at the global level, the rebound in the
services sector has recently been trailing that in
the manufacturing sector. Since services – unlike
goods – are not storable, trade in services has not
been boosted by fi rms’ recent re-stocking. Partly
for the same reason, trade in services declined
much less than merchandise trade around the
turn of the year, giving rise to less favourable base effects. Moreover, certain fi scal policy measures,
such as car scrapping schemes in a number of euro area countries, have boosted trade in goods more
than services trade.
Turning to the other current account items, the 12-month cumulated defi cit in the income
account was signifi cantly higher in July 2009 than a year earlier, as investment receipts declined
by more than investment payments. Finally, the defi cit in current transfers increased slightly in
the year to July (see Table 7).
Available indicators suggest that the gradual
rebound in euro area exports of goods will
continue in the near term. Following six
increases in a row, the Purchasing Managers’
Index (PMI) of new export orders in the
euro area manufacturing sector stabilised in
September at a level just above the expansion/
contraction threshold of 50 (see Chart 37).
This is broadly consistent with the European
Commission’s survey of export order-book
levels in the euro area, which improved in
September, albeit by less than in the previous
month and from very low levels. Extra-euro
area imports of goods are also expected to
improve gradually, supported by strengthening
fi nal domestic demand and additional demand
for imported inputs induced by higher exports.
Chart 36 Main items of the current account
(EUR billions; 12-month cumulated fl ows; monthly data; working day and seasonally adjusted)
-200
-150
-100
-50
0
50
100
150
-200
-150
-100
-50
0
50
100
150
2005 2006 2007 2008 2009
current transfers balance
income balance
services balance
goods balance
current account balance
Source: ECB.
Chart 37 Euro area PMI of new export orders
(diffusion index; monthly data)
25
30
35
40
45
50
55
60
65
25
30
35
40
45
50
55
60
65
1999 2001 2003 2005 2007 2009
Source: Markit.

60ECB
Monthly Bulletin
October 2009
FINANCIAL ACCOUNT
Following the intensifi cation of the fi nancial crisis in the autumn of 2008 the euro area witnessed
signifi cant changes in its fi nancial account. As investors’ appetite for safe and liquid assets increased,
the euro area saw a sharp rise in net infl ows of money market instruments (see Chart 38). This
development was driven primarily by euro area residents’ repatriation of funds, but also by higher
purchases of euro area money market instruments by non-residents. In parallel, both residents and
non-residents repatriated funds invested in equities.
Over the past few months, however, the repercussions of the global fi nancial crisis on the fi nancial
account have gradually subsided. Safe-haven considerations and short-term, low-risk assets seem
to have lost some of their appeal in the light of a more favourable global economic outlook and
improved fi nancial market conditions.
As a result, the repatriation of funds has subsided in all major components of the fi nancial
account. Furthermore, both non-residents’ purchases and net infl ows of euro area money market
instruments have fallen markedly compared with the peak levels recorded towards the end of last
Table 7 Main items of the euro area balance of payments
(seasonally adjusted data, unless otherwise indicated)
Three-month moving average fi gures ending
12-month cumulated fi gures ending
2009 2009 2008 2009 2009 2009 2008 2009June July Oct. Jan. Apr. July July July
EUR billions
Current account -4.3 6.6 -9.1 -18.2 -9.6 0.7 -44.0 -108.7Goods balance 2.5 11.2 0.3 -5.0 0.1 5.5 18.2 2.7
Exports 104.5 108.8 133.1 114.3 105.4 105.6 1578.0 1375.2
Imports 102.0 97.6 132.8 119.3 105.3 100.1 1559.8 1372.5
Services balance 1.0 2.7 2.7 3.0 1.8 2.2 50.5 29.2
Exports 37.1 37.3 42.6 41.6 39.1 37.6 505.1 482.7
Imports 36.0 34.6 39.9 38.6 37.3 35.4 454.6 453.4
Income balance -2.7 -1.6 -3.9 -7.1 -2.9 -0.8 -17.1 -44.0
Current transfers balance -5.2 -5.7 -8.2 -9.2 -8.5 -6.3 -95.6 -96.6
Financial account 1) -7.4 -34.1 29.4 32.3 33.3 -5.0 135.1 269.9
Combined net direct and portfolio
investment35.7 -17.6 62.9 -3.7 44.8 27.0 -43.2 392.8
Net direct investment -9.2 5.3 -15.4 -25.0 -11.2 0.3 -144.2 -154.2
Net portfolio investment 44.9 -23.0 78.3 21.3 56.0 26.7 101.0 547.0
Equities 0.4 18.9 -17.0 -7.6 16.3 9.3 -16.1 2.9
Debt instruments 44.5 -41.9 95.3 29.0 39.7 17.4 117.0 544.0
Bonds and notes 53.8 -66.6 19.5 18.7 29.2 14.4 146.3 245.5
Money market instruments -9.4 24.8 75.8 10.2 10.5 2.9 -29.3 298.5
Percentage changes from previous period
Goods and servicesExports -0.3 3.2 0.0 -11.3 -7.3 -0.8 7.1 -10.8
Imports 1.3 -4.2 -0.3 -8.5 -9.7 -5.0 8.6 -9.4
GoodsExports 1.1 4.1 -0.7 -14.1 -7.8 0.2 6.7 -12.9
Imports 1.4 -4.3 -1.5 -10.1 -11.7 -5.0 8.9 -12.0
ServicesExports -3.8 0.5 2.5 -2.4 -6.0 -3.7 8.4 -4.4
Imports 1.1 -3.9 4.0 -3.2 -3.4 -4.9 7.7 -0.3
Source: ECB.Note: Figures may not add up due to rounding.1) Figures refer to balances (net fl ows). A positive (negative) sign indicates a net infl ow (outfl ow). Not seasonally adjusted.

61ECB
Monthly Bulletin
October 2009
ECONOMIC AND MONETARYDEVELOPMENTS
Exchange rate
and balance
of payments
developments
year. In terms of three-month moving averages, net infl ows of money market instruments amounted
to €2.9 billion in July 2009, compared with €78.9 billion in November 2008. In parallel, moderate
net infl ows of equity securities resumed in the second quarter of 2009, after being at a virtual
standstill in the three preceding quarters, possibly refl ecting more favourable market expectations
of euro area fi rms’ future profi ts.
Unlike portfolio investment, direct investment has shown some signs of weakness lately, on both
the asset side and the liability side, following a notable rebound at the beginning of the year. Since
direct investment abroad by euro area residents weakened more than direct investment in the euro
area by non-residents, the euro area on average recorded marginal net infl ows of direct investment
in the three-month period to July 2009, for the fi rst time since December 2007.
Overall, in terms of three-month moving averages, net infl ows of combined direct and
portfolio investment have declined continuously since March 2009. This reduced the 12-month
cumulated net infl ow of combined direct and portfolio investment to €392.8 billion in July 2009.
In the 12-month period to July 2008, the euro area recorded cumulated net outfl ows of €43.2 billion.
Chart 38 Main items of the financial account
(EUR billions; net fl ows; three-month moving averages; monthly data)
(EUR billions; 12-month cumulated net fl ows; monthly data)
-60
-40
-20
0
20
40
60
80
100
120
-60
-40
-20
0
20
40
60
80
100
120
2009
equities
money market instruments
bonds and notes
direct investment
combined direct and portfolio investment
2005 2006 2007 2008-300
-200
-100
0
100
200
300
400
500
600
700
-300
-200
-100
0
100
200
300
400
500
600
700
20092005 2006 2007 2008
equities
money market instruments
bonds and notes
direct investment
combined direct and portfolio investment
Source: ECB.


63ECB
Monthly Bulletin
October 2009
ART ICLES
MONETARY POLICY AND LOAN SUPPLY IN THE EURO AREA
This article examines the monetary policy effects on loan supply in the euro area. While loan developments typically hinge on a combination of factors that impact simultaneously on the demand for, and the supply of, bank loans, the focus of this article is on identifying the importance of supply-side factors for aggregate loan developments and their interaction with monetary policy. The evidence presented in this article suggests that monetary policy may affect banks’ ability and willingness to supply loans, as well as the prices banks offer on their loans. The substantial reductions in key ECB interest rates and the introduction of non-standard monetary policy measures during the recent fi nancial crisis should also be seen against the background of this evidence, taking into account the dominant position of the banking sector in the euro area fi nancial system.
1 INTRODUCTION
In most developed economies, bank lending
and, more generally, overall lending by MFIs
constitute one of the most important sources
of external fi nancing for households and
non-fi nancial corporations. Bank lending is a
particularly important source of fi nancing in the
euro area, where bank loans have accounted for
around 85% of the total external fi nancing of the
private sector in recent years.1 Accordingly, the
continued smooth functioning of loan supply
from the banking system to creditworthy
borrowers is a key prerequisite for sustained
economic activity, and also for the effective and
smooth transmission of the monetary policy
stance to the economy. As part of its monetary
policy analysis, the ECB thus pays close
attention to developments in bank lending and
to indications of strains on bank loan
supply. For this reason, the sharp decline
recorded in recent quarters in the real annual
growth rate of loans granted to euro area
non-fi nancial corporations and households has
been monitored closely (see Chart 1). As in past
episodes, the drop in the growth of loans has
coincided with the sharp deterioration in
economic activity. However, owing to the
unprecedented shocks that have hit the fi nancial
sector during the fi nancial crisis since mid-2007,
it cannot be ruled out that a supply-induced
reduction of lending has likewise contributed to
amplifying the downturn in the wider economy.
Banks may reduce loan supply by raising
loan rates, by lowering loan volumes, or
both. Indeed, the Eurosystem’s bank lending
survey for the euro area provides qualitative
information on the extent to which banks
tighten their credit standards via price
or volume-related terms and conditions
(see Chart 2). On average, the tightening of
credit standards since the second half of 2007
has been implemented predominantly through
increases in margins. However, more stringent
requirements with respect to the quantity of
loans (and other non-price terms) also seem to
have played a non-negligible role.
Generally, it is rather diffi cult to identify
the supply and demand effects that underlie
credit developments, especially as shifts in
For further details on the importance of bank fi nancing in the 1
euro area fi nancial system, see the articles entitled “The role
of banks in the monetary policy transmission mechanism” and
“The external fi nancing of households and non-fi nancial
corporations” in the August 2008 and April 2009 issues
respectively of the Monthly Bulletin.
Chart 1 Real annual growth rate of loans to non-financial corporations and households, and real GDP growth
(annual percentage changes)
1999 2000 2001 2002 2003 2004 2005 2006 2007 2008-6
-4
-2
0
2
4
6
8
10
12
14
-6
-4
-2
0
2
4
6
8
10
12
14
real growth of loans to non-financial corporations
real growth of loans to households
real GDP growth
Sources: ECB and Eurostat.Note: Defl ated by the GDP defl ator.

64ECB
Monthly Bulletin
October 2009
demand and supply both have an impact on
bank lending rates and credit volumes. This
is illustrated in a highly stylised manner in
Chart 3, which displays the effects on lending
rates and the volume of loans in a situation
where both supply and demand are reduced.
In such a case, the two countervailing factors
trigger a reduction in the credit provided to the
economy; at the same time, the net effect on
lending rates depends on the relative strength of
the two effects. The focus of this article is on
identifying and assessing the implications for
loan volumes and prices from shifts in the loan
supply curve (LS).
In practice, the monitoring of the functioning
of bank lending and the identifi cation of
impairments to credit supply require a detailed
knowledge and continuous analysis of the
fi nancial system and loan supply decisions
by fi nancial intermediaries. In general, it can
be expected that a bank’s decision to fulfi l
the demand for loans from its customers will
depend on a variety of factors. First, it will
depend on the bank’s ability to fi nance the
amount of money demanded by the bank’s
borrowers. This will hinge on the loanable
funds it has available in terms of its deposit
base and access to wholesale funding sources,
and on the amount of capital it can allocate to
the loan, which in turn hinges on regulatory
requirements and the disciplining forces of
the market. Second, it will be subject to a
risk-return calculation that takes into account
the opportunity cost and the possible
informational asymmetries between banks
and their customers. This, among other things,
involves weighing a number of considerations,
including the bank’s assessment of the
probability that the loan will be paid back (which
is infl uenced, inter alia, by the collateral values
and by the fi rm-specifi c and general economic
outlook), alternative investment opportunities
for the bank and alternative fi nancing sources
for the potential borrower. The latter will, in
turn, depend on the degree of competition in
the banking sector and in the broader fi nancial
system, on the banking model of the lender
(for example, on the extent to which the bank
engages in long-term relationship lending),
on the presence of informational frictions and
on the bank’s degree of risk aversion. All of
these factors potentially have an impact on
the bank’s lending decisions in terms of the
volume of loans it is inclined to extend and the
price at which it is willing to do so.
Chart 2 Changes in euro area banks’ terms and conditions on loans to enterprises
(net percentages)
-20
0
20
40
60
80
100
price terms
volume terms
other terms
-40 -40
-20
0
20
40
60
80
100
2003 2004 2005 2006 2007 2008
Source: Eurosystem bank lending survey.Notes: “Price terms” refer to “margins on average loans” and “margins on riskier loans”. “Volume terms” refer to “size of loan or credit line” and “collateral requirements”. “Other terms” refer to “loan covenants”, “non-interest rate charges” and “maturity”. The net percentages reported for the three groups are simple averages of the net tightening in the underlying terms listed above.
Chart 3 Loan supply and demand
y-axis: loan rate
x-axis: loan volume
LD
1
LD
0
LS
0
LS
1
R0
V1
V0
Note: LS refers to the loan supply curve, whereas LD refers to the loan demand curve.

65ECB
Monthly Bulletin
October 2009
ARTICLES
Monetary policy and
loan supply in the
euro area
Monetary policy has the potential to affect
many of the elements that determine banks’
lending decisions. In the economic literature,
apart from its impact on bank interest rates via
the “interest rate channel”, the transmission of
monetary policy to bank loan supply is
traditionally categorised as the “credit channel”
of the transmission mechanism. The latter
emphasises the impact that changes in monetary
policy rates may have on banks’ funding and
capital positions (the “narrow” credit channel),
on the one hand, and on the collateral values and
net worth of the banks’ borrowers (the “broad”
credit channel), on the other. In addition,
monetary policy might infl uence the risk-taking
behaviour of banks, and thus the credit standards
that banks apply to their loans, by affecting their
risk perceptions and willingness to take more risk.2
While monetary policy actions are likely to
primarily affect the demand for bank loans
through the traditional interest rate channel, it is
important for the central bank to also be able to
identify and monitor as precisely as possible its
impact on the supply side of bank lending. From
a monetary policy perspective, it is important to
know whether developments in aggregate loans
to the non-fi nancial private sector are driven by
changes in the demand for loans or by those in
loan supply. Indeed, the tools and actions that
monetary policy-makers may need to employ
can differ substantially, depending on whether
the central bank aims to affect loan supply,
loan demand, or both. In addition, it is
important to identify the underlying source
of a shock to loan supply. The response of
monetary policy may differ substantially if
banks reduce loans (and/or tighten credit
standards) because the creditworthiness of
borrowers has deteriorated, or because they
cannot fi nance themselves in the market. In
the fi rst case, a reduction in policy rates would
encourage aggregate demand, so that the net
worth of corporations and the willingness of
banks to lend would increase over time. In the
second case, providing the necessary liquidity
to banks would enable them to satisfy the
demand for loans of profi table fi rms.
Furthermore, gauging the interaction between
monetary policy and loan supply becomes
particularly important during crisis periods
when the banking sector is under pressure and
loan supply is hit by adverse shocks. In such
cases, it is crucial for the central bank to
have a sound knowledge of the magnitude of
implications of monetary policy actions for loan
supply in order to alleviate the shocks to loan
supply and put banks in a position to fulfi l their
role as fi nancial intermediaries for the economy.
Such policy actions can range from adjustments
to key policy rates to a number of so-called
“non-standard” measures. The latter comprise,
fi rst, the provision of funding liquidity to banks
via full-allotment liquidity operations, the
widening of the related collateral framework
or an extension of the maturity of liquidity
operations, as well as the acquisition of bank
assets or (securitised) bank debt. Second, they
might extend to the direct supply of funds to the
real economy via the purchase of debt issued by
the private non-fi nancial sector or by providing
funds to intermediary state-sponsored banks
that act as a catalyst for the extension of credit
to small and medium-sized enterprises.
Against this background, this article focuses
on the supply side of bank lending and initially
reviews the theoretical arguments for links
between monetary policy and banks’ lending
decisions. Second, it presents recent empirical
evidence on the credit and risk-taking channels
of monetary policy transmission in the euro
area, building up on micro-based data and on
information from the Eurosystem bank lending
survey. Analogously, the impact of both the
fi nancial crisis and recent fi nancial innovation
on the transmission of monetary policy to
loan supply is assessed. Finally, it offers some
concluding remarks from a monetary policy
perspective.
In the literature, this channel of the monetary policy transmission 2
mechanism is often referred to as the “risk-taking channel”;
see, for example, C. Borio and H. Zhu, “Capital regulation, risk-
taking and monetary policy: A missing link in the transmission
mechanism”, BIS Working Paper Series, No 268, Bank for
International Settlements, 2008.

66ECB
Monthly Bulletin
October 2009
2 THE CREDIT CHANNEL FROM A THEORETICAL
PERSPECTIVE
This section reviews the theoretical mechanisms
that underpin the impact of monetary policy on
bank lending, thereby affecting the real economy
in turn.3
As illustrated in Chart 4, monetary policy – via
banks – can affect the economy through several
channels. It can have an impact on aggregate
demand via the banking system as part of
the traditional interest rate channel.4 Banks
determine the pass-through of policy rates to
bank lending rates for fi rms and households.5
A tightening of monetary policy, which could
result in higher lending rates, reduces the demand
for loans from fi rms and households, thereby
For a comprehensive overview, see also the article entitled “The 3
role of banks in the monetary policy transmission mechanism” in
the August 2008 issue of the Monthly Bulletin.
The interest rate channel works on the assumption that some 4
prices and nominal wages are infl exible (sticky) in the short run.
For recent evidence on the broad monetary policy transmission
mechanism in the euro area, see, for example, J. Boivin,
M.P. Giannoni and B. Mojon, “Macroeconomic dynamics in
the euro area”, in D. Acemoglu, K. Rogoff and M. Woodford
(eds.), NBER Macroeconomics Annual 2008, National Bureau of
Economic Research, 2008. For evidence in the early 2000s, see
the studies conducted by the Eurosystem Monetary Transmission
Network, which have been collected in I. Angeloni, A.N. Kashyap
and B. Mojon (eds.), Monetary policy transmission in the euro area, Cambridge University Press, 2003.
See the article entitled “Recent developments in the retail bank 5
interest rate pass-through in the euro area” in the August 2009
issue of the Monthly Bulletin.
Chart 4 The main monetary policy transmission channels involving banks
Credit channel
Bank interest rate
pass-through
Real interest rate
Risk-taking channel
Risk perceptions
and aversion
Risk-taking behaviour
Credit standards
Change in monetary policy
Balance sheet
channel
External finance
premium
Cash flow
Net worth
Bank lending
channel
Interest income Asset prices
Deposits
(loanable funds)Bank capital
“Pure” loan supply
Investment and consumption
Economic growth and inflation
Interest rate channel
Source: ECB.

67ECB
Monthly Bulletin
October 2009
ARTICLES
Monetary policy and
loan supply in the
euro area
ultimately leading to lower aggregate demand
by reducing investment and consumption. This
mechanism, however, is not the focus of this
article, even though it is probably the most
important channel of monetary policy.
Monetary policy may also infl uence the ability
of, and incentives for, banks to supply loans
through the functioning of the so-called credit
channel. In a frictionless fi nancial system, all the
projects with a positive net present value would
be fi nanced, irrespective of the net worth of the
borrower(s) and/or lender(s). However, frictions
in fi nancial markets, such as asymmetries of
information and incompleteness of contracts,
imply that – on account of, for example, moral
hazard problems – lenders will not always
fi nance projects with a positive net present value.
In such cases, the net worth of the borrower(s)
and/or lender(s) is of importance for loan supply,
and monetary policy can affect it.6 This, in turn,
has an infl uence on real economic activity and
infl ation, especially in the euro area where banks
are the key suppliers of external fi nance for the
non-fi nancial private sector.
The credit channel of monetary policy
transmission is composed of two sub-channels
(see Chart 4). In the fi rst, the bank lending
channel, a change in monetary policy rates
affects the liability side of banks’ balance
sheets. This, in turn, triggers adjustments on
the asset side through changes in the banks’
loan portfolios.7 Since banks fi nance themselves
largely through short-term debt and deposits,
a tightening of monetary policy would tend to
reduce loan supply, via its negative impact on
the availability of funds for banks. This effect
rests on the assumption that banks are not able
to perfectly replace short-term debt and deposits
with funding from other sources, or that they do
not have suffi cient liquidity buffers.8
Moreover, an increase in short-term rates can
increase the external fi nance premium for banks
(i.e. the premium over the risk-free rate paid to
outside investors) by potentially reducing the net
worth of banks’ assets and by increasing their
risk burden. This would also affect loan supply.9
In this sense, the bank lending channel includes
the impact of monetary policy, as channelled
through banks’ capital position, also referred to
as the bank capital channel.10 By way of their
impact on bank balance sheet valuations and
overall bank profi tability, monetary policy rates
affect banks’ capital position, thus inducing
banks to adjust loan supply to meet targeted
leverage and capital ratios, as well as regulatory
capital requirements. Therefore, the effect
of monetary policy on bank loan supply will
depend on the liquidity and capital positions of
banks, as well as on the size and the maturity
structure of their liabilities.11
The second mechanism belonging to the credit
channel of monetary policy transmission, the
balance sheet channel, works through changes
to the quality of borrowers (see Chart 4).
See B.S. Bernanke and M. Gertler, “Inside the black box: the 6
credit channel of monetary policy transmission”, Journal of Economic Perspectives, Vol. 9, No 4, autumn 1995, pp. 27-48;
and B.S. Bernanke, “The Financial Accelerator and the Credit
Channel”, speech presented at the conference entitled “The Credit
Channel of Monetary Policy in the Twenty-fi rst Century”,
Federal Reserve Bank of Atlanta, 2007. See also J.E. Stiglitz
and B. Greenwald, Towards a New Paradigm in Monetary Economics, Cambridge University Press, 2003.
See for example B.S. Bernanke and A. Blinder, “Credit, money, 7
and aggregate demand”, American Economic Review, 78, No 2,
May 1988, pp. 901-921; D.W. Diamond and R.G. Rajan, “Money
in a Theory of Banking”, American Economic Review, 96, 2006,
pp. 30-53; and J.C. Stein, “An Adverse-Selection Model of
Bank Asset and Liability Management with Implications for the
Transmission of Monetary Policy”, RAND Journal of Economics,
No 29, 1998, pp. 466-486.
See T. Adrian and H. Shin, “Money, Liquidity and Monetary 8
Policy”, American Economic Review, Papers and Proceedings,
Vol. 99(2), 2009.
See Bernanke (2007), op. cit.9
The assumption for the “bank capital” channel to work is that the 10
market for bank equity is imperfect (in the sense that imperfect
information, especially when fi nancing conditions are more
restrictive, makes it diffi cult for banks to raise new equity);
see, for example, S. Van den Heuvel, “Does bank capital matter
for monetary transmission?”, Economic Policy Review, Federal
Reserve Bank of New York, May 2002, pp. 259-265; R.P. Kishan
and T.P. Opiela, “Bank capital and loan asymmetry in the
transmission of monetary policy”, Journal of Banking & Finance,
No 30, 2006, pp. 259-285; and Y. Altunbas, G. de Bondt and
D. Marqués, “Bank capital, bank lending, and monetary policy in
the euro area”, Kredit und Kapital, Vol. 37(4), 2004, pp. 443-464.
See, for example, A.N. Kashyap and J. Stein, “What do a 11
million observations on banks say about the transmission of
monetary policy?”, American Economic Review, Vol. 90, No 3,
June 2000, pp. 407-428. See also W.J. Den Haan, S. Sumner
and G. Yamashiro, “Bank Loan Portfolios and the Monetary
Transmission Mechanism”, Journal of Monetary Economics,
Vol. 54, 2007, pp. 904-924.
68ECB
Monthly Bulletin
October 2009
Changes in policy rates may affect borrowers’
net worth via the impact on cash fl ows and
collateral values. The external fi nance premium
paid by borrowers depends inversely on
their net worth. When borrowers have little
capital to contribute to the fi nancing of a
project, the confl ict of interests between the
borrower and the suppliers of external funds is
potentially larger, which translates into higher
compensation to be paid to external investors.
Moreover, borrowers’ net worth is typically
pro-cyclical (because profi ts and asset prices
tend to be pro-cyclical) and, therefore, the
external fi nance premium is counter-cyclical.
This amplifi es the impact of changes in short-
term rates on credit availability, and thus on
investment, consumption, and production –
a mechanism referred to as the fi nancial
accelerator.12 Hence, the effect of monetary
policy on bank loan supply depends on the
borrowers’ net worth (capital ratio, liquidity
ratio, size and tangible assets).13
The (fi rm) balance sheet and the bank lending
channels are interrelated. A tightening of
monetary policy reduces the net worth of
borrowers, which, in turn, decreases the net
worth of banks via an increase in the credit risk
of their loan books. In addition, restrictions
on bank loan supply may reduce the net worth
of borrowers as a result of the higher cost
of capital and/or the reduction of the credit
effectively granted.
More recently, the notion of a “risk-taking”
channel of monetary policy transmission has
been put forward.14 Low short-term interest
rates may increase risk-taking by banks
through several mechanisms. First, low levels
of interest rates – policy rates and government
bond yields – may increase the attractiveness of
risky assets for all investors, including banks.
This effect can be seen in models of portfolio
optimisation in a mean-variance analysis
framework, or in models including habit
formation. Investors may become less risk-
averse during economic expansions because
their consumption increases relative to the
status quo (normal levels). Less tight monetary
policy conditions may decrease investors’ risk
aversion by supporting real economic activity.15
Second, when interest rates are low and
liquidity is abundant, fi nancial intermediaries
may “over-lend” and fi nance projects with
sub-optimal net present values because of
confl icts of interests that arise from asymmetric
information, which is often pervasive in the
banking industry.16 In fact, the level of
overnight rates is a key driver of liquidity for
banks, since banks increase their balance sheets
(leverage) when fi nancing conditions (through
short-term debt) are more favourable, and
vice versa.17 Therefore, low short-term interest
See B.S. Bernanke, M. Gertler and S. Gilchrist, “The fi nancial 12
accelerator in a quantitative business cycle framework”, in
J. Taylor and M. Woodford (eds.), Handbook of Macroeconomics, Amsterdam, 1999; J.E. Stiglitz and A. Weiss, “Credit
rationing in markets with imperfect information”, American Economic Review, Vol. 71, No 3, June 1981, pp. 393-410; and
B. Holmström and J. Tirole, “Financial intermediation, loanable
funds, and the real sector”, The Quarterly Journal of Economics,
Vol. 112, No 3, 1997, pp. 663-691.
See B.S. Bernanke, M. Gertler, and S. Gilchrist, “The Financial 13
Accelerator and the Flight to Quality”, Review of Economics and Statistics, 78, 1996, pp. 1-15; and A. Ashcraft and M. Campello,
“Firm balance sheets and monetary policy transmission”, Journal of Monetary Economics, Vol. 54, 2007, pp. 1515-1528.
See, for example, C. Borio and H. Zhu (2008), op. cit.14
See J. Campbell and J. Cochrane, “By force of habit: a 15
consumption-based explanation of aggregate stock market
behaviour”, Journal of Political Economy, Vol. 107, 1999,
pp. 205-251; S. Manganelli and G. Wolswijk, “Market
discipline, fi nancial integration and fi scal rules – what drives
spreads in the euro area government bond market?”, Working Paper Series, No 745, ECB, 2007; and B.S. Bernanke and
K.N. Kuttner, “What explains the stock market’s reaction to
Federal Reserve policy?”, The Journal of Finance, Vol. 60,
No 3, June 2005, pp. 1221-1257. For a discussion of the
search for yield associated with low levels of interest rates,
see R.G. Rajan, “Has Finance Made the World Riskier?”, NBER
Working Paper 11728 and paper presented at the symposium
sponsored by the Federal Reserve Bank of Kansas City,
Jackson Hole, 2005.
See F. Allen and D. Gale, 16 Understanding Financial Crises,
Oxford University Press, 2007; and F. Allen and D. Gale,
“Asset price bubbles and monetary policy” in M. Desai and
Y. Said (eds.), Global Governance and Financial Crises, 2004.
Without bank agency problems, banks would, in the event of
having excess liquidity, give funds back to their shareholders
or the central bank. See also G. Dell’Ariccia and R. Marquez,
“Lending Booms and Lending Standards”, Journal of Finance,
No 61(5), 2006, pp. 2511-2546, and Diamond and Rajan (2006),
op. cit.
See H. Shin, 17 Risk and liquidity, 2008 Clarendon Lectures
in Finance, Oxford University Press, forthcoming; and
M. Brunnermeier, A. Crockett, C. Goodhart, A. Persaud and
H. Shin, “The Fundamental Principles of Financial Regulation”,
Geneva Reports on the World Economy, 11, 2009.

69ECB
Monthly Bulletin
October 2009
ARTICLES
Monetary policy and
loan supply in the
euro area
rates may increase bank risk-taking through
these channels.18
Overall, there are several theoretical mechanisms
by which monetary policy may affect the
supply of loans that banks are willing and able
to provide to fi rms and households. Given that,
in the euro area, banks are the key suppliers
of external fi nance for fi rms and households,
changes in bank loan supply may, in turn, affect
economic activity. Hence, the transmission
of monetary policy through the credit and
risk-taking channels may potentially amplify
the monetary policy implications for output
and infl ation that emanate from the impact on
demand via the interest rate channel.
3 EMPIRICAL EVIDENCE ON THE CREDIT AND
RISK-TAKING CHANNELS IN THE EURO AREA
This section presents an overview of empirical
evidence for the euro area on the impact of
monetary policy on bank loan supply and,
ultimately, on economic activity. More
specifi cally, it provides indications for
the different channels of monetary policy
transmission discussed above, with a focus on
the euro area.
The empirical fi ndings are divided into three
parts: fi rst, the monetary policy impact on
banks’ own balance sheets and loan supply is
examined. Second, the monetary policy impact
on borrower balance sheets and loan supply is
analysed. Third, the impact of changes in loan
supply on economic activity and infl ation is
assessed. These fi ndings help address one of
the key challenges faced by central banks in
gauging the impact of monetary policy on loan
supply, namely disentangling loan supply and
demand effects as precisely as possible.
Empirically, it is diffi cult to identify supply
effects using aggregate time series. Therefore,
individual bank-specifi c characteristics are often
used in the empirical literature to identify
factors that directly infl uence loan supply,
while demand for loans is typically assumed to
be independent of the situation of individual
banks and to rather depend on macroeconomic
factors. In addition to using such micro-based
evidence, use is also made in this article of
responses to the Eurosystem bank lending
survey for the euro area, which include
information on euro area banks’ assessments of
loan supply and demand conditions and which
thus allow a potential identifi cation of supply-
side effects at the more aggregate euro area
level also. As illustrated in Charts 5 and 6,
which include information from the
aforementioned survey, bank lending tends to
be highly positively correlated with changes in
loan demand and negatively correlated with
changes in bank credit standards (that broadly
refl ect bank supply conditions). Using these
survey data for identifi cation, however, implies
some general qualifi cations as they are
restricted to qualitative information and,
thereby, subjective by nature, with the potential
Securitisation of loans also increases bank liquidity, and 18
results in assets yielding attractive returns for investors. At the
same time, it may induce reduced screening and monitoring
of securitised loans. Hence, the impact of low rates on bank
risk-taking may be stronger with high securitisation activity
(see Rajan (2005), op. cit.).
Chart 5 Lending to non-financial corporations in the euro area
(annual percentage changes; net percentages)
-80
-60
-40
-20
0
20
40
60
80
-16
-12
-8
-4
0
4
8
12
16
2003 2004 2005 2006 2007 2008 2009
demand for loans to enterprises (net percentages;
left-hand scale)
credit standards on loans to enterprises (net percentages;
left-hand scale)
loans to non-financial corporations (annual growth rate;
four-quarter lag; right-hand scale)
Source: ECB.

70ECB
Monthly Bulletin
October 2009
for an endogenous link between responses that
relate to credit demand and those that refer to
credit supply.19 Furthermore, in the case of the
bank lending survey, the time horizon of the
data available is still limited, as the fi rst survey
round only took place in the fourth quarter of
2002.
MONETARY POLICY IMPACT ON BANK BALANCE
SHEETS AND LOAN SUPPLY
The issue of the extent to which monetary
policy impacts on bank loan supply is typically
analysed in terms of the credit and risk-taking
channels of monetary policy transmission
(see Section 2). In this respect, it is useful to
distinguish between the “traditional” bank
lending channel (working through the
availability of funds), a bank capital channel
(via the impact on banks’ profi tability and capital
position), the balance sheet channel (relating to
the net worth of the bank borrowers) and the
risk-taking channel (working through banks’
risk perceptions). The empirical evidence for
the euro area with respect to these four channels
is presented hereafter.
As regards the “traditional” bank lending
channel, where a change in monetary policy
rates that affects the banks’ liabilities can be
expected to have an impact on the banks’
ability to lend, the empirical evidence for the
euro area is rather mixed.20 Early evidence on
the importance of the bank lending channel
in the euro area countries was provided by
the results of studies by the Eurosystem
Monetary Transmission Network (MTN).21
Somewhat in contrast to evidence for the
United States, the MTN found that the features
of the banking sector in many euro area
countries to some extent sheltered banks from
the effects of monetary policy on their funding,
and thus on their ability to lend. For example,
the partial public involvement in national
banking sectors, extensive deposit insurance
schemes, the existence of bank network
arrangements and the prominence of
relationship lending were assessed to be
weakening the importance of the bank lending
channel in many euro area countries. According
to the MTN results, only the degree of bank
liquidity was found to signifi cantly interact
with monetary policy in the sense that less
liquid banks were more prone to change their
lending in response to changes in monetary
When looking at the survey responses on the factors contributing 19
to the tightening of credit standards, this qualifi cation holds true
particularly for risk-related factors that refl ect the assessment of
the creditworthiness of borrowers.
By contrast, earlier evidence in favour of the bank lending 20
channel was found for the United States, using micro-
econometric modelling approaches. In particular, it was found
that monetary policy had distributional effects across banks with
different degrees of informational opaqueness (as measured by,
for example, size, liquidity and capital); see, for example, J. Peek
and E.S. Rosengren, “Bank lending and the transmission of
monetary policy”, in J. Peek and E.S. Rosengren, (eds.), Is Bank Lending Important for the Transmission of Monetary Policy?,
Federal Reserve Bank of Boston Conference Series 39, 1995,
pp. 47-68; Kashyap and Stein (2000), op. cit. A related study
using a different modelling approach was undertaken by
J.C. Driscoll, “Does bank lending affect output? Evidence from
the U.S. states”, Journal of Monetary Economics, Vol. 51, 2004,
pp. 451-471. For similar fi ndings, see also A. Ashcraft, “New
evidence on the lending channel”, Journal of Money, Credit, and Banking, Vol. 38(3), 2003, pp. 751-776.
See, in particular, M. Ehrmann, L. Gambacorta, J. Martínez Pagés, 21
P. Sevestre and A. Worms, “Financial systems and the role of
banks in monetary policy”, in I. Angeloni, A.K. Kashyap and
B. Mojon (eds.), Monetary Policy Transmission in the Euro Area, Cambridge University Press, Cambridge, 2003, and the
companion papers cited therein.
Chart 6 Lending to households for house purchase in the euro area
(annual percentage changes; net percentages)
-80
-60
-40
-20
0
20
40
60
80
-14
-10
-6
-2
2
6
10
14
2003 2004 2005 2006 2007 2008 2009
demand for loans to households (net percentages;
left-hand scale)
credit standards on loans to households (net percentages;
left-hand scale)
loans to households (annual growth rates;
four-quarter lag; right-hand scale)
Source: ECB.

71ECB
Monthly Bulletin
October 2009
ARTICLES
Monetary policy and
loan supply in the
euro area
policy. More recently, the growing importance
of non-deposit funding sources, such as capital
market fi nancing (e.g. covered bond issuance)
and the rapid expansion of the euro area
securitisation market, has also tended to further
weaken the bank lending channel. In this
regard, Box 1 examines the role of fi nancial
innovation in the monetary policy transmission
mechanism, also taking into account the effects
of the fi nancial turmoil. Nonetheless, whereas
the MTN studies were conducted mainly on the
basis of data samples covering the period prior
to the introduction of the euro, more recent
studies using data covering the period since the
start of Stage Three of EMU have found some
evidence of a functioning bank lending channel
among euro area countries.22
Using the approach of Driscoll (op. cit.) for a panel of euro 22
area countries, the studies fi nd that money demand shocks
have a signifi cant effect on bank lending (and, in contrast to
Driscoll’s fi ndings, also on economic activity); see L. Cappiello,
A. Kadareja, C. Kok Sørensen and M. Protopapa, “Do bank loans
and credit standards have an effect on output? A panel approach
for the euro area”, Working Paper Series, ECB, forthcoming; and
M. Čihák, and P.K. Brooks, “From subprime loans to subprime
growth? Evidence for the euro area”, IMF Working Paper Series,
No 09/69, International Monetary Fund, 2008.
Box
TAKING STOCK OF THE IMPACT OF FINANCIAL INNOVATION ON BANK LOAN SUPPLY IN THE LIGHT
OF THE FINANCIAL TURMOIL
The years prior to the credit market turmoil coincided with spectacular increases in the amount
and complexity of securitisation activity, and in the number of countries using structured fi nance
products. While securitisation has been in use as a funding technique for more than 50 years
in the United States, a signifi cant use of securitisation in the euro area has only taken place in
recent years.1 The large increases in the use of securitisation across the globe were part of a
wider trend of fi nancial innovation towards the structuring and trading of credit risk.2 Together,
these developments helped to make credit risk more tradable. This trend also encompassed the
development of credit derivatives and the frequent use of securitisation techniques, in combination
with more traditional forms of transferring credit risk, such as the syndication of loans. This
revolution in credit risk transfer techniques can be traced back to a number of concurrent factors,
such as globalisation in fi nancial markets, improvements in information technology and pricing
models, as well as the movement towards a more market-based fi nancial system. In Europe,
the disappearance of exchange rate risk among euro area countries, the increase in fi nancial
integration and a more market-based fi nancial system all contributed to enhancing the liquidity
and size of the securitisation market.
The recent fi nancial market crisis has had a huge impact on the securitisation markets. In this
respect, even though securitisation activity in the primary markets has remained robust, the bulk
of the thus securitised instruments is retained within the originators’ balance sheets. The primary
market for public securitisation was very weak and almost ground to a halt in most of 2008 and
in the fi rst half of 2009, while some activity remains in the secondary market. Indeed, evidence
from the bank lending survey for the euro area in recent quarters suggests that problems in
accessing securitisation markets are having an impact on banks’ willingness and ability to lend.
1 For an explanation of securitisation in the euro area, see the article entitled “Securitisation in the euro area” in the February 2008 issue
of the Monthly Bulletin.
2 D. Marqués-Ibáñez and M. Scheicher, “Securitisation: Causes and Consequences”, in A. Berger, P. Molyneux and J. Wilson (eds.),
Handbook of Banking, Oxford University Press, forthcoming.

72ECB
Monthly Bulletin
October 2009
This is likely to also be the case in the near future, given a dislocated investor base that suffered
very heavy losses during the fi nancial crisis, the high level of uncertainty and an excess pre-
crisis supply.
These developments in securitisation activity have produced signifi cant changes both in the
fi nancial structure of most developed countries and in the role of banks therein. In this respect,
the use of securitisation prior to the fi nancial crisis modifi ed the functioning of credit markets,
reducing the fundamental role of liquidity transformation traditionally performed by fi nancial
intermediaries. The changing role of banks from that of “originating and holding” to one of
“originating, repackaging and selling” also had implications for the incentives and ability of
banks to grant credit. Indeed, from a macroeconomic perspective, securitisation brought about
signifi cant changes in the credit markets, thereby altering loan dynamics. In this respect, one of the
consequences of securitisation from a macroeconomic perspective was an overall increase in the
aggregate loan supply. This was due to the characteristics of securitisation activity that releases
previously illiquid parts of the credit spectrum, thereby encouraging a larger mobilisation of
funds from investors. Furthermore, by fully removing loans from their balance sheet, banks were
often able to obtain regulatory capital relief, which could also be used to expand loan supply.
From a microeconomic point of view, the ability to securitise part of their assets gave banks
access to additional funding that could, in turn, be used to grant additional loans. Recent studies
suggest that the expansion of credit supply in recent years was partly driven by securitisation.
In particular, there is evidence that credit growth is higher in those areas experiencing larger
increases in securitisation activity and that banks that are more active in the securitisation market
also seem to supply more loans.3
In addition, securitisation may have altered the monitoring function performed by banks.4
By moving instruments from banks’ balance sheets to the markets, there may have been fewer
incentives for fi nancial intermediaries to screen borrowers. This is consistent with recent evidence
suggesting that securitisation might have led to looser lending standards.5 By making banks more
dependent on market funding, securitisation could strengthen the connections between banks’
lending, banks’ funding and systemic developments in fi nancial markets. As a result, banks’
incentives and abilities to lend are expected to depend on fi nancial market conditions to a larger
extent than in the past when banks were overwhelmingly funded via bank deposits. This is mainly
because deposits tend to have a more stable remuneration and are, by defi nition, less dependent on
fi nancial market conditions than tradable instruments. Overall, under more extreme circumstances,
securitisation could have a signifi cant impact on the banking sector’s ability to grant credit.
The return of a robust securitisation market, however, is expected to take a very different form
to that seen in the pre-crisis period. In particular, a sharp reduction in the level of complexity and
leverage of the instruments issued is anticipated in a more regulated market. In this respect, a higher
level of transparency and more aligned incentives are crucial for an effi cient securitisation market.
3 A. Sufi and A. Mian, “The consequences of mortgage credit expansion: evidence from the U.S. mortgage default crisis”, Quarterly Journal of Economics, Vol. 124(4), 2009; and Y. Altunbas, L. Gambacorta and D. Marqués-Ibáñez, “Securitisation and the bank
lending channel”, European Economic Review, forthcoming.
4 See B. Holmström and J. Tirole, “Financial intermediation, loanable funds, and the real sector”, The Quarterly Journal of Economics,
Vol. 112(3), 1997, pp. 663-691; and A. Ashcraft and T. Schuermann, “The seven deadly frictions of subprime mortgage credit
securitization”, The Investment Professional, autumn 2008.
5 B. Keys, T. Mukherjee, A. Seru and V. Vig, “Did securitization lead to lax screening? Evidence from subprime loans 2001-2006”,
The Quarterly Journal of Economics, Vol. 125(1), 2010.

73ECB
Monthly Bulletin
October 2009
ARTICLES
Monetary policy and
loan supply in the
euro area
Turning to the bank capital channel as part of
the broader defi nition of the bank lending
channel, there is some empirical evidence
suggesting that euro area banks with low
capitalisation are more sensitive to changes in
monetary policy than banks which are well-
capitalised.23 A recent study examines the
importance of monetary policy for bank
profi tability in the euro area, distinguishing
between the different elements of bank
earnings.24 First, the nature of the impact of
monetary policy on banks’ net interest income,
via its effect on the level of short-term interest
rates and the slope of the yield curve, hinges
crucially on the respective bank’s business
model. In particular, it brought to light the fact
that traditional banks, i.e. banks characterised
by operations with a maturity mismatch in the
sense of lending long term and funding short
term, are most strongly affected by monetary
policy. Thus, it is of relevance whether banks
lend predominantly at fl oating rates or at fi xed
rates. In fact, there are considerable differences
across euro area countries as regards the typical
initial rate fi xation period of bank loans. For
example, it is found that a reduction of policy
rates and a steepening of the yield curve have a
positive impact on the banks’ net interest
income in countries where banks lend mainly
at fi xed long-term rates, whereas the opposite
effect is found in countries where banks lend to
a larger degree at fl oating and short-term rates
(see Chart 7). Second, as a consequence of its
effects on asset prices, a reduction in policy
rates tends to have positive valuation effects on
the banks’ trading books. A third fi nding is
that, by impacting on the collateral values and
the cash fl ows of bank borrowers, the policy-
induced changes in asset prices in turn affect
the level of write-offs in banks’ loan books, as
well as the loan loss provisions that banks will
have to make.
Monetary policy-induced changes to banks’
balance sheets, as well as other shocks that
affect bank soundness, may cause banks to
alter their loan supply. This can be refl ected in
the credit volumes made available by the
banks, as well as in the terms and conditions
stipulated for credit. By way of illustration,
Chart 8 shows that, in certain periods, bank
balance sheet constraints have contributed to a
signifi cant net tightening of bank credit
standards, most notably during the recent
See, for example, Y. Altunbas, G. de Bondt and D. Marqués-23
Ibáñez, op. cit.; L. Gambacorta and P.E. Mistrulli, “Does
bank capital affect lending behaviour?”, Journal of Financial Intermediation, Vol. 13(4), 2004, pp. 436-457; for US-based
evidence, see, for example, R.P. Kishan and T.P. Opiela, “Bank
capital and loan asymmetry in the transmission of monetary
policy”, Journal of Banking and Finance, Vol. 30, 2006, pp. 259-
285; and T. Bayoumi and O. Melander, “Credit Matters: Empirical
Evidence on U.S. Macro-Financial Linkages”, IMF Working Paper Series, No 08/169, International Monetary Fund, 2008; for
Japan, see, for example, W. Watanabe, “Prudential Regulation and
the ‘Credit Crunch’: Evidence from Japan”, Journal of Money, Credit and Banking, Vol. 39, No 2–3, 2007, pp. 639-665.
See H.S. Hempell and C. Kok Sørensen, “Does monetary 24
policy affect bank profi tability and bank loan supply? Empirical
evidence for the euro area”, Working Paper Series, ECB,
forthcoming.
Chart 7 MFI loan-deposit margins and the yield curve
(percentages per annum; percentage points)
-1
0
1
2
3
4
5
2.0
2.5
3.0
3.5
4.0
EONIA
slope of the yield curve (10-year government bond
yield minus 3-month EURIBOR)
loan-deposit margin (fixed-rate countries;
right-hand scale)
loan-deposit margin (floating-rate countries;
right-hand scale)
Jan. July Jan. July Jan. July Jan. July JulyJan.2005 2006 2007 2008 2009
Sources: ECB and Reuters.Notes: The category “fi xed-rate countries” comprises Belgium, Germany, France and the Netherlands, and are defi ned as countries where more than 50% of the mortgage loans are at interest rates fi xed for an initial period of more than fi ve years. The category “fl oating-rate countries” consists of the remaining euro area countries. See also ECB, “Differences in MFI interest rates across euro area countries”, September 2006.
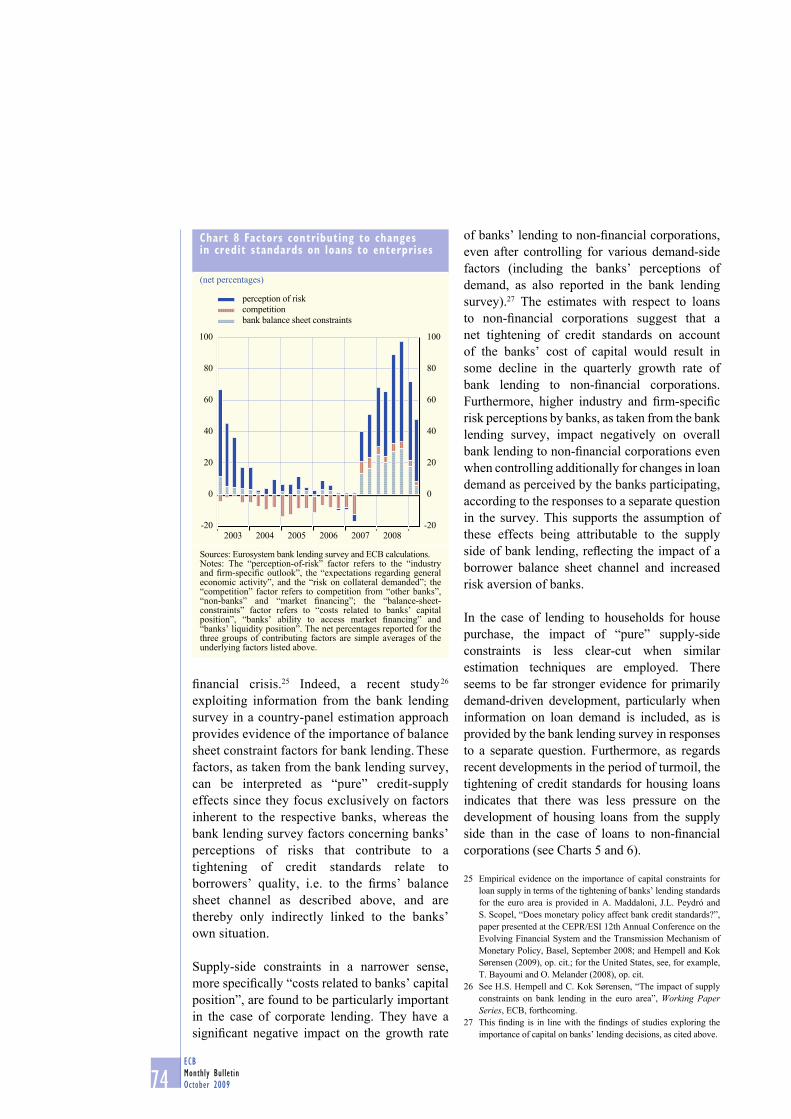
74ECB
Monthly Bulletin
October 2009
fi nancial crisis.25 Indeed, a recent study 26
exploiting information from the bank lending
survey in a country-panel estimation approach
provides evidence of the importance of balance
sheet constraint factors for bank lending. These
factors, as taken from the bank lending survey,
can be interpreted as “pure” credit-supply
effects since they focus exclusively on factors
inherent to the respective banks, whereas the
bank lending survey factors concerning banks’
perceptions of risks that contribute to a
tightening of credit standards relate to
borrowers’ quality, i.e. to the fi rms’ balance
sheet channel as described above, and are
thereby only indirectly linked to the banks’
own situation.
Supply-side constraints in a narrower sense,
more specifi cally “costs related to banks’ capital
position”, are found to be particularly important
in the case of corporate lending. They have a
signifi cant negative impact on the growth rate
of banks’ lending to non-fi nancial corporations,
even after controlling for various demand-side
factors (including the banks’ perceptions of
demand, as also reported in the bank lending
survey).27 The estimates with respect to loans
to non-fi nancial corporations suggest that a
net tightening of credit standards on account
of the banks’ cost of capital would result in
some decline in the quarterly growth rate of
bank lending to non-fi nancial corporations.
Furthermore, higher industry and fi rm-specifi c
risk perceptions by banks, as taken from the bank
lending survey, impact negatively on overall
bank lending to non-fi nancial corporations even
when controlling additionally for changes in loan
demand as perceived by the banks participating,
according to the responses to a separate question
in the survey. This supports the assumption of
these effects being attributable to the supply
side of bank lending, refl ecting the impact of a
borrower balance sheet channel and increased
risk aversion of banks.
In the case of lending to households for house
purchase, the impact of “pure” supply-side
constraints is less clear-cut when similar
estimation techniques are employed. There
seems to be far stronger evidence for primarily
demand-driven development, particularly when
information on loan demand is included, as is
provided by the bank lending survey in responses
to a separate question. Furthermore, as regards
recent developments in the period of turmoil, the
tightening of credit standards for housing loans
indicates that there was less pressure on the
development of housing loans from the supply
side than in the case of loans to non-fi nancial
corporations (see Charts 5 and 6).
Empirical evidence on the importance of capital constraints for 25
loan supply in terms of the tightening of banks’ lending standards
for the euro area is provided in A. Maddaloni, J.L. Peydró and
S. Scopel, “Does monetary policy affect bank credit standards?”,
paper presented at the CEPR/ESI 12th Annual Conference on the
Evolving Financial System and the Transmission Mechanism of
Monetary Policy, Basel, September 2008; and Hempell and Kok
Sørensen (2009), op. cit.; for the United States, see, for example,
T. Bayoumi and O. Melander (2008), op. cit.
See H.S. Hempell and C. Kok Sørensen, “The impact of supply 26
constraints on bank lending in the euro area”, Working Paper Series, ECB, forthcoming.
This fi nding is in line with the fi ndings of studies exploring the 27
importance of capital on banks’ lending decisions, as cited above.
Chart 8 Factors contributing to changes in credit standards on loans to enterprises
(net percentages)
-20
0
20
40
60
80
100
-20
0
20
40
60
80
100
2003 2004 2005 2006 2007 2008
perception of risk
competition
bank balance sheet constraints
Sources: Eurosystem bank lending survey and ECB calculations.Notes: The “perception-of-risk” factor refers to the “industry and fi rm-specifi c outlook”, the “expectations regarding general economic activity”, and the “risk on collateral demanded”; the “competition” factor refers to competition from “other banks”, “non-banks” and “market fi nancing”; the “balance-sheet-constraints” factor refers to “costs related to banks’ capital position”, “banks’ ability to access market fi nancing” and “banks’ liquidity position”. The net percentages reported for the three groups of contributing factors are simple averages of the underlying factors listed above.

75ECB
Monthly Bulletin
October 2009
ARTICLES
Monetary policy and
loan supply in the
euro area
MONETARY POLICY IMPACT ON BORROWERS’
BALANCE SHEETS AND LOAN SUPPLY
Regarding the balance sheet channel, where
monetary policy is deemed to impact on
bank loan supply via its effect on the net
worth of borrowers’ balance sheets, recent
empirical evidence based on the analysis of
loan applications from fi rms points to the
existence of this mechanism.28 Data on loan
applications allow the questions of whether
and why banks grant loans to be analysed and
help to disentangle the impact arising from loan
supply from that of loan demand. The empirical
evidence suggests that the probability of banks
granting loans to fi rms with higher leverage and
lower liquidity ratios increases when monetary
policy rates decline. The associated increase in
the loan volume may have a positive infl uence
on economic activity, given the key importance
of banks as suppliers of external fi nance,
especially in the euro area. In addition, if the
more capital-constrained fi rms belong to sectors
with higher productivity (e.g. biotech fi rms),
the induced change in the composition of bank
loan portfolios may spur economic growth even
more.29 Hence, monetary policy may infl uence
economic activity not only by changing
bank loan volumes, but also by affecting the
composition of bank loans.
In the framework of the balance sheet channel
of monetary policy transmission, lower policy
rates do not imply that banks are taking higher
risks, since borrowers’ net worth tends to
increase when short-term interest rates are
lower, for example through higher values of
collateral. In this context, banks lend to fi rms
with an improved fi nancial position, which are
therefore less risky.
Recent empirical evidence, however, suggests
that low short-term rates may also induce banks
to grant loans with a higher actual risk
(a mechanism labelled the “risk-taking channel”,
as outlined in Section 2) when risk is measured
by ex ante credit standards or by default
probabilities. When short-term interest rates are
low, banks tend to soften their credit standards
and the originated loans tend to have a high
default risk. In addition, banks with relatively
low capital engage in more risk-taking, and the
interest rate spreads on such loans do not
account for the high credit risks taken.30 The
impact of low short-term interest rates may also
be strengthened when banks engage in large-
scale securitisation activity. All these effects are
present when improvements in borrowers’
collateral risk and value are taken into account,
thus suggesting that banks take more risk when
short-term interest rates are low.31
IMPACT OF BANK LOAN SUPPLY
ON ECONOMIC ACTIVITY
The fi nal part of this article investigates the
linkages between the banking sector and the real
economy. In particular, it analyses the impact
of loan supply restrictions on economic activity
and infl ation. For the credit and risk-taking
channels to be operative, bank loan supply
should ultimately affect economic activity and
See G. Jiménez, S. Ongena, J.L. Peydró, and J. Saurina, 28
“Identifying loan supply and balance-sheet channels with loan
applications”, paper presented at the Fourth BI-CEPR Conference
on Money, Banking and Finance: Corporate Governance, Capital
Structure and Firm Performance, Rome, October 2009.
See K. Matsuyama, “Credit Traps and Credit Cycles,” 29 American Economic Review, 2007, 97(1), pp. 503-16.
See G. Jiménez, S. Ongena, J.L. Peydró, and J. Saurina, 30
“Hazardous Times for Monetary Policy: What Do Twenty-
Three Million Bank Loans Say About the Effects of Monetary
Policy on Credit Risk-Taking?”, paper presented at the
American Finance Association Meetings, San Francisco,
2009; V. Ioannidou, S. Ongena and J.L. Peydró, “Monetary
policy, risk-taking and pricing: evidence from a natural
experiment”, paper presented at the NBER Summer Institute,
Cambridge, MA, 2009; A. Maddaloni and J.L. Peydró, “Bank
risk-taking, securitisation, supervision and low interest rates”,
paper presented at the conference entitled “The Financial
Crisis”, New Haven, CT, 2009; Maddaloni et al. (2009),
op. cit.; and Marqués-Ibáñez et al. (2009), op. cit. They all show
that bank risk matters for monetary policy. When short-term
interest rates are lower, the reduction of spreads is not unique to
loans, but also holds true for equity and bond spreads. For effects
of short-term interest rates on the pricing of equity, see, for
example, Bernanke and Kuttner (2005), op. cit.; for the effects
on the pricing of bonds, see Manganelli and Wolswijk (2007),
op. cit. As explained in Section 2, low levels of interest rates
may induce a search for yield (see Rajan (2005), op. cit.).
Securitised loans provide assets with attractive yields, but
owing to a reduced screening and monitoring of securitised
loans by banks, the interaction between low policy rates and
high securitisation may imply softer lending standards by banks
(see A. Mian and A. Sufi (2009), op. cit.).
See Maddaloni and Peydró (2009), op. cit.31

76ECB
Monthly Bulletin
October 2009
infl ation. This would apply if companies and
consumers cannot perfectly replace bank loans
with other means of fi nancing, such as bonds
or equities. However, while the theoretical
mechanisms have been discussed and analysed
in depth, empirical evidence supporting these
mechanisms, and estimates of the economic
signifi cance of the effects involved, remains a
challenge for researchers.
There are different empirical approaches that
can be used to analyse this impact. For the euro
area, two recent studies based on panel
econometric techniques using country-based
macroeconomic data fi nd that changes in credit
supply have a non-negligible impact on real
economic activity in the region.32 These fi ndings
continue to hold true even when controlling for
bank credit standards on lending as reported in
the bank lending survey.
Lending standards can also be used directly as
a measure of credit supply in the economy.33
Indeed, credit standards from bank lending
surveys have predictive power for future
developments in credit and economic growth.
This has been shown for the United States
where longer time series are available, and more
recently also for the euro area.34 This suggests
that the credit standards applied to borrowers
affect the actual credit granted by banks, in turn
infl uencing economic activity.
Survey answers related to the factors affecting
loan supply provide a simple and intuitive way
of distinguishing the different mechanisms of
monetary policy transmission. In particular,
the mechanisms of transmission related to the
bank lending channel and the balance sheet
channel can be identifi ed using the answers
from the survey related to bank balance sheet
constraints and risk perceptions related to
borrower collateral and outlook. Ultimately, the
relative impact on real economic activity and
prices can be assessed as well. In addition, bank
lending surveys contain explicit information on
reported demand for loans to fi rms and loans
to households.
A vector autoregression (VAR) methodology
provides a useful empirical framework for
analysing these mechanisms.35 The derived
impulse response functions are a simple tool
to illustrate the dynamic impact arising from
a shock to one of the variables, and thus allow
the question to be analysed as to whether a
tightening in loan supply has a dampening
impact on economic activity. Chart 9 plots
the responses of GDP and a price index to a
tightening of credit standards for all kinds
of loans, as measured by the bank lending
survey. In this context, the tightening implies
restrictions on all types of terms and conditions
for a loan (loan margins, volume, maturity
and collateral requirements). GDP declines
in response to tightened supply conditions.
The impact is similar for restrictions on loan
supply to non-fi nancial corporations and
mortgage loans, while it is not signifi cant
for consumer loans. This latter result may
refl ect the low relative importance that this
segment of the credit market has in most euro
area countries, despite the signifi cant rates of
increase recorded over the last few years.36 The
effect of supply restrictions on GDP reaches
a peak after around one year and fades away
after around three years.
See Cappiello et al., op. cit., and Čihák and Brooks (2008), op. cit.32
For US evidence, see, for example, Bayoumi and Melander 33
(2008), op. cit., and A. Swiston, “A U.S. Financial Conditions
Index: Putting Credit Where Credit is Due”, IMF Working Paper Series, 08/161, International Monetary Fund, 2008.
For US evidence, see C. Lown and D.P. Morgan, “The Credit 34
Cycle and the Business Cycle: New Findings Using the Loan
Offi cer Opinion Survey”, Journal of Money, Credit and Banking, Vol. 38, No 6, September 2006, pp. 1575-1597. For
euro area evidence, see G. de Bondt, A. Maddaloni, J.L. Peydró
and S. Scopel, “The bank lending survey matters: fi rst empirical
evidence for euro area credit and output”, Working Paper Series,
ECB, forthcoming.
For details, see M. Ciccarelli, A. Maddaloni and J.L. Peydró, 35
“Trusting the Bankers: a New Look at the Credit Channel of
Monetary Transmission”, paper presented at the C.R.E.D.I.T.
conference, Venice, September 2009. The panel VAR for the
euro area includes GDP, prices, short-term interest rates, loan
demand (proxied by the changes in demand volume from the
bank lending survey) and loan supply conditions (proxied by the
changes in credit standards from the bank lending survey).
Consumer loans account for less than 10% of total loans 36
outstanding in the euro area.

77ECB
Monthly Bulletin
October 2009
ARTICLES
Monetary policy and
loan supply in the
euro area
Restrictions on credit supply also have an effect
on the dynamics of prices. Chart 9 shows that a
restriction on credit for all categories of loan
results in a decline in infl ation.37 Compared with
the impact on GDP, the effect on prices takes
more time to reach a peak.
The panel VAR approach can also help to
disentangle the relative importance of the
balance sheet and the bank lending channels.
These transmission mechanisms were identifi ed
The price index is the GDP defl ator.37
Chart 9 Response of GDP and prices to credit supply restrictions
GDP Prices
Loans to non-financial corporations
0.2
0.1
0.0
-0.1
-0.2
-0.3
-0.4
-0.5
0.2
0.1
0.0
-0.1
-0.2
-0.3
-0.4
-0.50 5 6 7 8 9 10 11 12 14 15131 2 3 4
0.0
-0.1
-0.2
-0.3
-0.4
-0.5
0.0
-0.1
-0.2
-0.3
-0.4
-0.50 51 2 3 4 6 7 8 9 10 11 12 13 14 15
Loans for house purchase
0.05
0.00
-0.05
-0.10
-0.15
-0.20
-0.30
0.05
0.00
-0.05
-0.10
-0.15
-0.20
-0.25-0.25
-0.30
0 51 2 3 4 6 7 8 9 10 11 12 13 14 15
-0.30
-0.25
-0.20
-0.15
-0.10
-0.05
0.00
0.05
0.10
0.15
-0.30
-0.25
-0.20
-0.15
-0.10
-0.05
0.00
0.05
0.10
0.15
0 5 6 7 8 9 10 11 12 14 15131 2 3 4
Consumer loans
0 5 6 7 8 9 10 11 12 14 15131 2 3 4
0.00
0.05
-0.05
-0.10
0.10
-0.15
-0.20
0.00
0.05
-0.05
-0.10
0.10
-0.15
-0.20 -0.25
-0.20
-0.15
-0.10
-0.05
0.00
0.05
-0.25
-0.20
-0.15
-0.10
-0.05
0.00
0.05
0 5 6 7 8 9 10 11 12 14 15131 2 3 4
Source: Ciccarelli et al. (2009).Notes: These graphs plot the response of log real GDP and a GDP defl ator to a shock to credit supply in the order of one standard deviation. Credit supply is measured by the answers related to credit standards applied to loans to non-fi nancial corporations, loans to households for house purchase and consumer loans as reported in the Eurosystem bank lending survey. The confi dence bands are 68% Bayesian credible bands.

78ECB
Monthly Bulletin
October 2009
Chart 10 Response of GDP and prices to credit supply restrictions due to bank balance sheet constraints and perception of risk
GDP Prices
Bank balance sheet constraints – loans to non-financial corporations
0.1
0.0
-0.1
-0.2
-0.3
-0.4
-0.5
0.1
0.0
-0.1
-0.2
-0.3
-0.4
-0.5
0 5 6 7 8 9 10 11 12 14 15131 2 3 4 0 1 2 3 4 5 6 7 8 9 10 11 12 13 14 15-0.45
-0.40
-0.35
-0.30
-0.25
-0.20
-0.15
-0.10
-0.05
0.00
-0.45
-0.40
-0.35
-0.30
-0.25
-0.20
-0.15
-0.10
-0.05
0.00
Perception of risks – loans to non-financial corporations
0 5 6 7 8 9 10 11 12 14 15131 2 3 4
0.00
0.05
-0.05
-0.10
0.10
-0.15
-0.20
0.00
0.05
-0.05
-0.10
0.10
-0.15
-0.200 1 2 3 4 5 6 7 8 9 10 11 12 13 14 15
-0.125
-0.100
-0.075
-0.050
-0.025
0.000
0.025
0.050
0.075
0.100
-0.125
-0.100
-0.075
-0.050
-0.025
0.000
0.025
0.050
0.075
0.100
Bank balance sheet constraints – loans for house purchase
0.2
0.1
0.0
-0.1
-0.2
-0.3
-0.4
0.2
0.1
0.0
-0.1
-0.2
-0.3
-0.40 1 2 3 4 5 6 7 8 9 10 11 12 13 14 15
0.05
0.00
-0.05
-0.10
-0.15
-0.20
-0.25
-0.30
-0.35
0.05
0.00
-0.05
-0.10
-0.15
-0.20
-0.25
-0.30
-0.350 51 2 3 4 6 7 8 9 10 11 12 13 14 15
Perception of risks – loans for house purchase
0 5 6 7 8 9 10 11 12 14 15131 2 3 4
0.00
0.05
-0.05
-0.10
-0.15
-0.20
-0.25
-0.30
0.00
0.05
-0.05
-0.10
-0.15
-0.20
-0.25
-0.30
0.05
0.00
-0.05
-0.10
-0.15
-0.20
-0.25
0.05
0.00
-0.05
-0.10
-0.15
-0.20
-0.250 51 2 3 4 6 7 8 9 10 11 12 13 14 15
Source: Ciccarelli et al. (2009).Notes: These graphs plot the response of log real GDP and a GDP defl ator to a shock to credit supply in the order of one standard deviation. Credit supply is measured by the answers related to “bank balance sheet constraints” and “perception of (borrower) risk” applied to loans to non-fi nancial corporations and loans to households for house purchase as reported in the Eurosystem bank lending survey. The confi dence bands are 68% Bayesian credible bands.

79ECB
Monthly Bulletin
October 2009
ARTICLES
Monetary policy and
loan supply in the
euro area
using survey responses related to whether banks
changed their standards on account of “bank
balance sheet constraints” and/or as a result
of the “perception of (borrower) risk”. The
impulse response functions shown in Chart 10
suggest that the functioning of the two channels
in the euro area differs somewhat for loans to
households for house purchase and loans to
non-fi nancial corporations. For mortgage loans,
both supply channels are active, and their size is
comparable. In the case of loans to non-fi nancial
corporations, only the bank lending channel
seems to have an impact on economic activity.
In sum, available empirical evidence suggests
that the various credit channels discussed
in Section 2 are part of the monetary policy
transmission in the euro area. More precisely,
empirical fi ndings indicate that the bank
lending channel – including the bank capital
channel – is of more relevance than suggested
by earlier studies undertaken at the turn of the
century. Moreover, there is increasing evidence
of the existence of a balance sheet channel of
monetary policy transmission in the euro area.
Finally, recent empirical results point to an
amplifi cation of monetary policy impulses via
the so-called risk-taking channel.
During the current fi nancial crisis and
particularly in the aftermath of the default of
Lehman Brothers, credit supply frictions most
likely impacted on banks’ credit standards, with
adverse implications for the provision of credit
and economic activity. There are, however, as
yet only few empirical studies that support this
interpretation, as the number of observations for
this period is still limited. At the same time,
monetary policy action has contributed to
addressing the impairment in credit supply by
substantially lowering policy rates and by
employing special (non-standard) measures
such as the introduction of long-term refi nancing
operations of up to one year, the widening of the
collateral framework and the purchase of
covered bonds. These policy measures may
indeed have contributed to the decrease in the
net tightening of credit standards, as reported in
the most recent bank lending survey rounds.38
However, credit supply constraints may still
exist for certain borrower segments in the euro
area and, accordingly, there is a need for banks
to pass the effects of the policy actions taken
on to their borrowers and to fully exploit
recapitalisation opportunities. Finally, it is
essential for market adjustments to proceed,
even though the required adjustments might
vary across regions and market segments.
4 CONCLUDING REMARKS
This article has presented new evidence
concerning the impact of monetary policy on
bank loan supply and economic activity in the
euro area. It has also introduced new empirical
evidence based on information provided by
the bank lending survey for the euro area.
This new source of data offers the potential to
better disentangle the relationship between loan
supply and loan demand, which has been hard
to assess empirically with available quantitative
aggregate economic data. The empirical results
have provided indications of the existence of a
credit channel in the euro area having become
more visible in the period of fi nancial turmoil
since mid-2007.
As regards the bank lending channel, the current
turmoil has put substantial strain on banks’ ability
to fund themselves via deposits and markets.
As regards market-based funding, securitisation,
an important source of refi nancing for banks,
has suffered signifi cantly over the last two
years. Moreover, the deterioration of banks’
capital positions, also as a result of their
substantially weaker profi tability, has put their
balance sheets under additional stress. All in
all, these different pressures on banks’ balance
sheets and their cost of funds seem to have
affected bank loan supply to the household and
corporate sector in the current crisis. In addition,
the deterioration of borrower creditworthiness
has had a substantial impact on the quality
See, for instance, Box 2, entitled “The results of the July 2009 38
bank lending survey for the euro area”, in the August 2009 issue
of the Monthly Bulletin.

80ECB
Monthly Bulletin
October 2009
of loan demand and has put further strain on
banks’ ability and willingness to lend. This has
become particularly apparent in the risk-related
information provided by the bank lending
survey.
At the same time, the empirical results indicate
that the worsening of overall economic
conditions and the economic outlook has
weighed heavily on the demand for loans.
Depending on the methodology applied,
empirical fi ndings suggest that the current weak
development of overall bank lending in the
euro area is mainly affected by particularly low
demand for loans from the real sector. However,
this does not rule out the possibility that there
are also constraints on credit availability, at least
for certain borrower segments.
The monetary policy pursued by the ECB
over the past two years since the eruption of
the fi nancial crisis should be seen against this
background. Safeguarding price stability as
its primary goal, the policy measures, taken
by the ECB since mid-2007 have supported
demand, mainly through consecutive reductions
of the key ECB interest rates, and have
bolstered loan supply, in particular through its
“non-standard” policy measures, such as the
provision of funding to the banking system via
its long-term full allotment liquidity operations
and the purchase of euro-denominated covered
bonds. These monetary policy actions should be
seen in the context of the predominant position
of the banking system in providing funds to
the fi rms and households in the euro area. It is
therefore important that euro area banks take
the opportunity to pass on the liquidity support
provided by the Eurosystem to their ultimate
borrowers, which in turn should support
spending and investment in the period ahead.
81ECB
Monthly Bulletin
October 2009
ARTICLES
Recent developments in
the balance sheets of the
Eurosystem, the Federal
Reserve System and
the Bank of Japan
RECENT DEVELOPMENTS IN THE BALANCE SHEETS OF THE EUROSYSTEM, THE FEDERAL RESERVE SYSTEM AND THE BANK OF JAPAN
During the fi nancial market turmoil, which started in August 2007, the size and composition of central bank balance sheets have changed signifi cantly as a result of exceptional monetary policy operations. This article explains these recent developments using simplifi ed versions of the balance sheets of the Eurosystem, the Federal Reserve System (hereinafter referred to as “the Federal Reserve”) and the Bank of Japan. The massive expansion and increasing complexity of the balance sheets of these three central banks, especially in the aftermath of the bankruptcy of Lehman Brothers in September 2008, are evidence of their strong response to the severe deterioration in fi nancial and economic conditions.
1 INTRODUCTION
The balance sheet of a central bank provides
detailed information about how it uses its
monetary policy instruments. It is therefore
also a useful guide for understanding how
monetary policy is implemented. The changes
in balance sheets that have occurred since
the start of the fi nancial market turmoil show
that central banks have used existing tools in
innovative ways, as well as introduced new
ones, in order to relieve liquidity shortages
and ensure the smooth functioning of money
markets, which is essential for the transmission
of monetary policy. As central banks have
stepped up their intermediation role in money
markets and offered crucial support to other
credit markets during the fi nancial turmoil,
particularly after the bankruptcy of Lehman
Brothers in September 2008, the size and
complexity of their balance sheets have
increased signifi cantly.
This article describes and compares the evolution
of the balance sheets of the Eurosystem, the
Federal Reserve and the Bank of Japan.1
As there are differences in the monetary policy
implementation frameworks and accounting
standards of these central banks, the comparison
is not based on their detailed fi nancial statements
but on simplifi ed versions thereof (hereinafter
referred to as “simplifi ed balance sheets”).
Between June 2007 and December 2008, the
total assets of the Eurosystem and the Federal
Reserve grew considerably, by 90% and
160% respectively, as a result of the measures
introduced in response to the fi nancial turmoil.
With the improvement in money market
conditions in the fi rst half of 2009, the total
assets of the Eurosystem declined by about
20% and those of the Federal Reserve by 10%.
However, high demand for the Eurosystem’s fi rst
one-year refi nancing operation, conducted on
24 June 2009, triggered an increase once again
in the size of the Eurosystem’s balance sheet,
almost to its peak level. By contrast, the Bank
of Japan’s balance sheet was relatively large
in 2007 owing to the signifi cant increase in
outstanding banknotes in the late 1990s, which
meant that the level of banknotes in circulation
remained above its long-term trend. The Bank
of Japan’s balance sheet therefore grew by only
25% between June 2007 and March 2009, when
it peaked as a result of the fi nancial turmoil.
Several factors have contributed to the
considerable expansion and increased
complexity of the balance sheets of these three
central banks during the fi nancial turmoil.
Prior to September 2008, the Eurosystem and
the Federal Reserve increased the number
of refi nancing operations, especially at term
maturities, and introduced foreign currency
liquidity-providing operations. At the same
time, the Bank of Japan relied on instruments
that were developed during the fi nancial crisis
in Japan in the 1990s and therefore already
contained unconventional elements, such as
longer maturities and a wider range of eligible
collateral. Subsequently, during the more
intense phase of the fi nancial turmoil, when
interest rates came close to zero, all three central
banks focused increasingly on the transmission
of monetary policy to the real sector of the
economy. As a result, it became essential to
This article covers the period up to the end of August 2009.1

82ECB
Monthly Bulletin
October 2009
support major credit markets through outright
asset purchases or special lending facilities.
Section 2 introduces the concept of simplifi ed
balance sheets and Section 3 reviews the
developments in the balance sheets of the three
central banks in more detail.
2 SIMPLIFIED BALANCE SHEETS: RATIONALE
AND DEFINITION
The Eurosystem, the Federal Reserve and the
Bank of Japan have different frameworks for
the implementation of monetary policy and
different reporting rules, which is refl ected in
the structure of their balance sheets. Thus, in
order to make a comparison of these balance
sheets easier and more meaningful, it is based
on simplifi ed versions thereof (the box describes
the construction of the simplifi ed balance sheets
in more detail).
The simplifi ed balance sheet aggregates and
nets several items reported in the fi nancial
statement in order to highlight monetary policy
implementation and facilitate liquidity analysis.
It presents the relationship between the size and
type of monetary policy instrument, in both
domestic and foreign currencies, as well as the
main autonomous liquidity factors.
The three main categories of item on the
simplifi ed balance sheet are (i) autonomous
liquidity factors, (ii) foreign currency liquidity-
providing operations that were introduced
during the fi nancial market turmoil to provide
foreign currency to domestic counterparties,
and (iii) monetary policy instruments that are
used to steer domestic money market interest
rates and, as of September 2008, to support
certain credit market segments (see Table 1).
All of these items appear on both the asset side
and the liability side of the balance sheet.
Autonomous liquidity factors are balance
sheet items such as banknotes in circulation
and government deposits, over which central
banks have little or no control, but which may
affect interest rates or liquidity conditions in
the short run. For the purposes of this article,
autonomous liquidity factors on the asset
side of the balance sheet include net foreign
assets (i.e. foreign currency denominated
assets held outright for foreign exchange
intervention or for investment purposes)
and, in the case of the Eurosystem, domestic
assets that are held outright by NCBs and not
used for monetary policy implementation. On
the liability side, they include banknotes in
circulation, government deposits (i.e. Treasury
departments’ current account holdings with
NCBs) and a residual item called “other
autonomous factors (net)”.
The foreign currency liquidity-providing
operations, which have been carried out in
response to the fi nancial market turmoil, consist
of swaps and repos through which central banks
supply foreign currency to domestic interbank
markets. The foreign currency for these
operations has been obtained through swap
arrangements with partner central banks.
Monetary policy instruments also appear on
both the asset side and the liability side of
the simplifi ed balance sheet. Short-term and
long-term repo operations, lending facilities and
outright portfolios are on the asset side, while
the current accounts held by credit institutions
to fulfi l minimum reserve requirements or
for transaction purposes, liquidity-absorbing
operations (e.g. fi xed-term deposits and
reverse repos), deposit facilities and other
liquidity-absorbing tools are reported on the
liability side.

83ECB
Monthly Bulletin
October 2009
ARTICLES
Recent developments in
the balance sheets of the
Eurosystem, the Federal
Reserve System and
the Bank of Japan
Table 1 Simplified balance sheets of the Eurosystem, the Federal Reserve and theBank of Japan as at the end of August 2009
Assets Liabilities
(a) Eurosystem 1 (EUR billions)
Autonomous liquidity factorsNet foreign assets 392 (317) Banknotes in circulation 767 (633)
Domestic assets 2 341 (131) Government deposits 136 (70)
Other autonomous factors (net) 189 (27)
Foreign currency liquidity-providing operationsUSD repos 31 (0) Claims of the Federal Reserve 31 (0)
DKK swaps 0 (0) Claims of the Swiss National Bank 19 (0)
SEK swaps 3 (0)
Monetary policy instrumentsCovered bond portfolio 9 (0) Current accounts 203 (182)
Main refi nancing operations 78 (313) Absorbing operations 0 (0)
Longer-term refi nancing operations 634 (150) Deposit facility 143 (1)
Fine-tuning operations 0 (0)
Marginal lending facility 0 (1)
Total 1,488 (913) 1,488 (913)
(b) Federal Reserve 3 (USD billions)
Autonomous liquidity factorsNet foreign assets 38 (34) Banknotes in circulation 870 (775)
Government deposits 13 (4)
Other autonomous factors (net) 76 (49)
Foreign currency liquidity-providing operationsCentral bank liquidity swaps 60 (0)
Monetary policy instrumentsDomestic assets 1,485 (790) Current accounts 862 (16)
Repos 0 (20) Reverse repos 0 (0)
Term Auction Facility 221 (0) Treasury supplementary fi nancing account 200 (0)
Other lending 217 (0)
Total 2,021 (845) 2,021 (845)
(c) Bank of Japan 1 (JPY 100 billions)
Autonomous liquidity factorsForeign assets 54 (57) Banknotes in circulation 762 (758)
Government deposits 29 (42)
Other autonomous factors (net) 139 (-59)
Foreign currency liquidity-providing operationsUSD repos 8 (0) Claims of the Federal Reserve 8 (0)
Monetary policy instrumentsDomestic assets 596 (578) Current accounts 119 (97)
Repos 399 (204) Reverse repos 0 (0)
Other lending 0 (0) Bank of Japan bills sold 0 (0)
Total 1,056 (838) 1,056 (838)
Sources: ECB calculations based on the Eurosystem’s weekly fi nancial statement (weekly data); the Federal Reserve’s H.4.1 statistical release, Table 9 “Consolidated statement of condition of all Federal Reserve banks” (previously Table 8), and Wednesday Historical Levels, Table 16 (weekly data); Bank of Japan accounts and “Monetary Base and the Bank of Japan’s transactions” (monthly data).1) As at 28 August 2009 (fi gures as at 29 June 2007 are provided in parentheses).2) Of which the sub-item “general government debt denominated in euro” stood at €37 billion on 29 June 2007 and at €36 billion on28 August 2009.3) As at 26 August 2009 (fi gures as at 27 June 2007 are provided in parentheses).

84ECB
Monthly Bulletin
October 2009
Box
SIMPLIFIED BALANCE SHEETS: METHODOLOGY
The simplifi ed balance sheets standardise the information presented in the central banks’ fi nancial
statements by aggregating and netting certain items, with the degree of netting dependent on
the level of detail in the respective fi nancial statement. For example, the Eurosystem’s fi nancial
statement provides very detailed information on accounts unrelated to monetary policy. The ratio of
total assets on the simplifi ed balance sheet to total assets on the fi nancial statement is approximately
4:5 for the Eurosystem and the Bank of Japan and almost 1:1 for the Federal Reserve.
The simplifi ed balance sheets have three main categories of asset and liability: autonomous liquidity
factors, foreign currency liquidity-providing operations and monetary policy instruments.
Autonomous liquidity factors
On the asset side of the simplifi ed balance sheet, autonomous liquidity factors comprise the item “net
foreign assets”, which covers all accounts denominated in foreign currency, including gold
and special drawing rights but excluding the foreign exchange liquidity-providing operations,
and subtracts liabilities from assets. The Eurosystem’s simplifi ed balance sheet has an additional
autonomous factor on the asset side, namely “domestic assets”. These are securities and
government debt denominated in euro which are held outright by euro area central banks for
investment purposes at their own fi nancial risk. These portfolios are subject to maximum size
limits, agreed at the Eurosystem level, in order to ensure that they do not interfere with the
implementation of the single monetary policy.
The liquidity-absorbing autonomous factors, reported on the liability side of the simplifi ed
balance sheet, are banknotes and government deposits. A residual category called “other
autonomous factors (net)” is computed as the difference between the sum of all liability accounts
and the sum of all asset accounts of the fi nancial statement that are not reported on the simplifi ed
balance sheet. None of these netted items are linked to the implementation of monetary policy.
At the end of 2008 an accounting reclassifi cation changed the composition of the Eurosystem’s
weekly fi nancial statement so that part of the central banks’ investment portfolios were moved
from item A9 (“other assets”) to item A7 (“securities by euro area residents denominated in
euro”). While this accounting reclassifi cation did not affect the size of the weekly fi nancial
statement, it resulted in an expansion of the Eurosystem’s simplifi ed balance sheet since, unlike
item A9, item A7 is not netted out under the item “other autonomous factors (net)”. The resulting
level shift of €157.4 billion in “domestic assets” recorded in the simplifi ed balance sheet on
2 January 2009 refl ects, to some extent, the actual expansion of investment portfolios in the
period from mid-2007 to the end of 2008. Prior to the accounting reclassifi cation, this had been
reported under “other assets” in the weekly fi nancial statement.1
Foreign currency liquidity-providing operations
Central banks usually report all foreign currency operations under the same foreign asset and
liability items of their fi nancial statements. However, the operations introduced in response to the
1 See the press release of 7 January 2009, available at http://www.ecb.europa.eu/press/pr/wfs/2009/html/fs081231.en.html.

85ECB
Monthly Bulletin
October 2009
ARTICLES
Recent developments in
the balance sheets of the
Eurosystem, the Federal
Reserve System and
the Bank of Japan
fi nancial turmoil are presented separately in the simplifi ed balance sheets used for the purposes
of this article. In these operations, the Federal Reserve provides other central banks with US
dollars and thus acquires a claim reported under “central bank liquidity swaps” in its balance
sheet. In exchange for the US dollar funds, the Federal Reserve receives euro (yen) funds and
deposits them with the Eurosystem (Bank of Japan). This euro (yen) deposit is shown under
“claims of the Federal Reserve” on the liability side of the Eurosystem’s (Bank of Japan’s)
balance sheet.2 The US dollar funds received from the Federal Reserve are currently being used
by the Eurosystem to conduct US dollar liquidity-providing operations with its counterparties in
the form of repos. The item “USD repos”, which appears on the asset side of the Eurosystem’s
simplifi ed balance sheet, indicates the claim denominated in US dollars that the Eurosystem
acquires vis-à-vis its counterparties in the repo operations. Similarly, the USD repos conducted
by the Bank of Japan are shown as an asset in its balance sheet.
Until January 2009 the Eurosystem also conducted US dollar liquidity-providing operations in
the form of swaps. In these swap operations, the Eurosystem supplied its counterparties with
US dollars in exchange for euro, which were debited (subtracted) from the current accounts of
the counterparties. The CHF/EUR swap operations, conducted in cooperation with the Swiss
National Bank, are similar transactions: the Swiss National Bank receives euro in exchange for
Swiss francs and deposits the euro with the Eurosystem. This euro deposit is reported under the
liability item “claims of the Swiss National Bank”. The Eurosystem also has reciprocal currency
arrangements with Danmarks Nationalbank and Sveriges Riksbank. Through the EUR/DKK
and EUR/SEK swaps, credit institutions in Denmark and Sweden receive euro in exchange for
domestic currency. The Eurosystem deposits the Danish kroner and the Swedish kronor with the
respective central banks and thus acquires claims denominated in foreign currency, which are
reported under “DKK swaps” and “SEK swaps” on the Eurosystem’s simplifi ed balance sheet.
Monetary policy instruments
The main differences in the simplifi ed balance sheets of the three central banks being analysed
in this article are in the items reported under monetary policy instruments. In the case of the
Eurosystem, the simplifi ed balance sheet shows the liquidity provided through one-week
main refi nancing operations; one, three, six and 12-month longer-term refi nancing operations;
fi ne-tuning operations; and the overnight marginal lending facility. A large set of collateral,
containing both private and public debt, is eligible for these operations, which are currently open
to around 2,200 counterparties. In addition, the Eurosystem’s monetary policy instruments include
the covered bond portfolio which has been built up since July 2009 and which is clearly separated
from outright portfolios held by euro area central banks (“domestic assets”).
While in the case of the Eurosystem and to a lesser extent the Bank of Japan, refi nancing
operations have tended to account for a large share of total assets on the simplifi ed balance sheet,
even before the fi nancial turmoil, such operations accounted for a relatively small share of total
assets in the case of the Federal Reserve, with repos traditionally being used to address only
temporary fl uctuations in the banking system’s liquidity needs.
For both the Federal Reserve and the Bank of Japan, outright portfolios (domestic assets) play
an active role in the implementation of their monetary policies and are, for the purposes of this
2 The forward leg of the swap transactions is booked off-balance sheet.

86ECB
Monthly Bulletin
October 2009
3 BALANCE SHEET DEVELOPMENTS
SINCE JUNE 2007
During the fi rst phase of the fi nancial turmoil,
which lasted until September 2008, the size
of the central banks’ balance sheets did not
change noticeably (see Chart 1). Liquidity
injections were offset through the sale of
central bank assets or downward adjustments
to the size of the refi nancing operations
towards the end of the maintenance period,
in order to ensure that no excess liquidity
remained in the banking system. However,
after the fi nancial turmoil intensifi ed in
the fourth quarter of 2008, the Eurosystem
undertook a number of enhanced credit
support measures and the Federal Reserve
introduced a credit easing programme, both
of which triggered a signifi cant expansion in
their respective balance sheets. Subsequent
improvements in money market conditions
during the fi rst half of 2009 led to a reduction
in the total assets of the Eurosystem and the
Federal Reserve. However, high demand for
article, reported as monetary policy instruments in the simplifi ed balance sheet. The securities
currently held by the Federal Reserve include Treasury bills, notes and bonds, federal agency
debt securities and, since January 2009, federal agency mortgage-backed securities. Before the
start of the fi nancial market turmoil, the Federal Reserve tended to steer the size of its outright
portfolio towards the level of outstanding banknotes. The assets currently held by the Bank of
Japan include government bonds, Treasury discount bills and stocks held in pecuniary trusts,
as well as commercial paper and corporate bonds since February and March 2009 respectively.
The outright holdings of Japanese government bonds have been kept below the amount of
banknotes issued.
Additionally, the asset side of the Federal Reserve’s simplifi ed balance sheet shows the Term
Auction Facility, which was introduced in response to the fi nancial turmoil. Compared with the
Federal Reserve’s regular repo operations, a larger number of counterparties (approximately
7,000 vis-à-vis the 18 in the regular repo operations) are able to participate in these operations
against a broadened range of collateral. In the case of the Federal Reserve, the simplifi ed balance
sheet item “other lending” consists of the “other loans” and “net portfolio holdings” reported
in its fi nancial statement and contains many of the credit easing measures undertaken by the
Federal Reserve (see Section 3.1 for more details). In the case of the Bank of Japan, “other
lending” includes special fund-supplying operations against corporate debt that were introduced
in January 2009, as well as the complementary lending facility, which provides overnight loans
to counterparties upon request.
The monetary policy instruments reported on the liability side of the simplifi ed balance sheet
include the current accounts of credit institutions, as well as several other liquidity-absorbing
monetary policy instruments. The current accounts cover the minimum reserve requirements, as
well as the “excess reserve” holdings, i.e. the current account holdings in excess of the minimum
reserve requirements. The Eurosystem offers a deposit standing facility that enables counterparties
to deposit liquidity on an overnight basis. The “absorbing operations” item on the Eurosystem’s
simplifi ed balance sheet consists of the collection of fi xed-term deposits, which, in contrast to
the reverse repos of the Federal Reserve and the Bank of Japan, do not involve a transfer of
collateral to counterparties. The “US Treasury supplementary fi nancing account” contains deposits
made by the US Treasury with the Federal Reserve as part of a scheme that was introduced in
September 2008 in order to absorb some of the excess liquidity provided through the new lending
facilities. Finally, the item “Bank of Japan bills sold” contains bills issued by the Bank of Japan.

87ECB
Monthly Bulletin
October 2009
ARTICLES
Recent developments in
the balance sheets of the
Eurosystem, the Federal
Reserve System and
the Bank of Japan
the one-year refi nancing operation, conducted
on 24 June 2009, triggered a second increase
in the size of the Eurosystem’s balance
sheet. Owing to the high level of outstanding
banknotes caused by above-trend growth in
the late 1990s, the Bank of Japan’s balance
sheet was relatively large before the start of
the fi nancial market turmoil, with the result
that its increase in size over the past two years
has been smaller.
Table 2 shows total assets as a share of GDP
and as a share of banknotes in circulation for
the euro area, the United States and Japan.
Prior to the implementation of the turmoil-
related measures, the balance sheets of these
three central banks differed in size relative to
GDP and banknotes in circulation. The Federal
Reserve had the smallest balance sheet relative
to both GDP and banknotes in circulation, while
the Eurosystem and the Bank of Japan had the
largest in terms of banknotes in circulation and
relative to GDP respectively. These differences
can be explained, at least in part, by various
factors, such as different fi nancial market
structures, monetary policy implementation
frameworks and economic conditions. The
increase in central bank assets since October
2008 has made the Federal Reserve’s balance
sheet the largest relative to banknotes, even if
it has remained the smallest in terms of GDP.
The following sections describe the factors that
contributed to the expansion of central bank
assets.
3.1 IMPACT OF LIQUIDITY-PROVIDING
INSTRUMENTS
The signifi cant increase in size and the change
in composition of the simplifi ed balance sheets
were triggered by the measures taken by the
central banks to address the tensions in the money
markets with a view to ensuring the smooth
implementation of monetary policy.
EUROSYSTEM
During the fi rst phase of the fi nancial market
turmoil, the main change to the Eurosystem’s
approach to liquidity management – the increase
in the allotment amounts and frequency of
longer-term refi nancing operations (LTROs) –
did not affect the size of the simplifi ed balance
sheet. It only affected the ratio of LTROs to
one-week refi nancing operations, with LTROs
constituting one-third of the total outstanding
refi nancing before the fi nancial turmoil and
two-thirds in September 2008.
Chart 1 Total assets on the simplified balance sheet
(June 2007 = 100)
300
250
200
150
100
50
0
300
250
200
150
100
50
0
Eurosystem
Federal Reserve
Bank of Japan
June Sep. Dec. Mar. June JuneSep. Dec. Mar.2007 2008 2009
Sources: Eurosystem, Federal Reserve, Bank of Japan and ECB calculations.Note: The increase in the Eurosystem’s total assets recorded on 2 January 2009 resulted from an accounting reclassifi cation. Expansions of investment portfolios in previous years were refl ected on the asset side of the simplifi ed balance sheet (see the box).
Table 2 Total assets on the simplified balance sheet relative to GDP and banknotes in circulation
Eurosystem Federal Reserve
Bank of Japan
Relative to GDP (%)
June 2007 10 6 16
Peak 19 15 23
Peak reference date 2/01/09 17/12/08 31/03/09
August 2009 16 14 22
Relative to banknotes in circulation (%)
June 2007 144 109 111
Peak 231 266 144
Peak reference date 2/01/09 17/12/08 31/03/09
August 2009 194 232 139
Sources: Eurosystem, Federal Reserve, Bank of Japan and ECB calculations.

88ECB
Monthly Bulletin
October 2009
In October 2008 the Eurosystem launched a
series of enhanced credit support measures,
which were supplemented by several additional
tools in May 2009. First, the Eurosystem
started to conduct all refi nancing operations
at a fi xed rate while allotting all bids received
from counterparties. This operational change
was coupled with a temporary expansion of the
already long list of collateral eligible for open
market operations – the second building block
of the enhanced credit support package. Third,
the number and frequency of LTROs with
maturities ranging from one to six months were
raised. These three facets of the enhanced credit
support programme resulted in a signifi cant
increase in the size of the Eurosystem’s balance
sheet. The outstanding amount of LTROs
went up from €150 billion in June 2007 to
over €600 billion at the end of 2008, almost
doubling the total amount of outstanding
refi nancing, which peaked at €850 billion on
2 January 2009 (see Chart 2(a)). The outstanding
amount of main refi nancing operations (MROs)
also increased from an average of €190 billion
during the fi rst phase of the fi nancial turmoil to
€340 billion at the beginning of December 2008;
thereafter it decreased.
In the fi rst half of 2009, as money market
conditions had improved, demand for one,
three and six-month LTROs declined gradually
to €400 billion. Nevertheless, the Eurosystem
left the exceptional liquidity measures in place
to encourage banks to lend to the real sector.
Moreover, on 24 June 2009, it carried out its
fi rst one-year LTRO, which was introduced as
an extension of the third enhanced credit support
measure mentioned above. Counterparties’
interest in this operation was very high and the
allotted amount was €442 billion, resulting once
again in a signifi cant increase in the size of the
Eurosystem’s balance sheet. The total amount
of outstanding refi nancing reached €900 billion
at the end of June 2009.
In July 2009 the Eurosystem implemented the
fourth building block of the enhanced credit
support programme, namely the outright
purchase of covered bonds. A portfolio worth
Chart 2 Monetary policy instruments
(a) Eurosystem (EUR billions)
-500
-400
-300
-200
-100
0
100
200
300
400
500
600
700
800
900
1,000
1,100
-500
-400
-300
-200
-100
0
100
200
300
400
500
600
700
800
900
1,000
1,100
Jan. May2007
Sep. Jan. May2008 2009
Sep. May Sep.Jan.
covered bond portfolio
main refinancing operations
longer-term refinancing operations
fine-tuning operations
marginal lending facility
USD repos
DKK swaps
SEK swaps
current accounts
absorbing operations
deposit facility
Start of
financial
turmoil
(b) Federal Reserve (USD billions)
-1,200
-1,000
-800
-600
-400
-200
0
200
400
600
800
1,000
1,200
1,400
1,600
1,800
2,000
2,200
-1,200
-1,000
-800
-600
-400
-200
0
200
400
600
800
1,000
1,200
1,400
1,600
1,800
2,000
2,200
domestic assets
repos
central bank liquidity swaps
term auction credit
other lending
current accounts
reverse repos
treasury supplementary financing account
2007 2008 2009
Jan. Apr. July Oct. Jan. Apr. July Oct. Jan. Apr. July
Start of
financial
turmoil
Sources: Eurosystem, Federal Reserve (weekly data) andBank of Japan (monthly data).

89ECB
Monthly Bulletin
October 2009
ARTICLES
Recent developments in
the balance sheets of the
Eurosystem, the Federal
Reserve System and
the Bank of Japan
€9 billion was purchased during the fi rst
two months and the total amount is expected to
reach €60 billion by the end of June 2010. This
measure brought about an important change
in the Eurosystem’s balance sheet: the item
“securities of euro area residents denominated
in euro” became divided into two sub-items, i.e.
the covered bond portfolio, used for monetary
policy implementation, and the investment
assets of the euro area central banks, which are
an autonomous factor.
FEDERAL RESERVE
The regular repo operations of the Federal
Reserve, normally used to correct temporary
fl uctuations in the banking system’s liquidity
needs, amounted to USD 30 billion on average
during the fi rst half of 2007. In early 2008
the Federal Reserve launched a one-month
term repo programme, which pushed up the
outstanding amount of repos to USD 130 billion
in May 2008. As the lending programmes
introduced following the bankruptcy of
Lehman Brothers generated large levels of
excess reserve balances, the Federal Reserve
stopped conducting its regular repos in
January 2009 (see Chart 2(b)). In December
2007 the Federal Reserve launched the Term
Auction Facility (TAF) in order to lend term
funds, raising the maximum maturity to three
months in 2008. The outstanding amount of
the TAF peaked at almost USD 500 billion
in March 2009 and has since fallen to around
USD 220 billion.
In addition to the regular repos and the
TAF, changes in the outright portfolio have
affected the size and composition of the
Federal Reserve’s balance sheet during
the fi nancial turmoil. Initially, the Federal
Reserve sold Treasury securities worth around
USD 300 billion between June 2007 and
September 2008 in order to compensate for
the liquidity provided through the TAF and the
other new lending programmes. However, in the
context of its credit easing policy, the Federal
Reserve started to purchase federal agency debt
securities in September 2008 and federal agency
mortgage-backed securities in January 2009.
This portfolio totalled USD 740 billion in
August 2009. Moreover, in April 2009 the
Federal Reserve resumed its purchases of
Treasury securities and thus had increased its
portfolio by USD 270 billion by the end of
August 2009.
Finally, the item “other lending” contributed
signifi cantly to the strong expansion of the
Federal Reserve’s balance sheet. This item
includes the discount window, which is a
standing lending facility available to depository
institutions. After the Federal Reserve reduced
the spread between the discount window rate
and its target for the federal funds rate, from
100 to 50 basis points in August 2007 and to
25 basis points in March 2008, and extended
the maturity of discount window lending from
overnight to 30 days and 90 days respectively,
the use of the discount window increased from
an average of USD 200 million in June 2007
to almost USD 100 billion in October 2008.
Moreover, in March 2008, the primary
Chart 2 Monetary policy instruments
(c) Bank of Japan (JPY 100 billions)
-300
-200
-100
100
200
300
400
500
600
700
800
900
1,000
1,100
1,200
-300
-200
-100
00
100
200
300
400
500
600
700
800
900
1,000
1,100
1,200Start of
financial
turmoil
domestic assets
repos
other lendingcurrent accounts
reverse repos
Bank of Japan bills sold
-400 -400
Jan. Apr. July Oct. Jan. Apr. July Oct. Jan. Apr. July2007 2008 2009
Sources: Eurosystem, Federal Reserve (weekly data) andBank of Japan (monthly data).
90ECB
Monthly Bulletin
October 2009
dealers (i.e. a limited group of non-bank
fi nancial intermediaries which constitute the
counterparties of the Federal Reserve for the
usual open market operations) were given access
to a similar overnight standing lending facility –
the Primary Dealer Credit Facility.
The Federal Reserve balance sheet item “other
lending” also includes several credit easing
tools that were introduced after September
2008. First, the Federal Reserve launched the
Asset-Backed Commercial Paper Money Market
Mutual Fund Liquidity Facility to fi nance
credit institutions’ purchases of asset-backed
commercial paper from money market mutual
funds. In October 2008 the Commercial Paper
Funding Facility was established to enhance the
liquidity of the commercial paper market and
the Money Market Investor Funding Facility to
provide liquidity to money market investors. In
March 2009 the Term Asset-backed Securities
Loan Facility was launched to support the
issuance of asset-backed securities collateralised
by consumer and small business loans. These
new lending programmes, the greater use of the
discount window, the funding provided in the
context of the merger between Bear Stearns and
JPMorgan Chase and the restructuring of AIG
increased “other lending” from USD 190 million
at the end of June 2007 to a peak of USD 600
billion at the end of 2008. As was the case with
the Eurosystem’s LTROs, the improvement in
fi nancial market conditions led to a decrease
in demand for the new lending facilities to
USD 220 billion by the end of August 2009.
BANK OF JAPAN
Like the Eurosystem and the Federal Reserve,
the Bank of Japan has also expanded the size
and changed the composition of its balance
sheet, but not on such a large scale. First,
since June 2007, it has increased the level of
its repo operations by around JPY 19 trillion
(see Chart 2(c)). Second, the Bank of Japan’s
holdings of Japanese government bonds
declined in 2007 and 2008, mainly because
purchases of Japanese government bonds were
lower than those of redemptions. To support
credit markets during the fi nancial turmoil, the
Bank of Japan started to purchase commercial
paper in February 2009 and corporate bonds in
March 2009, the total amounts in August 2009
being JPY 100 billion and JPY 250 billion
respectively. Finally, in order to facilitate
corporate fi nancing, in January 2009 the Bank
of Japan introduced special fund-supplying
operations with a fi xed rate, for an unlimited
amount and backed by corporate debt. These
operations meant that the item “other lending”
reached JPY 7.5 trillion in March 2009.
CENTRAL BANK COLLABORATION
A major innovation that marked an important
step in central bank collaboration during the
global fi nancial turmoil was introduced in
December 2007, when the ECB and several
other central banks decided to take joint
action with the Federal Reserve by providing
US dollar liquidity against domestic collateral
to their domestic counterparties through swap
arrangements. While the central banks have
traditionally relied on swap lines solely for
foreign exchange intervention, the activation
thereof during the fi nancial market turmoil
addressed money market frictions and brought
about a qualitative change in the composition
of the central banks’ simplifi ed balance
sheets. The total outstanding amount of
US dollar swap operations on the simplifi ed
balance sheet of the Federal Reserve reached
almost USD 600 billion, a quarter of its total
assets, in mid-December 2008. In the same
month almost half of the USD 600 billion
in central bank liquidity swaps (equivalent
to €200 billion) were on the liability side
of the Eurosystem’s simplifi ed balance
sheets, while the corresponding fi gure for the
Bank of Japan was one-fi fth (equivalent to
JPY 11 trillion). In 2009 international demand
for US dollar refi nancing declined gradually to
reach USD 60 billion on the Federal Reserve’s
simplifi ed balance sheet in August, of which
the equivalent of €31 billion was supplied
in the euro area and the equivalent of around
JPY 770 billion in Japan.
In addition to the US dollar operations, since
October 2008 the Eurosystem, in cooperation

91ECB
Monthly Bulletin
October 2009
ARTICLES
Recent developments in
the balance sheets of the
Eurosystem, the Federal
Reserve System and
the Bank of Japan
with the Swiss National Bank, has conducted
CHF/EUR swaps, providing the equivalent of
€33 billion on average. Since November 2008
the Eurosystem has also provided an average of
€3 billion to Danish credit institutions through
an EUR/DKK swap agreement with Danmarks
Nationalbank. Similarly, since June 2009
the Eurosystem has supplied €3 billion to
counterparties of Sveriges Riksbank through an
EUR/SEK swap line. These foreign currency
liquidity-providing operations were the fi fth
building block of the Eurosystem’s enhanced
credit support programme.
3.2 DEVELOPMENTS STEMMING
FROM LIQUIDITY-ABSORBING
INSTRUMENTS
The three central banks have absorbed excess
liquidity by means of different instruments.
For the Eurosystem, the liability item that has
seen the largest increase is the deposit facility.
First, it rose from around €1 billion at the end
of June 2007 to over €300 billion at the end
of 2008. Subsequently, the average amount
placed in the deposit facility declined gradually
to less than €20 billion by June 2009, but
rose again to €190 billion on average during
the summer. The Eurosystem also absorbed
liquidity through fi ne-tuning operations in the
course of the maintenance period on several
occasions in December 2007, January 2008
and October 2008, as well as at the end of most
maintenance periods.
As mentioned above, the size of the
Federal Reserve’s balance sheet did not
increase signifi cantly between June 2007
and September 2008, because the excess
liquidity provided through the new lending
facilities was withdrawn through the sale
and redemption of Treasury securities worth
around USD 300 billion – this raised the
amount of one category of assets and reduced
the amount of another. However, this was no
longer possible after the massive liquidity
injections resulting from the measures
implemented in October 2008, when the
Federal Reserve reached an agreement
with the Treasury, according to which the
latter would issue securities and deposit
the proceeds in a supplementary account
with the Federal Reserve. This measure
absorbed USD 500 billion in October and
November 2008, with USD 200 billion still
outstanding in August 2009.
For its part, before November 2008, the Bank of
Japan occasionally absorbed liquidity through
the sale of Bank of Japan bills and reverse
repos of Japanese government securities, the
outstanding amounts of which were around
JPY 1 trillion at most.
US and Japanese credit institutions’ current
account balances with their respective
central banks, which cover minimum reserve
requirements and excess reserves, have also
increased since October 2008. This is due to
the introduction of the remuneration of excess
reserves which has enabled banks to hold excess
reserves at no cost. The Federal Reserve began
remunerating required and excess reserves
in October 2008 and, the following month,
the Bank of Japan introduced a temporary
Complementary Deposit Facility, which is
reported together with the current accounts
on the balance sheet, in order to pay interest
on excess reserves. These measures became
important for the absorption of excess liquidity
and led to signifi cant increases in the current
accounts – from less than USD 20 billion in
June 2007 to USD 860 billion in August 2009
in the case of the Federal Reserve and from
less than JPY 10 trillion to JPY 12 trillion in
the case of the Bank of Japan.
The massive increases in liquidity provision
on the asset side of the balance sheet and
liquidity absorption on the liability side show
the important role that the central banks played
as intermediaries when money markets were
not functioning properly, particularly in the
months following the collapse of Lehman
Brothers in September 2008. By stepping in to
relieve the liquidity shortages in October 2008,
the central banks partially replaced a large part
of the money market as a source of funding for

92ECB
Monthly Bulletin
October 2009
credit institutions. For example, the volume of
trading on the euro interbank overnight market
and on the e-MID 2 market dropped when the
Eurosystem introduced unlimited refi nancing
at a fi xed rate and reduced the standing
facilities corridor to 100 basis points around
the interest rate on the MROs (see Chart 3(a)).
With a view to reactivating the euro money
market, the standing facilities corridor was
widened again to 200 basis points at the end of
January 2009. Thereafter, it was reduced to
150 basis points in May. As shown in
Chart 3(a), overnight volumes increased and
the Eurosystem’s total assets declined between
January and June 2009.3 The increase in the
Bank of Japan’s repo operations and excess
reserves between October 2008 and July 2009
was also associated with a decrease in money
market activity (see Chart 3(b)).4
The intermediation role of the central banks,
which was particularly important in the months
following the collapse of Lehman Brothers,
is consistent with the Eurosystem’s enhanced
credit support programme, the Federal Reserve’s
credit easing policy and the Bank of Japan’s
measures to bolster the corporate debt market.
3.3 TRENDS IN AUTONOMOUS FACTORS
During the fi nancial turmoil, the liability side of
the simplifi ed balance sheets of the three central
banks also grew as a result of the increase in
autonomous liquidity factors, in particular euro
banknotes, euro area government deposits and
US Treasury deposits. The increase in the size
of these autonomous factors explains why the
liquidity provision by means of monetary policy
instruments explained in Section 3.1 increased
more than the liquidity absorption explained
in Section 3.2. The increase in the size of
these autonomous factors was coupled with an
increase in their volatility.
The fi nancial turmoil affected demand for
banknotes, particularly in the autumn of 2008.
Chart 4(a) shows that, in addition to the
long-term upward trend and the seasonal
increases in the quantity of banknotes in
circulation around holiday periods, there was a
signifi cant rise in demand for euro banknotes
and, to a lesser extent, for US dollar banknotes
at the end of September 2008. In the fi rst half
of October the above-trend demand for euro
banknotes was approximately €35 billion,
approximately two-thirds of which was for
e-MID is the largest European electronic market for unsecured 2
interbank deposits.
For a discussion on the impact of the narrow corridor between 3
the standing facilities on euro overnight markets, see the
article entitled “The implementation of monetary policy since
August 2007” in the July 2009 issue of the Monthly Bulletin.
Data on US dollar overnight trading volumes are not publicly 4
available.
Chart 3 Central banks’ total assets and money market turnover
(January 2007 = 100)
a) Euro area (EONIA overnight maturities;e-MID overnight to six-month maturities)
0
20
40
60
80
100
120
140
160
180
200
0
20
40
60
80
100
120
140
160
180
200
Jan. Apr. July Oct. Jan. Apr. July Oct. Jan. Apr. July
2007 2008 2009
total assets
EONIA volume
e-MID volume
b) Japan (overnight to one-year maturities)
40
60
80
100
120
140
160
40
60
80
100
120
140
160
total assets
JPY unsecured call market oustanding
Jan. Apr. July Oct. Jan. Apr. July Oct. Jan. Apr. July2007 2008 2009
Sources: Eurosystem, e-MID, Bank of Japan, Japanese Brokers Association and ECB calculations.

93ECB
Monthly Bulletin
October 2009
ARTICLES
Recent developments in
the balance sheets of the
Eurosystem, the Federal
Reserve System and
the Bank of Japan
€500 banknotes. Since high-denomination
banknotes are usually used as a store of value
(i.e. as a substitute for bank deposits) and not
for transaction purposes, the high demand may
be related to a lack of confi dence in the banking
system at that time. Moreover, a considerable
proportion of the demand for €500 banknotes
stemmed from banks located close to the borders
of the euro area or from banks that handle the
distribution of banknotes in countries outside
the euro area, particularly in eastern Europe.
This extraordinary demand for euro banknotes
tapered off at the end of October 2008 after
governments had announced extraordinary
measures to support the banking sector. The
level of currency in circulation, however, has
remained above its long-term trend. Similarly,
the growth in the Federal Reserve’s banknotes
outstanding, which had been decelerating
since 2003, rose in May 2008, driven mainly by
greater demand from Latin America and, later
in the year, from eastern Europe and within the
United States.
The size and volatility of the deposits by euro
area governments and the US Treasury with the
Eurosystem and the Federal Reserve respectively
rose signifi cantly in the last quarter of 2008
(see Chart 4(b)). One reason for this development
was the large and varying payments related to
various government programmes introduced
in response to the fi nancial turmoil. The US
government, for example, kept a high balance
in its Treasury General Account at the Federal
Reserve in order to accommodate outfl ows related
to the Troubled Asset Relief Program. Moreover,
Treasury departments found it increasingly
diffi cult to place funds in the market.
Finally, the investment portfolios of the euro area
central banks, shown under “domestic assets”
on the Eurosystem’s simplifi ed balance sheet
(see Table 1(a)), have increased since June 2007.
Most of this increase in “domestic assets” did not
appear in the simplifi ed balance sheet until an
accounting reclassifi cation took place at the end
of December 2008 (see the box). The increase
in euro area central banks’ investment portfolios
is within the limits stipulated in a Eurosystem
agreement that ensures that the investment
portfolios held by euro area central banks do not
interfere with the single monetary policy. Euro
area central banks acquire euro-denominated
assets, for example, to boost monetary income,
to invest their own funds and to provide agent
services to governments (e.g. government
pension funds), foreign central banks and foreign
governments (e.g. reserve management services).
Chart 4 Autonomous liquidity factors
(January 2007 = 100)
(a) Banknotes
90
95
100
105
110
115
120
125
130
90
95
100
105
110
115
120
125
130
Eurosystem
Federal Reserve
Bank of Japan
Jan. Apr. July Oct. Jan. Apr. July Oct. Jan. Apr. July2007 2008 2009
(b) Government deposits
0
200
400
600
800
1,000
1,200
1,400
1,600
1,800
2,000
2,200
0
200
400
600
800
1,000
1,200
1,400
1,600
1,800
2,000
2,200
Jan. Apr. July Oct. Jan. Apr. July Oct. Jan. Apr. July2007 2008 2009
Sources: Eurosystem, Federal Reserve, Bank of Japan and ECB calculations.

94ECB
Monthly Bulletin
October 2009
4 CONCLUSION
In response to the fi nancial turmoil, the
Eurosystem, the Federal Reserve and
the Bank of Japan introduced signifi cant
measures to support the continued access of
fi nancial institutions to liquidity, despite the
dysfunctioning of money markets, and to reduce
the tension in credit markets, and thereby ensure
the smooth transmission of monetary policy to
the real sector of the economy. These measures
turned the central banks into important money
market intermediaries and led to considerable
increases in the size and complexity of their
balance sheets.
Prior to October 2008 the three central banks
focused on addressing the dysfunctioning of the
money market by increasing the outstanding
amounts and/or the average maturity of their
refi nancing operations. Since October 2008 they
have increasingly aimed to support the fl ow of
credit to the private sector and repair the
monetary policy transmission mechanism in a
broader sense. As the euro area economy
depends much more on the banking sector than
the US economy does,5 the Eurosystem has
implemented an enhanced credit support
programme, emphasising the provision of
liquidity to credit institutions, including by
means of covered bond purchases. Owing to the
economic importance of capital markets in the
United States, the Federal Reserve has conducted
a credit easing policy, targeting different
segments of the credit market. The Bank of
Japan has introduced special measures in support
of the corporate fi nancing market, which has
been particularly hard-hit as a result of the
downturn. In addition to the domestic monetary
policy measures, the three central banks
(and several others) have joined forces in an
unprecedented global effort to mitigate the
impact of the worst fi nancial turmoil in decades
by supplying foreign currency to local banking
systems via central bank swap lines. Euro area non-fi nancial corporations obtained an average of 70% 5
of their external fi nancing from banks between 2004 and 2008,
while US corporations relied on banks for slightly more than
20% of their fi nancing needs during the same period. For details,
see the article entitled “The external fi nancing of households and
non-fi nancial corporations: a comparison of the euro area and the
United States” in the April 2009 issue of the Monthly Bulletin.

95ECB
Monthly Bulletin
October 2009
ARTICLES
Financial development
in emerging economies –
stock-taking and
policy implications
FINANCIAL DEVELOPMENT IN EMERGING ECONOMIES – STOCK-TAKING AND POLICY IMPLICATIONS
Domestic fi nancial development is an issue with broad economic and policy implications, which this article addresses by focusing on emerging and developing economies, also taking account of their fi nancial and economic links to advanced economies. Four implications of fi nancial development stand out from the perspective of emerging and developing economies. First, progress in fi nancial development is likely to be associated with higher potential growth via, for example, an increase in investment levels, as a vast body of literature has explored. Second, more developed domestic fi nancial markets tend, on the whole, to increase the resilience of emerging economies, provided they are based on very strong and rigorous prudential surveillance. Third, deeper and more liquid markets are also likely to attract foreign investors, as developments in gross private capital infl ows to emerging economies confi rm. Larger cross-border fi nancial exposures may, under certain circumstances, give rise to sudden retrenchments in capital fl ows, as the experience with the ongoing fi nancial crisis illustrates. Fourth, the existence of major differences in the level of fi nancial development between advanced and most emerging economies has been one of the factors underlying the accumulation of global imbalances in the years preceding the fi nancial crisis. It could, therefore, be inferred that a greater degree of symmetry in fi nancial globalisation – that is, a process of catching-up of emerging economies in fi nancial terms – may, over the longer run, contribute to more sustainable saving-investment and current account confi gurations via higher domestic demand in, and lower offi cial capital outfl ows from, emerging and developing economies. This also requires appropriate improvements to reinforce the stability of the global fi nancial sector.
Against this backdrop, this article presents and discusses measures of domestic fi nancial development in emerging economies in comparison with advanced economies. The article then addresses two of the aforementioned facets of fi nancial development: (i) its relationship with global imbalances and the ensuing implications both from an emerging market and a global perspective; and (ii) the link between domestic fi nancial development and fi nancial stability, focusing on rapid bank-based fi nancial development in eastern and south-eastern Europe as a case study.
1 INTRODUCTION
Domestic fi nancial development can be defi ned as
the capability of a country to channel savings into
investment within its own borders. This capability
hinges on institutional and organisational progress
in the local fi nancial system, which reduces
asymmetric information, brings in new important
market segments, promotes fi nancial innovation,
adds possibilities for agents to engage in fi nancial
transactions, reduces transaction costs and
increases competition.1 Given this defi nition, the
notion of “domestic fi nancial development”
should be kept distinct from other concepts, such
as those of “fi nancial system”, “fi nancial
integration” and “fi nancial openness”.2 In
particular, for the purposes of this article the
distinction between fi nancial stability and
domestic fi nancial development is of the essence:
a country can be very developed in fi nancial terms
and yet experience fi nancial crises if its
performance from a fi nancial stability perspective
is inadequate, as the ongoing crisis has clearly
illustrated.
In view of the broad economic and policy
implications of domestic fi nancial development,
the international community has been paying
increasing attention to the issue, its implications
and the required policy actions (e.g. in the fi elds
of regulatory and microeconomic reforms,
macroeconomic management and cooperation
among central banks). International fora and
See P. Hartmann, F. Heider, E. Papaioannou and M. Lo Duca 1
(2007), “The role of fi nancial markets and innovation in
productivity and growth in Europe”, ECB Occasional Paper
No 72.
Regarding the conceptual background to which this article refers, 2
see the article entitled, “Assessing the performance of fi nancial
systems”, in the October 2005 issue of the ECB’s Monthly
Bulletin; and ECB (2008), “Financial integration in Europe”.

96ECB
Monthly Bulletin
October 2009
organisations, such as the G7/G8, the G20, the
International Monetary Fund, the World Bank
and the Bank for International Settlements, have
called for progress in domestic fi nancial
development in emerging and developing
economies (hereafter referred to as “emerging
economies” for the sake of brevity) in order to
enhance their resilience and contribute to an
orderly unwinding of global imbalances via
lower net fl ows of capital from surplus to defi cit
countries.3 As regards the complex link between
domestic fi nancial development, capital fl ows
and fi nancial stability, the BIS-based Committee
on the Global Financial System (CGFS) and the
G20 have recently published reports addressing
this among other issues.
Some stylised facts suggest that the pace of
domestic fi nancial development has been
accelerating somewhat since the late 1990s in
most emerging economies:
Looking at the overall fi nancing of these
economies, i.e. including both domestic and
external funding, the ratio of total private bank
loans, debt instruments and equity liabilities
(the latter excluding external funding) to GDP
increased signifi cantly in the period 1998-2007, to
over 200% of GDP (see Chart 1). The subsequent
fi nancial crisis produced a decrease of this broad
measure in 2008. However, in annual terms this
decline was relatively contained compared with
the major retrenchment in foreign private capital
fl ows to emerging economies that took place
especially in the last quarter of that year.
Focusing on debt liabilities, in line with the
G8 action plan emerging economies have been
reducing their issuance of external debt since
2003, thus increasingly relying on domestic
For instance, in October 2007 G7 fi nance ministers and central 3
bank governors welcomed the G8 action plan for developing
local bond markets in emerging economies.
Chart 2 External versus domestic debt of emerging economies
(percentages of GDP)
0
10
20
30
40
50
60
70
0
10
20
30
40
50
60
70
1998 2000 2002 2004 2006 2008
domestic corporate
domestic financial
domestic government
external corporate
external financial
external government
Sources: BIS, IMF World Economic Outlook and Datastream.Note: See the note to Chart 1.
Chart 1 Total funding sources of emerging economies
(percentages of GDP)
0
50
100
150
200
250
0
50
100
150
200
250
1998 2000 2002 2004 2006 2008
equity
debt
private credit
Sources: BIS, IMF World Economic Outlook and Datastream.Note: The 17 emerging market economies (EMEs) portrayed in Charts 1, 2 and 3 are: Argentina, Brazil, Chile, China, Hong Kong SAR, India, Indonesia, Malaysia, Mexico, the Philippines, Singapore, South Africa, South Korea, Taiwan PoC, Thailand, Turkey and Venezuela.
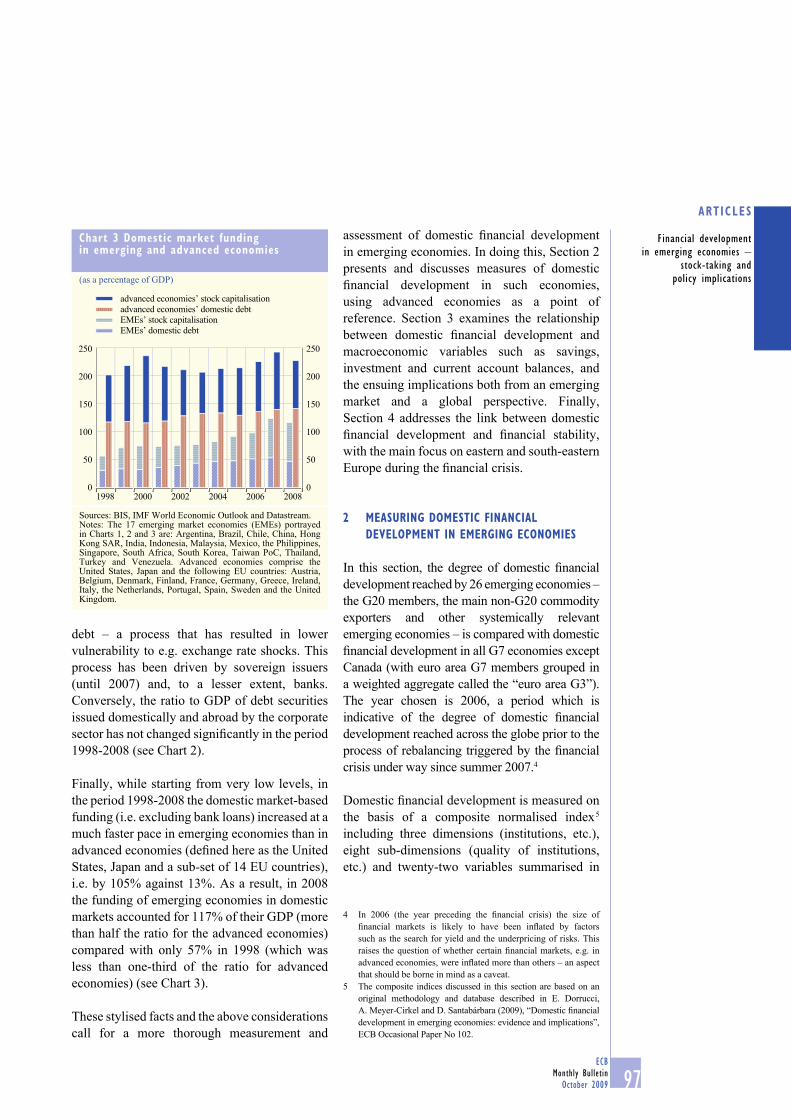
97ECB
Monthly Bulletin
October 2009
ARTICLES
Financial development
in emerging economies –
stock-taking and
policy implications
debt – a process that has resulted in lower
vulnerability to e.g. exchange rate shocks. This
process has been driven by sovereign issuers
(until 2007) and, to a lesser extent, banks.
Conversely, the ratio to GDP of debt securities
issued domestically and abroad by the corporate
sector has not changed signifi cantly in the period
1998-2008 (see Chart 2).
Finally, while starting from very low levels, in
the period 1998-2008 the domestic market-based
funding (i.e. excluding bank loans) increased at a
much faster pace in emerging economies than in
advanced economies (defi ned here as the United
States, Japan and a sub-set of 14 EU countries),
i.e. by 105% against 13%. As a result, in 2008
the funding of emerging economies in domestic
markets accounted for 117% of their GDP (more
than half the ratio for the advanced economies)
compared with only 57% in 1998 (which was
less than one-third of the ratio for advanced
economies) (see Chart 3).
These stylised facts and the above considerations
call for a more thorough measurement and
assessment of domestic fi nancial development
in emerging economies. In doing this, Section 2
presents and discusses measures of domestic
fi nancial development in such economies,
using advanced economies as a point of
reference. Section 3 examines the relationship
between domestic fi nancial development and
macroeconomic variables such as savings,
investment and current account balances, and
the ensuing implications both from an emerging
market and a global perspective. Finally,
Section 4 addresses the link between domestic
fi nancial development and fi nancial stability,
with the main focus on eastern and south-eastern
Europe during the fi nancial crisis.
2 MEASURING DOMESTIC FINANCIAL
DEVELOPMENT IN EMERGING ECONOMIES
In this section, the degree of domestic fi nancial
development reached by 26 emerging economies –
the G20 members, the main non-G20 commodity
exporters and other systemically relevant
emerging economies – is compared with domestic
fi nancial development in all G7 economies except
Canada (with euro area G7 members grouped in
a weighted aggregate called the “euro area G3”).
The year chosen is 2006, a period which is
indicative of the degree of domestic fi nancial
development reached across the globe prior to the
process of rebalancing triggered by the fi nancial
crisis under way since summer 2007.4
Domestic fi nancial development is measured on
the basis of a composite normalised index 5
including three dimensions (institutions, etc.),
eight sub-dimensions (quality of institutions,
etc.) and twenty-two variables summarised in
In 2006 (the year preceding the fi nancial crisis) the size of 4
fi nancial markets is likely to have been infl ated by factors
such as the search for yield and the underpricing of risks. This
raises the question of whether certain fi nancial markets, e.g. in
advanced economies, were infl ated more than others – an aspect
that should be borne in mind as a caveat.
The composite indices discussed in this section are based on an 5
original methodology and database described in E. Dorrucci,
A. Meyer-Cirkel and D. Santabárbara (2009), “Domestic fi nancial
development in emerging economies: evidence and implications”,
ECB Occasional Paper No 102.
Chart 3 Domestic market funding in emerging and advanced economies
(as a percentage of GDP)
0
50
100
150
200
250
0
50
100
150
200
250
1998 2000 2002 2004 2006 2008
advanced economies’ stock capitalisation
advanced economies’ domestic debt
EMEs’ stock capitalisation
EMEs’ domestic debt
Sources: BIS, IMF World Economic Outlook and Datastream.Notes: The 17 emerging market economies (EMEs) portrayed in Charts 1, 2 and 3 are: Argentina, Brazil, Chile, China, Hong Kong SAR, India, Indonesia, Malaysia, Mexico, the Philippines, Singapore, South Africa, South Korea, Taiwan PoC, Thailand, Turkey and Venezuela. Advanced economies comprise the United States, Japan and the following EU countries: Austria, Belgium, Denmark, Finland, France, Germany, Greece, Ireland, Italy, the Netherlands, Portugal, Spain, Sweden and the United Kingdom.

98ECB
Monthly Bulletin
October 2009
Table 1. In particular, the three broad dimensions
are designed to capture different aspects relevant
for domestic fi nancial development, namely:
(i) the institutions and rules supporting domestic
fi nancial development, as indicated by the
World Bank “Doing Business” database and the
International Country Risk Guide (ICRG);
(ii) the relative size of fi nancial markets in each
economy and the possibility for economic agents
to access such markets effi ciently; and (iii) a
number of proxies trying to summarise the
“performance” of each market in terms of
market liquidity, banking effi ciency and the
degree of “crowding in” of the private sector in
comparison with the relative weight of the
government and the central bank.
The main rankings and scores obtained with the
DFD (domestic fi nancial development) index are
summarised in Table 2, which shows that in 2006
the bulk of emerging economies still needed to
make substantial progress to achieve a degree of
domestic fi nancial development close to the
selected G7 economies. The latter indeed
presented a (non-weighted) average score of
about 68 (out of a maximum score of 100),
Table 1 Index of domestic financial development: dimensions and variables used
1. Institutions 2. Size of and access to markets 3. Market performance
Quality of institutions
Regulatory and judicial framework
Size of “traditional” private fi nancial markets
Financial innovation
Possibility for residents to access fi nance
Banks’ effi ciency
Liquidity (market turnover)
Distribution of domestic asset base between the private and the offi cial sector
Level of
corruption (-)
Strength,
impartiality and
observance of the
legal system (+)
Stock market
value/GDP (+)
Gross issuance
of ABS and
MBS/GDP (+)
Number of
bank branches
per 100,000
inhabitants (+)
Banks’ costs-
to-income
ratio (-)
Value of shares
traded as a ratio
of equity market
capitalisation
(three-year moving
average) (+)
Central bank
claims on the
private sector
over total
claims on the
private sector (-)
Bureaucratic
quality (+)
Investor
protection
(strength
of minority
shareholders) (+)
Private bond
market/GDP (+)
Number of
ATM machines
per 100,000
inhabitants (+)
Amount of
public sector
funding over
total bank
claims (-)
Strength of
collateral and
bankruptcy laws
in protecting
the rights of
borrowers and
lenders (+)
Total bank
claims/GDP (+)
Life insurance
penetration
(volume of
life insurance
premiums/GDP)
(+)
Domestic
private debt
over domestic
government
debt (-)
Degree of
information
available
in lending
operations (+)
Assets of
non-bank
fi nancial
institutions/
GDP (+)
Non-life insurance
penetration
(volume of
non-life insurance
premiums/GDP) (+)
Effi ciency
in enforcing
contracts and
resolving
commercial
disputes (+)
Cost of
maintaining a
savings account
(annual fees) (-)
Source: E. Dorrucci, A. Meyer-Cirkel and D. Santabárbara (2009), op. cit. (see pp. 52-54 for the specifi c source of each variable).
Notes: Expected effect on DFD in parentheses. ABS stands for asset-backed securities and MBS for mortgage-backed securities.

99ECB
Monthly Bulletin
October 2009
ARTICLES
Financial development
in emerging economies –
stock-taking and
policy implications
whereas the average score was below 48 for the
emerging market group taken as a whole. At the
same time, the scope for catching-up varies
considerably from country to country. Three
Asian fi nancial centres (Hong Kong SAR,
Singapore and Taiwan PoC) and South Korea
present scores comparable to those of G7
economies. An intermediate group of countries,
ranging between Malaysia and Kuwait, shows
intermediate scores between 58 and 48. Finally,
a large group of 14 countries (54% of the
sample) includes slightly or much lower scores,
spanning from Saudi Arabia (46) to Venezuela
(29). Regarding G7 members, in 2006 the
United States ranked fi rst across all dimensions
of fi nancial development. Similar conclusions
have been drawn in other contributions to the
literature.6
Table 2 also illustrates that there may be some
variance among the three aforementioned broad
See, in particular, World Economic Forum (2008), “The Financial 6
Development Report”. For a seminal contribution, see T. Beck,
A. Demirgüç-Kunt and R. Levine (2000), “A New Database on
Financial Development and Structure”, World Bank Economic
Review No 14.
Table 2 Index of domestic financial development: rankings and scores
(2006)
Composite index of domestic fi nancial development (DFD)
1st dimension: Institutions and rules
supporting DFD
2nd dimension: Financial market size and access to fi nance
3rd dimension: Selected proxies of fi nancial
market performance
Country/economyRank Score
(scale 1-100)Rank Rank Rank
United States 1 77.3 1 1 1
Hong Kong SAR 2 69.8 3 7 4
United Kingdom 2 69.8 4 3 11
Japan 4 66.2 5 2 22
Singapore 4 66.2 2 9 16
South Korea 6 64.6 8 5 2
Taiwan PoC 7 61.7 12 4 6
Euro area G3 8 58.6 10 6 5
Malaysia 9 57.9 7 11 8
Bahrain 10 55.4 13 12 7
Israel 11 54.4 6 10 18
Qatar 12 51.8 9 20 17
South Africa 13 49.8 18 8 13
China 14 49.5 21 16 3
Chile 15 48.4 11 13 25
Kuwait 16 48.1 15 17 15
Saudi Arabia 17 45.9 19 26 20
Turkey 18 45.5 16 21 12
Thailand 19 45.0 20 18 9
UAE 20 44.0 26 15 14
Mexico 21 43.2 14 23 21
India 22 42.4 22 19 24
Egypt 23 42.2 29 22 23
Oman 24 41.1 23 28 10
Brazil 25 40.8 24 14 26
Argentina 26 39.6 17 29 29
Philippines 27 36.9 27 24 28
Russia 27 36.9 28 27 19
Indonesia 29 34.1 25 30 30
Venezuela 30 29.4 30 25 27
Source: E. Dorrucci, A. Meyer-Cirkel and D. Santabárbara (2009), op. cit.

100ECB
Monthly Bulletin
October 2009
Chart 4 Quality of institutions
(2006)
Sub-index
0
20
40
60
80
100
0
20
40
60
80
100
1 Venezuela (VEN)
2 Russia (RUS)
3 China (CHN)
4 Thailand (THA)
5 Bahrain (BHR)
6 Brazil (BRA)
7 Egypt (EGY)
8 Saudi Arabia (SAU)
9 Indonesia (IDN)
10 Oman (OMN)
11 Qatar (QAT)
12 South Africa (ZAF)
13 Turkey (TUR)
14 Kuwait (KWT)
15 Mexico (MEX)
16 Philippines (PHL)
17 United Arab Emirates (UAE)
18 Argentina (ARG)
19 India (IND)
20 Korea (KOR)
21 Malaysia (MYS)
22 Taiwan (TWN)
23 Hong Kong (HKG)
24 Euro area G3 (EUR)
25 Chile (CHL)
26 Israel (ISR)
27 Japan (JPN)
28 US (USA)
29 UK (GBR)
30 Singapore (SGP)
1 2 3 4 5 6 7 8 9 10 11 12 13 14 15 16 17 18 19 20 21 22 23 24 25 26 27 28 29 30
Source: E. Dorrucci, A. Meyer-Cirkel and D. Santabárbara (2009), op. cit.
Chart 5 Regulatory framework
(2006)
Sub-index
0
20
40
60
80
100
0
20
40
60
80
100
1 VEN
2 EGY
3 PHL
4 UAE
5 RUS
6 IDN
7 IND
8 BRA
9 OMN
10 ARG
11 MEX
12 ZAF
19 TWN
20 BHR
21 EUR
22 ISR
23 KOR
24 MYS
1 2 3 4 5 6 7 8 9 10 11 12 13 14 15 16 17 18 19 20 21 22 23 24 25 26 27 28 29 30
25 QAT
26 JPN
27 GBR
28 SGP
29 USA
30 HKG
13 SAU
14 KWT
15 CHN
16 THA
17 TUR
18 CHL
Source: E. Dorrucci, A. Meyer-Cirkel and D. Santabárbara (2009), op. cit.

101ECB
Monthly Bulletin
October 2009
ARTICLES
Financial development
in emerging economies –
stock-taking and
policy implications
Chart 6 Financial market size
(2006)
Sub-index
0
10
20
30
40
50
60
70
80
90
100
0
10
20
30
40
50
60
70
80
90
100
1 VEN
2 OMN
3 IDN
4 ARG
5 PHL
6 TUR
7 RUS
8 MEX
9 IND
10 BRA
11 EGY
12 EUR
19 THA
20 CHL
21 QAT
22 TWN
23 SGP
24 KOR
25 GBR
26 MYS
27 HKG
28 ZAF
29 JPN
30 USA
13 UAE
14 CHN
15 ISR
16 KWT
17 BHR
18 SAU
1 2 3 4 5 6 7 8 9 10 11 12 13 14 15 16 17 18 19 20 21 22 23 24 25 26 27 28 29 30
Source: E. Dorrucci, A. Meyer-Cirkel and D. Santabárbara (2009), op. cit.
Chart 7 Distribution of the domestic asset base
(2006)
Sub-index
0
10
20
30
40
50
60
70
80
90
100
0
10
20
30
40
50
60
70
80
90
100
1 IDN
2 JPN
3 TUR
4 ARG
5 EGY
6 PHL
7 BRA
8 GBR
9 VEN
10 IND
11 CHL
12 SAU
19 THA
20 CHN
21 EUR
22 ZAF
23 RUS
24 ISR
1 2 3 4 5 6 7 8 9 10 11 12 13 14 15 16 17 18 19 20 21 22 23 24 25 26 27 28 29 30
25 OMN
26 TWN
27 MYS
28 KOR
29 HKG
30 USA
13 QAT
14 SGP
15 KWT
16 MEX
17 UAE
18 BHR
Source: E. Dorrucci, A. Meyer-Cirkel and D. Santabárbara (2009), op. cit.

102ECB
Monthly Bulletin
October 2009
dimensions of domestic fi nancial development
(in short, institutions, size and performance).
A deeper analysis of some of the eight sub-
dimensions listed in Table 1 helps to explain
this variance. Regarding the quality of
institutions underpinning domestic fi nancial
development, Singapore, Israel and Chile
are the emerging economies ranking in the
top positions, whereas Venezuela, Russia,
China and Thailand present the lowest
scores. In the sample, 27% of the economies
considered present scores above 60, the bulk
(60%) between 40 and 60, and 13% below 40
(see Chart 4). Turning to the sub-dimension
of regulatory framework, most of the sample
ranges between 50 and 70. Hong Kong SAR,
Singapore, Qatar, Malaysia and South Korea
have the best regulatory environments, while
Venezuela, Egypt and the Philippines rank
lowest (see Chart 5).
The sub-dimension “traditional size measures”
comprises the size of the stock market and the
private bond market,7 as well as the assets of
banks and non-banking fi nancial institutions,
as a share of GDP. These measures are
“traditional” in the sense that they are the most
widely quoted in the literature on domestic
fi nancial development. The highest values are
reached by South Africa, Hong Kong SAR,
Singapore, Taiwan PoC, Malaysia and South
Korea. After Qatar, Chile and Thailand – which
present intermediate scores – a gradual decline
in values characterises the other economies
until Venezuela’s value of 2 only is reached
(see Chart 6).
Finally, the distribution of the domestic asset
base is portrayed by three variables: (i) central
bank claims on the private sector over total
claims on the private sector; (ii) the amount
of funding accruing to the public sector over
total bank claims; and (iii) domestic private
debt over domestic government debt. This
is a particularly important sub-dimension,
as it captures possible crowding-out effects
stemming from the public sector. Chart 7
shows that Hong Kong SAR leads on this score
(86), followed by South Korea (79). Indonesia
(28) and Turkey (55) are at the bottom.
A complementary picture is provided in Charts 8
and 9, where the focus is shifted from individual
countries to a geographical distribution of the
scores in the composite DFD index across
different emerging market groupings and
regions. Looking, for instance, at the so-called
BRICs (Brazil, Russia, India and China), on the
whole, their prominence in the global economy
in terms of their contribution to world trade and
GDP growth is not yet mirrored by an adequate
level of fi nancial development 8 (see Chart 8).
Similarly, further progress in domestic fi nancial
development in the countries participating in the
Gulf Cooperation Council would contribute to
the domestic absorption of net savings in this
region, thus limiting the need to reinvest the
windfall from oil exports in fi nancial assets of
advanced economies, thereby helping unwind
global external imbalances (see Chart 9). Similar
considerations apply to the broader group of
commodity exporters (see Chart 8).
As a last point, Chart 10 illustrates the positive
relationship between the “institutions/rules”
and the “size/access” dimensions of the
index. Interestingly, this chart also suggests
that in 2006 the United States tended to be
oversized in relation to the institutional index.
Conversely, fi nancial systems such as those of
While the importance of public debt in the earlier stages of 7
domestic fi nancial development is not denied, here this variable
is not included since its excessive growth would not be desirable
for an economy.
An unexpected fi nding that calls for further inspection relates 8
to China, which ranks only 21st on the institutional dimension
and 16th on the size and access measures, but 3rd in the sub-
index of “performance” – admittedly the most controversial
component of the index presented here. This result refl ects a
very low cost-to-income ratio for the banking system, which is
not only due to low labour costs, but also – more importantly –
to the setting by the central bank of benchmark interest rates
on loans and deposits, which artifi cially ensure wide interest
rate margins for the banking system. Moreover, statistics
on the distribution of the asset base between the private and
public sector tend to underestimate the proportion of banks
in the country that are state-run. As a result, the scores in the
performance component should be interpreted with caution,
and indeed they decrease once the defi nition of “performance”
is adjusted for the aforementioned factors.

103ECB
Monthly Bulletin
October 2009
ARTICLES
Financial development
in emerging economies –
stock-taking and
policy implications
Chile, Israel and Singapore present relatively
strong institutions that are not fully refl ected in
their size and performance scores. The question
why certain emerging economies have not yet
fully translated their successful institutional
and regulatory environments into well-sized
and high-performing fi nancial intermediaries
and markets is certainly one that deserves
further attention.
3 FINANCIAL UNDERDEVELOPMENT
IN EMERGING ECONOMIES, INTERNATIONAL
CAPITAL FLOWS AND GLOBAL IMBALANCES
3.1 REVIEW OF THE LITERATURE
In recent years, the group of countries with
current account surpluses, i.e. recording net
total outfl ows of capital, has on the whole
been recording increasingly lower incomes
per capita, despite the presence in the group of
some rich countries such as Japan or Germany
(see Chart 11). This section addresses the
question of whether fi nancial underdevelopment
may have been one of the factors accounting for
this phenomenon, which conventional economic
models see as a puzzle. In fact, fi nancial
integration between two groups of economies
with different levels of economic development –
which are labelled here as “high income per
capita countries” (HICs) and “low income per
Chart 8 Composite index of DFD: breakdown by selected country groupings
(GDP-weighted data)
5
15
25
35
45
55
65
75
5
15
25
35
45
55
65
75
Commodity
exporters
BRICs Asian
financial
centres
Source: E. Dorrucci, A. Meyer-Cirkel and D. Santabárbara (2009), op. cit.Notes: Key commodity exporters are Chile, Venezuela, Bahrain, Kuwait, Oman, Qatar, Saudi Arabia, the United Arab Emirates and Russia. The BRICs are Brazil, Russia, India and China. The Asian fi nancial centres are Hong Kong SAR, Singapore and Taiwan PoC.
Chart 9 Composite index of DFD: geographical breakdown
(GDP-weighted data)
0
20
10
40
30
60
50
80
70
0
20
10
40
30
60
50
80
70
Latin
America
Other 5 GCC Emerging
Asia
Advanced
economies
Sources: E. Dorrucci, A. Meyer-Cirkel and D. Santabárbara (2009), op. cit.Notes: Latin American economies are Argentina, Brazil, Chile, Mexico and Venezuela. Gulf Cooperation Council (GCC) economies are Bahrain, Kuwait, Oman, Qatar, Saudi Arabia and the United Arab Emirates. Emerging Asian economies are China, Hong Kong SAR, India, Indonesia, Malaysia, the Philippines, Singapore, South Korea, Taiwan PoC and Thailand. The “other 5” economies are Egypt, Israel, Russia, Turkey and South Africa. Advanced economies comprise all G7 countries except Canada.
Chart 10 Relationship between financial market size and institutional quality
(2006)
0
20
40
60
80
0
20
40
60
80
VEN EGY
RUSPHL
IDN
BRAUAE
OMN ARGSAU
BHR
ITA
ZAF
TWN FRAKOR
EUR
JPN
GBR
USA
DEU
HKG
SGPISRMYS
CHL
QATKWT
CHN
IND
20 40 60 80 100
x-axis: institutions and rules supporting DFD sub-index
y-axis: financial market size and access to finance sub-index
Source: E. Dorrucci, A. Meyer-Cirkel and D. Santabárbara (2009), op. cit.

104ECB
Monthly Bulletin
October 2009
capita countries” (LICs) – is expected to lead
to net capital fl ows from HICs to LICs, where
the rate of return on capital and potential growth
are higher. This expected outcome could be
called a “fi rst-order effect”. However, the recent
experience has contradicted this expectation
since total net capital has been fl owing from
emerging economies (taken, of course, as a
whole since there are several exceptions, such
as countries in central and eastern Europe) to
advanced economies. Nonetheless, an important
qualifi cation is that in net terms private capital
has continued to fl ow to LICs, as conventional
models would have predicted, but this has been
more than compensated for by offi cial capital
directed by emerging economies to advanced
economies.9
Some recent contributions to the economic
literature have argued 10 that a more important
role than that of the aforementioned fi rst-order
effect may have been played by a second-order
effect originating in fi nancially underdeveloped
LICs. The existence of underdeveloped fi nancial
markets tends indeed to feed private savings and
hold back domestic demand, since consumers
and fi rms face borrowing constraints 11 impeding
both consumption smoothing over time and the
fi nancing of investment opportunities. As a result,
economies with underdeveloped fi nancial markets
have, all other things being equal, a propensity to
channel their excess savings abroad.
It is well known that trade development has
preceded domestic fi nancial development
in emerging economies. Since a developed
fi nancial system cannot be created overnight,
it is not surprising that several emerging
economies have exploited their cheaper labour
costs and other comparative advantages to
integrate into the world economy, whereas their
endowment and comparative advantages in the
provision of fi nancial services and instruments
have remained relatively limited. Moreover,
with globalisation, net lenders in LICs gain
easy access to global assets of HICs, but only
specialised investors and lenders in HICs
gain equal access to net private borrowers in
LICs, because the latter’s liabilities are more
local in nature, thus engendering a problem of
asymmetric information. As a result, and despite
the ongoing fi nancial crisis, HICs are likely to
continue to have a comparative advantage in the
provision of fi nancial services for some time to
This qualifi cation is discussed further below. The expression 9
“private capital” refers here to the fi nancial account of the
balance of payments net of “offi cial capital”, in turn defi ned as
changes in reserve assets plus any other capital fl ows triggered
by the public sector (e.g. sovereign wealth funds).
For an overview of arguments, see L. Bini Smaghi (2007), 10
“Global capital and national monetary policies”, speech given at
the European and Economic Financial Centre, London, January.
The term “borrowing constraints” should be understood as a 11
catchword referring to a broad and complex set of fi nancial
market features that are captured by the DFD index presented
in Section 2 of this article. For instance, low domestic fi nancial
market liquidity tends to result in high domestic asset price
volatility, thus creating incentives to invest abroad rather than
domestically. Moreover, information asymmetries (due e.g.
to an insuffi cient lenders’ knowledge of borrowers) reduce the
investment opportunities that can be fi nanced in a profi table
way, thus forcing extra savings to be channelled abroad. Finally,
limits on consumer credit also contribute to containing domestic
demand by limiting consumer spending.
Chart 11 Weighted average of income in the two groups of countries with current account deficits and surpluses
0.0
0.1
0.2
0.3
0.4
0.5
0.6
0.7
0.8
0.9
1.0
0.0
0.1
0.2
0.3
0.4
0.5
0.6
0.7
0.8
0.9
1.0
1981 1984 1987 1990 1993 1996 1999 2002 20052008
High
income
Low
income
surplus countries
deficit countries
Source: IMF World Economic Outlook.Notes: The sample includes 83 countries. The vertical axis measures the weighted average of per capita incomes in the two groups of countries recording, respectively, current account surpluses and defi cits. To this end, the sample has been split into these two groups for each year of the period 1981-2008. For both groups, the share of each country in the group’s total current account balance has been calculated and then multiplied by the relative income per capita of the country concerned, in turn measured as a share, ranging between zero and one, of the income per capita of the richest country in the sample in each year. Data have been adjusted for purchasing power.

105ECB
Monthly Bulletin
October 2009
ARTICLES
Financial development
in emerging economies –
stock-taking and
policy implications
come. This helps to explain the constellation of
current accounts in which LICs tend to have a
surplus and HICs a defi cit.
In support of this interpretation, several authors 12
have claimed that the world has a shortage of
supply of fi nancial assets, to which fast-growing
emerging economies would have contributed
by seeking to store value in fi nancial assets
that they do not produce. These economies are
indeed experiencing a large increase in their
disposable income, but have not been able to
sell in advance rights over their output – i.e. to
create fi nancial assets – owing to their fi nancial
underdevelopment. In this context, the fact that
advanced economies such as the Anglo-Saxon
ones have been supplying fi nancial assets to
those emerging economies which are unable
to produce them would help to partly explain
their external imbalances in the form of current
account defi cits.13
Other authors 14 have asked why the majority of
emerging economies in the past recorded
current account defi cits despite even less
developed local fi nancial systems. The shift
from defi cit to surplus can only be understood
in conjunction with a number of shocks to
output growth and total savings of emerging
economies that have occurred over the past
12 years: (i) the Asian crisis in the late 1990s,
which resulted in a negative demand shock
followed by the promotion of export-led
growth, sometimes coupled with a massive
accumulation of foreign exchange reserves and
heavily managed exchange rates; and (ii) two
positive supply shocks in the 2000s – a
productivity shock and rising commodity
prices – to which the domestic demand of
several emerging economies has not reacted in
a proportionate way owing to structural factors
such as demographic trends and the lack of
adequate welfare provision.15 The extra
precautionary savings engendered by such
shocks to the income of emerging economies
have tended to be channelled abroad due to
their fi nancial underdevelopment, thus resulting
in current account surpluses.
Differences in the degree of fi nancial
development can also help to explain portfolio
composition, i.e. the reason why, as already
mentioned, private capital tends to fl ow to
LICs, as one would expect, whereas it is mainly
offi cial capital that is directed to HICs via the
accumulation of foreign assets by central banks
and sovereign wealth funds. Whatever the origin
of excess savings in emerging economies, they
tend to be channelled abroad by the offi cial sector
for three main reasons that can be partly related to
fi nancial underdevelopment: (i) the ineffi ciency
of the private sector of most emerging economies
in channelling savings abroad; (ii) the presence,
in some countries, of asymmetric capital controls
discouraging portfolio capital outfl ows; (iii) the
attempt to create “national buffers” against
future fi nancial crises by accumulating foreign
exchange reserves in a context of fi xed or heavily
managed exchange rate regimes.16
Regarding, fi nally, regional peculiarities, some
authors 17 have focused on the case of emerging
economies in central and eastern Europe,
See, for instance, R. J. Caballero (2006), “On the macroeconomics 12
of asset shortages”, NBER Working Paper No 12753;
R. J. Caballero, E. Farhi and P.-O. Gourinchas (2007), “An
equilibrium model of ‘global imbalances’ and low interest rates”,
American Economic Review; and R. J. Caballero, E. Farhi and
P.-O. Gourinchas (2008), “Financial crash, commodity prices
and global imbalances”, paper presented at the ECB Conference
on Global Financial Linkages, Transmission of Shocks and Asset
Prices, Frankfurt am Main, 2 December.
Differently from the previous authors, who focus on a country’s 13
ability to supply assets, other authors have highlighted the link
between fi nancial underdevelopment and savings, hence the
demand for fi nancial assets. See E. G. Mendoza, V. Quadrini and
J.-V. Rios-Rull (2007), “Financial integration, fi nancial deepness
and global imbalances”, NBER Working Paper No 12909.
See, for instance, R. S. Kroszner (2007), “International capital 14
fl ows and emerging market economies”, speech given in Buenos
Aires, 15 May.
For further details, see T. Bracke, M. Bussière, M. Fidora and15
R. Straub (2008), “A framework for assessing global
imbalances”, ECB Occasional Paper No 78.
See, for instance, Eurosystem (2006), “The accumulation of 16
foreign reserves”, ECB Occasional Paper No 43, prepared by a
Task Force of the International Relations Committee.
See, for instance, P. R. Lane and G. M. Milesi-Ferretti (2006), 17
“Capital fl ows to central and emerging Europe”, Discussion Paper
No 161 of the Institute for International Integration Studies (IIIS);
A. Abiad, D. Leigh and A. Mody (2008), “International fi nance,
capital mobility and income convergence: Is Europe different?”,
paper presented at the Economic Policy Forty-Eighth Panel
Meeting hosted by the Banque de France, Paris, 24-25 October.

106ECB
Monthly Bulletin
October 2009
which provides a counter-example supporting
a more conventional textbook perspective.
Other authors 18 have observed that the
low-return emerging market regions, such as
Latin America, have over time received more
capital than high-return regions such as the
“Asian Tigers”. This fi nding would further
qualify the puzzle “why does capital not fl ow
to poor countries?” into “why does capital not
fl ow to high-return poor countries?”
In line with the literature summarised above,
econometric analysis 19 has also supported
the idea that fi nancial underdevelopment in
emerging economies has been one structural
factor contributing to the accumulation of
global imbalances and, in particular, to the
phenomenon of net capital fl owing “uphill”
from LICs to HICs.
3.2 LOOKING FORWARD: POSSIBLE GLOBAL
IMPLICATIONS OF FINANCIAL CATCHING-UP
OF EMERGING ECONOMIES
While, as shown in Section 2, the scope for
fi nancial catching-up in emerging economies is
still substantial, there is some indication that this
process may have already started in certain
countries. In particular, Charts 12 and 13 –
which, due to data constraints in the time series,
only focus on a narrower version of the index of
fi nancial market size described in Table 1 20 –
show some interesting results:
• Chart 12 highlights that, in terms of fi nancial
market size, emerging market economies
(EMEs) taken as a whole recorded some
(limited) fi nancial convergence towards
advanced economies between 2002,
i.e. after the bursting of the IT asset bubble,
and 2006;
• Chart 13 focuses on selected emerging
fi nancial markets and shows that: (i) most
of them grew in relative size between 1992
and 2006; (ii) Korea, Saudi Arabia and India
have been clearly converging, in most recent
years, towards advanced economies, as
presented in Section 2.
As Charts 12 and 13 confi rm, this process of
fi nancial convergence, at least in certain emerging
economies, seems to have been signifi cantly
infl uenced by fi nancial crisis episodes affecting
either advanced or emerging economies.
Looking forward, the ongoing crisis has shown
that the fi nancial sector in several economies,
notably advanced economies and the United States
in particular, is deleveraging and, ultimately,
needs to shrink – a process which is indeed
taking place. At the same time, once the negative
spillover effects of the fi nancial crisis on emerging
economies has faded away, it is quite possible
L. E. Ohanian and M. L. J. Wright (2007), “Where did capital 18
fl ow? Fifty years of international rate of return differentials and
capital fl ows”, paper presented at the ECB Conference on Global
Financial Linkages, Transmission of Shocks and Asset Prices,
Frankfurt am Main, 2 December 2008.
See M. D. Chinn and H. Ito (2005), “What matters for fi nancial 19
development? Capital controls, institutions, and interactions”,
NBER Working Paper No 11370; M. D. Chinn and H. Ito (2007),
“East Asia and global imbalances: Saving, investment and
fi nancial development”, NBER Working Paper No 13364; and
Dorrucci et al. (2009), op. cit.
Due to data restrictions, this narrower index only comprises: 20
(i) market capitalisation over GDP, calculated as a three-year
moving average in order to smooth out sudden spikes; and
(ii) non-life insurance penetration.
Chart 12 Index of financial market size in emerging and advanced economies
0
25
50
75
0
25
50
75
1991 1994 1997 2000 2003 2006
emerging market economies
advanced economies
Source: E. Dorrucci, A. Meyer-Cirkel and D. Santabárbara (2009), op. cit.Notes: The index of fi nancial market size portrayed in Charts 12 and 13 is narrower than the index of fi nancial market size described in Table 1 (see footnote 20 for details). The emerging market economies portrayed in Chart 12 are Argentina, Brazil, Chile, China, Hong Kong SAR, India, Indonesia, Malaysia, Mexico, the Philippines, Singapore, South Africa, South Korea, Taiwan PoC, Thailand, Turkey and Venezuela. Advanced economies comprise all G7 countries except Canada.

107ECB
Monthly Bulletin
October 2009
ARTICLES
Financial development
in emerging economies –
stock-taking and
policy implications
that investors will look with renewed interest at
their fi nancial markets – a process which has also
been observable in recent months. As a result, the
gap between advanced and emerging economies
in terms of domestic fi nancial development might
further narrow in the years to come.
More generally, if fi nancial globalisation were
to become more symmetric in nature, the view
may no longer hold true that, thanks to the
opening-up of capital accounts and developed
fi nancial markets, it would always be possible
for fi nancially developed economies to smooth
consumption, share risk abroad and fi nance large
current account defi cits under any circumstances
and over any time horizons.
4 DOMESTIC FINANCIAL DEVELOPMENT
AND FINANCIAL STABILITY
4.1 A FEW GENERAL LESSONS
FROM THE FINANCIAL CRISIS
Recent reports by the Committee on the Global
Financial System (CGFS) and the G20 21 have
discussed, among other things, the link between
domestic fi nancial development in emerging
economies and fi nancial stability in the light of
the ongoing fi nancial crisis. Both publications
have remarked that limited progress in fi nancial
innovation has implied, as a welcome indirect
by-product, very limited exposures of emerging
economies to sub-prime mortgage markets. As a
result, emerging fi nancial markets were able to
retain the confi dence of international investors
in the early stages of the crisis, and until summer
2008 suffered from limited spillover effects
from the fi nancial turmoil occurring in advanced
economies. However, when the crisis intensifi ed
in mid-September 2008, factors such as global
deleveraging, the sudden evaporation of market
liquidity and fl ight to safety had a major impact
on emerging fi nancial markets, but these markets
proved to be overall more resilient than in past
crisis episodes (though the most fi nancially
developed ones were not necessarily the most resilient).
While the enhanced liquidity of fi nancial markets
in emerging economies has strengthened their
fi nancial resilience somewhat, the experience
with the crisis has shown that considerable scope
remains for further progress. For instance, in
many countries local currency debt and interest
rate derivatives markets are still in the early
stages of development, which implies that
shocks affecting capital infl ows can lead to larger
changes in fi nancial asset prices than in deeper
markets. Moreover, several markets suffer from
vulnerability owing to a narrow investor base.
Broadening the investor base calls for further
reforms, e.g. of relevant regulations, pension
funds and other institutional investors, capital
market infrastructure, and the way central banks
as fi scal agents design bond issuance and trading.
Finally, market resilience can also be improved
through well-developed hedging markets.22
See Committee on the Global Financial System (2009), “Capital 21
fl ows and emerging market economies”, report submitted by a
working group established by the CGFS, CGFS Papers No 33
(January); and G20 (2008), “Study Group on Global Credit
Market Disruptions”, paper prepared by Australia.
For a broader discussion of the link between fi nancial 22
development and fi nancial stability in emerging economies,
see A. de la Torre, J. C. Gozzi and S. L. Schmukler (2007),
“Financial Development: Maturing and Emerging Policy Issues”,
The World Bank Research Observer, Vol. 22, No 1.
Chart 13 Index of financial market size: selected emerging market economies compared with advanced economies
0.00
0.25
0.50
0.75
0.00
0.25
0.50
0.75
1992 1994 1996 1998 2000 2002 2004 2006
advanced economies
BrazilChina
India
Korea
Mexico
Russia
Saudi Arabia
Source: E. Dorrucci, A. Meyer-Cirkel and D. Santabárbara (2009), op. cit.Notes: The index of fi nancial market size portrayed in Charts 12 and 13 is narrower than the index of fi nancial market size described in Table 1 (see footnote 20 for details). Advanced economies comprise all G7 countries except Canada.

108ECB
Monthly Bulletin
October 2009
Another important aspect is that the process of
domestic fi nancial development has been coupled
with a signifi cant foreign bank presence in many
emerging economies, which raises a number of
issues of potential relevance in the context of
the current crisis. This topic is discussed in the
remainder of this section, focusing on the case
of eastern and south-eastern Europe during the
fi nancial crisis.
4.2 RAPID BANK-BASED FINANCIAL
DEVELOPMENT: A CASE STUDY
Several economies in eastern and south-eastern
Europe have experienced very rapid bank-based
fi nancial development in recent years. Although
fi nancial intermediation, as measured by the share
of total assets of the banking system in GDP, still
lags far behind the euro area average of more
than 300%, it has signifi cantly trended upwards
in the last decade (see Chart 14). Despite this
general tendency, there are important differences
across the countries concerned, both in the levels
reached and in the pace of increase over this
period. In Turkey, for instance, the increase in
the size of the banking sector relative to GDP
was among the smallest in the region.
The fast bank-driven domestic fi nancial
development has been facilitated by the entry of
foreign banks into these countries. The
privatisation of formerly state-owned banks
often involved foreign buyers, who – given the
growth potential of this market segment in such
economies – entered the market as strategic
investors and expanded their activities very
rapidly afterwards. Therefore, in most countries
foreign penetration increased substantially,
again with considerable cross-country
differences.23 In the western Balkan economies,
banking systems are dominated by foreign
banks, with a share of foreign ownership in
terms of assets close to or above 80%
(see Chart 15). However, prevailing shares of
foreign bank assets are signifi cantly lower in
other economies of the region, particularly in
Russia and Turkey (below 20%). The parent
companies of the foreign-owned banks are
typically headquartered in the euro area. Their
strategic focus on emerging Europe is also
illustrated by the large increase in euro area
bank claims on this region during the past ten
See World Bank (2009), “Global Development Finance 2009: 23
Charting a Global Recovery”.
Chart 14 Ratio of banking sector assets to GDP
(percentages)
0
20
40
60
80
100
0
20
40
60
80
100
1 2 3 4 5 6 7 8 9 10
1 Albania 1)
2 Bosnia and Herzegovina
3 Croatia
4 FYR Macedonia
5 Montenegro 2)
6 Serbia
7 Turkey
8 Kazakhstan
9 Russia
10 Ukraine 1)
1999
2008
Sources: IMF, Haver Analytics.1) Latest data point: 2007.2) Earliest data point: 2003.
Chart 15 The ratio of foreign bank assets to total assets
(percentages)
0
20
40
60
80
100
0
20
40
60
80
100
1999
2007
1 Albania
2 Bosnia and Herzegovina
3 Croatia
4 FYR Macedonia
5 Montenegro 1)
6 Serbia
7 Turkey
8 Kazakhstan
9 Russia
10 Ukraine
1 2 3 4 5 6 7 8 9 10
Sources: European Bank for Reconstruction and Development, Haver Analytics for Turkey.1) Earliest data point: 2003.

109ECB
Monthly Bulletin
October 2009
ARTICLES
Financial development
in emerging economies –
stock-taking and
policy implications
years, which signifi cantly surpassed exposures
to other emerging market regions (see Chart 16).
This fi nancial development, spurred by foreign
bank presence, has supported economic
development and real convergence in the
region. Since fi nancing by parent banks is
generally more stable than many other forms of
capital infl ows, especially portfolio investment,
this bank-based development model offers
numerous advantages. In addition, foreign
banks contributed to economic transition in
these countries not only by providing capital
to fi nancial systems, but also by transferring
reputation, know-how, managerial skills and
information technology. Moreover, foreign
banks may act as a stabilising force in the case
of domestic shocks. In general, more developed
and more integrated fi nancial markets allow
access to international borrowing on more
favourable terms, and thus raise domestic
investment relative to domestic savings through
the bank funding channel. In fact, the economic
literature summarised in Section 3.1 suggests
that this factor was crucial in bringing about,
differently from other emerging economies, the
“downhill” fl ow of capital from more capital-
rich advanced economies to emerging Europe.24
At the same time, this rapid process of bank-
based fi nancial development has been coupled
with some fi nancial and macroeconomic
vulnerabilities. On the fi nancial side, these
vulnerabilities have been manifest from rapid
credit growth 25 (see Chart 17), which was
enhanced by a fi erce competition for market
share among banks.26 This led to increased credit
See S. Herrmann and A. Winkler (2008), “Real convergence, 24
fi nancial markets, and the current account: Emerging Europe
versus emerging Asia”, ECB Occasional Paper No 88.
Credit growth in the region exceeded that of other emerging 25
markets. In 2004-08, credit to the private sector expanded,
on average, by 44% annually in the countries analysed here
(taking a simple average of the country growth rates), while the
corresponding measure was 31% in Latin America and only 12%
in emerging Asia.
See ECB (2008), “Financial stability challenges in candidate 26
countries: Managing the transition to deeper and more market-
oriented fi nancial systems”, by an expert group of the International
Relations Committee, ECB Occasional Paper No 95.
Chart 16 Consolidated foreign claims on selected emerging market regions of banks headquartered in the euro area
(EUR billions)
0
200
400
600
800
1,000
0
200
400
600
800
1,000
2000 2001 2002 2003 2004 2005 2006 2007 2008
emerging Europe
Latin America and Caribbean
Africa and Middle East
Asia and Pacific
Source: BIS.Note: Emerging Europe, as defi ned in the BIS statistics, comprises Albania, Belarus, Bosnia and Herzegovina, Bulgaria, Croatia, the Czech Republic, Estonia, Hungary, Latvia, Lithuania, the former Yugoslav Republic of Macedonia, Moldova, Montenegro, Poland, Romania, Russia, Serbia, Turkey and Ukraine.
Chart 17 Average credit growth and the ratio of credit to GDP
(annual percentage changes; percentages)
Bosnia and
Herzegovina
FYR Macedonia Serbia
Albania
CroatiaUkraine
Montenegro
Russia
euro area
Kazakhstan
Turkey
0
20
40
60
80
100
120
140
160
20
40
60
80
100
120
140
160
x-axis: average credit growth (2004-2008)
y-axis: credit/GDP (2008)
00 10 20 30 40 50 60 70 80 90
Sources: ECB, IMF, Haver Analytics and national sources.

110ECB
Monthly Bulletin
October 2009
risks, as well as a large expansion of private
sector debt. In fact, the fast expansion is in line
with the catching-up process, and the room for
convergence is indeed substantial, since the
credit-to-GDP ratio in the region is still well
below euro area levels. Nevertheless, the strong
rate of increase and the expansion to customers
without a credit history made the assessment of
creditworthiness particularly challenging. The
resulting vulnerabilities are partly magnifi ed by
the use of foreign currency loans to unhedged
borrowers in some economies.27
On the macroeconomic side, the easier availability
of credit and the pent-up demand led to increasing
consumption and boosted gross fi xed capital
formation. As a result, domestic demand
became the main contributor to output growth.
The mirror image of domestic demand largely
fi nanced by the strong credit growth was the
widening current account defi cit (see Chart 18).
This exposed countries to external fi nancial
vulnerabilities, which illustrates the importance
of the link between macroeconomic imbalances
and fi nancial stability. In resource-rich economies
such as Russia, external vulnerabilities were of a
different origin, related to the high dependence
on commodity prices. But as a result of elevated
growth rates and booming domestic demand,
several eastern and south-eastern European
economies started showing signs of overheating,
materialising in high infl ation rates and/or high
current account defi cits.28
The current global fi nancial crisis has suddenly
exposed some of these vulnerabilities.29
Although the direct impact on regional fi nancial
markets was limited as banks in the region had
only a very small exposure to structured
products, the second wave of the crisis hit these
economies hard, especially via a collapse in
external trade. Since most of the economies
analysed here are small open economies or
depend largely on commodity exports, they
were strongly affected by the decline in external
demand. As real economic activity declines,
loan portfolios are expected to deteriorate.
Moreover, banks often faced deposit withdrawal
pressures in the region due to confi dence effects
and, given their large external funding needs,
were negatively affected by a reduced or more
expensive access to international borrowing.
Support from the parent companies may, for
these reasons, be crucial in some cases. In
general, foreign banks can be in a better position
to recapitalise their subsidiaries or branches in
the region than purely domestic banks. However,
if the foreign parent banks have been hit by the
fi nancial crisis, their presence opens another
potential transmission channel to these emerging
countries.
In conclusion, the foreign bank-based banking
models of eastern and south-eastern Europe
are currently being put to the test. On the one
On the side of households and companies, taking out loans 27
in foreign currency was motivated by the large interest rate
differentials, while due to the real convergence process
currencies seemed to be more prone to appreciation pressures.
But it was also often in line with the incentives of the banks,
given that the major source of funding for these foreign-owned
banks was capital from their parent companies.
The impact of high credit growth on infl ation and on current 28
account positions was determined, inter alia, by the exchange rate
regime of the countries concerned. In particular, the highest rates
of infl ation were experienced in countries with fi xed exchange
rates, where relative productivity gains could not translate into
nominal currency appreciation.
See IMF (2009), “Regional Economic Outlook on Europe: 29
Addressing the Crisis”.
Chart 18 Average credit growth and current account-to-GDP ratio (2004-08)
(annual percentage changes; percentages)
Turkey
euro area
Russia
Ukraine
CroatiaAlbania
Serbia
FYR Macedonia
Bosnia and
Herzegovina
-15
-10
-5
0
5
10
-15
-10
-5
0
5
10
30 40 50 70 8010 20 60 900
Montenegro
Kazakhstan
y-axis: current account-to-GDP ratio
x-axis: annual credit growth
Sources: ECB, IMF, Haver Analytics and national sources.

111ECB
Monthly Bulletin
October 2009
ARTICLES
Financial development
in emerging economies –
stock-taking and
policy implications
hand, foreign bank presence has acted as an
anchor of stability across most countries, also
during the crisis, as foreign funding pressures
remained overall limited. Many parent banks
have repeatedly communicated that they remain
committed to the region and, in the case of a few
countries under an IMF program, have formalised
this commitment through voluntary agreements
to maintain their exposure. At the same time,
banks have partly acted as a transmission channel
of shocks, which is potentially bi-directional,
i.e. from advanced to emerging economies via
the bank lending channel, as well as vice versa,
e.g. in the case of a deterioration in profi tability
in the region. At the current juncture, it is too
early to judge the overall performance of this
fi nancial development model in case of stress.
However, it is by now well recognised that
the presence of foreign banks, while providing
many advantages, can become a source of
shocks for both counterparties, which needs to
be better taken into account by regulators and in
risk assessments in the future.
5 CONCLUSION
Domestic fi nancial development in emerging
economies is a crucial ingredient in the pursuit
of more symmetric fi nancial globalisation, which
in turn could play an important role in reducing
global imbalances. While more developed
fi nancial markets are generally found to be
benefi cial for economic development, a process
of rapid fi nancial deepening may, under certain
circumstances, entail some risks to fi nancial
stability. The quality of domestic fi nancial
development and the parallel development of
fi nancial supervision and regulation are, therefore,
crucial for the avoidance of fi nancial crises.
In particular, fi nancial development models
relying to a very large extent on just one element
of the fi nancial system (e.g. banks or markets)
may tend to be more vulnerable in times of crisis.
Domestic fi nancial development resting on more
broad-based fi nancial structures could prove to
be more stable in the medium to long run.


S 1ECB
Monthly Bulletin
October 2009
EURO AREA STATISTICS


S 3ECB
Monthly Bulletin
October 2009
CONTENTS 1
For further infomation, please contact us at: [email protected]. See the ECB Statistical Data Warehouse on the Statistics section of the ECB website 1
(http://sdw.ecb.europa.eu) for longer runs and more detailed data.
EURO AREA OVERVIEW
Summary of economic indicators for the euro area S5
1 MONETARY POLICY STATISTICS
1.1 Consolidated fi nancial statement of the Eurosystem S6
1.2 Key ECB interest rates S7
1.3 Eurosystem monetary policy operations allotted through tenders S8
1.4 Minimum reserve and liquidity statistics S9
2 MONEY, BANKING AND INVESTMENT FUNDS
2.1 Aggregated balance sheet of euro area MFIs S10
2.2 Consolidated balance sheet of euro area MFIs S11
2.3 Monetary statistics S12
2.4 MFI loans, breakdown S14
2.5 Deposits held with MFIs, breakdown S17
2.6 MFI holdings of securities, breakdown S20
2.7 Revaluation of selected MFI balance sheet items S21
2.8 Currency breakdown of selected MFI balance sheet items S22
2.9 Aggregated balance sheet of euro area investment funds S24
2.10 Assets of euro area investment funds broken down by investment policy and type of investor S25
3 EURO AREA ACCOUNTS
3.1 Integrated economic and fi nancial accounts by institutional sector S26
3.2 Euro area non-fi nancial accounts S30
3.3 Households S32
3.4 Non-fi nancial corporations S33
3.5 Insurance corporations and pension funds S34
4 FINANCIAL MARKETS
4.1 Securities, other than shares, by original maturity, residency of the issuer and currency S35
4.2 Securities, other than shares, issued by euro area residents, by sector of the issuer and instrument type S36
4.3 Growth rates of securities, other than shares, issued by euro area residents S38
4.4 Quoted shares issued by euro area residents S40
4.5 MFI interest rates on euro-denominated deposits and loans by euro area residents S42
4.6 Money market interest rates S44
4.7 Euro area yield curves S45
4.8 Stock market indices S46
5 PRICES, OUTPUT, DEMAND AND LABOUR MARKETS
5.1 HICP, other prices and costs S47
5.2 Output and demand S50
5.3 Labour markets S54
6 GOVERNMENT FINANCE
6.1 Revenue, expenditure and defi cit/surplus S55
6.2 Debt S56

ECB
Monthly Bulletin
October 2009
Conventions used in the tables
“-” data do not exist/data are not applicable
“.” data are not yet available
“…” nil or negligible
“billion” 109
(p) provisional
s.a. seasonally adjusted
n.s.a. non-seasonally adjusted
S 4
ENLARGEMENT OF THE EURO AREA ON 1 JANUARY 2009 TO INCLUDE SLOVAKIA
Unless otherwise indicated, all data series covering observations for 2009 relate to the Euro 16 (the euro area including
Slovakia) for the whole time series. For interest rates, monetary statistics and the HICP (and, for consistency reasons,
the components and counterparts of M3 and the components of the HICP), the statistical series relating to the euro area
cover the EU Member States that had adopted the euro at the time to which the statistics relate. Where applicable, this is
indicated in the tables by means of a footnote. In such cases, where underlying data are available, absolute and percentage
changes for the respective year of entry into the euro area of Greece (2001), Slovenia (2007), Cyprus (2008), Malta (2008)
and Slovakia (2009), calculated from bases covering the year prior to the year of entry, use a series in which the impact
of these countries’ joining the euro area is taken into account. Historical data referring to the euro area before the entry of
Slovakia are available on the ECB’s website at http://www.ecb.europa.eu/stats/services/downloads/html/index.en.html
6.3 Change in debt S57
6.4 Quarterly revenue, expenditure and defi cit/surplus S58
6.5 Quarterly debt and change in debt S59
7 EXTERNAL TRANSACTIONS AND POSITIONS
7.1 Summary balance of payments S60
7.2 Current and capital accounts S61
7.3 Financial account S63
7.4 Monetary presentation of the balance of payments S69
7.5 Trade in goods S70
8 EXCHANGE RATES
8.1 Effective exchange rates S72
8.2 Bilateral exchange rates S73
9 DEVELOPMENTS OUTSIDE THE EURO AREA
9.1 In other EU Member States S74
9.2 In the United States and Japan S75
LIST OF CHARTS S76
TECHNICAL NOTES S77
GENERAL NOTES S83

ECB
Monthly Bulletin
October 2009 S 5
EURO AREA OVERVIEW
Summary of economic indicators for the euro area (annual percentage changes, unless otherwise indicated)
1. Monetary developments and interest rates 1)
M1 2) M2 2) M3 2), 3) M3 2), 3) MFI loans to Securities other 3-month 10-year3-month euro area than shares issued interest rate spot rate
moving average residents in euro by non-MFI (EURIBOR, (% per annum,(centred) excluding MFIs corporations 2) % per annum, end-of-
and general period period) 4)
government 2) averages)
1 2 3 4 5 6 7 82007 6.5 9.9 11.2 - 10.8 18.6 4.28 4.382008 2.4 9.7 9.7 - 9.5 18.7 4.64 3.69
2008 Q4 2.7 8.9 8.2 - 7.4 20.0 4.24 3.692009 Q1 5.3 7.2 6.0 - 4.6 26.2 2.01 3.77 Q2 8.0 5.5 4.3 - 2.2 27.8 1.31 3.99 Q3 . . . - . . 0.87 3.64
2009 Apr. 8.3 5.9 4.9 4.6 2.3 28.5 1.42 3.79 May 7.9 5.0 3.8 4.1 1.8 27.9 1.28 4.18 June 9.4 4.9 3.6 3.4 1.5 26.0 1.23 3.99 July 12.1 4.7 3.0 3.0 0.7 26.7 0.97 3.74 Aug. 13.6 4.6 2.5 . 0.1 . 0.86 3.68 Sep. . . . . . . 0.77 3.64
2. Prices, output, demand and labour markets 5)
HICP 1) Industrial Hourly Real GDP Industrial Capacity Employment Unemploymentproducer labour production utilisation in (% of labour
prices costs excluding manufacturing force)construction (percentages)
1 2 3 4 5 6 7 82007 2.1 2.7 2.5 2.8 3.7 84.1 1.8 7.52008 3.3 6.1 3.4 0.7 -1.7 81.8 0.8 7.5
2009 Q1 1.0 -2.0 3.6 -4.9 -18.4 72.5 -1.2 8.8 Q2 0.2 -5.7 4.0 -4.8 -18.5 69.9 -1.8 9.3 Q3 . . . . . . . .
2009 Apr. 0.6 -4.8 - - -21.3 70.3 - 9.2 May 0.0 -5.9 - - -17.6 - - 9.3 June -0.1 -6.5 - - -16.6 - - 9.4 July -0.7 -8.4 - - -15.9 69.5 - 9.5 Aug. -0.2 -7.5 - - . - - 9.6 Sep. -0.3 . - - . - - .
3. Balance of payments, reserve assets and exchange rates(EUR billions, unless otherwise indicated)
Balance of payments (net transactions) Reserve assets Effective exchange rate of USD/EUR (end-of-period the euro: EER-21 6) exchange rate
Current and Direct Portfolio positions) (index, 1999 Q1 = 100)capital Goods investment investment
accounts Nominal Real (CPI)
1 2 3 4 5 6 7 82007 24.8 46.4 -92.5 159.7 347.2 107.9 109.0 1.37052008 -89.0 -6.0 -242.3 441.5 374.2 113.0 113.6 1.4708
2008 Q4 -28.5 -0.6 -77.7 204.2 374.2 109.1 109.6 1.31802009 Q1 -40.8 -10.3 -38.5 179.4 395.7 111.9 112.2 1.3029 Q2 -18.0 11.2 -8.9 94.0 381.5 113.2 113.4 1.3632 Q3 . . . . . 114.3 114.3 1.4303
2009 Apr. -7.4 3.9 -4.5 -9.0 386.3 112.5 112.8 1.3190 May -11.6 2.2 4.8 58.0 392.2 113.0 113.2 1.3650 June 1.0 5.1 -9.2 44.9 381.5 114.0 114.3 1.4016 July 9.4 12.6 5.3 -23.0 386.5 113.8 113.8 1.4088 Aug. . . . . 428.0 113.9 113.9 1.4268 Sep. . . . . . 115.2 115.3 1.4562
Sources: ECB, European Commission (Eurostat and Economic and Financial Affairs DG) and Reuters.Note: For more information on the data, see the relevant tables later in this section.1) Data refer to the changing composition of the euro area. For further information, see the General notes.2) Annual percentage changes of monthly data refer to the end of the month, whereas those of quarterly and yearly data refer to the annual change in the period average of the series.
See the Technical notes for details.3) M3 and its components exclude holdings by non-euro area residents of money market fund shares/units and debt securities with a maturity of up to two years.4) Based on AAA-rated euro area central government bond yield curves. For further information, see table 4.7.5) Unless otherwise indicated, data refer to Euro 16.6) For the definition of the trading partner groups and other information, please refer to the General notes.

ECB
Monthly Bulletin
October 2009
1
S 6
MONETARY POLICY STATISTICS
1.1 Consolidated financial statement of the Eurosystem (EUR millions)
1. Assets
2009 11 September 2009 18 September 2009 25 September 2009 2 October
Gold and gold receivables 232,024 231,971 231,913 238,169Claims on non-euro area residents in foreign currency 198,135 196,666 196,308 194,400Claims on euro area residents in foreign currency 58,215 59,131 58,096 52,323Claims on non-euro area residents in euro 16,333 15,612 15,007 15,141Lending to euro area credit institutions in euro 689,256 683,837 681,048 734,324
Main refinancing operations 93,285 87,800 85,004 66,767Longer-term refinancing operations 595,862 595,862 595,863 667,440Fine-tuning reverse operations 0 0 0 0Structural reverse operations 0 0 0 0Marginal lending facility 85 149 141 91Credits related to margin calls 24 25 40 26
Other claims on euro area credit institutions in euro 24,022 24,686 26,356 24,675Securities of euro area residents in euro 316,605 317,451 319,065 320,756
Securities held for monetary policy purposes 11,140 12,779 14,239 15,579Other securities 305,465 304,672 304,826 305,177
General government debt in euro 36,230 36,230 36,229 36,204Other assets 231,653 227,388 226,220 228,574
Total assets 1,802,473 1,792,972 1,790,242 1,844,567
2. Liabilities
2009 11 September 2009 18 September 2009 25 September 2009 2 October
Banknotes in circulation 769,238 767,516 766,140 770,946Liabilities to euro area credit institutions in euro 331,855 325,234 306,532 368,906
Current accounts (covering the minimum reserve system) 243,037 236,238 189,778 218,307Deposit facility 88,815 88,995 116,751 150,597Fixed-term deposits 0 0 0 0Fine-tuning reverse operations 0 0 0 0Deposits related to margin calls 3 1 2 2
Other liabilities to euro area credit institutions in euro 207 169 154 158Debt certificates issued 0 0 0 0Liabilities to other euro area residents in euro 138,358 145,745 160,743 151,750Liabilities to non-euro area residents in euro 89,347 83,366 85,716 76,339Liabilities to euro area residents in foreign currency 2,068 3,150 3,030 3,865Liabilities to non-euro area residents in foreign currency 12,144 10,999 10,712 8,841Counterpart of special drawing rights allocated by the IMF 51,481 51,481 51,481 50,906Other liabilities 147,020 144,557 144,980 147,644Revaluation accounts 187,797 187,797 187,797 192,254Capital and reserves 72,958 72,959 72,959 72,958
Total liabilities 1,802,473 1,792,972 1,790,242 1,844,567
Source: ECB.

S 7ECB
Monthly Bulletin
October 2009
EURO AREASTATISTICS
Monetary
policy
statistics
1.2 Key ECB interest rates (levels in percentages per annum; changes in percentage points)
With effect from 1) Deposit facility Main refinancing operations Marginal lending facility
Fixed rate tenders Variable rate tenders Fixed rate Minimum bid rate
Level Change Level Level Change Level Change
1 2 3 4 5 6 71999 1 Jan. 2.00 - 3.00 - - 4.50 -
4 2) 2.75 0.75 3.00 - ... 3.25 -1.2522 2.00 -0.75 3.00 - ... 4.50 1.25
9 Apr. 1.50 -0.50 2.50 - -0.50 3.50 -1.005 Nov. 2.00 0.50 3.00 - 0.50 4.00 0.50
2000 4 Feb. 2.25 0.25 3.25 - 0.25 4.25 0.2517 Mar. 2.50 0.25 3.50 - 0.25 4.50 0.2528 Apr. 2.75 0.25 3.75 - 0.25 4.75 0.25
9 June 3.25 0.50 4.25 - 0.50 5.25 0.5028 3) 3.25 ... - 4.25 ... 5.25 ...
1 Sep. 3.50 0.25 - 4.50 0.25 5.50 0.256 Oct. 3.75 0.25 - 4.75 0.25 5.75 0.25
2001 11 May 3.50 -0.25 - 4.50 -0.25 5.50 -0.2531 Aug. 3.25 -0.25 - 4.25 -0.25 5.25 -0.2518 Sep. 2.75 -0.50 - 3.75 -0.50 4.75 -0.50
9 Nov. 2.25 -0.50 - 3.25 -0.50 4.25 -0.502002 6 Dec. 1.75 -0.50 - 2.75 -0.50 3.75 -0.502003 7 Mar. 1.50 -0.25 - 2.50 -0.25 3.50 -0.25
6 June 1.00 -0.50 - 2.00 -0.50 3.00 -0.502005 6 Dec. 1.25 0.25 - 2.25 0.25 3.25 0.252006 8 Mar. 1.50 0.25 - 2.50 0.25 3.50 0.25
15 June 1.75 0.25 - 2.75 0.25 3.75 0.259 Aug. 2.00 0.25 - 3.00 0.25 4.00 0.25
11 Oct. 2.25 0.25 - 3.25 0.25 4.25 0.2513 Dec. 2.50 0.25 - 3.50 0.25 4.50 0.25
2007 14 Mar. 2.75 0.25 - 3.75 0.25 4.75 0.2513 June 3.00 0.25 - 4.00 0.25 5.00 0.25
2008 9 July 3.25 0.25 - 4.25 0.25 5.25 0.258 Oct. 2.75 -0.50 - - - 4.75 -0.509 4) 3.25 0.50 - - - 4.25 -0.50
15 5) 3.25 ... 3.75 - -0.50 4.25 ... 12 Nov. 2.75 -0.50 3.25 - -0.50 3.75 -0.5010 Dec. 2.00 -0.75 2.50 - -0.75 3.00 -0.75
2009 21 Jan. 1.00 -1.00 2.00 - -0.50 3.00 ... 11 Mar. 0.50 -0.50 1.50 - -0.50 2.50 -0.50
8 Apr. 0.25 -0.25 1.25 - -0.25 2.25 -0.2513 May 0.25 ... 1.00 - -0.25 1.75 -0.50
Source: ECB.1) From 1 January 1999 to 9 March 2004, the date refers to the deposit and marginal lending facilities. For main refinancing operations, changes in the rate are effective from the
first operation following the date indicated. The change on 18 September 2001 was effective on that same day. From 10 March 2004 onwards, the date refers to the deposit andmarginal lending facilities and to the main refinancing operations (changes effective from the first main refinancing operation following the Governing Council discussion),unless otherwise indicated.
2) On 22 December 1998 the ECB announced that, as an exceptional measure between 4 and 21 January 1999, a narrow corridor of 50 basis points would be applied between theinterest rates for the marginal lending facility and the deposit facility, aimed at facilitating the transition to the new monetary regime by market participants.
3) On 8 June 2000 the ECB announced that, starting from the operation to be settled on 28 June 2000, the main refinancing operations of the Eurosystem would be conducted asvariable rate tenders. The minimum bid rate refers to the minimum interest rate at which counterparties may place their bids.
4) As of 9 October 2008 the ECB reduced the standing facilities corridor from 200 basis points to 100 basis points around the interest rate on the main refinancing operations.The standing facilities corridor was restored to 200 basis points as of 21 January 2009.
5) On 8 October 2008 the ECB announced that, starting from the operation to be settled on 15 October, the weekly main refinancing operations would be carried out through afixed rate tender procedure with full allotment at the interest rate on the main refinancing operations. This change overrode the previous decision (made on the same day)to cut by 50 basis points the minimum bid rate on the main refinancing operations conducted as variable rate tenders.

ECB
Monthly Bulletin
October 2009S 8
1.3 Eurosystem monetary policy operations allotted through tenders 1), 2) (EUR millions; interest rates in percentages per annum)
1. Main and longer-term refinancing operations 3), 4)
Main refinancing operations
Date of Bids Number of Allotment Fixed rate tenders Variable rate tenders Running for
settlement (amount) participants (amount) (...) daysFixed rate Minimum Marginal Weighted
bid rate rate 5) average rate
1 2 3 4 5 6 7 8
2009 10 June 302,077 604 302,077 1.00 - - - 717 309,621 670 309,621 1.00 - - - 724 167,902 530 167,902 1.00 - - - 7
1 July 105,905 405 105,905 1.00 - - - 78 106,406 397 106,406 1.00 - - - 7
15 100,294 389 100,294 1.00 - - - 722 88,272 396 88,272 1.00 - - - 729 94,780 382 94,780 1.00 - - - 7
5 Aug. 80,785 348 80,785 1.00 - - - 712 73,596 320 73,596 1.00 - - - 719 76,056 330 76,056 1.00 - - - 726 77,530 325 77,530 1.00 - - - 7
2 Sep. 72,086 286 72,086 1.00 - - - 79 93,285 311 93,285 1.00 - - - 7
16 87,800 318 87,800 1.00 - - - 723 85,004 332 85,004 1.00 - - - 730 66,767 244 66,767 1.00 - - - 7
7 Oct. 62,620 224 62,620 1.00 - - - 7Longer-term refinancing operations
2009 9 July 9,067 56 9,067 1.00 - - - 18930 9,492 68 9,492 1.00 - - - 9112 Aug. 30,686 90 30,686 1.00 - - - 2813 13,024 20 13,024 1.00 - - - 9113 11,875 53 11,875 1.00 - - - 18227 8,321 35 8,321 1.00 - - - 91
9 Sep. 10,627 45 10,627 1.00 - - - 3510 3,686 23 3,686 1.00 - - - 18210 3,161 14 3,161 1.00 - - - 91
1 Oct. 2,769 19 2,769 1.00 - - - 771 75,241 589 75,241 1.00 - - - 3648 1,128 8 1,128 1.00 - - - 988 2,368 22 2,368 1.00 - - - 182
2. Other tender operations
Date of settlement Type of Bids Number of Allotment Fixed rate Variable rate tenders Running for
operation (amount) participants (amount) tenders (...) days
Fixed rate Minimum Maximum Marginal Weightedbid rate bid rate rate 5) average rate
1 2 3 4 5 6 7 8 9 102008 3 Oct. Collection of fixed-term deposits 193,844 54 193,844 4.25 - - - - 3
6 Collection of fixed-term deposits 171,947 111 171,947 4.25 - - - - 17 Collection of fixed-term deposits 147,491 97 147,491 4.25 - - - - 19 Reverse transaction 24,682 99 24,682 3.75 - - - - 6
11 Nov. Collection of fixed-term deposits 149,656 117 79,940 - - 3.75 3.60 3.51 19 Dec. Collection of fixed-term deposits 152,655 95 137,456 - - 3.25 3.05 2.94 1
2009 20 Jan. Collection of fixed-term deposits 143,835 103 140,013 - - 2.50 2.30 2.15 110 Feb. Collection of fixed-term deposits 130,435 119 129,135 - - 2.00 1.80 1.36 110 Mar. Collection of fixed-term deposits 111,502 119 110,832 - - 2.00 1.80 1.52 1
7 Apr. Collection of fixed-term deposits 105,486 114 103,876 - - 1.50 1.30 1.12 112 May Collection of fixed-term deposits 109,091 128 108,056 - - 1.25 1.05 0.93 1
9 June Collection of fixed-term deposits 91,551 101 57,912 - - 1.00 0.80 0.77 17 July Collection of fixed-term deposits 279,477 165 275,986 - - 1.00 0.80 0.64 1
11 Aug. Collection of fixed-term deposits 238,847 159 238,345 - - 1.00 0.80 0.70 18 Sep. Collection of fixed-term deposits 196,299 157 195,099 - - 1.00 0.80 0.73 1
Source: ECB.1) The amounts shown may differ slightly from those in Section 1.1 due to operations allotted but not settled.2) With effect from April 2002, split tender operations, i.e. operations with one-week maturity conducted as standard tenders in parallel with a main refinancing operation, are
classified as main refinancing operations. For split tender operations conducted before this month, see Table 2 in Section 1.3.3) On 8 June 2000 the ECB announced that, starting from the operation to be settled on 28 June 2000, the main refinancing operations of the Eurosystem would be conducted as
variable rate tenders. The minimum bid rate refers to the minimum interest rate at which counterparties may place their bids.4) On 8 October 2008 the ECB announced that, starting from the operation to be settled on 15 October, the weekly main refinancing operations would be carried out through a
fixed rate tender procedure with full allotment at the interest rate on the main refinancing operations.5) In liquidity-providing (absorbing) operations, the marginal rate refers to the lowest (highest) rate at which bids were accepted.
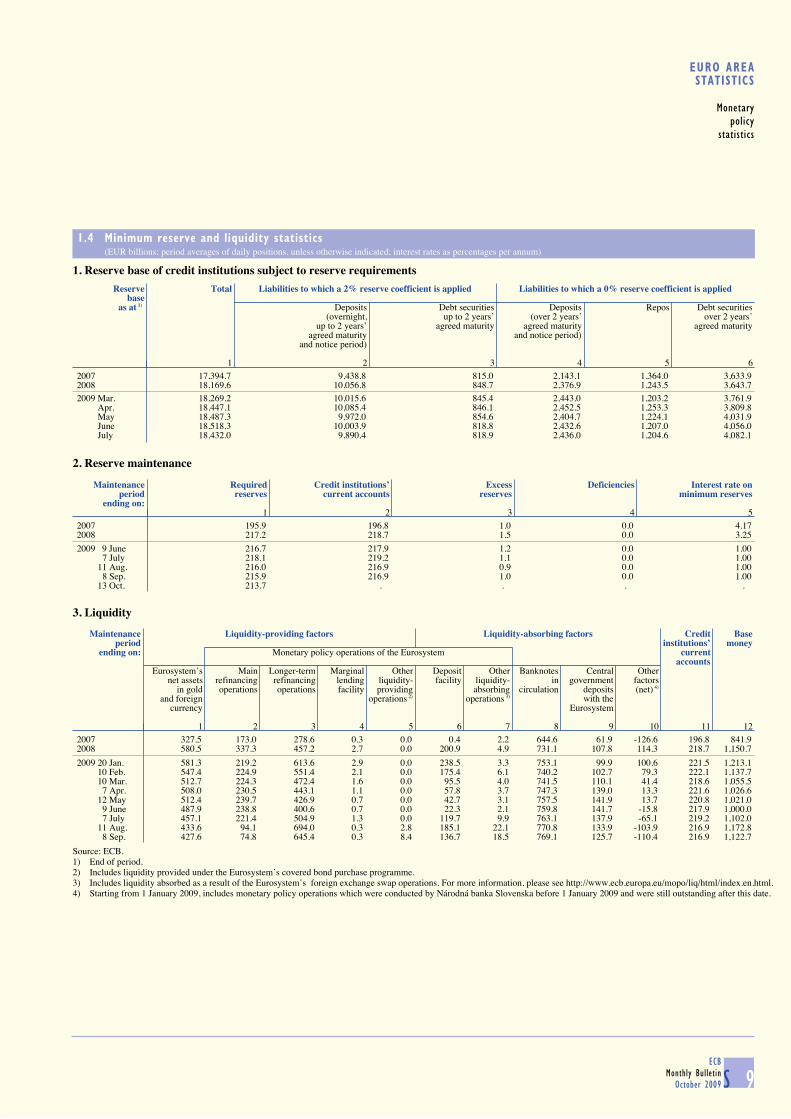
S 9ECB
Monthly Bulletin
October 2009
EURO AREASTATISTICS
Monetary
policy
statistics
1.4 Minimum reserve and liquidity statistics (EUR billions; period averages of daily positions, unless otherwise indicated; interest rates as percentages per annum)
1. Reserve base of credit institutions subject to reserve requirements
Reserve Total Liabilities to which a 2% reserve coefficient is applied Liabilities to which a 0% reserve coefficient is applied
baseas at 1) Deposits Debt securities Deposits Repos Debt securities
(overnight, up to 2 years’ (over 2 years’ over 2 years’up to 2 years’ agreed maturity agreed maturity agreed maturity
agreed maturity and notice period)and notice period)
1 2 3 4 5 62007 17,394.7 9,438.8 815.0 2,143.1 1,364.0 3,633.92008 18,169.6 10,056.8 848.7 2,376.9 1,243.5 3,643.72009 Mar. 18,269.2 10,015.6 845.4 2,443.0 1,203.2 3,761.9 Apr. 18,447.1 10,085.4 846.1 2,452.5 1,253.3 3,809.8 May 18,487.3 9,972.0 854.6 2,404.7 1,224.1 4,031.9 June 18,518.3 10,003.9 818.8 2,432.6 1,207.0 4,056.0 July 18,432.0 9,890.4 818.9 2,436.0 1,204.6 4,082.1
2. Reserve maintenance
Maintenance Required Credit institutions’ Excess Deficiencies Interest rate onperiod reserves current accounts reserves minimum reserves
ending on:1 2 3 4 5
2007 195.9 196.8 1.0 0.0 4.172008 217.2 218.7 1.5 0.0 3.25
2009 9 June 216.7 217.9 1.2 0.0 1.007 July 218.1 219.2 1.1 0.0 1.00
11 Aug. 216.0 216.9 0.9 0.0 1.008 Sep. 215.9 216.9 1.0 0.0 1.00
13 Oct. 213.7 . . . .
3. Liquidity
Maintenance Liquidity-providing factors Liquidity-absorbing factors Credit Base
period institutions’ moneyending on: Monetary policy operations of the Eurosystem current
accountsEurosystem’s Main Longer-term Marginal Other Deposit Other Banknotes Central Other
net assets refinancing refinancing lending liquidity- facility liquidity- in government factorsin gold operations operations facility providing absorbing circulation deposits (net) 4)
and foreign operations 2) operations 3) with thecurrency Eurosystem
1 2 3 4 5 6 7 8 9 10 11 122007 327.5 173.0 278.6 0.3 0.0 0.4 2.2 644.6 61.9 -126.6 196.8 841.92008 580.5 337.3 457.2 2.7 0.0 200.9 4.9 731.1 107.8 114.3 218.7 1,150.7
2009 20 Jan. 581.3 219.2 613.6 2.9 0.0 238.5 3.3 753.1 99.9 100.6 221.5 1,213.110 Feb. 547.4 224.9 551.4 2.1 0.0 175.4 6.1 740.2 102.7 79.3 222.1 1,137.710 Mar. 512.7 224.3 472.4 1.6 0.0 95.5 4.0 741.5 110.1 41.4 218.6 1,055.5
7 Apr. 508.0 230.5 443.1 1.1 0.0 57.8 3.7 747.3 139.0 13.3 221.6 1,026.612 May 512.4 239.7 426.9 0.7 0.0 42.7 3.1 757.5 141.9 13.7 220.8 1,021.0
9 June 487.9 238.8 400.6 0.7 0.0 22.3 2.1 759.8 141.7 -15.8 217.9 1,000.07 July 457.1 221.4 504.9 1.3 0.0 119.7 9.9 763.1 137.9 -65.1 219.2 1,102.0
11 Aug. 433.6 94.1 694.0 0.3 2.8 185.1 22.1 770.8 133.9 -103.9 216.9 1,172.88 Sep. 427.6 74.8 645.4 0.3 8.4 136.7 18.5 769.1 125.7 -110.4 216.9 1,122.7
Source: ECB.1) End of period.2) Includes liquidity provided under the Eurosystem’s covered bond purchase programme.3) Includes liquidity absorbed as a result of the Eurosystem’s foreign exchange swap operations. For more information, please see http://www.ecb.europa.eu/mopo/liq/html/index.en.html.4) Starting from 1 January 2009, includes monetary policy operations which were conducted by Národná banka Slovenska before 1 January 2009 and were still outstanding after this date.

ECB
Monthly Bulletin
October 2009
2
S 10
MONEY, BANKING AND INVESTMENT FUNDS
2.1 Aggregated balance sheet of euro area MFIs 1) (EUR billions; outstanding amounts at end of period)
1. Assets
Eurosystem
Total Loans to euro area residents Holdings of securities other than Money Holdings External Fixed Remaining
shares issued by euro area residents market of shares/ assets assets assetsfund other equity
Total General Other MFIs Total General Other MFIs shares/ issued bygovernment euro area government euro area units 2) euro area
residents residents residents
1 2 3 4 5 6 7 8 9 10 11 12 13 14
2007 2,046.1 1,031.7 17.8 0.6 1,013.3 268.6 225.1 1.9 41.6 - 17.4 395.3 15.2 318.02008 2,982.9 1,809.4 18.6 0.6 1,790.1 350.8 308.0 2.4 40.3 - 14.4 476.7 15.7 316.02009 Q1 2,783.6 1,555.3 18.7 0.7 1,535.9 374.1 322.7 2.5 48.9 - 13.9 490.3 15.7 334.22009 Apr. 2,710.2 1,479.4 18.1 0.7 1,460.7 378.1 326.5 2.4 49.2 - 14.7 487.5 15.8 334.7 May 2,678.1 1,452.0 18.1 0.7 1,433.2 375.6 322.9 2.5 50.2 - 15.0 488.8 15.8 330.9 June 2,893.4 1,671.5 17.7 0.7 1,653.1 385.4 327.0 2.7 55.7 - 15.0 480.8 16.4 324.4 July 2,734.4 1,500.7 17.7 0.7 1,482.4 391.8 327.8 3.0 60.9 - 15.3 483.7 16.5 326.5 Aug. (p) 2,723.6 1,451.3 17.6 0.7 1,433.1 400.6 332.2 3.3 65.2 - 15.7 518.5 16.4 321.1
MFIs excluding the Eurosystem
2007 29,448.1 16,894.2 954.5 10,139.0 5,800.8 3,890.1 1,196.9 952.9 1,740.3 93.5 1,293.8 4,886.1 205.7 2,184.72008 31,841.0 18,053.4 967.6 10,768.1 6,317.7 4,630.8 1,244.7 1,406.3 1,979.8 98.7 1,199.7 4,756.6 211.6 2,890.22009 Q1 31,746.7 17,907.6 970.7 10,810.3 6,126.7 4,920.1 1,387.3 1,446.9 2,085.8 104.1 1,185.5 4,545.2 215.1 2,869.02009 Apr. 31,862.9 17,907.6 982.4 10,806.7 6,118.5 4,993.8 1,405.1 1,473.1 2,115.6 104.0 1,217.7 4,611.1 214.0 2,814.7 May 31,528.1 17,859.4 974.7 10,804.0 6,080.7 5,042.5 1,422.0 1,477.4 2,143.2 102.6 1,214.7 4,477.2 214.5 2,617.3 June 31,818.3 18,059.4 998.5 10,834.5 6,226.3 5,075.2 1,466.5 1,488.2 2,120.5 95.5 1,198.6 4,430.2 215.2 2,744.2 July 31,717.7 17,955.8 999.3 10,799.3 6,157.2 5,101.3 1,475.8 1,486.3 2,139.1 95.3 1,205.9 4,388.1 215.8 2,755.5 Aug. (p) 31,496.9 17,786.5 1,003.5 10,731.3 6,051.7 5,100.1 1,476.5 1,488.5 2,135.1 94.8 1,213.9 4,342.1 216.0 2,743.5
2. Liabilities
Eurosystem
Total Currency Deposits of euro area residents Money Debt Capital External Remaining
in market securities and liabilities liabilitiescirculation Total Central Other general MFIs fund issued 4) reserves
government government/ shares/other euro units 3)
area residents
1 2 3 4 5 6 7 8 9 10 11
2007 2,046.1 697.0 714.7 23.9 19.1 671.8 - 0.1 238.0 119.2 277.12008 2,982.9 784.7 1,217.5 68.8 16.6 1,132.1 - 0.1 274.0 383.3 323.42009 Q1 2,783.6 768.9 1,114.9 135.6 23.3 956.0 - 0.1 296.4 301.6 301.82009 Apr. 2,710.2 781.0 1,046.9 140.3 21.5 885.1 - 0.1 293.2 274.9 314.1 May 2,678.1 783.4 1,053.1 137.2 19.0 897.0 - 0.1 291.5 249.0 300.9 June 2,893.4 785.9 1,257.5 125.1 23.6 1,108.7 - 0.1 283.3 208.0 358.6 July 2,734.4 795.1 1,106.7 128.2 20.2 958.2 - 0.1 286.7 192.5 353.4 Aug. (p) 2,723.6 790.0 1,097.0 124.0 21.7 951.3 - 0.1 288.6 224.8 323.2
MFIs excluding the Eurosystem
2007 29,448.1 - 15,098.2 126.9 8,885.4 6,085.8 754.1 4,631.0 1,683.6 4,533.7 2,747.42008 31,841.0 - 16,759.8 190.8 9,710.5 6,858.5 825.4 4,848.3 1,767.5 4,396.0 3,244.02009 Q1 31,746.7 - 16,608.2 216.2 9,785.4 6,606.6 885.2 4,936.1 1,778.3 4,344.4 3,194.42009 Apr. 31,862.9 - 16,646.0 197.2 9,870.7 6,578.1 886.1 4,976.7 1,790.6 4,399.9 3,163.6 May 31,528.1 - 16,567.9 194.4 9,877.2 6,496.3 874.5 5,000.4 1,803.3 4,268.4 3,013.7 June 31,818.3 - 16,787.6 227.5 9,931.3 6,628.8 837.3 4,984.1 1,826.4 4,232.3 3,150.5 July 31,717.7 - 16,623.0 170.2 9,902.5 6,550.3 853.5 5,008.2 1,842.7 4,193.2 3,197.0 Aug. (p) 31,496.9 - 16,459.3 149.2 9,883.3 6,426.7 854.4 5,000.3 1,863.3 4,132.4 3,187.2
Source: ECB.1) Data refer to the changing composition of the euro area. For further information, see the General notes.2) Amounts issued by euro area residents. Amounts issued by non-euro area residents are included in external assets.3) Amounts held by euro area residents.4) Amounts issued with maturity up to two years held by non-euro area residents are included in external liabilities.

S 11ECB
Monthly Bulletin
October 2009
EURO AREASTATISTICS
Money, banking
and investment
funds
2.2 Consolidated balance sheet of euro area MFIs 1) (EUR billions; outstanding amounts at end of period; transactions during period)
1. Assets
Outstanding amounts
Total Loans to euro area residents Holdings of securities other than shares Holdings External Fixed Remaining
issued by euro area residents of shares/ assets assets assetsother equity
Total General Other Total General Other issued bygovernment euro area government euro area other euro area
residents residents residents
1 2 3 4 5 6 7 8 9 10 11
2007 22,317.5 11,111.9 972.3 10,139.6 2,376.9 1,422.0 954.9 882.2 5,281.4 220.9 2,444.32008 24,107.9 11,755.0 986.2 10,768.8 2,961.5 1,552.7 1,408.8 786.3 5,233.4 227.3 3,144.42009 Q1 24,150.3 11,800.3 989.4 10,810.9 3,159.5 1,710.1 1,449.4 770.0 5,035.5 230.8 3,154.32009 Apr. 24,236.3 11,807.9 1,000.5 10,807.4 3,207.0 1,731.6 1,475.4 795.5 5,098.5 229.8 3,097.7 May 23,908.2 11,797.4 992.8 10,804.6 3,224.8 1,744.9 1,479.9 792.9 4,966.0 230.2 2,896.8 June 24,075.2 11,851.4 1,016.2 10,835.2 3,284.4 1,793.5 1,491.0 779.3 4,911.0 231.6 3,017.6 July 24,023.8 11,816.9 1,017.0 10,799.9 3,293.0 1,803.6 1,489.4 777.4 4,871.8 232.3 3,032.4 Aug. (p) 23,936.1 11,753.0 1,021.1 10,731.9 3,300.5 1,808.7 1,491.8 773.9 4,860.6 232.4 3,015.8
Transactions
2007 2,574.0 1,014.8 -9.9 1,024.7 232.2 -46.3 278.5 55.5 807.6 -0.5 464.42008 1,561.5 601.1 12.5 588.6 373.1 58.2 314.9 -56.0 -72.1 -2.1 716.82009 Q1 -142.0 6.3 2.1 4.2 178.9 141.9 37.0 -4.5 -276.2 2.1 -48.5 Q2 -229.3 72.2 27.3 44.9 136.5 89.6 46.9 4.5 -66.4 0.6 -377.62009 Apr. 60.0 6.8 11.3 -4.5 48.2 21.2 27.0 21.2 42.4 -1.1 -57.5 May -219.1 6.6 -7.4 14.0 29.0 20.7 8.2 -3.3 -50.8 0.4 -202.0 June -70.2 58.8 23.4 35.4 59.4 47.7 11.6 -13.4 -58.0 1.3 -118.2 July -55.0 -27.7 0.8 -28.5 3.1 6.1 -3.0 -6.1 -38.8 1.0 13.5 Aug. (p) -60.4 -60.8 4.1 -64.9 4.7 3.5 1.3 -6.5 20.5 0.1 -15.9
2. Liabilities
Outstanding amounts
Total Currency in Deposits of Deposits of Money market Debt Capital External Remaining Excesscirculation central other general fund shares/ securities and liabilities liabilities of inter-
government government/ units 2) issued 3) reserves MFIother euro area liabilities
residents
1 2 3 4 5 6 7 8 9 10
2007 22,317.5 638.6 150.8 8,904.5 660.4 2,849.3 1,492.7 4,652.9 3,024.5 -56.52008 24,107.9 722.9 259.6 9,727.2 726.3 2,828.3 1,613.8 4,779.3 3,567.3 -117.22009 Q1 24,150.3 719.9 351.8 9,808.7 780.8 2,801.4 1,645.2 4,646.0 3,496.2 -100.02009 Apr. 24,236.3 729.2 337.5 9,892.2 781.8 2,811.9 1,646.9 4,674.8 3,477.7 -116.0 May 23,908.2 732.0 331.5 9,896.2 771.6 2,807.1 1,658.1 4,517.4 3,314.5 -120.7 June 24,075.2 735.0 352.7 9,954.9 741.6 2,808.0 1,675.3 4,440.4 3,509.0 -141.9 July 24,023.8 745.5 298.4 9,922.7 758.0 2,808.2 1,685.6 4,385.7 3,550.4 -131.0 Aug. (p) 23,936.1 741.2 273.2 9,905.1 759.3 2,800.1 1,696.2 4,357.2 3,510.4 -106.8
Transactions
2007 2,574.0 45.8 -13.4 838.8 54.5 269.7 150.1 824.2 474.5 -70.52008 1,561.5 83.2 106.1 606.8 29.8 -27.3 142.6 86.7 559.5 -26.02009 Q1 -142.0 -4.3 89.3 25.6 55.8 -37.4 17.2 -200.3 -107.3 19.5 Q2 -229.3 15.0 0.9 154.8 -20.1 21.3 34.0 -167.2 -223.3 -44.62009 Apr. 60.0 9.3 -14.0 80.5 2.3 5.5 4.5 7.6 -20.3 -15.4 May -219.1 2.8 -5.9 16.5 0.6 15.0 12.2 -82.5 -166.5 -11.2 June -70.2 3.0 20.8 57.8 -23.1 0.8 17.3 -92.4 -36.4 -18.0 July -55.0 10.5 -54.2 -31.9 16.1 -1.7 6.5 -52.1 35.1 16.8 Aug. (p) -60.4 -4.3 -13.8 -15.2 1.1 -2.0 4.6 -8.8 -43.7 21.7
Source: ECB.1) Data refer to the changing composition of the euro area. For further information, see the General notes.2) Amounts held by euro area residents.3) Amounts issued with maturity up to two years held by non-euro area residents are included in external liabilities.
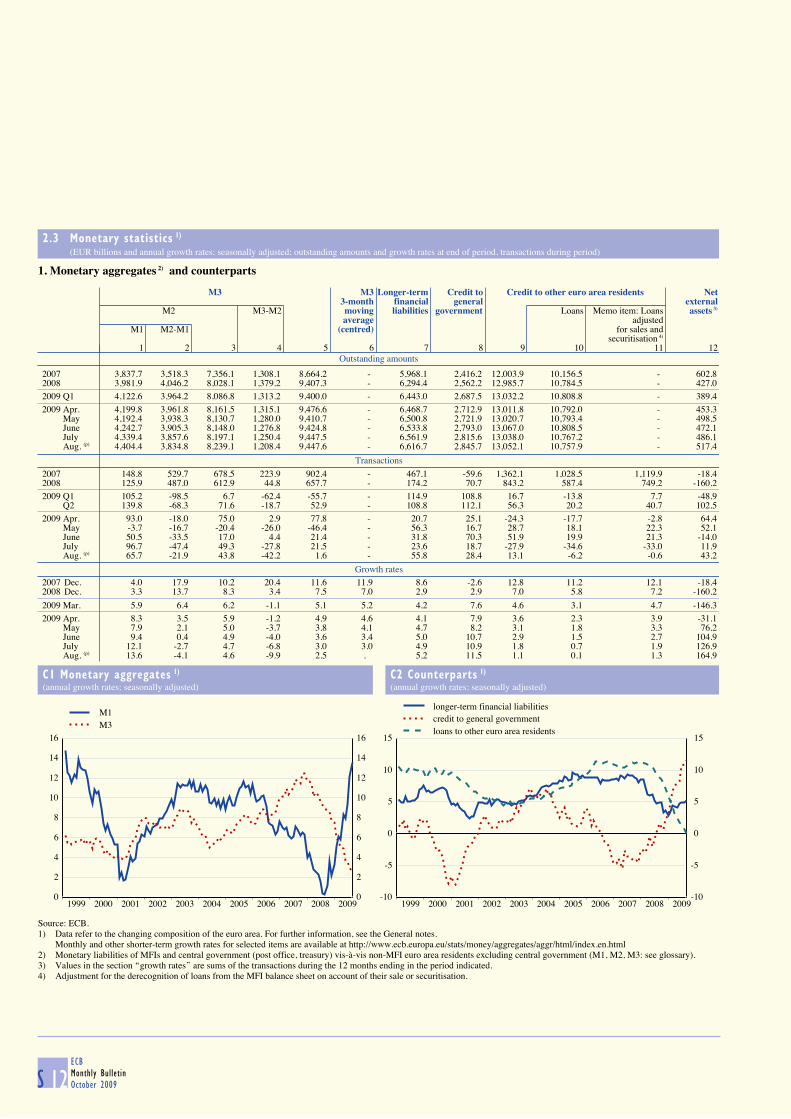
ECB
Monthly Bulletin
October 2009S 12
2.3 Monetary statistics 1) (EUR billions and annual growth rates; seasonally adjusted; outstanding amounts and growth rates at end of period, transactions during period)
1. Monetary aggregates 2) and counterparts
Outstanding amounts
M3 M3 Longer-term Credit to Credit to other euro area residents Net
3-month financial general external M2 M3-M2 moving liabilities government Loans Memo item: Loans assets 3)
average adjustedM1 M2-M1 (centred) for sales and
securitisation 4)
1 2 3 4 5 6 7 8 9 10 11 12
2007 3,837.7 3,518.3 7,356.1 1,308.1 8,664.2 - 5,968.1 2,416.2 12,003.9 10,156.5 - 602.82008 3,981.9 4,046.2 8,028.1 1,379.2 9,407.3 - 6,294.4 2,562.2 12,985.7 10,784.5 - 427.02009 Q1 4,122.6 3,964.2 8,086.8 1,313.2 9,400.0 - 6,443.0 2,687.5 13,032.2 10,808.8 - 389.42009 Apr. 4,199.8 3,961.8 8,161.5 1,315.1 9,476.6 - 6,468.7 2,712.9 13,011.8 10,792.0 - 453.3 May 4,192.4 3,938.3 8,130.7 1,280.0 9,410.7 - 6,500.8 2,721.9 13,020.7 10,793.4 - 498.5 June 4,242.7 3,905.3 8,148.0 1,276.8 9,424.8 - 6,533.8 2,793.0 13,067.0 10,808.5 - 472.1 July 4,339.4 3,857.6 8,197.1 1,250.4 9,447.5 - 6,561.9 2,815.6 13,038.0 10,767.2 - 486.1 Aug. (p) 4,404.4 3,834.8 8,239.1 1,208.4 9,447.6 - 6,616.7 2,845.7 13,052.1 10,757.9 - 517.4
Transactions
2007 148.8 529.7 678.5 223.9 902.4 - 467.1 -59.6 1,362.1 1,028.5 1,119.9 -18.42008 125.9 487.0 612.9 44.8 657.7 - 174.2 70.7 843.2 587.4 749.2 -160.22009 Q1 105.2 -98.5 6.7 -62.4 -55.7 - 114.9 108.8 16.7 -13.8 7.7 -48.9 Q2 139.8 -68.3 71.6 -18.7 52.9 - 108.8 112.1 56.3 20.2 40.7 102.52009 Apr. 93.0 -18.0 75.0 2.9 77.8 - 20.7 25.1 -24.3 -17.7 -2.8 64.4 May -3.7 -16.7 -20.4 -26.0 -46.4 - 56.3 16.7 28.7 18.1 22.3 52.1 June 50.5 -33.5 17.0 4.4 21.4 - 31.8 70.3 51.9 19.9 21.3 -14.0 July 96.7 -47.4 49.3 -27.8 21.5 - 23.6 18.7 -27.9 -34.6 -33.0 11.9 Aug. (p) 65.7 -21.9 43.8 -42.2 1.6 - 55.8 28.4 13.1 -6.2 -0.6 43.2
Growth rates
2007 Dec. 4.0 17.9 10.2 20.4 11.6 11.9 8.6 -2.6 12.8 11.2 12.1 -18.42008 Dec. 3.3 13.7 8.3 3.4 7.5 7.0 2.9 2.9 7.0 5.8 7.2 -160.2
2009 Mar. 5.9 6.4 6.2 -1.1 5.1 5.2 4.2 7.6 4.6 3.1 4.7 -146.3
2009 Apr. 8.3 3.5 5.9 -1.2 4.9 4.6 4.1 7.9 3.6 2.3 3.9 -31.1 May 7.9 2.1 5.0 -3.7 3.8 4.1 4.7 8.2 3.1 1.8 3.3 76.2 June 9.4 0.4 4.9 -4.0 3.6 3.4 5.0 10.7 2.9 1.5 2.7 104.9 July 12.1 -2.7 4.7 -6.8 3.0 3.0 4.9 10.9 1.8 0.7 1.9 126.9 Aug. (p) 13.6 -4.1 4.6 -9.9 2.5 . 5.2 11.5 1.1 0.1 1.3 164.9
C1 Monetary aggregates 1)
(annual growth rates; seasonally adjusted)
C2 Counterparts 1)
(annual growth rates; seasonally adjusted)
0
2
4
6
8
10
12
14
16
1999 2000 2001 2002 2003 2004 2005 2006 2007 2008 20090
2
4
6
8
10
12
14
16
M1M3
-10
-5
0
5
10
15
1999 2000 2001 2002 2003 2004 2005 2006 2007 2008 2009-10
-5
0
5
10
15
longer-term financial liabilitiescredit to general governmentloans to other euro area residents
Source: ECB.1) Data refer to the changing composition of the euro area. For further information, see the General notes.
Monthly and other shorter-term growth rates for selected items are available at http://www.ecb.europa.eu/stats/money/aggregates/aggr/html/index.en.html2) Monetary liabilities of MFIs and central government (post office, treasury) vis-à-vis non-MFI euro area residents excluding central government (M1, M2, M3: see glossary).3) Values in the section ‘‘growth rates’’ are sums of the transactions during the 12 months ending in the period indicated.4) Adjustment for the derecognition of loans from the MFI balance sheet on account of their sale or securitisation.

S 13ECB
Monthly Bulletin
October 2009
EURO AREASTATISTICS
Money, banking
and investment
funds
2.3 Monetary statistics 1) (EUR billions and annual growth rates; seasonally adjusted; outstanding amounts and growth rates at end of period, transactions during period)
2. Components of monetary aggregates and longer-term financial liabilities
Outstanding amounts
Currency in Overnight Deposits Deposits Repos Money Debt Debt Deposits Deposits Capitalcirculation deposits with agreed redeemable market securities securities redeemable with agreed and
maturity up at notice up fund up to over at notice maturity reservesto 2 years to 3 months shares/units 2 years 2 years over 3 months over 2 years
1 2 3 4 5 6 7 8 9 10 11
2007 625.6 3,212.2 1,977.3 1,541.1 307.3 686.2 314.6 2,547.4 119.3 1,814.8 1,486.62008 709.9 3,272.0 2,478.8 1,567.4 354.1 756.2 268.9 2,573.1 121.2 1,992.8 1,607.22009 Q1 727.5 3,395.2 2,321.7 1,642.5 336.1 780.4 196.6 2,605.6 124.2 2,073.6 1,639.52009 Apr. 729.8 3,470.0 2,294.3 1,667.5 337.1 770.3 207.7 2,603.8 125.9 2,090.1 1,648.9 May 730.0 3,462.4 2,257.6 1,680.7 326.1 753.1 200.8 2,599.5 128.2 2,100.1 1,673.1 June 734.2 3,508.5 2,208.9 1,696.3 355.1 738.2 183.5 2,608.6 129.4 2,115.4 1,680.4 July 733.6 3,605.8 2,134.6 1,723.0 331.0 745.0 174.4 2,619.2 130.9 2,130.3 1,681.4 Aug. (p) 742.8 3,661.6 2,090.9 1,743.9 306.3 746.9 155.2 2,637.9 132.2 2,145.7 1,700.9
Transactions
2007 46.7 102.1 582.3 -52.5 42.2 58.7 123.0 147.5 9.7 160.4 149.52008 83.3 42.6 467.2 19.8 48.1 33.2 -36.5 10.8 0.6 20.8 142.12009 Q1 16.2 89.1 -173.3 74.8 -18.0 25.6 -69.9 19.3 2.2 75.3 18.1 Q2 6.8 133.1 -122.9 54.6 19.2 -23.4 -14.5 18.9 4.5 40.6 44.82009 Apr. 2.3 90.7 -43.7 25.7 0.9 -8.8 10.7 -6.4 1.0 14.0 12.2 May 0.2 -3.9 -30.0 13.3 -10.8 -6.7 -8.6 17.1 2.2 11.8 25.1 June 4.2 46.3 -49.2 15.6 29.0 -7.9 -16.6 8.2 1.2 14.8 7.5 July -0.6 97.3 -74.2 26.8 -24.1 6.5 -10.2 9.9 1.5 15.0 -2.8 Aug. (p) 9.2 56.6 -42.8 20.9 -24.6 1.7 -19.3 24.8 1.3 16.1 13.5
Growth rates
2007 Dec. 8.1 3.3 41.3 -3.4 15.8 9.2 63.4 6.2 9.5 9.7 11.42008 Dec. 13.3 1.3 23.4 1.3 15.6 4.8 -12.1 0.4 0.5 1.1 9.7
2009 Mar. 13.8 4.3 6.4 6.6 8.0 4.1 -26.7 0.8 3.7 4.9 9.1
2009 Apr. 13.2 7.4 0.5 8.0 3.6 3.2 -20.1 0.2 5.1 5.5 9.1 May 13.1 6.9 -2.7 9.4 1.9 2.7 -27.5 0.4 7.7 5.6 10.5 June 12.8 8.7 -6.1 10.4 5.4 2.7 -33.6 0.4 9.3 6.1 10.8 July 12.5 12.1 -12.1 12.3 -3.3 3.7 -38.6 0.1 10.9 6.9 10.1 Aug. (p) 13.2 13.6 -15.1 13.7 -8.5 1.9 -43.9 0.8 12.8 7.4 9.5
C3 Components of monetary aggregates 1) (annual growth rates; seasonally adjusted)
C4 Components of longer-term financial liabilities 1) (annual growth rates; seasonally adjusted)
-40
-20
0
20
40
60
1999 2000 2001 2002 2003 2004 2005 2006 2007 2008 2009-40
-20
0
20
40
60
currency in circulationovernight depositsdeposits redeemable at notice up to 3 months
-5
0
5
10
15
20
1999 2000 2001 2002 2003 2004 2005 2006 2007 2008 2009-5
0
5
10
15
20
debt securities over 2 yearsdeposits with agreed maturity over 2 yearscapital and reserves
Source: ECB.1) Data refer to the changing composition of the euro area. For further information, see the General notes.
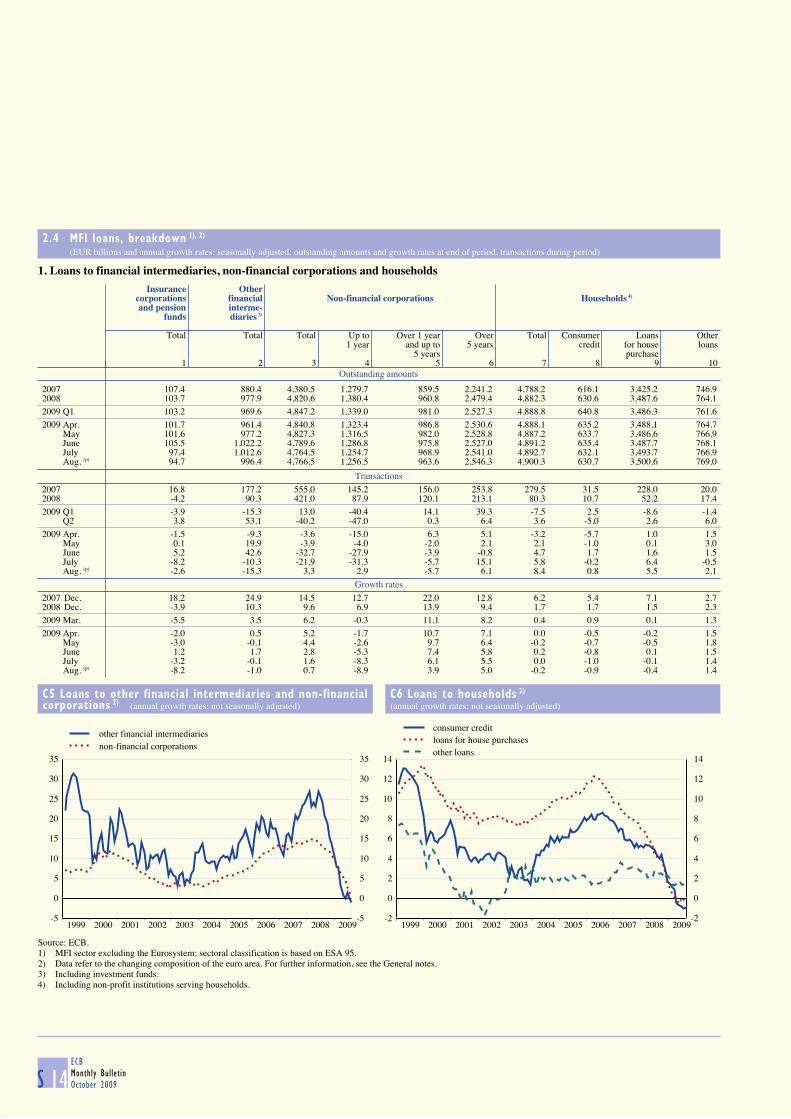
S 14ECB
Monthly Bulletin
October 2009
2.4 MFI loans, breakdown 1), 2) (EUR billions and annual growth rates; seasonally adjusted; outstanding amounts and growth rates at end of period, transactions during period)
1. Loans to financial intermediaries, non-financial corporations and households
Outstanding amounts
Insurance Other
corporations financial Non-financial corporations Households 4) and pension interme-
funds diaries 3)
Total Total Total Up to Over 1 year Over Total Consumer Loans Other1 year and up to 5 years credit for house loans
5 years purchase1 2 3 4 5 6 7 8 9 10
2007 107.4 880.4 4,380.5 1,279.7 859.5 2,241.2 4,788.2 616.1 3,425.2 746.92008 103.7 977.9 4,820.6 1,380.4 960.8 2,479.4 4,882.3 630.6 3,487.6 764.12009 Q1 103.2 969.6 4,847.2 1,339.0 981.0 2,527.3 4,888.8 640.8 3,486.3 761.62009 Apr. 101.7 961.4 4,840.8 1,323.4 986.8 2,530.6 4,888.1 635.2 3,488.1 764.7 May 101.6 977.2 4,827.3 1,316.5 982.0 2,528.8 4,887.2 633.7 3,486.6 766.9 June 105.5 1,022.2 4,789.6 1,286.8 975.8 2,527.0 4,891.2 635.4 3,487.7 768.1 July 97.4 1,012.6 4,764.5 1,254.7 968.9 2,541.0 4,892.7 632.1 3,493.7 766.9 Aug. (p) 94.7 996.4 4,766.5 1,256.5 963.6 2,546.3 4,900.3 630.7 3,500.6 769.0
Transactions
2007 16.8 177.2 555.0 145.2 156.0 253.8 279.5 31.5 228.0 20.02008 -4.2 90.3 421.0 87.9 120.1 213.1 80.3 10.7 52.2 17.42009 Q1 -3.9 -15.3 13.0 -40.4 14.1 39.3 -7.5 2.5 -8.6 -1.4 Q2 3.8 53.1 -40.2 -47.0 0.3 6.4 3.6 -5.0 2.6 6.02009 Apr. -1.5 -9.3 -3.6 -15.0 6.3 5.1 -3.2 -5.7 1.0 1.5 May 0.1 19.9 -3.9 -4.0 -2.0 2.1 2.1 -1.0 0.1 3.0 June 5.2 42.6 -32.7 -27.9 -3.9 -0.8 4.7 1.7 1.6 1.5 July -8.2 -10.3 -21.9 -31.3 -5.7 15.1 5.8 -0.2 6.4 -0.5 Aug. (p) -2.6 -15.3 3.3 2.9 -5.7 6.1 8.4 0.8 5.5 2.1
Growth rates
2007 Dec. 18.2 24.9 14.5 12.7 22.0 12.8 6.2 5.4 7.1 2.72008 Dec. -3.9 10.3 9.6 6.9 13.9 9.4 1.7 1.7 1.5 2.32009 Mar. -5.5 3.5 6.2 -0.3 11.1 8.2 0.4 0.9 0.1 1.32009 Apr. -2.0 0.5 5.2 -1.7 10.7 7.1 0.0 -0.5 -0.2 1.5 May -3.0 -0.1 4.4 -2.6 9.7 6.4 -0.2 -0.7 -0.5 1.8 June 1.2 1.7 2.8 -5.3 7.4 5.8 0.2 -0.8 0.1 1.5 July -3.2 -0.1 1.6 -8.3 6.1 5.5 0.0 -1.0 -0.1 1.4 Aug. (p) -8.2 -1.0 0.7 -8.9 3.9 5.0 -0.2 -0.9 -0.4 1.4
C5 Loans to other financial intermediaries and non-financialcorporations 2) (annual growth rates; not seasonally adjusted)
C6 Loans to households 2) (annual growth rates; not seasonally adjusted)
-5
0
5
10
15
20
25
30
35
1999 2000 2001 2002 2003 2004 2005 2006 2007 2008 2009-5
0
5
10
15
20
25
30
35
other financial intermediariesnon-financial corporations
-2
0
2
4
6
8
10
12
14
1999 2000 2001 2002 2003 2004 2005 2006 2007 2008 2009-2
0
2
4
6
8
10
12
14
consumer creditloans for house purchasesother loans
Source: ECB.1) MFI sector excluding the Eurosystem; sectoral classification is based on ESA 95.2) Data refer to the changing composition of the euro area. For further information, see the General notes.3) Including investment funds.4) Including non-profit institutions serving households.

S 15ECB
Monthly Bulletin
October 2009
EURO AREASTATISTICS
Money, banking
and investment
funds
2.4 MFI loans, breakdown 1), 2) (EUR billions and annual growth rates; not seasonally adjusted; outstanding amounts and growth rates at end of period, transactions during period)
2. Loans to financial intermediaries and non-financial corporations
Outstanding amounts
Insurance corporations and pension funds Other financial intermediaries 3) Non-financial corporations
Total Up to Over 1 year Over Total Up to Over 1 year Over Total Up to Over 1 year Over1 year and up to 5 years 1 year and up to 5 years 1 year and up to 5 years
5 years 5 years 5 years1 2 3 4 5 6 7 8 9 10 11 12
2008 92.3 68.5 5.7 18.0 960.5 553.9 168.8 237.8 4,827.0 1,378.3 960.6 2,488.12009 Q1 102.1 75.7 6.2 20.2 986.1 568.6 180.0 237.5 4,843.0 1,336.2 981.4 2,525.3
2009 May 105.7 78.9 5.7 21.0 993.3 575.7 179.4 238.3 4,826.3 1,312.4 982.8 2,531.2 June 108.3 83.1 7.5 17.7 1,022.8 597.8 183.0 242.1 4,804.2 1,300.8 975.9 2,527.5 July 101.2 76.2 7.4 17.7 1,009.4 576.6 186.1 246.7 4,785.7 1,268.9 972.1 2,544.7 Aug. (p) 94.6 69.6 7.9 17.2 981.8 552.2 182.5 247.1 4,753.1 1,244.7 963.0 2,545.4
Transactions
2007 15.0 16.7 -5.2 3.5 175.0 113.4 34.1 27.5 555.7 144.9 156.1 254.72008 -3.8 -2.9 -1.8 0.9 91.1 27.2 21.5 42.4 421.7 87.6 120.1 213.92009 Q1 6.5 5.8 0.6 0.1 18.6 10.0 11.1 -2.6 2.3 -41.1 14.8 28.6 Q2 7.7 7.5 1.3 -1.1 37.3 31.3 1.7 4.3 -21.3 -30.2 0.0 8.9
2009 May 2.1 1.8 0.0 0.4 13.9 15.4 -0.2 -1.2 -8.5 -12.9 -0.8 5.2 June 4.0 4.1 1.9 -2.0 27.1 22.7 1.9 2.5 -17.0 -9.7 -4.6 -2.7 July -7.1 -6.9 -0.2 0.0 -14.2 -21.5 2.9 4.5 -15.4 -31.1 -2.6 18.3 Aug. (p) -6.6 -6.6 0.5 -0.5 -26.7 -23.2 -4.2 0.7 -31.2 -23.2 -9.5 1.5
Growth rates
2008 Dec. -3.9 -4.0 -23.7 5.0 10.6 5.4 14.6 22.1 9.6 6.8 13.9 9.42009 Mar. -5.2 -7.2 -18.0 10.4 3.4 -5.3 19.6 17.3 6.3 -0.3 11.1 8.22009 May -3.2 -4.4 -22.7 11.2 -0.1 -9.2 16.7 15.8 4.4 -2.6 9.7 6.4 June 1.3 1.5 -1.1 3.2 1.6 -4.7 13.3 11.6 2.8 -5.3 7.4 5.8 July -3.2 -5.5 16.3 1.6 0.0 -6.1 12.6 7.8 1.6 -8.3 6.1 5.5 Aug. (p) -8.2 -11.3 19.5 -3.3 -1.0 -7.1 9.6 7.5 0.8 -8.9 3.9 5.0
3. Loans to households 4)
Outstanding amounts
Total Consumer credit Loans for house purchase Other loans
Total Up to Over 1 year Over Total Up to Over 1 year Over Total Up to Over 1 year Over1 year and up to 5 years 1 year and up to 5 years 1 year and up to 5 years
5 years 5 years 5 years1 2 3 4 5 6 7 8 9 10 11 12 13
2008 4,888.4 632.8 138.8 196.1 298.0 3,490.3 17.2 67.5 3,405.7 765.2 155.0 90.5 519.62009 Q1 4,879.1 637.8 136.3 199.9 301.7 3,480.9 16.3 65.6 3,399.0 760.4 150.7 88.7 521.0
2009 May 4,878.6 632.4 133.3 197.6 301.4 3,481.6 16.2 65.4 3,400.0 764.7 147.2 88.9 528.6 June 4,899.1 638.9 136.0 199.0 303.9 3,487.6 16.1 65.8 3,405.6 772.7 154.0 88.4 530.3 July 4,903.0 635.8 134.7 198.4 302.7 3,499.5 16.1 65.9 3,417.5 767.7 146.8 88.8 532.1 Aug. (p) 4,901.8 631.2 133.5 196.7 301.0 3,502.7 16.1 66.0 3,420.7 767.8 146.0 88.2 533.6
Transactions
2007 278.9 31.5 3.8 1.1 26.6 227.4 0.9 2.3 224.1 20.1 1.7 4.4 14.02008 79.6 10.7 1.1 -9.1 18.6 51.6 1.1 -3.8 54.3 17.4 2.5 -5.3 20.22009 Q1 -23.2 -2.7 -2.4 -2.1 1.8 -16.8 -0.9 -3.3 -12.5 -3.7 -4.2 -1.5 2.1 Q2 21.2 1.4 0.0 -0.6 2.0 7.9 -0.5 0.2 8.1 11.9 3.7 0.0 8.2
2009 May 6.4 -0.6 -1.1 -0.3 0.8 3.7 0.0 -0.1 3.8 3.3 -0.7 0.0 4.0 June 21.3 6.4 2.9 1.4 2.2 6.5 -0.1 0.5 6.1 8.3 6.9 -0.3 1.7 July 8.2 0.1 -1.1 0.5 0.7 12.4 0.0 0.1 12.2 -4.3 -7.1 0.4 2.4 Aug. (p) -0.4 -2.3 -0.9 -1.6 0.1 1.8 -0.1 0.0 1.9 0.2 -0.8 -0.5 1.5
Growth rates
2008 Dec. 1.7 1.7 0.8 -4.4 6.7 1.5 7.0 -5.2 1.6 2.3 1.7 -5.1 4.12009 Mar. 0.4 0.9 0.2 -4.5 5.1 0.1 1.0 -9.0 0.3 1.3 -0.2 -7.2 3.52009 May -0.1 -0.7 -1.8 -6.0 3.7 -0.5 0.1 -9.2 -0.3 1.8 -0.7 -4.8 3.9 June 0.2 -0.8 -2.2 -5.3 3.1 0.1 -0.3 -8.7 0.3 1.5 -1.9 -5.5 3.8 July 0.0 -1.0 -2.6 -4.9 2.5 -0.1 0.2 -8.7 0.0 1.4 -2.7 -4.9 3.8 Aug. (p) -0.2 -0.9 -1.9 -5.3 2.5 -0.4 -1.0 -8.4 -0.2 1.4 -3.1 -4.3 3.8
Source: ECB.1) MFI sector excluding the Eurosystem; sectoral classification is based on ESA 95.2) Data refer to the changing composition of the euro area. For further information, see the General notes.3) Including investment funds.4) Including non-profit institutions serving households.

S 16ECB
Monthly Bulletin
October 2009
2.4 MFI loans, breakdown 1), 2) (EUR billions and annual growth rates; not seasonally adjusted; outstanding amounts and growth rates at end of period, transactions during period)
4. Loans to government and non-euro area residents
Outstanding amounts
General government Non-euro area residents
Total Central Other general government Total Banks 3) Non-banks
governmentState Local Social Total General Other
government government security governmentfunds
1 2 3 4 5 6 7 8 9 10
2006 809.0 104.0 232.5 446.6 25.8 2,931.8 2,070.6 861.2 63.1 798.12007 954.5 213.4 217.6 494.0 29.4 3,307.6 2,352.4 955.1 59.8 895.32008 Q3 978.8 225.6 210.0 497.8 45.4 3,525.7 2,461.8 1,063.9 61.8 1,002.0 Q4 967.6 226.9 210.1 508.4 22.2 3,250.1 2,284.6 965.5 57.8 907.72009 Q1 970.7 232.8 205.6 511.3 21.0 3,056.6 2,100.4 956.2 59.2 896.9 Q2 (p) 998.5 249.1 206.5 520.6 22.3 2,954.3 2,018.1 935.7 57.4 878.3
Transactions
2007 -8.0 -4.5 -13.0 6.0 3.6 541.6 382.1 159.5 0.3 159.22008 13.3 12.3 -8.1 16.3 -7.2 -51.7 -82.8 30.9 0.6 30.32008 Q3 4.5 4.9 -5.2 1.4 3.4 90.8 73.5 17.3 -3.2 20.5 Q4 -9.4 1.1 -0.2 12.8 -23.2 -256.3 -182.5 -73.9 -0.7 -73.22009 Q1 2.0 5.5 -4.4 2.3 -1.2 -236.8 -211.7 -25.3 0.3 -25.6 Q2 (p) 28.3 16.7 0.9 9.4 1.3 -65.0 -59.1 -6.1 -0.7 -5.4
Growth rates
2006 Dec. -1.6 -14.0 -5.8 5.2 -11.6 21.9 24.0 17.2 -0.1 18.92007 Dec. -1.0 -4.3 -5.6 1.3 13.8 18.6 18.6 18.8 0.5 20.3
2008 Sep. 3.4 13.2 -1.9 2.7 9.6 8.0 5.2 15.0 1.8 15.9 Dec. 1.4 5.8 -3.7 3.3 -24.4 -1.5 -3.5 3.3 0.9 3.52009 Mar. 1.5 10.0 -3.6 3.6 -43.5 -14.2 -16.7 -8.3 -3.3 -8.6 June (p) 2.6 12.7 -4.1 5.2 -46.9 -13.6 -15.8 -8.4 -6.8 -8.5
C7 Loans to government 2) (annual growth rates; not seasonally adjusted)
C8 Loans to non-euro area residents 2) (annual growth rates; not seasonally adjusted)
-20
-15
-10
-5
0
5
10
15
1999 2000 2001 2002 2003 2004 2005 2006 2007 2008-20
-15
-10
-5
0
5
10
15
central governmentother general government
-20
-10
0
10
20
30
40
1999 2000 2001 2002 2003 2004 2005 2006 2007 2008-20
-10
0
10
20
30
40
non-resident banksnon-resident non-banks
Source: ECB.1) MFI sector excluding the Eurosystem; sectoral classification is based on ESA 95.2) Data refer to the changing composition of the euro area. For further information, see the General notes.3) The term ‘‘banks’’ is used in this table to indicate institutions of a similar type to MFIs resident outside the euro area.

S 17ECB
Monthly Bulletin
October 2009
EURO AREASTATISTICS
Money, banking
and investment
funds
2.5 Deposits held with MFIs, breakdown 1), 2) (EUR billions and annual growth rates; outstanding amounts and growth rates at end of period, transactions during period)
1. Deposits by financial intermediaries
Outstanding amounts
Insurance corporations and pension funds Other financial intermediaries 3)
Total Overnight With agreed maturity Redeemable at notice Repos Total Overnight With agreed maturity Redeemable at notice Repos
Up to Over 2 Up to Over Up to Over Up to Over2 years years 3 months 3 months 2 years 2 years 3 months 3 months
1 2 3 4 5 6 7 8 9 10 11 12 13 14
2007 691.7 70.9 70.5 527.5 0.8 1.1 20.8 1,466.4 312.5 345.7 648.6 12.2 0.3 147.12008 765.4 83.8 117.1 538.9 1.1 1.5 23.1 1,804.1 320.9 420.5 853.4 12.3 0.1 197.0
2009 Q1 763.5 91.7 99.8 546.8 2.3 1.5 21.4 1,838.8 333.3 350.8 905.4 14.4 0.0 234.7
2009 Apr. 766.0 90.1 101.2 550.6 1.8 1.5 20.8 1,866.7 326.2 372.7 914.6 15.0 0.0 238.1 May 759.0 83.6 100.5 551.9 1.9 1.5 19.7 1,854.2 309.0 364.7 926.5 14.7 0.0 239.2 June 753.3 85.4 93.7 552.0 1.7 1.5 19.0 1,891.8 335.5 343.3 943.8 14.1 0.0 255.0 July 752.3 86.2 93.7 552.1 1.8 1.5 16.9 1,854.1 315.5 346.9 945.6 14.6 0.0 231.4 Aug. (p) 751.5 87.1 89.8 552.6 1.8 1.5 18.7 1,833.2 303.3 353.2 938.8 14.5 0.1 223.3
Transactions
2007 38.5 0.8 10.5 31.9 -0.3 -0.3 -4.1 339.0 34.0 98.7 180.4 1.7 0.1 24.12008 71.7 12.4 44.9 12.4 -0.3 0.1 2.2 172.9 4.6 71.4 46.6 -0.3 -0.3 50.9
2009 Q1 -6.7 5.5 -18.8 7.8 0.5 0.0 -1.7 30.9 8.8 -68.4 50.6 2.1 0.0 37.7 Q2 -10.1 -6.3 -6.1 5.2 -0.5 0.0 -2.4 57.4 19.9 -19.8 37.0 -0.2 0.0 20.4
2009 Apr. 2.3 -1.7 1.3 3.8 -0.5 0.0 -0.6 26.6 9.3 6.6 6.7 0.6 0.0 3.4 May -6.7 -6.4 -0.6 1.3 0.1 0.0 -1.1 -5.8 -15.7 -4.5 13.5 -0.2 0.0 1.2 June -5.8 1.8 -6.8 0.1 -0.1 0.0 -0.7 36.6 26.4 -21.9 16.8 -0.6 0.0 15.8 July -1.0 0.9 0.0 0.1 0.1 0.0 -2.1 -37.6 -19.9 3.6 1.9 0.5 0.0 -23.6 Aug. (p) -0.6 0.9 -3.9 0.5 0.0 0.0 1.8 -19.4 -12.0 6.7 -6.0 -0.1 0.1 -8.1
Growth rates
2007 Dec. 5.9 1.1 17.5 6.4 -25.3 - -16.4 29.9 12.0 39.7 38.5 16.4 - 19.12008 Dec. 10.3 17.3 62.1 2.4 -23.4 - 10.5 11.8 1.4 20.8 7.2 -2.3 - 34.62009 Mar. 4.3 8.9 13.9 2.4 -3.4 - -2.2 9.6 -2.2 -2.3 13.6 6.4 - 39.42009 Apr. 4.8 16.6 10.4 2.8 -13.5 - -8.1 9.0 7.5 -8.9 13.5 4.2 - 31.9 May 4.1 16.6 6.7 2.7 -1.0 - -9.5 7.5 0.1 -9.0 12.6 14.3 - 32.0 June 3.6 12.8 6.1 2.4 -13.3 - -4.1 7.6 3.0 -14.4 12.7 15.6 - 39.9 July 3.6 20.1 3.6 2.3 -3.2 - -16.0 5.3 8.5 -21.7 12.8 1.9 - 30.3 Aug. (p) 4.3 27.4 1.2 2.3 3.8 - -4.3 3.9 9.7 -23.5 12.7 11.7 - 21.8
C9 Total deposits by sector 2) (annual growth rates)
C10 Total deposits and deposits included in M3by sector 2) (annual growth rates)
0
5
10
15
20
25
30
35
1999 2000 2001 2002 2003 2004 2005 2006 2007 20080
5
10
15
20
25
30
35
insurance corporations and pension funds (total)other financial intermediaries (total)
-10
0
10
20
30
40
2004 2005 2006 2007 2008 2009-10
0
10
20
30
40
insurance corporations and pension funds (total)other financial intermediaries (total)insurance corporations and pension funds (included in M3)other financial intermediaries (included in M3)
Source: ECB.1) MFI sector excluding the Eurosystem; sectoral classification is based on ESA 95.2) Data refer to the changing composition of the euro area. For further information, see the General notes.3) This category includes investment funds.4) Covers deposits in columns 2, 3, 5 and 7.5) Covers deposits in columns 9, 10, 12 and 14.
4)
5)

S 18ECB
Monthly Bulletin
October 2009
2.5 Deposits held with MFIs, breakdown 1), 2) (EUR billions and annual growth rates; outstanding amounts and growth rates at end of period, transactions during period)
2. Deposits by non-financial corporations and households
Outstanding amounts
Non-financial corporations Households 3)
Total Overnight With agreed maturity Redeemable at notice Repos Total Overnight With agreed maturity Redeemable at notice Repos
Up to Over 2 Up to Over Up to Over Up to Over2 years years 3 months 3 months 2 years 2 years 3 months 3 months
1 2 3 4 5 6 7 8 9 10 11 12 13 14
2007 1,488.8 888.9 485.3 59.6 29.9 1.4 23.7 4,990.6 1,778.9 993.3 561.6 1,458.6 111.1 87.12008 1,516.5 889.9 508.6 64.6 28.3 1.3 23.7 5,370.2 1,814.7 1,350.1 517.9 1,490.2 113.6 83.7
2009 Q1 1,487.2 877.8 480.5 71.0 38.7 1.3 17.9 5,447.9 1,900.3 1,281.3 524.4 1,565.5 114.9 61.4
2009 Apr. 1,504.5 881.3 486.1 72.3 43.7 1.4 19.7 5,483.9 1,957.9 1,242.2 527.9 1,583.2 115.8 56.8 May 1,514.3 897.0 475.6 72.6 47.3 1.4 20.4 5,498.6 1,986.5 1,214.9 531.6 1,594.2 117.3 54.2 June 1,530.5 922.8 464.3 72.3 50.1 1.5 19.6 5,507.2 2,012.1 1,186.6 535.4 1,604.0 118.2 50.9 July 1,530.6 918.8 463.2 74.4 54.4 1.5 18.4 5,517.4 2,030.1 1,155.2 543.9 1,617.9 119.4 50.9 Aug. (p) 1,541.2 934.7 455.3 76.4 56.8 1.5 16.5 5,509.0 2,033.2 1,123.0 552.0 1,632.5 120.1 48.1
Transactions
2007 140.2 34.1 126.8 -8.1 -10.8 -0.7 -1.1 282.9 22.4 320.9 -45.4 -43.2 11.2 17.12008 8.2 -4.5 13.3 3.3 -3.6 -0.3 0.0 347.6 28.6 335.6 -43.1 28.1 1.7 -3.4
2009 Q1 -39.3 -17.4 -32.2 5.0 11.1 0.0 -5.8 41.2 64.3 -80.3 3.9 75.1 0.5 -22.2 Q2 47.2 47.7 -15.1 1.4 11.4 0.1 1.7 60.1 111.1 -93.3 11.0 39.2 2.7 -10.6
2009 Apr. 17.7 4.2 5.2 1.3 5.1 0.0 1.9 34.5 56.5 -39.4 3.5 18.3 0.3 -4.7 May 13.0 17.4 -9.0 0.5 3.5 0.0 0.6 16.9 28.9 -25.7 3.7 11.1 1.4 -2.6 June 16.5 26.0 -11.3 -0.3 2.8 0.1 -0.8 8.6 25.6 -28.3 3.8 9.8 1.0 -3.3 July 0.2 -4.0 -1.1 2.1 4.3 0.0 -1.2 10.1 17.8 -31.4 8.5 14.0 1.1 0.1 Aug. (p) 11.3 16.3 -7.5 2.1 2.5 0.0 -1.9 -8.2 3.3 -32.1 8.1 14.7 0.8 -2.8
Growth rates
2007 Dec. 10.4 4.0 35.1 -11.8 -26.3 -31.6 -4.4 6.1 1.3 47.7 -7.5 -3.3 11.2 24.42008 Dec. 0.6 -0.5 2.8 5.4 -11.4 -16.2 0.0 6.9 1.6 33.2 -7.7 1.9 1.5 -3.92009 Mar. -0.8 1.2 -6.6 13.4 31.5 -9.5 -21.9 6.5 6.8 15.2 -4.6 6.6 4.7 -35.82009 Apr. -0.4 2.6 -9.6 14.2 54.1 -3.3 -5.9 6.2 9.1 8.3 -3.2 7.9 6.2 -41.8 May -0.8 2.9 -12.0 13.5 68.4 -2.4 -4.3 5.9 10.3 3.7 -1.7 8.7 8.9 -46.8 June 0.5 4.8 -11.7 12.5 79.6 1.0 -13.0 5.8 11.3 -0.5 -0.1 9.5 10.5 -48.4 July 1.4 7.2 -13.5 13.2 107.2 5.4 -20.0 5.5 13.3 -6.7 2.1 11.2 12.1 -52.5 Aug. (p) 2.2 9.8 -15.7 16.5 119.7 5.2 -28.8 5.2 15.1 -11.5 3.9 12.3 14.0 -56.5
C11 Total deposits by sector 2) (annual growth rates)
C12 Total deposits and deposits included in M3by sector 2) (annual growth rates)
-2
0
2
4
6
8
10
12
14
1999 2000 2001 2002 2003 2004 2005 2006 2007 2008-2
0
2
4
6
8
10
12
14
non-financial corporations (total)households (total)
-5
0
5
10
15
20
2004 2005 2006 2007 2008 2009-5
0
5
10
15
20
non-financial corporations (total)households (total)non-financial corporations (included in M3)households (included in M3)
Source: ECB.1) MFI sector excluding the Eurosystem; sectoral classification is based on ESA 95.2) Data refer to the changing composition of the euro area. For further information, see the General notes.3) Including non-profit institutions serving households.4) Covers deposits in columns 2, 3, 5 and 7.5) Covers deposits in columns 9, 10, 12 and 14.
4)
5)

S 19ECB
Monthly Bulletin
October 2009
EURO AREASTATISTICS
Money, banking
and investment
funds
2.5 Deposits held with MFIs, breakdown 1), 2) (EUR billions and annual growth rates; outstanding amounts and growth rates at end of period, transactions during period)
3. Deposits by government and non-euro area residents
Outstanding amounts
General government Non-euro area residents
Total Central Other general government Total Banks 3) Non-banks
governmentState Local Social Total General Other
government government security governmentfunds
1 2 3 4 5 6 7 8 9 10
2006 329.6 124.1 45.4 91.4 68.8 3,430.0 2,561.5 868.6 128.5 740.12007 374.8 126.9 59.0 108.5 80.4 3,857.3 2,948.5 908.8 143.3 765.52008 Q3 401.7 139.9 61.7 114.4 85.7 4,145.6 3,142.2 1,003.4 141.8 861.6 Q4 445.1 190.8 52.3 116.1 85.9 3,707.4 2,809.9 897.5 65.8 831.72009 Q1 464.2 216.2 50.6 114.3 83.0 3,660.2 2,780.9 879.3 63.6 815.7 Q2 (p) 475.9 227.5 48.9 117.8 81.6 3,560.7 2,699.3 861.4 62.5 798.9
Transactions
2007 31.9 -3.1 13.6 9.8 11.6 610.6 543.5 67.1 20.2 46.82008 72.3 63.5 -6.5 8.4 7.0 -181.9 -164.8 -17.1 -36.8 19.62008 Q3 -10.8 -16.0 5.2 0.8 -0.8 -15.4 -16.8 1.3 8.7 -7.4 Q4 45.9 50.8 -9.2 2.7 1.5 -427.4 -331.5 -95.9 -35.3 -60.62009 Q1 15.4 22.5 -1.7 -2.5 -2.9 -106.9 -75.6 -31.3 -2.6 -28.7 Q2 (p) 11.3 11.3 -1.6 3.5 -1.9 -58.6 -46.9 -11.6 -0.8 -10.8
Growth rates
2006 Dec. 4.3 -16.6 18.4 9.3 52.1 15.7 17.3 11.2 5.3 12.42007 Dec. 9.7 -2.4 29.9 10.7 16.9 17.9 21.4 7.8 15.8 6.3
2008 Sep. 3.7 -6.8 2.9 8.3 18.9 7.7 7.5 8.3 -1.2 10.1 Dec. 19.3 49.9 -11.0 7.7 8.7 -4.6 -5.5 -1.7 -25.5 2.72009 Mar. 22.7 52.6 2.2 5.3 6.5 -13.6 -14.5 -10.8 -24.0 -8.7 June (p) 15.0 43.9 -13.0 3.9 -4.9 -14.6 -14.9 -13.7 -24.0 -12.2
C13 Deposits by government and non-euro area residents 2) (annual growth rates)
-20
-15
-10
-5
0
5
10
15
20
25
30
1999 2000 2001 2002 2003 2004 2005 2006 2007 2008-20
-15
-10
-5
0
5
10
15
20
25
30
general governmentnon-resident banksnon-resident non-banks
Source: ECB.1) MFI sector excluding the Eurosystem; sectoral classification is based on ESA 95.2) Data refer to the changing composition of the euro area. For further information, see the General notes.3) The term ‘‘banks’’ is used in this table to indicate institutions of a similar type to MFIs resident outside the euro area.
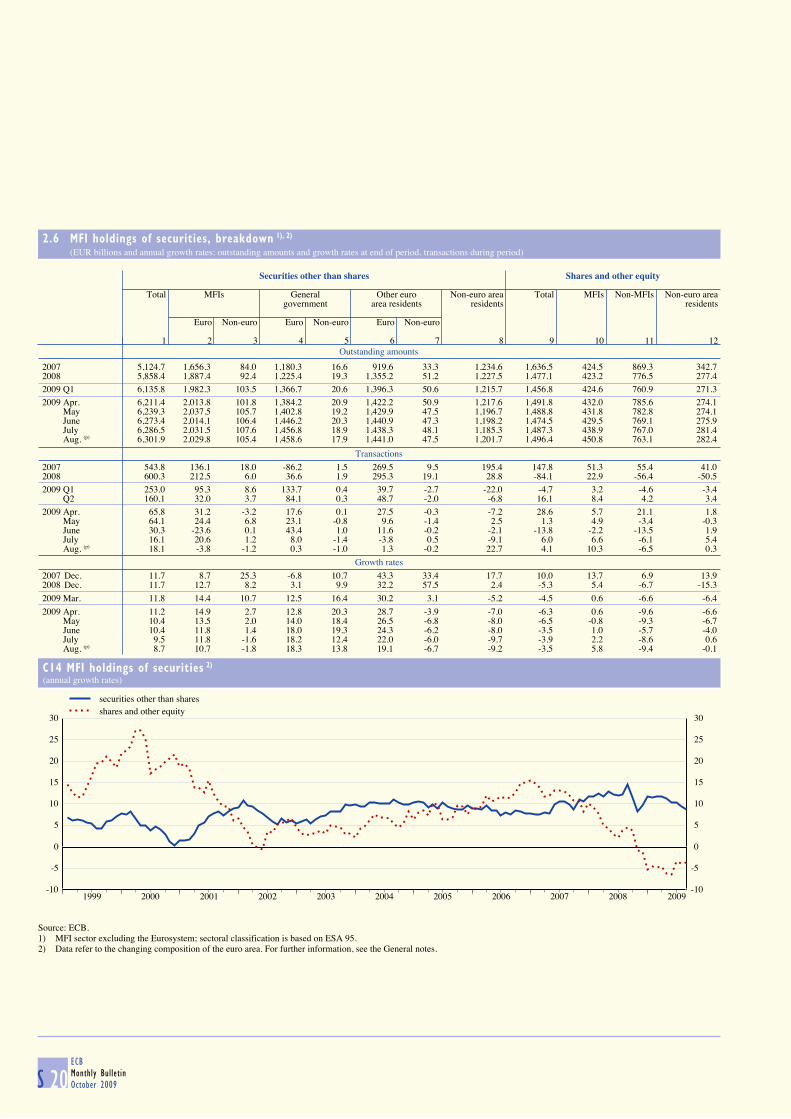
S 20ECB
Monthly Bulletin
October 2009
2.6 MFI holdings of securities, breakdown 1), 2) (EUR billions and annual growth rates; outstanding amounts and growth rates at end of period, transactions during period)
Outstanding amounts
Securities other than shares Shares and other equity
Total MFIs General Other euro Non-euro area Total MFIs Non-MFIs Non-euro area
government area residents residents residents
Euro Non-euro Euro Non-euro Euro Non-euro
1 2 3 4 5 6 7 8 9 10 11 12
2007 5,124.7 1,656.3 84.0 1,180.3 16.6 919.6 33.3 1,234.6 1,636.5 424.5 869.3 342.72008 5,858.4 1,887.4 92.4 1,225.4 19.3 1,355.2 51.2 1,227.5 1,477.1 423.2 776.5 277.42009 Q1 6,135.8 1,982.3 103.5 1,366.7 20.6 1,396.3 50.6 1,215.7 1,456.8 424.6 760.9 271.32009 Apr. 6,211.4 2,013.8 101.8 1,384.2 20.9 1,422.2 50.9 1,217.6 1,491.8 432.0 785.6 274.1 May 6,239.3 2,037.5 105.7 1,402.8 19.2 1,429.9 47.5 1,196.7 1,488.8 431.8 782.8 274.1 June 6,273.4 2,014.1 106.4 1,446.2 20.3 1,440.9 47.3 1,198.2 1,474.5 429.5 769.1 275.9 July 6,286.5 2,031.5 107.6 1,456.8 18.9 1,438.3 48.1 1,185.3 1,487.3 438.9 767.0 281.4 Aug. (p) 6,301.9 2,029.8 105.4 1,458.6 17.9 1,441.0 47.5 1,201.7 1,496.4 450.8 763.1 282.4
Transactions
2007 543.8 136.1 18.0 -86.2 1.5 269.5 9.5 195.4 147.8 51.3 55.4 41.02008 600.3 212.5 6.0 36.6 1.9 295.3 19.1 28.8 -84.1 22.9 -56.4 -50.52009 Q1 253.0 95.3 8.6 133.7 0.4 39.7 -2.7 -22.0 -4.7 3.2 -4.6 -3.4 Q2 160.1 32.0 3.7 84.1 0.3 48.7 -2.0 -6.8 16.1 8.4 4.2 3.42009 Apr. 65.8 31.2 -3.2 17.6 0.1 27.5 -0.3 -7.2 28.6 5.7 21.1 1.8 May 64.1 24.4 6.8 23.1 -0.8 9.6 -1.4 2.5 1.3 4.9 -3.4 -0.3 June 30.3 -23.6 0.1 43.4 1.0 11.6 -0.2 -2.1 -13.8 -2.2 -13.5 1.9 July 16.1 20.6 1.2 8.0 -1.4 -3.8 0.5 -9.1 6.0 6.6 -6.1 5.4 Aug. (p) 18.1 -3.8 -1.2 0.3 -1.0 1.3 -0.2 22.7 4.1 10.3 -6.5 0.3
Growth rates
2007 Dec. 11.7 8.7 25.3 -6.8 10.7 43.3 33.4 17.7 10.0 13.7 6.9 13.92008 Dec. 11.7 12.7 8.2 3.1 9.9 32.2 57.5 2.4 -5.3 5.4 -6.7 -15.3
2009 Mar. 11.8 14.4 10.7 12.5 16.4 30.2 3.1 -5.2 -4.5 0.6 -6.6 -6.4
2009 Apr. 11.2 14.9 2.7 12.8 20.3 28.7 -3.9 -7.0 -6.3 0.6 -9.6 -6.6 May 10.4 13.5 2.0 14.0 18.4 26.5 -6.8 -8.0 -6.5 -0.8 -9.3 -6.7 June 10.4 11.8 1.4 18.0 19.3 24.3 -6.2 -8.0 -3.5 1.0 -5.7 -4.0 July 9.5 11.8 -1.6 18.2 12.4 22.0 -6.0 -9.7 -3.9 2.2 -8.6 0.6 Aug. (p) 8.7 10.7 -1.8 18.3 13.8 19.1 -6.7 -9.2 -3.5 5.8 -9.4 -0.1
C14 MFI holdings of securities 2) (annual growth rates)
-10
-5
0
5
10
15
20
25
30
1999 2000 2001 2002 2003 2004 2005 2006 2007 2008 2009-10
-5
0
5
10
15
20
25
30
securities other than sharesshares and other equity
Source: ECB.1) MFI sector excluding the Eurosystem; sectoral classification is based on ESA 95.2) Data refer to the changing composition of the euro area. For further information, see the General notes.

S 21ECB
Monthly Bulletin
October 2009
EURO AREASTATISTICS
Money, banking
and investment
funds
2.7 Revaluation of selected MFI balance sheet items 1), 2) (EUR billions)
1. Write-offs/write-downs of loans to households 3)
Consumer credit Lending for house purchase Other lending
Total Up to Over 1 year Over Total Up to Over 1 year Over Total Up to Over 1 year Over1 year and up to 5 years 1 year and up to 5 years 1 year and up to 5 years
5 years 5 years 5 years
1 2 3 4 5 6 7 8 9 10 11 122007 -4.2 -1.2 -1.4 -1.6 -2.7 -0.2 -0.2 -2.3 -6.9 -0.8 -2.3 -3.72008 -4.5 -1.1 -1.5 -1.9 -2.7 0.0 -0.2 -2.5 -6.7 -1.2 -2.3 -3.22009 Q1 -1.8 -0.5 -0.5 -0.8 -1.2 0.0 -0.1 -1.1 -2.2 -0.7 -0.2 -1.3 Q2 -1.5 -0.3 -0.5 -0.8 -1.0 0.0 0.0 -0.9 -1.1 -0.1 -0.2 -0.82009 Apr. -0.6 0.0 -0.2 -0.3 -0.2 0.0 0.0 -0.2 -0.2 0.0 0.0 -0.2 May -0.3 0.0 -0.1 -0.2 -0.3 0.0 0.0 -0.3 -0.4 -0.1 0.0 -0.3 June -0.6 -0.2 -0.2 -0.2 -0.4 0.0 0.0 -0.4 -0.6 -0.1 -0.1 -0.4 July -0.7 -0.1 -0.3 -0.4 -0.3 0.0 0.0 -0.3 -0.6 -0.1 -0.1 -0.4 Aug. (p) -0.5 -0.1 -0.1 -0.2 -0.2 0.0 0.0 -0.2 -0.4 -0.1 0.0 -0.2
2. Write-offs/write-downs of loans to non-financial corporations and non-euro area residents
Non-financial corporations Non-euro area residents
Total Up to Over 1 year Over Total Up to Over 11 year and up to 5 years 1 year year
5 years
1 2 3 4 5 6 72007 -12.5 -2.1 -5.4 -4.9 -5.2 -3.4 -1.82008 -17.7 -4.0 -9.1 -4.5 -6.6 -3.4 -3.22009 Q1 -7.1 -3.5 -1.6 -2.0 -2.7 -1.3 -1.3 Q2 -5.8 -1.7 -2.4 -1.7 -1.1 -0.3 -0.82009 Apr. -1.8 -0.7 -0.6 -0.6 0.1 -0.1 0.2 May -1.3 -0.3 -0.6 -0.3 -0.3 -0.1 -0.2 June -2.7 -0.7 -1.2 -0.8 -0.9 -0.2 -0.7 July -2.6 -0.8 -0.9 -0.9 -0.4 -0.2 -0.2 Aug. (p) -1.4 -0.7 -0.4 -0.3 -0.1 -0.1 0.0
3. Revaluation of securities held by MFIs
Securities other than shares Shares and other equity
Total MFIs General Other euro Non-euro area Total MFIs Non-MFIs Non-euro area
government area residents residents residents
Euro Non-euro Euro Non-euro Euro Non-euro
1 2 3 4 5 6 7 8 9 10 11 122007 -14.2 -3.3 0.1 -0.3 -0.2 -3.2 -0.6 -6.7 27.6 3.8 11.7 12.12008 -56.4 -8.0 0.0 5.2 0.0 -20.1 -2.2 -31.2 -60.6 -8.2 -44.1 -8.22009 Q1 -14.4 -0.5 -0.1 -3.1 0.0 -2.8 0.4 -8.3 -16.0 -3.5 -11.4 -1.1 Q2 -2.4 2.0 0.1 -2.0 -0.1 -1.6 0.3 -1.0 8.2 2.3 4.7 1.32009 Apr. -0.3 1.1 0.1 -0.2 0.0 -1.8 0.2 0.3 6.5 1.7 3.6 1.1 May -2.1 1.2 0.0 -2.0 -0.2 0.2 0.0 -1.5 2.2 0.8 1.2 0.2 June 0.0 -0.4 0.0 0.2 0.0 -0.1 0.0 0.2 -0.4 -0.2 -0.2 -0.1 July 6.7 1.0 0.1 2.7 0.0 0.9 0.2 1.8 6.8 2.9 3.9 0.1 Aug. (p) 6.8 1.8 0.1 1.4 0.0 1.5 0.0 1.9 5.0 1.6 2.7 0.7
Source: ECB.1) MFI sector excluding the Eurosystem; sectoral classification is based on ESA 95.2) Data refer to the changing composition of the euro area. For further information, see the General notes.3) Including non-profit institutions serving households.

S 22ECB
Monthly Bulletin
October 2009
2.8 Currency breakdown of selected MFI balance sheet items 1),2) (percentages of total; outstanding amounts in EUR billions; end of period)
1. Deposits
By euro area residents
MFIs 3) Non-MFIs
All Euro 4) Non-euro currencies All Euro 4) Non-euro currencies
currencies currencies (outstanding Total (outstanding Total
amount) amount)USD JPY CHF GBP USD JPY CHF GBP
1 2 3 4 5 6 7 8 9 10 11 12 13 14
2006 5,239.3 90.7 9.3 5.6 0.4 1.5 1.2 8,025.9 96.4 3.6 2.2 0.3 0.1 0.62007 6,085.8 92.1 7.9 4.8 0.4 1.1 1.0 9,012.4 96.4 3.6 2.2 0.4 0.1 0.5
2008 Q3 6,746.8 89.4 10.6 6.9 0.4 1.5 1.0 9,487.6 96.2 3.8 2.2 0.5 0.1 0.6 Q4 6,858.5 89.7 10.3 7.3 0.4 1.2 0.8 9,901.3 96.9 3.1 1.9 0.5 0.1 0.42009 Q1 6,606.6 90.9 9.1 6.3 0.3 1.2 0.7 10,001.6 96.9 3.1 1.9 0.4 0.1 0.5 Q2 (p) 6,628.8 92.2 7.8 5.1 0.3 1.1 0.8 10,158.8 97.0 3.0 1.8 0.3 0.1 0.5
By non-euro area residents
2006 2,561.5 45.4 54.6 35.0 2.3 2.7 11.5 868.6 50.8 49.2 31.9 1.3 2.0 10.42007 2,948.5 46.9 53.1 33.6 2.9 2.4 11.0 908.8 50.1 49.9 32.9 1.6 1.8 9.9
2008 Q3 3,142.2 45.8 54.2 35.2 3.2 2.7 9.8 1,003.4 52.6 47.4 30.3 1.3 1.5 10.3 Q4 2,809.9 48.2 51.8 33.4 2.8 2.6 10.2 897.5 54.9 45.1 28.7 1.4 1.9 9.42009 Q1 2,780.9 47.2 52.8 34.8 2.1 2.6 10.4 879.3 52.7 47.3 31.6 1.2 1.9 8.4 Q2 (p) 2,699.3 49.0 51.0 32.8 1.9 2.6 10.9 861.4 51.9 48.1 33.1 1.3 1.8 7.7
2. Debt securities issued by euro area MFIs
All Euro 4) Non-euro currencies
currencies (outstanding Total
amount)USD JPY CHF GBP
1 2 3 4 5 6 72006 4,470.8 80.6 19.4 10.0 1.6 1.9 3.52007 4,933.2 81.5 18.5 9.2 1.7 1.9 3.4
2008 Q3 5,168.4 81.9 18.1 8.9 1.9 1.8 3.3 Q4 5,111.7 83.3 16.7 8.4 2.0 1.9 2.52009 Q1 5,197.9 83.3 16.7 8.7 1.9 1.9 2.5 Q2 (p) 5,224.2 83.5 16.5 8.4 1.9 1.8 2.6
Source: ECB.1) MFI sector excluding the Eurosystem; sectoral classification is based on ESA 95.2) Data refer to the changing composition of the euro area. For further information, see the General notes.3) For non-euro area residents, the term ‘‘MFIs’’ refers to institutions of a similar type to euro area MFIs.4) Including items expressed in the national denominations of the euro.

S 23ECB
Monthly Bulletin
October 2009
EURO AREASTATISTICS
Money, banking
and investment
funds
2.8 Currency breakdown of selected MFI balance sheet items 1),2) (percentages of total; outstanding amounts in EUR billions; end of period)
3. Loans
To euro area residents
MFIs 3) Non-MFIs
All Euro 4) Non-euro currencies All Euro 4) Non-euro currencies
currencies currencies (outstanding Total (outstanding Total
amount) amount)USD JPY CHF GBP USD JPY CHF GBP
1 2 3 4 5 6 7 8 9 10 11 12 13 14
2006 4,938.0 - - - - - - 9,943.7 96.4 3.6 1.6 0.2 1.1 0.52007 5,800.8 - - - - - - 11,093.4 96.2 3.8 1.8 0.2 0.9 0.6
2008 Q3 6,355.5 - - - - - - 11,778.9 95.8 4.2 2.1 0.2 1.0 0.5 Q4 6,317.7 - - - - - - 11,735.7 95.9 4.1 2.1 0.3 1.0 0.42009 Q1 6,126.7 - - - - - - 11,780.9 95.9 4.1 2.1 0.3 1.0 0.5 Q2 (p) 6,226.3 - - - - - - 11,833.0 96.1 3.9 2.0 0.2 1.0 0.5
To non-euro area residents
2006 2,070.6 50.9 49.1 28.7 2.0 2.3 11.0 861.2 39.3 60.7 43.1 1.1 4.0 8.62007 2,352.4 48.3 51.7 28.8 2.3 2.4 12.7 955.1 40.9 59.1 41.2 1.2 3.7 8.2
2008 Q3 2,461.8 42.7 57.3 33.2 2.9 2.6 12.4 1,063.9 41.4 58.6 40.5 1.5 3.9 8.0 Q4 2,284.6 45.8 54.2 31.8 3.0 2.6 11.3 965.5 40.5 59.5 41.9 1.4 4.3 7.42009 Q1 2,100.4 44.8 55.2 31.2 2.7 3.1 12.7 956.2 38.1 61.9 44.5 1.0 4.2 7.8 Q2 (p) 2,018.1 45.5 54.5 29.5 2.9 3.1 13.5 935.7 39.5 60.5 43.0 0.9 4.0 7.8
4. Holdings of securities other than shares
Issued by euro area residents
Issued by MFIs 3) Issued by non-MFIs
All Euro 4) Non-euro currencies All Euro 4) Non-euro currencies
currencies currencies (outstanding Total (outstanding Total
amount) amount)USD JPY CHF GBP USD JPY CHF GBP
1 2 3 4 5 6 7 8 9 10 11 12 13 14
2006 1,636.9 95.6 4.4 2.3 0.2 0.3 1.3 1,924.6 97.6 2.4 1.3 0.3 0.1 0.72007 1,740.3 95.2 4.8 2.4 0.3 0.3 1.5 2,149.8 97.7 2.3 1.4 0.2 0.1 0.5
2008 Q3 1,905.6 94.6 5.4 2.9 0.4 0.3 1.5 2,302.2 97.2 2.8 1.9 0.3 0.1 0.4 Q4 1,979.8 95.3 4.7 2.6 0.4 0.2 1.2 2,651.1 97.3 2.7 1.7 0.3 0.1 0.42009 Q1 2,085.8 95.0 5.0 2.7 0.2 0.4 1.3 2,834.3 97.5 2.5 1.7 0.2 0.1 0.4 Q2 (p) 2,120.5 95.0 5.0 2.5 0.5 0.4 1.3 2,954.7 97.7 2.3 1.5 0.2 0.1 0.3
Issued by non-euro area residents
2006 515.3 52.3 47.7 28.8 0.7 0.4 14.5 594.5 38.9 61.1 36.5 4.9 0.8 14.22007 582.3 53.9 46.1 27.3 0.7 0.4 14.4 652.2 35.9 64.1 39.3 4.5 0.8 12.6
2008 Q3 645.1 51.1 48.9 30.7 0.8 0.5 14.2 663.4 37.2 62.8 38.1 6.4 0.9 10.5 Q4 580.8 54.0 46.0 28.6 0.9 0.5 13.3 646.7 39.0 61.0 37.1 6.4 0.8 11.02009 Q1 597.9 52.1 47.9 27.6 0.3 1.6 13.9 617.9 34.1 65.9 40.5 4.3 0.8 15.3 Q2 (p) 570.1 55.3 44.7 24.7 1.7 1.4 14.4 628.2 33.5 66.5 40.3 4.2 0.9 16.0
Source: ECB.1) MFI sector excluding the Eurosystem; sectoral classification is based on ESA 95.2) Data refer to the changing composition of the euro area. For further information, see the General notes.3) For non-euro area residents, the term ‘‘MFIs’’ refers to institutions of a similar type to euro area MFIs.4) Including items expressed in the national denominations of the euro.

S 24ECB
Monthly Bulletin
October 2009
2.9 Aggregated balance sheet of euro area investment funds 1) (EUR billions; outstanding amounts at end of period)
1. Assets
Total Deposits Holdings of securities Holdings Holdings of Fixed Other
other than shares of shares/ investment assets assetsother fund shares
Total Up to Over equity1 year 1 year
1 2 3 4 5 6 7 8 92007 Q4 5,783.4 353.7 1,994.3 184.2 1,810.1 2,077.7 784.6 189.1 384.12008 Q1 5,162.7 365.9 1,858.8 164.8 1,693.9 1,670.4 720.3 197.1 350.2 Q2 5,017.4 359.6 1,808.2 157.5 1,650.7 1,624.6 691.2 204.9 328.8 Q3 4,715.2 377.4 1,748.3 148.1 1,600.1 1,411.5 641.9 202.8 333.4 Q4 4,232.3 352.1 1,687.9 132.4 1,555.5 1,132.7 566.7 200.2 292.72009 Q1 (p) 4,095.6 344.6 1,699.3 121.7 1,577.6 1,044.4 529.7 202.3 275.3
2. Liabilities
Total Deposits and Investment Otherloans taken fund shares liabilities
1 2 3 42007 Q4 5,783.4 76.8 5,413.5 293.12008 Q1 5,162.7 76.4 4,848.6 237.7 Q2 5,017.4 74.8 4,723.1 219.5 Q3 4,715.2 71.0 4,415.4 228.8 Q4 4,232.3 64.7 3,983.1 184.52009 Q1 (p) 4,095.6 74.6 3,836.6 184.4
3. Total assets/liabilities broken down by investment policy and type of investor
Total Funds by investment policy Funds by type of investor
Equity Bond Mixed Real estate Other General Specialfunds funds funds funds funds public investors’
funds funds
1 2 3 4 5 6 7 82007 Q4 5,783.4 1,735.7 1,597.4 1,535.8 244.3 670.2 4,346.8 1,436.72008 Q1 5,162.7 1,362.8 1,483.8 1,428.1 249.7 638.3 3,780.2 1,382.5 Q2 5,017.4 1,325.4 1,413.9 1,405.6 256.3 616.2 3,649.3 1,368.1 Q3 4,715.2 1,132.4 1,383.2 1,359.3 253.2 587.1 3,343.0 1,372.3 Q4 4,232.3 908.4 1,330.8 1,210.8 257.1 525.2 2,950.7 1,281.62009 Q1 (p) 4,095.6 854.6 1,330.8 1,170.6 257.4 482.2 2,825.4 1,270.2
C15 Total assets of investment funds(EUR billions)
0
500
1000
1500
2000
1999 2000 2001 2002 2003 2004 2005 2006 2007 20080
500
1000
1500
2000
equity fundsbond fundsmixed fundsreal estate funds
Source: ECB.1) Other than money market funds. For further details, see the General notes.

S 25ECB
Monthly Bulletin
October 2009
EURO AREASTATISTICS
Money, banking
and investment
funds
2.10 Assets of euro area investment funds broken down by investment policy and type of investor (EUR billions; outstanding amounts at end of period)
1. Funds by investment policy
Equity funds
Total Deposits Holdings of securities Holdings Holdings of Fixed Other
other than shares of shares/ investment assets assetsother fund shares
Total Up to Over equity1 year 1 year
1 2 3 4 5 6 7 8 9
2007 Q4 1,735.7 58.1 71.8 26.5 45.2 1,464.4 79.5 - 61.92008 Q1 1,362.8 51.3 63.1 21.3 41.8 1,131.0 65.7 - 51.7 Q2 1,325.4 54.3 65.1 22.0 43.1 1,088.7 65.7 - 51.6 Q3 1,132.4 48.3 61.3 20.2 41.1 915.3 57.2 - 50.2 Q4 908.4 37.3 65.2 19.4 45.8 715.4 47.2 - 43.32009 Q1 (p) 854.6 38.8 63.8 16.5 47.3 660.7 45.2 - 46.1
Bond funds
2007 Q4 1,597.4 116.1 1,273.6 92.8 1,180.8 58.0 49.8 - 99.82008 Q1 1,483.8 124.7 1,168.2 80.3 1,087.9 56.8 45.5 - 88.6 Q2 1,413.9 115.9 1,118.8 74.6 1,044.2 57.9 42.7 - 78.6 Q3 1,383.2 128.7 1,074.0 67.9 1,006.1 55.7 41.3 - 83.5 Q4 1,330.8 122.2 1,034.2 62.2 971.9 57.5 36.4 - 80.52009 Q1 (p) 1,330.8 117.5 1,044.6 62.1 982.5 49.1 38.6 - 80.9
Mixed funds
2007 Q4 1,535.8 89.8 547.2 47.3 499.8 393.2 343.7 0.7 161.42008 Q1 1,428.1 97.9 528.1 46.4 481.8 339.5 314.0 1.2 147.3 Q2 1,405.6 99.1 520.1 42.6 477.5 341.7 308.0 0.8 135.9 Q3 1,359.3 109.0 512.8 42.2 470.6 312.1 287.4 1.1 137.0 Q4 1,210.8 110.3 494.9 34.3 460.6 245.2 235.8 1.2 123.42009 Q1 (p) 1,170.6 109.4 498.5 28.2 470.3 227.2 224.0 1.8 109.6
Real estate funds
2007 Q4 244.3 19.7 6.0 1.5 4.5 3.4 12.5 187.9 14.72008 Q1 249.7 19.9 5.3 1.1 4.2 3.1 11.3 195.4 14.6 Q2 256.3 18.0 5.9 1.1 4.8 3.0 10.1 203.5 15.8 Q3 253.2 19.0 4.7 1.3 3.4 3.1 9.3 201.2 16.0 Q4 257.1 14.4 4.8 1.1 3.7 12.7 6.8 198.5 19.82009 Q1 (p) 257.4 14.4 5.1 1.1 4.0 12.3 7.5 200.1 18.1
2. Funds by type of investor
General public funds
Total Deposits Holdings of Holdings of Holdings of Fixed Othersecurities shares/ investment assets assets
other than other fund sharesshares equity
1 2 3 4 5 6 7
2007 Q4 4,346.8 280.2 1,337.7 1,717.7 570.2 149.1 291.82008 Q1 3,780.2 278.0 1,219.2 1,362.3 514.7 154.1 252.0 Q2 3,649.3 264.9 1,178.3 1,327.0 486.0 155.0 238.1 Q3 3,343.0 265.4 1,105.7 1,140.8 441.4 152.4 237.3 Q4 2,950.7 244.6 1,037.6 933.0 382.6 146.7 206.22009 Q1 (p) 2,825.4 243.5 1,029.9 864.7 342.8 144.5 199.9
Special investors’ funds
2007 Q4 1,436.7 73.4 656.6 360.0 214.5 40.0 92.22008 Q1 1,382.5 88.0 639.6 308.1 205.6 43.0 98.2 Q2 1,368.1 94.8 629.9 297.6 205.2 49.9 90.7 Q3 1,372.3 112.0 642.5 270.7 200.5 50.5 96.1 Q4 1,281.6 107.5 650.2 199.7 184.1 53.5 86.52009 Q1 (p) 1,270.2 101.1 669.4 179.7 186.9 57.8 75.3
Source: ECB.

S 26ECB
Monthly Bulletin
October 2009
3 EURO AREA ACCOUNTS
3.1 Integrated economic and financial accounts by institutional sector (EUR billions)
Uses Euro Households Non-financial Financial General Rest ofarea corporations corporations government the world
2009 Q1
External account
Exports of goods and services 421.2 Trade balance 1) 11.0
Generation of income account
Gross value added (basic prices) Taxes less subsidies on products Gross domestic product (market prices) Compensation of employees 1,047.9 102.7 663.6 52.0 229.7 Other taxes less subsidies on production 24.2 2.7 14.2 3.6 3.8 Consumption of fixed capital 351.0 94.5 199.1 11.6 45.7 Net operating surplus and mixed income 1) 540.7 279.4 226.5 35.8 -0.9
Allocation of primary income account
Net operating surplus and mixed income Compensation of employees 4.6 Taxes less subsidies on production Property income 777.7 42.7 288.7 380.7 65.6 109.5 Interest 481.8 40.4 83.1 292.7 65.6 66.7 Other property income 295.8 2.3 205.6 87.9 0.0 42.8 Net national income 1) 1,824.2 1,549.3 33.8 39.0 202.0
Secondary distribution of income account
Net national income Current taxes on income, wealth, etc. 231.0 201.3 23.9 5.6 0.2 1.3 Social contributions 403.2 403.2 0.6 Social benefits other than social transfers in kind 422.2 1.4 15.6 31.7 373.6 0.7 Other current transfers 192.5 71.3 25.2 45.9 50.1 8.1 Net non-life insurance premiums 43.7 31.8 10.3 0.9 0.7 1.4 Non-life insurance claims 43.8 43.8 0.6 Other 105.0 39.5 14.9 1.2 49.4 6.1 Net disposable income 1) 1,793.4 1,384.1 -4.7 48.2 365.8
Use of income account
Net disposable income Final consumption expenditure 1,743.6 1,279.3 464.2 Individual consumption expenditure 1,562.6 1,279.3 283.3 Collective consumption expenditure 181.0 181.0 Adjustment for the change in net equity of households in pension fund reserves 15.3 0.1 0.2 15.0 0.0 0.0 Net saving/current external account 1) 49.9 120.0 -4.9 33.2 -98.4 55.2
Capital account
Net saving / current external account Gross capital formation 456.1 140.8 256.2 12.9 46.3 Gross fixed capital formation 438.3 138.2 241.3 12.7 46.1 Changes in inventories and acquisitions less disposals of valuables 17.9 2.6 14.9 0.2 0.2 Consumption of fixed capital Acquisitions less disposals of non-produced non-financial assets 0.6 -1.4 1.3 0.1 0.6 -0.6 Capital transfers 34.4 6.1 -0.2 1.2 27.3 3.7 Capital taxes 5.0 4.8 0.2 0.0 0.0 Other capital transfers 29.4 1.3 -0.3 1.2 27.3 3.7 Net lending (+)/net borrowing (-) (from capital account) 1) -54.3 83.8 -47.0 31.4 -122.5 54.3 Statistical discrepancy 0.0 13.1 -13.1 0.0 0.0 0.0
Sources: ECB and Eurostat.1) For the calculation of the balancing items, see the Technical notes.

S 27ECB
Monthly Bulletin
October 2009
EURO AREASTATISTICS
Euro area
accounts
3.1 Integrated economic and financial accounts by institutional sector (cont'd) (EUR billions)
Resources Euro Households Non-financial Financial General Rest ofarea corporations corporations government the world
2009 Q1
External account
Imports of goods and services 432.1 Trade balance Generation of income account
Gross value added (basic prices) 1,963.9 479.2 1,103.4 103.0 278.3 Taxes less subsidies on products 224.8 Gross domestic product (market prices)2) 2,188.7 Compensation of employees Other taxes less subsidies on production Consumption of fixed capital Net operating surplus and mixed income Allocation of primary income account
Net operating surplus and mixed income 540.7 279.4 226.5 35.8 -0.9 Compensation of employees 1,050.4 1,050.4 2.1 Taxes less subsidies on production 247.2 247.2 1.9 Property income 763.5 262.2 96.0 383.9 21.3 123.6 Interest 463.4 72.4 48.3 334.9 7.9 85.1 Other property income 300.1 189.9 47.8 49.1 13.4 38.5 Net national income Secondary distribution of income account
Net national income 1,824.2 1,549.3 33.8 39.0 202.0 Current taxes on income, wealth, etc. 231.9 231.9 0.4 Social contributions 402.7 1.1 15.6 47.4 338.6 1.1 Social benefits other than social transfers in kind 419.6 419.6 3.4 Other current transfers 163.9 91.4 10.4 45.0 17.2 36.7 Net non-life insurance premiums 43.8 43.8 1.3 Non-life insurance claims 42.8 34.2 7.7 0.7 0.3 1.6 Other 77.3 57.2 2.8 0.5 16.9 33.8 Net disposable income Use of income account
Net disposable income 1,793.4 1,384.1 -4.7 48.2 365.8 Final consumption expenditure Individual consumption expenditure Collective consumption expenditure Adjustment for the change in net equity of households in pension fund reserves 15.3 15.3 0.0 Net saving/current external account Capital account
Net saving / current external account 49.9 120.0 -4.9 33.2 -98.4 55.2 Gross capital formation Gross fixed capital formation Changes in inventories and acquisitions less disposals of valuables Consumption of fixed capital 351.0 94.5 199.1 11.6 45.7 Acquisitions less disposals of non-produced non-financial assets Capital transfers 35.9 14.8 16.0 0.7 4.4 2.2 Capital taxes 5.0 5.0 0.0 Other capital transfers 30.9 14.8 16.0 0.7 -0.6 2.2 Net lending (+)/net borrowing (-) (from capital account) Statistical discrepancy
Sources: ECB and Eurostat.2) Gross domestic product is equal to gross value added of all domestic sectors plus net taxes (taxes less subsidies) on products.

S 28ECB
Monthly Bulletin
October 2009
3.1 Integrated economic and financial accounts by institutional sector (cont'd) (EUR billions)
Assets Euro Households Non-financial MFIs Other Insurance General Rest ofarea corporations financial corporations govern- the world
inter- and pension ment2009 Q1 mediaries funds
Opening balance sheet, financial assets
Total financial assets 16,629.4 14,160.4 23,728.5 9,484.6 5,963.5 3,159.6 14,898.2 Monetary gold and special drawing rights (SDRs) 221.8 Currency and deposits 6,120.0 1,835.6 2,393.9 1,800.1 874.8 641.5 4,206.6 Short-term debt securities 60.3 94.3 154.5 327.8 331.2 37.6 855.6 Long-term debt securities 1,256.5 213.8 4,253.6 1,631.7 2,017.2 322.8 2,942.3 Loans 65.7 2,531.9 12,755.1 2,112.2 364.8 442.6 1,775.9 of which long-term 47.7 1,404.8 9,679.5 1,684.7 287.6 354.5 . Shares and other equity 3,750.4 6,067.4 1,599.1 3,413.1 1,919.6 1,136.0 4,434.8 Quoted shares 611.6 1,106.3 470.7 1,505.7 426.0 263.2 . Unquoted shares and other equity 1,820.0 4,652.7 915.5 1,374.8 433.0 751.9 . Mutual fund shares 1,318.9 308.5 212.9 532.6 1,060.6 120.9 . Insurance technical reserves 5,148.6 136.9 1.8 0.0 142.3 3.1 149.3 Other accounts receivable and financial derivatives 227.9 3,280.4 2,348.6 199.6 313.5 575.9 533.8 Net financial worth Financial account, transactions in financial assets
Total transactions in financial assets 101.5 -5.9 -116.1 118.4 54.8 94.6 -131.3 Monetary gold and special drawing rights (SDRs) -0.9 0.9 Currency and deposits 27.3 -41.6 -223.9 59.4 -1.4 92.8 -188.2 Short-term debt securities -14.8 -7.9 -9.1 3.2 7.4 -11.6 45.9 Long-term debt securities 37.3 -18.0 161.2 9.7 32.3 -4.6 67.3 Loans -1.1 80.9 -31.1 75.0 2.8 4.3 -31.9 of which long-term -1.1 62.4 19.9 76.9 10.6 4.4 . Shares and other equity 12.4 77.2 -5.5 -35.3 2.8 10.5 21.6 Quoted shares 3.0 26.7 -3.1 -30.7 -0.2 2.3 . Unquoted shares and other equity 6.4 38.2 16.1 27.3 4.4 7.9 . Mutual fund shares 3.0 12.3 -18.4 -31.8 -1.3 0.2 . Insurance technical reserves 42.6 1.2 0.0 0.0 3.7 0.0 -10.5 Other accounts receivable and financial derivatives -2.3 -97.8 -6.9 6.4 7.2 3.3 -36.4 Changes in net financial worth due to transactions Other changes account, financial assets
Total other changes in financial assets -264.6 -348.9 58.5 -91.9 -71.2 -44.1 -41.5 Monetary gold and special drawing rights (SDRs) 24.4 Currency and deposits 14.4 -3.4 25.4 5.8 4.2 0.0 47.2 Short-term debt securities -0.5 -0.2 -1.3 7.7 0.3 -0.5 0.9 Long-term debt securities -2.0 -8.7 13.6 -5.2 1.8 -1.1 0.0 Loans 0.0 8.3 23.1 6.1 -4.3 0.0 -1.3 of which long-term 0.0 5.6 15.6 4.1 -2.5 -0.1 . Shares and other equity -247.1 -389.9 -61.6 -107.5 -75.8 -40.1 -98.6 Quoted shares -89.5 -151.6 -50.4 -75.9 -33.1 -42.0 . Unquoted shares and other equity -120.8 -225.0 -33.3 -54.5 -23.2 5.3 . Mutual fund shares -36.8 -13.3 22.1 22.9 -19.5 -3.4 . Insurance technical reserves -36.6 0.0 0.0 0.0 0.1 0.0 2.6 Other accounts receivable and financial derivatives 7.2 45.1 34.8 1.2 2.6 -2.5 7.8 Other changes in net financial worth Closing balance sheet, financial assets
Total financial assets 16,466.3 13,805.6 23,670.9 9,511.0 5,947.1 3,210.0 14,724.6 Monetary gold and special drawing rights (SDRs) 245.2 Currency and deposits 6,161.7 1,790.6 2,195.4 1,865.3 877.7 734.4 4,065.6 Short-term debt securities 45.0 86.2 144.2 338.6 338.9 25.6 902.4 Long-term debt securities 1,291.9 187.1 4,428.4 1,636.2 2,051.2 317.1 3,009.5 Loans 64.6 2,621.1 12,747.2 2,193.4 363.3 446.8 1,742.7 of which long-term 46.7 1,472.8 9,715.0 1,765.7 295.8 358.8 . Shares and other equity 3,515.8 5,754.8 1,532.0 3,270.3 1,846.6 1,106.4 4,357.8 Quoted shares 525.1 981.4 417.1 1,399.1 392.7 223.5 . Unquoted shares and other equity 1,705.5 4,465.9 898.3 1,347.6 414.2 765.1 . Mutual fund shares 1,285.1 307.5 216.6 523.6 1,039.7 117.8 . Insurance technical reserves 5,154.6 138.1 1.9 0.0 146.1 3.1 141.4 Other accounts receivable and financial derivatives 232.8 3,227.6 2,376.6 207.2 323.2 576.6 505.2 Net financial worthSource: ECB.
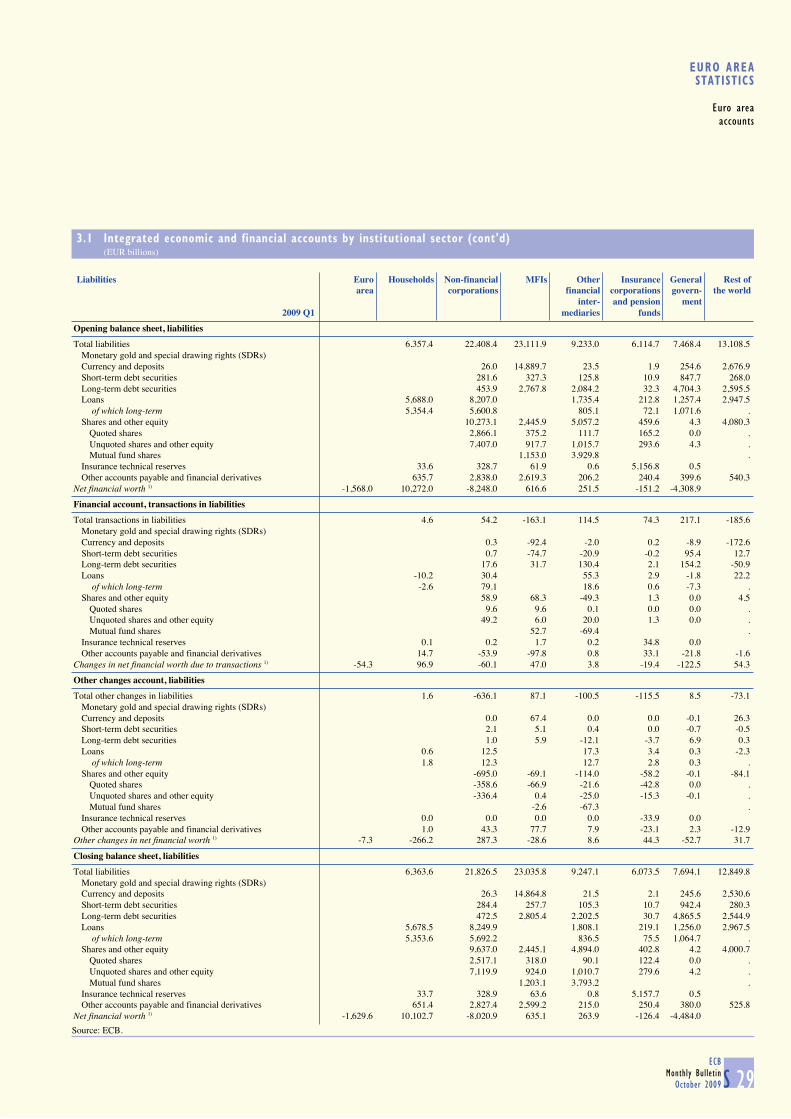
S 29ECB
Monthly Bulletin
October 2009
EURO AREASTATISTICS
Euro area
accounts
3.1 Integrated economic and financial accounts by institutional sector (cont'd) (EUR billions)
Liabilities Euro Households Non-financial MFIs Other Insurance General Rest ofarea corporations financial corporations govern- the world
inter- and pension ment2009 Q1 mediaries funds
Opening balance sheet, liabilities
Total liabilities 6,357.4 22,408.4 23,111.9 9,233.0 6,114.7 7,468.4 13,108.5 Monetary gold and special drawing rights (SDRs) Currency and deposits 26.0 14,889.7 23.5 1.9 254.6 2,676.9 Short-term debt securities 281.6 327.3 125.8 10.9 847.7 268.0 Long-term debt securities 453.9 2,767.8 2,084.2 32.3 4,704.3 2,595.5 Loans 5,688.0 8,207.0 1,735.4 212.8 1,257.4 2,947.5 of which long-term 5,354.4 5,600.8 805.1 72.1 1,071.6 . Shares and other equity 10,273.1 2,445.9 5,057.2 459.6 4.3 4,080.3 Quoted shares 2,866.1 375.2 111.7 165.2 0.0 . Unquoted shares and other equity 7,407.0 917.7 1,015.7 293.6 4.3 . Mutual fund shares 1,153.0 3,929.8 . Insurance technical reserves 33.6 328.7 61.9 0.6 5,156.8 0.5 Other accounts payable and financial derivatives 635.7 2,838.0 2,619.3 206.2 240.4 399.6 540.3 Net financial worth 1) -1,568.0 10,272.0 -8,248.0 616.6 251.5 -151.2 -4,308.9
Financial account, transactions in liabilities
Total transactions in liabilities 4.6 54.2 -163.1 114.5 74.3 217.1 -185.6 Monetary gold and special drawing rights (SDRs) Currency and deposits 0.3 -92.4 -2.0 0.2 -8.9 -172.6 Short-term debt securities 0.7 -74.7 -20.9 -0.2 95.4 12.7 Long-term debt securities 17.6 31.7 130.4 2.1 154.2 -50.9 Loans -10.2 30.4 55.3 2.9 -1.8 22.2 of which long-term -2.6 79.1 18.6 0.6 -7.3 . Shares and other equity 58.9 68.3 -49.3 1.3 0.0 4.5 Quoted shares 9.6 9.6 0.1 0.0 0.0 . Unquoted shares and other equity 49.2 6.0 20.0 1.3 0.0 . Mutual fund shares 52.7 -69.4 . Insurance technical reserves 0.1 0.2 1.7 0.2 34.8 0.0 Other accounts payable and financial derivatives 14.7 -53.9 -97.8 0.8 33.1 -21.8 -1.6 Changes in net financial worth due to transactions 1) -54.3 96.9 -60.1 47.0 3.8 -19.4 -122.5 54.3
Other changes account, liabilities
Total other changes in liabilities 1.6 -636.1 87.1 -100.5 -115.5 8.5 -73.1 Monetary gold and special drawing rights (SDRs) Currency and deposits 0.0 67.4 0.0 0.0 -0.1 26.3 Short-term debt securities 2.1 5.1 0.4 0.0 -0.7 -0.5 Long-term debt securities 1.0 5.9 -12.1 -3.7 6.9 0.3 Loans 0.6 12.5 17.3 3.4 0.3 -2.3 of which long-term 1.8 12.3 12.7 2.8 0.3 . Shares and other equity -695.0 -69.1 -114.0 -58.2 -0.1 -84.1 Quoted shares -358.6 -66.9 -21.6 -42.8 0.0 . Unquoted shares and other equity -336.4 0.4 -25.0 -15.3 -0.1 . Mutual fund shares -2.6 -67.3 . Insurance technical reserves 0.0 0.0 0.0 0.0 -33.9 0.0 Other accounts payable and financial derivatives 1.0 43.3 77.7 7.9 -23.1 2.3 -12.9 Other changes in net financial worth 1) -7.3 -266.2 287.3 -28.6 8.6 44.3 -52.7 31.7
Closing balance sheet, liabilities
Total liabilities 6,363.6 21,826.5 23,035.8 9,247.1 6,073.5 7,694.1 12,849.8 Monetary gold and special drawing rights (SDRs) Currency and deposits 26.3 14,864.8 21.5 2.1 245.6 2,530.6 Short-term debt securities 284.4 257.7 105.3 10.7 942.4 280.3 Long-term debt securities 472.5 2,805.4 2,202.5 30.7 4,865.5 2,544.9 Loans 5,678.5 8,249.9 1,808.1 219.1 1,256.0 2,967.5 of which long-term 5,353.6 5,692.2 836.5 75.5 1,064.7 . Shares and other equity 9,637.0 2,445.1 4,894.0 402.8 4.2 4,000.7 Quoted shares 2,517.1 318.0 90.1 122.4 0.0 . Unquoted shares and other equity 7,119.9 924.0 1,010.7 279.6 4.2 . Mutual fund shares 1,203.1 3,793.2 . Insurance technical reserves 33.7 328.9 63.6 0.8 5,157.7 0.5 Other accounts payable and financial derivatives 651.4 2,827.4 2,599.2 215.0 250.4 380.0 525.8 Net financial worth 1) -1,629.6 10,102.7 -8,020.9 635.1 263.9 -126.4 -4,484.0 Source: ECB.

S 30ECB
Monthly Bulletin
October 2009
3.2 Euro area non-financial accounts (EUR billions; four-quarter cumulated flows)
Uses 2007 Q2- 2007 Q3- 2007 Q4- 2008 Q1- 2008 Q2-2005 2006 2007 2008 Q1 2008 Q2 2008 Q3 2008 Q4 2009 Q1
Generation of income account
Gross value added (basic prices) Taxes less subsidies on products Gross domestic product (market prices) Compensation of employees 3,905.8 4,068.0 4,252.2 4,300.7 4,350.5 4,395.5 4,429.5 4,435.0 Other taxes less subsidies on production 129.9 129.6 137.6 137.2 137.6 138.6 135.2 133.7 Consumption of fixed capital 1,185.2 1,243.6 1,310.3 1,324.9 1,340.7 1,356.1 1,370.3 1,384.4 Net operating surplus and mixed income 1) 2,075.9 2,190.4 2,332.4 2,358.9 2,390.5 2,397.9 2,380.1 2,307.8
Allocation of primary income account
Net operating surplus and mixed income Compensation of employees Taxes less subsidies on production Property income 2,616.1 3,039.9 3,562.1 3,667.3 3,774.7 3,862.4 3,890.9 3,805.8 Interest 1,346.6 1,644.5 2,033.5 2,123.1 2,203.2 2,275.5 2,299.4 2,225.5 Other property income 1,269.5 1,395.4 1,528.6 1,544.2 1,571.5 1,586.9 1,591.5 1,580.4 Net national income 1) 6,969.8 7,312.0 7,689.2 7,753.4 7,814.6 7,862.1 7,848.9 7,750.6
Secondary distribution of income account
Net national income Current taxes on income, wealth, etc. 935.6 1,027.8 1,111.6 1,128.3 1,140.0 1,142.1 1,124.9 1,116.1 Social contributions 1,477.8 1,539.7 1,598.3 1,613.9 1,630.2 1,648.0 1,662.8 1,671.7 Social benefits other than social transfers in kind 1,504.8 1,554.6 1,598.3 1,611.3 1,626.5 1,645.7 1,663.0 1,686.3 Other current transfers 710.3 718.4 746.2 756.6 764.9 768.2 776.2 772.2 Net non-life insurance premiums 178.8 177.7 181.5 182.1 183.5 184.2 184.9 183.0 Non-life insurance claims 179.6 177.9 181.0 181.6 183.3 184.1 185.4 183.4 Other 351.9 362.8 383.7 393.0 398.1 399.9 405.8 405.7 Net disposable income 1) 6,882.9 7,220.6 7,594.3 7,653.6 7,713.4 7,763.4 7,746.8 7,649.1
Use of income account
Net disposable income Final consumption expenditure 6,358.5 6,632.0 6,888.9 6,960.7 7,038.3 7,110.9 7,148.4 7,157.6 Individual consumption expenditure 5,693.0 5,947.5 6,177.7 6,241.6 6,309.1 6,373.0 6,402.6 6,402.6 Collective consumption expenditure 665.5 684.6 711.1 719.1 729.2 737.9 745.8 754.9 Adjustment for the change in net equity of households in pension funds reserves 60.8 59.3 60.1 61.3 64.1 66.1 66.8 67.8 Net saving 1) 524.7 588.8 705.7 693.1 675.3 652.6 598.5 491.7
Capital account
Net saving Gross capital formation 1,715.7 1,872.0 2,017.6 2,039.5 2,064.8 2,084.7 2,079.5 2,016.3 Gross fixed capital formation 1,710.1 1,855.9 1,995.9 2,016.6 2,044.3 2,061.1 2,043.7 1,992.0 Changes in inventories and acquisitions less disposals of valuables 5.6 16.0 21.7 23.0 20.5 23.6 35.8 24.4 Consumption of fixed capital Acquisitions less disposals of non-produced non-financial assets -0.1 0.5 -0.1 0.1 0.4 0.4 0.5 0.9 Capital transfers 182.6 175.5 163.1 163.4 167.8 161.7 162.3 160.8 Capital taxes 24.4 22.5 23.7 23.3 23.6 23.9 23.6 23.3 Other capital transfers 158.1 152.9 139.3 140.1 144.2 137.8 138.7 137.5 Net lending (+)/net borrowing (-) (from capital account) 1) 7.9 -25.6 12.2 -6.6 -33.7 -62.1 -98.4 -131.0 Sources: ECB and Eurostat.1) For the calculation of the balancing items, see the Technical notes.

S 31ECB
Monthly Bulletin
October 2009
EURO AREASTATISTICS
Euro area
accounts
3.2 Euro area non-financial accounts (cont'd) (EUR billions; four-quarter cumulated flows)
Resources 2007 Q2- 2007 Q3- 2007 Q4- 2008 Q1- 2008 Q2-2005 2006 2007 2008 Q1 2008 Q2 2008 Q3 2008 Q4 2009 Q1
Generation of income account
Gross value added (basic prices) 7,296.8 7,631.6 8,032.4 8,121.7 8,219.3 8,288.2 8,315.0 8,260.9 Taxes less subsidies on products 845.4 914.2 958.9 958.2 954.3 952.3 945.4 928.6 Gross domestic product (market prices)2) 8,142.1 8,545.8 8,991.3 9,079.8 9,173.6 9,240.4 9,260.4 9,189.4 Compensation of employees Other taxes less subsidies on production Consumption of fixed capital Net operating surplus and mixed income
Allocation of primary income account
Net operating surplus and mixed income 2,075.9 2,190.4 2,332.4 2,358.9 2,390.5 2,397.9 2,380.1 2,307.8 Compensation of employees 3,912.8 4,075.3 4,260.0 4,308.8 4,358.6 4,403.7 4,437.5 4,442.8 Taxes less subsidies on production 988.1 1,055.0 1,103.1 1,100.3 1,096.7 1,095.9 1,085.3 1,066.9 Property income 2,609.0 3,031.2 3,555.9 3,652.7 3,743.5 3,827.1 3,836.8 3,738.9 Interest 1,319.4 1,618.2 1,993.6 2,075.0 2,148.1 2,217.6 2,239.1 2,163.2 Other property income 1,289.7 1,413.1 1,562.4 1,577.7 1,595.4 1,609.5 1,597.7 1,575.7 Net national income
Secondary distribution of income account
Net national income 6,969.8 7,312.0 7,689.2 7,753.4 7,814.6 7,862.1 7,848.9 7,750.6 Current taxes on income, wealth, etc. 939.4 1,032.8 1,119.1 1,135.7 1,147.8 1,149.7 1,132.8 1,123.9 Social contributions 1,477.1 1,538.9 1,597.6 1,613.1 1,629.4 1,647.2 1,661.9 1,670.8 Social benefits other than social transfers in kind 1,497.0 1,546.3 1,589.0 1,601.9 1,616.8 1,636.1 1,653.0 1,676.1 Other current transfers 628.2 631.2 653.8 659.7 666.4 672.2 677.0 674.0 Net non-life insurance premiums 179.6 177.9 181.0 181.6 183.3 184.1 185.4 183.4 Non-life insurance claims 177.3 175.1 178.7 179.3 180.6 181.2 182.0 179.8 Other 271.3 278.2 294.1 298.8 302.6 307.0 309.6 310.8 Net disposable income
Use of income account
Net disposable income 6,882.9 7,220.6 7,594.3 7,653.6 7,713.4 7,763.4 7,746.8 7,649.1 Final consumption expenditure Individual consumption expenditure Collective consumption expenditure Adjustment for the change in net equity of households in pension funds reserves 61.0 59.6 60.3 61.5 64.3 66.3 67.0 67.9 Net saving
Capital account
Net saving 524.7 588.8 705.7 693.1 675.3 652.6 598.5 491.7 Gross capital formation Gross fixed capital formation Changes in inventories and acquisitions less disposals of valuables Consumption of fixed capital 1,185.2 1,243.6 1,310.3 1,324.9 1,340.7 1,356.1 1,370.3 1,384.4 Acquisitions less disposals of non-produced non-financial assets Capital transfers 196.2 189.9 176.9 178.6 183.3 176.0 175.2 170.9 Capital taxes 24.4 22.5 23.7 23.3 23.6 23.9 23.6 23.3 Other capital transfers 171.8 167.4 153.1 155.2 159.7 152.0 151.6 147.7 Net lending (+)/net borrowing (-) (from capital account) Sources: ECB and Eurostat.2) Gross domestic product is equal to gross value added of all domestic sectors plus net taxes (taxes less subsidies) on products.

S 32ECB
Monthly Bulletin
October 2009
3.3 Households (EUR billions; four-quarter cumulated flows; outstanding amounts at end-of-period)
2007 Q2- 2007 Q3- 2007 Q4- 2008 Q1- 2008 Q2-2005 2006 2007 2008 Q1 2008 Q2 2008 Q3 2008 Q4 2009 Q1
Income, saving and changes in net worth
Compensation of employees (+) 3,912.8 4,075.3 4,260.0 4,308.8 4,358.6 4,403.7 4,437.5 4,442.8 Gross operating surplus and mixed income (+) 1,331.0 1,407.3 1,486.6 1,506.2 1,525.8 1,541.9 1,550.8 1,540.2 Interest receivable (+) 230.6 269.1 306.1 316.9 328.9 339.5 342.1 332.2 Interest payable (-) 130.8 165.5 209.4 217.6 226.0 233.1 231.9 216.0 Other property income receivable (+) 717.8 761.2 802.5 806.5 813.7 819.6 812.8 811.1 Other property income payable (-) 9.5 9.7 9.8 9.7 9.8 9.7 9.7 9.8 Current taxes on income and wealth (-) 741.0 793.4 851.9 866.7 882.4 889.7 892.3 889.8 Net social contributions (-) 1,473.9 1,535.6 1,594.0 1,609.6 1,625.9 1,643.6 1,658.4 1,667.3 Net social benefits (+) 1,491.8 1,540.9 1,583.3 1,596.2 1,611.1 1,630.3 1,647.2 1,670.3 Net current transfers receivable (+) 66.8 67.4 70.7 71.2 74.2 75.6 77.3 77.9 = Gross disposable income 5,395.6 5,616.9 5,844.1 5,902.0 5,968.2 6,034.4 6,075.5 6,091.7 Final consumption expenditure (-) 4,693.4 4,899.7 5,088.5 5,141.3 5,193.7 5,246.2 5,262.1 5,249.2 Changes in net worth in pension funds (+) 60.6 59.2 59.8 61.1 63.8 65.8 66.5 67.5 = Gross saving 762.8 776.4 815.4 821.8 838.3 854.0 880.0 910.0 Consumption of fixed capital (-) 318.7 336.4 354.6 358.3 362.7 366.3 368.8 372.3 Net capital transfers receivable (+) 24.1 22.3 15.0 15.9 16.4 16.6 16.4 16.0 Other changes in net worth 1) (+) 510.6 563.9 37.3 -760.9 -1,167.5 -1,346.4 -1,785.1 -1,417.9 = Changes in net worth 1) 978.9 1,026.3 513.1 -281.5 -675.5 -842.1 -1,257.6 -864.2
Investment, financing and changes in net worth
Net acquisition of non-financial assets (+) 546.6 600.4 639.4 643.8 645.3 644.3 635.1 617.2 Consumption of fixed capital (-) 318.7 336.4 354.6 358.3 362.7 366.3 368.8 372.3 Main items of financial investment (+) Short-term assets 206.4 305.7 421.0 443.8 421.5 427.5 438.0 386.0 Currency and deposits 246.9 284.1 349.4 385.0 386.4 391.5 436.8 400.4 Money market fund shares -20.2 0.9 40.0 34.0 10.5 13.5 -9.6 2.1 Debt securities 2) -20.3 20.8 31.6 24.8 24.6 22.5 10.8 -16.5 Long-term assets 426.0 350.1 186.9 122.4 123.6 71.4 33.1 78.7 Deposits -4.7 0.8 -29.5 -34.8 -35.9 -39.7 -32.4 -18.3 Debt securities 0.5 69.9 9.7 29.6 60.5 69.1 49.0 59.6 Shares and other equity 136.6 -33.7 -61.8 -119.2 -127.5 -169.2 -158.2 -122.1 Quoted, unquoted shares and other equity 70.3 -11.1 8.8 -20.2 -13.6 -31.6 -17.0 0.1 Mutual fund shares 66.2 -22.5 -70.5 -99.0 -113.9 -137.6 -141.2 -122.2 Life insurance and pension fund reserves 293.7 313.1 268.5 246.7 226.5 211.1 174.6 159.6 Main items of financing (-) Loans 397.7 396.8 351.1 318.1 288.1 251.2 200.6 141.7 of which from euro area MFIs 358.5 347.4 281.5 249.1 196.5 181.0 78.9 17.2 Other changes in financial assets (+) Shares and other equity 446.5 509.9 10.9 -681.4 -1,024.3 -1,065.1 -1,394.2 -1,111.6 Life insurance and pension fund reserves 105.5 54.7 -2.0 -80.2 -129.9 -182.7 -250.7 -210.6 Remaining net flows (+) -35.7 -61.3 -37.4 -53.3 -60.9 -120.0 -149.5 -109.9 = Changes in net worth 1) 978.9 1,026.3 513.1 -281.5 -675.5 -842.1 -1,257.6 -864.2
Financial balance sheet
Financial assets (+) Short-term assets 4,486.5 4,747.9 5,209.4 5,362.3 5,482.8 5,540.0 5,714.6 5,787.8 Currency and deposits 4,174.1 4,454.2 4,844.2 4,937.1 5,055.3 5,104.9 5,313.7 5,377.7 Money market fund shares 296.4 257.6 296.0 347.0 346.5 348.7 327.4 352.0 Debt securities 2) 16.1 36.1 69.2 78.1 81.1 86.4 73.5 58.1 Long-term assets 10,933.2 11,902.7 12,066.4 11,401.5 11,125.1 10,760.6 10,278.0 10,034.6 Deposits 936.9 942.2 875.6 832.3 821.9 803.5 806.3 784.1 Debt securities 1,199.5 1,280.0 1,293.0 1,309.9 1,294.8 1,258.7 1,243.3 1,278.8 Shares and other equity 4,549.8 5,065.7 5,016.4 4,400.4 4,130.1 3,839.6 3,423.0 3,163.8 Quoted, unquoted shares and other equity 3,203.3 3,643.8 3,637.8 3,189.2 2,970.6 2,756.7 2,431.6 2,230.7 Mutual fund shares 1,346.5 1,421.8 1,378.7 1,211.1 1,159.5 1,083.0 991.4 933.1 Life insurance and pension fund reserves 4,247.1 4,614.8 4,881.3 4,859.0 4,878.3 4,858.7 4,805.3 4,808.0 Remaining net assets (+) 77.7 60.8 16.6 -3.5 -4.4 5.6 -32.5 -41.2 Liabilities (-) Loans 4,763.2 5,159.6 5,494.9 5,542.0 5,607.0 5,655.1 5,688.0 5,678.5 of which from euro area MFIs 4,201.0 4,553.0 4,824.7 4,860.8 4,887.0 4,938.3 4,901.4 4,879.6 = Net financial wealth 10,734.3 11,551.8 11,797.4 11,218.3 10,996.5 10,651.1 10,272.0 10,102.7
Sources: ECB and Eurostat.1) Excluding changes in net worth due to other changes in non-financial assets such as revaluations of residential property.2) Securities issued by MFIs with a maturity of less than two years and by other sectors with a maturity of less than one year.
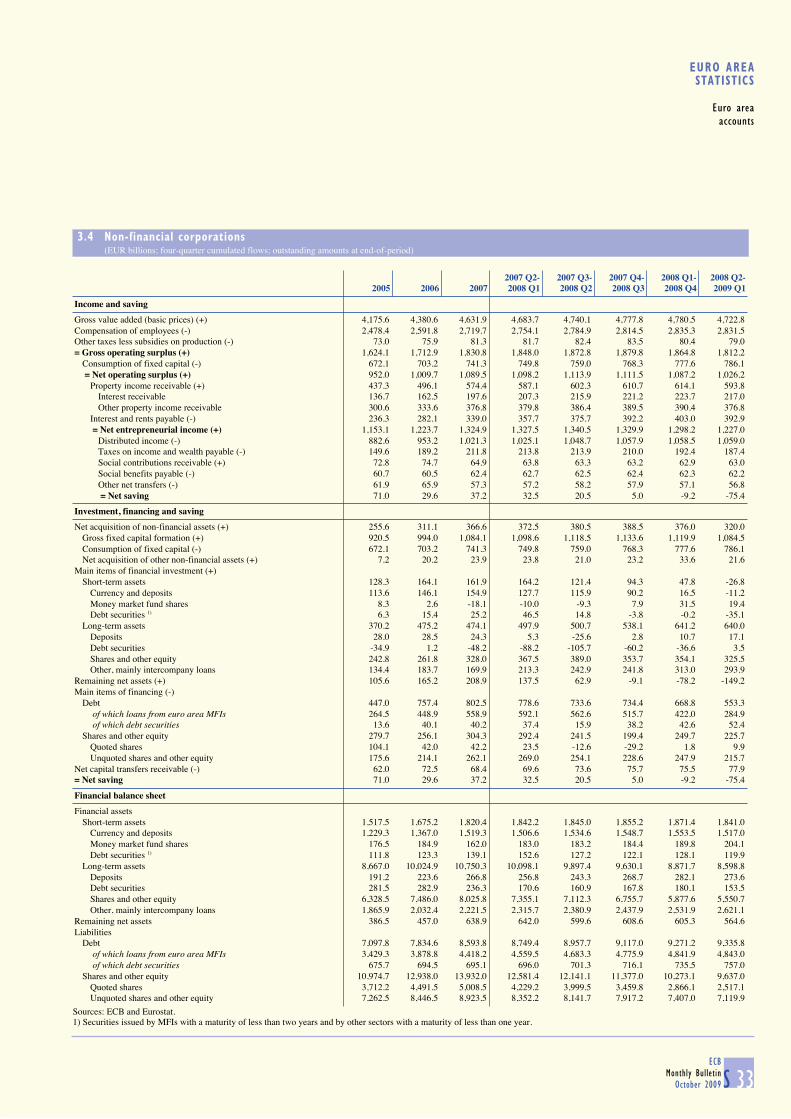
S 33ECB
Monthly Bulletin
October 2009
EURO AREASTATISTICS
Euro area
accounts
3.4 Non-financial corporations (EUR billions; four-quarter cumulated flows; outstanding amounts at end-of-period)
2007 Q2- 2007 Q3- 2007 Q4- 2008 Q1- 2008 Q2-2005 2006 2007 2008 Q1 2008 Q2 2008 Q3 2008 Q4 2009 Q1
Income and saving
Gross value added (basic prices) (+) 4,175.6 4,380.6 4,631.9 4,683.7 4,740.1 4,777.8 4,780.5 4,722.8 Compensation of employees (-) 2,478.4 2,591.8 2,719.7 2,754.1 2,784.9 2,814.5 2,835.3 2,831.5 Other taxes less subsidies on production (-) 73.0 75.9 81.3 81.7 82.4 83.5 80.4 79.0 = Gross operating surplus (+) 1,624.1 1,712.9 1,830.8 1,848.0 1,872.8 1,879.8 1,864.8 1,812.2 Consumption of fixed capital (-) 672.1 703.2 741.3 749.8 759.0 768.3 777.6 786.1 = Net operating surplus (+) 952.0 1,009.7 1,089.5 1,098.2 1,113.9 1,111.5 1,087.2 1,026.2 Property income receivable (+) 437.3 496.1 574.4 587.1 602.3 610.7 614.1 593.8 Interest receivable 136.7 162.5 197.6 207.3 215.9 221.2 223.7 217.0 Other property income receivable 300.6 333.6 376.8 379.8 386.4 389.5 390.4 376.8 Interest and rents payable (-) 236.3 282.1 339.0 357.7 375.7 392.2 403.0 392.9 = Net entrepreneurial income (+) 1,153.1 1,223.7 1,324.9 1,327.5 1,340.5 1,329.9 1,298.2 1,227.0 Distributed income (-) 882.6 953.2 1,021.3 1,025.1 1,048.7 1,057.9 1,058.5 1,059.0 Taxes on income and wealth payable (-) 149.6 189.2 211.8 213.8 213.9 210.0 192.4 187.4 Social contributions receivable (+) 72.8 74.7 64.9 63.8 63.3 63.2 62.9 63.0 Social benefits payable (-) 60.7 60.5 62.4 62.7 62.5 62.4 62.3 62.2 Other net transfers (-) 61.9 65.9 57.3 57.2 58.2 57.9 57.1 56.8 = Net saving 71.0 29.6 37.2 32.5 20.5 5.0 -9.2 -75.4
Investment, financing and saving
Net acquisition of non-financial assets (+) 255.6 311.1 366.6 372.5 380.5 388.5 376.0 320.0 Gross fixed capital formation (+) 920.5 994.0 1,084.1 1,098.6 1,118.5 1,133.6 1,119.9 1,084.5 Consumption of fixed capital (-) 672.1 703.2 741.3 749.8 759.0 768.3 777.6 786.1 Net acquisition of other non-financial assets (+) 7.2 20.2 23.9 23.8 21.0 23.2 33.6 21.6 Main items of financial investment (+) Short-term assets 128.3 164.1 161.9 164.2 121.4 94.3 47.8 -26.8 Currency and deposits 113.6 146.1 154.9 127.7 115.9 90.2 16.5 -11.2 Money market fund shares 8.3 2.6 -18.1 -10.0 -9.3 7.9 31.5 19.4 Debt securities 1) 6.3 15.4 25.2 46.5 14.8 -3.8 -0.2 -35.1 Long-term assets 370.2 475.2 474.1 497.9 500.7 538.1 641.2 640.0 Deposits 28.0 28.5 24.3 5.3 -25.6 2.8 10.7 17.1 Debt securities -34.9 1.2 -48.2 -88.2 -105.7 -60.2 -36.6 3.5 Shares and other equity 242.8 261.8 328.0 367.5 389.0 353.7 354.1 325.5 Other, mainly intercompany loans 134.4 183.7 169.9 213.3 242.9 241.8 313.0 293.9 Remaining net assets (+) 105.6 165.2 208.9 137.5 62.9 -9.1 -78.2 -149.2 Main items of financing (-) Debt 447.0 757.4 802.5 778.6 733.6 734.4 668.8 553.3 of which loans from euro area MFIs 264.5 448.9 558.9 592.1 562.6 515.7 422.0 284.9 of which debt securities 13.6 40.1 40.2 37.4 15.9 38.2 42.6 52.4 Shares and other equity 279.7 256.1 304.3 292.4 241.5 199.4 249.7 225.7 Quoted shares 104.1 42.0 42.2 23.5 -12.6 -29.2 1.8 9.9 Unquoted shares and other equity 175.6 214.1 262.1 269.0 254.1 228.6 247.9 215.7 Net capital transfers receivable (-) 62.0 72.5 68.4 69.6 73.6 75.7 75.5 77.9 = Net saving 71.0 29.6 37.2 32.5 20.5 5.0 -9.2 -75.4
Financial balance sheet
Financial assets Short-term assets 1,517.5 1,675.2 1,820.4 1,842.2 1,845.0 1,855.2 1,871.4 1,841.0 Currency and deposits 1,229.3 1,367.0 1,519.3 1,506.6 1,534.6 1,548.7 1,553.5 1,517.0 Money market fund shares 176.5 184.9 162.0 183.0 183.2 184.4 189.8 204.1 Debt securities 1) 111.8 123.3 139.1 152.6 127.2 122.1 128.1 119.9 Long-term assets 8,667.0 10,024.9 10,750.3 10,098.1 9,897.4 9,630.1 8,871.7 8,598.8 Deposits 191.2 223.6 266.8 256.8 243.3 268.7 282.1 273.6 Debt securities 281.5 282.9 236.3 170.6 160.9 167.8 180.1 153.5 Shares and other equity 6,328.5 7,486.0 8,025.8 7,355.1 7,112.3 6,755.7 5,877.6 5,550.7 Other, mainly intercompany loans 1,865.9 2,032.4 2,221.5 2,315.7 2,380.9 2,437.9 2,531.9 2,621.1 Remaining net assets 386.5 457.0 638.9 642.0 599.6 608.6 605.3 564.6 Liabilities Debt 7,097.8 7,834.6 8,593.8 8,749.4 8,957.7 9,117.0 9,271.2 9,335.8 of which loans from euro area MFIs 3,429.3 3,878.8 4,418.2 4,559.5 4,683.3 4,775.9 4,841.9 4,843.0 of which debt securities 675.7 694.5 695.1 696.0 701.3 716.1 735.5 757.0 Shares and other equity 10,974.7 12,938.0 13,932.0 12,581.4 12,141.1 11,377.0 10,273.1 9,637.0 Quoted shares 3,712.2 4,491.5 5,008.5 4,229.2 3,999.5 3,459.8 2,866.1 2,517.1 Unquoted shares and other equity 7,262.5 8,446.5 8,923.5 8,352.2 8,141.7 7,917.2 7,407.0 7,119.9Sources: ECB and Eurostat.1) Securities issued by MFIs with a maturity of less than two years and by other sectors with a maturity of less than one year.

S 34ECB
Monthly Bulletin
October 2009
3.5 Insurance corporations and pension funds (EUR billions; four-quarter cumulated flows; outstanding amounts at end-of-period)
2007 Q2- 2007 Q3- 2007 Q4- 2008 Q1- 2008 Q2-2005 2006 2007 2008 Q1 2008 Q2 2008 Q3 2008 Q4 2009 Q1
Financial account, financial transactions
Main items of financial investment (+) Short-term assets 25.6 64.8 87.8 110.0 102.8 88.8 106.7 50.7 Currency and deposits 7.2 11.0 6.4 32.7 35.7 32.1 59.1 18.7 Money market fund shares -0.5 3.5 3.1 15.8 14.2 20.9 22.2 13.6 Debt securities 1) 18.9 50.2 78.3 61.6 52.9 35.8 25.3 18.4 Long-term assets 284.3 317.1 220.4 214.1 172.9 156.3 131.9 111.6 Deposits 17.2 76.8 51.5 27.8 15.8 0.6 -1.2 9.9 Debt securities 133.1 126.7 92.9 83.0 74.1 90.4 70.1 72.6 Loans -4.1 2.5 -13.6 20.2 16.3 20.0 30.3 6.3 Quoted shares 30.8 -1.4 -5.8 -2.9 -1.7 -9.4 -6.0 -4.4 Unquoted shares and other equity 19.9 28.6 29.6 44.7 39.7 41.7 34.3 26.0 Mutual fund shares 87.4 84.1 65.8 41.3 28.5 12.8 4.5 1.2 Remaining net assets (+) 12.2 3.2 -26.7 -20.9 -17.4 -7.8 23.7 -5.2 Main items of financing (-) Debt securities -0.4 5.7 3.9 4.4 5.1 5.4 9.3 9.8 Loans 17.3 35.9 21.7 44.0 18.1 4.1 21.7 -9.9 Shares and other equity 10.6 11.5 1.7 -0.9 -1.9 -7.1 3.6 4.5 Insurance technical reserves 335.5 323.9 287.0 269.6 252.2 237.8 193.1 160.2 Net equity of households in life insurance and pension fund reserves 292.8 310.0 283.3 264.3 242.1 222.5 179.0 152.1 Prepayments of insurance premiums and reserves for outstanding claims 42.6 14.0 3.6 5.4 10.2 15.3 14.2 8.1 = Changes in net financial worth due to transactions -40.9 8.1 -32.8 -13.8 -15.3 -3.0 34.6 -7.4
Other changes account
Other changes in financial assets (+) Shares and other equity 190.7 180.5 -12.0 -218.4 -327.5 -399.1 -540.5 -437.6 Other net assets 76.1 -34.5 -58.7 -1.9 -19.1 -27.8 35.0 27.1 Other changes in liabilities (-) Shares and other equity 118.4 35.0 -31.4 -92.7 -148.2 -146.7 -187.7 -188.4 Insurance technical reserves 137.8 52.9 -3.3 -80.8 -132.3 -188.5 -255.5 -215.5 Net equity of households in life insurance and pension fund reserves 146.9 56.2 -2.8 -78.1 -127.6 -180.8 -246.2 -208.6 Prepayments of insurance premiums and reserves for outstanding claims -9.1 -3.3 -0.4 -2.7 -4.7 -7.7 -9.3 -6.9 = Other changes in net financial worth 10.6 58.2 -36.0 -46.8 -66.1 -91.6 -62.3 -6.6
Financial balance sheet
Financial assets (+) Short-term assets 437.2 509.4 591.2 650.1 659.3 664.1 702.3 707.8 Currency and deposits 146.6 157.1 164.6 192.5 182.6 189.5 226.6 216.8 Money market fund shares 75.6 81.5 82.4 95.4 94.8 98.3 102.2 109.9 Debt securities 1) 215.0 270.8 344.1 362.2 381.9 376.3 373.5 381.1 Long-term assets 4,608.2 5,045.0 5,198.6 5,102.6 5,039.0 4,974.1 4,805.3 4,770.0 Deposits 524.7 602.4 650.6 649.3 653.4 648.7 648.2 660.8 Debt securities 1,776.4 1,848.5 1,893.5 1,941.7 1,921.2 1,966.9 1,974.9 2,009.1 Loans 353.5 351.2 331.8 359.1 355.0 356.9 364.8 363.3 Quoted shares 653.3 725.1 708.3 613.9 595.1 536.3 426.0 392.7 Unquoted shares and other equity 392.8 471.0 506.5 485.5 468.7 455.7 433.0 414.2 Mutual fund shares 907.5 1,046.9 1,107.9 1,053.1 1,045.7 1,009.6 958.4 929.8 Remaining net assets (+) 176.9 203.3 171.9 192.0 176.9 175.5 213.5 216.9 Liabilities (-) Debt securities 21.3 35.9 35.2 35.8 36.5 36.7 43.2 41.5 Loans 136.4 167.7 187.2 221.6 211.4 206.7 212.8 219.1 Shares and other equity 626.9 673.4 643.6 586.6 548.3 527.1 459.6 402.8 Insurance technical reserves 4,558.7 4,935.5 5,219.2 5,213.0 5,237.5 5,221.3 5,156.8 5,157.7 Net equity of households in life insurance and pension fund reserves 3,892.0 4,258.2 4,538.7 4,526.1 4,547.7 4,530.5 4,471.5 4,469.6 Prepayments of insurance premiums and reserves for outstanding claims 666.7 677.3 680.5 686.9 689.8 690.8 685.4 688.1 = Net financial wealth -121.0 -54.7 -123.5 -112.3 -158.5 -178.0 -151.2 -126.4
Source: ECB.1) Securities issued by MFIs with a maturity of less than two years and by other sectors with a maturity of less than one year.

S 35ECB
Monthly Bulletin
October 2009
4FINANCIAL MARKETS
4.1 Securities, other than shares, by original maturity, residency of the issuer and currency (EUR billions and period growth rates; seasonally adjusted; transactions during the month and end-of-period outstanding amounts; nominal values)
Total
By euro area residents
Total in euro 1) In euro In all currencies
Outstanding Gross issues Net issues Outstanding Gross issues Net issues Outstanding Gross issues Net issues Annual Seasonally adjusted 2)
amounts amounts amounts growth rates6-month
Net issues growth rates1 2 3 4 5 6 7 8 9 10 11 12
2008 July 13,506.6 1,139.6 11.2 11,308.9 1,073.9 55.6 12,614.3 1,160.7 75.0 7.1 100.9 7.1 Aug. 13,632.4 880.7 123.0 11,416.8 816.0 105.2 12,744.0 889.5 110.5 7.8 146.5 9.0 Sep. 13,635.5 1,022.1 1.5 11,384.4 930.5 -33.7 12,704.1 1,001.3 -43.2 7.0 8.1 8.7 Oct. 13,733.5 1,454.3 97.4 11,535.3 1,417.3 150.3 12,903.2 1,494.5 145.4 6.9 119.4 9.5 Nov. 13,953.5 1,422.3 218.5 11,764.4 1,369.7 227.9 13,098.0 1,437.1 213.9 8.1 193.3 11.0 Dec. 14,139.1 1,537.5 189.1 11,916.6 1,448.8 155.9 13,170.4 1,526.0 142.6 9.5 228.7 13.12009 Jan. 14,239.2 1,500.7 95.5 12,057.3 1,451.4 137.1 13,372.6 1,530.0 146.3 10.1 104.4 13.1 Feb. 14,431.3 1,259.2 189.7 12,243.3 1,200.0 183.8 13,576.0 1,285.5 203.4 11.1 156.1 13.1 Mar. 14,606.0 1,318.0 173.2 12,382.0 1,229.8 137.3 13,680.3 1,323.1 148.3 11.9 132.9 15.2 Apr. 14,683.8 1,230.4 77.5 12,482.8 1,164.1 100.4 13,794.3 1,247.1 108.4 12.1 90.6 14.6 May 14,888.5 1,157.4 205.3 12,653.6 1,068.0 171.6 13,930.3 1,154.4 166.8 12.0 106.9 12.9 June 14,973.9 1,082.7 87.2 12,711.9 1,004.0 59.9 13,996.9 1,086.8 73.0 11.9 91.5 10.5 July . . . 12,761.1 1,066.2 51.9 14,060.7 1,146.0 67.4 11.7 101.2 10.4
Long-term
2008 July 12,113.9 208.9 25.2 10,055.9 178.6 30.1 11,154.0 196.7 35.7 5.3 68.4 5.7 Aug. 12,203.1 160.0 87.2 10,133.8 133.8 76.1 11,252.6 149.2 76.8 6.1 121.4 7.7 Sep. 12,192.1 183.6 -10.2 10,111.8 145.5 -21.2 11,236.2 158.6 -31.6 5.7 0.8 7.5 Oct. 12,216.6 199.0 24.8 10,147.8 182.8 36.3 11,329.3 195.4 30.8 5.3 32.9 6.7 Nov. 12,393.7 275.5 174.4 10,325.3 253.9 175.0 11,486.8 262.8 166.1 6.2 138.5 8.0 Dec. 12,572.4 362.9 179.8 10,496.5 328.3 172.7 11,581.0 340.0 153.4 7.3 165.0 9.72009 Jan. 12,649.7 291.7 75.1 10,587.0 276.9 89.3 11,716.3 300.3 89.9 8.2 116.4 10.6 Feb. 12,819.3 300.6 168.5 10,748.6 269.6 160.7 11,889.0 296.7 172.9 9.2 135.6 10.7 Mar. 13,002.4 319.8 153.3 10,921.6 280.2 143.3 12,026.4 301.8 144.4 10.4 141.7 13.3 Apr. 13,078.6 289.1 77.2 10,989.8 254.2 69.3 12,104.7 273.0 72.8 10.3 69.6 14.0 May 13,278.9 336.5 201.4 11,157.2 278.6 168.6 12,252.6 298.9 172.6 10.6 110.0 13.3 June 13,395.4 307.0 117.0 11,264.4 271.9 107.5 12,378.9 305.7 127.6 10.8 100.5 11.9 July . . . 11,291.0 244.9 29.0 12,415.0 269.4 39.1 10.8 80.4 11.1
C16 Total outstanding amounts and gross issues of securities, other than shares, issued by euro area residents(EUR billions)
2000
4000
6000
8000
10000
12000
14000
16000
18000
1994 1995 1996 1997 1998 1999 2000 2001 2002 2003 2004 2005 2006 2007 2008 20090
200
400
600
800
1000
1200
1400
1600
total gross issues (right-hand scale)total outstanding amounts (left-hand scale)outstanding amounts in euro (left-hand scale)
Sources: ECB and BIS (for issues by non-euro area residents).1) Total euro-denominated securities, other than shares, issued by euro area residents and non-euro area residents.2) For the calculation of the growth rates, see the Technical notes. The 6-month growth rates have been annualised.

S 36ECB
Monthly Bulletin
October 2009
4.2 Securities, other than shares, issued by euro area residents, by sector of the issuer and instrument type (EUR billions ; transactions during the month and end-of-period outstanding amounts; nominal values)
1. Outstanding amounts and gross issues
Total
Outstanding amounts Gross issues 1)
Total MFIs Non-MFI corporations General government Total MFIs Non-MFI corporations General government
(including (includingEurosystem) Financial Non-financial Central Other Eurosystem) Financial Non-financial Central Other
corporations corporations government general corporations corporations government generalother than government other than government
MFIs MFIs1 2 3 4 5 6 7 8 9 10 11 12
2007 12,066 5,046 1,506 653 4,534 327 1,138 841 59 109 116 122008 13,170 5,268 1,929 696 4,937 340 1,177 817 74 100 162 242008 Q3 12,704 5,267 1,686 681 4,747 324 1,017 691 54 97 148 27 Q4 13,170 5,268 1,929 696 4,937 340 1,486 1,006 136 107 209 282009 Q1 13,680 5,394 2,038 719 5,187 343 1,380 922 78 92 251 35 Q2 13,997 5,432 2,119 750 5,344 351 1,163 748 62 89 244 202009 Apr. 13,794 5,423 2,072 730 5,219 350 1,247 806 65 90 259 26 May 13,930 5,459 2,100 742 5,280 350 1,154 744 67 88 239 17 June 13,997 5,432 2,119 750 5,344 351 1,087 693 54 88 235 16 July 14,061 5,447 2,153 763 5,344 353 1,146 718 68 94 250 14
Short-term
2007 1,287 787 36 100 345 18 946 754 18 101 64 92008 1,589 822 61 115 566 25 962 723 26 92 101 192008 Q3 1,468 826 62 111 457 13 849 614 25 92 94 24 Q4 1,589 822 61 115 566 25 1,220 911 38 95 152 232009 Q1 1,654 838 41 98 659 18 1,080 806 17 74 156 27 Q2 1,618 785 37 84 696 16 870 631 14 69 143 132009 Apr. 1,690 830 42 95 705 17 974 694 16 74 173 16 May 1,678 832 40 89 701 15 856 626 13 64 142 10 June 1,618 785 37 84 696 16 781 572 15 69 113 12 July 1,646 779 35 84 731 17 877 615 11 77 167 7
Long-term 2)
2007 10,779 4,259 1,469 553 4,189 309 191 86 41 8 52 32008 11,581 4,446 1,868 581 4,371 315 215 95 48 8 61 42008 Q3 11,236 4,441 1,624 570 4,290 311 168 76 29 5 54 3 Q4 11,581 4,446 1,868 581 4,371 315 266 95 98 11 57 52009 Q1 12,026 4,555 1,997 621 4,528 324 300 116 61 18 96 8 Q2 12,379 4,647 2,082 666 4,648 336 293 117 47 20 101 72009 Apr. 12,105 4,593 2,029 636 4,514 333 273 112 49 16 86 10 May 12,253 4,626 2,060 653 4,579 335 299 118 54 24 96 6 June 12,379 4,647 2,082 666 4,648 336 306 121 39 20 122 4 July 12,415 4,667 2,119 679 4,613 337 269 103 58 18 83 7
Of which long-term fixed rate
2007 7,324 2,263 594 419 3,797 250 107 44 10 5 45 32008 7,614 2,328 636 445 3,955 250 119 48 9 6 53 32008 Q3 7,534 2,370 619 432 3,865 248 101 42 7 3 47 2 Q4 7,614 2,328 636 445 3,955 250 120 42 13 10 53 22009 Q1 7,934 2,398 703 487 4,094 252 208 72 27 18 86 5 Q2 8,243 2,495 748 532 4,209 259 207 71 23 19 90 52009 Apr. 7,986 2,422 719 501 4,085 258 183 62 21 15 77 7 May 8,108 2,461 728 519 4,139 260 208 77 20 23 84 5 June 8,243 2,495 748 532 4,209 259 230 74 28 18 109 2 July 8,258 2,511 767 545 4,175 259 180 62 24 17 72 6
Of which long-term variable rate
2007 3,001 1,621 857 123 342 58 69 31 30 3 4 02008 3,479 1,723 1,202 126 363 64 81 36 38 1 5 12008 Q3 3,229 1,698 978 129 362 61 53 24 21 2 4 1 Q4 3,479 1,723 1,202 126 363 64 129 39 83 1 3 22009 Q1 3,589 1,756 1,269 124 369 70 75 32 34 0 5 3 Q2 3,620 1,739 1,308 124 374 75 65 30 24 1 7 22009 Apr. 3,605 1,763 1,285 124 360 73 72 37 27 1 5 3 May 3,619 1,750 1,306 123 367 73 72 26 34 1 9 1 June 3,620 1,739 1,308 124 374 75 50 28 11 2 7 2 July 3,639 1,744 1,326 123 369 76 73 30 33 0 7 1
Source: ECB.1) Monthly averages of/monthly data for the transactions during this period.2) The residual difference between total long-term debt securities and fixed and variable rate long-term debt securities consists of zero coupon bonds and revaluation effects.

S 37ECB
Monthly Bulletin
October 2009
EURO AREASTATISTICS
Financial
markets
4.2 Securities, other than shares, issued by euro area residents, by sector of the issuer and instrument type (EUR billions unless otherwise indicated; transactions during the period; nominal values)
2. Net issues
Total
Non-seasonally adjusted 1) Seasonally adjusted 1)
Total MFIs Non-MFI corporations General government Total MFIs Non-MFI corporations General government
(including (includingEurosystem) Financial Non-financial Central Other Eurosystem) Financial Non-financial Central Other
corporations corporations government general corporations corporations government generalother than government other than government
MFIs MFIs1 2 3 4 5 6 7 8 9 10 11 12
2007 83.6 40.7 27.6 4.2 9.9 1.2 83.7 41.3 27.1 4.3 10.0 1.12008 95.1 23.2 35.2 3.9 31.7 1.1 95.8 23.3 34.4 4.0 33.1 0.92008 Q3 47.4 10.9 18.6 2.0 14.7 1.2 85.2 20.0 32.9 4.7 25.3 2.2 Q4 167.3 11.4 81.6 6.0 63.0 5.3 180.4 21.6 56.5 9.0 90.7 2.82009 Q1 166.0 40.5 35.5 7.0 82.1 0.9 131.1 21.1 45.4 5.1 56.9 2.5 Q2 116.0 21.0 27.8 10.6 53.8 2.9 96.3 20.3 27.5 6.5 39.1 3.02009 Apr. 108.4 28.0 31.7 10.2 31.3 7.2 90.6 16.2 37.4 6.4 23.9 6.8 May 166.8 54.2 33.2 13.5 66.0 -0.2 106.9 30.8 30.5 5.9 39.3 0.5 June 73.0 -19.4 18.3 8.1 64.1 1.8 91.5 13.8 14.6 7.3 54.0 1.7 July 67.4 18.0 34.6 12.3 0.3 2.2 101.2 13.5 48.2 12.4 24.5 2.7
Long-term
2007 61.7 23.9 27.0 2.4 7.8 0.7 61.3 24.1 26.4 2.4 7.7 0.72008 65.8 16.2 33.2 2.5 13.3 0.5 65.0 16.4 32.4 2.6 13.2 0.52008 Q3 26.9 7.4 15.2 2.6 1.3 0.5 63.5 16.2 29.6 4.1 12.2 1.5 Q4 116.8 2.9 81.8 4.4 26.2 1.5 112.1 12.5 57.2 4.7 37.0 0.72009 Q1 135.7 25.8 42.3 12.9 51.7 3.1 131.3 17.1 52.4 14.4 44.4 3.0 Q2 124.4 35.3 29.1 15.1 41.0 3.8 93.3 24.6 28.2 11.5 25.4 3.72009 Apr. 72.8 36.1 30.5 13.2 -15.3 8.3 69.6 27.8 36.5 11.8 -14.3 7.7 May 172.6 47.3 35.2 19.0 69.0 2.2 110.0 24.5 30.9 12.4 39.6 2.5 June 127.6 22.5 21.7 13.2 69.3 1.0 100.5 21.5 17.3 10.2 50.8 0.8 July 39.1 23.3 36.7 12.5 -34.7 1.3 80.4 22.4 51.7 13.1 -8.7 1.9
C17 Net issues of securities, other than shares, seasonally adjusted and non-seasonally adjusted(EUR billions; transactions during the month; nominal values)
-100
-50
0
50
100
150
200
250
2003 2004 2005 2006 2007 2008 2009-100
-50
0
50
100
150
200
250
net issuesnet issues, seasonally adjusted
Source: ECB.1) Monthly averages of/monthly data for the transactions during this period.

S 38ECB
Monthly Bulletin
October 2009
4.3 Growth rates of securities, other than shares, issued by euro area residents 1) (percentage changes)
Total
Annual growth rates (non-seasonally adjusted) 6-month seasonally adjusted growth rates
Total MFIs Non-MFI corporations General government Total MFIs Non-MFI corporations General government
(including (includingEurosystem) Financial Non-financial Central Other Eurosystem) Financial Non-financial Central Other
corporations corporations government general corporations corporations government generalother than government other than government
MFIs MFIs1 2 3 4 5 6 7 8 9 10 11 12
2008 July 7.1 8.6 21.5 2.7 2.1 3.3 7.1 7.0 22.4 2.0 3.6 2.4 Aug. 7.8 8.4 23.9 4.9 3.0 3.4 9.0 8.8 27.9 3.1 4.5 5.9 Sep. 7.0 6.9 23.8 6.0 2.6 2.3 8.7 8.1 28.4 5.3 3.9 5.9 Oct. 6.9 5.3 21.0 4.3 5.0 2.8 9.5 6.7 25.8 5.1 8.2 9.9 Nov. 8.1 5.7 24.0 4.2 6.7 2.8 11.0 5.1 30.8 4.9 12.5 7.1 Dec. 9.5 5.5 28.0 7.2 8.4 3.9 13.1 4.8 35.7 12.7 15.5 9.62009 Jan. 10.1 5.3 30.3 7.0 9.6 5.4 13.1 3.6 38.4 12.2 16.0 8.5 Feb. 11.1 6.3 32.3 8.0 10.1 6.5 13.1 3.8 36.7 13.1 16.0 7.1 Mar. 11.9 6.5 33.4 9.0 11.5 7.9 15.2 4.9 38.5 12.8 19.5 9.9 Apr. 12.1 6.3 33.5 10.0 11.6 10.6 14.6 6.1 41.6 15.3 14.8 11.3 May 12.0 5.5 33.1 9.9 12.6 9.5 12.9 5.8 35.3 15.5 12.6 11.8 June 11.9 4.8 30.0 11.4 13.6 9.7 10.5 4.7 24.4 10.1 11.8 10.1 July 11.7 4.2 31.0 12.6 13.5 9.5 10.4 4.8 24.2 13.1 10.9 10.6
Long-term
2008 July 5.3 5.2 19.5 2.2 1.6 3.1 5.7 5.8 20.1 0.8 1.9 2.5 Aug. 6.1 5.3 21.6 3.1 2.5 3.5 7.7 7.2 27.0 2.1 2.8 5.0 Sep. 5.7 5.1 21.5 4.5 1.7 2.2 7.5 7.1 27.1 5.5 1.9 4.3 Oct. 5.3 4.3 19.3 3.8 2.1 1.4 6.7 6.0 23.8 4.5 2.1 5.5 Nov. 6.2 4.5 22.6 3.2 3.4 1.3 8.0 4.6 29.6 3.6 5.2 3.0 Dec. 7.3 4.6 27.0 5.5 3.8 2.1 9.7 4.0 35.8 9.7 7.1 4.32009 Jan. 8.2 4.4 30.9 8.2 4.4 3.3 10.6 3.1 42.6 16.0 7.1 4.1 Feb. 9.2 5.1 34.1 10.5 5.1 3.9 10.7 3.0 41.4 19.4 7.3 2.9 Mar. 10.4 5.5 35.0 13.0 6.7 5.7 13.3 4.0 43.4 21.0 11.7 7.2 Apr. 10.3 5.6 34.9 14.8 5.9 8.6 14.0 5.3 46.9 26.0 9.9 11.8 May 10.6 5.2 34.6 16.1 7.1 8.5 13.3 5.7 39.6 30.1 9.0 14.2 June 10.8 4.8 31.9 18.7 8.4 8.5 11.9 5.6 28.1 28.3 9.7 13.1 July 10.8 4.6 33.6 20.7 7.8 8.2 11.1 6.1 25.3 25.5 8.4 12.4
C18 Annual growth rates of long-term debt securities, by sector of the issuer, in all currencies combined(annual percentage changes)
0
5
10
15
20
25
30
35
1994 1995 1996 1997 1998 1999 2000 2001 2002 2003 2004 2005 2006 2007 2008 20090
5
10
15
20
25
30
35
general governmentMFIs (including Eurosystem)non-MFI corporations
Source: ECB.1) For the calculation of the growth rates, see the Technical notes.The 6-month growth rates have been annualised.
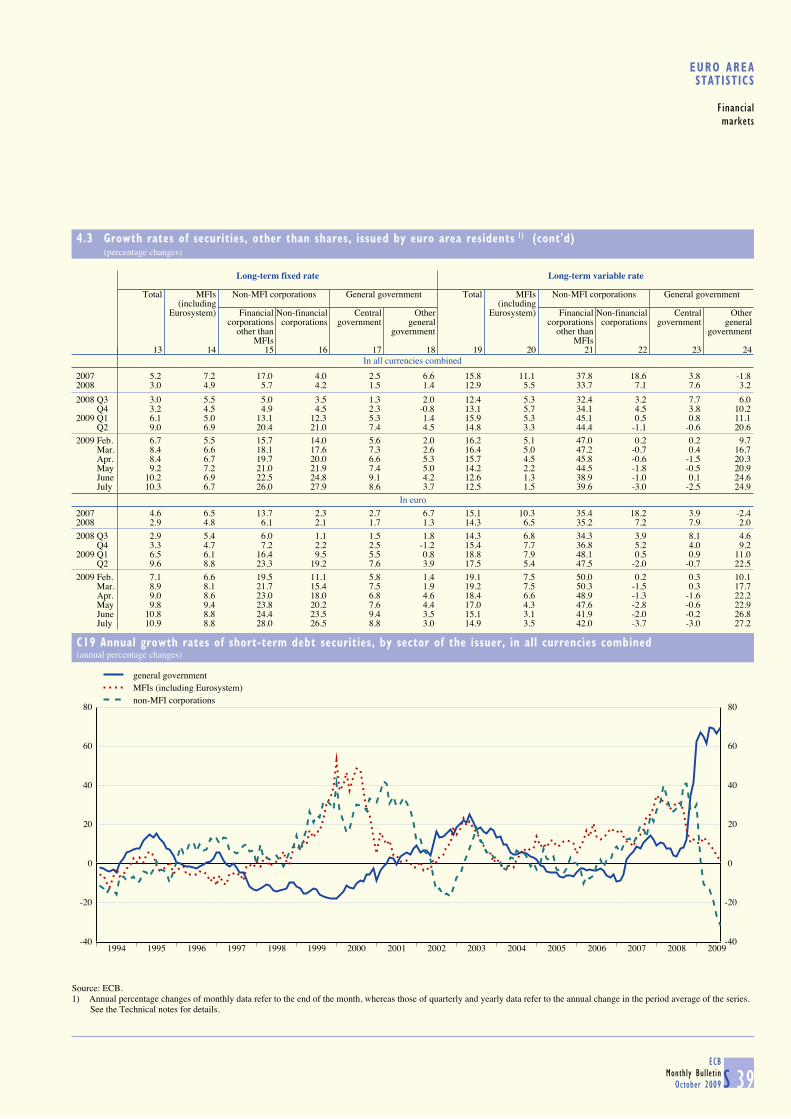
S 39ECB
Monthly Bulletin
October 2009
EURO AREASTATISTICS
Financial
markets
4.3 Growth rates of securities, other than shares, issued by euro area residents 1) (cont'd) (percentage changes)
In all currencies combined
Long-term fixed rate Long-term variable rate
Total MFIs Non-MFI corporations General government Total MFIs Non-MFI corporations General government
(including (includingEurosystem) Financial Non-financial Central Other Eurosystem) Financial Non-financial Central Other
corporations corporations government general corporations corporations government generalother than government other than government
MFIs MFIs13 14 15 16 17 18 19 20 21 22 23 24
2007 5.2 7.2 17.0 4.0 2.5 6.6 15.8 11.1 37.8 18.6 3.8 -1.82008 3.0 4.9 5.7 4.2 1.5 1.4 12.9 5.5 33.7 7.1 7.6 3.2
2008 Q3 3.0 5.5 5.0 3.5 1.3 2.0 12.4 5.3 32.4 3.2 7.7 6.0 Q4 3.2 4.5 4.9 4.5 2.3 -0.8 13.1 5.7 34.1 4.5 3.8 10.22009 Q1 6.1 5.0 13.1 12.3 5.3 1.4 15.9 5.3 45.1 0.5 0.8 11.1 Q2 9.0 6.9 20.4 21.0 7.4 4.5 14.8 3.3 44.4 -1.1 -0.6 20.6
2009 Feb. 6.7 5.5 15.7 14.0 5.6 2.0 16.2 5.1 47.0 0.2 0.2 9.7 Mar. 8.4 6.6 18.1 17.6 7.3 2.6 16.4 5.0 47.2 -0.7 0.4 16.7 Apr. 8.4 6.7 19.7 20.0 6.6 5.3 15.7 4.5 45.8 -0.6 -1.5 20.3 May 9.2 7.2 21.0 21.9 7.4 5.0 14.2 2.2 44.5 -1.8 -0.5 20.9 June 10.2 6.9 22.5 24.8 9.1 4.2 12.6 1.3 38.9 -1.0 0.1 24.6 July 10.3 6.7 26.0 27.9 8.6 3.7 12.5 1.5 39.6 -3.0 -2.5 24.9
In euro
2007 4.6 6.5 13.7 2.3 2.7 6.7 15.1 10.3 35.4 18.2 3.9 -2.42008 2.9 4.8 6.1 2.1 1.7 1.3 14.3 6.5 35.2 7.2 7.9 2.0
2008 Q3 2.9 5.4 6.0 1.1 1.5 1.8 14.3 6.8 34.3 3.9 8.1 4.6 Q4 3.3 4.7 7.2 2.2 2.5 -1.2 15.4 7.7 36.8 5.2 4.0 9.22009 Q1 6.5 6.1 16.4 9.5 5.5 0.8 18.8 7.9 48.1 0.5 0.9 11.0 Q2 9.6 8.8 23.3 19.2 7.6 3.9 17.5 5.4 47.5 -2.0 -0.7 22.5
2009 Feb. 7.1 6.6 19.5 11.1 5.8 1.4 19.1 7.5 50.0 0.2 0.3 10.1 Mar. 8.9 8.1 21.7 15.4 7.5 1.9 19.2 7.5 50.3 -1.5 0.3 17.7 Apr. 9.0 8.6 23.0 18.0 6.8 4.6 18.4 6.6 48.9 -1.3 -1.6 22.2 May 9.8 9.4 23.8 20.2 7.6 4.4 17.0 4.3 47.6 -2.8 -0.6 22.9 June 10.8 8.8 24.4 23.5 9.4 3.5 15.1 3.1 41.9 -2.0 -0.2 26.8 July 10.9 8.8 28.0 26.5 8.8 3.0 14.9 3.5 42.0 -3.7 -3.0 27.2
C19 Annual growth rates of short-term debt securities, by sector of the issuer, in all currencies combined(annual percentage changes)
-40
-20
0
20
40
60
80
1994 1995 1996 1997 1998 1999 2000 2001 2002 2003 2004 2005 2006 2007 2008 2009-40
-20
0
20
40
60
80
general governmentMFIs (including Eurosystem)non-MFI corporations
Source: ECB.1) Annual percentage changes of monthly data refer to the end of the month, whereas those of quarterly and yearly data refer to the annual change in the period average of the series. See the Technical notes for details.

S 40ECB
Monthly Bulletin
October 2009
4.4 Quoted shares issued by euro area residents 1) (EUR billions, unless otherwise indicated; market values)
1. Outstanding amounts and annual growth rates(outstanding amounts as end-of-period)
Total MFIs Financial corporations other than MFIs Non-financial corporations
Total Index Annual Total Annual Total Annual Total AnnualDec. 01 = growth growth growth growth
100 rates (%) rates (%) rates (%) rates (%)
1 2 3 4 5 6 7 8 92007 July 6,740.3 104.0 1.3 1,101.6 1.7 608.9 1.1 5,029.8 1.2 Aug. 6,626.8 103.9 1.2 1,062.0 1.6 583.9 1.0 4,981.0 1.2 Sep. 6,690.9 104.0 1.2 1,050.6 1.9 597.3 0.8 5,042.9 1.1 Oct. 6,945.9 104.3 1.4 1,074.6 1.3 628.2 3.3 5,243.1 1.2 Nov. 6,631.8 104.3 1.4 1,034.6 1.1 578.6 3.3 5,018.6 1.2 Dec. 6,588.7 104.4 1.4 1,019.0 1.2 578.4 2.9 4,991.2 1.22008 Jan. 5,766.1 104.4 1.3 889.8 0.8 497.0 2.8 4,379.3 1.2 Feb. 5,820.8 104.5 1.2 860.1 0.5 492.0 2.6 4,468.7 1.2 Mar. 5,567.1 104.5 1.2 860.5 1.1 501.0 2.5 4,205.6 1.1 Apr. 5,748.0 104.4 1.0 837.2 1.3 519.1 2.4 4,391.6 0.7 May 5,729.4 104.5 0.9 771.0 1.8 496.7 2.5 4,461.7 0.6 June 5,081.0 104.5 0.6 665.3 1.8 435.5 2.4 3,980.2 0.1 July 4,972.6 104.6 0.6 691.6 2.8 427.9 2.5 3,853.1 0.0 Aug. 4,999.2 104.6 0.6 665.5 2.8 438.0 2.7 3,895.6 0.0 Sep. 4,430.0 104.7 0.7 612.2 3.6 381.8 2.6 3,436.0 0.0 Oct. 3,743.7 105.0 0.7 451.9 4.2 280.1 2.8 3,011.8 -0.1 Nov. 3,489.3 105.2 0.9 394.5 5.9 265.1 2.3 2,829.7 -0.2 Dec. 3,482.5 105.4 1.0 377.0 5.8 269.0 3.0 2,836.5 -0.12009 Jan. 3,286.8 105.6 1.1 344.6 7.4 239.9 3.1 2,702.3 -0.1 Feb. 2,922.1 105.6 1.1 276.7 7.3 189.0 3.1 2,456.4 -0.1 Mar. 3,009.9 106.1 1.5 315.8 8.0 204.8 3.2 2,489.2 0.4 Apr. 3,435.5 106.2 1.7 414.4 8.2 249.9 3.3 2,771.3 0.5 May 3,580.6 106.5 2.0 455.2 8.9 254.8 3.1 2,870.6 0.8 June 3,530.7 107.3 2.7 448.5 9.8 257.9 4.3 2,824.3 1.5 July 3,815.2 107.5 2.7 509.4 9.5 278.3 4.0 3,027.5 1.6
C20 Annual growth rates for quoted shares issued by euro area residents(annual percentage changes)
-4.0
-2.0
0.0
2.0
4.0
6.0
8.0
10.0
12.0
2000 2001 2002 2003 2004 2005 2006 2007 2008 2009-4.0
-2.0
0.0
2.0
4.0
6.0
8.0
10.0
12.0
MFIsfinancial corporations other than MFIsnon-financial corporations
Source: ECB.1) For the calculation of the index and the growth rates, see the Technical notes.

S 41ECB
Monthly Bulletin
October 2009
EURO AREASTATISTICS
Financial
markets
4.4 Quoted shares issued by euro area residents 1) (EUR billions; market values)
2. Transactions during the month
Total MFIs Financial corporations other than MFIs Non-financial corporations
Gross issues Redemptions Net issues Gross issues Redemptions Net issues Gross issues Redemptions Net issues Gross issues Redemptions Net issues
1 2 3 4 5 6 7 8 9 10 11 122007 July 13.3 1.8 11.5 1.2 0.0 1.2 1.3 0.3 1.0 10.9 1.5 9.3 Aug. 2.5 6.6 -4.2 0.0 0.1 -0.1 1.0 1.4 -0.5 1.5 5.1 -3.6 Sep. 4.7 2.5 2.2 2.6 0.0 2.6 0.4 0.3 0.1 1.6 2.1 -0.5 Oct. 27.2 8.0 19.1 0.2 3.2 -3.0 16.1 0.5 15.6 10.8 4.3 6.5 Nov. 6.8 3.3 3.5 0.9 0.0 0.9 1.0 1.3 -0.3 4.9 2.0 2.9 Dec. 9.5 4.6 4.9 0.9 0.0 0.9 0.7 2.2 -1.5 7.9 2.5 5.52008 Jan. 3.6 1.4 2.3 0.1 0.0 0.1 0.4 0.7 -0.2 3.1 0.7 2.4 Feb. 2.8 1.9 0.9 1.0 0.0 1.0 0.1 0.3 -0.2 1.7 1.6 0.1 Mar. 6.4 6.0 0.3 5.9 0.0 5.9 0.0 0.5 -0.4 0.4 5.6 -5.1 Apr. 2.0 3.0 -0.9 1.1 0.0 1.1 0.1 0.5 -0.3 0.8 2.5 -1.7 May 7.3 6.0 1.4 4.1 0.1 4.1 1.5 0.3 1.2 1.7 5.6 -3.9 June 3.9 4.8 -0.9 1.3 0.0 1.3 0.5 0.1 0.4 2.1 4.7 -2.6 July 12.7 3.4 9.4 6.7 0.0 6.7 1.5 0.5 1.0 4.5 2.9 1.6 Aug. 1.5 3.0 -1.4 0.3 0.0 0.3 0.1 0.0 0.1 1.1 3.0 -1.9 Sep. 7.8 2.8 5.0 7.0 0.0 7.0 0.0 0.1 -0.1 0.8 2.7 -1.9 Oct. 12.8 0.6 12.2 1.4 0.0 1.4 10.7 0.0 10.7 0.8 0.6 0.1 Nov. 10.6 2.9 7.7 8.4 0.5 8.0 0.5 2.1 -1.6 1.7 0.3 1.4 Dec. 9.3 2.6 6.8 0.0 0.0 0.0 1.3 0.0 1.2 8.0 2.5 5.52009 Jan. 6.3 0.5 5.8 5.7 0.0 5.7 0.1 0.0 0.0 0.5 0.4 0.1 Feb. 0.2 0.9 -0.7 0.0 0.0 0.0 0.0 0.1 -0.1 0.2 0.8 -0.6 Mar. 13.6 0.2 13.4 3.6 0.0 3.6 0.1 0.0 0.1 9.9 0.2 9.7 Apr. 3.7 0.3 3.4 1.2 0.0 1.2 0.1 0.0 0.0 2.4 0.3 2.1 May 11.2 0.3 10.9 4.4 0.0 4.4 0.0 0.0 0.0 6.7 0.3 6.5 June 27.0 1.7 25.3 4.8 0.0 4.8 3.3 0.0 3.2 18.9 1.6 17.3 July 7.2 0.2 6.9 3.0 0.0 3.0 0.0 0.0 0.0 4.1 0.2 3.9
C21 Gross issues of quoted shares by sector of the issuer(EUR billions; transactions during the month; market values)
0
5
10
15
20
25
30
35
40
1999 2000 2001 2002 2003 2004 2005 2006 2007 2008 20090
5
10
15
20
25
30
35
40
non-financial corporationsMFIsfinancial corporations other than MFIs
Source: ECB.1) For the calculation of the index and the growth rates, see the Technical notes.

S 42ECB
Monthly Bulletin
October 2009
4.5 MFI interest rates on euro-denominated deposits and loans by euro area residents 1) (percentages per annum; outstanding amounts as end-of-period, new business as period average, unless otherwise indicated)
1. Interest rates on deposits (new business)
Deposits from households Deposits from non-financial corporations Repos
Overnight 2) With agreed maturity Redeemable at notice 2), 3) Overnight 2) With agreed maturity
Up to 1 year Over 1 and Over 2 years Up to 3 months Over 3 months Up to 1 year Over 1 and Over 2 yearsup to 2 years up to 2 years
1 2 3 4 5 6 7 8 9 10 112008 Sep. 1.32 4.65 4.85 3.36 2.97 4.01 2.20 4.52 5.19 4.69 4.27 Oct. 1.34 4.77 4.85 3.57 3.01 4.12 2.20 4.26 5.12 4.57 3.66 Nov. 1.29 4.26 4.67 3.71 3.02 4.20 1.98 3.53 4.58 4.18 3.19 Dec. 1.16 3.75 4.35 3.69 2.95 4.17 1.63 2.87 4.23 4.09 2.632009 Jan. 1.02 3.27 3.90 3.52 2.88 4.08 1.28 2.25 3.81 3.78 2.05 Feb. 0.90 2.62 3.40 3.23 2.49 3.98 1.12 1.61 3.21 3.89 1.55 Mar. 0.80 2.24 2.96 3.07 2.31 3.87 0.96 1.36 2.97 3.30 1.23 Apr. 0.66 2.01 2.70 2.87 2.22 3.75 0.80 1.15 2.64 3.07 1.12 May 0.61 1.89 2.42 2.71 1.99 3.62 0.76 1.08 2.39 3.12 1.02 June 0.56 1.86 2.38 2.57 1.95 3.52 0.66 1.04 2.18 2.58 0.93 July 0.52 1.86 2.41 2.62 1.89 3.38 0.57 0.81 2.48 2.93 0.68 Aug. 0.50 1.72 2.33 2.67 1.67 3.23 0.55 0.71 2.06 2.94 0.57
2. Interest rates on loans to households (new business)
Bank Consumer credit Lending for house purchase Other lending
overdrafts 2) by initial rate fixation By initial rate fixation Annual By initial rate fixation Annual
percentage percentageFloating rate Over 1 Over rate of Floating rate Over 1 Over 5 Over rate of Floating rate Over 1 Over
and up to and up to 5 years charge 4) and up to and up to and up to 10 years charge 4) and up to and up to 5 years1 year 5 years 1 year 5 years 10 years 1 year 5 years
1 2 3 4 5 6 7 8 9 10 11 12 132008 Sep. 10.80 8.77 7.20 8.70 8.85 5.80 5.43 5.28 5.37 5.71 6.24 6.36 5.77 Oct. 10.83 8.88 7.22 8.69 8.92 5.84 5.42 5.28 5.37 5.70 6.37 6.26 5.80 Nov. 10.78 8.98 7.17 8.69 8.92 5.63 5.34 5.22 5.28 5.58 5.84 6.15 5.75 Dec. 10.46 8.22 7.03 8.39 8.50 5.09 5.06 5.10 5.13 5.30 4.99 5.75 5.292009 Jan. 10.13 8.33 7.03 8.63 8.67 4.37 4.77 4.92 5.00 4.86 4.43 5.44 5.23 Feb. 10.14 8.15 6.65 8.49 8.38 3.97 4.54 4.80 4.89 4.60 4.08 5.03 5.16 Mar. 9.94 7.51 6.51 8.31 8.05 3.65 4.33 4.61 4.72 4.37 3.83 4.72 5.05 Apr. 9.71 7.43 6.50 8.27 8.05 3.38 4.19 4.55 4.67 4.22 3.54 4.69 4.90 May 9.62 7.87 6.44 8.17 8.08 3.22 4.13 4.50 4.58 4.11 3.60 4.71 4.90 June 9.54 7.30 6.36 8.03 7.83 3.12 4.01 4.51 4.58 4.03 3.54 4.76 4.95 July 9.30 7.67 6.49 8.04 8.02 3.03 4.09 4.54 4.54 4.02 3.35 4.77 4.91 Aug. 9.26 7.96 6.51 7.95 8.13 3.00 4.06 4.54 4.45 4.05 3.20 4.70 4.74
3. Interest rates on loans to non-financial corporations (new business)
Bank Other loans up to EUR 1 million Other loans over EUR 1 million
overdrafts 2) by initial rate fixation by initial rate fixation
Floating rate and Over 1 and Over 5 years Floating rate and Over 1 and Over 5 yearsup to 1 year up to 5 years up to 1 year up to 5 years
1 2 3 4 5 6 72008 Sep. 6.91 6.34 6.37 5.64 5.62 5.83 5.64 Oct. 6.89 6.52 6.35 5.57 5.59 5.75 5.08 Nov. 6.66 6.04 6.10 5.41 4.86 5.02 4.97 Dec. 6.26 5.38 5.78 5.32 4.28 4.50 4.762009 Jan. 5.68 4.73 5.46 5.24 3.52 3.96 4.58 Feb. 5.40 4.32 5.25 4.96 3.12 3.52 4.23 Mar. 5.10 4.03 5.07 4.75 2.85 3.22 3.87 Apr. 4.76 3.82 5.02 4.60 2.55 3.34 4.01 May 4.67 3.73 5.01 4.52 2.49 3.22 3.96 June 4.58 3.64 4.86 4.50 2.57 3.08 3.70 July 4.34 3.57 4.79 4.32 2.38 2.89 3.90 Aug. 4.25 3.42 4.68 4.23 2.32 2.81 3.83
Source: ECB.1) Data refer to the changing composition of the euro area. For further information, see the General notes.2) For this instrument category, new business and outstanding amounts coincide. End-of-period.3) For this instrument category, households and non-financial corporations are merged and allocated to the household sector, since the outstanding amounts of non-financial
corporations are negligible compared with those of the household sector in all participating Member States combined.4) The annual percentage rate of charge covers the total cost of a loan. The total cost comprises an interest rate component and a component of other (related) charges, such as the
cost of inquiries, administration, preparation of documents, guarantees, etc.
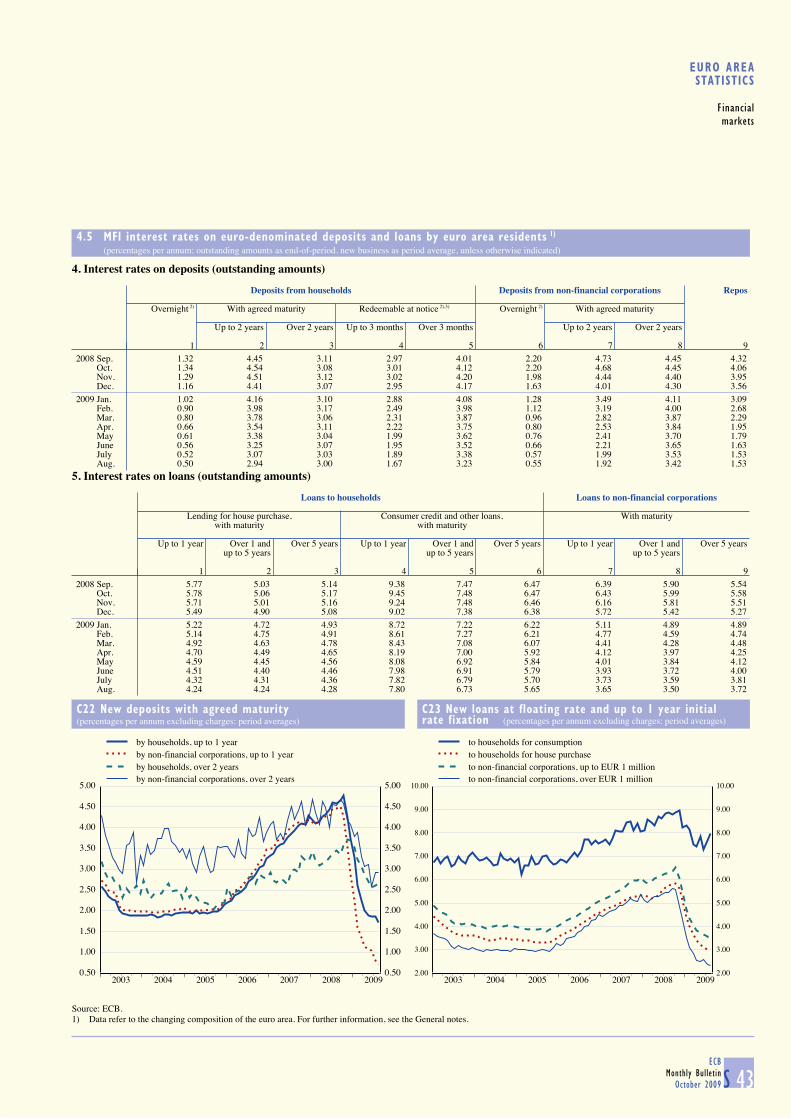
S 43ECB
Monthly Bulletin
October 2009
EURO AREASTATISTICS
Financial
markets
4.5 MFI interest rates on euro-denominated deposits and loans by euro area residents 1) (percentages per annum; outstanding amounts as end-of-period, new business as period average, unless otherwise indicated)
4. Interest rates on deposits (outstanding amounts)
Deposits from households Deposits from non-financial corporations Repos
Overnight 2) With agreed maturity Redeemable at notice 2),3) Overnight 2) With agreed maturity
Up to 2 years Over 2 years Up to 3 months Over 3 months Up to 2 years Over 2 years
1 2 3 4 5 6 7 8 92008 Sep. 1.32 4.45 3.11 2.97 4.01 2.20 4.73 4.45 4.32 Oct. 1.34 4.54 3.08 3.01 4.12 2.20 4.68 4.45 4.06 Nov. 1.29 4.51 3.12 3.02 4.20 1.98 4.44 4.40 3.95 Dec. 1.16 4.41 3.07 2.95 4.17 1.63 4.01 4.30 3.562009 Jan. 1.02 4.16 3.10 2.88 4.08 1.28 3.49 4.11 3.09 Feb. 0.90 3.98 3.17 2.49 3.98 1.12 3.19 4.00 2.68 Mar. 0.80 3.78 3.06 2.31 3.87 0.96 2.82 3.87 2.29 Apr. 0.66 3.54 3.11 2.22 3.75 0.80 2.53 3.84 1.95 May 0.61 3.38 3.04 1.99 3.62 0.76 2.41 3.70 1.79 June 0.56 3.25 3.07 1.95 3.52 0.66 2.21 3.65 1.63 July 0.52 3.07 3.03 1.89 3.38 0.57 1.99 3.53 1.53 Aug. 0.50 2.94 3.00 1.67 3.23 0.55 1.92 3.42 1.53
5. Interest rates on loans (outstanding amounts)
Loans to households Loans to non-financial corporations
Lending for house purchase, Consumer credit and other loans, With maturity
with maturity with maturity
Up to 1 year Over 1 and Over 5 years Up to 1 year Over 1 and Over 5 years Up to 1 year Over 1 and Over 5 yearsup to 5 years up to 5 years up to 5 years
1 2 3 4 5 6 7 8 92008 Sep. 5.77 5.03 5.14 9.38 7.47 6.47 6.39 5.90 5.54 Oct. 5.78 5.06 5.17 9.45 7.48 6.47 6.43 5.99 5.58 Nov. 5.71 5.01 5.16 9.24 7.48 6.46 6.16 5.81 5.51 Dec. 5.49 4.90 5.08 9.02 7.38 6.38 5.72 5.42 5.272009 Jan. 5.22 4.72 4.93 8.72 7.22 6.22 5.11 4.89 4.89 Feb. 5.14 4.75 4.91 8.61 7.27 6.21 4.77 4.59 4.74 Mar. 4.92 4.63 4.78 8.43 7.08 6.07 4.41 4.28 4.48 Apr. 4.70 4.49 4.65 8.19 7.00 5.92 4.12 3.97 4.25 May 4.59 4.45 4.56 8.08 6.92 5.84 4.01 3.84 4.12 June 4.51 4.40 4.46 7.98 6.91 5.79 3.93 3.72 4.00 July 4.32 4.31 4.36 7.82 6.79 5.70 3.73 3.59 3.81 Aug. 4.24 4.24 4.28 7.80 6.73 5.65 3.65 3.50 3.72
C22 New deposits with agreed maturity(percentages per annum excluding charges; period averages)
C23 New loans at floating rate and up to 1 year initialrate fixation (percentages per annum excluding charges; period averages)
0.50
1.00
1.50
2.00
2.50
3.00
3.50
4.00
4.50
5.00
2003 2004 2005 2006 2007 2008 20090.50
1.00
1.50
2.00
2.50
3.00
3.50
4.00
4.50
5.00
by households, up to 1 yearby non-financial corporations, up to 1 yearby households, over 2 yearsby non-financial corporations, over 2 years
2.00
3.00
4.00
5.00
6.00
7.00
8.00
9.00
10.00
2003 2004 2005 2006 2007 2008 20092.00
3.00
4.00
5.00
6.00
7.00
8.00
9.00
10.00
to households for consumptionto households for house purchaseto non-financial corporations, up to EUR 1 millionto non-financial corporations, over EUR 1 million
Source: ECB.1) Data refer to the changing composition of the euro area. For further information, see the General notes.

S 44ECB
Monthly Bulletin
October 2009
4.6 Money market interest rates (percentages per annum; period averages)
Euro area 1),2) United States Japan
Overnight 1-month 3-month 6-month 12-month 3-month 3-monthdeposits deposits deposits deposits deposits deposits deposits
(EONIA) (EURIBOR) (EURIBOR) (EURIBOR) (EURIBOR) (LIBOR) (LIBOR)
1 2 3 4 5 6 72006 2.83 2.94 3.08 3.23 3.44 5.20 0.302007 3.87 4.08 4.28 4.35 4.45 5.30 0.792008 3.87 4.28 4.64 4.73 4.83 2.93 0.93
2008 Q3 4.25 4.54 4.98 5.18 5.37 2.91 0.90 Q4 3.17 3.92 4.24 4.31 4.38 2.77 0.962009 Q1 1.37 1.67 2.01 2.11 2.22 1.24 0.67 Q2 0.77 0.94 1.31 1.51 1.67 0.84 0.53 Q3 0.36 0.53 0.87 1.13 1.34 0.41 0.40
2008 Sep. 4.27 4.66 5.02 5.22 5.38 3.12 0.91 Oct. 3.82 4.83 5.11 5.18 5.25 4.06 1.04 Nov. 3.15 3.84 4.24 4.29 4.35 2.28 0.91 Dec. 2.49 2.99 3.29 3.37 3.45 1.83 0.922009 Jan. 1.81 2.14 2.46 2.54 2.62 1.21 0.73 Feb. 1.26 1.63 1.94 2.03 2.14 1.24 0.64 Mar. 1.06 1.27 1.64 1.77 1.91 1.27 0.62 Apr. 0.84 1.01 1.42 1.61 1.77 1.11 0.57 May 0.78 0.88 1.28 1.48 1.64 0.82 0.53 June 0.70 0.91 1.23 1.44 1.61 0.62 0.49 July 0.36 0.61 0.97 1.21 1.41 0.52 0.43 Aug. 0.35 0.51 0.86 1.12 1.33 0.42 0.40 Sep. 0.36 0.46 0.77 1.04 1.26 0.30 0.36
C24 Euro area money market rates 2)
(monthly; percentages per annum)C25 3-month money market rates(monthly; percentages per annum)
0.00
1.00
2.00
3.00
4.00
5.00
6.00
7.00
8.00
9.00
1994 1996 1998 2000 2002 2004 2006 20080.00
1.00
2.00
3.00
4.00
5.00
6.00
7.00
8.00
9.00
1-month rate3-month rate12-month rate
0.00
1.00
2.00
3.00
4.00
5.00
6.00
7.00
8.00
9.00
1994 1996 1998 2000 2002 2004 2006 20080.00
1.00
2.00
3.00
4.00
5.00
6.00
7.00
8.00
9.00
euro areaJapanUnited States
Source: ECB.1) Before January 1999 synthetic euro area rates were calculated on the basis of national rates weighted by GDP. For further information, see the General notes.2) Data refer to the changing composition of the euro area. For further information, see the General notes.
2)
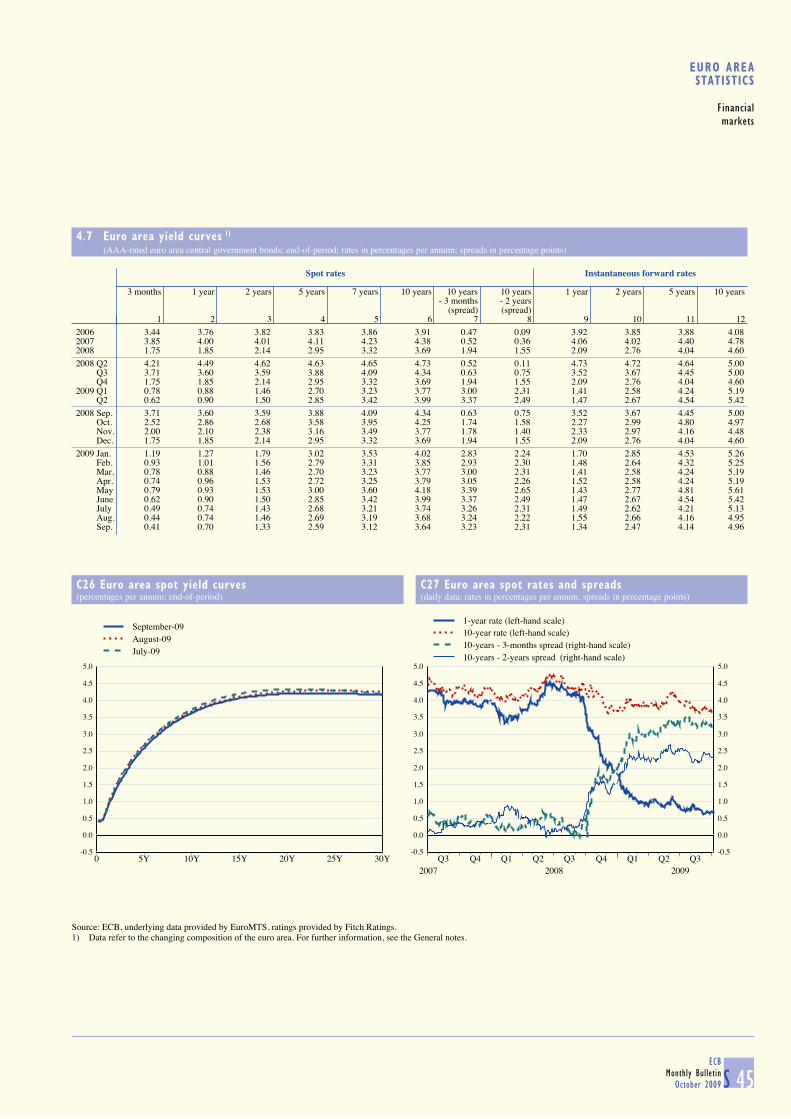
S 45ECB
Monthly Bulletin
October 2009
EURO AREASTATISTICS
Financial
markets
4.7 Euro area yield curves 1)
(AAA-rated euro area central government bonds; end-of-period; rates in percentages per annum; spreads in percentage points)
Spot rates Instantaneous forward rates
3 months 1 year 2 years 5 years 7 years 10 years 10 years 10 years 1 year 2 years 5 years 10 years- 3 months - 2 years
(spread) (spread)1 2 3 4 5 6 7 8 9 10 11 12
2006 3.44 3.76 3.82 3.83 3.86 3.91 0.47 0.09 3.92 3.85 3.88 4.082007 3.85 4.00 4.01 4.11 4.23 4.38 0.52 0.36 4.06 4.02 4.40 4.782008 1.75 1.85 2.14 2.95 3.32 3.69 1.94 1.55 2.09 2.76 4.04 4.602008 Q2 4.21 4.49 4.62 4.63 4.65 4.73 0.52 0.11 4.73 4.72 4.64 5.00 Q3 3.71 3.60 3.59 3.88 4.09 4.34 0.63 0.75 3.52 3.67 4.45 5.00 Q4 1.75 1.85 2.14 2.95 3.32 3.69 1.94 1.55 2.09 2.76 4.04 4.602009 Q1 0.78 0.88 1.46 2.70 3.23 3.77 3.00 2.31 1.41 2.58 4.24 5.19 Q2 0.62 0.90 1.50 2.85 3.42 3.99 3.37 2.49 1.47 2.67 4.54 5.422008 Sep. 3.71 3.60 3.59 3.88 4.09 4.34 0.63 0.75 3.52 3.67 4.45 5.00 Oct. 2.52 2.86 2.68 3.58 3.95 4.25 1.74 1.58 2.27 2.99 4.80 4.97 Nov. 2.00 2.10 2.38 3.16 3.49 3.77 1.78 1.40 2.33 2.97 4.16 4.48 Dec. 1.75 1.85 2.14 2.95 3.32 3.69 1.94 1.55 2.09 2.76 4.04 4.602009 Jan. 1.19 1.27 1.79 3.02 3.53 4.02 2.83 2.24 1.70 2.85 4.53 5.26 Feb. 0.93 1.01 1.56 2.79 3.31 3.85 2.93 2.30 1.48 2.64 4.32 5.25 Mar. 0.78 0.88 1.46 2.70 3.23 3.77 3.00 2.31 1.41 2.58 4.24 5.19 Apr. 0.74 0.96 1.53 2.72 3.25 3.79 3.05 2.26 1.52 2.58 4.24 5.19 May 0.79 0.93 1.53 3.00 3.60 4.18 3.39 2.65 1.43 2.77 4.81 5.61 June 0.62 0.90 1.50 2.85 3.42 3.99 3.37 2.49 1.47 2.67 4.54 5.42 July 0.49 0.74 1.43 2.68 3.21 3.74 3.26 2.31 1.49 2.62 4.21 5.13 Aug. 0.44 0.74 1.46 2.69 3.19 3.68 3.24 2.22 1.55 2.66 4.16 4.95 Sep. 0.41 0.70 1.33 2.59 3.12 3.64 3.23 2.31 1.34 2.47 4.14 4.96
C26 Euro area spot yield curves(percentages per annum; end-of-period)
C27 Euro area spot rates and spreads(daily data; rates in percentages per annum; spreads in percentage points)
-0.5
0.0
0.5
1.0
1.5
2.0
2.5
3.0
3.5
4.0
4.5
5.0
0 5Y 10Y 15Y 20Y 25Y 30Y
September-09August-09July-09
-0.5
0.0
0.5
1.0
1.5
2.0
2.5
3.0
3.5
4.0
4.5
5.0
Q3 Q4 Q1 Q2 Q3 Q4 Q1 Q2 Q32007 2008 2009
-0.5
0.0
0.5
1.0
1.5
2.0
2.5
3.0
3.5
4.0
4.5
5.0
1-year rate (left-hand scale)10-year rate (left-hand scale)10-years - 3-months spread (right-hand scale)10-years - 2-years spread (right-hand scale)
Source: ECB, underlying data provided by EuroMTS, ratings provided by Fitch Ratings.1) Data refer to the changing composition of the euro area. For further information, see the General notes.
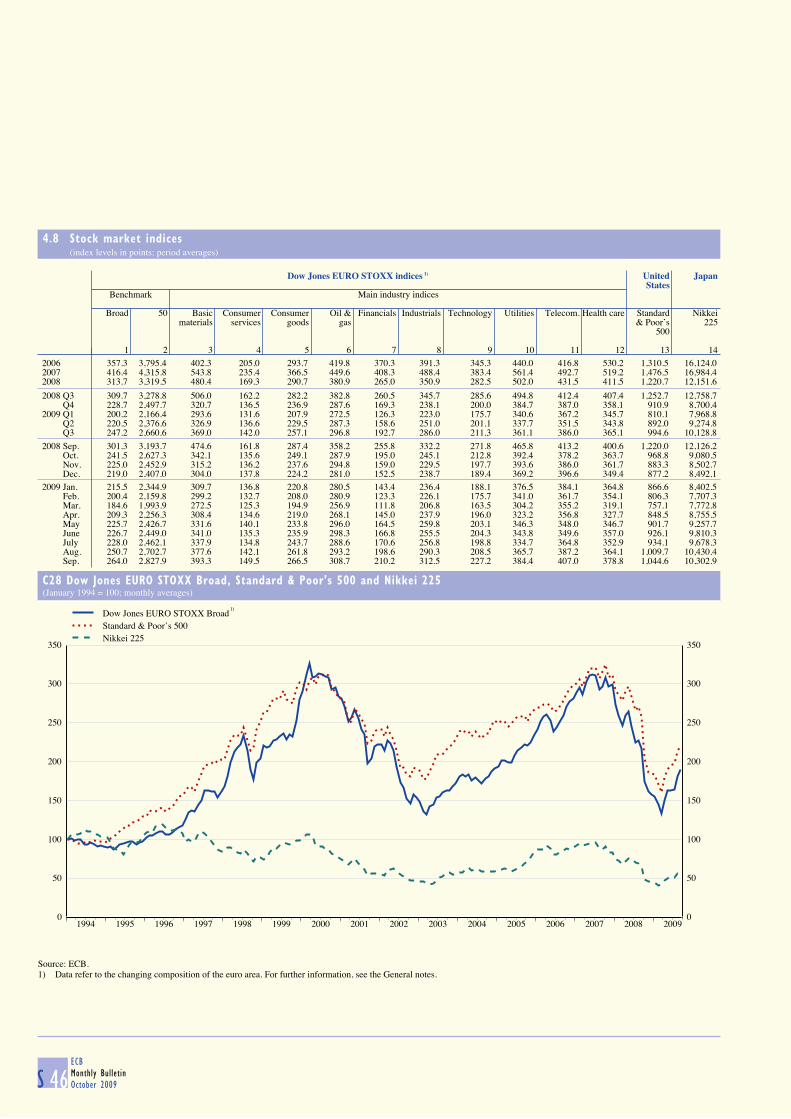
S 46ECB
Monthly Bulletin
October 2009
4.8 Stock market indices (index levels in points; period averages)
Dow Jones EURO STOXX indices 1) United Japan
States Benchmark Main industry indices
Broad 50 Basic Consumer Consumer Oil & Financials Industrials Technology Utilities Telecom. Health care Standard Nikkeimaterials services goods gas & Poor’s 225
500
1 2 3 4 5 6 7 8 9 10 11 12 13 142006 357.3 3,795.4 402.3 205.0 293.7 419.8 370.3 391.3 345.3 440.0 416.8 530.2 1,310.5 16,124.02007 416.4 4,315.8 543.8 235.4 366.5 449.6 408.3 488.4 383.4 561.4 492.7 519.2 1,476.5 16,984.42008 313.7 3,319.5 480.4 169.3 290.7 380.9 265.0 350.9 282.5 502.0 431.5 411.5 1,220.7 12,151.6
2008 Q3 309.7 3,278.8 506.0 162.2 282.2 382.8 260.5 345.7 285.6 494.8 412.4 407.4 1,252.7 12,758.7 Q4 228.7 2,497.7 320.7 136.5 236.9 287.6 169.3 238.1 200.0 384.7 387.0 358.1 910.9 8,700.42009 Q1 200.2 2,166.4 293.6 131.6 207.9 272.5 126.3 223.0 175.7 340.6 367.2 345.7 810.1 7,968.8 Q2 220.5 2,376.6 326.9 136.6 229.5 287.3 158.6 251.0 201.1 337.7 351.5 343.8 892.0 9,274.8 Q3 247.2 2,660.6 369.0 142.0 257.1 296.8 192.7 286.0 211.3 361.1 386.0 365.1 994.6 10,128.8
2008 Sep. 301.3 3,193.7 474.6 161.8 287.4 358.2 255.8 332.2 271.8 465.8 413.2 400.6 1,220.0 12,126.2 Oct. 241.5 2,627.3 342.1 135.6 249.1 287.9 195.0 245.1 212.8 392.4 378.2 363.7 968.8 9,080.5 Nov. 225.0 2,452.9 315.2 136.2 237.6 294.8 159.0 229.5 197.7 393.6 386.0 361.7 883.3 8,502.7 Dec. 219.0 2,407.0 304.0 137.8 224.2 281.0 152.5 238.7 189.4 369.2 396.6 349.4 877.2 8,492.12009 Jan. 215.5 2,344.9 309.7 136.8 220.8 280.5 143.4 236.4 188.1 376.5 384.1 364.8 866.6 8,402.5 Feb. 200.4 2,159.8 299.2 132.7 208.0 280.9 123.3 226.1 175.7 341.0 361.7 354.1 806.3 7,707.3 Mar. 184.6 1,993.9 272.5 125.3 194.9 256.9 111.8 206.8 163.5 304.2 355.2 319.1 757.1 7,772.8 Apr. 209.3 2,256.3 308.4 134.6 219.0 268.1 145.0 237.9 196.0 323.2 356.8 327.7 848.5 8,755.5 May 225.7 2,426.7 331.6 140.1 233.8 296.0 164.5 259.8 203.1 346.3 348.0 346.7 901.7 9,257.7 June 226.7 2,449.0 341.0 135.3 235.9 298.3 166.8 255.5 204.3 343.8 349.6 357.0 926.1 9,810.3 July 228.0 2,462.1 337.9 134.8 243.7 288.6 170.6 256.8 198.8 334.7 364.8 352.9 934.1 9,678.3 Aug. 250.7 2,702.7 377.6 142.1 261.8 293.2 198.6 290.3 208.5 365.7 387.2 364.1 1,009.7 10,430.4 Sep. 264.0 2,827.9 393.3 149.5 266.5 308.7 210.2 312.5 227.2 384.4 407.0 378.8 1,044.6 10,302.9
C28 Dow Jones EURO STOXX Broad, Standard & Poor's 500 and Nikkei 225(January 1994 = 100; monthly averages)
0
50
100
150
200
250
300
350
1994 1995 1996 1997 1998 1999 2000 2001 2002 2003 2004 2005 2006 2007 2008 20090
50
100
150
200
250
300
350
Dow Jones EURO STOXX BroadStandard & Poor’s 500Nikkei 225
Source: ECB.1) Data refer to the changing composition of the euro area. For further information, see the General notes.
1)
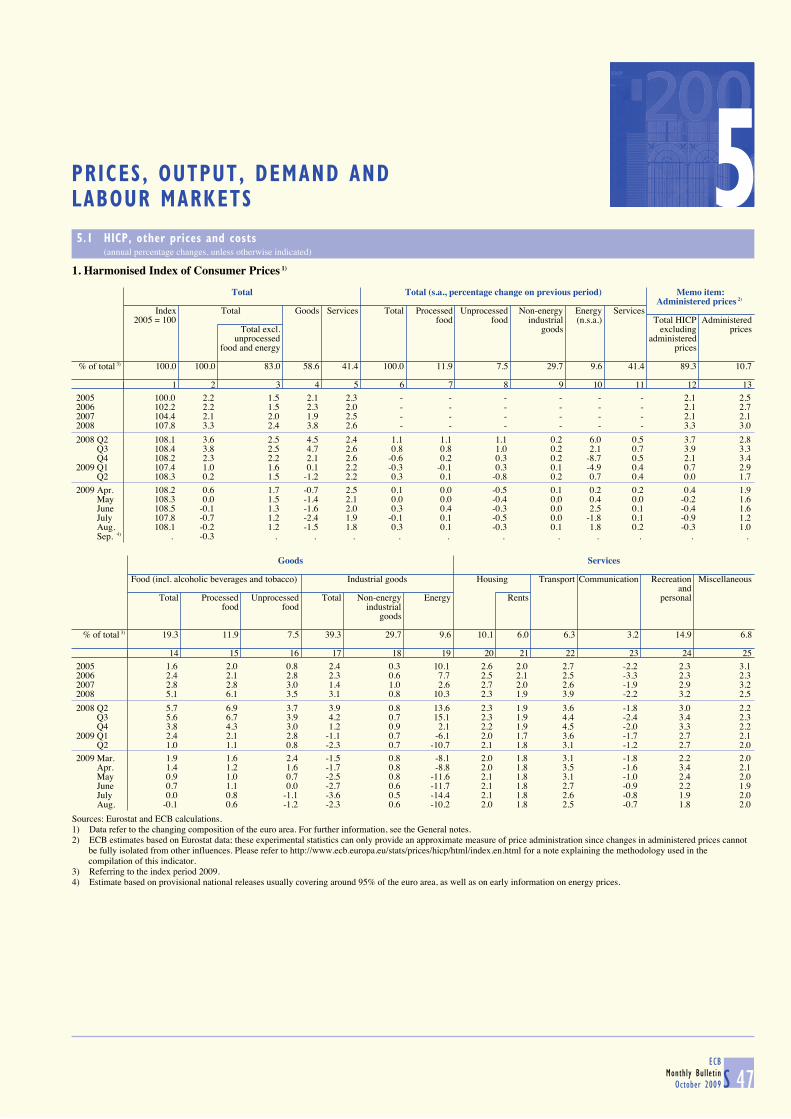
S 47ECB
Monthly Bulletin
October 2009
5PRICES, OUTPUT, DEMAND AND LABOUR MARKETS
5.1 HICP, other prices and costs (annual percentage changes, unless otherwise indicated)
1. Harmonised Index of Consumer Prices 1)
Total Total (s.a., percentage change on previous period) Memo item: Administered prices 2)
Index Total Goods Services Total Processed Unprocessed Non-energy Energy Services2005 = 100 food food industrial (n.s.a.) Total HICP Administered
Total excl. goods excluding pricesunprocessed administered
food and energy prices
% of total 3) 100.0 100.0 83.0 58.6 41.4 100.0 11.9 7.5 29.7 9.6 41.4 89.3 10.7
1 2 3 4 5 6 7 8 9 10 11 12 132005 100.0 2.2 1.5 2.1 2.3 - - - - - - 2.1 2.52006 102.2 2.2 1.5 2.3 2.0 - - - - - - 2.1 2.72007 104.4 2.1 2.0 1.9 2.5 - - - - - - 2.1 2.12008 107.8 3.3 2.4 3.8 2.6 - - - - - - 3.3 3.0
2008 Q2 108.1 3.6 2.5 4.5 2.4 1.1 1.1 1.1 0.2 6.0 0.5 3.7 2.8 Q3 108.4 3.8 2.5 4.7 2.6 0.8 0.8 1.0 0.2 2.1 0.7 3.9 3.3 Q4 108.2 2.3 2.2 2.1 2.6 -0.6 0.2 0.3 0.2 -8.7 0.5 2.1 3.42009 Q1 107.4 1.0 1.6 0.1 2.2 -0.3 -0.1 0.3 0.1 -4.9 0.4 0.7 2.9 Q2 108.3 0.2 1.5 -1.2 2.2 0.3 0.1 -0.8 0.2 0.7 0.4 0.0 1.7
2009 Apr. 108.2 0.6 1.7 -0.7 2.5 0.1 0.0 -0.5 0.1 0.2 0.2 0.4 1.9 May 108.3 0.0 1.5 -1.4 2.1 0.0 0.0 -0.4 0.0 0.4 0.0 -0.2 1.6 June 108.5 -0.1 1.3 -1.6 2.0 0.3 0.4 -0.3 0.0 2.5 0.1 -0.4 1.6 July 107.8 -0.7 1.2 -2.4 1.9 -0.1 0.1 -0.5 0.0 -1.8 0.1 -0.9 1.2 Aug. 108.1 -0.2 1.2 -1.5 1.8 0.3 0.1 -0.3 0.1 1.8 0.2 -0.3 1.0 Sep. 4) . -0.3 . . . . . . . . . . .
Goods Services
Food (incl. alcoholic beverages and tobacco) Industrial goods Housing Transport Communication Recreation Miscellaneous
andTotal Processed Unprocessed Total Non-energy Energy Rents personal
food food industrialgoods
% of total 3) 19.3 11.9 7.5 39.3 29.7 9.6 10.1 6.0 6.3 3.2 14.9 6.8
14 15 16 17 18 19 20 21 22 23 24 252005 1.6 2.0 0.8 2.4 0.3 10.1 2.6 2.0 2.7 -2.2 2.3 3.12006 2.4 2.1 2.8 2.3 0.6 7.7 2.5 2.1 2.5 -3.3 2.3 2.32007 2.8 2.8 3.0 1.4 1.0 2.6 2.7 2.0 2.6 -1.9 2.9 3.22008 5.1 6.1 3.5 3.1 0.8 10.3 2.3 1.9 3.9 -2.2 3.2 2.5
2008 Q2 5.7 6.9 3.7 3.9 0.8 13.6 2.3 1.9 3.6 -1.8 3.0 2.2 Q3 5.6 6.7 3.9 4.2 0.7 15.1 2.3 1.9 4.4 -2.4 3.4 2.3 Q4 3.8 4.3 3.0 1.2 0.9 2.1 2.2 1.9 4.5 -2.0 3.3 2.22009 Q1 2.4 2.1 2.8 -1.1 0.7 -6.1 2.0 1.7 3.6 -1.7 2.7 2.1 Q2 1.0 1.1 0.8 -2.3 0.7 -10.7 2.1 1.8 3.1 -1.2 2.7 2.0
2009 Mar. 1.9 1.6 2.4 -1.5 0.8 -8.1 2.0 1.8 3.1 -1.8 2.2 2.0 Apr. 1.4 1.2 1.6 -1.7 0.8 -8.8 2.0 1.8 3.5 -1.6 3.4 2.1 May 0.9 1.0 0.7 -2.5 0.8 -11.6 2.1 1.8 3.1 -1.0 2.4 2.0 June 0.7 1.1 0.0 -2.7 0.6 -11.7 2.1 1.8 2.7 -0.9 2.2 1.9 July 0.0 0.8 -1.1 -3.6 0.5 -14.4 2.1 1.8 2.6 -0.8 1.9 2.0 Aug. -0.1 0.6 -1.2 -2.3 0.6 -10.2 2.0 1.8 2.5 -0.7 1.8 2.0
Sources: Eurostat and ECB calculations.1) Data refer to the changing composition of the euro area. For further information, see the General notes.2) ECB estimates based on Eurostat data; these experimental statistics can only provide an approximate measure of price administration since changes in administered prices cannot be fully isolated from other influences. Please refer to http://www.ecb.europa.eu/stats/prices/hicp/html/index.en.html for a note explaining the methodology used in the compilation of this indicator.3) Referring to the index period 2009.4) Estimate based on provisional national releases usually covering around 95% of the euro area, as well as on early information on energy prices.

S 48ECB
Monthly Bulletin
October 2009
5.1 HICP, other prices and costs (annual percentage changes, unless otherwise indicated)
2. Industry, construction and residential property prices 1)
Industrial producer prices excluding construction Construct- Residential
ion 2) propertyTotal Total Industry excluding construction and energy Energy prices 3)
(index 2005 = 100) Manu- Total Intermediate Capital Consumer goods
facturing goods goodsTotal Durable Non-durable
% of total 4) 100.0 100.0 83.0 75.8 30.1 21.9 23.7 2.7 21.0 24.2
1 2 3 4 5 6 7 8 9 10 11 122005 100.0 4.1 3.1 1.6 2.8 1.2 1.1 1.3 0.9 13.5 3.7 7.52006 105.1 5.1 3.5 2.8 4.6 1.6 1.7 1.4 1.5 13.4 4.9 6.52007 107.9 2.7 3.0 3.2 4.6 2.2 2.3 2.4 2.1 1.2 4.1 4.42008 114.4 6.1 4.8 3.5 4.0 2.1 3.9 2.8 4.1 14.1 3.5 1.7
2008 Q2 114.8 7.0 6.4 3.7 4.0 2.0 4.8 2.8 5.1 17.2 3.5 2.8 5)
Q3 117.2 8.4 6.7 4.2 5.4 2.3 4.2 2.7 4.4 21.5 4.9 - Q4 113.7 3.4 0.7 2.4 2.6 2.5 2.0 2.6 1.9 6.7 3.2 0.6 5)
2009 Q1 109.8 -2.0 -4.3 -1.1 -2.7 1.8 -1.0 1.9 -1.4 -4.1 3.3 - Q2 108.3 -5.7 -6.8 -3.0 -5.7 0.6 -2.0 1.5 -2.5 -13.2 0.2 .
2009 Mar. 109.1 -3.2 -5.4 -1.9 -3.9 1.5 -1.6 1.8 -2.0 -6.9 - - Apr. 108.1 -4.8 -5.9 -2.5 -5.1 1.1 -1.8 1.6 -2.2 -11.1 - - May 108.1 -5.9 -7.1 -3.0 -5.7 0.5 -2.0 1.4 -2.5 -13.7 - - June 108.5 -6.5 -7.3 -3.5 -6.4 0.3 -2.3 1.6 -2.9 -14.7 - - July 107.8 -8.4 -8.2 -4.1 -7.5 0.0 -2.5 1.2 -3.0 -19.9 - - Aug. 108.2 -7.5 -7.0 -4.2 -7.4 -0.2 -2.6 1.2 -3.1 -16.9 - -
3. Commodity prices and gross domestic product deflators 1)
Oil prices 6) Non-energy commodity prices GDP deflators
(EUR per barrel) Import-weighted 7) Use-weighted 8) Total Total Domestic demand Exports 9) Imports 9)
(s.a. indexTotal Food Non-food Total Food Non-food 2000 = 100) Total Private Government Gross
consump- consump- fixedtion tion capital
formation
% of total 100.0 35.0 65.0 100.0 44.3 55.7
1 2 3 4 5 6 7 8 9 10 11 12 13 14 152005 44.6 11.9 0.9 17.9 9.0 2.5 14.4 111.6 2.0 2.3 2.1 2.3 2.5 2.4 3.42006 52.9 27.5 5.8 37.6 24.4 5.9 38.1 113.8 1.9 2.4 2.2 2.0 2.9 2.7 3.92007 52.8 7.5 14.3 5.0 5.1 9.4 2.7 116.4 2.3 2.3 2.2 1.7 2.6 1.7 1.52008 65.9 2.0 18.2 -4.3 -1.7 9.7 -8.5 119.1 2.3 2.8 2.9 2.9 2.2 2.5 3.8
2008 Q2 78.5 2.5 32.4 -7.5 -0.3 20.3 -11.1 118.9 2.3 3.1 3.3 3.7 2.3 2.7 4.7 Q3 77.6 6.8 16.2 2.8 0.6 4.3 -1.9 119.4 2.3 3.2 3.4 2.8 2.6 3.4 5.7 Q4 43.5 -10.1 -7.7 -11.2 -14.5 -12.9 -15.8 120.0 2.4 2.1 2.0 2.2 1.7 1.4 0.62009 Q1 35.1 -29.1 -14.8 -36.0 -28.5 -17.3 -36.8 120.1 1.9 1.1 0.5 2.7 0.6 -2.5 -4.5 Q2 43.8 -24.5 -11.1 -31.0 -22.5 -9.9 -31.4 120.1 1.1 0.0 -0.4 1.6 -0.7 -4.0 -6.8
2009 Apr. 39.0 -25.4 -11.7 -31.9 -23.7 -10.8 -32.8 - - - - - - - - May 42.8 -24.5 -8.3 -32.1 -22.0 -6.7 -32.6 - - - - - - - - June 49.5 -23.5 -13.1 -28.8 -21.7 -12.0 -28.9 - - - - - - - - July 46.5 -22.8 -15.1 -26.6 -21.4 -13.7 -26.8 - - - - - - - - Aug. 51.1 -16.2 -10.2 -19.1 -17.4 -15.7 -18.7 - - - - - - - - Sep. 46.9 -16.7 -10.8 -19.4 -17.3 -15.3 -18.7 - - - - - - - -
Sources: Eurostat, ECB calculations based on Eurostat data (column 7 in Table 2 in Section 5.1 and columns 8-15 in Table 3 in Section 5.1), ECB calculations based onThomson Financial Datastream data (column 1 in Table 3 in Section 5.1) and ECB calculations (column 12 in Table 2 in Section 5.1 and columns 2-7 in Table 3 in Section 5.1).1) Data refer to the Euro 16.2) Input prices for residential buildings.3) Experimental data based on non-harmonised national sources (see the ECB website for further details).4) In 2005.5) The quarterly data for the second (fourth) quarter refer to semi-annual averages of the first (second) half of the year, respectively. Since some national data are only available
at annual frequency, the semi-annual estimate is partially derived from annual results; therefore, the accuracy of semi-annual data is lower than the accuracy of annual data.6) Brent Blend (for one-month forward delivery).7) Refers to prices expressed in euro. Weighted according to the structure of euro area imports in the period 2004-06.8) Refers to prices expressed in euro. Weighted according to euro area domestic demand (domestic production plus imports minus exports) in the period 2004-06. Experimental data
(see the ECB website for details).9) Deflators for exports and imports refer to goods and services and include cross-border trade within the euro area.

S 49ECB
Monthly Bulletin
October 2009
EURO AREASTATISTICS
Prices, output,
demand and
labour markets
5.1 HICP, other prices and costs (annual percentage changes, unless otherwise indicated)
4. Unit labour costs, compensation per employee and labour productivity 1) (seasonally adjusted)
Unit labour costs 2)
Total Total By economic activity
(index2000 = 100) Agriculture, hunting, Mining, Construction Trade, repairs, hotels and Financial, real estate, Public administration,
forestry and fishing manufacturing restaurants, transport and renting and business education, healthand energy communication services and other services
1 2 3 4 5 6 7 8
2005 109.0 1.2 8.4 -0.5 3.2 0.7 2.1 2.12006 110.0 0.9 2.3 -0.5 3.3 0.5 2.0 2.12007 111.7 1.5 1.8 0.5 4.1 0.5 2.4 1.82008 115.2 3.2 -0.5 3.6 2.4 3.2 2.9 3.1
2008 Q2 114.7 2.8 -1.6 1.4 2.4 2.4 2.5 4.3 Q3 115.6 3.5 -1.1 4.2 2.7 4.5 3.2 2.5 Q4 117.9 4.6 -0.3 9.8 2.2 5.1 2.3 3.12009 Q1 120.0 5.8 1.6 16.5 1.8 6.8 0.2 3.2 Q2 120.2 4.8 1.9 14.8 0.2 5.7 1.4 1.7
Compensation per employee
2005 112.3 2.0 2.5 1.9 2.2 1.9 2.4 1.92006 114.9 2.3 3.3 3.4 3.5 1.6 2.3 1.72007 117.7 2.5 3.6 2.7 2.8 1.9 2.4 2.52008 121.4 3.1 2.8 3.0 3.8 2.8 2.5 3.6
2008 Q2 121.1 3.1 2.2 2.7 3.6 2.1 2.3 4.5 Q3 121.9 3.5 3.2 3.1 4.2 4.0 3.0 3.4 Q4 122.5 2.9 2.7 2.7 3.8 2.9 2.0 3.42009 Q1 122.5 1.8 3.3 0.4 2.6 2.3 0.5 3.1 Q2 123.0 1.6 3.6 -0.5 3.4 2.5 2.0 1.9
Labour productivity 3)
2005 103.1 0.7 -5.4 2.4 -1.0 1.2 0.2 -0.22006 104.5 1.3 1.0 3.9 0.2 1.1 0.3 -0.42007 105.5 1.0 1.7 2.2 -1.2 1.4 0.1 0.72008 105.4 -0.1 3.3 -0.6 1.3 -0.4 -0.4 0.5
2008 Q2 105.6 0.3 3.9 1.3 1.1 -0.3 -0.2 0.1 Q3 105.5 0.0 4.4 -1.0 1.5 -0.4 -0.2 0.8 Q4 103.9 -1.7 3.0 -6.5 1.5 -2.1 -0.3 0.42009 Q1 102.1 -3.7 1.7 -13.8 0.8 -4.2 0.3 -0.1 Q2 102.4 -3.1 1.7 -13.3 3.2 -3.0 0.5 0.3
5. Hourly labour costs 1), 4)
Total Total By component By selected economic activity Memo:
(s.a. index indicator2008 = 100) Wages and Employers’ social Mining, Construction Services of
salaries contributions manufacturing negotiatedand energy wages 5)
% of total 6) 100.0 100.0 75.2 24.8 32.4 9.0 58.6
1 2 3 4 5 6 7 82005 92.2 2.2 2.3 2.0 2.1 1.6 2.3 2.12006 94.3 2.3 2.4 2.3 3.3 1.4 1.9 2.32007 96.7 2.5 2.9 1.5 2.2 2.6 2.7 2.12008 99.9 3.4 3.4 3.3 3.9 4.1 3.1 3.2
2008 Q2 99.2 2.5 2.5 2.4 2.5 3.8 2.3 2.9 Q3 100.4 3.6 3.6 3.5 3.1 3.7 3.8 3.4 Q4 101.4 4.2 4.1 4.6 6.0 4.7 3.2 3.62009 Q1 102.3 3.6 3.4 4.1 5.6 3.0 2.5 3.2 Q2 103.3 4.0 3.9 4.2 5.3 4.5 3.2 2.8
Sources: Eurostat, ECB calculations based on Eurostat data (Table 4 in Section 5.1 and column 7 in Table 5 in Section 5.1) and ECB calculations (column 8 in Table 5 in Section 5.1).1) Data refer to Euro 16.2) Compensation (at current prices) per employee divided by value added (volumes) per person employed.3) Value added (volumes) per person employed.4) Hourly labour costs for the whole economy, excluding agriculture, public administration, education, health and services not elsewhere classified. Owing to differences in
coverage, the estimates for the components may not be consistent with the total.5) Experimental data (see the ECB website for further details).6) In 2008.

S 50ECB
Monthly Bulletin
October 2009
5.2 Output and demand
1. GDP and expenditure components 1)
Current prices (EUR billions, seasonally adjusted)
GDP
Total Domestic demand External balance 2)
Total Private Government Gross fixed Changes in Total Exports 2) Imports 2)
consumption consumption capital inventories 3)
formation
1 2 3 4 5 6 7 8 9
2005 8,140.1 8,021.0 4,669.2 1,664.4 1,681.1 6.3 119.1 3,114.3 2,995.22006 8,557.1 8,460.9 4,872.9 1,733.3 1,831.0 23.7 96.3 3,470.2 3,374.02007 9,002.2 8,863.7 5,064.5 1,801.6 1,970.1 27.5 138.5 3,746.0 3,607.52008 9,263.2 9,168.4 5,232.7 1,892.2 2,002.0 41.5 94.7 3,880.8 3,786.02008 Q2 2,325.0 2,291.9 1,308.4 473.9 507.3 2.3 33.0 992.2 959.2 Q3 2,327.2 2,311.5 1,317.4 474.9 502.8 16.3 15.7 991.2 975.5 Q4 2,297.1 2,284.3 1,306.4 480.6 483.2 14.0 12.8 908.5 895.72009 Q1 2,241.9 2,235.4 1,288.9 487.9 455.0 3.5 6.5 803.4 796.9 Q2 2,238.1 2,218.4 1,291.6 493.5 446.5 -13.3 19.7 785.0 765.2
percentage of GDP 2008 100.0 99.0 56.5 20.4 21.6 0.4 1.0 - -
Chain-linked volumes (prices of the previous year, seasonally adjusted 4) )
quarter-on-quarter percentage changes
2008 Q2 -0.3 -0.6 -0.4 0.8 -1.3 - - -0.5 -1.1 Q3 -0.4 0.1 0.0 0.5 -1.5 - - -1.0 0.3 Q4 -1.8 -0.7 -0.5 0.6 -3.5 - - -7.0 -4.62009 Q1 -2.5 -2.0 -0.5 0.6 -5.4 - - -9.2 -7.9 Q2 -0.2 -0.7 0.1 0.7 -1.5 - - -1.5 -2.9
annual percentage changes
2005 1.7 1.9 1.8 1.5 3.2 - - 5.0 5.72006 3.0 2.9 2.1 2.0 5.5 - - 8.3 8.32007 2.8 2.4 1.6 2.2 4.9 - - 6.1 5.32008 0.7 0.6 0.4 2.1 -0.3 - - 1.2 1.1
2008 Q2 1.5 0.8 0.5 2.1 1.2 - - 4.0 2.5 Q3 0.4 0.3 0.0 2.2 -0.9 - - 1.3 1.0 Q4 -1.8 -0.5 -0.7 2.4 -5.5 - - -6.6 -3.72009 Q1 -4.9 -3.1 -1.4 2.6 -11.2 - - -16.8 -12.8 Q2 -4.8 -3.2 -0.9 2.5 -11.4 - - -17.7 -14.4
contributions to quarter-on-quarter percentage changes of GDP in percentage points
2008 Q2 -0.3 -0.6 -0.2 0.2 -0.3 -0.2 0.2 - - Q3 -0.4 0.1 0.0 0.1 -0.3 0.4 -0.5 - - Q4 -1.8 -0.7 -0.3 0.1 -0.8 0.2 -1.1 - - 2009 Q1 -2.5 -2.0 -0.3 0.1 -1.1 -0.6 -0.5 - - Q2 -0.2 -0.7 0.0 0.2 -0.3 -0.6 0.5 - -
contributions to annual percentage changes of GDP in percentage points
2005 1.7 1.8 1.1 0.3 0.6 -0.2 -0.1 - - 2006 3.0 2.9 1.2 0.4 1.1 0.1 0.1 - - 2007 2.8 2.4 0.9 0.4 1.0 0.0 0.4 - - 2008 0.7 0.6 0.2 0.4 -0.1 0.1 0.0 - -
2008 Q2 1.5 0.8 0.3 0.4 0.3 -0.2 0.6 - - Q3 0.4 0.3 0.0 0.4 -0.2 0.1 0.2 - - Q4 -1.8 -0.5 -0.4 0.5 -1.2 0.6 -1.3 - - 2009 Q1 -4.9 -3.1 -0.8 0.5 -2.5 -0.4 -1.9 - - Q2 -4.8 -3.2 -0.5 0.5 -2.5 -0.7 -1.6 - -
Sources: Eurostat and ECB calculations.1) Data refer to Euro 16.2) Exports and imports cover goods and services and include cross-border intra-euro area trade. They are not fully consistent with Tables 7.1.2 and 7.3.1.3) Including acquisitions less disposals of valuables.4) Annual data are not adjusted for the variations in the number of working days.

S 51ECB
Monthly Bulletin
October 2009
EURO AREASTATISTICS
Prices, output,
demand and
labour markets
5.2 Output and demand
2. Value added by economic activity 1)
Current prices (EUR billions, seasonally adjusted)
Gross value added (basic prices) Taxes less
subsidies onTotal Agriculture, Mining, Construction Trade, repairs, Financial, real Public products
hunting, manufacturing hotels and estate, renting administration,forestry and energy restaurants, and business education,
and fishing transport and activities health andactivities communication other services
1 2 3 4 5 6 7 8
2005 7,295.2 143.7 1,481.3 439.8 1,540.9 2,018.0 1,671.4 844.92006 7,643.0 141.7 1,563.6 476.8 1,596.9 2,132.5 1,731.5 914.12007 8,043.1 152.3 1,640.1 513.5 1,670.4 2,264.7 1,802.1 959.02008 8,316.5 149.1 1,663.4 536.1 1,727.5 2,359.6 1,880.9 946.62008 Q2 2,086.5 37.7 424.0 133.9 431.7 589.3 469.9 238.5 Q3 2,088.9 36.5 418.6 135.3 434.4 593.1 471.0 238.3 Q4 2,066.6 35.9 396.6 132.7 429.7 593.6 478.0 230.52009 Q1 2,018.4 36.0 360.3 130.9 418.1 588.0 485.0 223.5 Q2 2,016.2 35.4 351.1 130.4 419.5 590.0 489.8 221.9
percentage of value added 2008 100.0 1.8 20.0 6.4 20.8 28.4 22.6 -
Chain-linked volumes (prices of the previous year, seasonally adjusted 2) )
quarter-on-quarter percentage changes
2008 Q2 -0.3 -0.1 -1.0 -2.1 -0.5 0.4 0.3 -0.9 Q3 -0.4 -0.1 -1.9 -1.5 -0.3 0.0 0.6 -0.1 Q4 -1.8 0.6 -6.2 -1.6 -1.8 -0.6 0.3 -2.02009 Q1 -2.5 -0.7 -8.3 -1.1 -2.9 -0.8 0.1 -2.7 Q2 -0.2 0.2 -1.9 -0.4 0.0 -0.1 0.6 0.3
annual percentage changes
2005 1.7 -6.1 1.3 1.6 1.9 2.7 1.3 1.92006 3.0 -0.8 3.6 2.9 2.8 4.1 1.4 3.32007 3.0 0.2 2.5 2.6 3.4 4.1 1.9 0.92008 0.9 1.8 -0.8 -0.9 0.8 1.9 1.7 -1.1
2008 Q2 1.7 1.9 1.7 -0.1 1.4 2.4 1.5 -0.4 Q3 0.7 2.8 -1.2 -1.4 0.4 1.6 1.8 -1.4 Q4 -1.7 2.2 -7.7 -3.8 -1.9 0.4 1.7 -2.52009 Q1 -4.9 -0.3 -16.5 -6.1 -5.4 -0.9 1.3 -5.6 Q2 -4.8 -0.1 -17.2 -4.5 -4.8 -1.4 1.6 -4.4
contributions to quarter-on-quarter percentage changes of value added in percentage points
2008 Q2 -0.3 0.0 -0.2 -0.1 -0.1 0.1 0.1 - Q3 -0.4 0.0 -0.4 -0.1 -0.1 0.0 0.1 - Q4 -1.8 0.0 -1.2 -0.1 -0.4 -0.2 0.1 - 2009 Q1 -2.5 0.0 -1.6 -0.1 -0.6 -0.2 0.0 - Q2 -0.2 0.0 -0.3 0.0 0.0 0.0 0.1 -
contributions to annual percentage changes of value added in percentage points
2005 1.7 -0.1 0.3 0.1 0.4 0.7 0.3 - 2006 3.0 0.0 0.7 0.2 0.6 1.1 0.3 - 2007 3.0 0.0 0.5 0.2 0.7 1.2 0.4 - 2008 0.9 0.0 -0.2 -0.1 0.2 0.5 0.4 -
2008 Q2 1.7 0.0 0.3 0.0 0.3 0.7 0.3 - Q3 0.7 0.0 -0.2 -0.1 0.1 0.5 0.4 - Q4 -1.7 0.0 -1.6 -0.2 -0.4 0.1 0.4 - 2009 Q1 -4.9 0.0 -3.4 -0.4 -1.1 -0.3 0.3 - Q2 -4.8 0.0 -3.5 -0.3 -1.0 -0.4 0.3 -
Sources: Eurostat and ECB calculations.1) Data refer to Euro 16.2) Annual data are not adjusted for the variations in the number of working days.

S 52ECB
Monthly Bulletin
October 2009
5.2 Output and demand (annual percentage changes, unless otherwise indicated)
3. Industrial production 1)
Total Industry excluding construction Construction
Total Total Industry excluding construction and energy Energy
(s.a. index 2005 = 100) Manu- Total Intermediate Capital Consumer goods
facturing goods goodsTotal Durable Non-durable
% of total 2) 100.0 78.0 78.0 69.4 68.8 28.2 22.1 18.5 2.6 15.9 9.1 22.0
1 2 3 4 5 6 7 8 9 10 11 122006 4.0 104.3 4.2 4.6 4.7 4.9 6.0 2.9 4.4 2.7 0.6 3.02007 3.2 108.1 3.7 4.1 4.3 3.7 6.7 2.3 1.3 2.5 -0.9 1.12008 -2.4 106.2 -1.7 -1.9 -2.0 -3.4 -0.3 -2.0 -5.6 -1.4 0.2 -4.7
2008 Q3 -2.2 105.5 -1.4 -1.5 -1.7 -2.1 -0.6 -2.2 -7.2 -1.5 -0.4 -5.0 Q4 -8.9 99.0 -9.0 -9.3 -9.5 -13.4 -8.6 -4.8 -11.9 -3.6 -4.4 -8.42009 Q1 -17.0 91.6 -18.4 -20.2 -20.6 -25.3 -23.8 -7.5 -20.3 -5.4 -4.4 -10.3 Q2 -16.6 89.2 -18.5 -19.5 -19.9 -24.0 -24.2 -6.1 -21.3 -3.5 -8.7 -7.3
2009 Feb. -18.0 91.2 -19.3 -21.2 -21.7 -25.8 -25.5 -8.6 -21.9 -6.5 -3.5 -12.5 Mar. -17.5 90.2 -19.3 -20.4 -20.7 -26.0 -23.2 -7.6 -20.6 -5.4 -10.1 -8.3 Apr. -18.6 88.8 -21.3 -22.0 -22.6 -27.0 -27.3 -7.6 -21.0 -5.2 -12.5 -5.6 May -16.0 89.4 -17.6 -18.6 -18.8 -23.1 -23.0 -5.3 -19.5 -2.8 -7.6 -8.5 June -15.1 89.3 -16.6 -17.8 -18.3 -22.0 -22.3 -5.4 -23.4 -2.5 -5.5 -7.8 July -15.6 89.0 -15.9 -16.9 -17.6 -19.8 -23.6 -3.9 -20.7 -1.2 -6.3 -10.3
month-on-month percentage changes (s.a.)
2009 Feb. -2.4 - -2.5 -2.3 -2.4 -2.1 -3.2 -1.7 -3.5 -1.4 -2.1 -1.7 Mar. -0.8 - -1.1 -1.0 -0.7 -1.5 0.1 -0.3 -0.5 -0.2 -4.0 0.6 Apr. -1.2 - -1.5 -1.0 -1.5 -1.4 -2.9 -0.1 -0.6 0.1 -1.4 0.0 May 0.1 - 0.7 0.3 0.8 0.7 1.0 0.4 -1.6 0.7 1.8 -2.0 June -0.3 - -0.2 -0.3 -0.5 -0.2 -0.6 -0.2 -3.2 0.1 2.3 -0.3 July -1.1 - -0.3 -0.2 -0.4 0.4 -2.2 0.4 0.0 0.4 -0.7 -1.7
4. Industrial new orders and turnover, retail sales and new passenger car registrations 1)
Industrial new orders Industrial turnover Retail sales (exluding automotive fuel) New passenger car
registrations Manufacturing 3) Manufacturing Current prices Constant prices (current prices) (current prices)
Total Total Total Total Total Total Total Food, Non-food Total (s.a., Total
(s.a. index (s.a. index (s.a. index beverages, thousands) 4)
2005 = 100) 2005 = 100) 2005 = 100) tobacco Textiles, Householdclothing, equipmentfootwear
% of total 2) 100.0 100.0 100.0 100.0 100.0 100.0 100.0 42.9 57.1 9.9 13.9
1 2 3 4 5 6 7 8 9 10 11 12 132006 110.9 10.3 108.3 8.0 3.4 102.4 2.5 1.1 3.6 3.1 5.4 978 3.32007 120.3 8.7 115.0 6.5 2.8 104.1 1.6 0.1 2.7 3.5 2.4 970 -0.92008 113.6 -5.3 116.9 1.9 1.7 103.3 -0.8 -1.7 -0.3 -1.7 -1.9 893 -7.9
2008 Q3 114.7 -1.3 118.3 4.3 2.1 103.1 -1.1 -1.8 -0.6 -1.0 -2.9 889 -8.7 Q4 95.0 -22.4 107.3 -7.5 -0.3 102.4 -1.7 -2.2 -1.4 -3.1 -2.7 827 -18.52009 Q1 84.5 -31.7 95.1 -21.6 -2.6 101.8 -2.5 -3.6 -1.8 -0.3 -6.1 834 -12.6 Q2 84.7 -30.4 93.9 -23.2 -2.7 101.5 -1.7 -1.4 -1.9 -2.0 -5.4 936 4.0
2009 Mar. 84.3 -26.3 94.2 -15.8 -2.7 101.7 -2.2 -3.9 -0.9 1.3 -6.3 865 -5.8 Apr. 84.0 -35.1 94.0 -25.9 -1.8 101.9 -1.2 -0.7 -1.8 -0.1 -5.5 898 -3.7 May 83.3 -30.3 94.3 -23.4 -3.5 101.4 -2.4 -2.1 -2.6 -4.4 -5.9 945 5.7 June 86.6 -25.6 93.4 -20.4 -2.7 101.4 -1.6 -1.4 -1.4 -1.4 -4.7 965 10.0 July 88.6 -24.6 95.0 -20.3 -3.0 101.2 -1.5 -1.7 -1.6 0.6 -3.5 945 6.9 Aug. . . . . -2.8 101.0 -2.3 -1.3 -3.2 . . 955 5.9
month-on-month percentage changes (s.a.)
2009 Apr. - -0.3 - -0.3 0.1 - 0.2 1.1 -0.3 -0.7 0.2 - 3.8 May - -0.8 - 0.3 -0.6 - -0.5 -0.6 -0.4 -0.5 -0.5 - 5.2 June - 4.0 - -0.9 -0.1 - 0.0 -0.2 0.0 0.7 0.1 - 2.2 July - 2.2 - 1.7 -0.3 - -0.2 -0.4 -0.2 1.1 0.1 - -2.1 Aug. - . - . 0.2 - -0.2 0.5 -0.6 . . - 1.0
Sources: Eurostat, except columns 12 and 13 in Table 4 in Section 5.2 (ECB calculations based on data from the ACEA, European Automobile Manufacturers’ Association).1) Data refer to Euro 16.2) In 2005.3) Includes manufacturing industries working mainly on the basis of orders, representing 61.2% of total manufacturing in 2005.4) Annual and quarterly figures are averages of monthly figures in the period concerned.

S 53ECB
Monthly Bulletin
October 2009
EURO AREASTATISTICS
Prices, output,
demand and
labour markets
5.2 Output and demand (percentage balances, 1) unless otherwise indicated; seasonally adjusted)
5. Business and Consumer Surveys
Economic Manufacturing industry Consumer confidence indicatorsentiment
indicator 2) Industrial confidence indicator Capacity Total 4) Financial Economic Unemployment Savings(long-term utilisation 3) situation situation situation over next
average Total 4) Order Stocks of Production (percentages) over next over next over next 12 months= 100) books finished expectations 12 months 12 months 12 months
products
1 2 3 4 5 6 7 8 9 10 112005 98.2 -7 -16 11 6 81.1 -14 -4 -15 28 -92006 106.9 2 0 6 13 83.1 -9 -3 -9 15 -92007 108.9 4 5 5 13 84.1 -5 -2 -4 5 -82008 91.1 -9 -15 11 -2 81.8 -18 -10 -25 23 -14
2008 Q3 89.9 -10 -15 12 -2 82.2 -19 -12 -28 23 -14 Q4 75.6 -25 -36 18 -22 78.1 -27 -11 -34 49 -142009 Q1 65.7 -36 -56 20 -31 72.5 -33 -11 -41 64 -14 Q2 70.2 -33 -62 18 -21 69.9 -28 -9 -34 59 -11 Q3 79.9 -26 -58 12 -9 . -21 -5 -20 51 -9
2009 Apr. 67.3 -35 -60 20 -25 70.3 -31 -10 -38 63 -11 May 70.2 -33 -61 18 -21 - -28 -9 -33 58 -13 June 73.2 -32 -63 16 -16 - -25 -7 -29 55 -9 July 76.0 -30 -61 14 -13 69.5 -23 -6 -23 53 -10 Aug. 80.8 -25 -56 13 -8 - -22 -5 -21 53 -9 Sep. 82.8 -24 -56 10 -7 - -19 -4 -15 48 -10
Construction confidence indicator Retail trade confidence indicator Services confidence indicator
Total 4) Order Employment Total 4) Present Volume of Expected Total 4) Business Demand in Demand inbooks expectations business stocks business climate recent the months
situation situation months ahead
12 13 14 15 16 17 18 19 20 21 222005 -7 -12 -2 -7 -12 13 4 11 5 10 182006 1 -4 6 1 3 14 13 18 13 18 242007 0 -8 7 1 4 15 12 19 16 19 232008 -14 -20 -7 -7 -6 16 1 2 -5 4 7
2008 Q3 -14 -21 -7 -9 -9 17 -1 1 -7 3 6 Q4 -23 -31 -16 -15 -16 17 -13 -12 -20 -9 -62009 Q1 -31 -36 -26 -19 -21 15 -20 -24 -33 -21 -18 Q2 -34 -42 -25 -17 -23 9 -19 -22 -29 -23 -15 Q3 -32 -41 -22 -14 -19 10 -13 -12 -19 -13 -6
2009 Apr. -34 -41 -26 -20 -26 11 -22 -24 -32 -22 -19 May -34 -44 -23 -14 -18 8 -17 -23 -29 -25 -14 June -33 -42 -24 -17 -24 9 -17 -20 -26 -22 -11 July -33 -41 -25 -13 -16 10 -14 -18 -24 -19 -9 Aug. -32 -40 -23 -14 -20 10 -12 -11 -16 -10 -5 Sep. -31 -42 -19 -15 -21 10 -14 -9 -15 -10 -2
Source: European Commission (Economic and Financial Affairs DG).1) Difference between the percentages of respondents giving positive and negative replies.2) The economic sentiment indicator is composed of the industrial, services, consumer, construction and retail trade confidence indicators; the industrial confidence indicator has
a weight of 40%, the services confidence indicator a weight of 30%, the consumer confidence indicator a weight of 20% and the two other indicators a weight of 5% each.Values of the economic sentiment indicator above (below) 100 indicate above-average (below-average) economic sentiment, calculated for the period 1990 to 2008.
3) Data are collected in January, April, July and October each year. The quarterly figures shown are averages of two successive surveys. Annual data are derived from quarterly averages.
4) The confidence indicators are calculated as simple averages of the components shown; the assessments of stocks (columns 4 and 17) and unemployment (column 10) are used with inverted signs for the calculation of confidence indicators.

S 54ECB
Monthly Bulletin
October 2009
5.3 Labour markets 1) (annual percentage changes, unless otherwise indicated)
1. Employment
Whole economy By employment status By economic activity
Millions (s.a.) Employees Self- Agriculture, Mining, Construction Trade, repairs, Financial, real Publicemployed hunting, manufacturing hotels and estate, renting administration,
forestry and energy restaurants, and business education, healthand fishing transport and services and other services
communication
% of total 2) 100.0 100.0 85.2 14.8 3.9 17.1 7.5 25.6 15.9 30.0
1 2 3 4 5 6 7 8 9 102005 141.846 1.0 1.0 0.5 -0.7 -1.1 2.7 0.7 2.5 1.52006 144.148 1.6 1.8 0.7 -1.8 -0.3 2.7 1.7 3.9 1.82007 146.712 1.8 2.0 0.8 -1.5 0.3 3.9 2.0 4.1 1.22008 147.821 0.8 0.9 -0.3 -1.4 -0.2 -2.2 1.3 2.2 1.1
2008 Q2 148.164 1.1 1.3 -0.2 -1.8 0.3 -1.4 1.6 2.6 1.4 Q3 147.743 0.5 0.8 -0.9 -1.7 -0.1 -2.7 0.9 1.8 1.0 Q4 147.304 0.0 0.1 -0.8 -1.0 -1.2 -5.0 0.4 0.7 1.42009 Q1 146.215 -1.2 -1.0 -2.3 -2.0 -3.0 -7.1 -1.2 -1.2 1.4 Q2 145.526 -1.8 -1.7 -2.2 -1.9 -4.6 -7.6 -1.9 -1.9 1.4
quarter-on-quarter percentage changes (s.a.)
2008 Q2 0.089 0.1 0.2 -0.5 -1.1 -0.1 -0.9 0.1 0.0 0.6 Q3 -0.421 -0.3 -0.2 -0.6 -0.6 -0.6 -2.0 -0.2 0.0 0.1 Q4 -0.439 -0.3 -0.3 -0.4 0.3 -1.0 -2.1 -0.4 -0.4 0.62009 Q1 -1.089 -0.7 -0.7 -0.9 -0.7 -1.5 -2.1 -0.8 -0.8 0.1 Q2 -0.689 -0.5 -0.5 -0.5 -0.8 -1.5 -1.5 -0.5 -0.6 0.5
2. Unemployment(seasonally adjusted)
Total By age 3) By gender 4)
Millions % of labour Adult Youth Male Female
forceMillions % of labour Millions % of labour Millions % of labour Millions % of labour
force force force force
% of total 2) 100.0 77.9 22.1 50.4 49.6
1 2 3 4 5 6 7 8 9 102005 13.717 9.0 10.674 7.9 3.042 17.5 6.916 8.1 6.801 10.02006 12.879 8.3 10.054 7.3 2.825 16.4 6.388 7.5 6.491 9.42007 11.661 7.5 9.114 6.6 2.546 14.9 5.731 6.7 5.929 8.52008 11.892 7.6 9.267 6.6 2.625 15.4 5.998 6.9 5.894 8.3
2008 Q2 11.595 7.4 9.041 6.4 2.553 15.0 5.776 6.7 5.819 8.2 Q3 11.964 7.6 9.314 6.6 2.649 15.6 6.074 7.0 5.889 8.3 Q4 12.656 8.0 9.844 7.0 2.813 16.6 6.549 7.6 6.108 8.62009 Q1 13.850 8.8 10.770 7.6 3.080 18.3 7.319 8.5 6.531 9.2 Q2 14.675 9.3 11.465 8.1 3.210 19.2 7.847 9.1 6.827 9.5
2009 Mar. 14.237 9.0 11.069 7.8 3.168 18.8 7.567 8.7 6.670 9.3 Apr. 14.503 9.2 11.309 8.0 3.194 19.0 7.741 8.9 6.762 9.5 May 14.684 9.3 11.463 8.1 3.221 19.2 7.858 9.1 6.826 9.5 June 14.836 9.4 11.623 8.2 3.214 19.4 7.943 9.2 6.893 9.6 July 15.000 9.5 11.779 8.3 3.221 19.6 8.048 9.3 6.952 9.7 Aug. 15.165 9.6 11.933 8.4 3.233 19.7 8.123 9.4 7.042 9.8
Source: Eurostat.1) Data refer to Euro 16. Data for employment refer to persons and are based on the ESA 95. Data for unemployment refer to persons and follow ILO recommendations.2) In 2008.3) Adult: 25 years of age and over; youth: below 25 years of age; rates are expressed as a percentage of the labour force for the relevant age group.4) Rates are expressed as a percentage of the labour force for the relevant gender.

S 55ECB
Monthly Bulletin
October 2009
6GOVERNMENT FINANCE
6.1 Revenue, expenditure and deficit/surplus 1) (as a percentage of GDP)
1. Euro area _ revenue
Total Current revenue Capital revenue Memo:
fiscalDirect Indirect Social Sales Capital burden 2)
taxes Households Corporations taxes Received by EU contributions Employers Employees taxesinstitutions
1 2 3 4 5 6 7 8 9 10 11 12 13 142000 46.5 46.2 12.6 9.6 3.0 13.9 0.6 15.8 8.2 4.8 2.2 0.3 0.3 42.62001 45.7 45.5 12.2 9.4 2.7 13.5 0.5 15.6 8.2 4.7 2.1 0.2 0.3 41.62002 45.1 44.8 11.8 9.2 2.5 13.5 0.4 15.6 8.2 4.6 2.1 0.3 0.3 41.22003 45.0 44.4 11.4 9.0 2.3 13.5 0.4 15.7 8.3 4.6 2.1 0.6 0.5 41.12004 44.5 44.1 11.3 8.7 2.5 13.5 0.3 15.5 8.2 4.5 2.1 0.5 0.4 40.82005 44.8 44.3 11.5 8.8 2.7 13.7 0.3 15.4 8.1 4.5 2.2 0.5 0.3 40.92006 45.4 45.0 12.1 8.9 3.0 13.9 0.3 15.3 8.1 4.5 2.1 0.3 0.3 41.52007 45.5 45.2 12.4 9.1 3.1 13.8 0.3 15.1 8.0 4.4 2.1 0.3 0.3 41.72008 44.8 44.6 12.2 9.3 2.7 13.3 0.3 15.3 8.1 4.4 2.1 0.2 0.3 41.0
2. Euro area _ expenditure
Total Current expenditure Capital expenditure Memo:
primaryTotal Compensation Intermediate Interest Current Investment Capital expenditure 3)
of consumption transfers Social Subsidies transfers Paid by EUemployees payments Paid by EU institutions
institutions1 2 3 4 5 6 7 8 9 10 11 12 13 14
2000 46.6 43.8 10.4 4.8 3.9 24.7 21.6 2.0 0.5 2.8 2.5 1.3 0.0 42.72001 47.6 43.7 10.3 4.8 3.8 24.8 21.7 1.9 0.5 3.9 2.5 1.4 0.0 43.82002 47.7 43.9 10.4 4.9 3.5 25.1 22.2 1.9 0.5 3.8 2.4 1.4 0.0 44.22003 48.1 44.1 10.5 5.0 3.3 25.4 22.5 1.9 0.5 3.9 2.5 1.4 0.1 44.82004 47.5 43.6 10.4 5.0 3.1 25.1 22.4 1.8 0.5 3.9 2.5 1.5 0.1 44.42005 47.3 43.4 10.4 5.0 3.0 25.0 22.3 1.7 0.5 3.9 2.5 1.4 0.0 44.32006 46.7 42.8 10.2 5.0 2.9 24.8 22.0 1.7 0.5 3.8 2.5 1.4 0.0 43.72007 46.1 42.3 10.0 5.0 3.0 24.4 21.6 1.6 0.4 3.9 2.5 1.3 0.0 43.12008 46.7 42.9 10.1 5.1 3.0 24.8 21.9 1.6 0.4 3.8 2.5 1.3 0.0 43.8
3. Euro area _ deficit/surplus, primary deficit/surplus and government consumption
Deficit (-)/surplus (+) Primary Government consumption 4)
deficit (-)/ Total Central State Local Social surplus (+) Total Collective Individual
gov. gov. gov. security Compensation Intermediate Transfers Consumption Sales consumption consumptionfunds of employees consumption in kind of fixed (minus)
via market capitalproducers
1 2 3 4 5 6 7 8 9 10 11 12 13 142000 -0.1 -0.5 -0.1 0.1 0.5 3.8 19.8 10.4 4.8 4.9 1.8 2.2 8.2 11.62001 -1.9 -1.7 -0.4 -0.1 0.3 1.9 19.9 10.3 4.8 5.0 1.8 2.1 8.2 11.72002 -2.6 -2.1 -0.5 -0.2 0.2 0.9 20.2 10.4 4.9 5.1 1.8 2.1 8.3 12.02003 -3.1 -2.4 -0.5 -0.2 0.0 0.2 20.5 10.5 5.0 5.2 1.9 2.1 8.3 12.22004 -3.0 -2.5 -0.4 -0.3 0.2 0.2 20.4 10.4 5.0 5.1 1.9 2.1 8.3 12.12005 -2.5 -2.2 -0.3 -0.2 0.2 0.4 20.4 10.4 5.0 5.1 1.9 2.2 8.2 12.32006 -1.3 -1.4 -0.1 -0.2 0.4 1.6 20.3 10.2 5.0 5.2 1.9 2.1 8.0 12.22007 -0.7 -1.2 0.0 0.0 0.5 2.3 20.0 10.0 5.0 5.2 1.9 2.1 7.9 12.12008 -1.9 -2.0 -0.2 -0.1 0.4 1.1 20.4 10.1 5.1 5.2 1.9 2.1 8.1 12.3
4. Euro area countries _ deficit (-)/surplus (+) 5)
BE DE IE GR ES FR IT CY LU MT NL AT PT SI SK FI1 2 3 4 5 6 7 8 9 10 11 12 13 14 15 16
2005 -2.7 -3.3 1.7 -5.1 1.0 -2.9 -4.3 -2.4 0.0 -2.9 -0.3 -1.6 -6.1 -1.4 -2.8 2.82006 0.3 -1.5 3.0 -2.8 2.0 -2.3 -3.3 -1.2 1.4 -2.6 0.6 -1.6 -3.9 -1.3 -3.5 4.02007 -0.2 -0.2 0.2 -3.6 2.2 -2.7 -1.5 3.4 3.6 -2.2 0.3 -0.5 -2.6 0.5 -1.9 5.22008 -1.2 -0.1 -7.1 -5.0 -3.8 -3.4 -2.7 0.9 2.6 -4.7 1.0 -0.4 -2.6 -0.9 -2.2 4.2
Sources: ECB for euro area aggregated data; European Commission for data relating to countries’ deficit/surplus.1) The data refer to the Euro 16. Revenue, expenditure and deficit/surplus are based on the ESA 95. Transactions involving the EU budget are included and consolidated.
Transactions among Member States’ governments are not consolidated.2) The fiscal burden comprises taxes and social contributions.3) Comprises total expenditure minus interest expenditure.4) Corresponds to final consumption expenditure (P.3) of general government in the ESA 95.5) Includes proceeds from the sale of UMTS licences and settlements under swaps and forward rate agreements.

S 56ECB
Monthly Bulletin
October 2009
6.2 Debt 1) (as a percentage of GDP)
1. Euro area _ by financial instrument and sector of the holder
Total Financial instruments Holders
Currency Loans Short-term Long-term Domestic creditors 2) Other
and securities securities creditors 3)
deposits Total MFIs Other Otherfinancial sectors
corporations
1 2 3 4 5 6 7 8 9 101999 71.9 2.9 14.4 4.3 50.4 48.7 25.4 13.7 9.7 23.22000 69.2 2.7 13.2 3.7 49.6 44.1 22.1 12.4 9.7 25.12001 68.2 2.8 12.4 4.0 49.0 42.0 20.6 11.1 10.3 26.22002 67.9 2.7 11.8 4.6 48.9 40.1 19.4 10.6 10.0 27.92003 69.1 2.1 12.4 5.0 49.6 39.4 19.6 11.1 8.7 29.72004 69.4 2.2 11.9 5.0 50.4 37.6 18.5 10.8 8.3 31.82005 70.0 2.4 11.8 4.7 51.1 35.5 17.2 11.2 7.1 34.52006 68.2 2.4 11.4 4.1 50.3 33.8 17.3 9.4 7.1 34.42007 66.0 2.2 10.8 4.2 48.8 32.1 16.6 8.6 6.9 33.92008 69.3 2.3 10.8 6.7 49.5 32.2 16.9 8.1 7.1 37.1
2. Euro area _ by issuer, maturity and currency denomination
Total Issued by 4) Original maturity Residual maturity Currencies
Central State Local Social Up to Over Up to Over 1 year Over Euro or Other
gov. gov. gov. security 1 year 1 year Variable 1 year and up to 5 5 years participating currenciesfunds interest rate years currencies 5)
1 2 3 4 5 6 7 8 9 10 11 12 131999 71.9 60.4 6.0 5.1 0.4 7.3 64.6 7.0 13.5 27.8 30.6 69.9 2.02000 69.2 58.1 5.8 4.9 0.4 6.5 62.7 6.3 13.4 27.8 28.0 67.4 1.82001 68.2 57.0 6.0 4.7 0.4 7.0 61.2 5.3 13.7 26.6 27.9 66.6 1.52002 67.9 56.6 6.2 4.7 0.4 7.6 60.3 5.2 15.5 25.3 27.2 66.7 1.32003 69.1 56.9 6.5 5.0 0.6 7.8 61.2 5.0 14.9 26.0 28.2 68.1 0.92004 69.4 57.3 6.6 5.1 0.4 7.8 61.6 4.7 14.8 26.2 28.5 68.6 0.92005 70.0 57.6 6.7 5.2 0.5 7.9 62.1 4.6 14.8 25.5 29.6 69.0 1.02006 68.2 55.8 6.5 5.4 0.5 7.4 60.8 4.3 14.4 24.0 29.8 67.6 0.62007 66.0 54.0 6.2 5.2 0.5 7.4 58.5 4.3 14.1 22.5 29.3 65.6 0.42008 69.3 57.2 6.6 5.2 0.4 10.2 59.2 4.5 17.5 22.1 29.7 68.8 0.5
3. Euro area countries
BE DE IE GR ES FR IT CY LU MT NL AT PT SI SK FI
1 2 3 4 5 6 7 8 9 10 11 12 13 14 15 162005 92.2 67.8 27.5 98.8 43.0 66.4 105.8 69.1 6.1 69.8 51.8 63.7 63.6 27.0 34.2 41.42006 87.9 67.6 24.9 95.9 39.6 63.7 106.5 64.6 6.7 63.7 47.4 62.0 64.7 26.7 30.4 39.22007 84.0 65.1 25.0 94.8 36.2 63.8 103.5 59.4 6.9 62.1 45.6 59.4 63.5 23.4 29.4 35.12008 89.6 65.9 43.2 97.6 39.5 68.0 105.8 49.1 14.7 64.1 58.2 62.5 66.4 22.8 27.6 33.4
Sources: ECB for euro area aggregated data; European Commission for data relating to countries’ debt.1) The data refer to the Euro 16. Gross general government debt at nominal value and consolidated between sub-sectors of government. Holdings by non-resident governments are
not consolidated. Data are partially estimated.2) Holders resident in the country whose government has issued the debt. 3) Includes residents of euro area countries other than the country whose government has issued the debt. 4) Excludes debt held by general government in the country whose government has issued it.5) Before 1999, this comprises debt in ECU, in domestic currency and in the currencies of other Member States which have adopted the euro.

S 57ECB
Monthly Bulletin
October 2009
EURO AREASTATISTICS
Government
finance
6.3 Change in debt 1) (as a percentage of GDP)
1. Euro area _ by source, financial instrument and sector of the holder
Total Source of change Financial instruments Holders
Borrowing Valuation Other Currency Loans Short-term Long-term Domestic Other
requirement 2) effects 3) changes and securities securities creditors 5) MFIs Other creditors 6)
in deposits financialvolume 4) corporations
1 2 3 4 5 6 7 8 9 10 11 122000 1.1 1.1 0.0 -0.1 0.0 -0.5 -0.3 1.9 -2.1 -2.0 -0.6 3.12001 1.9 1.9 -0.1 0.1 0.2 -0.3 0.5 1.5 -0.3 -0.5 -0.8 2.22002 2.1 2.7 -0.5 -0.1 0.0 -0.2 0.7 1.6 -0.5 -0.5 -0.1 2.62003 3.1 3.3 -0.2 0.0 -0.6 0.9 0.6 2.1 0.5 0.7 0.8 2.62004 3.1 3.2 -0.1 0.0 0.2 0.1 0.1 2.7 -0.2 -0.3 0.1 3.32005 3.0 3.0 0.0 0.0 0.3 0.3 -0.1 2.6 -0.8 -0.6 0.8 3.82006 1.5 1.4 0.1 0.0 0.2 0.2 -0.4 1.5 0.0 0.9 -1.2 1.52007 1.1 1.1 0.0 0.0 -0.1 -0.1 0.3 1.0 -0.1 0.2 -0.4 1.22008 5.3 5.2 0.1 0.0 0.1 0.4 2.6 2.2 1.1 0.8 -0.2 4.2
2. Euro area _ deficit-debt adjustment
Change in Deficit (-) / Deficit-debt adjustment 8)
debt surplus (+) 7) Total Transactions in main financial assets held by general government Valuation Other Other 9)
effects Exchange changes inTotal Currency Loans Securities 10) Shares and rate volume
and other Privatisations Equity effectsdeposits equity injections
1 2 3 4 5 6 7 8 9 10 11 12 13 142000 1.1 -0.1 1.0 1.0 0.7 0.1 0.2 0.0 -0.4 0.2 0.0 0.1 -0.1 0.12001 1.9 -1.9 0.0 -0.5 -0.6 0.1 0.1 -0.1 -0.3 0.1 -0.1 0.0 0.1 0.62002 2.1 -2.6 -0.5 0.1 0.1 0.0 0.0 -0.1 -0.4 0.1 -0.5 -0.1 -0.1 0.02003 3.1 -3.1 0.0 0.1 0.1 0.0 0.0 0.1 -0.2 0.1 -0.2 -0.1 0.0 0.12004 3.1 -3.0 0.2 0.2 0.2 0.0 0.1 0.0 -0.5 0.2 -0.1 0.0 0.0 0.12005 3.0 -2.5 0.5 0.6 0.3 0.1 0.1 0.1 -0.3 0.2 0.0 0.0 0.0 -0.12006 1.5 -1.3 0.2 0.3 0.3 -0.1 0.3 -0.2 -0.4 0.1 0.1 0.0 0.0 -0.12007 1.1 -0.7 0.4 0.5 0.2 0.0 0.3 0.0 -0.3 0.1 0.0 0.0 0.0 -0.12008 5.3 -1.9 3.4 3.1 0.8 0.9 0.7 0.8 -0.1 0.7 0.1 0.0 0.0 0.1
Source: ECB.1) The data refer to the Euro 16 and are partially estimated. Annual change in gross nominal consolidated debt is expressed as a percentage of GDP, i.e. [debt(t) - debt(t-1)] ÷ GDP(t).2) The borrowing requirement is by definition equal to transactions in debt.3) Includes, in addition to the impact of foreign exchange movements, effects arising from measurement at nominal value (e.g. premia or discounts on securities issued).4) Includes, in particular, the impact of the reclassification of units and certain types of debt assumption.5) Holders resident in the country whose government has issued the debt. 6) Includes residents of euro area countries other than the country whose government has issued the debt. 7) Including proceeds from sales of UMTS licences.8) The difference between the annual change in gross nominal consolidated debt and the deficit as a percentage of GDP. 9) Mainly composed of transactions in other assets and liabilities (trade credits, other receivables/payables and financial derivatives).10) Excluding financial derivatives.

S 58ECB
Monthly Bulletin
October 2009
6.4 Quarterly revenue, expenditure and deficit/surplus 1) (as a percentage of GDP)
1. Euro area _ quarterly revenue
Total Current revenue Capital revenue Memo:
fiscalDirect taxes Indirect taxes Social Sales Property Capital burden 2)
contributions income taxes
1 2 3 4 5 6 7 8 9 102003 Q1 42.0 41.5 9.8 12.9 15.5 1.7 0.7 0.5 0.2 38.5 Q2 45.8 44.4 11.9 12.8 15.7 2.0 1.4 1.4 1.2 41.5 Q3 42.7 42.2 10.8 12.6 15.5 1.9 0.6 0.5 0.2 39.1 Q4 49.2 48.2 13.1 14.1 16.2 2.9 0.8 1.0 0.3 43.72004 Q1 41.4 40.9 9.6 12.9 15.3 1.7 0.6 0.4 0.3 38.1 Q2 44.8 44.0 12.0 12.9 15.3 2.0 1.1 0.8 0.6 40.8 Q3 42.8 42.3 10.6 12.8 15.4 1.9 0.7 0.5 0.3 39.1 Q4 49.0 48.0 12.9 14.2 16.2 2.9 0.7 1.0 0.4 43.72005 Q1 41.9 41.4 9.9 13.0 15.2 1.7 0.6 0.5 0.3 38.4 Q2 44.4 43.8 11.7 13.2 15.1 2.0 1.1 0.6 0.3 40.2 Q3 43.4 42.7 11.0 13.0 15.2 1.9 0.7 0.7 0.3 39.5 Q4 49.1 48.3 13.4 14.2 16.1 2.9 0.8 0.8 0.3 43.92006 Q1 42.4 42.0 10.2 13.4 15.1 1.6 0.8 0.4 0.3 39.0 Q2 45.5 45.0 12.4 13.5 15.1 1.9 1.3 0.5 0.3 41.2 Q3 43.8 43.2 11.5 13.0 15.2 2.0 0.8 0.5 0.3 39.9 Q4 49.4 48.8 14.0 14.2 15.8 2.9 0.9 0.6 0.3 44.42007 Q1 42.2 41.8 10.3 13.5 14.8 1.7 0.8 0.4 0.3 38.8 Q2 45.8 45.4 12.8 13.4 15.0 1.9 1.5 0.4 0.3 41.5 Q3 43.7 43.2 12.0 12.8 14.9 1.9 0.8 0.5 0.3 40.0 Q4 49.7 49.2 14.4 14.2 15.8 3.0 0.9 0.5 0.3 44.72008 Q1 42.0 41.7 10.6 12.9 14.8 1.7 0.9 0.3 0.2 38.6 Q2 45.0 44.6 12.8 12.8 15.0 1.8 1.5 0.4 0.3 40.8 Q3 43.0 42.7 11.7 12.4 15.0 1.9 0.8 0.3 0.3 39.5 Q4 48.8 48.3 13.6 13.6 16.2 3.0 1.1 0.5 0.3 43.72009 Q1 42.3 42.1 10.6 12.6 15.4 1.8 1.0 0.2 0.2 38.8
2. Euro area _ quarterly expenditure and deficit/surplus
Total Current expenditure Capital expenditure Deficit (-)/ Primary
surplus (+) deficit (-)/Total Compensation Intermediate Interest Current Investment Capital surplus (+)
of consumption transfers Social Subsidies transfersemployees benefits
1 2 3 4 5 6 7 8 9 10 11 12 132003 Q1 46.9 43.3 10.3 4.6 3.5 24.9 21.3 1.3 3.5 1.9 1.6 -4.9 -1.3 Q2 47.1 43.6 10.4 4.7 3.4 25.1 21.6 1.3 3.5 2.3 1.2 -1.3 2.1 Q3 47.1 43.4 10.2 4.8 3.3 25.1 21.6 1.3 3.7 2.5 1.2 -4.4 -1.1 Q4 51.1 46.3 11.1 5.6 3.1 26.5 23.0 1.5 4.8 3.3 1.6 -1.9 1.22004 Q1 46.4 43.0 10.3 4.7 3.2 24.9 21.3 1.2 3.4 1.9 1.5 -5.0 -1.8 Q2 46.6 43.2 10.4 4.7 3.3 24.8 21.5 1.3 3.4 2.3 1.1 -1.8 1.5 Q3 46.0 42.7 9.9 4.8 3.1 24.8 21.4 1.3 3.4 2.4 1.0 -3.3 -0.2 Q4 50.8 45.6 11.0 5.7 2.9 26.1 22.6 1.4 5.2 3.1 2.1 -1.9 1.02005 Q1 46.8 43.1 10.2 4.6 3.1 25.1 21.3 1.2 3.7 1.9 1.8 -4.9 -1.8 Q2 46.1 42.7 10.2 4.8 3.2 24.5 21.4 1.1 3.4 2.3 1.1 -1.7 1.5 Q3 45.8 42.3 9.9 4.9 3.0 24.6 21.2 1.2 3.4 2.5 1.0 -2.4 0.6 Q4 50.5 45.7 11.1 5.8 2.7 26.0 22.5 1.3 4.8 3.1 1.7 -1.4 1.32006 Q1 45.2 42.1 10.0 4.6 2.9 24.5 21.0 1.2 3.1 1.9 1.2 -2.8 0.1 Q2 45.4 42.2 10.2 4.8 3.1 24.1 21.1 1.1 3.2 2.3 1.0 0.1 3.1 Q3 45.3 41.9 9.8 4.8 2.9 24.4 21.1 1.2 3.4 2.5 1.0 -1.6 1.4 Q4 50.3 45.0 10.7 5.7 2.7 25.9 22.2 1.4 5.3 3.2 2.2 -0.9 1.82007 Q1 44.3 41.1 9.8 4.6 2.9 23.8 20.3 1.2 3.2 2.0 1.2 -2.1 0.8 Q2 44.6 41.4 9.9 4.7 3.2 23.6 20.6 1.1 3.2 2.3 0.9 1.2 4.3 Q3 44.9 41.2 9.5 4.8 3.0 23.9 20.7 1.2 3.7 2.5 1.2 -1.3 1.7 Q4 50.2 45.1 10.6 5.7 2.8 26.0 22.2 1.5 5.1 3.3 1.8 -0.5 2.32008 Q1 44.5 41.4 9.7 4.6 2.9 24.1 20.4 1.2 3.2 2.0 1.2 -2.5 0.4 Q2 45.1 41.7 10.0 4.8 3.1 23.7 20.6 1.1 3.3 2.3 1.0 -0.1 3.1 Q3 45.2 41.8 9.6 4.9 3.0 24.2 21.0 1.2 3.5 2.5 1.0 -2.2 0.8 Q4 51.6 46.5 11.0 5.9 2.8 26.8 22.9 1.4 5.1 3.3 1.8 -2.8 0.02009 Q1 47.9 44.5 10.5 5.0 3.0 26.0 22.2 1.3 3.4 2.1 1.2 -5.6 -2.6
Source: ECB calculations based on Eurostat and national data.1) The data refer to the Euro 16. Revenue, expenditure and deficit/surplus are based on the ESA 95. Transactions between the EU budget and entities outside the government sector
are not included. Otherwise, and except for different data transmission deadlines, the quarterly data are consistent with the annual data. The data are not seasonally adjusted.2) The fiscal burden comprises taxes and social contributions.

S 59ECB
Monthly Bulletin
October 2009
EURO AREASTATISTICS
Government
finance
6.5 Quarterly debt and change in debt 1) (as a percentage of GDP)
1. Euro area _ Maastricht debt by financial instrument 2)
Total Financial instruments
Currency and deposits Loans Short-term securities Long-term securities1 2 3 4 5
2006 Q2 70.4 2.5 11.6 4.9 51.4 Q3 69.9 2.5 11.6 4.7 51.1 Q4 68.2 2.4 11.4 4.1 50.32007 Q1 68.5 2.4 11.4 4.8 49.9 Q2 68.6 2.2 11.2 5.1 50.3 Q3 67.7 2.1 11.0 5.1 49.4 Q4 66.0 2.2 10.8 4.2 48.82008 Q1 66.8 2.1 11.0 5.0 48.8 Q2 67.1 2.1 11.0 4.9 49.1 Q3 67.1 2.1 10.8 5.5 48.6 Q4 69.3 2.3 10.8 6.7 49.52009 Q1 73.1 2.3 10.9 7.9 52.0
2. Euro area _ deficit-debt adjustment
Change in Deficit (-)/ Deficit-debt adjustment Memo:
debt surplus (+) BorrowingTotal Transactions in main financial assets held by general government Valuation effects Other requirement
and other changesTotal Currency Loans Securities Shares and in volume
and deposits other equity1 2 3 4 5 6 7 8 9 10 11
2006 Q2 3.2 0.1 3.3 3.3 2.6 0.1 0.4 0.1 0.6 -0.6 2.6 Q3 1.2 -1.6 -0.4 -0.9 -0.7 -0.2 0.2 -0.2 0.3 0.3 0.9 Q4 -2.9 -0.9 -3.8 -2.4 -1.5 -0.5 -0.2 -0.2 -0.2 -1.3 -2.82007 Q1 4.9 -2.1 2.8 1.9 1.0 0.0 0.7 0.2 -0.2 1.1 5.2 Q2 3.7 1.2 4.9 4.9 4.0 0.0 0.6 0.3 0.2 -0.2 3.5 Q3 -0.5 -1.3 -1.7 -1.7 -2.1 0.1 0.4 -0.1 0.1 -0.1 -0.6 Q4 -3.5 -0.5 -4.0 -2.9 -2.0 -0.1 -0.6 -0.3 -0.1 -0.9 -3.42008 Q1 6.0 -2.5 3.5 3.2 2.0 -0.1 0.9 0.4 -0.1 0.4 6.2 Q2 3.7 -0.1 3.6 3.6 2.0 0.2 1.1 0.2 0.1 0.0 3.6 Q3 2.0 -2.2 -0.2 -1.0 -1.6 -0.1 0.1 0.7 0.5 0.3 1.5 Q4 9.3 -2.8 6.5 6.6 0.6 3.4 0.8 1.8 0.0 -0.2 9.32009 Q1 13.5 -5.6 8.0 6.9 4.9 1.5 -0.2 0.7 -0.1 1.1 13.6
C29 Deficit, borrowing requirement and change in debt(four-quarter moving sum as a percentage of GDP)
C30 Maastricht debt(annual change in the debt to GDP ratio and underlying factors)
0.0
1.0
2.0
3.0
4.0
5.0
6.0
7.0
8.0
2001 2002 2003 2004 2005 2006 2007 20080.0
1.0
2.0
3.0
4.0
5.0
6.0
7.0
8.0
deficitchange in debtborrowing requirement
-4.0
-2.0
0.0
2.0
4.0
6.0
8.0
2001 2002 2003 2004 2005 2006 2007 2008-4.0
-2.0
0.0
2.0
4.0
6.0
8.0
deficit-debt adjustmentprimary deficit/surplusgrowth/interest rate differentialchange in debt to GDP ratio
Source: ECB calculations based on Eurostat and national data.1) The data refer to the Euro 16.2) The stock data in quarter t are expressed as a percentage of the sum of GDP in t and the previous three quarters.

S 60ECB
Monthly Bulletin
October 2009
7 EXTERNAL TRANSACTIONS AND POSITIONS
7.1 Summary balance of payments 1) (EUR billions; net transactions)
Current account Net Financial account
Capital lending/ Errors andTotal Goods Services Income Current account borrowing Total Direct Portfolio Financial Other Reserve omissions
transfers to/from investment investment derivatives investment assetsrest of
the world(columns
1+6)
1 2 3 4 5 6 7 8 9 10 11 12 13 142006 -10.5 12.3 43.3 13.6 -79.7 9.2 -1.2 141.4 -157.6 293.7 3.3 2.9 -0.9 -140.22007 11.1 46.4 49.2 1.4 -85.9 13.7 24.8 41.2 -92.5 159.7 -67.0 46.0 -5.1 -66.02008 -101.0 -6.0 42.8 -41.3 -96.4 12.0 -89.0 303.3 -242.3 441.5 -56.7 164.6 -3.9 -214.32008 Q2 -31.1 6.1 13.1 -32.0 -18.3 3.1 -28.0 79.7 -53.4 27.3 -8.9 114.8 0.0 -51.7 Q3 -23.1 -9.0 13.4 -3.0 -24.6 1.9 -21.2 61.7 -35.9 121.5 -8.4 -17.2 1.6 -40.4 Q4 -29.5 -0.6 6.2 -9.8 -25.3 1.0 -28.5 126.3 -77.7 204.2 -16.7 17.0 -0.4 -97.92009 Q1 -42.4 -10.3 0.8 -2.6 -30.2 1.5 -40.8 147.9 -38.5 179.4 14.3 -13.0 5.7 -107.0 Q2 -20.5 11.2 9.3 -23.5 -17.5 2.5 -18.0 16.7 -8.9 94.0 28.2 -94.1 -2.5 1.32008 July -4.1 0.4 4.3 -0.6 -8.2 0.9 -3.2 48.5 -1.6 29.1 -0.1 23.4 -2.3 -45.3 Aug. -11.5 -7.1 5.0 -1.1 -8.2 0.5 -10.9 0.4 -11.8 19.3 -8.3 -1.1 2.3 10.6 Sep. -7.5 -2.3 4.1 -1.2 -8.2 0.5 -7.1 12.8 -22.5 73.1 0.1 -39.5 1.6 -5.7 Oct. -8.1 3.9 1.5 -2.7 -10.9 -0.1 -8.2 75.0 -12.0 142.6 -3.2 -44.5 -7.9 -66.7 Nov. -16.0 -4.0 1.4 -4.2 -9.2 1.3 -14.6 15.1 -51.9 53.7 -9.5 23.2 -0.4 -0.5 Dec. -5.3 -0.5 3.3 -2.9 -5.2 -0.3 -5.6 36.3 -13.9 7.9 -4.0 38.3 7.9 -30.72009 Jan. -28.4 -13.9 0.2 -3.5 -11.2 0.2 -28.3 45.4 -9.4 2.3 7.2 39.9 5.3 -17.2 Feb. -7.0 0.3 0.5 -1.7 -6.2 0.5 -6.5 34.5 -8.5 81.4 2.9 -42.5 1.2 -28.0 Mar. -7.0 3.3 0.0 2.6 -12.9 0.9 -6.1 68.0 -20.6 95.7 4.2 -10.4 -0.8 -61.9 Apr. -9.4 3.9 2.3 -7.2 -8.4 2.0 -7.4 -2.5 -4.5 -9.0 7.7 3.1 0.1 9.9 May -11.9 2.2 3.6 -11.4 -6.2 0.2 -11.6 26.6 4.8 58.0 10.4 -44.4 -2.3 -15.0 June 0.8 5.1 3.4 -4.9 -2.9 0.3 1.0 -7.4 -9.2 44.9 10.1 -52.8 -0.3 6.4 July 8.8 12.6 4.0 -1.1 -6.6 0.6 9.4 -34.1 5.3 -23.0 6.4 -19.4 -3.5 24.7
12-month cumulated transactions 2009 July -102.5 3.5 29.4 -39.4 -96.0 6.6 -95.9 269.9 -154.2 547.0 24.0 -150.1 3.2 -174.0
C31 B.o.p. current account balance(EUR billions)
-150
-100
-50
0
50
100
2001 2002 2003 2004 2005 2006 2007 2008-150
-100
-50
0
50
100
quarterly transactions12-month cumulated transactions
Source: ECB.1) The sign convention is explained in the general notes.

S 61ECB
Monthly Bulletin
October 2009
EURO AREASTATISTICS
External
transactions
and
positions
7.2 Current and capital accounts (EUR billions; transactions)
1. Summary current and capital accounts
Current account Capital account
Total Goods Services Income Current transfers
Credit Debit Net Credit Debit Credit Debit Credit Debit Credit Debit Credit Debit
Workers Workersremit- remit-tances tances
1 2 3 4 5 6 7 8 9 10 11 12 13 14 152006 2,423.8 2,434.3 -10.5 1,396.8 1,384.5 440.8 397.5 496.4 482.8 89.8 5.4 169.5 17.4 23.9 14.72007 2,686.1 2,675.0 11.1 1,513.7 1,467.3 490.3 441.1 592.3 591.0 89.8 6.4 175.7 20.5 25.9 12.22008 2,761.1 2,862.0 -101.0 1,579.5 1,585.5 506.5 463.8 586.0 627.3 89.0 6.7 185.5 21.3 25.7 13.72008 Q2 709.2 740.4 -31.1 407.8 401.7 126.1 113.0 153.4 185.3 22.0 1.5 40.3 5.3 7.3 4.1 Q3 696.6 719.8 -23.1 403.1 412.1 136.2 122.8 143.8 146.7 13.5 1.8 38.1 5.4 4.8 2.9 Q4 674.8 704.2 -29.5 378.4 379.0 127.3 121.0 141.7 151.5 27.4 1.8 52.7 5.5 4.7 3.82009 Q1 560.0 602.4 -42.4 308.3 318.6 108.9 108.1 117.7 120.3 25.1 1.4 55.4 4.9 4.2 2.6 Q2 563.4 583.9 -20.5 311.0 299.8 113.3 104.0 121.6 145.1 17.5 - 35.0 - 4.8 2.3
2009 May 184.3 196.2 -11.9 99.2 97.1 37.3 33.7 42.0 53.4 5.8 . 12.0 . 0.9 0.7 June 193.3 192.5 0.8 107.6 102.5 39.3 36.0 40.0 44.9 6.3 . 9.2 . 1.1 0.9 July 198.0 189.2 8.8 116.8 104.2 42.3 38.4 34.6 35.7 4.3 . 10.9 . 1.4 0.8
Seasonally adjusted
2008 Q2 702.1 718.9 -16.8 403.4 401.6 126.4 115.7 148.4 154.5 23.9 . 47.1 . . . Q3 696.4 719.9 -23.5 403.5 406.4 125.8 116.5 147.8 154.9 19.3 . 42.1 . . . Q4 653.8 697.1 -43.2 366.6 370.4 125.8 117.3 139.0 160.3 22.5 . 49.0 . . . 2009 Q1 581.4 625.7 -44.3 319.3 329.7 120.0 115.3 121.6 133.0 20.5 . 47.7 . . . Q2 563.3 573.8 -10.5 312.1 304.2 114.3 107.4 117.9 121.5 19.0 . 40.7 . . . 2009 Feb. 194.2 206.9 -12.7 106.9 108.0 39.4 37.8 40.0 45.9 7.9 . 15.1 . . . Mar. 190.1 200.1 -10.0 105.2 106.3 39.2 38.3 39.3 39.1 6.6 . 16.4 . . . Apr. 187.6 193.7 -6.1 104.1 101.7 38.7 35.7 38.6 41.5 6.2 . 14.8 . . . May 190.1 190.2 -0.1 103.5 100.6 38.6 35.6 41.7 39.7 6.4 . 14.3 . . . June 185.6 189.9 -4.3 104.5 102.0 37.1 36.0 37.6 40.3 6.4 . 11.6 . . . July 188.2 181.6 6.6 108.8 97.6 37.3 34.6 35.4 37.1 6.6 . 12.3 . . .
C32 B.o.p. goods(EUR billions, seasonally adjusted; three-month moving average)
C33 B.o.p. services(EUR billions, seasonally adjusted; three-month moving average)
60
80
100
120
140
2000 2001 2002 2003 2004 2005 2006 2007 2008 200960
80
100
120
140
exports (credit)imports (debit)
20
25
30
35
40
45
2000 2001 2002 2003 2004 2005 2006 2007 2008 200920
25
30
35
40
45
exports (credit)imports (debit)
Source: ECB.
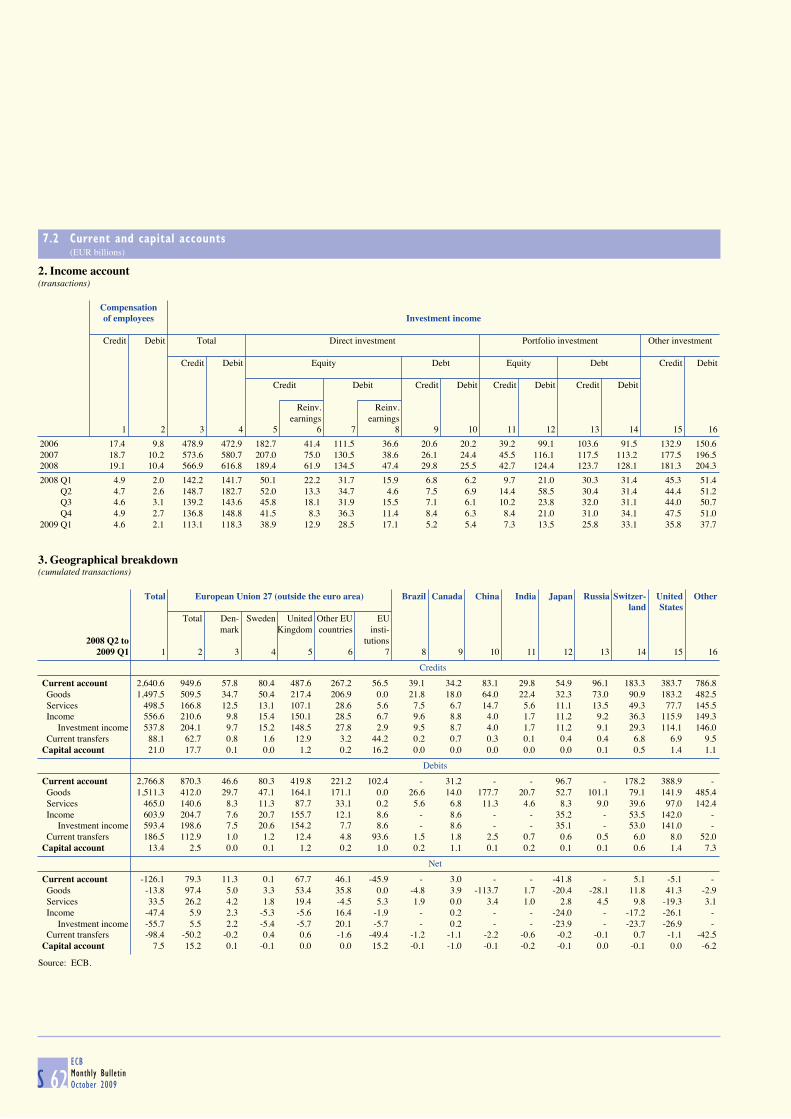
S 62ECB
Monthly Bulletin
October 2009
7.2 Current and capital accounts (EUR billions)
2. Income account(transactions)
Compensation of employees Investment income
Credit Debit Total Direct investment Portfolio investment Other investment
Credit Debit Equity Debt Equity Debt Credit Debit
Credit Debit Credit Debit Credit Debit Credit Debit
Reinv. Reinv.earnings earnings
1 2 3 4 5 6 7 8 9 10 11 12 13 14 15 16 2006 17.4 9.8 478.9 472.9 182.7 41.4 111.5 36.6 20.6 20.2 39.2 99.1 103.6 91.5 132.9 150.6 2007 18.7 10.2 573.6 580.7 207.0 75.0 130.5 38.6 26.1 24.4 45.5 116.1 117.5 113.2 177.5 196.5 2008 19.1 10.4 566.9 616.8 189.4 61.9 134.5 47.4 29.8 25.5 42.7 124.4 123.7 128.1 181.3 204.3 2008 Q1 4.9 2.0 142.2 141.7 50.1 22.2 31.7 15.9 6.8 6.2 9.7 21.0 30.3 31.4 45.3 51.4 Q2 4.7 2.6 148.7 182.7 52.0 13.3 34.7 4.6 7.5 6.9 14.4 58.5 30.4 31.4 44.4 51.2 Q3 4.6 3.1 139.2 143.6 45.8 18.1 31.9 15.5 7.1 6.1 10.2 23.8 32.0 31.1 44.0 50.7 Q4 4.9 2.7 136.8 148.8 41.5 8.3 36.3 11.4 8.4 6.3 8.4 21.0 31.0 34.1 47.5 51.0 2009 Q1 4.6 2.1 113.1 118.3 38.9 12.9 28.5 17.1 5.2 5.4 7.3 13.5 25.8 33.1 35.8 37.7
3. Geographical breakdown(cumulated transactions)
Total European Union 27 (outside the euro area) Brazil Canada China India Japan Russia Switzer- United Other
land StatesTotal Den- Sweden United Other EU EU
mark Kingdom countries insti-2008 Q2 to tutions
2009 Q1 1 2 3 4 5 6 7 8 9 10 11 12 13 14 15 16
Credits
Current account 2,640.6 949.6 57.8 80.4 487.6 267.2 56.5 39.1 34.2 83.1 29.8 54.9 96.1 183.3 383.7 786.8 Goods 1,497.5 509.5 34.7 50.4 217.4 206.9 0.0 21.8 18.0 64.0 22.4 32.3 73.0 90.9 183.2 482.5 Services 498.5 166.8 12.5 13.1 107.1 28.6 5.6 7.5 6.7 14.7 5.6 11.1 13.5 49.3 77.7 145.5 Income 556.6 210.6 9.8 15.4 150.1 28.5 6.7 9.6 8.8 4.0 1.7 11.2 9.2 36.3 115.9 149.3 Investment income 537.8 204.1 9.7 15.2 148.5 27.8 2.9 9.5 8.7 4.0 1.7 11.2 9.1 29.3 114.1 146.0 Current transfers 88.1 62.7 0.8 1.6 12.9 3.2 44.2 0.2 0.7 0.3 0.1 0.4 0.4 6.8 6.9 9.5 Capital account 21.0 17.7 0.1 0.0 1.2 0.2 16.2 0.0 0.0 0.0 0.0 0.0 0.1 0.5 1.4 1.1
Debits
Current account 2,766.8 870.3 46.6 80.3 419.8 221.2 102.4 - 31.2 - - 96.7 - 178.2 388.9 - Goods 1,511.3 412.0 29.7 47.1 164.1 171.1 0.0 26.6 14.0 177.7 20.7 52.7 101.1 79.1 141.9 485.4 Services 465.0 140.6 8.3 11.3 87.7 33.1 0.2 5.6 6.8 11.3 4.6 8.3 9.0 39.6 97.0 142.4 Income 603.9 204.7 7.6 20.7 155.7 12.1 8.6 - 8.6 - - 35.2 - 53.5 142.0 - Investment income 593.4 198.6 7.5 20.6 154.2 7.7 8.6 - 8.6 - - 35.1 - 53.0 141.0 - Current transfers 186.5 112.9 1.0 1.2 12.4 4.8 93.6 1.5 1.8 2.5 0.7 0.6 0.5 6.0 8.0 52.0 Capital account 13.4 2.5 0.0 0.1 1.2 0.2 1.0 0.2 1.1 0.1 0.2 0.1 0.1 0.6 1.4 7.3
Net
Current account -126.1 79.3 11.3 0.1 67.7 46.1 -45.9 - 3.0 - - -41.8 - 5.1 -5.1 - Goods -13.8 97.4 5.0 3.3 53.4 35.8 0.0 -4.8 3.9 -113.7 1.7 -20.4 -28.1 11.8 41.3 -2.9 Services 33.5 26.2 4.2 1.8 19.4 -4.5 5.3 1.9 0.0 3.4 1.0 2.8 4.5 9.8 -19.3 3.1 Income -47.4 5.9 2.3 -5.3 -5.6 16.4 -1.9 - 0.2 - - -24.0 - -17.2 -26.1 - Investment income -55.7 5.5 2.2 -5.4 -5.7 20.1 -5.7 - 0.2 - - -23.9 - -23.7 -26.9 - Current transfers -98.4 -50.2 -0.2 0.4 0.6 -1.6 -49.4 -1.2 -1.1 -2.2 -0.6 -0.2 -0.1 0.7 -1.1 -42.5 Capital account 7.5 15.2 0.1 -0.1 0.0 0.0 15.2 -0.1 -1.0 -0.1 -0.2 -0.1 0.0 -0.1 0.0 -6.2
Source: ECB.

S 63ECB
Monthly Bulletin
October 2009
EURO AREASTATISTICS
External
transactions
and
positions
7.3 Financial account (EUR billions and annual growth rates; outstanding amounts and growth rates at end of period, transactions and other changes during period)
1. Summary financial account
Outstanding amounts (international investment position)
Total 1) Total Direct Portfolio Net Other Reserve
as a % of GDP investment investment financial investment assetsderivatives
Assets Liabilities Net Assets Liabilities Net Assets Liabilities Assets Liabilities Assets Liabilities
1 2 3 4 5 6 7 8 9 10 11 12 13 14
2004 8,602.5 9,518.4 -915.9 109.5 121.2 -11.7 2,268.7 2,235.4 3,045.0 4,080.2 -37.4 3,045.2 3,202.9 281.02005 10,785.2 11,605.3 -820.2 132.4 142.5 -10.1 2,790.8 2,444.3 3,887.5 5,109.1 -21.4 3,805.8 4,052.0 322.52006 12,258.8 13,306.1 -1,047.3 143.3 155.6 -12.2 3,131.7 2,728.7 4,371.5 5,866.5 -20.8 4,448.7 4,711.0 327.72007 13,750.6 14,915.4 -1,164.9 152.8 165.8 -12.9 3,526.1 3,091.6 4,653.8 6,340.0 -10.2 5,233.5 5,483.9 347.4
2008 Q4 13,069.7 14,873.5 -1,803.9 141.0 160.5 -19.5 3,742.5 3,223.1 3,723.6 5,985.8 1.2 5,228.2 5,664.6 374.22009 Q1 12,776.8 14,762.3 -1,985.5 139.0 160.6 -21.6 3,771.7 3,229.1 3,609.5 6,029.9 -44.8 5,044.7 5,503.3 395.7
Changes to outstanding amounts
2004 740.8 888.6 -147.8 9.4 11.3 -1.9 99.2 151.2 389.4 494.0 -17.3 295.4 243.4 -25.72005 2,182.7 2,086.9 95.7 26.8 25.6 1.2 522.1 209.0 842.5 1,028.9 16.0 760.6 849.1 41.52006 1,473.6 1,700.8 -227.1 17.2 19.9 -2.7 340.9 284.3 484.0 757.4 0.6 642.9 659.0 5.22007 1,491.8 1,609.3 -117.5 16.6 17.9 -1.3 394.4 362.9 282.3 473.5 10.6 784.7 772.9 19.7
2008 Q4 -859.4 -311.8 -547.6 -36.3 -13.2 -23.1 -34.9 24.4 -557.5 -43.2 -22.0 -248.3 -292.9 3.32009 Q1 -292.8 -111.2 -181.6 -13.4 -5.1 -8.3 29.2 6.0 -114.0 44.0 -46.0 -183.6 -161.3 21.6
Transactions
2005 1,329.2 1,339.4 -10.2 16.3 16.4 -0.1 358.4 152.4 416.2 543.3 17.3 554.9 643.7 -17.72006 1,680.0 1,821.4 -141.4 19.6 21.3 -1.7 417.4 259.8 527.6 821.4 -3.3 737.4 740.3 0.92007 1,896.7 1,937.9 -41.2 21.1 21.5 -0.5 474.2 381.7 439.5 599.3 67.0 910.9 956.9 5.12008 395.2 698.5 -303.3 4.3 7.5 -3.3 348.1 105.8 -20.2 421.4 56.7 6.7 171.4 3.9
2008 Q4 -373.1 -246.8 -126.3 -15.8 -10.4 -5.3 47.6 -30.1 -160.7 43.4 16.7 -277.1 -260.1 0.42009 Q1 -246.1 -98.2 -147.9 -11.2 -4.5 -6.7 79.3 40.8 -72.2 107.2 -14.3 -233.2 -246.2 -5.7 Q2 -81.4 -64.7 -16.7 -3.6 -2.9 -0.7 88.9 80.0 10.5 104.5 -28.2 -155.1 -249.2 2.5
2009 Mar. -122.5 -54.6 -68.0 . . . 33.4 12.8 -63.1 32.6 -4.2 -89.6 -100.0 0.8 Apr. 78.7 76.2 2.5 . . . 59.2 54.7 -0.6 -9.6 -7.7 28.0 31.1 -0.1 May -138.5 -111.9 -26.6 . . . 14.3 19.0 8.9 66.9 -10.4 -153.5 -197.9 2.3 June -21.6 -29.0 7.4 . . . 15.4 6.2 2.2 47.1 -10.1 -29.5 -82.3 0.3 July -32.7 -66.8 34.1 . . . 11.6 17.0 5.5 -17.5 -6.4 -46.9 -66.3 3.5
Other changes
2004 -76.9 97.0 -173.9 -1.0 1.2 -2.2 -69.8 61.8 43.6 76.2 -25.8 -11.7 -41.0 -13.32005 853.5 747.5 105.9 10.5 9.2 1.3 163.7 56.5 426.3 485.6 -1.4 205.7 205.4 59.22006 -206.4 -120.6 -85.7 -2.4 -1.4 -1.0 -76.5 24.5 -43.6 -63.9 3.9 -94.4 -81.3 4.32007 -404.9 -328.5 -76.3 -4.5 -3.7 -0.8 -79.7 -18.8 -157.2 -125.8 -56.4 -126.1 -184.0 14.6
Other changes due to exchange rate changes
2004 -168.8 -96.4 -72.4 -2.1 -1.2 -0.9 -36.0 7.4 -62.3 -50.2 . -61.2 -53.5 -9.42005 369.3 214.4 154.9 4.5 2.6 1.9 86.9 -18.2 136.8 118.1 . 126.9 114.5 18.72006 -321.7 -207.9 -113.8 -3.8 -2.4 -1.3 -70.7 11.7 -131.1 -118.0 . -104.6 -101.5 -15.32007 -501.6 -244.1 -257.5 -5.6 -2.7 -2.9 -110.0 27.1 -194.5 -124.1 . -182.2 -147.1 -14.9
Other changes due to price changes
2004 102.1 218.6 -116.5 1.3 2.8 -1.5 30.7 25.0 100.3 193.6 -25.8 . . -3.12005 288.1 327.5 -39.4 3.5 4.0 -0.5 60.7 48.6 186.6 278.9 -1.4 . . 42.12006 297.0 309.5 -12.5 3.5 3.6 -0.1 61.2 39.4 215.7 270.1 3.9 . . 16.32007 156.6 -63.8 220.3 1.7 -0.7 2.4 29.6 12.3 151.7 -76.1 -56.4 . . 31.6
Other changes due to other adjustments
2004 -10.3 -25.2 15.0 -0.1 -0.3 0.2 -64.5 29.4 5.6 -67.2 . 49.5 12.5 -0.82005 195.5 205.6 -10.2 2.4 2.5 -0.1 16.0 26.1 102.9 88.6 . 78.8 90.9 -2.22006 -181.4 -222.3 40.9 -2.1 -2.6 0.5 -67.0 -26.6 -128.2 -216.0 . 10.2 20.3 3.72007 -59.5 -20.7 -38.9 -0.7 -0.2 -0.4 0.6 -58.2 -114.3 74.4 . 56.0 -36.8 -1.9
Growth rates of outstanding amounts
2004 10.3 9.1 - . . . 7.8 4.2 12.8 11.5 . 11.1 9.5 -4.12005 14.9 13.7 - . . . 15.2 6.8 13.1 12.8 . 17.6 19.5 -5.82006 15.7 15.8 - . . . 15.0 10.6 13.8 16.3 . 19.5 18.4 0.22007 15.5 14.5 - . . . 15.2 14.0 10.0 10.1 . 20.5 20.4 1.6
2008 Q4 2.8 4.7 - . . . 10.0 3.4 -0.7 7.0 . 0.1 3.2 1.12009 Q1 -3.0 0.1 - . . . 7.2 1.7 -4.0 6.3 . -9.5 -7.1 -1.9 Q2 -4.2 -1.4 . . . . 8.4 4.5 -6.6 5.3 . -10.4 -11.4 -1.3
Source: ECB.1) Net financial derivatives are included in assets.

S 64ECB
Monthly Bulletin
October 2009
7.3 Financial account (EUR billions and annual growth rates; outstanding amounts and growth rates at end of period, transactions during period)
2. Direct investment
Oustanding amounts (international investment position)
By resident units abroad By non-resident units in the euro area
Total Equity capital Other capital Total Equity capital Other capital and reinvested earnings (mostly inter-company loans) and reinvested earnings (mostly inter-company loans)
Total MFIs Non- Total MFIs Non- Total into MFIs into Total to MFIs toMFIs MFIs Non-MFIs Non-MFIs
1 2 3 4 5 6 7 8 9 10 11 12 13 14
2006 3,131.7 2,540.4 217.4 2,323.0 591.3 2.2 589.1 2,728.7 2,091.9 65.5 2,026.4 636.8 9.7 627.12007 3,526.1 2,844.3 246.4 2,597.9 681.9 6.3 675.6 3,091.6 2,343.9 69.1 2,274.8 747.7 14.9 732.8
2008 Q4 3,742.5 2,951.6 248.7 2,703.0 790.9 6.1 784.7 3,223.1 2,394.4 75.8 2,318.6 828.7 17.1 811.62009 Q1 3,771.7 2,953.9 254.8 2,699.0 817.8 12.0 805.8 3,229.1 2,403.7 77.7 2,325.9 825.5 17.3 808.2
Transactions
2007 474.2 355.5 24.6 330.9 118.7 -0.1 118.8 381.7 267.4 5.2 262.2 114.3 1.4 112.92008 348.1 227.5 14.0 213.5 120.6 -0.2 120.8 105.8 76.9 -1.3 78.2 28.9 1.5 27.42008 Q4 47.6 27.9 5.8 22.1 19.7 -0.3 20.0 -30.1 8.6 0.0 8.6 -38.7 -0.2 -38.62009 Q1 79.3 36.2 9.1 27.1 43.1 0.9 42.2 40.8 34.7 1.0 33.7 6.1 0.1 5.9 Q2 88.9 66.2 10.2 55.9 22.7 0.6 22.2 80.0 62.3 0.3 62.0 17.7 1.1 16.5
2009 Mar. 33.4 13.1 4.0 9.0 20.4 -1.2 21.6 12.8 13.9 -1.7 15.7 -1.1 -0.2 -1.0 Apr. 59.2 49.7 6.7 43.0 9.5 1.5 7.9 54.7 47.8 0.3 47.5 6.9 0.1 6.8 May 14.3 7.7 0.7 6.9 6.6 0.1 6.5 19.0 5.0 -0.1 5.1 14.1 0.1 14.0 June 15.4 8.7 2.8 6.0 6.7 -1.1 7.7 6.2 9.6 0.1 9.4 -3.4 0.9 -4.3 July 11.6 2.2 3.0 -0.8 9.4 3.3 6.1 17.0 10.0 0.3 9.8 6.9 0.9 6.1
Growth rates
2006 15.0 14.6 20.1 14.1 17.1 -2.9 17.2 10.6 12.3 10.2 12.4 5.5 -1.2 5.62007 15.2 14.0 11.1 14.3 20.1 -82.4 20.3 14.0 12.8 8.5 12.9 18.0 9.0 18.2
2008 Q4 10.0 8.1 5.7 8.3 17.8 -4.5 18.0 3.4 3.3 -1.9 3.5 3.9 8.4 3.82009 Q1 7.2 5.1 6.0 5.0 15.8 -19.9 16.2 1.7 2.9 -0.7 3.0 -1.8 8.3 -2.0 Q2 8.4 6.8 7.0 6.8 14.5 7.8 14.6 4.5 5.8 2.9 5.9 0.7 9.0 0.6
C34 B.o.p. net direct and portfolio investment(EUR billions)
-300
-200
-100
0
100
200
300
400
500
600
700
2001 2002 2003 2004 2005 2006 2007 2008-300
-200
-100
0
100
200
300
400
500
600
700
direct investment (quarterly transactions)portfolio investment (quarterly transactions)direct investment (12-month cumulated transactions)portfolio investment (12-month cumulated transactions)
Source: ECB.

S 65ECB
Monthly Bulletin
October 2009
EURO AREASTATISTICS
External
transactions
and
positions
7.3 Financial account (EUR billions and annual growth rates; outstanding amounts and growth rates at end of period, transactions during period)
3. Portfolio investment assets
Outstanding amounts (international investment position)
Total Equity Debt instruments
Bonds and notes Money market instruments
Total MFIs Non-MFIs Total MFIs Non-MFIs Total MFIs Non-MFIs
Euro- General Euro- General Euro- Generalsystem government system government system government
1 2 3 4 5 6 7 8 9 10 11 12 13 14 15 16
2006 4,371.5 1,936.2 127.8 2.8 1,808.4 37.0 2,056.0 875.0 13.0 1,181.0 14.1 379.3 311.6 11.1 67.7 0.22007 4,653.8 1,984.7 145.2 2.4 1,839.5 44.6 2,231.5 937.4 15.5 1,294.0 16.9 437.7 350.6 33.9 87.1 0.5
2008 Q4 3,723.6 1,144.8 70.6 3.0 1,074.1 28.0 2,134.3 955.1 19.9 1,179.2 17.0 444.5 376.9 61.6 67.6 1.22009 Q1 3,609.5 1,053.7 62.2 2.9 991.4 27.9 2,089.4 913.5 17.1 1,175.9 16.1 466.5 389.1 58.9 77.4 1.7
Transactions
2007 439.5 79.5 36.0 -0.4 43.6 5.5 282.5 153.6 3.8 128.9 2.0 77.5 68.5 25.0 9.0 0.32008 -20.2 -113.2 -55.4 0.6 -57.8 -0.5 88.6 48.2 10.3 40.4 2.4 4.4 21.8 21.2 -17.4 0.32008 Q4 -160.7 -49.9 -4.0 0.4 -45.8 -1.3 -62.1 -16.7 -1.1 -45.4 -0.5 -48.8 -22.1 -5.1 -26.7 0.22009 Q1 -72.2 -34.4 -7.9 0.0 -26.6 0.2 -57.4 -40.5 -2.4 -16.9 -1.2 19.7 13.4 -0.5 6.3 0.4 Q2 10.5 5.3 1.2 0.0 4.1 - 8.0 -14.8 3.5 22.8 - -2.9 -0.4 -6.6 -2.5 -
2009 Mar. -63.1 -18.4 -5.3 0.0 -13.2 . -38.9 -32.8 -1.4 -6.1 . -5.7 -6.6 -0.1 0.9 . Apr. -0.6 -2.5 0.1 -0.1 -2.6 . 6.9 -6.6 0.6 13.5 . -5.1 0.3 1.3 -5.4 . May 8.9 3.0 1.2 0.0 1.8 . -0.1 -9.9 -0.2 9.8 . 6.0 2.2 -1.9 3.9 . June 2.2 4.8 -0.1 0.0 4.9 . 1.3 1.7 3.1 -0.5 . -3.9 -2.9 -6.1 -1.0 . July 5.5 3.6 0.9 0.0 2.7 . 6.2 -11.7 0.7 17.9 . -4.3 1.4 0.8 -5.7 .
Growth rates
2006 13.8 9.0 17.5 0.9 8.4 22.1 17.1 24.1 15.8 12.5 9.0 21.3 22.2 220.7 20.4 -27.32007 10.0 4.0 29.0 -13.1 2.3 14.4 13.8 17.8 30.1 10.8 14.0 20.8 22.5 225.0 13.0 173.4
2008 Q4 -0.7 -6.6 -37.8 26.0 -3.9 -1.3 4.0 5.1 48.9 3.2 14.6 0.7 6.1 82.5 -22.2 52.82009 Q1 -4.0 -7.3 -23.2 19.1 -6.1 0.8 -0.4 -2.3 7.9 1.1 4.3 -10.1 -5.9 51.3 -27.8 74.6 Q2 -6.6 -8.6 -17.6 15.0 -8.0 - -4.1 -7.5 0.2 -1.5 - -12.2 -10.2 -21.6 -22.0 -
4. Portfolio investment liabilities
Outstanding amounts (international investment position)
Total Equity Debt instruments
Bonds and notes Money market instruments
Total MFIs Non-MFIs Total MFIs Non-MFIs Total MFIs Non-MFIs
General Generalgovernment government
1 2 3 4 5 6 7 8 9 10 11 12
2006 5,866.5 2,910.8 657.6 2,253.2 2,656.9 953.8 1,705.5 1,019.2 298.8 125.7 173.2 138.02007 6,340.0 3,103.1 754.7 2,348.3 2,917.3 1,128.0 1,789.3 1,113.4 319.6 153.4 166.1 142.5
2008 Q4 5,985.8 2,135.2 574.2 1,561.0 3,255.2 1,148.8 2,106.4 1,374.1 595.4 172.4 423.0 355.92009 Q1 6,029.9 2,065.0 593.5 1,471.5 3,337.3 1,139.0 2,198.3 1,437.6 627.6 169.8 457.9 405.3
Transactions
2007 599.3 127.6 76.7 50.6 433.0 229.7 203.4 148.6 38.6 41.1 -2.6 8.12008 421.4 -73.5 94.8 -168.6 274.7 42.3 232.6 205.5 220.2 -6.3 226.4 199.22008 Q4 43.4 -42.4 19.2 -61.9 -20.0 -44.8 24.7 40.8 105.8 -10.5 116.3 109.12009 Q1 107.2 -10.9 4.3 -15.3 82.1 -13.7 95.8 65.4 36.0 1.2 34.8 51.1 Q2 104.5 -5.2 -11.7 6.5 95.7 33.0 62.6 - 14.0 -12.2 26.1 -
2009 Mar. 32.6 24.3 . . 15.2 . . . -6.9 . . . Apr. -9.6 -21.9 . . -15.4 . . . 27.7 . . . May 66.9 11.5 . . 55.9 . . . -0.5 . . . June 47.1 5.3 . . 55.1 . . . -13.2 . . . July -17.5 22.5 . . -60.4 . . . 20.4 . . .
Growth rates
2006 16.3 12.1 17.5 10.6 22.9 25.9 21.2 15.2 1.5 21.5 -10.0 -11.22007 10.1 4.4 11.4 2.3 16.3 24.3 11.9 14.6 12.7 33.7 -0.2 6.6
2008 Q4 7.0 -3.2 13.0 -8.7 9.6 3.8 13.1 18.9 65.6 -3.5 135.5 144.62009 Q1 6.3 -5.6 3.8 -9.1 9.6 0.9 14.6 17.6 65.3 -5.9 133.9 135.0 Q2 5.3 -5.2 -0.6 -7.1 7.0 -1.4 11.9 - 58.7 -14.2 122.8 -
Source: ECB.

S 66ECB
Monthly Bulletin
October 2009
7.3 Financial account (EUR billions and annual growth rates; outstanding amounts and growth rates at end of period, transactions during period)
5. Other investment assets
Outstanding amounts (international investment position)
Total Eurosystem MFIs General Other sectors
(excluding Eurosystem) government
Total Loans/ Other Total Loans/ Other Trade Loans/currency Trade Loans/currencycurrency assets currency assets credits and deposits credits and deposits
and anddeposits deposits Currency Currency
and anddeposits deposits
1 2 3 4 5 6 7 8 9 10 11 12 13 14 15
2006 4,448.7 14.1 12.7 1.4 2,937.6 2,874.9 62.8 120.0 14.2 58.2 15.4 1,377.1 187.9 1,062.1 395.62007 5,233.5 39.1 37.7 1.4 3,342.5 3,271.4 71.1 107.1 12.7 48.1 13.5 1,744.8 191.1 1,387.7 441.7
2008 Q4 5,228.2 28.8 27.7 1.0 3,273.9 3,214.9 59.0 101.2 12.0 41.2 7.2 1,824.3 189.2 1,409.7 443.72009 Q1 5,044.7 21.7 21.4 0.3 3,093.8 3,037.2 56.6 106.7 12.0 45.4 14.5 1,822.5 176.9 1,416.2 446.2
Transactions
2007 910.9 22.0 22.0 0.0 548.3 541.0 7.3 -7.6 -1.4 -7.2 -2.0 348.3 13.7 292.7 38.72008 6.7 -9.0 -9.0 0.0 -44.7 -60.0 15.3 -6.6 -1.1 -6.7 -5.9 67.0 9.3 -1.2 -44.82008 Q4 -277.1 -6.9 -7.0 0.0 -240.9 -250.8 10.0 0.0 -0.3 1.0 -1.9 -29.3 -9.5 -19.0 -3.72009 Q1 -233.2 -8.2 -8.2 0.0 -222.1 -220.3 -1.8 6.5 0.0 5.8 9.1 -9.4 -8.6 -1.1 -1.7 Q2 -155.1 7.0 - - -81.8 - - -4.3 - - -5.3 -75.9 - - -23.5
2009 Mar. -89.6 -2.2 . . -90.0 . . 0.8 . . 0.8 1.9 . . 4.0 Apr. 28.0 1.6 . . 39.6 . . -9.9 . . -10.2 -3.4 . . -7.3 May -153.5 0.0 . . -64.6 . . 3.8 . . 3.7 -92.8 . . -21.2 June -29.5 5.3 . . -56.9 . . 1.8 . . 1.2 20.3 . . 4.9 July -46.9 -2.2 . . -37.2 . . -4.5 . . -4.4 -3.1 . . -7.5
Growth rates
2006 19.5 -37.6 -40.0 1.6 21.1 21.3 10.7 -5.5 -26.1 -4.3 24.5 20.0 3.4 24.5 8.52007 20.5 157.3 173.8 -1.7 18.8 18.9 11.5 -6.4 -9.7 -12.4 -13.1 25.2 7.4 27.3 9.8
2008 Q4 0.1 -26.4 -27.1 5.0 -1.3 -1.8 21.7 -6.2 -8.6 -14.1 -45.7 3.8 4.8 -0.1 -10.62009 Q1 -9.5 -57.3 -58.7 6.0 -13.6 -14.1 11.2 4.6 -6.4 9.0 35.9 -0.9 -2.9 -3.1 -14.2 Q2 -10.4 -28.7 - - -13.4 - - -5.5 - - -42.6 -4.6 - - -6.9
6. Other investment liabilities
Outstanding amounts (international investment position)
Total Eurosystem MFIs General Other sectors
(excluding Eurosystem) government
Total Loans/ Other Total Loans/ Other Total Trade Loans Other Total Trade Loans Othercurrency liabilities currency liabilities credits liabilities credits liabilities
and anddeposits deposits
1 2 3 4 5 6 7 8 9 10 11 12 13 14 15
2006 4,711.0 116.3 116.1 0.2 3,484.8 3,430.4 54.5 51.6 0.0 47.5 4.1 1,058.2 146.8 819.6 91.72007 5,483.9 201.7 201.4 0.2 3,938.7 3,871.7 67.0 51.8 0.0 46.6 5.2 1,291.7 158.4 1,024.1 109.3
2008 Q4 5,664.6 481.5 481.2 0.3 3,762.9 3,704.2 58.6 61.7 0.0 57.7 3.9 1,358.6 166.4 1,076.7 115.52009 Q1 5,503.3 404.0 400.9 3.2 3,708.6 3,650.0 58.6 58.6 0.0 55.2 3.4 1,332.1 161.0 1,057.1 114.0
Transactions
2007 956.9 91.4 91.4 0.0 635.2 630.4 4.8 -0.9 0.0 -1.8 0.9 231.3 9.9 224.4 -3.02008 171.4 280.0 280.0 0.1 -181.4 -192.3 10.9 9.5 0.0 10.9 -1.4 63.2 6.3 57.5 -0.52008 Q4 -260.1 110.6 110.7 -0.1 -411.7 -418.0 6.3 9.0 0.0 8.6 0.4 32.0 -3.9 29.0 6.82009 Q1 -246.2 -81.5 -84.4 2.9 -112.1 -110.8 -1.3 -2.1 0.0 -0.9 -1.2 -50.5 -8.8 -37.1 -4.7 Q2 -249.2 -89.3 - - -81.4 - - -3.0 - - - -75.4 - - -
2009 Mar. -100.0 5.6 . . -114.2 . . 1.1 . . . 7.5 . . . Apr. 31.1 -28.9 . . 37.8 . . -0.6 . . . 22.8 . . . May -197.9 -20.2 . . -66.7 . . 0.1 . . . -111.2 . . . June -82.3 -40.2 . . -52.5 . . -2.6 . . . 13.0 . . . July -66.3 -15.7 . . -30.8 . . -0.2 . . . -19.7 . . .
Growth rates
2006 18.4 22.4 22.4 5.7 16.1 16.1 13.3 3.6 -24.1 4.2 -3.2 27.3 9.8 31.9 17.62007 20.4 79.2 79.4 -6.9 18.3 18.5 8.8 -1.6 29.1 -3.6 18.0 21.4 6.7 27.4 -1.5
2008 Q4 3.2 140.9 141.1 20.8 -4.6 -4.9 16.1 18.3 -4.8 23.5 -28.3 4.9 4.0 5.6 -0.82009 Q1 -7.1 82.4 81.3 709.6 -13.6 -14.0 9.2 15.5 0.9 17.9 -19.4 -2.3 -3.5 -1.6 -7.5 Q2 -11.4 19.0 - - -15.0 - - 12.2 - - - -6.9 - - -
Source: ECB.
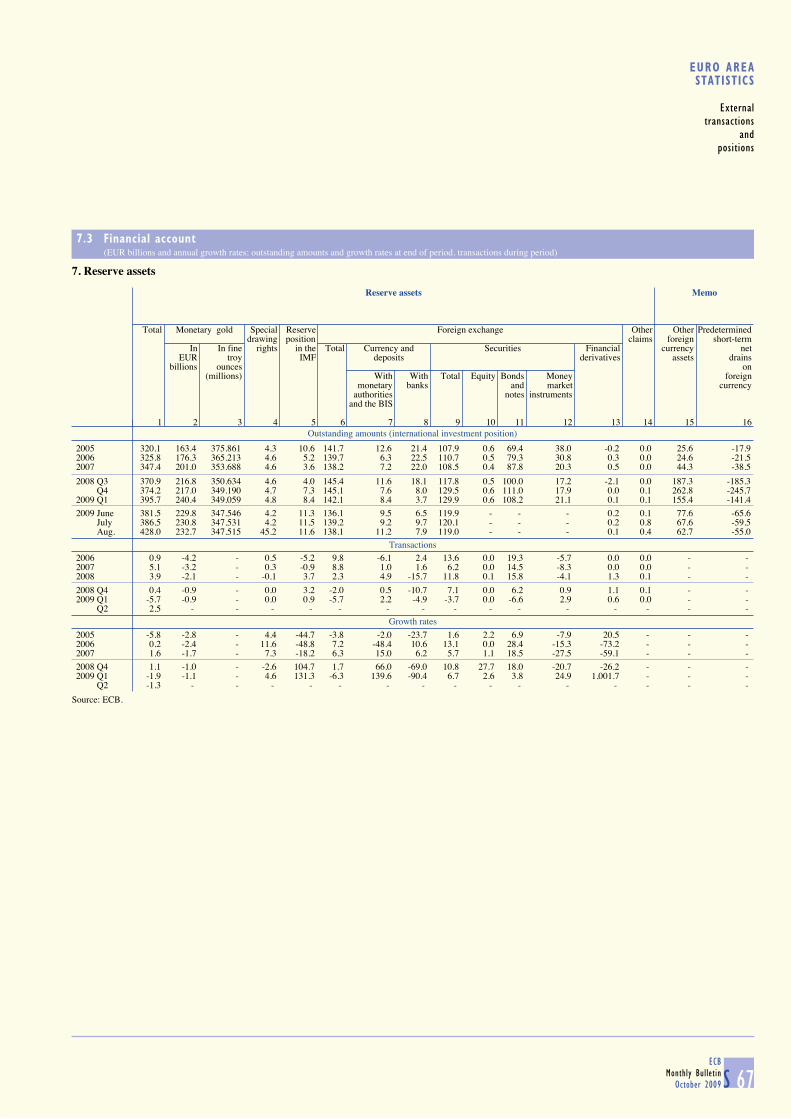
S 67ECB
Monthly Bulletin
October 2009
EURO AREASTATISTICS
External
transactions
and
positions
7.3 Financial account (EUR billions and annual growth rates; outstanding amounts and growth rates at end of period, transactions during period)
7. Reserve assets
Outstanding amounts (international investment position)
Reserve assets Memo
Total Monetary gold Special Reserve Foreign exchange Other Other Predetermined
drawing position claims foreign short-termIn In fine rights in the Total Currency and Securities Financial currency net
EUR troy IMF deposits derivatives assets drainsbillions ounces on
(millions) With With Total Equity Bonds Money foreignmonetary banks and market currency
authorities notes instrumentsand the BIS
1 2 3 4 5 6 7 8 9 10 11 12 13 14 15 16
2005 320.1 163.4 375.861 4.3 10.6 141.7 12.6 21.4 107.9 0.6 69.4 38.0 -0.2 0.0 25.6 -17.92006 325.8 176.3 365.213 4.6 5.2 139.7 6.3 22.5 110.7 0.5 79.3 30.8 0.3 0.0 24.6 -21.52007 347.4 201.0 353.688 4.6 3.6 138.2 7.2 22.0 108.5 0.4 87.8 20.3 0.5 0.0 44.3 -38.5
2008 Q3 370.9 216.8 350.634 4.6 4.0 145.4 11.6 18.1 117.8 0.5 100.0 17.2 -2.1 0.0 187.3 -185.3 Q4 374.2 217.0 349.190 4.7 7.3 145.1 7.6 8.0 129.5 0.6 111.0 17.9 0.0 0.1 262.8 -245.72009 Q1 395.7 240.4 349.059 4.8 8.4 142.1 8.4 3.7 129.9 0.6 108.2 21.1 0.1 0.1 155.4 -141.4
2009 June 381.5 229.8 347.546 4.2 11.3 136.1 9.5 6.5 119.9 - - - 0.2 0.1 77.6 -65.6 July 386.5 230.8 347.531 4.2 11.5 139.2 9.2 9.7 120.1 - - - 0.2 0.8 67.6 -59.5 Aug. 428.0 232.7 347.515 45.2 11.6 138.1 11.2 7.9 119.0 - - - 0.1 0.4 62.7 -55.0
Transactions
2006 0.9 -4.2 - 0.5 -5.2 9.8 -6.1 2.4 13.6 0.0 19.3 -5.7 0.0 0.0 - - 2007 5.1 -3.2 - 0.3 -0.9 8.8 1.0 1.6 6.2 0.0 14.5 -8.3 0.0 0.0 - - 2008 3.9 -2.1 - -0.1 3.7 2.3 4.9 -15.7 11.8 0.1 15.8 -4.1 1.3 0.1 - -
2008 Q4 0.4 -0.9 - 0.0 3.2 -2.0 0.5 -10.7 7.1 0.0 6.2 0.9 1.1 0.1 - - 2009 Q1 -5.7 -0.9 - 0.0 0.9 -5.7 2.2 -4.9 -3.7 0.0 -6.6 2.9 0.6 0.0 - - Q2 2.5 - - - - - - - - - - - - - - -
Growth rates
2005 -5.8 -2.8 - 4.4 -44.7 -3.8 -2.0 -23.7 1.6 2.2 6.9 -7.9 20.5 - - - 2006 0.2 -2.4 - 11.6 -48.8 7.2 -48.4 10.6 13.1 0.0 28.4 -15.3 -73.2 - - - 2007 1.6 -1.7 - 7.3 -18.2 6.3 15.0 6.2 5.7 1.1 18.5 -27.5 -59.1 - - -
2008 Q4 1.1 -1.0 - -2.6 104.7 1.7 66.0 -69.0 10.8 27.7 18.0 -20.7 -26.2 - - - 2009 Q1 -1.9 -1.1 - 4.6 131.3 -6.3 139.6 -90.4 6.7 2.6 3.8 24.9 1,001.7 - - - Q2 -1.3 - - - - - - - - - - - - - - -
Source: ECB.

S 68ECB
Monthly Bulletin
October 2009
7.3 Financial account (EUR billions; outstanding amounts at end of period, transactions during period)
8. Geographical breakdown
Total European Union 27 (outside the euro area) Canada China Japan Switzer- United Offshore Internat. Otherland States financial organisa- countries
Total Denmark Sweden United Other EU EU centres tionsKingdom countries institutions
1 2 3 4 5 6 7 8 9 10 11 12 13 14 15
2007 Outstanding amounts (international investment position)
Direct investment 434.6 -97.4 -4.0 -32.9 -277.8 217.6 -0.3 23.7 27.0 -11.0 112.6 -67.4 -37.4 -0.2 484.6 Abroad 3,526.1 1,285.8 37.1 82.5 916.2 249.9 0.0 91.6 30.7 69.1 350.1 684.4 391.6 0.0 622.8
Equity/reinvested earnings 2,844.3 1,012.7 32.3 55.2 710.0 215.2 0.0 67.8 24.1 57.8 292.5 525.9 366.1 0.0 497.4 Other capital 681.9 273.1 4.9 27.3 206.2 34.7 0.0 23.8 6.6 11.4 57.6 158.6 25.5 0.0 125.3
In the euro area 3,091.6 1,383.2 41.2 115.4 1,194.0 32.3 0.3 67.9 3.7 80.1 237.4 751.9 429.0 0.3 138.2 Equity/reinvested earnings 2,343.9 1,127.8 33.6 93.7 988.2 12.1 0.2 56.6 0.9 65.7 181.6 552.6 267.8 0.1 90.8 Other capital 747.7 255.4 7.6 21.7 205.8 20.2 0.1 11.3 2.7 14.4 55.9 199.3 161.2 0.2 47.4
Portfolio investment assets 4,653.8 1,371.3 68.2 139.3 995.5 97.8 70.6 82.5 42.0 241.9 132.4 1,493.5 630.2 26.8 633.3 Equity 1,984.7 415.3 11.4 45.9 335.4 22.1 0.5 20.3 39.5 141.7 115.7 635.1 285.3 1.0 331.0 Debt instruments 2,669.2 956.0 56.8 93.4 660.1 75.6 70.1 62.3 2.5 100.2 16.6 858.4 344.9 25.9 302.4
Bonds and notes 2,231.5 781.0 52.7 78.2 505.6 75.0 69.4 58.6 2.2 63.5 12.9 713.3 303.1 24.8 272.0 Money market instruments 437.7 174.9 4.0 15.1 154.5 0.6 0.7 3.6 0.3 36.7 3.8 145.1 41.8 1.1 30.4
Other investment -250.4 -163.9 -155.4 -8.8 122.2 43.5 -165.5 -66.0 -45.3 -31.5 -54.9 -71.1 -91.2 -23.8 297.4 Assets 5,233.5 2,571.9 104.5 72.3 2,242.6 141.7 10.8 23.5 35.0 81.3 266.2 840.1 516.8 57.5 841.1
General government 107.1 21.6 0.8 0.1 10.3 1.2 9.2 0.0 1.8 0.2 0.1 3.1 1.4 38.3 40.7 MFIs 3,381.6 1,916.2 86.7 52.1 1,663.5 113.0 0.8 15.0 15.3 45.0 157.5 411.6 353.5 18.7 448.8 Other sectors 1,744.8 634.1 16.9 20.1 568.8 27.5 0.9 8.5 17.9 36.1 108.6 425.4 162.0 0.5 351.6
Liabilities 5,483.9 2,735.8 259.8 81.0 2,120.5 98.1 176.4 89.5 80.3 112.8 321.1 911.2 608.1 81.3 543.7 General government 51.8 28.9 0.0 0.3 2.4 0.0 26.2 0.0 0.0 0.5 0.8 6.3 0.3 11.9 3.0 MFIs 4,140.4 2,142.4 249.6 58.4 1,660.0 72.6 101.9 81.5 62.2 89.0 247.6 525.1 523.7 66.8 402.1 Other sectors 1,291.7 564.5 10.2 22.4 458.0 25.6 48.3 8.0 18.1 23.3 72.7 379.8 84.1 2.6 138.7
2008 Q2 to 2009 Q1 Cumulated transactions
Direct investment 205.6 86.5 -0.4 7.1 54.4 25.4 0.0 -7.4 3.1 -1.2 -34.7 91.9 18.2 0.0 49.4 Abroad 260.6 82.1 1.7 19.3 40.2 20.9 0.0 2.3 3.3 3.8 -20.2 98.1 35.5 0.0 55.7
Equity/reinvested earnings 146.2 33.7 0.9 7.9 11.7 13.1 0.0 4.4 4.1 3.5 -18.5 63.7 18.0 0.0 37.3 Other capital 114.4 48.4 0.8 11.4 28.4 7.8 0.0 -2.1 -0.7 0.3 -1.7 34.3 17.5 0.0 18.5
In the euro area 55.0 -4.5 2.1 12.2 -14.3 -4.5 0.0 9.7 0.3 5.0 14.6 6.2 17.3 0.0 6.3 Equity/reinvested earnings 69.1 -8.6 0.1 6.8 -17.5 2.0 0.0 7.8 0.2 2.8 7.7 23.2 22.8 0.0 13.1 Other capital -14.1 4.1 2.0 5.4 3.2 -6.5 0.0 1.9 0.0 2.2 6.9 -17.0 -5.5 0.0 -6.8
Portfolio investment assets -159.3 30.2 7.2 -3.1 24.4 -2.8 4.6 13.0 -1.3 -16.0 -0.4 -86.9 -77.4 2.7 -23.4 Equity -103.2 -16.6 0.9 -4.1 -12.8 -0.5 0.1 9.0 -1.1 -13.8 2.3 -37.4 -28.6 0.0 -17.0 Debt instruments -56.1 46.8 6.3 1.0 37.2 -2.3 4.5 4.0 -0.2 -2.2 -2.6 -49.5 -48.8 2.7 -6.4
Bonds and notes -5.8 61.8 3.4 4.2 54.5 -3.5 3.3 3.6 -0.1 -13.1 0.4 -20.2 -53.1 3.1 11.8 Money market instruments -50.2 -15.0 3.0 -3.2 -17.3 1.2 1.3 0.5 -0.1 10.9 -3.1 -29.3 4.3 -0.3 -18.2
Other investment -101.6 -240.2 -12.6 -5.8 -265.0 59.3 -16.1 -5.1 -9.3 44.5 19.7 -123.2 118.6 12.2 81.0 Assets -521.8 -325.7 -23.6 -13.6 -341.1 52.7 -0.1 1.4 -9.3 -17.5 -51.7 -134.5 8.1 -9.4 16.8
General government 4.7 4.5 -1.3 -0.2 6.1 -0.5 0.4 0.0 0.0 0.0 0.0 0.1 0.0 1.2 -1.2 MFIs -510.4 -294.6 -18.5 -11.4 -313.6 49.2 -0.4 0.2 -10.6 -8.0 -48.9 -94.9 -16.0 -10.5 -27.0 Other sectors -16.1 -35.6 -3.8 -2.0 -33.6 3.9 -0.2 1.2 1.3 -9.5 -2.8 -39.7 24.1 0.0 45.0
Liabilities -420.1 -85.5 -11.0 -7.7 -76.1 -6.6 16.0 6.5 -0.1 -62.0 -71.4 -11.4 -110.5 -21.6 -64.1 General government 7.9 2.8 0.0 -0.1 1.5 0.0 1.4 0.0 0.0 -0.1 0.0 0.1 0.1 5.0 0.1 MFIs -397.1 -88.4 -11.1 -6.8 -73.8 -4.4 7.6 5.2 0.1 -59.7 -69.2 45.9 -121.4 -26.4 -83.2 Other sectors -30.9 0.1 0.1 -0.9 -3.8 -2.3 7.0 1.3 -0.2 -2.2 -2.2 -57.3 10.8 -0.2 19.0
Source: ECB.

S 69ECB
Monthly Bulletin
October 2009
EURO AREASTATISTICS
External
transactions
and
positions
7.4 Monetary presentation of the balance of payments 1) (EUR billions; transactions)
B.o.p. items balancing transactions in the external counterpart of M3 Memo:
TransactionsCurrent and Direct investment Portfolio investment Other investment Financial Errors Total in the
capital derivatives and of externalaccounts By By non- Assets Liabilities Assets Liabilities omissions columns counterpartbalance resident resident 1 to 10 of M3
units unitsabroad in the Non-MFIs Equity 2) Debt Non-MFIs Non-MFIs
(non-MFIs) euro area instruments 3)
1 2 3 4 5 6 7 8 9 10 11 122006 7.9 -390.3 264.2 -282.3 237.5 468.9 -225.0 225.8 3.6 -138.5 171.9 204.92007 32.4 -451.4 379.2 -182.4 81.9 389.5 -340.9 230.4 -67.3 -64.8 6.6 -16.62008 -81.9 -334.8 103.6 35.2 -124.0 538.7 -61.2 73.3 -56.6 -213.8 -121.6 -158.82008 Q2 -25.8 -39.2 -9.4 -85.4 -33.9 151.7 0.7 -14.2 -8.8 -52.8 -117.2 -147.7 Q3 -19.5 -97.0 52.1 22.8 -69.6 170.0 -21.8 2.9 -8.5 -41.6 -10.2 3.0 Q4 -26.8 -42.3 -30.7 117.9 -39.4 143.4 28.8 41.3 -16.5 -95.6 80.2 75.92009 Q1 -40.8 -69.3 40.6 37.2 -7.8 123.5 2.9 -52.6 14.3 -107.0 -59.1 -75.9 Q2 -18.0 -78.1 78.9 -24.4 -7.4 129.5 80.2 -78.4 28.2 1.3 111.7 100.9
2008 July -2.5 -38.0 22.9 7.1 -8.2 30.2 -1.7 14.1 -0.1 -44.4 -20.5 -9.3 Aug. -10.6 -21.5 11.1 -2.2 -17.0 33.3 4.8 -9.1 -8.4 9.5 -10.1 -8.3 Sep. -6.4 -37.4 18.1 17.9 -44.5 106.6 -25.0 -2.2 0.0 -6.8 20.4 20.6 Oct. -7.6 -8.0 -2.0 75.6 -58.0 92.0 -17.3 41.2 -3.2 -67.4 45.2 55.8 Nov. -14.2 -28.3 -21.0 12.9 3.0 60.7 3.0 19.2 -9.6 0.8 26.4 10.9 Dec. -4.9 -6.0 -7.7 29.4 15.7 -9.3 43.1 -19.0 -3.7 -29.0 8.6 9.22009 Jan. -28.3 -19.2 15.3 -13.9 -50.4 54.8 -6.7 -44.1 7.2 -17.2 -102.4 -111.0 Feb. -6.5 -19.4 12.4 32.8 -0.2 57.5 12.3 -17.1 2.9 -28.0 46.7 45.9 Mar. -6.1 -30.7 13.0 18.4 42.7 11.1 -2.7 8.6 4.2 -61.9 -3.4 -10.8 Apr. -7.4 -51.0 54.6 -5.5 -29.1 27.6 13.3 22.2 7.7 9.9 42.4 34.7 May -11.6 -13.5 19.0 -15.5 20.0 52.7 89.0 -111.1 10.4 -15.0 24.4 31.7 June 1.0 -13.7 5.3 -3.4 1.7 49.2 -22.0 10.4 10.1 6.4 44.9 34.5 July 9.4 -5.3 16.1 -14.9 22.3 -36.3 7.6 -19.8 6.4 24.7 10.1 13.3
12-month cumulated transactions 2009 July -93.2 -254.1 134.1 131.4 -93.8 500.0 99.3 -120.8 24.0 -173.9 153.2 126.5
C35 Main b.o.p. transactions underlying the developments in MFI net external assets 1) (EUR billions; 12-month cumulated transactions)
-800
-600
-400
-200
0
200
400
600
800
2000 2001 2002 2003 2004 2005 2006 2007 2008-800
-600
-400
-200
0
200
400
600
800
MFI net external assetscurrent and capital accounts balancedirect and portfolio equity investment abroad by non-MFIsportfolio investment liabilities in the form of debt instruments
Source: ECB.1) Data refer to the changing composition of the euro area. For further information, see the General notes.2) Excluding money market fund shares/units.3) Excluding debt securities with a maturity of up to two years issued by euro area MFIs.
3)

S 70ECB
Monthly Bulletin
October 2009
7.5 Trade in goods
1. Values and volumes by product group 1) (seasonally adjusted, unless otherwise indicated)
Values (EUR billions; annual percentage changes for columns 1 and 2)
Total (n.s.a.) Exports (f.o.b.) Imports (c.i.f.)
Total Memo: Total Memo:
Exports Imports Intermediate Capital Consumption Manufactures Intermediate Capital Consumption Manufactures Oil
1 2 3 4 5 6 7 8 9 10 11 12 13
2007 11.0 8.4 1,508.0 738.7 326.4 401.3 1,282.6 1,491.8 914.3 234.4 323.2 1,019.9 227.52008 3.8 7.9 1,563.2 764.7 334.9 410.9 1,304.1 1,600.0 1,012.8 230.5 331.3 1,018.6 288.6
2008 Q3 5.7 13.0 398.7 197.0 84.3 103.0 329.2 413.4 269.1 58.8 83.6 257.4 85.5 Q4 -4.9 -2.0 366.9 174.0 81.4 95.5 303.9 375.1 229.1 56.0 81.7 241.3 55.22009 Q1 -21.3 -20.8 311.0 146.9 65.4 86.3 258.7 320.6 181.2 49.4 78.7 213.3 35.6 Q2 -23.7 -26.7 308.8 149.5 63.6 84.6 254.3 304.6 169.7 47.3 75.8 201.1 41.3
2009 Feb. -23.4 -21.6 103.4 48.9 22.3 28.6 85.5 105.8 59.4 16.5 26.2 69.9 11.2 Mar. -15.3 -18.2 104.7 50.3 22.0 28.8 88.1 106.2 59.4 16.8 26.2 71.2 12.6 Apr. -26.4 -27.2 103.7 50.6 21.3 28.4 86.5 103.3 57.4 16.2 25.5 68.2 13.0 May -23.0 -27.1 102.0 49.0 21.2 27.9 84.6 100.6 55.7 15.6 25.0 67.1 13.7 June -21.5 -25.9 103.0 49.9 21.1 28.3 83.2 100.7 56.6 15.5 25.3 65.8 14.7 July -19.3 -29.8 107.2 . . . . 100.4 . . . . .
Volume indices (2000 = 100; annual percentage changes for columns 1 and 2)
2007 8.6 6.8 144.5 141.3 153.1 144.6 142.1 129.1 123.2 143.3 141.5 134.8 107.72008 1.5 -0.1 146.3 140.8 156.6 146.5 143.0 128.3 121.4 142.2 142.3 133.1 106.6
2008 Q3 2.6 1.4 147.9 142.7 158.0 146.0 144.0 127.1 120.3 147.2 143.2 134.0 106.6 Q4 -7.5 -5.2 136.4 127.0 150.0 136.2 131.1 122.3 114.6 134.1 136.6 122.3 106.72009 Q1 -21.2 -14.9 117.6 110.7 119.8 124.4 111.9 113.2 104.3 117.4 130.9 109.5 99.3 Q2 -22.6 -19.1 118.0 114.5 117.6 122.1 111.7 108.3 97.4 113.3 129.7 105.7 97.2
2009 Feb. -23.6 -15.6 116.5 110.0 122.7 121.7 110.4 112.4 103.1 118.2 130.4 107.9 94.4 Mar. -15.2 -11.8 119.2 114.5 120.8 124.6 114.6 112.2 102.4 118.5 130.8 109.5 101.3 Apr. -25.6 -20.6 119.1 115.8 118.7 124.1 114.0 110.9 99.8 116.2 131.7 107.3 99.8 May -22.2 -19.7 117.3 112.9 117.5 120.5 111.5 107.6 96.5 112.0 127.7 105.6 98.1 June -20.0 -16.9 117.6 114.8 116.5 121.8 109.5 106.5 96.0 111.7 129.7 104.2 93.7 July . . . . . . . . . . . . .
2. Prices 2) (annual percentage changes, unless otherwise indicated)
Industrial producer export prices (f.o.b.) 3) Industrial import prices (c.i.f.)
Total Total Memo: Total Total Memo:
(index Manufac- (index Manufac-2005 = 100) Intermediate Capital Consumer Energy turing 2005 = 100) Intermediate Capital Consumer Energy turing
goods goods goods goods goods goods
% of total 100.0 100.0 32.2 46.3 17.7 3.8 99.4 100.0 100.0 28.4 27.9 22.1 21.6 81.1
1 2 3 4 5 6 7 8 9 10 11 12 13 142007 101.8 0.4 2.7 -0.5 0.9 1.8 0.4 105.9 0.1 2.3 -3.5 0.5 1.6 -0.32008 103.5 1.6 1.5 -0.4 2.4 25.2 1.5 112.7 6.5 0.2 -3.4 2.4 28.2 0.8
2008 Q4 102.7 0.7 2.6 1.3 2.7 -16.0 0.6 106.9 -1.7 0.9 -1.5 3.8 -8.5 0.12009 Q1 101.2 -1.3 -1.1 1.3 1.4 -32.3 -1.4 101.4 -8.4 -4.1 -0.3 2.7 -28.0 -2.4 Q2 100.9 -2.8 -3.9 1.5 0.9 -36.4 -2.7 101.4 -12.4 -6.5 0.1 1.4 -35.3 -4.2
2009 Mar. 100.9 -1.8 -2.0 1.5 1.3 -35.1 -1.8 101.1 -9.2 -5.0 0.3 2.7 -29.8 -2.8 Apr. 100.8 -2.1 -2.9 1.8 1.1 -36.0 -2.1 100.5 -10.7 -5.5 0.5 2.3 -33.7 -3.2 May 100.8 -3.0 -3.9 1.4 0.9 -37.8 -2.9 101.1 -13.1 -6.8 0.1 1.3 -37.2 -4.5 June 101.1 -3.3 -4.9 1.4 0.8 -35.4 -3.2 102.7 -13.2 -7.3 -0.2 0.6 -35.0 -5.0 July 100.7 -4.0 -5.8 1.3 0.5 -39.1 -3.8 101.5 -15.0 -8.1 -0.5 0.7 -39.2 -5.4 Aug. 101.1 -3.6 -6.2 0.8 0.8 -30.5 -3.5 103.1 -12.4 -7.7 -1.1 -0.4 -32.5 -4.9
Source: Eurostat.1) Product groups according to the classification by Broad Economic Categories. Unlike the product groups shown in Table 2, intermediate and consumption product groups include
agricultural and energy products.2) Product groups according to the classification of Main Industrial Groupings. Unlike the product groups shown in Table 1, intermediate and consumer goods do not include
energy products, and agricultural goods are not covered. Manufacturing has a different composition compared with the data shown in columns 7 and 12 of Table 1. Data shownare price indices which follow the pure price change for a basket of products and are not simple ratios of the value and volume data shown in Table 1, which are affectedby changes in the composition and quality of traded goods. These indices differ from the GDP deflators for imports and exports (shown in Table 3 in Section 5.1) mainlybecause the latter include all goods and services and cover cross-border trade within the euro area.
3) Industrial producer export prices refer to direct transactions between domestic producers and non-domestic customers. Contrary to the data shown for values and volumes in Table 1, exports from wholesalers and re-exports are not covered.

S 71ECB
Monthly Bulletin
October 2009
EURO AREASTATISTICS
External
transactions
and
positions
7.5 Trade in goods (EUR billions, unless otherwise indicated; seasonally adjusted)
3. Geographical breakdown
Exports (f.o.b.)
Total European Union 27 (outside the euro area) Russia Switzer- Turkey United Asia Africa Latin Other
land States America countriesDenmark Sweden United Other EU China Japan
Kingdom countries
1 2 3 4 5 6 7 8 9 10 11 12 13 14 15
2007 1,508.0 34.1 55.7 230.9 216.3 67.9 82.3 41.5 195.9 295.9 60.6 34.3 87.6 61.9 138.12008 1,563.2 35.1 54.2 221.7 231.4 78.5 86.5 42.9 187.1 308.0 65.7 33.7 100.4 68.3 149.2
2008 Q1 398.6 8.9 14.0 57.3 58.8 19.7 21.4 12.4 49.7 79.1 17.2 8.9 24.0 16.2 37.1 Q2 399.0 9.1 14.5 58.2 60.0 20.3 22.2 11.4 47.4 77.9 16.8 8.6 24.9 16.7 36.4 Q3 398.7 9.1 14.1 56.5 60.4 20.8 21.8 10.8 46.4 76.6 16.0 8.2 26.7 17.9 37.9 Q4 366.9 8.0 11.6 49.7 52.2 17.7 21.2 8.4 43.6 74.4 15.7 8.1 24.8 17.5 37.82009 Q1 311.0 7.3 10.0 42.3 43.6 12.6 20.0 7.7 39.7 65.0 15.4 7.1 23.4 12.8 26.6 Q2 308.8 6.4 9.6 42.3 42.0 12.2 19.2 8.3 37.5 70.4 16.7 7.0 22.7 12.2 26.0
2009 Feb. 103.4 2.3 3.3 13.9 14.1 4.3 6.7 2.5 12.9 22.1 5.2 2.4 7.9 4.3 8.9 Mar. 104.7 2.4 3.4 14.2 14.7 4.2 6.5 2.7 13.8 22.6 5.6 2.2 7.8 4.2 8.3 Apr. 103.7 2.3 3.2 14.2 14.3 4.2 6.4 2.7 12.6 23.2 5.6 2.4 7.6 4.2 8.8 May 102.0 2.2 3.1 13.8 13.9 3.8 6.3 2.8 12.5 23.3 5.6 2.2 7.5 4.1 8.7 June 103.0 2.0 3.3 14.3 13.8 4.2 6.5 2.8 12.4 23.9 5.5 2.4 7.6 3.9 8.4 July 107.2 . . . . 4.2 6.5 3.0 12.6 24.6 5.7 2.6 7.7 5.1 .
% share of total exports 2008 100.0 2.2 3.5 14.2 14.8 5.0 5.5 2.7 12.0 19.7 4.2 2.2 6.4 4.4 9.6
Imports (c.i.f.)
2007 1,491.8 28.8 52.2 169.6 169.6 102.2 67.2 32.4 131.7 455.6 172.7 59.1 113.4 75.2 94.02008 1,600.0 30.3 52.4 165.6 185.7 119.1 69.6 32.3 137.4 478.2 184.1 57.0 139.7 81.7 107.8
2008 Q1 403.5 7.3 13.7 43.8 46.4 30.0 16.8 8.6 34.6 121.3 44.6 14.8 34.7 20.3 25.9 Q2 407.9 7.8 13.6 42.6 47.6 30.9 17.5 8.5 33.7 120.1 45.0 14.6 36.9 20.3 28.2 Q3 413.4 8.0 13.4 42.2 48.0 33.7 17.9 8.1 35.4 123.4 47.9 14.1 37.5 21.3 24.6 Q4 375.1 7.2 11.6 37.0 43.7 24.6 17.4 7.1 33.7 113.4 46.5 13.5 30.6 19.8 29.12009 Q1 320.6 6.8 9.3 31.7 39.1 17.7 16.7 6.6 33.1 98.8 42.1 11.4 23.9 14.9 21.9 Q2 304.6 6.2 8.8 29.9 38.2 18.1 16.1 6.3 28.3 92.5 39.7 10.2 23.0 14.3 23.1
2009 Feb. 105.8 2.2 3.1 10.5 12.8 5.3 5.6 2.2 11.0 32.1 13.7 3.6 8.2 4.9 7.8 Mar. 106.2 2.3 3.1 10.4 13.5 6.1 5.5 2.3 11.8 32.6 13.8 3.6 7.5 5.1 6.0 Apr. 103.3 2.1 2.9 10.0 12.9 5.8 5.5 2.0 9.4 31.6 13.8 3.4 7.9 4.8 8.3 May 100.6 2.1 2.9 10.0 12.7 5.9 5.3 2.1 9.8 30.5 13.0 3.4 7.3 4.7 7.3 June 100.7 2.0 3.0 9.9 12.6 6.4 5.2 2.1 9.1 30.3 12.9 3.4 7.8 4.8 7.5 July 100.4 . . . . 6.7 5.3 2.2 9.0 29.9 12.5 3.3 7.5 4.9 .
% share of total imports 2008 100.0 1.9 3.3 10.3 11.6 7.4 4.4 2.0 8.6 29.9 11.5 3.6 8.7 5.1 6.8
Balance
2007 16.2 5.4 3.5 61.3 46.8 -34.3 15.1 9.0 64.2 -159.8 -112.1 -24.8 -25.8 -13.3 44.12008 -36.7 4.7 1.8 56.0 45.7 -40.6 16.9 10.6 49.7 -170.1 -118.4 -23.2 -39.3 -13.4 41.4
2008 Q1 -4.9 1.5 0.3 13.5 12.3 -10.2 4.6 3.8 15.0 -42.2 -27.5 -5.9 -10.7 -4.1 11.3 Q2 -8.9 1.3 0.8 15.5 12.4 -10.6 4.6 2.8 13.7 -42.2 -28.2 -6.0 -12.1 -3.6 8.2 Q3 -14.7 1.1 0.7 14.2 12.4 -12.9 3.9 2.6 11.0 -46.8 -31.9 -5.9 -10.8 -3.3 13.2 Q4 -8.2 0.8 0.0 12.7 8.6 -6.9 3.7 1.3 10.0 -39.0 -30.8 -5.4 -5.8 -2.3 8.72009 Q1 -9.6 0.5 0.6 10.6 4.5 -5.1 3.3 1.1 6.6 -33.8 -26.7 -4.4 -0.5 -2.2 4.8 Q2 4.2 0.2 0.8 12.4 3.8 -5.9 3.2 2.1 9.2 -22.1 -23.0 -3.2 -0.4 -2.1 2.9
2009 Feb. -2.4 0.0 0.2 3.5 1.4 -1.0 1.1 0.3 1.9 -10.1 -8.5 -1.1 -0.4 -0.6 1.1 Mar. -1.5 0.1 0.3 3.8 1.2 -1.9 1.0 0.4 2.0 -10.0 -8.2 -1.3 0.2 -0.8 2.3 Apr. 0.4 0.2 0.3 4.2 1.4 -1.6 0.9 0.7 3.3 -8.4 -8.2 -1.1 -0.3 -0.6 0.5 May 1.5 0.1 0.2 3.7 1.2 -2.0 1.0 0.7 2.7 -7.2 -7.4 -1.1 0.2 -0.5 1.5 June 2.3 0.0 0.3 4.5 1.2 -2.2 1.2 0.6 3.3 -6.4 -7.4 -1.0 -0.3 -0.9 1.0 July 6.8 . . . . -2.5 1.3 0.9 3.6 -5.3 -6.8 -0.7 0.2 0.2 .
Source: Eurostat.

S 72ECB
Monthly Bulletin
October 2009
8 EXCHANGE RATES
8.1 Effective exchange rates 1) (period averages; index 1999 Q1=100)
EER-21 EER-41
Nominal Real Real Real Real Real Nominal RealCPI PPI GDP ULCM ULCT CPI
deflator
1 2 3 4 5 6 7 82006 103.7 105.0 103.3 102.4 105.2 100.7 110.1 103.82007 107.9 109.0 107.2 105.8 109.7 103.8 114.3 107.22008 113.0 113.6 110.3 110.4 116.8 109.2 120.0 111.1
2008 Q3 114.1 114.4 110.6 111.5 118.3 110.0 120.8 111.6 Q4 109.1 109.6 105.8 106.7 115.4 105.7 116.7 107.72009 Q1 111.9 112.2 107.2 109.3 121.5 109.3 120.1 110.4 Q2 113.2 113.4 107.8 110.4 127.6 110.1 121.1 111.2 Q3 114.3 114.3 108.8 . . . 122.4 112.1
2008 Sep. 112.0 112.1 108.4 - - - 118.7 109.4 Oct. 107.9 108.2 104.7 - - - 115.4 106.4 Nov. 107.1 107.5 103.8 - - - 114.5 105.6 Dec. 112.4 112.9 108.7 - - - 120.3 111.02009 Jan. 111.9 112.3 107.5 - - - 119.9 110.4 Feb. 110.4 110.7 105.7 - - - 118.6 109.1 Mar. 113.3 113.4 108.1 - - - 121.6 111.7 Apr. 112.5 112.8 107.2 - - - 120.5 110.6 May 113.0 113.2 107.7 - - - 120.9 110.9 June 114.0 114.3 108.5 - - - 122.0 112.0 July 113.8 113.8 108.2 - - - 121.9 111.6 Aug. 113.9 113.9 108.4 - - - 122.0 111.7 Sep. 115.2 115.3 109.8 - - - 123.5 113.0
% change versus previous month 2009 Sep. 1.2 1.2 1.3 - - - 1.2 1.1
% change versus previous year 2009 Sep. 2.9 2.8 1.2 - - - 4.1 3.3
C36 Effective exchange rates(monthly averages; index 1999 Q1=100)
C37 Bilateral exchange rates(monthly averages; index 1999 Q1=100)
70
80
90
100
110
120
130
140
150
1999 2000 2001 2002 2003 2004 2005 2006 2007 2008 200970
80
90
100
110
120
130
140
150
nominal EER-21real CPI-deflated EER-21
70
80
90
100
110
120
130
140
150
1999 2000 2001 2002 2003 2004 2005 2006 2007 2008 200970
80
90
100
110
120
130
140
150
USD/EURJPY/EURGBP/EUR
Source: ECB.1) For the definition of the trading partner groups and other information, please refer to the General notes.

S 73ECB
Monthly Bulletin
October 2009
EURO AREASTATISTICS
Exchange
rates
8.2 Bilateral exchange rates (period averages; units of national currency per euro)
Danish Swedish Pound US Japanese Swiss South Korean Hong Kong Singapore Canadian Norwegian Australiankrone krona sterling dollar yen franc won dollar dollar dollar krone dollar
1 2 3 4 5 6 7 8 9 10 11 122006 7.4591 9.2544 0.68173 1.2556 146.02 1.5729 1,198.58 9.7545 1.9941 1.4237 8.0472 1.66682007 7.4506 9.2501 0.68434 1.3705 161.25 1.6427 1,272.99 10.6912 2.0636 1.4678 8.0165 1.63482008 7.4560 9.6152 0.79628 1.4708 152.45 1.5874 1,606.09 11.4541 2.0762 1.5594 8.2237 1.7416
2009 Q1 7.4514 10.9410 0.90878 1.3029 122.04 1.4977 1,847.59 10.1016 1.9709 1.6223 8.9472 1.9648 Q2 7.4471 10.7806 0.87883 1.3632 132.59 1.5138 1,747.10 10.5657 2.0050 1.5883 8.8431 1.7917 Q3 7.4442 10.4241 0.87161 1.4303 133.82 1.5195 1,772.14 11.0854 2.0570 1.5704 8.7397 1.7169
2009 Mar. 7.4509 11.1767 0.91966 1.3050 127.65 1.5083 1,894.48 10.1138 1.9949 1.6470 8.8388 1.9594 Apr. 7.4491 10.8796 0.89756 1.3190 130.25 1.5147 1,760.14 10.2229 1.9823 1.6188 8.7867 1.8504 May 7.4468 10.5820 0.88445 1.3650 131.85 1.5118 1,710.18 10.5807 1.9939 1.5712 8.7943 1.7831 June 7.4457 10.8713 0.85670 1.4016 135.39 1.5148 1,768.80 10.8638 2.0357 1.5761 8.9388 1.7463 July 7.4458 10.8262 0.86092 1.4088 133.09 1.5202 1,778.43 10.9182 2.0421 1.5824 8.9494 1.7504 Aug. 7.4440 10.2210 0.86265 1.4268 135.31 1.5236 1,768.99 11.0587 2.0577 1.5522 8.6602 1.7081 Sep. 7.4428 10.1976 0.89135 1.4562 133.14 1.5148 1,768.58 11.2858 2.0720 1.5752 8.5964 1.6903
% change versus previous month 2009 Sep. 0.0 -0.2 3.3 2.1 -1.6 -0.6 0.0 2.1 0.7 1.5 -0.7 -1.0
% change versus previous year 2009 Sep. -0.2 6.6 11.5 1.3 -13.1 -5.0 8.5 0.9 0.8 3.6 5.4 -3.6
Czech Estonian Latvian Lithuanian Hungarian Polish Bulgarian New Roma- Croatian New Turkishkoruna kroon lats litas forint zloty lev nian leu kuna lira
13 14 15 16 17 18 19 20 21 222006 28.342 15.6466 0.6962 3.4528 264.26 3.8959 1.9558 3.5258 7.3247 1.80902007 27.766 15.6466 0.7001 3.4528 251.35 3.7837 1.9558 3.3353 7.3376 1.78652008 24.946 15.6466 0.7027 3.4528 251.51 3.5121 1.9558 3.6826 7.2239 1.9064
2009 Q1 27.601 15.6466 0.7061 3.4528 294.19 4.4988 1.9558 4.2682 7.4116 2.1635 Q2 26.679 15.6466 0.7065 3.4528 285.71 4.4523 1.9558 4.1963 7.3528 2.1410 Q3 25.597 15.6466 0.7019 3.4528 271.35 4.1978 1.9558 4.2263 7.3232 2.1444
2009 Mar. 27.231 15.6466 0.7083 3.4528 304.14 4.6210 1.9558 4.2828 7.4430 2.2340 Apr. 26.774 15.6466 0.7093 3.4528 295.26 4.4326 1.9558 4.2041 7.4172 2.1277 May 26.731 15.6466 0.7092 3.4528 281.93 4.4103 1.9558 4.1700 7.3515 2.1251 June 26.545 15.6466 0.7015 3.4528 280.46 4.5084 1.9558 4.2131 7.2954 2.1675 July 25.793 15.6466 0.7006 3.4528 272.06 4.2965 1.9558 4.2184 7.3307 2.1378 Aug. 25.646 15.6466 0.7013 3.4528 270.05 4.1311 1.9558 4.2183 7.3287 2.1236 Sep. 25.346 15.6466 0.7039 3.4528 271.84 4.1584 1.9558 4.2420 7.3102 2.1711
% change versus previous month 2009 Sep. -1.2 0.0 0.4 0.0 0.7 0.7 0.0 0.6 -0.3 2.2
% change versus previous year 2009 Sep. 3.5 0.0 -0.3 0.0 12.9 23.2 0.0 17.0 2.6 21.7
Brazilian Chinese Icelandic Indian Indonesian Malaysian Mexican New Zealand Philippine Russian South African Thaireal 1) yuan renminbi krona 2) rupee 3) rupiah ringgit peso 1) dollar peso rouble rand baht
23 24 25 26 27 28 29 30 31 32 33 342006 2.7333 10.0096 87.76 56.8435 11,512.37 4.6044 13.6936 1.9373 64.379 34.1117 8.5312 47.5942007 2.6594 10.4178 87.63 56.4186 12,528.33 4.7076 14.9743 1.8627 63.026 35.0183 9.6596 44.2142008 2.6737 10.2236 143.83 63.6143 14,165.16 4.8893 16.2911 2.0770 65.172 36.4207 12.0590 48.475
2009 Q1 3.0168 8.9066 - 64.7948 15,174.96 4.7259 18.7267 2.4498 62.133 44.4165 12.9740 46.038 Q2 2.8245 9.3107 - 66.3982 14,334.53 4.8340 18.1648 2.2565 65.097 43.7716 11.5242 47.294 Q3 2.6699 9.7702 - 69.1909 14,285.93 5.0333 18.9695 2.1232 68.815 44.7703 11.1618 48.575
2009 Mar. 3.0198 8.9210 - 66.8026 15,477.84 4.7949 19.1278 2.4527 63.105 45.1451 12.9870 46.667 Apr. 2.9197 9.0110 - 66.0471 14,552.65 4.7562 17.7645 2.3123 63.462 44.2135 11.8784 46.741 May 2.8232 9.3157 - 66.1762 14,137.45 4.8057 17.9969 2.2663 64.600 43.5678 11.4475 47.241 June 2.7391 9.5786 - 66.9191 14,315.40 4.9305 18.6813 2.1967 67.036 43.5553 11.2718 47.844 July 2.7221 9.6246 - 68.2333 14,241.51 4.9963 18.8143 2.1873 67.724 44.3881 11.2007 47.969 Aug. 2.6314 9.7485 - 68.9570 14,270.78 5.0185 18.5571 2.1097 68.803 45.1972 11.3415 48.543 Sep. 2.6520 9.9431 - 70.4154 14,346.84 5.0862 19.5255 2.0691 69.967 44.7624 10.9495 49.239
% change versus previous month 2009 Sep. 0.8 2.0 - 2.1 0.5 1.3 5.2 -1.9 1.7 -1.0 -3.5 1.4
% change versus previous year 2009 Sep. 3.1 1.2 - 7.6 6.8 2.8 27.8 -2.8 4.3 23.1 -5.5 -0.1
Source: ECB.1) For these currencies the ECB computes and publishes euro reference exchange rates as from 1 January 2008. Previous data are indicative.2) The most recent rate for the Icelandic krona refers to 3 December 2008.3) For this currency the ECB computes and publishes euro reference exchange rates as from 1 January 2009. Previous data are indicative.

S 74ECB
Monthly Bulletin
October 2009
9 DEVELOPMENTS OUTSIDE THE EURO AREA
9.1 In other EU Member States (annual percentage changes, unless otherwise indicated)
1. Economic and financial developments
HICP
Bulgaria Czech Denmark Estonia Latvia Lithuania Hungary Poland Romania Sweden UnitedRepublic Kingdom
1 2 3 4 5 6 7 8 9 10 11
2007 7.6 3.0 1.7 6.7 10.1 5.8 7.9 2.6 4.9 1.7 2.32008 12.0 6.3 3.6 10.6 15.3 11.1 6.0 4.2 7.9 3.3 3.6
2008 Q4 9.0 4.4 3.0 8.7 11.9 9.4 4.2 3.6 6.9 2.7 3.92009 Q1 5.1 1.5 1.7 3.7 9.0 8.4 2.7 3.6 6.8 2.1 3.0 Q2 3.1 1.0 1.1 0.2 4.4 4.9 3.6 4.3 6.1 1.7 2.1
2009 Apr. 3.8 1.3 1.1 0.9 5.9 5.9 3.2 4.3 6.5 1.8 2.3 May 3.0 0.9 1.1 0.3 4.4 4.9 3.8 4.2 5.9 1.7 2.2 June 2.6 0.8 0.9 -0.5 3.1 3.9 3.7 4.2 5.9 1.6 1.8 July 1.0 -0.1 0.7 -0.4 2.1 2.6 4.9 4.5 5.0 1.8 1.8 Aug. 1.3 0.0 0.7 -0.7 1.5 2.2 5.0 4.3 4.9 1.9 1.6
General government deficit (-)/surplus (+) as a % of GDP
2006 3.0 -2.6 5.2 2.9 -0.5 -0.4 -9.2 -3.9 -2.2 2.5 -2.72007 0.1 -0.6 4.5 2.7 -0.4 -1.0 -4.9 -1.9 -2.5 3.8 -2.72008 1.5 -1.5 3.6 -3.0 -4.0 -3.2 -3.4 -3.9 -5.4 2.5 -5.5
General government gross debt as a % of GDP
2006 22.7 29.6 31.3 4.3 10.7 18.0 65.6 47.7 12.4 45.9 43.42007 18.2 28.9 26.8 3.5 9.0 17.0 65.8 44.9 12.7 40.5 44.22008 14.1 29.8 33.3 4.8 19.5 15.6 73.0 47.1 13.6 38.0 52.0
Long-term government bond yield as a % per annum, period average
2009 Mar. 7.73 5.16 3.44 - 11.32 14.50 11.65 6.22 9.38 2.94 3.00 Apr. 7.24 5.25 3.50 - 11.15 14.50 10.63 6.19 9.77 3.18 3.16 May 7.08 5.06 3.62 - 11.09 14.50 10.01 6.31 8.32 3.57 3.41 June 7.30 5.45 3.76 - 12.75 14.50 10.15 6.34 11.26 3.62 3.53 July 7.56 5.41 3.74 - 12.75 14.50 8.81 6.19 11.46 3.37 3.55 Aug. 7.77 5.09 3.60 - 12.81 14.50 8.40 6.08 11.46 3.45 3.45
3-month interest rate as a % per annum, period average
2009 Mar. 6.58 2.49 3.28 7.11 12.08 7.11 - 4.30 14.49 1.16 1.83 Apr. 6.05 2.50 2.94 6.51 12.43 6.94 9.56 4.20 13.61 1.00 1.53 May 5.98 2.30 2.67 6.27 13.41 6.81 11.30 4.52 11.23 0.95 1.36 June 5.94 2.17 2.35 6.20 21.25 8.14 - 4.60 10.22 0.97 1.24 July 5.69 2.09 2.06 6.16 16.94 8.41 9.99 4.26 9.21 0.67 1.00 Aug. 5.30 1.92 1.94 5.85 13.06 7.98 9.02 4.16 9.06 0.62 0.78
Real GDP
2007 6.2 6.1 1.6 7.2 10.0 8.9 1.2 6.8 6.2 2.6 2.62008 6.0 2.7 -1.2 -3.6 -4.6 3.0 0.6 4.9 7.1 -0.2 0.7
2008 Q4 3.5 0.5 -3.7 -9.2 -10.7 -1.3 -2.2 2.6 2.9 -5.1 -1.82009 Q1 -3.5 -4.5 -3.6 -15.0 -18.5 -11.6 -5.6 1.7 -6.2 -6.5 -4.9 Q2 -4.9 -5.5 -7.0 -16.1 -17.3 -20.4 -7.3 1.4 -8.7 -6.1 -5.5
Current and capital accounts balance as a % of GDP
2007 -27.2 -2.6 0.7 -16.8 -20.6 -12.8 -6.1 -3.6 -12.9 8.7 -2.52008 -24.6 -2.2 2.6 -8.4 -11.1 -10.1 -6.0 -3.9 -11.8 6.1 -1.4
2008 Q4 -30.9 -5.2 2.8 -3.5 -6.5 -3.4 -6.1 -4.6 -8.3 5.3 -1.92009 Q1 -17.2 4.5 0.5 0.8 4.3 4.7 0.1 2.6 -4.1 7.6 -1.0 Q2 -12.2 -2.7 3.7 6.3 17.0 2.4 4.5 -0.2 -5.6 8.6 -2.8
Unit labour costs
2007 14.2 2.9 4.2 17.3 27.3 10.3 5.4 2.6 . 4.7 3.02008 16.2 5.0 7.1 14.1 23.0 10.6 4.5 6.5 . 2.6 2.5
2008 Q4 17.5 5.2 9.1 12.2 18.5 9.3 - 12.2 - 6.0 1.82009 Q1 16.1 5.8 6.2 10.0 3.6 10.0 - 5.6 - 8.4 2.9 Q2 14.2 4.9 9.9 3.4 -3.2 11.2 - . - 7.4 .
Standardised unemployment rate as a % of labour force (s.a.)
2007 6.9 5.3 3.8 4.6 6.0 4.3 7.4 9.6 6.4 6.1 5.32008 5.6 4.4 3.4 5.6 7.5 5.9 7.8 7.2 5.8 6.2 5.6
2008 Q4 5.2 4.5 3.8 7.7 10.3 8.1 8.1 6.9 5.9 6.8 6.32009 Q1 6.0 5.5 4.8 11.0 13.2 11.0 9.2 7.7 6.2 7.5 7.0 Q2 6.3 6.3 5.9 13.3 16.4 13.7 9.7 8.0 6.4 8.5 7.7
2009 Apr. 6.2 6.1 5.7 - 15.5 13.7 9.7 8.0 6.4 8.2 7.5 May 6.3 6.3 5.9 - 16.5 13.7 9.7 8.0 6.4 8.5 7.7 June 6.4 6.5 6.1 - 17.1 13.7 9.6 8.0 6.4 8.8 7.8 July 6.8 6.7 6.0 - 17.6 16.7 9.5 8.0 . 9.1 . Aug. 7.1 6.9 5.9 - 18.3 . 9.6 8.0 . 9.4 .
Sources: European Commission (Economic and Financial Affairs DG and Eurostat), national data, Reuters and ECB calculations.

S 75ECB
Monthly Bulletin
October 2009
EURO AREASTATISTICS
Developments
outside the
euro area
9.2 In the United States and Japan (annual percentage changes, unless otherwise indicated)
1. Economic and financial developments
United States
Consumer Unit labour Real GDP Industrial Unemployment Broad 3-month 10-year Exchange Fiscal Grossprice index costs 1) production rate money 2) interbank zero coupon rate 4) deficit (-)/ public
index as a % of deposit government as national surplus (+) debt 5)
(manufacturing) labour force rate 3) bond yield 3) currency as a % of as a % of(s.a.) end-of- per euro GDP GDP
period
1 2 3 4 5 6 7 8 9 10 11
2005 3.4 2.3 3.1 4.2 5.1 4.2 3.57 5.05 1.2441 -3.3 48.22006 3.2 2.8 2.7 2.7 4.6 5.0 5.20 5.26 1.2556 -2.2 47.72007 2.9 2.3 2.1 1.6 4.6 5.8 5.30 4.81 1.3705 -2.8 48.32008 3.8 1.0 0.4 -3.1 5.8 6.9 2.93 2.70 1.4708 -6.5 56.0
2008 Q3 5.3 1.8 0.0 -3.9 6.1 6.1 2.91 4.61 1.5050 -6.4 52.0 Q4 1.6 1.7 -1.9 -8.7 6.9 8.3 2.77 2.70 1.3180 -8.1 56.02009 Q1 0.0 -0.1 -3.3 -13.9 8.1 9.5 1.24 2.96 1.3029 -9.8 59.7 Q2 -1.2 -1.2 -3.8 -14.6 9.3 8.7 0.84 3.95 1.3632 . . Q3 . . . . 9.6 . 0.41 3.61 1.4303 . .
2009 May -1.3 - - -14.8 9.4 8.8 0.82 3.82 1.3650 - - June -1.4 - - -14.9 9.5 9.0 0.62 3.95 1.4016 - - July -2.1 - - -13.4 9.4 8.1 0.52 3.90 1.4088 - - Aug. -1.5 - - -12.1 9.7 7.8 0.42 3.77 1.4268 - - Sep. . - - . 9.8 . 0.30 3.61 1.4562 - -
Japan
2005 -0.3 -2.1 1.9 1.4 4.4 1.8 0.06 1.66 136.85 -6.7 163.22006 0.2 -0.5 2.0 4.5 4.1 1.0 0.30 1.85 146.02 -1.6 160.02007 0.1 -1.1 2.3 2.8 3.8 1.6 0.79 1.70 161.25 -2.5 156.12008 1.4 1.7 -0.7 -3.4 4.0 2.1 0.93 1.21 152.45 . .
2008 Q3 2.2 1.3 -0.3 -1.4 4.0 2.2 0.90 1.72 161.83 . . Q4 1.0 4.3 -4.5 -14.6 4.0 1.8 0.96 1.21 126.71 . . 2009 Q1 -0.1 4.9 -8.4 -34.6 4.5 2.1 0.67 1.33 122.04 . . Q2 -1.0 . -7.2 -27.9 5.2 2.6 0.53 1.41 132.59 . . Q3 . . . . . . 0.40 1.45 133.82 . .
2009 May -1.1 - - -29.6 5.2 2.7 0.53 1.43 131.85 - - June -1.8 - - -23.6 5.4 2.5 0.49 1.41 135.39 - - July -2.2 - - -22.7 5.7 2.7 0.43 1.51 133.09 - - Aug. -2.2 - - -18.7 . 2.8 0.40 1.44 135.31 - - Sep. . - - . . . 0.36 1.45 133.14 - -
C38 Real gross domestic product(annual percentage changes; quarterly)
C39 Consumer price indices(annual percentage changes; monthly)
-10
-8
-6
-4
-2
0
2
4
6
1999 2000 2001 2002 2003 2004 2005 2006 2007 2008-10
-8
-6
-4
-2
0
2
4
6
euro areaUnited StatesJapan
-4
-2
0
2
4
6
1999 2000 2001 2002 2003 2004 2005 2006 2007 2008 2009-4
-2
0
2
4
6
euro areaUnited StatesJapan
Sources: National data (columns 1, 2 (United States), 3, 4, 5 (United States), 6, 9 and 10); OECD (column 2 (Japan)); Eurostat (column 5 (Japan), euro area chart data); Reuters(columns 7 and 8); ECB calculations (column 11).1) Seasonally adjusted. The data for the United States refer to the private non-agricultural business sector.2) Average-of-period values; M2 for US, M2+CDs for Japan.3) Percentages per annum. For further information on 3-month interbank deposit rate, see Section 4.6.4) For more information, see Section 8.2.5) Gross consolidated general government debt (end of period).6) Data refer to the changing composition of the euro area. For further information, see the General notes.
6)

S 76ECB
Monthly Bulletin
October 2009
LIST OF CHARTS
C1 Monetary aggregates S12
C2 Counterparts S12
C3 Components of monetary aggregates S13
C4 Components of longer-term fi nancial liabilities S13
C5 Loans to other fi nancial intermediaries and non-fi nancial corporations S14
C6 Loans to households S14
C7 Loans to government S16
C8 Loans to non-euro area residents S16
C9 Total deposits by sector (fi nancial intermediaries) S17
C10 Total deposits and deposits included in M3 by sector (fi nancial intermediaries) S17
C11 Total deposits by sector (non-fi nancial corporations and households) S18
C12 Total deposits and deposits included in M3 by sector (non-fi nancial corporations and households) S18
C13 Deposits by government and non-euro area residents S19
C14 MFI holdings of securities S20
C15 Total assets of investment funds S24
C16 Total outstanding amounts and gross issues of securities, other than shares, issued by euro area residents S35
C17 Net issues of securities, other than shares, seasonally adjusted and non-seasonally adjusted S37
C18 Annual growth rates of long-term debt securities, by sector of the issuer, in all currencies combined S38
C19 Annual growth rates of short-term debt securities, by sector of the issuer, in all currencies combined S39
C20 Annual growth rates for quoted shares issued by euro area residents S40
C21 Gross issues of quoted shares by sector of the issuer S41
C22 New deposits with agreed maturity S43
C23 New loans at fl oating rate and up to 1 year initial rate fi xation S43
C24 Euro area money market rates S44
C25 3-month money market rates S44
C26 Euro area spot yield curves S45
C27 Euro area spot rates and spreads S45
C28 Dow Jones EURO STOXX Broad, Standard & Poor’s 500 and Nikkei 225 S46
C29 Defi cit, borrowing requirement and change in debt S59
C30 Maastricht debt S59
C31 B.o.p. current account balance S60
C32 B.o.p. goods S61
C33 B.o.p. services S61
C34 B.o.p. net direct and portfolio investment S64
C35 Main b.o.p. transactions underlying the developments in MFI net external assets S69
C36 Effective exchange rates S72
C37 Bilateral exchange rates S72
C38 Real gross domestic product S75
C39 Consumer price indices S75

ECB
Monthly Bulletin
October 2009 S 77
TECHNICAL NOTES
RELATING TO THE EURO AREA OVERVIEW
CALCULATION OF GROWTH RATES FOR MONETARY
DEVELOPMENTS
The average growth rate for the quarter ending
in month t is calculated as:
a)
where It is the index of adjusted outstanding
amounts as at month t (see also below).
Likewise, for the year ending in month t, the
average growth rate is calculated as:
b)
RELATING TO SECTIONS 2.1 TO 2.6
CALCULATION OF TRANSACTIONS
Monthly transactions are calculated from monthly
differences in outstanding amounts adjusted for
reclassifi cations, other revaluations, exchange
rate variations and any other changes which do
not arise from transactions.
If Lt represents the outstanding amount at
the end of month t, C t
M the reclassifi cation
adjustment in month t, E t
M the exchange rate
adjustment and V t
M the other revaluation
adjustments, the transactions F t
M in month t are
defi ned as:
c)
Similarly, the quarterly transactions Ft
Q for the
quarter ending in month t are defi ned as:
d)
where Lt-3
is the amount outstanding at the end
of month t-3 (the end of the previous quarter)
and, for example, C t
Q is the reclassifi cation
adjustment in the quarter ending in month t.
For those quarterly series for which monthly
observations are now available (see below), the
quarterly transactions can be derived as the sum
of the three monthly transactions in the quarter.
CALCULATION OF GROWTH RATES FOR MONTHLY
SERIES
Growth rates may be calculated from
transactions or from the index of adjusted
outstanding amounts. If F t
M and Lt are defi ned
as above, the index It of adjusted outstanding
amounts in month t is defi ned as:
e)
The base of the index (of the non-seasonally
adjusted series) is currently set as December
2006 = 100. Time series of the index of adjusted
outstanding amounts are available on the
ECB’s website (www.ecb.europa.eu) under the
“Money, banking and fi nancial markets” sub-
section of the “Statistics” section.
The annual growth rate at for month t – i.e.
the change in the 12 months ending in
month t – may be calculated using either of the
following two formulae:
f)
g)
Unless otherwise indicated, the annual growth
rates refer to the end of the indicated period.
For example, the annual percentage change for
the year 2002 is calculated in g) by dividing
the index of December 2002 by the index of
December 2001.
−1
⎞
⎠
⎟⎟⎟⎟
⎞
⎠
⎟⎟⎟⎟
×100
0.5It−12
+ ∑ It−i−12 + 0.5I
t−15
2
i=1
0.5It + ∑ It−i
+ 0.5It−3
2
i=1
⎞
⎠
⎟⎟⎟⎟
⎞
⎠
⎟⎟⎟⎟
−1 ×1000.5I
t + ∑ I
t−i + 0.5I
t−12
11
i=1
0.5It−12
+ ∑ It−i−12
+ 0.5It−24
11
i=1
Ft = (L
t – L
t–1) – C
t – E
t – V
tM M M M
Ft = (L
t – L
t–3) – C
t – E
t – V
tQ Q Q Q
It = I
t−1 ×
Ft
Lt−1
M⎛
⎝⎜
⎞
⎠⎟1+
at = F
t−iL
t−1−i
M
i=0
⎛
⎝⎜
⎞
⎠⎟
⎡
⎣⎢
⎤
⎦⎥×100∏ 1 + −1
11
at = I
tI
t−12
⎛⎝⎜
⎞⎠⎟× 100−1
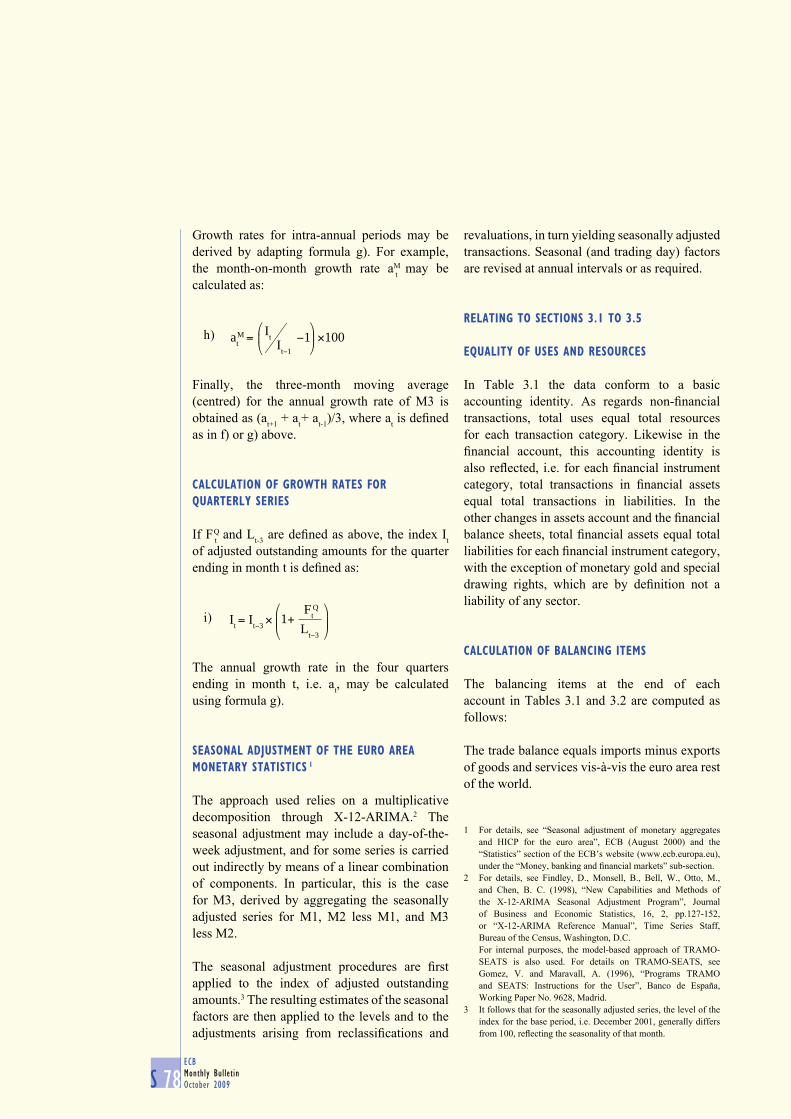
ECB
Monthly Bulletin
October 2009S 78
Growth rates for intra-annual periods may be
derived by adapting formula g). For example,
the month-on-month growth rate aM
t may be
calculated as:
h)
Finally, the three-month moving average
(centred) for the annual growth rate of M3 is
obtained as (at+1
+ at + a
t-1)/3, where a
t is defi ned
as in f) or g) above.
CALCULATION OF GROWTH RATES FOR
QUARTERLY SERIES
If F t
Q and Lt-3
are defi ned as above, the index It
of adjusted outstanding amounts for the quarter
ending in month t is defi ned as:
i)
The annual growth rate in the four quarters
ending in month t, i.e. at, may be calculated
using formula g).
SEASONAL ADJUSTMENT OF THE EURO AREA
MONETARY STATISTICS 1
The approach used relies on a multiplicative
decomposition through X-12-ARIMA.2 The
seasonal adjustment may include a day-of-the-
week adjustment, and for some series is carried
out indirectly by means of a linear combination
of components. In particular, this is the case
for M3, derived by aggregating the seasonally
adjusted series for M1, M2 less M1, and M3
less M2.
The seasonal adjustment procedures are fi rst
applied to the index of adjusted outstanding
amounts.3 The resulting estimates of the seasonal
factors are then applied to the levels and to the
adjustments arising from reclassifi cations and
revaluations, in turn yielding seasonally adjusted
transactions. Seasonal (and trading day) factors
are revised at annual intervals or as required.
RELATING TO SECTIONS 3.1 TO 3.5
EQUALITY OF USES AND RESOURCES
In Table 3.1 the data conform to a basic
accounting identity. As regards non-fi nancial
transactions, total uses equal total resources
for each transaction category. Likewise in the
fi nancial account, this accounting identity is
also refl ected, i.e. for each fi nancial instrument
category, total transactions in fi nancial assets
equal total transactions in liabilities. In the
other changes in assets account and the fi nancial
balance sheets, total fi nancial assets equal total
liabilities for each fi nancial instrument category,
with the exception of monetary gold and special
drawing rights, which are by defi nition not a
liability of any sector.
CALCULATION OF BALANCING ITEMS
The balancing items at the end of each
account in Tables 3.1 and 3.2 are computed as
follows:
The trade balance equals imports minus exports
of goods and services vis-à-vis the euro area rest
of the world.
It
It−1
at
=M −1⎛
⎝⎜
⎞
⎠⎟ ×100
It = I
t−3 ×⎛
⎝⎜
⎞
⎠⎟
Lt−3
FtQ
1+
For details, see “Seasonal adjustment of monetary aggregates 1
and HICP for the euro area”, ECB (August 2000) and the
“Statistics” section of the ECB’s website (www.ecb.europa. eu),
under the “Money, banking and fi nancial markets” sub-section.
For details, see Findley, D., Monsell, B., Bell, W., Otto, M., 2
and Chen, B. C. (1998), “New Capabilities and Methods of
the X-12-ARIMA Seasonal Adjustment Program”, Journal
of Business and Economic Statistics, 16, 2, pp.127-152,
or “X-12-ARIMA Reference Manual”, Time Series Staff,
Bureau of the Census, Washington, D.C.
For internal purposes, the model-based approach of TRAMO-
SEATS is also used. For details on TRAMO-SEATS, see
Gomez, V. and Maravall, A. (1996), “Programs TRAMO
and SEATS: Instructions for the User”, Banco de España,
Working Paper No. 9628, Madrid.
It follows that for the seasonally adjusted series, the level of the 3
index for the base period, i.e. December 2001, generally differs
from 100, refl ecting the seasonality of that month.

ECB
Monthly Bulletin
October 2009 S 79
EURO AREASTATISTICS
Technical notes
Net operating surplus and mixed income
is defi ned for resident sectors only and is
calculated as gross value added (gross domestic
product at market prices for the euro area) minus
compensation of employees (uses) minus other
taxes less subsidies on production (uses) minus
consumption of fi xed capital (uses).
Net national income is defi ned for resident
sectors only and is computed as net operating
surplus and mixed income plus compensation of
employees (resources) plus taxes less subsidies
on production (resources) plus net property
income (resources minus uses).
Net disposable income is also only defi ned
for resident sectors and equals net national
income plus net current taxes on income and
wealth (resources minus uses) plus net social
contributions (resources minus uses) plus net
social benefi ts other than social transfers in kind
(resources minus uses) plus net other current
transfers (resources minus uses).
Net saving is defi ned for resident sectors
and is calculated as net disposable income
plus the net adjustment for the change in net
equity of households in pension funds reserves
(resources minus uses) minus fi nal consumption
expenditure (uses). For the rest of the world,
current external account is compiled as the trade
balance plus all net income (resources minus
uses).
Net lending/net borrowing is computed from
the capital account as net saving plus net capital
transfers (resources minus uses) minus gross
capital formation (uses) minus acquisitions
less disposals of non-produced non-fi nancial
assets (uses) plus consumption of fi xed capital
(resources). It can also be calculated in the
fi nancial account as total transactions in fi nancial
assets minus total transactions in liabilities
(also known as changes in netfi nancial worth
(wealth) due to transactions). For the household
and non-fi nancial corporation sectors, there is a
statistical discrepancy between these balancing
items computed from the capital account and
the fi nancial account, respectively.
Changes in net worth (wealth) are calculated
as changes in net worth (wealth) due to savings
and capital transfers plus other changes in net
fi nancial worth (wealth). It currently excludes
other changes in non-fi nancial assets due to
unavailability of data.
Net fi nancial worth (wealth) is calculated as
total fi nancial assets minus total liabilities,
whereas changes in net fi nancial worth (wealth)
are equal to the sum of changes in net fi nancial
worth (wealth) due to transactions (lending/ net
borrowing from the fi nancial account) and other
changes in net fi nancial worth (wealth).
Finally, changes in net fi nancial worth (wealth)
due to transactions are computed as total
transactions in fi nancial assets minus total
transactions in liabilities and other changes in
net fi nancial worth (wealth) are calculated as
total other changes in fi nancial assets minus
total other changes in liabilities.
RELATING TO SECTION 4.3 AND 4.4
CALCULATION OF GROWTH RATES FOR DEBT
SECURITIES AND QUOTED SHARES
Growth rates are calculated on the basis of
fi nancial transactions and therefore exclude
reclassifi cations, revaluations, exchange rate
variations and any other changes which do not
arise from transactions. They may be calculated
from transactions or from the index of notional
stocks. If N t
M represents the transactions (net
issues) in month t and Lt the level outstanding
at the end of the month t, the index It of notional
stocks in month t is defi ned as:
j)
As a base, the index is set equal to 100 on
December 2001. The growth rate at for month
t corresponding to the change in the 12 months
ending in month t, may be calculated using
either of the following two formulae:
It = I
t−1 ×
Nt
Lt−1
⎛
⎝⎜
⎞
⎠⎟1+

ECB
Monthly Bulletin
October 2009S 80
k)
l)
The method used to calculate the growth rates
for securities other than shares is the same as
that used for the monetary aggregates, the only
difference being that an “N” is used rather than
an “F”. The reason for this is to distinguish
between the different ways of obtaining “net
issues” for securities issues statistics and the
equivalent “transactions” calculated used for the
monetary aggregates.
The average growth rate for the quarter ending
in month t is calculated as:
m)
where It is the index of notional stocks as at
month t. Likewise, for the year ending in month
t, the average growth rate is calculated as:
n)
The calculation formula used for Section 4.3 is
also used for Section 4.4 and is likewise based on
that used for the monetary aggregates. Section 4.4
is based on market values and the basis for the
calculation are fi nancial transactions, which
exclude reclassifi cations, revaluations or any
other changes that do not arise from transactions.
Exchange rate variations are not included as all
quoted shares covered are denominated in euro.
SEASONAL ADJUSTMENT OF SECURITIES ISSUES
STATISTICS 4
The approach used relies on a multiplicative
decomposition through X-12-ARIMA. The
seasonal adjustment for the securities issues
total is carried out indirectly by means of a linear
combination of sector and maturity component
breakdowns.
The seasonal adjustment procedures are applied
to the index of notional stocks. The resulting
estimates of the seasonal factors are then
applied to the outstanding amounts, from which
seasonally adjusted net issues are derived.
Seasonal factors are revised at annual intervals
or as required.
Similar as depicted in formula k) and l), the
growth rate at for month t corresponding to the
change in the 6 months ending in month t, may
be calculated using either of the following two
formulae:
o)
p)
RELATING TO TABLE 1 IN SECTION 5.1
SEASONAL ADJUSTMENT OF THE HICP 4
The approach used relies on multiplicative
decomposition through X-12-ARIMA (see
footnote 2 on page S78). The seasonal
adjustment of the overall HICP for the euro
area is carried out indirectly by aggregating
the seasonally adjusted euro area series for
processed food, unprocessed food, industrial
goods excluding energy, and services. Energy
is added without adjustment since there is no
statistical evidence of seasonality. Seasonal
factors are revised at annual intervals or as
required.
at = N
t−iL
t−1−i
M
i=0
⎛
⎝⎜
⎞
⎠⎟
⎡
⎣⎢
⎤
⎦⎥×100∏ 1 + −1
11
at = I
tI
t−12
⎛⎝⎜
⎞⎠⎟×100−1
−1
⎞
⎠
⎟⎟⎟⎟
⎞
⎠
⎟⎟⎟⎟
×100
0.5It−12
+ ∑ It−i−12 + 0.5I
t−15
2
i=1
0.5It + ∑ It−i
+ 0.5It−3
2
i=1
⎞
⎠
⎟⎟⎟⎟
⎞
⎠
⎟⎟⎟⎟
−1 ×1000.5I
t + ∑ I
t−i + 0.5I
t−12
11
i=1
0.5It−12
+ ∑ It−i−12
+ 0.5It−24
11
i=1
at = N
t−iL
t−1−i
M
i=0
⎛
⎝⎜
⎞
⎠⎟
⎡
⎣⎢
⎤
⎦⎥×100∏ 1 + −1
5
at = I
tI
t−6
⎛⎝⎜
⎞⎠⎟×100−1
For details, see “Seasonal adjustment of monetary aggregates and 4
HICP for the euro area”, ECB (August 2000) and the “Statistics”
section of the ECB’s website (www.ecb.europa.eu), under the
“Money, banking and fi nancial markets” sub-section.

ECB
Monthly Bulletin
October 2009 S 81
EURO AREASTATISTICS
Technical notes
RELATING TO TABLE 2 IN SECTION 7.1
SEASONAL ADJUSTMENT OF THE BALANCE OF
PAYMENTS CURRENT ACCOUNT
The approach relies on multiplicative
decomposition through X-12-ARIMA (see
footnote 2 on page S78). The raw data for
goods, services and income are pre-adjusted
to take a working-day effect into account. The
working-day adjustment in goods and services
is corrected for national public holidays. The
seasonal adjustment for these items is carried
out using these pre-adjusted series. The seasonal
adjustment of the total current account is carried
out by aggregating the seasonally adjusted euro
area series for goods, services, income and
current transfers. Seasonal (and trading day)
factors are revised at semi-annual intervals or as
required.
RELATING TO SECTION 7.3
CALCULATION OF GROWTH RATES FOR THE
QUARTERLY AND ANNUAL SERIES
The annual growth rate for quarter t is calculated
on the basis of quarterly transactions (Ft) and
positions (Lt), as follows:
The growth rate for the annual series is equal to
the growth rate in the last quarter of the year.
att
= ×100⎛⎝⎜
⎛⎝⎜
⎞⎠⎟
⎞⎠⎟
i=t-3∏ 1 + Fi
Li-l— −1


ECB
Monthly Bulletin
October 2009 S 83
The “Euro area statistics” section of the Monthly
Bulletin focuses on statistics for the euro area as
a whole. More detailed and longer runs of data,
with further explanatory notes, are available in
the “Statistics” section of the ECB’s website
(www.ecb.europa.eu). This allows user-friendly
access to data via the ECB’s Statistical Data
Warehouse (http://sdw.ecb.europa.eu/), which
includes search and download facilities. Further
services available under the “Data services”
sub-section include the subscription to different
datasets and a repository of compressed Comma
Separated Value (CSV) fi les. For further
information, please contact us at: statistics@
ecb.europa.eu.
In general, the cut-off date for the statistics
included in the Monthly Bulletin is the day
preceding the fi rst meeting in the month of the
ECB’s Governing Council. For this issue, the
cut-off date was 7 October 2009.
Unless otherwise indicated, all data series covering
observations for 2009 relate to the Euro 16 (the
euro area including Slovakia) for the whole time
series. For interest rates, monetary statistics
and the HICP (and, for consistency reasons, the
components and counterparts of M3 and the
components of the HICP), the statistical series refer
to the changing composition of the euro area. Where
applicable, this is indicated in the tables by means
of a footnote. In such cases, where underlying data
are available, absolute and percentage changes
for the respective year of entry into the euro area
of Greece (2001), Slovenia (2007), Cyprus (2008),
Malta (2008) and Slovakia (2009), calculated
from bases covering the year prior to the year of
entry, use a series in which the impact of these
countries’ joining the euro area is taken into
account. Historical data referring to the euro area
before the entry of Slovakia are available on the
ECB’s website at http://www.ecb.europa.eu/stats/
services/downloads/html/index.en.html.
The statistical series referring to the changing
composition of the euro area are based on the
euro area composition at the time to which the
statistics relate. Thus, data prior to 2001 refer to
the Euro 11, i.e. the following 11 EU Member
States: Belgium, Germany, Ireland, Spain, France,
Italy, Luxembourg, the Netherlands, Austria,
Portugal and Finland. Data from 2001 to 2006
refer to the Euro 12, i.e. the Euro 11 plus Greece.
Data for 2007 refer to the Euro 13, i.e. the Euro 12
plus Slovenia. Data for 2008 refer to the Euro 15,
i.e. the Euro 13 plus Cyprus and Malta, and data
as of 2009 refer to the Euro 16, i.e. the Euro 15
plus Slovakia.
Given that the composition of the European
currency unit (ECU) does not coincide with
the former currencies of the countries that have
adopted the single currency, pre-1999 amounts
originally expressed in the participating
currencies and converted into ECU at current
ECU exchange rates are affected by movements
in the currencies of EU Member States that
have not adopted the euro. To avoid this effect
on the monetary statistics, the pre-1999 data
in Sections 2.1 to 2.8 are expressed in units
converted from national currencies at the
irrevocable euro exchange rates established on
31 December 1998. Unless otherwise indicated,
price and cost statistics before 1999 are based
on data expressed in national currency terms.
Methods of aggregation and/or consolidation
(including cross-country consolidation) have
been used where appropriate.
Recent data are often provisional and may be
revised. Discrepancies between totals and their
components may arise from rounding.
The group “Other EU Member States” comprises
Bulgaria, the Czech Republic, Denmark, Estonia,
Latvia, Lithuania, Hungary, Poland, Romania,
Sweden and the United Kingdom.
In most cases, the terminology used within the
tables follows international standards, such
as those contained in the European System of
Accounts 1995 (ESA 95) and the IMF Balance of
Payments Manual. Transactions refer to voluntary
exchanges (measured directly or derived), while
fl ows also encompass changes in outstanding
amounts owing to price and exchange rate
changes, write-offs, and other changes.
GENERAL NOTES

ECB
Monthly Bulletin
October 2009S 84
In the tables, the term “up to (x) years” means
“up to and including (x) years”.
OVERVIEW
Developments in key indicators for the euro area
are summarised in an overview table.
MONETARY POLICY STATISTICS
Section 1.4 shows statistics on minimum
reserve and liquidity factors. Maintenance
periods for minimum reserve requirements
start every month on the settlement day of the
main refi nancing operation (MRO) following
the Governing Council meeting at which the
monthly assessment of the monetary policy
stance is scheduled, and end on the day
preceding the corresponding settlement day
in the following month. Annual and quarterly
observations refer to averages of the last reserve
maintenance period of the year/quarter.
Table 1 in Section 1.4 shows the components
of the reserve base of credit institutions subject
to reserve requirements. The liabilities vis-
à-vis other credit institutions subject to the
ESCB’s minimum reserve system, the ECB and
participating national central banks (NCBs) are
excluded from the reserve base. When a credit
institution cannot provide evidence of the amount
of its issues of debt securities with a maturity of
up to two years held by the institutions mentioned
above, it may deduct a certain percentage of these
liabilities from its reserve base. The percentage
for calculating the reserve base was 10% until
November 1999 and 30% thereafter.
Table 2 in Section 1.4 contains average data for
completed maintenance periods. The amount
of the reserve requirement of each individual
credit institution is fi rst calculated by applying
the reserve ratio for the corresponding categories
of liabilities to the eligible liabilities, using the
balance sheet data from the end of each calendar
month. Subsequently, each credit institution
deducts from this fi gure a lump-sum allowance
of €100,000. The resulting required reserves are
then aggregated at the euro area level (column 1).
The current account holdings (column 2) are the
aggregate average daily current account holdings
of credit institutions, including those that serve
the fulfi lment of reserve requirements. The excess
reserves (column 3) are the average current account
holdings over the maintenance period in excess of
the required reserves. The defi ciencies (column 4)
are defi ned as the average shortfalls of current
account holdings from required reserves over the
maintenance period, computed on the basis of
those credit institutions that have not fulfi lled their
reserve requirement. The interest rate on minimum
reserves (column 5) is equal to the average, over the
maintenance period, of the ECB’s rate (weighted
according to the number of calendar days) on the
Eurosystem’s MROs (see Section 1.3).
Table 3 in Section 1.4 shows the banking
system’s liquidity position, which is defi ned
as the current account holdings in euro of
credit institutions in the euro area with the
Eurosystem. All amounts are derived from
the consolidated fi nancial statement of the
Eurosystem. The other liquidity-absorbing
operations (column 7) exclude the issuance
of debt certifi cates initiated by NCBs in Stage
Two of EMU. The net other factors (column
10) represent the netted remaining items in
the consolidated fi nancial statement of the
Eurosystem. The credit institutions’ current
accounts (column 11) are equal to the difference
between the sum of liquidity-providing factors
(columns 1 to 5) and the sum of liquidity-
absorbing factors (columns 6 to 10). The base
money (column 12) is calculated as the sum of
the deposit facility (column 6), the banknotes in
circulation (column 8) and the credit institutions’
current account holdings (column 11).
MONEY, BANKING AND INVESTMENT FUNDS
Section 2.1 shows the aggregated balance sheet
of the monetary fi nancial institution (MFI)
sector, i.e. the sum of the harmonised balance
sheets of all MFIs resident in the euro area.
MFIs are central banks, credit institutions as

ECB
Monthly Bulletin
October 2009 S 85
EURO AREASTATISTICS
General notes
defi ned under Community law, money market
funds and other institutions whose business it is
to receive deposits and/or close substitutes for
deposits from entities other than MFIs and, for
their own account (at least in economic terms),
to grant credits and/or make investments in
securities. A complete list of MFIs is published
on the ECB’s website.
Section 2.2 shows the consolidated balance
sheet of the MFI sector, which is obtained by
netting the aggregated balance sheet positions
between MFIs in the euro area. Due to limited
heterogeneity in recording practices, the sum of
the inter-MFI positions is not necessarily zero; the
balance is shown in column 10 of the liabilities
side of Section 2.2. Section 2.3 sets out the euro
area monetary aggregates and counterparts.
These are derived from the consolidated MFI
balance sheet, and include positions of non-
MFIs resident in the euro area held with MFIs
resident in the euro area; they also take account
of some monetary assets/liabilities of central
government. Statistics on monetary aggregates
and counterparts are adjusted for seasonal and
trading-day effects. The external liabilities item
of Sections 2.1 and 2.2 shows the holdings by
non-euro area residents of (i) shares/units issued
by money market funds located in the euro area
and (ii) debt securities issued with a maturity
of up to two years by MFIs located in the euro
area. In Section 2.3, however, these holdings
are excluded from the monetary aggregates and
contribute to the item “net external assets”.
Section 2.4 provides an analysis by sector,
type and original maturity of loans granted by
MFIs other than the Eurosystem (the banking
system) resident in the euro area. Section 2.5
shows an analysis, by sector and instrument, of
deposits held with the euro area banking system.
Section 2.6 shows the securities held by the euro
area banking system, by type of issuer.
Sections 2.2 to 2.6 include transactions, which
are derived as differences in outstanding amounts
adjusted for reclassifi cations, revaluations,
exchange rate variations and any other changes
that do not arise from transactions. Section 2.7
shows selected revaluations that are used in the
derivation of transactions. Sections 2.2 to 2.6
also provide growth rates in terms of annual
percentage changes based on the transactions.
Section 2.8 shows a quarterly currency
breakdown of selected MFI balance sheet items.
Details of the sector defi nitions are set out in the
“Monetary Financial Institutions and Markets
Statistics Sector Manual – Guidance for the
statistical classifi cation of customers. Third
Edition” (ECB, March 2007). The “Guidance
Notes to the Regulation ECB/2001/13 on the
MFI Balance Sheet Statistics” (ECB,
November 2002) explains practices that NCBs
are recommended to follow. Since
1 January 1999, the statistical information has
been collected and compiled on the basis of
Regulation ECB/1998/16 of 1 December 1998
concerning the consolidated balance sheet of the
Monetary Financial Institutions sector 1, as last
amended by Regulation ECB/2003/10 2.
In line with this Regulation, the balance sheet
item “money market paper” has been merged
with the item “debt securities” on both the assets
and liabilities side of the MFI balance sheet.
Section 2.9 shows end-of-quarter outstanding
amounts for the balance sheet of the euro area
investment funds (other than money market
funds). The balance sheet is aggregated and
therefore includes, among the liabilities,
holdings by investment funds of shares/units
issued by other investment funds. Total assets/
liabilities are also broken down by investment
policy (equity funds, bond funds, mixed funds,
real estate funds and other funds) and by type
of investor (general public funds and special
investors’ funds). Section 2.10 shows the
aggregated balance sheet for each investment
fund sector, as identifi ed by investment policy
and type of investor.
OJ L 356, 30.12.1998, p. 7.1
OJ L 250, 2.10.2003, p. 19.2

ECB
Monthly Bulletin
October 2009S 86
EURO AREA ACCOUNTS
Section 3.1 shows quarterly integrated euro area
accounts data, which provide comprehensive
information on the economic activities of
households (including non-profi t institutions
serving households), non-fi nancial corporations,
fi nancial corporations and general government,
as well as on the interaction between these
sectors and both the euro area and the rest of
the world. The non-seasonally adjusted data on
current prices are displayed for the last available
quarter, following a simplifi ed sequence of
accounts in accordance with the methodological
framework of the European System of
Accounts 1995 (ESA 95).
In short, the sequence of accounts (transactions)
comprises: (1) the generation of income
account, which shows how the production
activity translates into various categories
of income; (2) the allocation of primary
income account, which records receipts and
expenses relating to various forms of property
income (for the economy as a whole, the
balancing item of the primary income account
is the national income); (3) the secondary
distribution of income account, which shows
how the national income of an institutional
sector changes because of current transfers;
(4) the use of income account, which shows how
disposable income is spent on consumption or
saved; (5) the capital account, which shows how
savings and net capital transfers are spent in the
acquisition of non-fi nancial assets (the balancing
item of the capital account is net lending/
net borrowing); and (6) the fi nancial account,
which records the net acquisitions of fi nancial
assets and the net incurrence of liabilities. As
each non-fi nancial transaction is mirrored by a
fi nancial transaction, the balancing item of the
fi nancial account conceptually also equals net
lending/net borrowing as calculated from the
capital account.
In addition, opening and closing fi nancial
balance sheets are presented, which provide a
picture of the fi nancial wealth of each individual
sector at a given point in time. Finally, other
changes in fi nancial assets and liabilities
(e.g. those resulting from the impact of changes
in asset prices) are also shown.
The sector coverage of the fi nancial account
and of the fi nancial balance sheets is more
detailed for the fi nancial corporations sector,
showing a breakdown into MFIs, other fi nancial
intermediaries (including fi nancial auxiliaries),
and insurance corporations and pension funds.
Section 3.2 shows four-quarter cumulated fl ows
(transactions) for the so-called non-fi nancial
accounts of the euro area (i.e. accounts (1) to (5)
above) also following the simplifi ed sequence
of accounts.
Section 3.3 shows four-quarter cumulated fl ows
(transactions and other changes) for households’
income, expenditure and accumulation
accounts, and outstanding amounts for the
fi nancial balance sheet accounts, following a
more analytical presentation. Sector-specifi c
transactions and balancing items are arranged
so as to more easily depict fi nancing and
investment decisions of households, whilst
respecting the account identities as presented in
Sections 3.1 and 3.2.
Section 3.4 displays four-quarter cumulated fl ows
(transactions) for non-fi nancial corporations’
income and accumulation accounts, and
outstanding amounts for the fi nancial balance
sheet accounts, following a more analytical
presentation.
Section 3.5 shows four-quarter cumulated
fi nancial fl ows (transactions and other changes)
and outstanding amounts for the fi nancial
balance sheets of insurance corporations and
pension funds.
FINANCIAL MARKETS
The series on fi nancial market statistics for the
euro area cover the EU Member States that
had adopted the euro at the time to which the
statistics relate (changing composition), with

ECB
Monthly Bulletin
October 2009 S 87
EURO AREASTATISTICS
General notes
the exception of statistics on securities issues
(Tables 4.1 to 4.4), which relate to the Euro 16
(i.e. the Euro 15 plus Slovakia) for the whole
time series (fi xed composition).
Statistics on securities other than shares and
quoted shares (Sections 4.1 to 4.4) are produced
by the ECB using data from the ESCB and the
BIS. Section 4.5 presents MFI interest rates on
euro-denominated deposits and loans by euro
area residents. Statistics on money market
interest rates, long-term government bond
yields and stock market indices (Sections 4.6
to 4.8) are produced by the ECB using data
from wire services.
Statistics on securities issues cover securities
other than shares (debt securities), which
are presented in Sections 4.1, 4.2 and 4.3,
and quoted shares, which are presented in
Section 4.4. Debt securities are broken down
into short-term and long-term securities.
“Short-term” means securities with an original
maturity of one year or less (in exceptional
cases two years or less). Securities with a longer
maturity, or with optional maturity dates, the
latest of which is more than one year away, or
with indefi nite maturity dates, are classifi ed as
“long-term”. Long-term debt securities issued
by euro area residents are broken down further
into fi xed and variable rate issues. Fixed rate
issues consist of issues where the coupon rate
does not change during the life of the issues.
Variable rate issues include all issues where
the coupon is periodically re-fi xed by reference
to an independent interest rate or index. The
statistics on debt securities are estimated to
cover approximately 95% of total issues by euro
area residents. The euro-denominated securities
indicated in Sections 4.1, 4.2 and 4.3 also include
items expressed in national denominations of
the euro.
Section 4.1 shows securities other than shares,
by original maturity, residency of the issuer
and currency. The section presents outstanding
amounts, gross issues and net issues of
securities other than shares denominated in euro
and securities other than shares issued by euro
area residents in euro and in all currencies for
total and long-term debt securities. Net issues
differ from the changes in outstanding amounts
owing to valuation changes, reclassifi cations
and other adjustments. This section also
presents seasonally adjusted statistics, including
annualised six-month seasonally adjusted
growth rates for total and long-term debt
securities. The latter are calculated from the
seasonally adjusted index of notional stocks,
from which the seasonal effects have been
removed. See the Technical notes for details.
Section 4.2 contains a sectoral breakdown
of outstanding amounts, gross issues and net
issues for issuers resident in the euro area in line
with the ESA 95. The ECB is included in the
Eurosystem.
The total outstanding amounts for total and
long-term debt securities in column 1 of
Table 1 in Section 4.2 corresponds to the data
on outstanding amounts for total and long-term
debt securities issued by euro area residents
in column 7 of Section 4.1. The outstanding
amounts for total and long-term debt securities
issued by MFIs in column 2 of Table 1 in
Section 4.2 are broadly comparable with data for
debt securities issued, as shown on the liabilities
side of the aggregated MFI balance sheet in
column 8 of Table 2 in Section 2.1. The total
net issues for total debt securities in column 1
of Table 2 in Section 4.2 correspond to the data
on total net issues by euro area residents in
column 9 of Section 4.1. The residual difference
between long-term debt securities and total
fi xed and variable rate long-term debt securities
in Table 1 in Section 4.2 consists of zero coupon
bonds and revaluation effects.
Section 4.3 shows non-seasonally and seasonally
adjusted growth rates for debt securities
issued by euro area residents (broken down by
maturity, type of instrument, sector of the issuer
and currency), which are based on fi nancial
transactions that occur when an institutional unit
incurs or redeems liabilities. The growth rates
therefore exclude reclassifi cations, revaluations,
exchange rate variations and any other changes

ECB
Monthly Bulletin
October 2009S 88
that do not arise from transactions. The
seasonally adjusted growth rates have been
annualised for presentational purposes. See the
Technical notes for details.
Section 4.4, columns 1, 4, 6 and 8, show the
outstanding amounts of quoted shares issued
by euro area residents broken down by issuing
sector. The monthly data for quoted shares
issued by non-fi nancial corporations correspond
to the quarterly series shown in Section 3.4
(fi nancial balance sheet, quoted shares).
Section 4.4, columns 3, 5, 7 and 9, show annual
growth rates for quoted shares issued by euro
area residents (broken down by the sector
of the issuer), which are based on fi nancial
transactions that occur when an issuer issues or
redeems shares for cash excluding investments
in the issuers’ own shares. The calculation of
annual growth rates excludes reclassifi cations,
revaluations and any other changes that do not
arise from transactions.
Section 4.5 presents statistics on all the interest
rates that MFIs resident in the euro area apply to
euro-denominated deposits and loans vis-à-vis
households and non-fi nancial corporations
resident in the euro area. Euro area MFI interest
rates are calculated as a weighted average (by
corresponding business volume) of the euro area
countries’ interest rates for each category.
MFI interest rate statistics are broken down by
type of business coverage, sector, instrument
category and maturity, period of notice or initial
period of interest rate fi xation. The new MFI
interest rate statistics replace the ten transitional
statistical series on euro area retail interest rates
that have been published in the Monthly Bulletin
since January 1999.
Section 4.6 presents money market interest rates
for the euro area, the United States and Japan.
For the euro area, a broad spectrum of money
market interest rates is covered, ranging from
interest rates on overnight deposits to those on
twelve-month deposits. Before January 1999,
synthetic euro area interest rates were calculated
on the basis of national rates weighted by GDP.
With the exception of the overnight rate to
December 1998, monthly, quarterly and yearly
values are period averages. Overnight deposits
are represented by interbank deposit bid rates
up to December 1998. From January 1999,
column 1 of Section 4.6 shows the euro overnight
index average (EONIA). These are end-of-period
rates up to December 1998 and period averages
thereafter. From January 1999, interest rates on
one-, three-, six- and twelve-month deposits are
euro interbank offered rates (EURIBOR); until
December 1998, London interbank offered rates
(LIBOR) where available. For the United States
and Japan, interest rates on three-month deposits
are represented by LIBOR.
Table 4.7 shows end-of-period rates estimated
from nominal spot yield curves based on AAA-
rated euro-denominated bonds issued by euro
area central governments. The yield curves are
estimated using the Svensson model 3. Spreads
between the ten-year rates and the three-month
and two-year rates are also released. Additional
yield curves (daily releases, including charts and
tables) and the corresponding methodological
information are available at http://www.ecb.
europa.eu/stats/money/yc/html/index.en.html.
Daily data may also be downloaded.
Section 4.8 shows stock market indices for the
euro area, the United States and Japan.
PRICES, OUTPUT, DEMAND AND LABOUR MARKETS
Most of the data described in this section are
produced by the European Commission (mainly
Eurostat) and national statistical authorities. Euro
area results are obtained by aggregating data
for individual countries. As far as possible, the
data are harmonised and comparable. Statistics
on hourly labour costs, GDP and expenditure
components, value added by economic activity,
industrial production, retail sales and passenger
Svensson, L. E., “Estimating and Interpreting Forward Interest 3
Rates: Sweden 1992-1994”, Centre for Economic Policy
Research, Discussion Paper No 1051, 1994.
ECB
Monthly Bulletin
October 2009 S 89
EURO AREASTATISTICS
General notes
car registrations are adjusted for the variations
in the number of working days.
The Harmonised Index of Consumer Prices
(HICP) for the euro area (Table 1 in Section 5.1)
is available from 1995 onwards. It is based
on national HICPs, which follow the same
methodology in all euro area countries. The
breakdown by goods and services components
is derived from the classifi cation of individual
consumption by purpose (Coicop/HICP).
The HICP covers monetary expenditure by
households on fi nal consumption in the economic
territory of the euro area. The table includes
seasonally adjusted HICP data and experimental
HICP-based estimates of administered prices,
which are compiled by the ECB.
Industrial producer prices (Table 2 in
Section 5.1), industrial production, industrial
new orders, industrial turnover and retail sales
(Section 5.2) are covered by Council Regulation
(EC) No 1165/98 of 19 May 1998 concerning
short-term statistics.4 Since January 2009 the
revised classifi cation of economic activities
(NACE Revision 2), as covered by Regulation
(EC) No 1893/2006 of the European Parliament
and of the Council of 20 December 2006
establishing the statistical classifi cation
of economic activities NACE Revision 2
and amending Council Regulation (EEC)
No 3037/90, as well as certain EC Regulations
on specifi c statistical domains,5 has been applied
in the production of short-term statistics. The
breakdown by end-use of products for industrial
producer prices and industrial production is the
harmonised sub-division of industry excluding
construction (NACE Revision 2 sections B to E)
into main industrial groupings (MIGs), as defi ned
by Commission Regulation (EC) No 656/2007 of
14 June 2007 6.Industrial producer prices refl ect
the ex-factory gate prices of producers. They
include indirect taxes except VAT and other
deductible taxes. Industrial production refl ects
the value added of the industries concerned.
The two non-energy commodity price indices
shown in Table 3 in Section 5.1 are compiled
with the same commodity coverage but using
two different weighting schemes: one based on
the respective commodity imports of the euro
area (columns 2-4), and the other (columns 5-7)
based on estimated euro area domestic demand, or
“use”, taking into account information on imports,
exports and the domestic production of each
commodity (ignoring for simplicity inventories,
which are assumed to be relatively stable over the
observed period). The import-weighted commodity
price index is appropriate for analysing external
developments, while the use-weighted index is
suitable for the specifi c purpose of analysing
international commodity price pressures on euro
area infl ation. The use-weighted commodity price
indices are experimental data. For more details on
compilation of the ECB commodity price indices,
refer to Box 1 in the December 2008 issue of the
Monthly Bulletin.
The labour cost indices (Table 5 in Section 5.1)
measure the changes in labour costs per hour
worked in industry (including construction) and
market services. Their methodology is laid down
in Regulation (EC) No 450/2003 of the European
Parliament and of the Council of 27 February
2003 concerning the labour cost index7 and in
the implementing Commission Regulation (EC)
No 1216/2003 of 7 July 2003.8 A breakdown of
hourly labour costs for the euro area is available
by labour cost component (wages and salaries,
and employers’ social contributions plus
employment-related taxes paid by the employer
less subsidies received by the employer) and by
economic activity. The ECB calculates the
indicator of negotiated wages (memo item in
Table 3 of Section 5.1) on the basis of non-
harmonised, national-defi nition data.
Unit labour cost components (Table 4 in
Section 5.1), GDP and its components (Tables 1
and 2 in Section 5.2), GDP defl ators (Table 3 in
Section 5.1) and employment statistics (Table 1
in Section 5.3) are results of the ESA 95
quarterly national accounts.
OJ L 162, 5.6.1998, p. 1.4
OJL L 393, 30.12.2006, p. 1 5
OJ L 155, 15.6.2007, p. 3.6
OJ L 69, 13.3.2003, p. 1.7
OJ L 169, 8.7.2003, p. 37.8

ECB
Monthly Bulletin
October 2009S 90
Industrial new orders (Table 4 in Section 5.2)
measure the orders received during the reference
period and cover industries working mainly on
the basis of orders – in particular the textile, pulp
and paper, chemical, metal, capital goods and
durable consumer goods industries. The data are
calculated on the basis of current prices.
Indices for turnover in industry and for the
retail trade (Table 4 in Section 5.2) measure
the turnover, including all duties and taxes
with the exception of VAT, invoiced during the
reference period. Retail trade turnover covers all
retail trade (excluding sales of motor vehicles
and motorcycles), except automotive fuel. New
passenger car registrations cover registrations
of both private and commercial passenger cars.
The series for the euro area excludes Cyprus
and Malta.
Qualitative business and consumer survey data
(Table 5 in Section 5.2) draw on the European
Commission Business and Consumer Surveys.
Unemployment rates (Table 2 in Section 5.3)
conform to International Labour Organization
(ILO) guidelines. They refer to persons actively
seeking work as a share of the labour force, using
harmonised criteria and defi nitions. The labour
force estimates underlying the unemployment rate
are different from the sum of the employment and
unemployment levels published in Section 5.3.
GOVERNMENT FINANCE
Sections 6.1 to 6.5 show the general government
fi scal position in the euro area. The data are
mainly consolidated and are based on the ESA 95
methodology. The annual euro area aggregates
in Sections 6.1 to 6.3 are compiled by the ECB
on the basis of harmonised data provided by the
NCBs, which are regularly updated. The defi cit
and debt data for the euro area countries may
therefore differ from those used by the European
Commission within the excessive defi cit
procedure. The quarterly euro area aggregates in
Sections 6.4 and 6.5 are compiled by the ECB on
the basis of Eurostat and national data.
Section 6.1 presents annual fi gures on general
government revenue and expenditure on the basis
of defi nitions laid down in Commission Regulation
(EC) No 1500/2000 of 10 July 2000 9 amending
the ESA 95. Section 6.2 shows details of general
government gross consolidated debt at nominal
value in line with the Treaty provisions on the
excessive defi cit procedure. Sections 6.1 and 6.2
include summary data for the individual euro area
countries owing to their importance in the
framework of the Stability and Growth Pact. The
defi cits/surpluses presented for the individual euro
area countries correspond to excessive defi cit
procedure B.9, as defi ned by Commission
Regulation (EC) No 351/2002 of 25 February 2002
amending Council Regulation (EC) No 3605/93
as regards references to the ESA 95. Section 6.3
presents changes in general government debt. The
difference between the change in the government
debt and the government defi cit – the defi cit-debt
adjustment – is mainly explained by government
transactions in fi nancial assets and by foreign
exchange valuation effects. Section 6.4 presents
quarterly fi gures on general government revenue
and expenditure on the basis of defi nitions laid
down in Regulation (EC) No 1221/2002 of the
European Parliament and of the Council of
10 June 2002 on quarterly non-fi nancial accounts
for general government 10. Section 6.5 presents
quarterly fi gures on gross consolidated government
debt, the defi cit-debt adjustment and the
government borrowing requirement. These fi gures
are compiled using data provided by the Member
States under Regulations (EC) No 501/2004 and
No 222/2004 and data provided by the NCBs.
EXTERNAL TRANSACTIONS AND POSITIONS
The concepts and defi nitions used in balance of
payments (b.o.p.) and international investment
position (i.i.p.) statistics (Sections 7.1 to 7.4) are
generally in line with the IMF Balance of
Payments Manual (fi fth edition, October 1993),
the ECB Guideline of 16 July 2004 on the
statistical reporting requirements of the ECB
OJ L 172, 12.7.2000, p. 3. 9
OJ L 179, 9.7.2002, p. 1.10

ECB
Monthly Bulletin
October 2009 S 91
EURO AREASTAT IST ICS
General notes
(ECB/2004/15)11 and the amending ECB
Guideline of 31 May 2007 (ECB/2007/3)12.
Additional references about the methodologies
and sources used in the euro area b.o.p. and i.i.p.
statistics can be found in the ECB publication
entitled “European Union balance of payments/
international investment position statistical
methods” (May 2007), and in the following
Task Force reports: “Portfolio investment
collection systems” (June 2002), “Portfolio
investment income” (August 2003) and “Foreign
direct investment” (March 2004), all of which
can be downloaded from the ECB’s website. In
addition, the report by the ECB/European
Commission (Eurostat) Task Force on Quality
of balance of payments and international
investment position statistics (June 2004) is
available on the website of the Committee on
Monetary, Financial and Balance of Payments
Statistics (www.cmfb.org). The annual quality
report on the euro area b.o.p./i.i.p., which is
based on the Task Force’s recommendations, is
available on the ECB’s website.
The tables in Sections 7.1 and 7.4 follow the
sign convention in the IMF Balance of Payments
Manual, i.e. surpluses in the current account and
in the capital account have a plus sign, while
in the fi nancial account a plus sign denotes an
increase in liabilities or a decrease in assets. In
the tables in Section 7.2, both credit and debit
transactions are presented with a plus sign.
Furthermore, starting with the February 2008
issue of the Monthly Bulletin, the tables in
Section 7.3 have been restructured in order
to allow the data on balance of payments, the
international investment position and related
growth rates to be presented together; in the new
tables, transactions in assets and liabilities that
correspond to increases in positions are shown
with a plus sign.
The euro area b.o.p. is compiled by the ECB.
Recent monthly fi gures should be regarded as
provisional. Data are revised when fi gures for
the following month and/or the detailed quarterly
b.o.p. are published. Earlier data are revised
periodically, or as a result of methodological
changes in the compilation of the source data.
In Section 7.2, Table 1 also contains seasonally
adjusted data for the current account. Where
appropriate, the adjustment also covers
working-day, leap-year and/or Easter effects.
Table 3 in Section 7.2 and Table 8 in Section 7.3
present a breakdown of the euro area b.o.p. and
i.i.p. vis-à-vis main partner countries individually
or as a group, distinguishing between EU Member
States outside the euro area and countries
or areas outside the European Union. The
breakdown also shows transactions and positions
vis-à-vis EU institutions (which, apart from the
ECB, are treated statistically as outside the euro
area, regardless of their physical location) and,
for some purposes, also offshore centres and
international organisations. The breakdown does
not cover transactions or positions in portfolio
investment liabilities, fi nancial derivatives and
international reserves. In addition, separate data
are not provided for investment income payable
to Brazil, mainland China, India and Russia.
The geographical breakdown is described in the
article entitled “Euro area balance of payments
and international investment position vis-à-vis
main counterparts” in the February 2005 issue of
the Monthly Bulletin.
The data on the euro area b.o.p. fi nancial
account and i.i.p. in Section 7.3 are based on
transactions and positions vis-à-vis non-residents
of the euro area, considering the euro area as a
single economic entity (see also Box 9 in the
December 2002 issue of the Monthly Bulletin,
Box 5 in the January 2007 issue of the Monthly
Bulletin and Box 6 in the January 2008 issue
of the Monthly Bulletin). The i.i.p. is valued
at current market prices, with the exception of
direct investment, where book values are used for
unquoted shares, and other investments (e.g. loans
and deposits). The quarterly i.i.p. is compiled on
the basis of the same methodological framework
as the annual i.i.p. As some data sources are not
available on a quarterly basis (or are available
with a delay), the quarterly i.i.p. is partly
estimated on the basis of fi nancial transactions,
asset prices and foreign exchange developments.
OJ L 354, 30.11.2004, p. 34.11
OJ L 159, 20.6.2007, p. 48.12

ECB
Monthly Bulletin
October 2009S 92
Table 1 in Section 7.3 summarises the i.i.p. and
fi nancial transactions in the euro area b.o.p. The
breakdown of the change in the annual i.i.p.
is obtained by applying a statistical model to
the i.i.p. changes other than transactions with
information from the geographical breakdown
and currency composition of assets and
liabilities, as well as price indices for different
fi nancial assets. In this table, Columns 5 and
6 refer to direct investment by resident units
abroad and direct investment by non-resident
units in the euro area.
In Table 5 in Section 7.3, the breakdown into
“loans” and “currency and deposits” is based
on the sector of the non-resident counterpart,
i.e. assets vis-à-vis non-resident banks are
classifi ed as deposits, whereas assets vis-à-vis
other non-resident sectors are classifi ed as loans.
This breakdown follows the distinction made in
other statistics, such as the MFI consolidated
balance sheet, and conforms to the IMF Balance
of Payments Manual.
The outstanding amounts of the Eurosystem’s
international reserves and related assets and
liabilities are shown in Section 7.3, Table 7. These
fi gures are not fully comparable with those of the
Eurosystem’s weekly fi nancial statement owing
to differences in coverage and valuation. The data
in Table 7 are in line with the recommendations
for the template on international reserves and
foreign currency liquidity. Changes in the gold
holdings of the Eurosystem (column 3) are due to
transactions in gold within the terms of the Central
Bank Gold Agreement of 26 September 1999,
which was updated on 8 March 2004. More
information on the statistical treatment of the
Eurosystem’s international reserves can be found
in a publication entitled “Statistical treatment
of the Eurosystem’s international reserves”
(October 2000), which can be downloaded from
the ECB’s website. The website also contains
more comprehensive data in accordance with the
template on international reserves and foreign
currency liquidity.
Section 7.4 contains a monetary presentation
of the euro area balance of payments, in which
the balance of payments transactions mirror the
transactions in the external counterpart to M3. In
portfolio investment liabilities (Columns 5 and 6),
the transactions include sales and purchases of
equity and debt securities issued by MFIs in the
euro area, excluding shares of money market
funds and debt securities with a maturity of
up to two years. A methodological note on the
monetary presentation of the euro area balance
of payments is available in the “Statistics”
section of the ECB’s website. See also Box 1 in
the June 2003 issue of the Monthly Bulletin.
Section 7.5 shows data on euro area external
trade in goods. The source is Eurostat. Value
data and volume indices are seasonally and
working day-adjusted. The breakdown by
product group in columns 4 to 6 and 9 to 11
of Table 1 in Section 7.5 is in line with the
classifi cation by Broad Economic Categories
and corresponds to the basic classes of goods in
the System of National Accounts. Manufactured
goods (columns 7 and 12) and oil (column 13)
are in line with the SITC Rev. 4 defi nition. The
geographical breakdown (Table 3 in Section 7.5)
shows main trading partners individually or in
regional groups. China excludes Hong Kong.
On account of differences in defi nitions,
classifi cation, coverage and time of recording,
external trade data, in particular for imports,
are not fully comparable with the goods item in
the b.o.p. statistics (Sections 7.1 and 7.2). Part
of the difference arises from the inclusion of
insurance and freight services in the recording
of goods imported in external trade data.
Industrial import prices and industrial producer
export prices (or industrial output prices for
the non-domestic market) shown in Table 2
in Section 7.5 were introduced by Regulation
(EC) No 1158/2005 of the European Parliament
and of the Council of 6 July 2005 amending
Council Regulation (EC) No 1165/98, which is
the principal legal basis for short-term statistics.
The industrial import price index covers
industrial products imported from outside the
euro area under sections B to E of the Statistical
Classifi cation of Products by Activity in the
European Economic Community (CPA) and

ECB
Monthly Bulletin
October 2009 S 93
EURO AREASTATISTICS
General notes
all institutional sectors of the importers except
households, governments and non-profi t
institutions. It refl ects the cost, insurance and
freight (c.i.f.) price excluding import duties
and taxes, and refers to the actual transactions
in euro recorded at the point when ownership
of the goods is being transferred. The industrial
producer export prices cover all industrial
products exported directly by euro area
producers to the extra-euro area market under
sections B to E of NACE Revision 2. Exports
from wholesalers and re-exports are not covered.
The indices refl ect the free on board (f.o.b.) price
expressed in euro and calculated at the euro area
frontiers, including any indirect taxes except
VAT and other deductible taxes. Industrial import
prices and industrial producer export prices are
available by Main Industrial Groupings (MIGs)
as defi ned by Commission Regulation (EC)
No 656/2007 of 14 June 2007. For more details,
refer to Box 11 in the December 2008 issue of
the Monthly Bulletin.
EXCHANGE RATES
Section 8.1 shows nominal and real effective
exchange rate (EER) indices for the euro,
calculated by the ECB on the basis of weighted
averages of bilateral exchange rates of the
euro against the currencies of the euro area’s
trading partners. A positive change denotes an
appreciation of the euro. Weights are based on
trade in manufactured goods with the trading
partners in the periods 1995-1997 and 1999-
2001, and are calculated to account for third-
market effects. The EER indices result from the
linking at the beginning of 1999 of the indices
based on 1995-1997 weights to those based
on 1999-2001 weights. The EER-21 group of
trading partners is composed of the 11 non-
euro area EU Member States plus Australia,
Canada, China, Hong Kong, Japan, Norway,
Singapore, South Korea, Switzerland and the
United States. The EER-41 group includes the
EER-21 and the following countries: Algeria,
Argentina, Brazil, Chile, Croatia, Iceland,
India, Indonesia, Israel, Malaysia, Mexico,
Morocco, New Zealand, the Philippines,
Russia, South Africa, Taiwan, Thailand, Turkey
and Venezuela. Real EERs are calculated using
consumer price indices, producer price indices,
gross domestic product defl ators, unit labour
costs in manufacturing and unit labour costs in
the total economy.
For more detailed information on the
calculation of the EERs, see Box 8 entitled “The
effective exchange rates of the euro following
the recent euro area and EU enlargements”
in the March 2007 issue of the Monthly
Bulletin and the ECB’s Occasional Paper No 2
(“The effective exchange rates of the euro”
by Luca Buldorini, Stelios Makrydakis and
Christian Thimann, February 2002), which can
be downloaded from the ECB’s website.
The bilateral rates shown in Section 8.2 are
monthly averages of those published daily as
reference rates for these currencies. The reference
rate of the Indian rupee vis-à-vis the euro has
been inserted for the fi rst time in column 26.
However data prior to 1 January 2009 are to be
considered as indicative rates
DEVELOPMENTS OUTSIDE THE EURO AREA
Statistics on other EU Member States (Section 9.1)
follow the same principles as those for data relating
to the euro area. The data for the United States and
Japan contained in Section 9.2 are obtained from
national sources.


ECB
Monthly Bulletin
October 2009
11 JANUARY AND 8 FEBRUARY 2007
The Governing Council of the ECB decides
that the minimum bid rate on the main
refi nancing operations and the interest rates on
the marginal lending facility and the deposit
facility will remain unchanged at 3.50%,
4.50% and 2.50% respectively.
8 MARCH 2007
The Governing Council of the ECB decides
to increase the minimum bid rate on the main
refi nancing operations by 25 basis points to
3.75%, starting from the operation to be settled
on 14 March 2007. In addition, it decides to
increase the interest rates on both the marginal
lending facility and the deposit facility by
25 basis points, to 4.75% and 2.75%, both with
effect from 14 March 2007.
12 APRIL AND 10 MAY 2007
The Governing Council of the ECB decides
that the minimum bid rate on the main
refi nancing operations and the interest rates on
the marginal lending facility and the deposit
facility will remain unchanged at 3.75%, 4.75%
and 2.75% respectively.
6 JUNE 2007
The Governing Council of the ECB decides
to increase the minimum bid rate on the main
refi nancing operations by 25 basis points to
4%, starting from the operation to be settled on
13 June 2007. In addition, it decides to increase
by 25 basis points the interest rates on both
the marginal lending facility and the deposit
facility, to 5% and 3% respectively, with effect
from 13 June 2007.
5 JULY, 2 AUGUST, 6 SEPTEMBER, 4 OCTOBER,
8 NOVEMBER AND 6 DECEMBER 2007, AND
10 JANUARY, 7 FEBRUARY, 6 MARCH, 10 APRIL,
8 MAY AND 5 JUNE 2008
The Governing Council of the ECB decides that
the minimum bid rate on the main refi nancing
operations and the interest rates on the marginal
lending facility and the deposit facility will
remain unchanged at 4.00%, 5.00% and 3.00%
respectively.
3 JULY 2008
The Governing Council of the ECB decides
to increase the minimum bid rate on the main
refi nancing operations by 25 basis points
to 4.25%, starting from the operation to be
settled on 9 July 2008. In addition, it decides
to increase by 25 basis points the interest
rates on both the marginal lending facility
and the deposit facility, to 5.25% and 3.25%
respectively, with effect from 9 July 2008.
7 AUGUST, 4 SEPTEMBER AND
2 OCTOBER 2008
The Governing Council of the ECB decides that
the minimum bid rate on the main refi nancing
operations and the interest rates on the marginal
lending facility and the deposit facility will
remain unchanged at 4.25%, 5.25% and 3.25%
respectively.
8 OCTOBER 2008
The Governing Council of the ECB decides
to decrease the minimum bid rate on the main
refi nancing operations by 50 basis points to
3.75%, starting from the operations to be settled
on 15 October 2008. In addition, it decides to
decrease by 50 basis points the interest rates on
I
ANNEXES
CHRONOLOGY OF MONETARY POLICY MEASURES OF THE EUROSYSTEM1
The chronology of monetary policy measures taken by the 1
Eurosystem between 1999 and 2006 can be found in the ECB’s
Annual Report for the respective years.

ECB
Monthly Bulletin
October 2009II
both the marginal lending facility and the deposit
facility, to 4.75% and 2.75% respectively, with
immediate effect. Moreover, the Governing
Council decides that, as from the operation settled
on 15 October, the weekly main refi nancing
operations will be carried out through a fi xed-
rate tender procedure with full allotment at the
interest rate on the main refi nancing operation.
Furthermore, as of 9 October, the ECB will
reduce the corridor of standing facilities from
200 basis points to 100 basis points around the
interest rate on the main refi nancing operation.
The two measures will remain in place for as
long as needed, and at least until the end of the
fi rst maintenance period of 2009, on 20 January.
15 OCTOBER 2008
The Governing Council of the ECB decides to
further expand the collateral framework and
enhance the provision of liquidity. To do so, the
Governing Council decides: (i) to expand the
list of assets eligible as collateral in Eurosystem
credit operations, with this expansion remaining
in force until the end of 2009, (ii) to enhance
the provision of longer-term refi nancing, with
effect from 30 October 2008 and until the end of
the fi rst quarter of 2009, and (iii) to provide US
dollar liquidity through foreign exchange swaps.
6 NOVEMBER 2008
The Governing Council of the ECB decides
to decrease the interest rate on the main
refi nancing operations by 50 basis points to
3.25%, starting from the operations to be settled
on 12 November 2008. In addition, it decides to
decrease by 50 basis points the interest rates on
both the marginal lending facility and the deposit
facility, to 3.75% and 2.75% respectively, with
effect from 12 November 2008.
4 DECEMBER 2008
The Governing Council of the ECB decides to
decrease the interest rate on the main refi nancing
operations of the Eurosystem by 75 basis points
to 2.50%, starting from the operations to be
settled on 10 December 2008. In addition,
it decides to decrease by 75 basis points the
interest rates on both the marginal lending
and the deposit facility to 3.00% and 2.00%
respectively, with effect from 10 December
2008.
18 DECEMBER 2008
The Governing Council of the ECB decides
that the main refi nancing operations will
continue to be carried out through a fi xed rate
tender procedure with full allotment beyond the
maintenance period ending on 20 January 2009.
This measure will be in place for as long as
needed, and at least until the last allotment of the
third maintenance period in 2009 on 31 March.
Moreover, as of 21 January 2009, the corridor of
standing facility rates, which on 9 October 2008
was reduced to 100 basis points around the
prevailing interest rate of the main refi nancing
operation, will be be re-widened symmetrically
to 200 basis points.
15 JANUARY 2009
The Governing Council of the ECB decides
to decrease the interest rate on the main
refi nancing operations by 50 basis points to
2.00%, starting from the operations to be settled
on 21 January 2009. In addition, it decides that
the interest rates on the marginal lending and
the deposit facility will be 3.00% and 1.00%
respectively, with effect from 21 January 2009,
in line with the decision of 18 December 2008.
5 FEBRUARY 2009
The Governing Council of the ECB decides
that the interest rate on the main refi nancing
operations and the interest rates on the marginal
lending facility and the deposit facility will
remain unchanged at 2.00%, 3.00% and 1.00%
respectively.

ECB
Monthly Bulletin
October 2009
CHRONOLOGY
III
5 MARCH 2009
The Governing Council of the ECB decides
to decrease the interest rate on the main
refi nancing operations by 50 basis points to
1.50%, starting from the operations to be settled
on 11 March 2009. In addition, it decides that
the interest rates on the marginal lending and
the deposit facility will be 2.50% and 0.50%
respectively, with effect from 11 March 2009.
Moreover, the Governing Council decides
to continue the fi xed rate tender procedure
with full allotment for all main refi nancing
operations, special-term refi nancing operations
and supplementary and regular longer-term
refi nancing operations for as long as needed,
and in any case beyond the end of 2009. In
addition, the Governing Council decides
to continue with the current frequency and
maturity profi le of supplementary longer-
term refi nancing operations and special-term
refi nancing operations for as long as needed,
and in any case beyond the end of 2009.
2 APRIL 2009
The Governing Council of the ECB decides
to decrease the interest rate on the main
refi nancing operations by 25 basis points to
1.25%, starting from the operations to be settled
on 8 April 2009. In addition, it decides that
the interest rates on the marginal lending and
the deposit facility will be 2.25% and 0.25%
respectively, with effect from 8 April 2009.
7 MAY 2009
The Governing Council of the ECB decides to
decrease the interest rate on the main refi nancing
operations by 25 basis points to 1.00%, starting
from the operation to be settled on 13 May
2009. In addition, it decides to decrease the
interest rate on the marginal lending facility
by 50 basis points to 1.75% with effect from
13 May 2009, and to leave the interest rate
on the deposit facility unchanged at 0.25%.
In addition, the Governing Council of the ECB
decides to proceed with its enhanced credit
support approach. In particular, it decides that
the Eurosystem will conduct liquidity-providing
longer-term refi nancing operations with a
maturity of one year as fi xed rate tender
procedure with full allotment. In addition, it
decides in principle that the Eurosystem will
purchase euro-denominated covered bonds
issued in the euro area.
4 JUNE 2009
The Governing Council of the ECB decides
that the interest rate on the main refi nancing
operations and the interest rates on the marginal
lending facility and the deposit facility will
remain unchanged at 1.00%, 1.75% and 0.25%
respectively. In addition, the Governing Council
of the ECB decides upon the technical modalities
related to the purchase of euro-denominated
covered bonds issued in the euro area decided
on 7 May 2009.
2 JULY, 6 AUGUST, 3 SEPTEMBER AND
8 OCTOBER 2009
The Governing Council of the ECB decides
that the interest rate on the main refi nancing
operations and the interest rates on the marginal
lending facility and the deposit facility will
remain unchanged at 1.00%, 1.75% and 0.25%
respectively.


ECB
Monthly Bulletin
October 2009 V
DOCUMENTS PUBLISHED BY THE EUROPEAN CENTRAL BANK SINCE 2008
This list is designed to inform readers about selected documents published by the European Central
Bank since January 2008. For Working Papers, which as of January 2009 (from Working Paper
No 989 onwards) are available online only, the list only refers to publications released between July
and September 2009. Unless otherwise indicated, hard copies can be obtained or subscribed to free
of charge, stock permitting, by contacting [email protected].
For a complete list of documents published by the European Central Bank and by the European
Monetary Institute, please visit the ECB’s website (http://www.ecb.europa.eu).
ANNUAL REPORT
“Annual Report 2007”, April 2008.
“Annual Report 2008”, April 2009.
CONVERGENCE REPORT
“Convergence Report May 2008”.
MONTHLY BULLETIN SPECIAL EDITION
“10th anniversary of the ECB 1998-2008”, May 2008.
MONTHLY BULLETIN ARTICLES
“Productivity developments and monetary policy”, January 2008.
“Globalisation, trade and the euro area macroeconomy”, January 2008.
“The Eurosystem’s experience with forecasting autonomous factors and excess reserves”,
January 2008.
“The analysis of the euro money market from a monetary policy perspective”, February 2008.
“Securitisation in the euro area”, February 2008.
“The new euro area yield curves”, February 2008.
“Business investment in the euro area and the role of fi rms’ fi nancial positions”, April 2008.
“Short-term forecasts of economic activity in the euro area”, April 2008.
“Developments in the EU arrangements for fi nancial stability”, April 2008.
“Price stability and growth”, May 2008.
“The Eurosystem’s open market operations during the recent period of fi nancial market volatility”,
May 2008.
“One monetary policy and many fi scal policies: ensuring a smooth functioning of EMU”,
July 2008.
“Euro area trade in services: some key stylised facts”, July 2008.
“The Eurosystem as a provider of technical assistance to EU neighbouring regions”, July 2008.
“The external dimension of monetary analysis”, August 2008.
“The role of banks in the monetary policy transmission mechanism”, August 2008.
“Ten years of the Stability and Growth Pact”, October 2008.
“Cross-border bank mergers & acquisitions and institutional investors”, October 2008.
“Monitoring labour cost developments across euro area countries”, November 2008.
“Valuing stock markets and the equity risk premium”, November 2008.
“Ten years of TARGET and the launch of TARGET2”, November 2008.
“Housing wealth and private consumption in the euro area”, January 2009.
“Foreign asset accumulation by authorities in emerging markets”, January 2009.
“New survey evidence on wage setting in Europe”, February 2009.
ECB
Monthly Bulletin
October 2009VI
“Assessing global trends in protectionism”, February 2009.
“The external fi nancing of households and non-fi nancial corporations: a comparison of the euro
area and the United States”, April 2009.
“Revisions to GDP estimates in the euro area”, April 2009.
“The functional composition of government spending in the European Union”, April 2009.
“Expectations and the conduct of monetary policy”, May 2009.
“Five years of EU membership”, May 2009.
“Credit rating agencies: developments and policy issues”, May 2009.
“The impact of government support to the banking sector on euro area public fi nances”, July 2009.
“The implementation of monetary policy since August 2007”, July 2009.
“Rotation of voting rights in the Governing Council of the ECB”, July 2009.
“Housing fi nance in the euro area”, August 2009.
“Recent developments in the retail bank interest rate pass-through in the euro area”, August 2009.
“Monetary policy and loan supply in the euro area”, October 2009.
“Recent developments in the balance sheets of the Eurosystem, the Federal Reserve System and
the Bank of Japan”, October 2009.
“Financial development in emerging economies – stock-taking and policy implications”,
October 2009.
STATISTICS POCKET BOOK
Available monthly since August 2003.
LEGAL WORKING PAPER SERIES
6 “The legal implications of the prudential supervisory assessment of bank mergers and
acquisitions under EU law” by S. Kerjean, June 2008.
7 “Electronic money institutions: current trends, regulatory issues and future prospects”
by P. Athanassiou and N. Mas-Guix, July 2008.
8 “National rescue measures in response to the current fi nancial crisis” by A. Petrovic and
R. Tutsch, July 2009.
OCCASIONAL PAPER SERIES
78 “A framework for assessing global imbalances” by T. Bracke, M. Bussière, M. Fidora and
R. Straub, January 2008.
79 “The workings of the Eurosystem: monetary policy preparations and decision-making –
selected issues” by P. Moutot, A. Jung and F. P. Mongelli, January 2008.
80 “China’s and India’s roles in global trade and fi nance: twin titans for the new millennium?”
by M. Bussière and A. Mehl, January 2008.
81 “Measuring fi nancial integration in new EU Member States” by M. Baltzer, L. Cappiello,
R. A. De Santis and S. Manganelli, March 2008.
82 “The sustainability of China’s exchange rate policy and capital account liberalisation”
by L. Cappiello and G. Ferrucci, March 2008.
83 “The predictability of monetary policy” by T. Blattner, M. Catenaro, M. Ehrmann,
R. Strauch and J. Turunen, March 2008.
84 “Short-term forecasting of GDP using large monthly datasets: a pseudo real-time forecast
evaluation exercise” by G. Rünstler, K. Barhoumi, R. Cristadoro, A. Den Reijer,
A. Jakaitiene, P. Jelonek, A. Rua, K. Ruth, S. Benk and C. Van Nieuwenhuyze, May 2008.

ECB
Monthly Bulletin
October 2009
DOCUMENTSPUBLISHED
VII
85 “Benchmarking the Lisbon strategy” by D. Ioannou, M. Ferdinandusse, M. Lo Duca
and W. Coussens, June 2008.
86 “Real convergence and the determinants of growth in EU candidate and potential candidate
countries: a panel data approach” by M. M. Borys, É. K. Polgár and A. Zlate, June 2008.
87 “Labour supply and employment in the euro area countries: developments and challenges”,
by a Task Force of the Monetary Policy Committee of the European System of Central
Banks, June 2008.
88 “Real convergence, fi nancial markets, and the current account – emerging Europe versus
emerging Asia” by S. Herrmann and A. Winkler, June 2008.
89 “An analysis of youth unemployment in the euro area” by R. Gomez-Salvador and
N. Leiner-Killinger, June 2008.
90 “Wage growth dispersion across the euro area countries: some stylised facts”
by M. Andersson, A. Gieseck, B. Pierluigi and N. Vidalis, July 2008.
91 “The impact of sovereign wealth funds on global fi nancial markets” by R. Beck and
M. Fidora, July 2008.
92 “The Gulf Cooperation Council countries: economic structures, recent developments and
role in the global economy” by M. Sturm, J. Strasky, P. Adolf and D. Peschel, July 2008.
93 “Russia, EU enlargement and the euro” by Z. Polański and A. Winkler, August 2008.
94 “The changing role of the exchange rate in a globalised economy” by F. di Mauro, R. Rüffer
and I. Bunda, September 2008.
95 “Financial stability challenges in candidate countries managing the transition to deeper and
more market-oriented fi nancial systems” by the International Relations Committee expert
group on fi nancial stability challenges in candidate countries, September 2008.
96 “The monetary presentation of the euro area balance of payments” by L. Bê Duc,
F. Mayerlen and P. Sola, September 2008.
97 “Globalisation and the competitiveness of the euro area” by F. di Mauro and K. Forster,
September 2008.
98 “Will oil prices decline over the long run?” by R. Kaufmann, P. Karadeloglou and
F. di Mauro, October 2008.
99 “The ECB and IMF indicators for the macro-prudential analysis of the banking sector:
a comparison of the two approaches” by A. M. Agresti, P. Baudino and P. Poloni,
November 2008.
100 “Survey data on household fi nance and consumption: research summary and policy use” by the
Eurosystem Household Finance and Consumption Network, January 2009.
101 “Housing fi nance in the euro area” by the Task Force of the Monetary Policy Committee of
the European System of Central Banks, March 2009.
102 “Domestic fi nancial development in emerging economies: evidence and implications”
by E. Dorrucci, A. Meyer-Cirkel and D. Santabárbara, April 2009.
103 “Transnational governance in global fi nance: the principles for stable capital fl ows and fair
debt restructuring in emerging markets” by R. Ritter, April 2009.
104 “Fiscal policy challenges in oil-exporting countries: a review of key issues” by M. Sturm,
F. Gurtner and J. González Alegre, June 2009.
105 “Flow-of-funds analysis at the ECB – framework and applications” by L. Bê Duc
and G. Le Breton, August 2009.
106 “Monetary policy strategy in a global environment” by P. Moutot and G. Vitale,
August 2009.
ECB
Monthly Bulletin
October 2009
RESEARCH BULLETIN
“Research Bulletin”, No 7, June 2008.
“Research Bulletin”, No 8, March 2009.
WORKING PAPER SERIES
1066 “Universal banks and corporate control: evidence from the global syndicated loan market”
by M. A. Ferreira and P. Matos, July 2009.
1067 “The dynamic effects of shocks to wages and prices in the United States and the euro area”
by R. Duarte and C. R. Marques, July 2009.
1068 “Asset price misalignments and the role of money and credit” by D. Gerdesmeier,
H.-E. Reimers and B. Roffi a, July 2009.
1069 “Housing fi nance and monetary policy” by A. Calza, T. Monacelli and L. Stracca, July 2009.
1070 “Monetary policy committees: meetings and outcomes” by J. M. Berk and B. K. Bierut,
July 2009.
1071 “Booms and busts in housing markets: determinants and implications” by L. Agnello and
L. Schuknecht, July 2009.
1072 “How important are common factors in driving non-fuel commodity prices? A dynamic
factor analysis” by I. Vansteenkiste, July 2009.
1073 “Can non-linear real shocks explain the persistence of PPP exchange rate disequilibria?”
by T. Peltonen, M. Sager and A. Popescu, July 2009.
1074 “Wages are fl exible, aren’t they? Evidence from monthly micro wage data” by P. Lünnemann
and L. Wintr, July 2009.
1075 “Bank risk and monetary policy” by Y. Altunbas, L. Gambacorta and D. Marqués-Ibáñez,
July 2009.
1076 “Optimal monetary policy in a new Keynesian model with habits in consumption”
by C. Leith, I. Moldovan and R. Rossi, July 2009.
1077 “The reception of public signals in fi nancial markets – what if central bank communication
becomes stale?” by M. Ehrmann and D. Sondermann, August 2009.
1078 “On the real effects of private equity investment: evidence from new business creation”
by A. Popov and P. Roosenboom, August 2009.
1079 “EMU and European government bond market integration” by P. Abad, H. Chuliá,
and M. Gómez-Puig, August 2009.
1080 “Productivity and job fl ows: heterogeneity of new hires and continuing jobs in the business
cycle” by J. Kilponen and J. Vanhala, August 2009.
1081 “Liquidity premia in German government bonds” by J. W. Ejsing and J. Sihvonen,
August 2009.
1082 “Disagreement among forecasters in G7 countries” by J. Dovern, U. Fritsche
and J. Slacalek, August 2009.
1083 “Evaluating microfoundations for aggregate price rigidities: evidence from matched
fi rm-level data on product prices and unit labour cost” by M. Carlsson
and O. Nordström Skansz, August 2009.
1084 “How are fi rms’ wages and prices linked: survey evidence in Europe” by M. Druant,
S. Fabiani, G. Kezdi, A. Lamo, F. Martins and R. Sabbatini, August 2009.
1085 “An empirical study on the decoupling movements between corporate bonds and
CDS spreads” by I. Alexopoulou, M. Andersson and O. M. Georgescu, August 2009.
1086 “Euro area money demand: empirical evidence on the role of equity and labour markets”
by G. J. de Bondt, September 2009.
VIII

ECB
Monthly Bulletin
October 2009
DOCUMENTSPUBLISHED
IX
1087 “Modelling global trade fl ows: results from a GVAR model” by M. Bussière, A. Chudik
and G. Sestieri, September 2009.
1088 “Infl ation perceptions and expectations in the euro area: the role of news” by C. Badarinza
and M. Buchmann, September 2009.
1089 “The effects of monetary policy on unemployment dynamics under model uncertainty:
evidence from the United States and the euro area” by C. Altavilla and M. Ciccarelli,
September 2009.
1090 “New Keynesian versus old Keynesian government spending multipliers” by J. F. Cogan,
T. Cwik, J. B. Taylor and V. Wieland, September 2009.
1091 “Money talks” by M. Hoerova, C. Monnet and T. Temzelides, September 2009.
1092 “Infl ation and output volatility under asymmetric incomplete information” by G. Carboni
and M. Ellison, September 2009.
1093 “Determinants of government bond spreads in new EU countries” by I. Alexopoulou,
I. Bunda and A. Ferrando, September 2009.
1094 “Signals from housing and lending booms” by I. Bunda and M. Ca’Zorzi, September 2009.
1095 “Memories of high infl ation” by M. Ehrmann and P. Tzamourani, September 2009.
OTHER PUBLICATIONS
“Bond markets and long-term interest rates in non-euro area Member States of the European
Union”, January 2008 (online only).
“Oversight framework for card payment schemes – standards”, January 2008 (online only).
“The role of money – money and monetary policy in the twenty-fi rst century – proceedings of the
Fourth ECB Central Banking Conference 2006”, February 2008.
“Euro area balance of payments and international investment position statistics – Annual quality
report”, March 2008 (online only).
“ECB statistics quality framework (SQF)”, April 2008 (online only).
“Quality assurance procedures within the ECB statistical function”, April 2008 (online only).
“ECB statistics – an overview”, April 2008 (online only).
“TARGET Annual Report 2007”, April 2008 (online only).
“Financial integration in Europe”, April 2008.
“Financial Stability Review”, June 2008.
“Labour supply and employment in the euro area countries: developments and challenges”,
June 2008.
“The international role of the euro”, July 2008 (online only).
“Payment systems and market infrastructure oversight report”, July 2008 (online only).
“Letter from the ECB President to Mr Dimitrios Papadimoulis, Member of the European
Parliament”, July 2008 (online only).
“Letter from the ECB President to Mr Ashley Mote, Member of the European Parliament”,
July 2008 (online only).
“Legal framework of the Eurosystem and the ESCB. ECB legal acts and instruments”, July 2008.
“CCBM2 User Requirements 4.1”, July 2008 (online only).
“Simulating fi nancial instability – conference on stress testing and fi nancial crisis simulation
exercises, 12-13 July 2007”, September 2008.
“New procedure for constructing ECB staff projection ranges”, September 2008 (online only).
“Commission’s draft directive/regulation on credit rating agencies – Eurosystem contribution to
the public consultation”, September 2008 (online only).
“Euro money market survey”, September 2008 (online only).
“EU banking structures”, October 2008 (online only).

ECB
Monthly Bulletin
October 2009
“Letter from the ECB President to Mr Mario Borghezio, Member of the European Parliament”,
October 2008 (online only).
“Letter from the ECB President to Mr Ashley Mote, Member of the European Parliament”,
October 2008 (online only).
“A strategic vision for statistics: challenges for the next 10 years – Fourth ECB Conference on
Statistics, 24 and 25 April 2008”, November 2008.
“The implementation of monetary policy in the euro area: General documentation on Eurosystem
monetary policy instruments and procedures”, November 2008.
“The Eurosystem policy principles on the location and operation of infrastructures settling
euro-denominated payment transactions: specifi cation of ‘legally and operationally located in the
euro area’ ”, November 2008 (online only).
“Single Euro Payments Area – sixth progress report”, November 2008 (online only).
“EU banks’ liquidity stress-testing and contingency funding plans”, November 2008 (online only).
“Government fi nance statistics guide”, December 2008 (online only).
“Financial Stability Review”, December 2008.
“Covered bonds in the EU fi nancial system”, December 2008 (online only).
“The incentive structure of the ‘originate and distribute’ model”, December 2008 (online only).
“Recommendations of the Governing Council of the European Central Bank on the pricing
of recapitalisations”, December 2008 (online only).
“Recommendations of the Governing Council of the European Central Bank on government
guarantees for bank debt”, December 2008 (online only).
“Commercial property markets – fi nancial stability risks, recent developments and EU banks’
exposures”, December 2008 (online only).
“Correspondent central banking model (CCBM) – procedures for Eurosystem counterparties”,
December 2008 (online only).
“Letter from the ECB President to Mr Robert Sturdy, Member of the European Parliament”,
January 2009 (online only).
“Euro money market study 2008”, February 2009 (online only).
“Eurosystem oversight policy framework”, February 2009 (online only).
“Harmonised oversight approach and oversight standards for payment instruments”, February 2009
(online only).
“European Commission’s consultation on hedge funds – Eurosystem contribution”, February 2009
(online only).
“Guiding principles for bank asset support schemes”, March 2009 (online only).
“Letter from the ECB President to Mr José Ribeiro e Castro, Member of the European
Parliament”, March 2009 (online only).
“Letter from the ECB President to Mr Dimitrios Papadimoulis, Member of the European
Parliament”, March 2009 (online only).
“Letter from the ECB President to Mr Manolis Mavrommatis, Member of the European
Parliament, regarding the issuance of low denomination euro banknotes”, March 2009
(online only).
“Letter from the ECB President to Mr Eoin Ryan, Member of the European Parliament, concerning
the recent widening of spreads between euro area government bond yields”, March 2009
(online only).
“Eurosystem’s SEPA expectations”, March 2009 (online only).
“Housing fi nance in the euro area”, March 2009 (online only).
“Euro area monetary and fi nancial statistics: 2008 quality report”, March 2009 (online only).
X

ECB
Monthly Bulletin
October 2009
DOCUMENTSPUBLISHED
XI
“Euro area balance of payments and international investment position statistics: 2008 quality
report”, March 2009 (online only).
“Manual on investment fund statistics”, May 2009 (online only).
“EU banks’ funding structures and policies”, May 2009 (online only).
“Letter from the ECB President to Mr Ashley Mote, Member of the European Parliament”,
May 2009 (online only).
“TARGET2 oversight assessment report”, May 2009 (online only).
“TARGET Annual Report”, May 2009 (online only).
“The ECB’s advisory role – overview of opinions (1994-2008)”, May 2009.
“Financial Stability Review”, June 2009.
“Recommendations for securities settlement systems and recommendations for central
counterparties in the European Union – European Central Bank (ECB) and the Committee of
European Securities Regulators (CESR)”, June 2009 (online only).
“The international role of the euro”, July 2009.
“Monthly report on the Eurosystem’s covered bond purchase programme”, July 2009 (online only).
“Oversight framework for direct debit schemes”, August 2009 (online only).
“Oversight framework for credit transfer schemes”, August 2009 (online only).
“The Eurosystem’s stance on the Commission’s consultation document on the review of Directive
94/19/EC on deposit-guarantee schemes”, August 2009 (online only).
“Legal framework of the Eurosystem and the European System of Central Banks. ECB legal acts
and instruments. 2009 update”, August 2009.
“EU banking sector stability”, August 2009 (online only).
“Credit default swaps and counterparty risk”, August 2009 (online only).
“OTC derivatives and post-trading infrastructures”, September 2009 (online only).
“Monthly report on the Eurosystem’s covered bond purchase programme – August 2009”,
September 2009 (online only).
“Consultation of the European Commission on ‘Possible initiatives to enhance the resilience of
OTC derivatives markets’: Eurosystem contribution”, September 2009 (online only).
“ECB survey on access to fi nance for small and medium-sized enterprises in the euro area”,
September 2009 (online only).
“The euro at ten – lessons and challenges”, Fifth ECB Central Banking Conference volume,
September 2009.
“Euro money market survey”, September 2009 (online only).
INFORMATION BROCHURES
“The European Central Bank, the Eurosystem, the European System of Central Banks”,
April 2008.
“Price stability – why is it important for you?”, June 2008.
“A single currency – an integrated market infrastructure”, September 2008.
“The European Central Bank, the Eurosystem, the European System of Central Banks”,
April 2009.
“Price stability – why is it important for you?”, April 2009.
“The Single Euro Payments Area (SEPA): an integrated retail payments market”, July 2009.


ECB
Monthly Bulletin
October 2009 XIII
GLOSSARY
This glossary contains selected items that are frequently used in the Monthly Bulletin.
A more comprehensive and detailed glossary can be found on the ECB’s website
(www.ecb.europa.eu/home/glossary/html/index.en.html).
Autonomous liquidity factors: liquidity factors that do not normally stem from the use of
monetary policy instruments. Such factors are, for example, banknotes in circulation, government
deposits with the central bank and the net foreign assets of the central bank.
Balance of payments (b.o.p.): a statistical statement that summarises, for a specifi c period of
time, the economic transactions of an economy with the rest of the world.
Bank lending survey (BLS): a quarterly survey on lending policies that has been conducted by
the Eurosystem since January 2003. It addresses qualitative questions on developments in credit
standards, terms and conditions of loans and loan demand for both enterprises and households to a
predefi ned sample group of banks in the euro area.
Borrowing requirement (general government): net incurrence of debt by the general government.
Capital account: a b.o.p. account that covers all capital transfers and acquisitions/disposals of non-
produced, non-fi nancial assets between residents and non-residents.
Capital accounts: part of the system of national (or euro area) accounts consisting of the change in
net worth that is due to net saving, net capital transfers and net acquisitions of non-fi nancial assets.
Central parity (or central rate): the exchange rate of each ERM II member currency vis-à-vis the
euro, around which the ERM II fl uctuation margins are defi ned.
Compensation per employee or per hour worked: the total remuneration, in cash or in kind, that
is payable by employers to employees, i.e. gross wages and salaries, as well as bonuses, overtime
payments and employers’ social security contributions, divided by the total number of employees
or by the total number of employees’ hours worked.
Consolidated balance sheet of the MFI sector: a balance sheet obtained by netting out
inter-MFI positions (e.g. inter-MFI loans and deposits) in the aggregated MFI balance sheet. It
provides statistical information on the MFI sector’s assets and liabilities vis-à-vis residents of the
euro area not belonging to this sector (i.e. the general government and other euro area residents)
and vis-à-vis non-euro area residents. It is the main statistical source for the calculation of monetary
aggregates, and it provides the basis for the regular analysis of the counterparts of M3.
Current account: a b.o.p. account that covers all transactions in goods and services, income and
current transfers between residents and non-residents.
Debt (financial accounts): loans, deposit liabilities, debt securities issued and pension fund
reserves of non-fi nancial corporations (resulting from employers’ direct pension commitments on
behalf of their employees), valued at market value at the end of the period.
Debt (general government): the gross debt (deposits, loans and debt securities excluding fi nancial
derivatives) at nominal value outstanding at the end of the year and consolidated between and
within the sectors of general government.

ECB
Monthly Bulletin
October 2009XIV
Debt security: a promise on the part of the issuer (i.e. the borrower) to make one or more
payment(s) to the holder (the lender) on a specifi ed future date or dates. Such securities usually
carry a specifi c rate of interest (the coupon) and/or are sold at a discount to the amount that will
be repaid at maturity. Debt securities issued with an original maturity of more than one year are
classifi ed as long-term.
Debt-to-GDP ratio (general government): the ratio of general government debt to GDP at
current market prices. It is the subject of one of the fi scal criteria laid down in Article 104(2) of the
Treaty establishing the European Community to defi ne the existence of an excessive defi cit.
Deficit (general government): the general government’s net borrowing, i.e. the difference between
total government revenue and total government expenditure.
Deficit-debt adjustment (general government): the difference between the general government
defi cit and the change in general government debt.
Deficit ratio (general government): the ratio of the general government defi cit to GDP at current
market prices. It is the subject of one of the fi scal criteria laid down in Article 104(2) of the Treaty
establishing the European Community to defi ne the existence of an excessive defi cit. It is also
referred to as the budget defi cit ratio or the fi scal defi cit ratio.
Deflation: a decline in the general price level, e.g. in the consumer price index.
Deposit facility: a standing facility of the Eurosystem which counterparties may use to make
overnight deposits, remunerated at a pre-specifi ed interest rate, at an NCB.
Direct investment: cross-border investment for the purpose of obtaining a lasting interest in an
enterprise resident in another economy (assumed, in practice, for ownership of at least 10% of the
ordinary shares or voting power). Included are equity capital, reinvested earnings and other capital
associated with inter-company operations. The direct investment account records net transactions/
positions in assets abroad by euro area residents (as “direct investment abroad”) and net transactions/
positions in euro area assets by non-residents (as “direct investment in the euro area”).
Effective exchange rates (EERs) of the euro (nominal/real): weighted averages of bilateral euro
exchange rates against the currencies of the euro area’s main trading partners. The nominal EER
indices for the euro are calculated against two groups of trading partners: the EER-21 (comprising
the 11 non-euro area EU Member States and 10 trading partners outside the EU) and the EER-41
(composed of the EER-21 and 20 additional countries). The weights used refl ect the share of each
partner country in euro area trade and account for competition in third markets. Real EERs are
nominal EERs defl ated by a weighted average of foreign, relative to domestic, prices or costs. They
are thus measures of price and cost competitiveness.
EONIA (euro overnight index average): a measure of the effective interest rate prevailing in the
euro interbank overnight market. It is calculated as a weighted average of the interest rates on unsecured
overnight lending transactions denominated in euro, as reported by a panel of contributing banks.
Equities: securities representing ownership of a stake in a corporation. They comprise shares traded
on stock exchanges (quoted shares), unquoted shares and other forms of equity. Equities usually
produce income in the form of dividends.
ECB
Monthly Bulletin
October 2009
GLOSSARY
XV
ERM II (exchange rate mechanism II): the exchange rate arrangement that provides the
framework for exchange rate policy cooperation between the euro area countries and the
EU Member States not participating in Stage Three of EMU.
EURIBOR (euro interbank offered rate): the rate at which a prime bank is willing to lend funds
in euro to another prime bank, computed daily for interbank deposits with different maturities of up
to 12 months.
Euro area: the area formed by those EU Member States in which the euro has been adopted as the
single currency in accordance with the Treaty establishing the European Community.
European Commission surveys: harmonised surveys of business and/or consumer sentiment
conducted on behalf of the European Commission in each of the EU Member States. Such
questionnaire-based surveys are addressed to managers in the manufacturing, construction, retail
and services industries, as well as to consumers. From each monthly survey, composite indicators
are calculated that summarise the replies to a number of different questions in a single indicator
(confi dence indicators).
Eurosystem: the central banking system made up of the ECB and the NCBs of those EU Member
States that have already adopted the euro.
Eurozone Purchasing Managers’ Surveys: surveys of business conditions in manufacturing and
in services industries conducted for a number of countries in the euro area and used to compile
indices. The Eurozone Manufacturing Purchasing Managers’ Index (PMI) is a weighted indicator
calculated from indices of output, new orders, employment, suppliers’ delivery times and stocks
of purchases. The services sector survey asks questions on business activity, expectations of future
business activity, the amount of business outstanding, incoming new business, employment, input
prices and prices charged. The Eurozone Composite Index is calculated by combining the results
from the manufacturing and services sector surveys.
External trade in goods: exports and imports of goods with countries outside the euro area,
measured in terms of value and as indices of volume and unit value. External trade statistics are
not comparable with the exports and imports recorded in the national accounts, as the latter include
both intra-euro area and extra-euro area transactions, and also combine goods and services. Nor are
they fully comparable with the goods item in b.o.p. statistics. Besides methodological adjustments,
the main difference is that imports in external trade statistics are recorded including insurance and
freight services, whereas they are recorded free on board in the goods item in the b.o.p. statistics.
Financial account: a b.o.p. account that covers transactions between residents and non-residents in
direct investment, portfolio investment, other investment, fi nancial derivatives and reserve assets.
Financial accounts: part of the system of national (or euro area) accounts showing the fi nancial
positions (stocks or balance sheets), fi nancial transactions and other changes of the different
institutional sectors of an economy by type of fi nancial asset.
Fixed rate tender: a tender procedure in which the interest rate is specifi ed in advance by the
central bank and in which participating counterparties bid the amount of money they wish to
transact at the fi xed interest rate.

ECB
Monthly Bulletin
October 2009
General government: a sector defi ned in the ESA 95 as comprising resident entities that are
engaged primarily in the production of non-market goods and services intended for individual and
collective consumption and/or in the redistribution of national income and wealth. Included are
central, regional and local government authorities as well as social security funds. Excluded are
government-owned entities that conduct commercial operations, such as public enterprises.
Gross domestic product (GDP): the value of an economy’s total output of goods and services less
intermediate consumption, plus net taxes on products and imports. GDP can be broken down by
output, expenditure or income components. The main expenditure aggregates that make up GDP are
household fi nal consumption, government fi nal consumption, gross fi xed capital formation, changes
in inventories, and imports and exports of goods and services (including intra-euro area trade).
Harmonised Index of Consumer Prices ( HICP): a measure of the development of consumer
prices that is compiled by Eurostat and harmonised for all EU Member States.
Hourly labour cost index: a measure of labour costs, including gross wages and salaries (in
cash and in kind, including bonuses) and other labour costs (employers’ social contributions plus
employment-related taxes paid by the employer minus subsidies received by the employer), per
hour actually worked (including overtime).
Implied volatility: the expected volatility (i.e. standard deviation) in the rates of change of the
price of an asset (e.g. a share or a bond). It can be derived from the asset’s price, maturity date and
exercise price of its options, as well as from a riskless rate of return, using an option pricing model
such as the Black-Scholes model.
Index of negotiated wages: a measure of the direct outcome of collective bargaining in terms of
basic pay (i.e. excluding bonuses) at the euro area level. It refers to the implied average change in
monthly wages and salaries.
Industrial producer prices: factory-gate prices (transportation costs are not included) of all
products sold by industry excluding construction on the domestic markets of the euro area countries,
excluding imports.
Industrial production: the gross value added created by industry at constant prices.
Inflation: an increase in the general price level, e.g. in the consumer price index.
Inflation-indexed government bonds: debt securities issued by the general government, the
coupon payments and principal of which are linked to a specifi c consumer price index.
International investment position (i.i.p.): the value and composition of an economy’s outstanding
net fi nancial claims on (or fi nancial liabilities to) the rest of the world.
International reserves: external assets readily available to and controlled by monetary authorities
for directly fi nancing or regulating the magnitude of payments imbalances through intervention
in exchange markets. The international reserves of the euro area comprise non-euro denominated
claims on non-euro area residents, gold, special drawing rights (SDRs) and the reserve positions in
the IMF which are held by the Eurosystem.
XVI

ECB
Monthly Bulletin
October 2009
GLOSSARY
XVII
Investment funds (except money market funds): fi nancial institutions that pool capital raised
from the public and invest it in fi nancial and non-fi nancial assets. See also MFIs.
Job vacancies: a collective term covering newly created jobs, unoccupied jobs or jobs about to
become vacant in the near future, for which the employer has recently taken active steps to fi nd a
suitable candidate.
Key ECB interest rates: the interest rates, set by the Governing Council, which refl ect the
monetary policy stance of the ECB. They are the rates at the main refi nancing operations, on the
marginal lending facility and on the deposit facility.
Labour force: the sum total of persons in employment and the number of unemployed.
Labour productivity: the output that can be produced with a given input of labour. It can be
measured in several ways, but is commonly measured as GDP (volume) divided by either total
employment or total hours worked.
Longer-term refinancing operation: a regular open market operation executed by the Eurosystem
in the form of reverse transactions. Such operations are carried out through a monthly standard
tender and normally have a maturity of three months.
M1: a narrow monetary aggregate that comprises currency in circulation plus overnight deposits
held with MFIs and central government (e.g. at the post offi ce or treasury).
M2: an intermediate monetary aggregate that comprises M1 plus deposits redeemable at a period
of notice of up to and including three months (i.e. short-term savings deposits) and deposits with an
agreed maturity of up to and including two years (i.e. short-term time deposits) held with MFIs and
central government.
M3: a broad monetary aggregate that comprises M2 plus marketable instruments, in particular
repurchase agreements, money market fund shares and units, and debt securities with a maturity of
up to and including two years issued by MFIs.
Main refinancing operation: a regular open market operation executed by the Eurosystem in the
form of reverse transactions. Such operations are carried out through a weekly standard tender and
normally have a maturity of one week.
Marginal lending facility: a standing facility of the Eurosystem which counterparties may use to
receive overnight credit from an NCB at a pre-specifi ed interest rate against eligible assets.
MFI credit to euro area residents: MFI loans granted to non-MFI euro area residents (including
general government and the private sector) and MFI holdings of securities (shares, other equity and
debt securities) issued by non-MFI euro area residents.
MFI interest rates: the interest rates that are applied by resident credit institutions and other MFIs,
excluding central banks and money market funds, to euro-denominated deposits and loans vis-à-vis
households and non-fi nancial corporations resident in the euro area.

ECB
Monthly Bulletin
October 2009XVIII
MFI longer-term financial liabilities: deposits with an agreed maturity of over two years,
deposits redeemable at a period of notice of over three months, debt securities issued by euro area
MFIs with an original maturity of more than two years and the capital and reserves of the euro area
MFI sector.
MFI net external assets: the external assets of the euro area MFI sector (such as gold, foreign
currency banknotes and coins, securities issued by non-euro area residents and loans granted to
non-euro area residents) minus the external liabilities of the euro area MFI sector (such as non-euro
area residents’ deposits and repurchase agreements, as well as their holdings of money market fund
shares/units and debt securities issued by MFIs with a maturity of up to and including two years).
MFIs (monetary financial institutions): fi nancial institutions which together form the money-
issuing sector of the euro area. These include the Eurosystem, resident credit institutions (as defi ned
in Community law) and all other resident fi nancial institutions whose business is to receive deposits
and/or close substitutes for deposits from entities other than MFIs and, for their own account
(at least in economic terms), to grant credit and/or invest in securities. The latter group consists
predominantly of money market funds, i.e. funds that invest in short-term and low-risk instruments
usually with a maturity of one year or less.
Minimum bid rate: the lower limit to the interest rates at which counterparties may submit bids in
the variable tenders.
Other investment: an item in the b.o.p. and the i.i.p. that covers the fi nancial transactions/positions
with non-residents in trade credits, deposits and loans, and other accounts receivable and payable.
Portfolio investment: euro area residents’ net transactions and/or positions in securities issued
by non-residents of the euro area (“assets”) and non-residents’ net transactions and/or positions
in securities issued by euro area residents (“liabilities”). Included are equity securities and debt
securities (bonds and notes, and money market instruments). Transactions are recorded at the
effective price paid or received, less commissions and expenses. To be regarded as a portfolio asset,
ownership in an enterprise must be equivalent to less than 10% of the ordinary shares or voting
power.
Price stability: the maintenance of price stability is the primary objective of the Eurosystem. The
Governing Council defi nes price stability as a year-on-year increase in the HICP for the euro area
of below 2%. The Governing Council has also made it clear that, in the pursuit of price stability, it
aims to maintain infl ation rates below, but close to, 2% over the medium term.
Purchasing power parity (PPP): the rate at which one currency is converted into another so as
to equalise the purchasing power of the two currencies by eliminating the differences in the price
levels prevailing in the countries concerned. In their simplest form, PPPs show the ratio of the
prices in national currency of the same good or service in different countries.
Reference value for M3 growth: the annual growth rate of M3 over the medium term that is
consistent with the maintenance of price stability. At present, the reference value for annual M3
growth is 4½%.
Reserve requirement: the minimum amount of reserves a credit institution is required to hold
with the Eurosystem over a predefi ned maintenance period. Compliance with the requirement

ECB
Monthly Bulletin
October 2009
GLOSSARY
XIX
is determined on the basis of the average of the daily balances in the reserve accounts over the
maintenance period.
Survey of Professional Forecasters (SPF): a quarterly survey that has been conducted by the
ECB since 1999 to collect macroeconomic forecasts on euro area infl ation, real GDP growth and
unemployment from a panel of experts affi liated to fi nancial and non-fi nancial organisations based
in the EU.
Unit labour costs: a measure of total labour costs per unit of output calculated for the euro area as
the ratio of total compensation per employee to labour productivity (defi ned as GDP (volume) per
person employed).
Variable rate tender: a tender procedure where the counterparties bid both the amount of money
they wish to transact with the central bank and the interest rate at which they wish to enter into the
transaction.
Write-down: a downward adjustment to the value of loans recorded in the balance sheets of MFIs
when it is recognised that the loans have become partly unrecoverable.
Write-off: the removal of the value of loans from the balance sheets of MFIs when the loans are
considered to be totally unrecoverable.
Yield curve: a graphical representation of the relationship between the interest rate or yield and the
residual maturity at a given point in time for suffi ciently homogenous debt securities with different
maturity dates. The slope of the yield curve can be measured as the difference between the interest
rates or yield at two selected maturities.