Month in Review...6 COMMERCIAL Mont eview New South Wales December 2019 Overview Another year is...
80
December 2019 Month in Review The Month in Review identifies the latest movements and trends for property markets across Australia.
Transcript of Month in Review...6 COMMERCIAL Mont eview New South Wales December 2019 Overview Another year is...

December 2019Month in ReviewThe Month in Review identifies the latest movements and trends for property markets across Australia.

Feature – 2019: The year in review 3
Commercial - Office 4
New South Wales 6
Victoria 8
Queensland 9
South Australia 15
Western Australia 17
Australian Capital Territory 18
Residential 21
New South Wales 24
Victoria 32
Queensland 37
South Australia 45
Western Australia 48
Northern Territory 52
Australian Capital Territory 54
Tasmania 55
Rural 56
Market Indicators 62
Contents
DisclaimerThis publication presents a generalised overview regarding the state of Australian property markets using property market risk-ranking scales. It is not a guide to individual property assessments and should not be relied upon.
Herron Todd White accepts no responsibility for any reliance placed on the commentary and generalised information. Contact Herron Todd White to obtain formal, specific property advice on any matters of interest arising from this publication.
All rights reserved. This report can not be reproduced or distributed without written permission of Herron Todd White.
Click on any state or
page number for immediate
access

3
CO
MM
ERC
IAL
Month in ReviewDecember 2019
Another twelve months of action is drawing to a close and we can look back with the clarity of perfect hindsight to pick through the highlights and lowlights of 2019.
Month in ReviewDecember 2019
FEA
TUR
E
3
2019: The year in review
This year we saw the Royal Commission into Misconduct in the Banking, Superannuation and Financial Services Industry table its final report, making 76 recommendations for reform.
The federal election was held in May, returning the Liberal-National Coalition Government to power in what was a Steven Bradbury-like performance.
Interest rates also continued a downward trend with the cash rate falling from 1.5 per cent to 0.75 per cent throughout the year.
On the international stage, 2019 might well be remembered for attention-grabbing activity at the highest levels of government. This is the year we saw the start of long-running Hong Kong anti-extradition protests and the beginning of impeachment proceedings against the sitting US president.
We’re also watching what many describe as the Brexit debacle stumble along in the UK. As at the time of writing, a general election is just a few weeks away for what could potentially be Britain’s third Prime Minister in less than six months.
Enough about that – what about our real estate markets?
Well, this year saw some unexpected shifts. Post-election and after some relaxation around lending, there was a boost in the big markets at the tail end of 2019 that had some commentators calling it the start of another boom run in Sydney.
The fact is, Australia is a mosaic of property markets and the only way to truly understand them is at a granular, coal face level. As such, we’ve asked our residential team to take a moment and look back at 2019. What’s resulted is the nation’s most comprehensive, detailed commentary on what’s happened in residential real estate over the preceding year.
And – because life’s no fun if it’s too easy – we threw in a request for the offices to report on whether their predictions from way back in February came to pass. Some have even been game enough to score themselves out of ten. Brave souls.
For commercial readers, we give the same treatment to the office sector. Our teams have gazed back on the year that was and let us know about the big changes, seismic shifts and significant movements that have driven office real estate.
Finally, the rural teams have not been let off the hook either. They dig deep into their specialty locations and industries to reveal exactly what it’s been like living and working on the land in Australia this year.
There it is dear readers, a brilliant accompaniment to your work Christmas party where you can impress associates with guru-like knowledge of the Aussie markets.
It’s our little present to you.
We’d also like to wish each and every reader a sensational holiday season. May it be filled with rest, relaxation, joy, laughter, family… and food. Lots and lots of delicious food.
See you in 2020.

OfficeDecember 2019

Liability limited by a scheme approved under Professional Standards Legislation.
This report is not intended to be comprehensive or render advice and neither Herron Todd White nor any persons involved in the preparation of this report accept any form of liability for its contents.
Entries coloured purple indicate positional change from last month.
National Property Clock: Office
CO
MM
ERC
IAL
5
Month in ReviewDecember 2019
RISING MARKET
Start of Recovery
BOTTOM OF MARKET
DECLINING MARKET
Approaching Bottom of Market
PEAK OF MARKET
Approaching Peak of Market
Starting to Decline
Ballina/Byron BayCoffs HarbourDubbo
Gold CoastLismoreMelbourne
South East NSWSunshine CoastSydney
Alice SpringsEchuca
Mid North CoastIllawarra
BundabergCairnsDarwinHervey Bay
HobartIpswichLauncestonMackay
PerthToowoombaTownsvilleWide Bay
BallaratBrisbane
AdelaideC’berra/ Q’beyanCentral CoastEmerald
GeelongMilduraNewcastle
GladstoneRockhamptonSouth West WA

6
CO
MM
ERC
IAL
Month in ReviewDecember 2019New South Wales
OverviewAnother year is coming to a close. As we enter the final month of 2019, it’s time to take a look back at how office markets performed across the nation.
It should come as no surprise that there was a mixed bag of results. Many big-city investors were looking to shore up cash flow by concentrating on commercial stock, which led to incredibly strong prices, but in less-populated areas, the outcomes were a bit more subdued.
Sydney2019 has been another strong year for the office market across both the Sydney CBD and metro centres. With rents continuing to climb and vacancy rates at record lows, it is no wonder that values have continued to rise.
The Sydney CBD saw vacancy rates decline over the first half of 2019 and were most recently recorded by the PCA in July 2019 at 3.7 per cent, a 1.1 per cent tightening since the same time in 2018. Tight vacancy kept rentals at record highs, particularly for prime and A grade stock, however agents have begun reporting softer demand for B through to D grade stock through 2019. That said, rentals have remained strong across the board and continue to be intrinsically linked to the continued rise in capital rates.
New approvals for office accommodation are
low across the CBD, with approvals being generally focused on residential and hotel redevelopment rather than traditional office space. That said, there is a new office supply on the horizon, however the majority of this will not come online until 2020/2021.
The CBD office market saw a number of high profile sales in 2019, with and its unlisted Dexus Wholesale Property Fund’s purchase of GPT Group’s half-share in the MLC Centre at 19-29 Martin Place for $800 million, through to record transactions for strata suites. Noonan Property recently achieved a sale price of $8.8 million for Suite 56 at 5-7 Macquarie Street. At $21,053 per square metre for 418 square metres, this sale reflects the highest rate to date for a strata suite over 400 square metres.
We note that there is a continued dominant demand from owner occupiers that appears to be propelling this strong value growth and for a variety of reasons. The current interest rate environment, seeing interest rates at record lows, is fuelling borrowing power and market sentiment across the board. The current low cost of money combined
with the impact of rising rents has seen a significant increase in tenants looking to purchase to owner occupy over the past two years. This appears to be a strong driver in increasing capital values as tenants looking to owner occupy, as well as owner occupiers in general, are typically less reliant on potential yields and as such are more willing to pay a premium to secure the property they desire.
With the completion of the light rail project along George Street imminent and the first trams trialling the tracks, a new era of CBD accessibility is in sight. The completion of the majority of the construction has already improved what has been a particularly unpleasant streetscape over the past few years. The below shows one of the shiny new trams in action.
Light rail Source: Herron Todd White
6
CO
MM
ERC
IAL
Month in ReviewDecember 2019
This sale reflects the highest rate to date for a strata suite over 400 square metres.
SYDNEY VACANCY RATES
3.7% July 2019
4.8% July 2018

7
CO
MM
ERC
IAL
Month in ReviewDecember 2019
We also saw the opening of the Metro North West Line earlier in the year, providing a significant increase in accessibility to the secondary office precincts of Norwest and Macquarie Park as well as an additional line of access to Chatswood, increasing the overall appeal of these secondary precincts.
The continuation of the Sydney Metro project, due for completion in 2024, is considered to be of further benefit to the Sydney CBD and surrounding office markets. This important infrastructure project will further improve accessibility to the CBD and surrounds and we therefore expect it to have a positive influence on the market.
Outside of the CBD, there have been impressive performances in a number of other metro office sectors. In the west, the Parramatta CBD has been the best performing secondary CBD in the country, with the most recently reported vacancy rates at 2.7 per cent (July 2019, PCA). This has continued to be driven by low supply additions and the draw of more affordable rentals than the CBD.
Overall, the strong office market across Sydney continued in 2019 and is unlikely to weaken in the short term. We expect that there will continue to be strong appeal for quality properties in locations with adequate accessibility and particularly where supply is limited in the short term.

8
CO
MM
ERC
IAL
Month in ReviewDecember 2019
MelbourneAccording to the Property Council of Australia’s Office Market Report, Melbourne’s CBD Office overall vacancy rate slightly increased from 3.2 per cent to 3.3 per cent over the six months to 1 July 2019.
Melbourne CBD has still recorded the lowest vacancy rate amongst all of Australia’s CBDs at 3.3 per cent, in front of Sydney CBD at 3.7 per cent. Low vacancy has led to competition for remaining space, driving up net face rents over the past 12 months. Incentives have also reduced however are still at relatively high levels. New supply of prime office accommodation was limited throughout 2019 however a deluge of new office supply is forecast for completion in 2020/21. As a result, the CBD office market saw strong rental growth over 2019 and is anticipated to level out as the new supply comes on line by 2021.
Sales volumes in the year to September 2019 were the highest in the Melbourne CBD in ten years owing to record low yields, low interest rates and strong demand from all buyer groups. Demand for good quality smaller office properties within the Melbourne CBD, metro and St Kilda Road office markets continues to be strong due to the lack of suitable stock on the market and sheer weight of capital for the limited investment opportunities. We highlight that whole level strata office floors within
the CBD have averaged record-high performance in 2019 with office strata capital value rates in the eastern core precinct selling well above $10,000 per square metre. Due to the tight leasing environment and record-low interest rates, vacant office floors are in demand and appeal to both owner occupiers and investors who are looking to capture the rental upside. We highlight that there is a possibility that the current overheating in the strata market will abate and yields may soften.
Tenant demand is continuing to rise in the city fringe. Tenants, especially from the creative, technology and business service sectors, actively compete for well-located high-quality office accommodation. Vacancy rates in the city fringe, inner east and outer east are well below long term average vacancy levels. The vacancy rate in the inner east is the lowest of all of Melbourne’s metro precincts. The CBD’s increasing rents are creating greater demand in city fringe locations as tenants seek cheaper alternatives.
Fringe CBD and inner suburban development sites with holding income are keenly sought after in the current market by developers and land bankers. In particular, there has been strong capital growth for commercial development sites in Cremorne and Richmond over the past 18 months which is backed by solid rental growth and low vacancy rate. There
are a number of commercial office developments under way in the precinct such as 510 Church Street, an 11-storey office building which is under construction and will provide 21,985 square metres of lettable area, and 600 Church Street, an eight-storey office building which is expected to be completed in Quarter 4, 2019 and will provide 5,799 square metres of lettable area. There is a potential that demand for office space may be saturated upon completion of the current developments. We note that there are existing pre-commitments in place over many of the approved developments.
The most active players within the sub-$50 million market at present are private investors, syndicates and Self-Managed Superannuation Funds (SMSF). Overseas investors are also prevalent as an overflow effect of the lack of good quality commercial stock in the Melbourne CBD. We are witnessing strong buyer demand for well-located assets with strong underlying fundamentals such as long WALES, good lease covenants and low capital expenditure requirements. We have also observed more suburban transactions to overseas purchasers focusing on underlying redevelopment potential. There is also an increase in owner occupiers returning to the market through purchasing suburban office property as an alternative to leasing owing to the low interest rate environment.
VictoriaMelbourne CBD has still recorded the lowest vacancy rate amongst all of Australia’s CBDs at 3.3 per cent in front of Sydney CBD at 3.7 per cent.
MELBOURNE VACANCY RATES
3.3% July 2019

9
CO
MM
ERC
IAL
Month in ReviewDecember 2019
BrisbaneIt has been quite a big year for the Brisbane commercial office market which has enjoyed positive capital growth in 2019.
The investment market in particular has been strong with CBD and fringe precincts including King Street, Ann Street, Gasworks and South Brisbane office precincts being very popular with investors. The high levels of demand had seen yields for Prime and A grade buildings fall to less than six per cent with capital growth of up to 25 per cent being achieved over the past three years. Overall, yields have fallen over the past three years by up to 150 basis points and the market is now starting to enter unprecedented yield territory with the potential for some final further compression in 2020.
The majority of the investor demand and market movement is primarily within the Prime and A grade sub-markets. These markets have seen some growth in gross face rental rates for the first time since the GFC, however incentives remain high at above 35 per cent. The lack of new stock entering the market has helped alleviate vacancy levels as they now have reached their lowest point for many years. Current vacancy levels for Prime CBD accommodation are now 8.7 per cent, their lowest rate since July 2015. For A grade space, the current CBD vacancy is ten per cent which is slightly up on January 2019 (9.9 per cent) but still at a near low point for the past five years. We note however that
the pending completion of 300 George Street will see the vacancy rate for Prime and A Grade space push back over ten per cent.
300 George St – Shortly to be Completed Source: HTW
In the fringe markets, total vacancy is 13.8 per cent whilst A grade vacancy is slightly less at 12.7 per cent. There is limited current development activity
in fringe areas but there are a number of approved sites ready to go when required.
Secondary office precincts (Milton and Spring Hill) remain weak as vacancy rates and incentives remain stubbornly high. We note however that Milton’s vacancy rate has reduced significantly by circa eight per cent in 2019 with approximately 26,000 square metres of lettable space being taken up in the 12 months from July 2018 to July 2019. This will come as a welcome relief for vendors as value levels have been negatively impacted by the weak leasing market.
With tight margins and a genuine lack of quality prime office stock available for sale, investors are looking for other investment and value-add opportunities. There has been a noticeable increase in the volume of well located, under-performing, secondary B grade office buildings sold with the intention of repositioning these assets. With improved leasing conditions, investors are seemingly more comfortable taking on the leasing risk by upgrading building services and amenities and creating more functional work environments. As there are limited opportunities available within the prime market and leasing demand remains positive, it is likely we will see
Queensland
It has been quite a big year for the Brisbane commercial office market which has enjoyed positive capital growth in 2019.
BRISBANE VACANCY RATES
8.7% Prime CBD
10% A grade CBD
12.7% A grade fringe

10
CO
MM
ERC
IAL
Month in ReviewDecember 2019
for the Gold Coast office sector would be 7% to 7.75%. There have been transactions below this range, although generally such properties would have some other element on offer, such as redevelopment scope.
Examples of larger office buildings to have sold on the Gold Coast over the course of 2019 to date include: 130 Bundall Road, Bundall in January for $11 million (source: CoreLogic) reflecting an analysed yield of 7.34 per cent and $2,988 per square metre on lettable area; Lakeside 1, Bermuda Point, Lot 1101/1 Lake Orr Drive, Varsity Lakes in March for $25.1 million (source: CoreLogic) reflecting an analysed yield of 8.75 per cent and $4,105 per square metre on lettable area; 169 Varsity Parade, Varsity Lakes in May for $14 million (source: CoreLogic) reflecting an analysed yield of 6.85 per cent and $4,172 per square metre on lettable area; 7-11 Short Street, Southport in July for $8.2 million (source: valuation) reflecting an analysed yield of 7.7 per cent and $3,356 per square metre on lettable area.
Examples of other notable sales include: 145 Wharf Street, Tweed Heads in March for $2.925 million (source: CoreLogic) reflecting an analysed yield of 7.52 per cent and $3,140 per square metre on lettable area; 34 Thomas Drive, Chevron Island in March for $4.1 million (source: CoreLogic) reflecting an analysed yield of 5.37 per cent and $4,409 per square metre on lettable area; 13 Hicks Street, Southport in March for $2.65 million (source: CoreLogic) reflecting an analysed yield of 6.91 per cent and $3,529 per square metre on lettable area; 16-20 Railway Street, Southport in July for $4.07 million
through to the larger assets.
Fair to say that the outcome of the Banking Royal Commission was expected. However, the main upshot from a property perspective, being stricter lending criteria, did put a bit of a dampener on the commercial market. This was then countered by the somewhat unexpected federal election result, meaning that negative gearing and capital gains tax were going to be unchanged, well at least for the next four years.
Coupled with a few reductions in the official cash rate by the RBA over the course of 2019, the picture moving forward looked good. The market responded to this general sentiment and the remainder of 2019 moved along quite nicely.
In terms of sale transactions of office buildings, the Gold Coast marketplace has been quite respectable. There have been several stand alone buildings sold over the course of the year, with the action noticeably up after the completion of the Banking Royal Commission. There have been a number in the over $7 million tier (mid to larger size for the Gold Coast) and a number also in the low to mid-size tier of $2 million to $5 million.
Yields have remained reasonably strong, although we do consider they softened over the latter part of 2019. In general, the expected yield range
further yield compression and capital value improvement in this sub-market, albeit within well located office precincts.
Moving further afield, suburban markets have largely seen a lesser level of capital value growth in 2019. Leasing markets remain fickle, especially for secondary and tertiary grade commercial office assets. Well located assets that are modern and within close proximity to transport, road networks and retail amenities are still sought after by both tenants and buyers. Sale activity has generally been in and around North Lakes, Caboolture town centre, Mount Gravatt and Springwood. Investors and owner occupiers remain cautious of commercial office assets in secondary precincts or older style buildings.
We also highlight that the owner occupier market remains strong with a combination of second tier buildings well below replacement costs and mortgage costs well below leasing. This is primarily confined to the sub-$5 million office markets.
Gold CoastGoing into 2019, the Gold Coast was still upbeat from the successful 2018 Commonwealth Games, although the elephants in the room were the Banking Royal Commission, with its findings to be handed down in February, and the federal election due in May.
It’s fair to say that there was a bit of trepidation in the commercial property market moving into 2019, however, to a degree, this was offset by the continuing low interest rate environment which had and was continuing to encourage buyers, both large and small, from high wealth individuals, to SMSFs and owner occupiers across all sectors, from investment to vacant properties for owner occupation, encompassing smaller strata units
GOLD COAST VACANCY RATES
11.6% January 2019
12.9% July 2019
7% - 7.75% Expected yield range
Coupled with a few reductions in the official cash rate by the RBA over the course of 2019, the picture moving forward looked good.

11
CO
MM
ERC
IAL
Month in ReviewDecember 2019
145 Wharf St Source: HTW Gold Coast
169 Varsity Pde Source: Ray White Commercial
Sunshine CoastThe office market across the Sunshine Coast performed in line with general expectations during 2019. Expectations at the end of 2018 were that the market would show a range of issues due to the high levels of supply that entered the market during 2017 and 2018 with circa 45,000 square metres of space added in that time.
We note that in general, leasing conditions have been impacted by this large level of supply. This has impacted secondary style locations to a greater level with these complexes noting impacts on lease renewal of drops in rental levels of up to 20 per cent. Good quality buildings in prime locations
◗ B grade: $310 to $375 per square metre per annum gross
◗ A grade: $400 to $475 per square metre per annum gross, although there are instances where over $600 per square metre per annum gross has been achieved
◗ Car parks - basement: $110 to $150 per bay per calendar month; undercroft: $100 to $120 per bay per calendar month; open: $80 to $100 per bay per calendar month.
Yield would appear to have been the primary driver for investors in the Gold Coast office sector in 2019. Certainly levels of seven per cent to 7.75 per cent have been superior to returns in the capital cities and in many cases are on par with larger regional cities. The dearth of new office buildings on the Gold Coast for several years now has assisted in reducing vacancy levels, which has in turn filtered down to create anticipation of sustainable rental growth going forward.
Whilst there are headwinds in terms of global issues (trade wars, Brexit) and interrupters for Queensland and the Gold Coast such as state and local government elections coming up in 2020, the general feeling in the Gold Coast marketplace is that in all likelihood, conditions will hold fast next year. Notwithstanding this sentiment, there is also an amount of deleterious commentary (print media and telecommunications) around global economic headwinds and dare we say it…recession predictions. So, nothing is a sure bet.
(source: CoreLogic) reflecting an analysed yield of 7.54 per cent and $4,409 per square metre on lettable area; strata Lots 12 and 13 Premion Place, 39 White Street, Southport in September for $2.25 million (source: CoreLogic) reflecting an analysed yield of 7.04 per cent and $6,048 per square metre on lettable area.
The overall level of vacancy across the Gold Coast office sector as monitored by the Property Council of Australia (PCA) reflected 12.9 per cent in July 2019, which was up from 11.6 per cent in January 2019. Leasing agents had noted a tougher first half for 2019 but suggest the second half of the year has been better. It is expected that the level of vacancy will hold at the next PCA report in January 2020.
Leasing agents report that there has been a general flight to quality, with tenants seeking to move from D and C grade space to B and A grade space. Rates have demonstrated growth at least in line with movement of the CPI and in some instances higher increments. Incentives have tended to settle at around eight per cent of the first year’s lease rental. For D and C grade space, being of lesser quality, incentives continue to be reflected in the level of the rental rate rather than any rent free period or contribution to fitout, which form the main basis of incentives in the Gold Coast marketplace. In summary, expected rental levels across the Gold Coast would be:
◗ D and C grade: $250 to $300 per square metre per annum gross;
Leasing agents report there has been a general flight to quality, with tenants seeking to move from D and C grade space to B and A grade space.

12
CO
MM
ERC
IAL
Month in ReviewDecember 2019
1,615 square metres and 60 on-site car parks. The building was fully leased to two government tenants. Sale price of circa $7.4 million with a passing net yield of circa 8 per cent.
◗ 70 Neil Street, Toowoomba City - This is a single level building with a net lettable area of 948 square metres and 26 on-site car parks. The building was fully leased to a legal firm and Darling Downs Radiology. Sale price of $4.65 million with a passing yield of circa 7 per cent.
CairnsThe Cairns office market is relatively shallow and experiences limited sales activity. The market has also experienced limited new development, with the last large office building constructed in Cairns being the state government office tower completed in 2010. There are no known new developments in the pipeline.
The level of general commercial property sales in Cairns, inclusive of retail and commercial office premises, highlights that activity in the Cairns commercial market remains well below the levels achieved in the 2003 to 2007 period. Sales volumes have been gradually rebuilding over the past nine years but are still only averaging around
Toowoomba Following years of limited new office development in Toowoomba, construction has been completed on a new building located on the corner of Campbell and Raff Streets in the northern fringes of Toowoomba’s CBD. The building is multi-level and will contain a food/café tenancy on the ground level (currently for lease). This project was driven by multiple owner occupiers and is strata-titled.
Owner occupier demand has continued to be strong, particularly for premises with floor areas of up to 300 square metres. There has been a reduced supply in this market segment, which has resulted in some sales achieving premium prices.
Leasing demand for commercial office accommodation in Toowoomba was subdued in 2019 which continued the trend from the previous couple of years. As a result there has not been a significant growth in rentals and evidence that some lease incentives may be required to secure tenants.
There were a number of major investment sales in 2019 following many years of limited activity. The sales of note include:
◗ Easternwell Building – 10 Russell Street, Toowoomba City – This is a nine level office building with a net lettable area of 7,126 square metres and 101 on-site car parks. Major tenants include Easternwell Group, Southern Cross Austereo, Neato Employment and two state government tenants. There were a number of vacant tenancies and leases with short remaining lease terms. WALE of 2.4 years. Sale price of $10.5 million with a passing net yield of circa 12 per cent.
◗ 146 Herries Street, Toowoomba City – This is a two level building with a net lettable area of
have had a lower overall impact to leasing rates this year, though there has still been some impact felt, though typically less than ten per cent.
PCA statistics are yet to be released for the 2019 calendar year, although overall absorption appears to have been above long-term averages of circa 4,000 square metres. This would still leave a high overall level of vacancy for the region with further stock planned to enter the market in 2020.
One of the unusual factors noted during 2019 was the continued strong sales of larger stand-alone complexes. Sales included Lakeview Centre at Main Drive, Birtinya for $4.2615 million analysing to a yield of 7.29 per cent and $4,864 per square metre and 1-5 Plaza Parade, Maroochydore for $3.65 million analysing to a yield of 7.24 per cent and $3,509 per square metre. These sales indicate that overall values held firm during 2019 even with the volatility surrounding the rental market. This is likely to have been driven by the continued low interest rate environment and the high overall cost to develop new office stock in the area.
The overall stability of the market is unknown moving into 2020 as vacancy is still considered to be high. If there are any changes to macro-economic conditions, including the current level of migration to the Sunshine Coast, then this could impact negatively.
One of the unknowns is the impact of the Submarine Broadband Internet Cable, which will be connected during 2020 and may lead to increased demand for office space from a range of users. This has the potential to improve overall leasing conditions and subsequently the overall outlook for the office market.
146 Herries Street, Toowoomba City Source: domain.com.au

13
CO
MM
ERC
IAL
Month in ReviewDecember 2019
rings true to what we have seen in the office sector.
There has been a notable increase in market confidence generally as a result of the continued recovery of the resources sector as well as commencement of major infrastructure projects in the region.
Sales activity has been limited, however owner occupiers have remained active and investors are actively still seeking quality investment opportunities. Rentals have remained relatively stable over the past 12 months, indicating a range of about $225 to $300 per square metre gross for the average semi-modern to modern office space within the CBD.
We have however seen a number of smaller tenancies signing up in the $300 to $350 per square metre gross range for modern, well located office tenancies, a positive sign for the market.
Secondary tenancies are still likely to prove difficult to lease and incentives are still common in leasing negotiations for these tenancies. The same continues for large office tenancies in excess of about 250 to 300 square metres. There are few tenants locally that require tenancies of this size and these continue to sit vacant.
GladstoneThroughout 2019, conditions in Gladstone’s office sector have continued to remain stable.
Whilst there are still vacancies to be filled, we have
fringe city centre central development. This is a purpose-built building to be wholly occupied by the Australian Taxation Office from 2020 on a ten-year lease plus options. Upon completion, the ATO will relocate from their current CBD office, which is likely to see a large amount of quality office space come onto the leasing market. The current depth of the local private sector is unlikely to be able to absorb this space.
Throughout 2019 we have also seen the re-development of an existing CBD office building to include upgrades to external facades and internal upgrades at a reported cost of $10 million. The property was rebranded Precinct 21 and comprises five levels of commercial office space of over 5,000 square metres which is being offered to the market for lease.
The leasing sector remains soft with better quality A grade stock appearing to be holding value levels, although new tenancies to non-government or multi-national tenants are still seeing high levels of leasing incentives in the 15 per cent to 25 per cent range. Lower quality B grade product is continuing to see downward pressure. Overall, rental rates for the market as a whole appear stable as a result of the market correction that has occurred over the past few years, however market corrections are very much property specific with downward pressure still occurring in some leases.
RockhamptonAt the start of 2019, we forecast that 2019 would see some positivity return to the commercial sector in Rockhampton, not necessarily by way of substantial value rises, but more by way of decreased vacancies, new developments and increased activity in general. As the year draws to a close, we consider that while the office market has remained relatively flat, most of the above
90 to 100 sales per annum. Median prices paid specifically for strata titled premises have increased mildly over the past seven years but our general impression is that prices per square metre of floor area are mostly stable within the $2,000 to $4,500 range.
Most new office space leasing demand is for smaller areas and for modern, good quality green-star rated premises, however there is only a handful of such buildings in Cairns. These buildings achieve high levels of occupancy and are experiencing stable rent levels typically of $350 to $450 per square metre per annum. Demand for lesser quality space remains limited and there is a large oversupply of good quality, non-inner CBD and well exposed secondary space in the $200 to $300 per square metre per annum rental range. These conditions have placed downward pressure on secondary rents and seen the emergence of incentives.
The Cairns office market overall has experienced little change during 2019 and is expected to remain steady in the short to medium term moving forward into 2020.
TownsvilleThroughout 2019 the office market has remained relatively stable with interest for larger assets being underpinned by national investors.
One of the biggest changes currently underway in the CBD office market is the construction of a new 4,000 square metre, four-level office building in a
ROCKHAMPTON RENTAL RANGE
$225 to $300 Semi-modern office space cost per sqm
$300 to $350 Small tenancies
cost per sqm
90-100Cairns sale
volumes per year

14
CO
MM
ERC
IAL
Month in ReviewDecember 2019
have now risen so disproportionately high in comparison to southern Australia that they are now constraining net returns from passive and going concern commercial property investments. This is having a direct and adverse impact on commercial property valuations above the Tropic of Capricorn.
MackayThis has been one of the quietest years for office sales in Mackay. There were only two transactions.
These included the mortgagee sale of vacant premises at 92 Wood Street at a price of $505,000 and the sale of a combined office and residential flats property at 89 Sydney Street at a price of $799,900.
The office leasing market was also noticeably slower throughout 2019. Office rental rates are highly variable and in some cases tenants have been able to negotiate fairly low rentals of between $150 and $200 per square metre per annum net for older tenancies or for large floor plates in secondary fringe localities. Better quality tenancies still achieve rentals of up to $300 per square metre per annum.
The Department of Resources, Mines and Energy is relocating from its tenancy at 22-30 Wood Street in December to the new state government building at 44 Nelson Street. This 1,500 square metre, mostly upper level tenancy has recently been listed for lease. The office market remains oversupplied.
We could not let the opportunity pass without mentioning the current building insurance issue also related to the market for office investment properties which has now reached crisis point in northern Australia. At the time of writing, we had just attended a public forum on the matter which was organised by our Federal MP and attended by the Federal Assistant Treasurer. This forum confirmed our observations that premiums
seen some new rentals in the CBD negotiated in the past 12 to 18 months that fall within the low-to-mid $300 per square metre gross, which is a positive sign for this sector. Notwithstanding, we consider the market remains volatile and rentals at this level are difficult for landlords to achieve.
The market is still recovering from years of increasing vacancies and downward pressure on rentals. Sales activity has been very limited and owner occupiers are still the most active in the market, taking advantage of the stage of the property cycle coupled with record low interest rates. Investors have returned to the market, however are very sensitive to tenant strength and unexpired lease terms.
Most recently, a strata office unit at 174 Goondoon Street sold for $1 million, reflecting a yield of about nine per cent. The property had a WALE of 2.88 years.
Wide BayThe office market throughout the Wide Bay had a relatively stable year with a low volume of sales occurring throughout the three main localities. Notable activity includes the continued construction of The Avenue at Hervey Bay and some medical and professional services businesses completing construction works in Bundaberg.
Vacancies remain high in Maryborough and at a moderate level in Hervey Bay and Bundaberg. This is a continued trend from previous years with little on the horizon indicating a change in market conditions over the short term.
We could not let the opportunity pass without mentioning the current building insurance issue which has now reached crisis point in northern Australia.

15
CO
MM
ERC
IAL
Month in ReviewDecember 2019
AdelaideAdelaide’s office market continued its steady performance throughout the past few months. Interest remains high for purchasing and leasing office space throughout the Adelaide CBD, with the core sector continuing to attract the major investment. The cash rate was left on hold at 0.75 per cent, while potential land tax changes and the trade war between the US and China are the major influences on property market transactions through the latter half of this year.
It will come as no surprise to readers that the Adelaide CBD itself gathered the most interest in office buildings throughout metropolitan Adelaide, particularly within the core sector. Of the sales listed above, 55 Currie Street, 25 Grenfell Street and 80 Flinders Street are all located in the CBD core sector, while 149 Flinders is situated in the frame sector. Overall, sales volumes are slightly below the levels of this time last year and the total volume of Adelaide CBD office sales has decreased
in each of the past two years from the highs set throughout 2017.
Adelaide CBD vacancies currently measure just 12.8 per cent as per the latest statistics provided by the Property Council of Australia. Within the CBD specifically, vacancies in the core sector sit at 13.8 per cent while vacancies in the frame sector are nine per cent.
Looking to the fringe of the Adelaide City encompassing Greenhill Road, Fullarton Road and Dequetteville Terrace, vacancies measure 13.1 per cent. Furthermore, we are continuing to see B and C grade space refurbished, fuelling the flight to quality as tenants look to secure space in A grade
buildings. Looking back on 2019, we have seen vacancies in the core sector drop from 15.5 per cent in January to 13.8 per cent in July, while frame vacancies have decreased from 9.7 per cent to nine per cent in that same timeframe.
NAB’s reports of record-low levels in South Australian business confidence combined with recent interest rate cuts, higher than expected unemployment, land tax uncertainty and geopolitical tensions, have been the major influences on South Australian property markets of late, keeping activity rather subdued in most sectors.
Looking to leasing deals, the major leasing transactions in the Adelaide CBD in the past few months include:
◗ 80 Flinders Street – The A grade office building recently purchased by Centuria Capital Group attracted tenants BAE Systems and Beach Energy earlier this year.
South AustraliaTHE HIGH PRICE POINTS FOR ADELAIDE OFFICE SALES IN 2019
Address Sale Date Sale PriceSite Area
(m2)Building
Area (m2)
$/m2 Building
AreaReported Yield (%)
55 Currie Street, Adelaide 10/09/19 $148,250,000 5,578 26,062 $5,688 8.00%
25 Grenfell Street, Adelaide 01/11/19 $134,220,283 1,968 25,131 $5,341 8.36%
80 Flinders Street, Adelaide 25/09/19 $127,000,000 1,398 12,154 $10,449 6.10%
7 Laffer Drive, Bedford Park 12/04/19 $23,500,000 32,990 6,430 $3,655 5.46%
149 Flinders Street, Adelaide 01/10/19 $18,400,000 530 2,144 $8,582 N/A
The recently sold office building at 55 Currie Street, Adelaide Source: RP Data
ADELAIDE CBD VACANCIES
12.8% Overall
13.8% Core sector
9% Frame sector

16
CO
MM
ERC
IAL
Month in ReviewDecember 2019
◗ 30 Pirie Street – Known as Telstra House, the 23-level A grade office tower has recently undergone refurbishments and attracted tenants, with BAE Systems also securing space here along with Boeing.
◗ 11 Hindmarsh Square – SA Health renewed its lease in Hindmarsh Square in April of this year.
Overall, the office sector in Adelaide has performed steadily throughout 2019. The ongoing land tax debates continue to halt investment by private investors. The proposed changes to the South Australian land tax system would reduce the top rate of land tax to 2.4 per cent but would eliminate the ability of owners to aggregate their tax expenses across different entities. The PCA has been vocal in its scrutiny of the changes to the aggregation rules and we expect to see the debate continue into the near future.

17
CO
MM
ERC
IAL
Month in ReviewDecember 2019
PerthThe Perth office property market maintained the status quo in 2019.
The Property Council of Australia Office Market Report published in July 2019 indicated that the total vacancy rate for office space in the Perth CBD was 18.4 per cent, down from 18.5 per cent recorded six months prior.
Although the vacancy rate recorded in July 2019 was the lowest since July 2015, Perth’s CBD still has the highest vacancy rate of all capital cities in Australia.
Property owners continue to be proactive in trying to entice existing tenants to recommit and also in order to attract new tenants.
Generally speaking, both rental incentives and rental rates have stabilised however the disparity between rental rates achieved for Premium and D grade space remains pronounced. Incentives for quality buildings in Perth’s core CBD have experienced some downward pressure with occasional signs of growth in the space needs of particular tenants, yet incentives are still being offered in the marketplace (typically between 25 per cent and 50 per cent).
There are no significant building projects in the pipeline until 2020 however the revitalisation of the CBD landscape with major infrastructure projects
such as Elizabeth Quay continues to move ahead.
The emergence of co-working space has been a talking point throughout the year with the number of offerings in Perth having increased substantially. The popularity of these spaces appears to be driven by the increasing number of small businesses and start-ups entering the market with a need to minimise overheads. Corporate entities are also showing an interest in taking up these flexible work places rather than secure fixed term lease agreements as a risk mitigation measure given the local economic climate.
In terms of capital transactions, demand for office property in the Perth CBD has been felt predominantly from institutions and foreign (south-east Asian) buyers seeking counter-cyclical acquisitions of secondary assets with good prospects for re-positioning.
In recent activity, industry sources indicate the 17-floor BGC Centre (28 The Esplanade, Perth) is under offer to the Singaporean based Redhill Partners for circa $100 million. Fund managers such as Redhill Partners, Centuria Capital and EG Funds Management have been particularly active in this space throughout 2019. Sales in the CBD have shown (analysed market) yields in the order of seven per cent to 8.75 per cent during the year.
The West Perth office market has not fared as well as the CBD for the six months to July 2019 as the total vacancy rate rose from 14.8 per cent to 16.9 per cent. Similar to the Perth CBD however, vacancy rates for A grade space actually tightened during this period, however this was offset by a substantial increase in vacancies for lower grade premises.
Face rents for A grade accommodation in the West Perth office district tend to be lower in comparison to the CBD and typically fall between $200 and $275 per square metre per annum.
There were very few sales of stand alone office buildings in West Perth during 2019. The lack of quality office stock with medium to long term WALEs combined with subdued economic conditions has affected transaction activity.
In summary, whilst it feels like the worst of the market conditions are behind us, there remain some challenging times ahead for owners of lesser grade and strata titled accommodation. These asset types continue to suffer from poor interest and an oversupply of available stock.
As Yazz and the Plastic Population sang, “the only way is up, baby”.
Western Australia
$200-$275Face rents per square metre per annum for
A grade in West Perth.
The emergence of co-working space has been a talking point throughout the year with the number of offerings in Perth having increased substantially.

18
CO
MM
ERC
IAL
Month in ReviewDecember 2019
CanberraThe Canberra office sector throughout 2019 has witnessed continued stabilization, tightening of vacancy rates for premium (A and B grade) stock as well as increased vacancy for non-centralised lower grade commercial stock. The growing discrepancy between prime and secondary stock uptake levels is expected to continue into next year with new premium offerings coming online in early 2020 reinforcing an increasingly competitive leasing environment.
Incentives have continued to increase throughout the year in both prime and secondary sectors with agents reporting average incentives for A grade stock being as high as 20 per cent. Demand for more specialised and flexible tenancies continues to drive the refurbishment of secondary office stock to meet market expectations.
A popular trend witnessed in 2019 was the emergence of the small scale shared co-working space. Spaces which traditionally would have been single tenanted are being refurbished with shared amenities including kitchen, printing facilities and meeting rooms. The flexibility of these spaces allows them to be sublet to multiple tenants often negotiated on a price per desk basis.
Continued increases in municipal or council rates throughout the territory (often outweighing CPI
rental increases) has resulted in an increase in net leases. It is becoming more prevalent for landlords to elect to pass on any increases to outgoings over the base year to the tenant.
Australian Capital Territory
A popular trend witnessed in 2019 was the emergence of the small scale shared co-working space.

ResidentialDecember 2019

Liability limited by a scheme approved under Professional Standards Legislation.
This report is not intended to be comprehensive or render advice and neither Herron Todd White nor any persons involved in the preparation of this report accept any form of liability for its contents.
Entries coloured orange indicate positional change from last month.
National Property Clock: Houses
RE
SID
ENTI
AL
20
Month in ReviewDecember 2019
RISING MARKET
Start of Recovery
BOTTOM OF MARKET
DECLINING MARKET
Approaching Bottom of Market
PEAK OF MARKET
Approaching Peak of Market
Starting to Decline
AlburyBathurstCanberra
DubboSunshine CoastTamworth
Kalgoorlie
Central Coast Wodonga
BroomeGeraldtonSouth West WA
AdelaideAdelaide HillsAlice SpringsBarossa Valley
DarwinIpswichPerthRockhampton
Southern HighlandsSouthern TablelandsToowoomba
Burnie/DevonportEmeraldHervey BayHobartKarratha
LauncestonMilduraMount GambierShepparton
Ballina/Byron BayBrisbaneBundabergCairnsCoffs HarbourGeelongGladstoneGold CoastIllawarra
LismoreMackayMelbourneNewcastlePort HedlandSydneyTownsvilleWhitsunday

Liability limited by a scheme approved under Professional Standards Legislation.
This report is not intended to be comprehensive or render advice and neither Herron Todd White nor any persons involved in the preparation of this report accept any form of liability for its contents.
Entries coloured blue indicate positional change from last month.
National Property Clock: Units
RE
SID
ENTI
AL
21
Month in ReviewDecember 2019
RISING MARKET
Start of Recovery
BOTTOM OF MARKET
DECLINING MARKET
Approaching Bottom of Market
PEAK OF MARKET
Approaching Peak of Market
Starting to Decline
AlburyBathurstSunshine Coast
TamworthWodonga
CanberraKalgoorlie
PerthSouthern Tablelands
BroomeGeraldtonSouth West WA
Central Coast
AdelaideAdelaide HillsAlice SpringsBarossa ValleyBrisbane
Coffs HarbourDarwinGold CoastIpswichRockhampton
Southern HighlandsSydneyToowoombaWhitsunday
Burnie/DevonportDubboHervey BayHobart
KarrathaLauncestonMilduraMount Gambier
Ballina/Byron BayBundabergCairnsEmeraldGeelongGladstoneIllawarra
LismoreMackayMelbourneNewcastlePort HedlandSheppartonTownsville

22
RE
SID
ENTI
AL
Month in ReviewDecember 2019
OverviewThe end of 2019 is in sight and markets across Australia, having worked through the spring selling season, are preparing for the Christmas period. Over the coming weeks you’ll begin to see an increasing number of retrospective reports about Australia’s real estate market – but we’ll be among the first.
We’ve seen wide and varied results again this year, another demonstration that it’s impossible to accurately describe our nation’s residential property sector as a single market.
SydneyAt the beginning of 2019 we forecast that the wider market would continue to weaken up until the state and federal elections, with a plateau post-election if other economic indicators remained the same. As it turned out, our predictions were accurate regarding the elections being a line in the sand.
What we didn’t predict however was the outcome of the federal election, which meant the well publicised changes to negative gearing and capital gains tax didn’t eventuate. It is likely that the market had already factored in these taxation changes, which meant that the election result kick started a more positive sentiment. Agents anecdotally reported to us that within weeks of the election, their phones were once again ringing hot with renewed interest from both vendors and purchasers.
Since then, an easing of APRA policy for residential mortgage lending along with three interest rates cuts has prompted a surge in
activity in the first home buyer and upgrader markets. This has resulted in a much quicker than anticipated rebound in values in a number of areas, particularly those that experienced larger declines during the downturn.
Given the above, we have marked ourselves a seven out of ten in regard to our start of year predictions.
With interest rates down to record lows in October, the market recovery appears to be in full swing with CoreLogic reporting 5.71 per cent growth in the most recent quarter (as at time of writing) across the Sydney metro area. However, it is important to note that year-on-year, RP Data is still recording a 1.58 per cent loss to the median value. Interestingly, on a year-on-year basis (across the Sydney metro area) units are outperforming houses at +1.29 per cent and -2.45 per cent respectively.
The new unit market is probably seeing more of a mixed recovery with pockets of oversupply along
New South Waleswith well publicised issues around significant building defects and flammable cladding concerns. It is almost twelve months since the Opal Tower was evacuated due to significant building issues. Since then a number of other unit complexes, including Mascot Towers, have been identified as having significant building issues. In addition to the building defects, approximately 444 complexes have been identified as having non-compliant cladding.
Settlement valuations were still a concern for a number of new unit complexes with values coming in lower than the off the plan prices agreed upon in a stronger market. Many of the units we were valuing in 2019 were purchased off the plan at around the peak of the market.
Inner Sydney/Eastern SuburbsWithin the inner city, investor heavy markets have been slow to recover with Hometrack reporting largely stable unit values within areas such as the CBD, Zetland and Waterloo. Conversely, median prices for houses within city fringe suburbs have improved slightly, with Hometrack showing Surry Hills having recovered from a low of $1.49 million in March to $1.635 million in October.
Local agents are reporting that markets where significant interest was lost throughout early 2019 are now springing back to life, including Redfern, Darlinghurst, Pyrmont and Annandale. Furthermore, it appears that the improved affordability and lower interest rates have spurred first home buyers to enter the market. The ABS reports that “first home buyers comprised the Mascot Towers Source: Sydney Morning Herald

RE
SID
ENTI
AL
Month in ReviewDecember 2019
23
95 Sturt St, Kingsford Source: PriceFinder
Now…
95 Sturt St, Kingsford Source: PriceFinder
95 Sturt St, Kingsford Source: PriceFinder
Another notable example of how the market has performed this year is 95 Sturt Street, Kingsford, which sold in October 2018 for $1.7075 million and comprised a completely original 1930s style bungalow on just over 400 square metres.
Since then, the property has been fully refurbished and extended to the rear with an open plan style living area which opens to a large rear deck that can also be used as additional alfresco style living space.
In just over twelve months, the property has undergone extensive works and recently sold at auction for $2.615 million and appears to have captured the recent lift in property prices. The selling agent explained that there was very strong interest in this property as there are limited options for this style of property and price point, which is pushing prices higher. It is also located within walking distance of the last stop on the south-east metro line, which is close to opening.
Then…
95 Sturt St, Kingsford Source: PriceFinder
largest proportion of national owner occupier mortgage activity since early 2012…comprising 29.8 per cent of owner occupier loans nationally” which is 4.8 per cent above the long term average of 25 per cent.
According to ABS data, investor demand still appears to be holding at weaker levels, having decreased from its peak of 43 per cent in 2015 to 26 per cent in August 2019, well below the long term average of 34 per cent.
Generally, the surprise this year has been the resurgence of interest in the inner-city markets. This appears to be largely driven by lower interest rates and post-election confidence.
Some parts of the inner city may be benefiting from the near completion of the light rail through Surry Hills and Centennial Park.
One memorably high result was an attached terrace in Surry Hills which sold for $1.71 million in July. The property comprising three bedrooms, one bathroom and no parking on just 83 square metres of land was initially offered with a buyer’s guide of $1.5 million, with highly comparable nearby sales within the previous month selling at around $1.6 million.
8 Prospect St, Surry Hills Source: BresicWhitney
In just over 12 months the property has undergone extensive works and recently sold at auction for $2.615 million and appears to have captured the recent lift in property prices.

RE
SID
ENTI
AL
Month in ReviewDecember 2019
24
204/42 Pinnacle Street, Miranda Source: realestate.com.au
Duplex sites are still experiencing subdued interest as lending criteria is still very tight for a construction loan involving multiple dwellings.
PrestigeAfter a long period of strength and buoyancy in the Sydney prestige residential market (above $5 million), we finally experienced some stabilisation, as predicted at the beginning of the year. As with the general residential market, high quality properties in prime locations continued to achieve good results, but properties in secondary locations and properties which had peculiar characteristics struggled in terms of selling period and sale results. This was most evident in the first half of 2019 as the heat really came out of the market and although we didn’t see any dramatic falls in value, the number of transactions above $5 million decreased substantially.
In the Month in Review edition published at the start of the year, we touched on the number of transactions above $10 million in 2018, with Vaucluse having 18 such sales and Bellevue Hill having 15 sales above $10 million. In comparison, Vaucluse has had three sales and Bellevue Hill has had six sales above $10 million so far in 2019 (pricefinder.com.au), clearly showing the reduced
will have on the local community and future development of the area.
NORTHERN BEACHES DWELLING STOCK LEVELS
MONTH 2019 2018
August 490 592
September 516 622
October 564 718
(source: SQM Research).
SouthThe year started slowly with a weakening market that appeared to be set in for the year, however post election and interest rate decreases, the market has started its recovery. Local agents are noticing an increase in the number of buyers currently in the market at open homes and auctions, with dwellings under $1.5 million and units under $1 million seeing the highest demand.
We predicted an oversupply of units from Miranda through to Kirrawee as a large number of complexes were due to for completion. There is still a problem of oversupply as these complexes have only finished construction over the past few months. There has only been a handful of resales within these new complexes and the resale values are generally slightly less than the original purchase price paid two to three years prior.
A one-bedroom, one-bathroom unit with two car spaces at 204/42 Pinnacle Street, Miranda sold off the plan for $574,000 in May 2017 and recently resold for $510,000 in September 2019.
Northern BeachesOverall, the Northern Beaches market played out reasonably as predicted and consistent with the wider Sydney market. The major exception and biggest surprise was how sharply the housing market rebounded in the second half of the year. We originally anticipated the market to bottom out in 2019 but were not anticipating the level of capital growth and strong buyer activity currently in the market.
This was particularly evident in the sub-$2 million housing bracket due to the amount of investors and first-home buyers who are more sensitive to regulatory and monetary policy changes. It felt as though the spring market started a month early as vendors were encouraged to capitalise on the positive market conditions and to list before the spring influx that never really eventuated. Dwelling stock levels were extremely low in the second half of the year, approximately 23 per cent lower year-on-year in the months of August, September and October as per the table below (source: SQM Research). This was really one of the fundamental drivers of the housing market and resulted in a strong back end of the year.
We also mentioned the potential Mona Vale Road upgrades that fortunately commenced in 2019. It is still premature to assess the impacts the upgrades will have on the proposed Ingleside development, however it is encouraging to see much needed infrastructure upgrades commencing and the positive benefits these
The year started slowly with a weakening market that appeared to be set in for the year, however post election and interest rate decreases, the market has started its recovery.

RE
SID
ENTI
AL
Month in ReviewDecember 2019
25
needed to be on point with their price range in order to snare a sale.
For the Casino/Kyogle areas, market activity for the first six months was relatively steady albeit at a more sedate pace compared to the regional centre of Lismore.
However, rental accommodation became rather tight. This was primarily due to new people coming into the area of which a majority were just not ready to buy into the market. Hence, already limited rental stock became even more stretched.
During the last half of 2019, market activity in Lismore, Casino and Kyogle has generally tapered off. Even with three RBA rate cuts in 2019 from 1.50 per cent in February 2019 to 0.75 per cent in October 2019 does not appear (as yet) to have caused overwhelming confidence. The fallout from the banking commission and resultant tightening of lending conditions would have played a part as well. Any progress from here will largely rest on the shoulders of the lenders and how they make their next move to coax the wary customer into action.
It clearly is not a situation where the borrower rocks up to the lender with an empty dinner bowl and says “Please Sir, can I have some more?” to which the lender replies “Yes, of course, just supply your three last payslips, yearly credit card and bank statements and explanation of your over-usage of your Netflix account…and then we can talk”.
One thing hasn’t changed though since the beginning of the year…and that is the persistent cry of the real estate agent for more quality listings like the “clear ringing of silver trumpets on a chilly winter morn”. They have buyers….but no one really wants to sell.
One of the surprises for the year was the continued demand for the larger rural lifestyle product of
relatively short hiatus. Although some of this increased activity may be attributed to seasonal effects, it is clearly evident that a positive trend is emerging in this higher value sector of the market.
Amongst all of the talk around the softening market, particularly in the first half of 2019, we received the news in October that the most expensive residence in Australia has transacted for $140 million. The property comprises a penthouse and sub-penthouse apartment, purchased in one line, to be situated in the yet to be built Tower 1 Development at Barangaroo South. The complex is earmarked for completion in 2023 and the purchasers will reportedly utilise the penthouse as their main residence, with the sub-penthouse to be configured as separate living quarters. This sale is a reminder that the Sydney prestige property market is alive and well and is considered highly desirable both locally and abroad.
Lismore/Casino/KyogleAt the start of the year, it was predicted that “the residential market for the year ahead in the Lismore area is expected to hold ground with a steady as it goes vibe” and the Richmond Valley/Kyogle Council areas were to experience some softening.
Hmmm….it kinda was a game of two halves.
During the first six months of the year, the Lismore City area showed some admirable resilience with the residential property market across most suburbs (apart from North Lismore and South Lismore) showing some pleasing gains, particularly in Goonellabah where there were 30 odd house sales in the $500,000 plus price range. Well-presented rural residential stock with added features such as creek or river frontage, pool or rural views still appeared to turn over reasonably well. The other less desirable lifestyle product
market activity experienced throughout this year in the affluent eastern suburbs.
Sydney’s Lower North Shore prestige market experienced a similar trend throughout 2019, with a clear drop in sales activity. Prices at the prestige level in this area appear to have softened in the first half of 2019, but as with other prestige areas of Sydney, the declines have been subtle.
However, the softened market conditions across the Sydney prestige market seem to have been relatively short lived. The second half of 2019 is already seeing a greater number of transactions and returning confidence to the market after a
Artist Impression - Barangaroo Towers Source: Domain.com.au

RE
SID
ENTI
AL
Month in ReviewDecember 2019
26
behind the positive property market trends of 2018 continued into 2019.
Coffs HarbourLooking back at the year, the Coffs Harbour market has been on a bit of a roller coaster ride getting off to a slow start and increasing pace as the year progressed.
The slower market conditions at the start of the year were attributed to reduced interest which was evident from capital city markets, increased APRA lending restrictions for broader investment loans and media reports of declining market conditions, especially within Sydney and Melbourne. Our market, like the capital cities, was impacted by the fallout from the Royal Commission into banking practices and the resultant negative effect on lending policies and available finance.
Since the recent interest rate reductions to a record low 0.75 per cent, we have seen a resurgence in market activity. Current evidence indicates market enquiry and sales rates have
slow, no noticeable falls in value levels were experienced. The second half of 2019 has seen a moderate increase in market activity, however local agents still report that listings need to be priced appropriately for any interest to be generated.
The prestige market in the sought after coastal locations of Lennox Head, Skennars Head and East Ballina as well as the sought after rural localities towards the north of the Shire remain strong which can be partly attributed to the recent upswing in the Sydney and Melbourne markets. Local agents report limited stock available for sale across this market segment, creating some upward pressure on value levels, however again listings need to be priced appropriately
Clarence ValleyThe Clarence Valley performed mostly in line with predictions over the 2019 period. The region continued to see market momentum roll over from 2018 fuelled primarily by the Pacific Highway and Grafton Correctional Centre upgrades. As predicted, these projects and their associated workforces, as well as the locale’s relative affordability, desirability and quaint beachside appeal, are likely contributors to the increase in median house price in beachside Yamba, which has risen to $550,000.
Further south in Grafton, predictions also came to fruition. The Grafton residential market saw a noticeable stabilisation in the recently rising median house price with no positive shift recorded for the 2019 period, albeit that the rate of sale recorded has already surpassed that of 2018. Overall as predicted, many of the primary influencing factors
20 hectares plus with a well-presented dwelling and ancillary buildings and ground improvements, particularly for properties in close proximity of the regional centre (Lismore) and the rural townships (Casino, Kyogle). We also noted a steady demand for larger tracts of good quality grazing land in the areas between Lismore, Casino and Kyogle. However, as the drought and dry conditions look likely to continue for some time yet, it would be a very brave person to predict that the demand for such a property type would improve. I mean…no grass, no feed for stock and creek water drying up?? Who wants to pay for tank water every two months or so?
We also noted that the breakthrough in 2018 of suburban properties in Lismore City breaching the $600,000 price bracket continued well into 2019. This is seriously big money in these parts. However, as the number of sales mount up, it is something that cannot be dismissed as being an anomaly. It appears to be the new norm for the upper end of the market in Lismore City.
In summary, the residential and rural residential property market for Lismore, Richmond Valley and Kyogle Council areas for 2019 improved steadily for the first half of the year. The remaining half of the year has tapered off, but with lack of stock to sell, good quality properties should hold value and would be keenly picked off if offered for sale by approved buyers hiding in amongst the trees ready to pounce…..providing the lenders do their bit.
Cheers!
BallinaThe market throughout the Ballina Shire began the 2019 year somewhat slowly after heated market conditions throughout 2016, 2017 and early 2018. Whilst market conditions were comparatively
Since the recent interest rate reductions to a record low 0.75 per cent, we have seen a resurgence in market activity.
Sold for $2.1 million in August Source: realestate.com.au

RE
SID
ENTI
AL
Month in ReviewDecember 2019
27
We predicted there was a ten per cent chance that the market would rebound. We then said there was a 30 per cent chance of a balanced market. At this point our maths failed us and we said that whatever was left over was directed towards the downturn continuing. Hedging our bets quite nicely we would suggest. We then spent a few paragraphs waxing lyrical about why predicting the market direction was really hard. We definitely hammered that home. Probably overkill.
In reality, you could make an argument that the market has rebounded from its nadir around May this year. Supporting the rebound theory is the continued occurrence of record or near-record sales occurring in many suburbs in Newcastle and the Hunter Valley. For further details see our most recent columns in Month in Review. Depending on which metric you choose to focus on, the stronger argument is that the market is largely balanced at present with the trend seen as improving by and large. Whilst we have record sales still occurring, we haven’t really seen a general increasing level of values. It’s too soon in the recovery for all that. Anecdotally we are coming across many properties that sold initially around 12 months ago reselling presently. There is not a great deal of variance in value from 12 months to now based on these sales. In reality some are selling for less and some are selling for more.
What has been the catalyst for confidence returning to the market? Its multi-faceted (full disclosure: we looked that up, we know you know we didn’t know that word). The election result was a tipping point. Traditionally, elections slow the property market and uncertainty of elections and
Oh… you insist that we have a quick look do you? Ok then, fine. Reading between the lines of our first prediction and discussion point, (we did meander a touch at this juncture if we are truly honest), it was an assertion that the Australian cricket team was on the decline. We hit the important stuff right up front it seems. We tenuously linked this event to the Newcastle property market. Having read it back for research, the point appears completely organic and seems to work quite nicely, so big tick there for us. As to the substance, the cricket team lost the T20 World Cup and won the Ashes. Up and down form there we would suggest and fully supports our adopted position.
Moving to the next point, clearly we nailed it, the fine print being we left it broadly open-ended enough to come true regardless. We are sheepishly looking around the room at each other collectively feeling like one of those fairground charlatans. Successful fairground charlatans to be sure, make no mistake on that score. We have the rapt crowd staring at us in awe with mouths open catching flies for how naturally brilliant we appear. Some kind of wizardry clearly just happened. However the reality is that we used basic sleight of hand and a few cheap shenanigans while they weren’t looking.
How did we do it you ask? How did the lady, who was quite clearly cut in half with a well-used, but suspiciously clean saw, suddenly extract herself from the box and start strutting around like it never happened? We used the old “percentage chance of multiple outcomes occurring, but covering all bases trick” trick. Sorry. It’s a bit like horoscopes really.
increased with most good quality property types holding value. There is still some buyer resistance for property that is overpriced, lacking in key features or situated in a secondary location, however there is good demand and some continuing increases in value being experienced for entry to mid-level residential product.
The prestige market ($1 million plus) has also increased with leading real estate agents reporting increased buyer enquiry, although this market is traditionally more thinly traded and reliant on out of town purchasers, typically coming from the capital city markets. Given the recent rebound in the capital city markets, selling agents are reporting that this out of town market is coming back. We have recently seen our first $2 million plus beachfront sale, the first since 2015 and making a total of eight since 2007. This statistic indicates the thinness of the Coffs Harbour residential prestige market priced greater than $2 million.
We have seen no real disparity between the owner occupier, investor, first home buyer or rural residential versus town purchaser with all market sectors seeming to have lifted since the interest reductions. The RBA decision to reduce interest rates has definitely created strong real estate activity across the board. We will have to wait and see whether we see this flow into the retail sector.
NewcastleWe have been asked to score the property predictions outlined with a great deal of confidence back in our February 2019 issue. Don’t do anything unless you do it confidently is our advice. As luck would have it, we predicted we would be asked to do this well before we were asked and therefore award ten points to Gryffindor. We are that good. We feel so confident in this that we haven’t even reviewed our predictions.
You could make an argument that the market has rebounded from its nadir around May this year.

RE
SID
ENTI
AL
Month in ReviewDecember 2019
28
We mentioned the region’s peninsula areas of Umina Beach, Woy Woy and Ettalong would be challenged in terms of values being sustainable and for the most part, values have come back a little but not too much overall.
A large level of focus was on the unit market within and around the Gosford CBD. The developments under construction for the past few years have been completed and settlements of purchases are being called. For the most part, the prices paid off the plan were okay on today’s values, but there were a few issues with not meeting the purchase prices for some developments.
IllawarraThe first quarter of the 2019 Illawarra property market continued on trend from the end of 2018, which saw the market continue to decline after the property boom experienced from 2013 to 2017. Unstable economic conditions, notably relating to employment growth and inflation, combined with the great uncertainty of the upcoming federal election in May contributed to the continuing declining property market in the Illawarra region. This decline was across all property sectors. At this time local agents were advising of longer selling periods, fewer buyers and decreasing sale prices.
Post the federal election in May, there was a renewed confidence in the Illawarra property market. This did not lead to drastic changes in the market, however it did seem to at the very least halt the declining market and begin to stabilise certain property sectors. The result of the federal election played a key and unexpected role in the sudden shift in the state of the market. Also a contributing factor to stabilising the Illawarra property market was the decision on 4 June by the Reserve Bank to lower the cash rate by 25 basis points to 1.25
Coast property market heading into the festive season on somewhat of a high. The increased activity together with limited stock has also seen a reduction in the days on market and modest price rises.
Of most surprise in 2019 was the milestone sales, namely the $2.97 million reached for a well publicised property breaking previous canal sales records within Port Macquarie.
Central Coast RegionAt the beginning of the year we commented amongst other things that the market would slow and that 2019 would be less prosperous than the previous year.
This has proven partly correct. The market did slow a little, but overall it pretty much ran without too much fanfare. Real estate agents report that attendances at open houses was down in the first half of the year, but back to normal toward the latter part.
Leading into the new year, we did say the local market had peaked and we think that has been proven.
We also said that some of our older suburbs toward the northern end of the region would gain some attention on the back of newer suburbs experiencing popularity. We mentioned areas such as Kanwal, Gorokan, Charmhaven and Toukley. As the year draws to a close, we did see a little more activity, but not as much as expected. Maybe next year.
Toward the middle of the region, we mentioned areas such as Narara, Niagara Park and Wyoming would leverage off the revitalisation of the Gosford CBD, but from what we can see, the limited availability of stock being sold prevented any great advances in this regard.
ensuing policy always translate into less activity. We make no judgment on policies and approaches of the parties; simply put, the uncertainty was made certain. Interest rates continued to lower in light of a softening economic landscape and serviceability requirements also loosened up over time as distance was put in to the banking Royal Commission. These factors have all made some impact on the local residential market.
As with all things, whether this is a fledgling recovery or small blip in a falling trend is largely unknown. It could go either way, just like the Australian cricket team. Full circle. Yes, we are that good.
Mid North CoastDuring the first half of 2019, demand remained slow along the Mid North Coast due to various factors including a softening of investor demand in the residential market throughout the region and uncertainty during the election run-up. Over this period, values stabilised and selling periods lengthened, returning to the more normal periods of up to four months.
Coastal towns within the region (especially the major regional centre of Port Macquarie) continued to see reasonable land sales activity in new subdivision developments, resulting in continuing but slowing building construction activity.
The May election with the Liberal/National coalition government win, three interest rate cuts between June and October and the relaxing of some lending policies have seen a steady increase in activity as the weather has warmed up. This has the Mid North
It could go either way, just like the Australian cricket team.

RE
SID
ENTI
AL
Month in ReviewDecember 2019
29
significantly, however as the year has progressed and transactions increased in spring, we have been surprised at the overall stability within the space.
Looking further north into the Wollondilly Shire, we have seen smaller rural residential holdings (ten hectares and under) around the Pheasants Nest and Bargo area the most heavily impacted with up to 20 per cent discounts being noted within this space.
Overall the start of 2019 was slow with transactions down and buyer interest across the board being limited, however as the year passed and we saw the back end of an election and a few interest rate cuts along the way, there are certainly better numbers starting to be achieved across the board and agents report a late spring flourish of buyers as Sydney appears to be back on an upward trend.
Southern TablelandsAfter peaking in mid-late 2018, the Goulburn region began the year with uncertainty, experiencing softer market conditions after a long period of strong growth. We saw properties across all sectors recording longer selling periods, weaker sale prices, a smaller number of buyers and fewer transactions, some areas experiencing larger declines than others. This was as a result of tighter credit availability, negative market sentiment and the uncertainty surrounding the federal election taking place in May.
With the end of 2019 drawing near, agents and valuers are noting more optimism across the board within the Goulburn property market as we shift from a declining market to a stabilising market. This is as a result of confidence being renewed in buyers post the election in May, another cash rate drop in October and overall market sentiment shifting. It is evident that selling periods have generally reduced in more recent times, there is stronger
We noted an oversupply of new land, particularly in subdivisions such as Renwick and Moss Vale’s Darraby Estate as at Quarter 4 2018, which brought increasing anxiety about discounts that may need to be applied as the market became saturated with vacant parcels.
Well, as predicted, these vacant lands sales have been negatively impacted by a softening market but not as severely as we had initially anticipated, with discounts of between five and ten per cent being seen on prices paid around the peak of the market. We have however seen a recent oversupply of cheaply built project homes within this section of the Renwick land release, which has impacted resale values as more and more of these listings hit the market and agents struggle to move them. We are seeing the better quality builds command a reasonable price, however overall we are still seeing the far better money commanded in the older section of the Renwick estate.
Looking at the rural lifestyle market in and around the Southern Highlands, it appears that this portion of the market has remained fairly strong overall, with most properties holding their values or commanding more as the year progressed. As always, quality of product has played a key role and anything purchased at an above market price in 2017 has seen slight corrections, however overall reports from local agents suggest that interest from Sydney buyers seeking weekenders or large good quality rural land holdings are still promising. Typically this rural residential space has been difficult to gauge due to a lack of transactions and this has certainly been the case in 2019 as transactions across all markets have dried up
per cent. Midway through 2019, local agents were advising of stronger buyer activity and good sale results.
As we head towards the end of 2019, the Illawarra property market continued to stabilise and showed some signs of slight growth. Another cash rate cut by 25 basis points to 0.75 per cent in October continued to bring first home buyers and investors back into the Illawarra property market. Valuers and agents alike are noting some strong sale prices and a decline in days on the market.
From the beginning of 2019 to now nearing the end of 2019, we have seen the Illawarra property market change from a declining market to stabilising mid-way through the year and now to more recently showing some signs of growth. This has been evident across most suburbs and property sectors. Uncertainty lingers about the new subdivisions in Calderwood, Tullimbar, Horsley, Wongawilli and Kembla Grange as well as new unit developments in and around the Wollongong CBD. Vacant land prices in these new subdivisions seem to have settled, however supply still outweighs demand and with more new land releases planned, this could be the sector which does not follow the rest of the Illawarra market.
Southern HighlandsLooking back at our February publication for the Southern Highlands region, our main points raised were impacts that a falling market may have on new land subdivisions and higher end rural acreage and lifestyle properties. So how did these play out as per our predictions?
Valuers and agents are noting some strong sale prices and a decline in days on the market.

RE
SID
ENTI
AL
Month in ReviewDecember 2019
30
previous 12 months. The vast majority (63 per cent) of all dwelling sales occurred in the $200,000 to $400,000 price bracket.
Unit sales have remained stable. Sales activity within this market however has returned to 2017 levels after declining to 53 sales in 2018. The decline was most likely due to the political uncertainty of the election and the fallout from the banking Royal Commission.
Once again, the median land price has remained stable, although the market has seen a significant reduction in the level of sales activity, declining from 152 to 118 over the past twelve months. Overall the market has remained stable, however there are early indications the market is beginning to decline slightly.
Probably the most surprising aspect of the market over the past twelve months has been the failure of the market to surge again with regard to sales activity, particularly in light of the cash rate being below one per cent and the re-election of the Liberal Party.
everyone was being saturated with news stories about the decline in the Sydney and Melbourne property markets and although prices held in our regional area, another form of uncertainty crept into the fast approaching spring property market. Coupled with daily reports on the drought, unrest in Hong Kong, the US-China trade war and climate change, it seemed the remainder of the year could get a little choppy as people closed their wallets with little prospect of wages growth and paused a little longer on property related decisions. With less stock hitting the market, agents reported sales were still moving but activity was lower as new listings slowed and spring was somewhat subdued across the region. There also appears to have been an increase in off market transactions and sales without the intervention of an agent.
All in all, 2019 to a great extent might be remembered as business as usual with a lot of background noise that did not really change our markets very much and reaffirmed the stability of our regional area that is for the most part, very grateful not to be subjected to the dreadful drought conditions further north. What would be a terrific finale is completely out of any market control…RAIN! Wishing everyone a safe, happy and restful festive season.
WodongaThe Wodonga market has slightly declined over the past twelve months with the median house price down five per cent from the same time in 2018. Sales activity in the housing sector also decreased slightly by around eight per cent on the
buyer activity and more transactions taking place, however this is typical when spring is in full swing. Whilst conditions appear to be improving, inferior quality properties and those in secondary locations are still expected to struggle in the current market.
AlburyIn 2019, the Albury-Wodonga and north-east Victoria property market has shown resilience set against an eventful year for national and global issues. The first half of the year was dominated by the federal election looming in May. This uncertainty created some hesitation in the market as a whole but also mobilized investors fearful that if they did not buy before the election, they may not qualify for exemptions from a new set of property related policies if Labor won.
A good example of this behaviour was in the snow village of Dinner Plain, 13 kilometres up the road from Mount Hotham, where one local agent had an Easter ski chalet buying frenzy fuelled by pre-election jitters. Interestingly this market has remained strong for the remainder of the year, whereas the trendy tourist township of Bright at the foot of the Alpine area appears to have stabilized after a sustained and phenomenal hike in demand and growth over the past three years. The owner occupiers of the region pre-election adopted a very stoic wait and see attitude and agents reported a drop in sales activity and listings as people held off any big decision making.
So the post-election scenario, given the status quo was held, should have meant a return to the pre-pre-election status, however by this time
Whilst conditions appear to be improving, inferior quality properties and those in secondary locations are still expected to struggle in the current market.
63% Percentage of
sales since November 2018
between $200,000 and $400,000

31
RE
SID
ENTI
AL
Month in ReviewDecember 2019
Contrary to initial predictions, 2019 has become the year where banks, state and federal government are looking for ways to increase people’s borrowing capacity.
Median Sale Price
20…
2015
- Q
1
2015
- Q
3
2016
- Q
1
2016
- Q
3
2017
- Q
1
2017
- Q
3
2018
- Q
1
2018
- Q
3
2019
- Q
1
2019
- Q
3
House - Melbourne Unit - Melbourne House - Melbourne Metro
Unit - Melbourne Metro
$300k
$400k
$500k
$600k
$700k
$800k
$900k
Source: REIV, 2019
The federal government’s latest initiative is the First Home Loan Deposit Scheme starting on 1 January 2020, where the first 10,000 applicants will be eligible to purchase their first home using only a five per cent deposit. To be eligible for the scheme, buyers must be purchasing a property valued at or below these thresholds. This policy would be ideal for those looking to buy into the CBD as the average median unit price is $525,000.
MelbourneAs we draw close to the end of another year, it’s time to look back on our predictions from February to see how accurate we were in our insights for this year’s residential market in all regions of Victoria.
2019 has been an unpredictable year in the residential property sector. As forecast earlier in February, the fallout from Royal Commission along with the potential changes to negative gearing definitely rocked buyer confidence. As a result, the property market was very much subdued until the third quarter of the year when reductions to the cash rate by 75 basis points and lower mortgage serviceability tests resulting in the removal of barriers which allow banks and brokerage firms to better facilitate access to credit for borrowers started to have an impact.
Melbourne CBDIt was originally forecast at the start of the year that the property sector in Melbourne’s CBD would face a decline due to the influx of off-the-plan purchased apartment complexes coming onto the market at settlement due to purchasers being unable to raise finance. Whilst fluctuations remain in some areas, the CBD residential market has surprisingly remained steady and has even taken a turn for the better. As shown below, the median sale price of units has increased greatly from Quarter 1 to Quarter 3 of 2019. This could be the result of the property market stabilising from the conclusion of the federal election, two consecutive rate cuts by the Reserve Bank in June and July and the easement of home loan serviceability tests.
State/TerritoryCapital City/
Regional Centre Rest of State
NSW $700,000 $450,000
VIC $600,000 $375,000
QLD $475,000 $400,000
SA $400,000 $250,000
WA $400,000 $300,000
TAS $400,000 $300,000
ACT $500,000 -
NT $375,000 -
Source: NHFIC,2019
South-East It was noted at the start of the year that the suburb of Pakenham was previously known as one of Melbourne’s most active housing markets and it was forecast that it would face a softening in the first half of the year and stabilise in the second half of 2019. We were correct in this prediction.
Located approximately 54 kilometres south-east of the Central Business District, Pakenham has been one of the fastest growing suburbs in Melbourne in the last twenty years as it has been one of the major areas for new residential development in the south-east growth corridors and it is expected to continually increase in the future. Recent figures show that Pakenham is not
VictoriaAs forecast earlier in February, the fallout from the Royal Commission along with the potential changes to negative gearing definitely rocked buyer confidence.

RE
SID
ENTI
AL
Month in ReviewDecember 2019
32
later. Corelogic highlighted that in July 2019, there had been a 24.26 per cent drop in median house and unit prices. The change in house and unit prices was evident since November 2017 but year on year statistics did not highlight the severity of the decline. The market has positively corrected so significantly in the four months since July that Hawthorn is considered one of the strongest recovered suburbs from the downturn. 2020 will be an interesting year for property fanatics, eager to see what the market will produce coming into one of the most exciting times for prosperous growth and market movement in the past decade.
Inner & Outer North2019 has been a year of change, with several contributing factors confronting homeowners, investors and developers over the year. Key issues have influenced the market throughout the year which has been a year of two halves – downturn and recovery. Whilst some of the predictions made in January have come true, others have not. Development orientated areas such as Craigieburn, Kalkallo and Mickleham have seen the growth and affordability we expected and inner suburbs such as Northcote and Richmond performed better than expected. Whilst growth showed signs of a significant downturn over the first two quarters of the year, interest rate cuts encouraged home owners to borrow and therefore buy which has been seen in the Quarter 3 data. Although inner prices have pulled back over the year, Quarter 3 has indicated strong growth signs which has placed the median sales prices for most suburbs back to prices similar to the start of 2019.
Northcote, 3070, an inner north-eastern suburb of Melbourne has been one of the bigger winners in the area. The suburb boasted a nine per cent increase in the median sale price from Quarter 2 to Quarter 3 with the average home in the area
a huge increase from October 2018 to December 2018 when clearance rates were at 52 per cent. The steady correction in median house prices is highlighted most significantly in the graph below. It indicates a rise in median house prices in direct correlation with rising auction clearance rates.
The steepest increase in housing prices in over ten years occurred over the month of October with an increase of 2.3 per cent. Demand for housing right now could be attributed largely to the lowest mortgage rates we have seen in Australia since the 1950s, renewed consumer confidence in the government following the election, the RBA cutting the cash rate by 75 base points and the previously limited supply of housing options and has led to a huge demand across many regions of Melbourne, particularly the inner eastern suburbs.
Source: CoreLogic.com.au (2019)
In Hawthorn, the median house price at the beginning of March 2018 peaked at $2.479 million. Prices declined heavily over the following 12 months to a low of $1.71 million twelve months
only experiencing capital growth every year, but rental yields are above the metro average sitting at 3.8 per cent and 2.9 per cent respectively.
Recent figures show that sales in Pakenham have slowed yet remained steady, as dwellings have increased in sale price by 3.2 per cent from Quarter 2 to Quarter 3 after facing a slight decline from Quarter 1 to Quarter 2, averaging $500,000 in median sale price in comparison to the average Melbourne metro areas which increased in median sale price by 4.5 per cent to $830,000.
Median Sale Price
20…
2015
- Q
1
2015
- Q
3
2016
- Q
1
2016
- Q
3
2017
- Q
1
2017
- Q
3
2018
- Q
1
2018
- Q
3
2019
- Q
1
2019
- Q
3
House - PAKENHAM Unit - PAKENHAM House - Melbourne Metro
Unit - Melbourne Metro
$200k
$400k
$600k
$800k
$1,000k
Source: REIV, 2019
Inner & Outer East The market in the inner and outer eastern suburbs of Melbourne has seen months of prosperity coupled with declines in clearance rates at auctions, median house prices fluctuating over the course of 2019 and a sense of instability across the wider residential market in Melbourne. From January to March, clearance rates were rising and were at 64 per cent across suburbs in Boroondara, Stonnington and Yarra’s municipalities. This was
The steepest increase in housing prices in over ten years occurred over the month of October with an increase of 2.3 per cent.

RE
SID
ENTI
AL
Month in ReviewDecember 2019
33
the extensive population boom. The majority of suburbs did indeed cool for the first half of 2019 although in correlation with Melbourne’s inner west, the latter half has in fact started climbing in median house price. Although these outer suburbs in Tarneit, Melton, Wyndham Vale and Point Cook are in completely different regions of Melbourne west, they have all followed an almost identical pattern in 2019 in quarterly price changes and clearance rates as illustrated below.
Another prediction made at the beginning of the year was in regard to the increase in incentives being used to make purchasing land within the growth region more attractive. This rise in incentives definitely took place with many estates across Melbourne’s outer middle-outer western suburbs offering extremely high rebates of up to $40,000 and dropping land deposit limits to a mere five per cent. This tactic was rife when these regions were experiencing a cooling period
WestReflecting on our predictions for what 2019 would entail for Melbourne’s western suburban property market, it is fair to say that we were on the mark for the most part. At the beginning of the year it was believed that Melbourne’s inner-west would stabilise after it suffered a bout of negative growth in the latter half of 2018. Stabilise it did and the majority of inner western suburbs such as Williamstown, Yarraville and Altona have all actually shown median house and unit price increases from Quarter 3 onwards. After suffering a fall in the early part of the year, Williamstown has bounced back remarkably with median house prices increasing by around $140,000 in just six months which is illustrated in the graph below.
Median Sale Price
20…
2015
- Q
1
2015
- Q
3
2016
- Q
1
2016
- Q
3
2017
- Q
1
2017
- Q
3
2018
- Q
1
2018
- Q
3
2019
- Q
1
2019
- Q
3
House - WILLIAMSTOWN Unit - WILLIAMSTOWN House - Melbourne Metro
Unit - Melbourne Metro
$250k
$500k
$750k
$1,000k
$1,250k
$1,500k
$1,750k
Source: REIV – Market Insights
In regard to middle-outer western suburbs, outcomes were not exactly as predicted. We predicted that these regions would begin to cool after showing moderate growth in 2018 due to
costing a cool $1.3 million. This increase doubled that of the Melbourne metro area which as a whole, saw a 4.5 per cent increase in the median sale price. The increased price was also reflected by the clearance rates for the quarter, which was 93.8 per cent, also significantly higher than that of Melbourne metro at 78.3 per cent. Whilst this hot inner suburb has provided great upside in capital growth, rental yields remain under the metro average sitting at 2.6 per cent and 2.9 per cent respectively.
Median Sale Price
20…
2015
- Q
1
2015
- Q
3
2016
- Q
1
2016
- Q
3
2017
- Q
1
2017
- Q
3
2018
- Q
1
2018
- Q
3
2019
- Q
1
2019
- Q
3
House - NORTHCOTE Unit - NORTHCOTE House - Melbourne Metro
Unit - Melbourne Metro
$250k
$500k
$750k
$1,000k
$1,250k
$1,500k
$1,750k
Source: REIV – Market Insights
Although strong indicators of growth have been seen in the outer northern suburbs, capital growth has not outperformed rental yields, with suburbs such as Craigieburn recorded at 3.8 per cent for the quarter. The higher rental yield rate indicates a higher demand for rental properties in the outer suburbs, making them an extremely attractive investment for developers or first home owners. Whilst there was significant growth in the area, the suburb only saw a 4.7 per cent increase in the median sale price between Quarter 2 and Quarter 3. In comparison to the inner suburbs, the clearance rates were 76.2 per cent which signifies a lack of buying and demand in the area.
Reflecting on our predictions for what 2019 would entail for Melbourne’s western suburban property market, it is fair to say that we were on the mark for the most part.
Median Sale Price
20…
2015
- Q
1
2015
- Q
3
2016
- Q
1
2016
- Q
3
2017
- Q
1
2017
- Q
3
2018
- Q
1
2018
- Q
3
2019
- Q
1
2019
- Q
3
House - WYNDHAM VALE Unit - WYNDHAM VALE
House - Melbourne Metro Unit - Melbourne Metro
$300k
$400k
$500k
$600k
$700k
$800k
$900k
Source: REIV – Market Insights

RE
SID
ENTI
AL
Month in ReviewDecember 2019
34
looking for either their first home or an upgrade from a plainer dwelling.
Values for residential units have been more stable, in keeping with the trend observed over much of the past decade. Buyers are attracted to units for the higher gross rental return rather than potential for capital gain.
Developers of residential subdivisions have faced higher development costs during 2019, however appear to have been able to pass these increases on, with the cost of buying residential lots increasing by over ten per cent during the past year. This increase in sale prices is also attributed to a shortage of developed lots being released during the year.
If anything, the gap between land values in Mildura and Irymple and the satellite towns of Gol Gol and Red Cliffs has widened. We had expected that the higher cost in Mildura and Irymple would attract buyers to the satellite towns, however this has not occurred to any great degree.
Our region is starting to feel the effects of water restrictions, however it is too early to see whether this will weaken demand for homes on larger lots with more extensive landscaping. This will become more apparent over the coming summer months. The Mildura region still has comparatively easy access to garden water.
Finally, our prediction at the start of the year that there would be less activity in the top end of our market appears to have been accurate. As discussed in last month’s edition, we are not entirely sure why there have been so few sales over
affecting how much home buyers could borrow, affecting the market accordingly.
In this positive market turn for greater Geelong, Belmont and Newtown have shown the most promising signs of real growth with Belmont increasing its median sale price by $50,000 in just one quarter alone.
Median Sale Price
20…
2015
- Q
1
2015
- Q
3
2016
- Q
1
2016
- Q
3
2017
- Q
1
2017
- Q
3
2018
- Q
1
2018
- Q
3
2019
- Q
1
2019
- Q
3
House - BELMONT Unit - BELMONT House - Vic Regional
Unit - Vic Regional
$200k
$300k
$400k
$500k
$600k
Source: REIV – Market Insights
Mildura2019 has played out a little stronger than we expected. Houses have been selling relatively quickly and the median house price appears to have risen more than we anticipated at the start of the year. CoreLogic statistics show the median house price increased by nearly ten per cent to now be just under $300,000. Low interest rates and local economic growth have no doubt helped this trend.
The main action continues to be for well-presented homes in the $300,000 to $500,000 range. Most buyers in this segment have been owner occupiers
however now that the market is slowly but steadily bouncing back we can expect the use of these extravagant incentives to plummet.
As a whole, we give our overall prediction a seven out of ten for how Melbourne’s west property market unfolded. Our view that there would be stabilising and cooling periods did take place, as well as our statements that the Royal Commission would impact the market and that incentives would be used to attract buyers during these times. One major forecast which was missed was the current growth in the market which has taken place over the latter half of the year across the board in Melbournes west. It’s fair to say we knew a bounce back would occur, but not so soon.
GeelongGeelong saw its biggest property boom in history in 2018 and was labelled Victoria’s hottest property market. As Melbourne house prices decreased, Geelong steadily increased as it was sought after by many as a fantastic investment opportunity. A major prediction we forecast at the beginning of 2019 was that the greater Geelong property market would begin to level off after the strong growth it showed throughout 2018. Our prediction was correct in that there was a slow in the market however we did not expect the cooling period to come around so quickly. Apart from a few established suburbs such as Highton and Wandana Heights, the vast majority of suburbs suffered price drops in median house pricing for the early part of 2019.
The market however took a turn in suburbs such as Newtown, Belmont, Hamlyn Heights and St Albans which have all started showing median house price growth for the latter half of the year. This sudden burst of growth which has occurred once again is largely due to financial regulators’ relaxed rules
CoreLogic statistics show the median house price in Mildura increased by nearly ten per cent to now be just under $300,000.

RE
SID
ENTI
AL
Month in ReviewDecember 2019
35
$1 million in 2019. Fewer properties being offered for sale still appears the most likely factor, but possibly buyers at this end of the market are being more cautious.
SheppartonThe local property market has remained buoyant throughout 2019 even though there was a lull in sales during winter. Demand for investment properties from Melbourne buyers is still strong and vacancy rates have stayed tight. New housing in the area is still steaming ahead, even though a few estates have now either sold out or are in the final stage, such as Connolly Park and Northside estates in the north and Riverwood Park in Kialla.
The industrial development along Doyles Road on the eastern fringe of Shepparton is very promising, fostering both construction jobs and ongoing manufacturing jobs. Coupled with the Goulburn Valley Health redevelopment bringing construction and then an ongoing 600 jobs is a strong boost to the region.
Two new large-scale housing developments have been recently announced by council. The precincts known as Shepparton North East and Shepparton South East will both be located along Doyles Road/Shepparton Alternate Route and are planned to accommodate 1,500 and 2,500 homes respectively, or 4,000 and 6,000 residents. By comparison, the Kialla Lakes estate which has been a jewel in Shepparton’s housing estate crown since the mid 1990s has only just hit around 1,400 homes in the most recent land releases. Works are due to commence on the South East development next year, with the North East yet to be confirmed.

36
RE
SID
ENTI
AL
Month in ReviewDecember 2019
BrisbaneBrisbane presented plenty of promise going into 2019. I believe we coined the phrase “restrained optimism” to describe our expectations when making predictions earlier this year. We said our region would continue to attract affordability-driven capital city seekers, but values across most markets would relatively remain flat.
And, for the most part, we were on the money.
$0
$100,000
$200,000
$300,000
$400,000
$500,000
$600,000
$700,000
Jan-
90Ja
n-91
Jan-
92Ja
n-93
Jan-
94Ja
n-95
Jan-
96Ja
n-97
Jan-
98Ja
n-99
Jan-
00Ja
n-01
Jan-
02Ja
n-03
Jan-
04Ja
n-05
Jan-
06Ja
n-07
Jan-
08Ja
n-09
Jan-
10Ja
n-11
Jan-
12Ja
n-13
Jan-
14Ja
n-15
Jan-
16Ja
n-17
Jan-
18Ja
n-19
0
2
4
6
8
10
12
14
16
18
Med
ian
Dw
ellin
g Pr
ice
(Bris
bane
)
Year
Bank
Rat
e (%
)
Median Dwellling Price Interest Rate
Median Dwelling Price (Brisbane) vs Bank Rate
Source: CoreLogic – RP Data, Reserve Bank of Australia, Australian Bureau of Statistics
Source: HTW
But, we’ll refrain from claiming Nostradamus status for the moment because, in truth, this is how our market has always operated. We aren’t historically prone to huge fluctuations like Sydney and Melbourne, but rather (as a generalisation) take a steady-as-she-goes approach to price movements.
Looking at the upside, Brisbane continued to enjoy an increasing Net Interstate Migration (NIM) result as demonstrated by this chart:
SEQ House Sales & Net Interstate Migration
Source: Australian Bureau of Statistics
SEQ 20 year avg sales: 50,758
e = Migration based on 9 months annualised data
Source: HTW
The small dip at the end does allow for an annualised figure, but compared to ten years ago, 2019 has seen a relatively impressive NIM outcome. It’s a number that property owners should keep an eye on, because rising NIM usually tracks in tandem with increased real estate values. If it establishes an upward trend, our market can potentially be hotter than a December day at Southbank.
That said, there were some macro challenges to tackle in 2019.
Significant headwinds manifested via the fallout from the Royal Commission, APRA’s tighter lending guidelines and, of course, the federal election.
Throughout all this, Brisbane’s market experienced limited activity and demand, with a slight softening in values across the wider city.
Following the election and interest rate drop mid-year however, confidence returned and buyer activity increased with the market correcting and stabilising right through to this tail end of 2019.
Let’s drill down a bit further though.
By price sector, performance was varied. Assets priced sub-$2 million were most affected by the tighter lending conditions. Many purchasers looking to access funds had a hard time securing their dollars. We also anecdotally observed that property listed for sale was taking longer to sell and vendors were tempering their price expectations. In addition, finance clauses on contracts were being pushed out to between 21 and 28 days and sellers were being conditioned by their agents to agree to this.
For properties priced above $2 million, the waters were a little calmer. These buyers didn’t seem to be affected, due to their strong cash position and equity and as such the higher price points and prestige market performed reasonably soundly, albeit with limited stock available for purchase.
Looking at our city by location, we stayed true to our history of growth by proximity to the CBD. Demand for suburbs closest to the city centre was consistently better than for most of the fringe suburbs. Certainly, demand from cashed-
Queensland
Looking at our city by location, we stayed true to our history of growth by proximity to the CBD.

RE
SID
ENTI
AL
Month in ReviewDecember 2019
37
and it must be admitted, we did not expect to see such encouraging signs at the moment.
CentralOur predictions were that prices in suburbs such as Burleigh Waters, Mermaid Waters and Broadbeach Waters may have reached a peak as the market was quite heated at the time. Almost twelve months later and these areas have remained resilient. Local agents are still reporting strong levels of demand for housing in these suburbs and price levels have not weakened. Due to a lack of stock in these areas, neighbouring areas such as Miami have benefited as buyers look for an alternative option as a result of the shortage. There are no signs of market activity easing in these areas moving into 2020.
In early 2019 it was expected that there would be a slowdown in construction and sales activity, particularly of new highrise projects around Surfers Paradise and this seems to be the case, however there appears to still be quite a bit of action around the Broadbeach precinct and towards the southern end of the Gold Coast.
We also made a safe bet that suburban housing in Benowa and Ashmore would remain stable throughout the year. Current feedback from local agents indicates that lately there are still good levels of demand for detached housing and that’s in all price brackets, and also for units, but in the more affordable price range. A positive upswing in the local market has also been noticed here in the couple months. Again, it was reported that stock levels remain low and properties are selling within a reasonable marketing period.
remains high from buyers and that’s translating into a handy premium for some property owners. Ask anyone looking to get into the State High catchment next year and you’ll hear tales of tough battles to secure real estate.
We’ve also anecdotally seen an increase in owners choosing to renovate rather than sell up and move. This is the result of multiple influences. Tough finance means it isn’t as easy to get a loan for the new home. In addition, the figures show that if you can create the living space your family needs by modifying your current abode, it’s much cheaper than dealing with the selling and buying costs of trading into a new residence.
So, in summary, our market pivoted mid-year to become a bit more confident, with excellent indications of sustained, long-term capital gains, particularly for detached housing within cooee of the CBD.
A merry Christmas and happy new year to everyone from all of us here at Herron Todd White Brisbane.
Gold CoastAt the beginning of the year, a few questions were posed and some market predictions were made concerning the central areas of the Gold Coast.
Overall, we anticipated the local market to continue to soften throughout 2019. After the first two quarters of this year, there were signs of the market cooling but generally speaking it remained stable, if not at times being slightly inconsistent. However, there has been a noticeable change in the market particularly over the September/October period
up interstate migrants for high-quality, lifestyle-oriented homes played a role in this.
Median House Price Growth 2011 - 2019
Source: CoreLogic – RP Data
>30%
16 - 30%
0 - 15%
Source: HTW
In addition, near-city suburbs are seen as providing good quality, long-term stock worth holding onto. If you can afford to secure something within CBD proximity and it’s a detached house (and you can service the debt for a cycle or two), you should generally be fine in terms of value resilience.
Middle ring positions also did pretty well and while some of the outer burbs saw price increases, the biggest rises were still within an easy jog of the CBD.
Housing again held its own compared to units. There’s just no denying Brisbane folk love their land.
Investor style units continued to see price softening, but price retractions in response to oversupply are slowing.
Perhaps the most interesting element of the attached housing market is that owner occupier units did extremely well compared to their investor-design counterparts.
Some other big takeaways from 2019 include the continued price growth potential of desirable school zones. If you’re in the right catchment, demand
We’ve also anecdotally seen an increase in owners choosing to renovate rather than sell up and move.

RE
SID
ENTI
AL
Month in ReviewDecember 2019
38
Southern Gold Coast/Northern New South WalesThe far northern New South Wales and southern Gold Coast became a segmented market towards the end of 2018 with mixed results continuing into the first half of 2019. Across the majority of the market, agents had advised more stock levels and longer selling periods, but nonetheless, relatively stable prices were seen along the coastal areas and only minor evidence of weakening further west from the coast line. We saw far more stability across these markets as 2019 progressed, with some evidence of growth in the northern New South Wales coastal areas of Kingscliff and Casuarina, as well as areas on the southern Gold Coast such as Coolangatta. It was becoming more apparent towards the end of 2018 that the Sydney and Melbourne buyers are not as abundant as they were six to twelve months prior and this, as well as tighter lending policies courtesy of the banking Royal Commission, proved to impact overall market values.
As anticipated, in the case of Kingscliff where the new Tweed Valley Hospital is under construction, agents have advised of an increase in buyer interest in the area due to the new infrastructure and job creation with the new build over the coming years. It would appear a slight spike in investor activity has occurred across the board with the easing of lending policy post the Royal Commission, as well as a spike in domestic migration to the southern Gold Coast and Tweed Shire.
Sunshine CoastIt’s fair to say that in 2019, the property market on the Sunshine Coast has had a stop - start kind of year. At times, sale volumes have been good with good values being achieved whilst at other times, it slowed down. General value trends have however been decent.
Analysis we have conducted has shown that values for one and two-bedroom units have weakened significantly. It appears that this segment has now stabilised albeit at levels 10 to 15 per cent lower than say 2017. The values of three and four-bedroom units generally appear to have eased or at best maintained their values.
The canal estates have eased slightly with sales activity down from the previous two years. We are now seeing a noticeable disparity between the values of vacant land sales in these estates as opposed to the sales of those properties improved with dwellings, with the value gap between the two getting closer and closer. Something must give here.
A good performer in the market over 2019 has been the typical family style home, say the four-bedroom, two-bathroom with double garage detached dwelling in the price range of $500,000 to $950,000. Generally speaking, this market has been steady to strong through all north central suburbs. A recent good performing and stand out suburb has been Arundel (market range $450,000 to $650,000). Earlier in the year Helensvale went through a good period of demand.
There now appears to again be some market behaviour changes in play. Fuelled by the lower interest rates, we are now seeing some apparent lift in activity at the upper end of the market. Modern duplex units in Paradise Point seem to be in good strong demand with a sudden jump in values. We are certain that the local market will always keep us guessing.
The Mudgeeraba housing market also appeared quite heated at the start of 2019. The market here did appear to cool temporarily for a very short period but latest evidence suggests that the slowdown was very short lived and demand, particularly for housing priced below $700,000, has ramped up again according to the latest agent feedback. Detached suburban housing remains the most popular property type with buyers, with many properties at the moment reportedly selling within two weeks of being listed on the market.
Overall, all central suburbs appear to be holding their values, with perhaps the exception of the investor driven market segment of the unit market in Surfers Paradise. The prestige waterfront dwelling market has also remained fairly stable and this has been underpinned by buyer confidence in this market sector, a steady volume of sales activity over $2 million and a low interest rate environment.
North CentralGenerally speaking, the market has stabilised across most sub property categories. Perhaps the best performer has been the vacant land parcels and particularly canal frontage and golf course allotments (price points $600,000 to $1.2 million). As good developed blocks have become scarce, demand has intensified. Several sales of canal front blocks in the Fairway Island estate have demonstrated very good capital growth over very short periods of time.
At the other extreme, the lowrise investor markets through the Southport, Labrador and up to Hope Island estates have fallen quite dramatically.
Overall, all central suburbs of the Gold Coast appear to be holding their values, with perhaps the exception of the investor driven market segment of the unit market in Surfers Paradise.

RE
SID
ENTI
AL
Month in ReviewDecember 2019
39
Maroochydore CBD, Sunshine Coast Airport expansion and the Sunshine Coast International Broadband Submarine Cable project are all under construction and all massive for the area. Add to these new projects such as the recent announcement that the Sunshine Coast will get Australia’s first Kelly Slater Wave Company wave pool and the news just keeps getting better. How this is affecting the coast can be seen from the latest population figures where the Sunshine Coast is the fastest growing region in south-east Queensland.
SEQ Population Growth 2017/18
Source: Australian Bureau of StatisticsNote: Net internal migration includes net interstate migration
Source: Herron Todd White
All in all, 2019 has ended pretty well. It is pretty clear that elections, election results and the uncertainty created by them can have a significant impact on the market. 2020 is set down for both local and state elections so we will probably see some slow down and we can deal with that. As long as we don’t see any major shocks to the global economy, we should go pretty well.
RockhamptonTime to reflect on the year that was – already! At the beginning of the year, there was a lot of high anticipation for a buoyant year in the market off the back of the market stabilising throughout 2018 combined with the vast number of infrastructure projects in our midst.
does appear that this market had slowed a little. It looks like this has mainly been by the investors pulling back a little. This may improve given the aforementioned market improvements in Sydney and Melbourne and passing effects of the banking Royal Commission.
The prestige market has had an uptick also right along the coast with the main focus continuing to be the northern coastal areas surrounding Noosa. Like other areas of the market, we experienced a little flat patch but this has certainly changed with supply being gobbled up and new value levels being hit. On the back of the record house sales in 2018, it is now units turn. A beachfront unit in Hastings Street, Unit 6 Noosa Court, is reportedly under contract for just under $10 million, and this isn’t even the best unit in the complex (exact sale price not revealed). It was listed for $11 million for just less than three months and surpassed the previous record unit price for 2/23 Hastings Street of $8.25 million. At $10 million the Noosa Court sale analyses to $41,666 per square metre making the Noosa Heads beachfront unit market the most expensive in Queensland.
Noosa Court Source: realestate.com.au
The infrastructure projects underway continue to be a great talking point for the region. The
As anticipated, in the first half of 2019 we experienced a slowing in the market on the back of the slowing Sydney and Melbourne markets, the effects of the banking Royal Commission and the lead up to the federal election (May 2019). This uncertainty led to general enquiry falling away which effectively led to a lack of urgency in the market. Buyers were taking a wait and see approach. On the back of this, stock levels increased in some areas as well as the number of days on market. The main buyer segment affected was the investors.
Move forward a few months after the election, and with an election result that was perceived by the market as being favourable, we were off and racing. This injection of confidence led to an instant increase in enquiry. An indication of this anecdotally was that an agent advised that they had four new leads on the Monday after the election on a multimillion dollar property that was contracted the week prior. Then when you combine this with the recently reported market improvements in Sydney and Melbourne and passing effects of the banking Royal Commission, the news got better.
The beachside areas, as always, have been performing well with supply remaining generally tight and values picking up. The coastal strip in the sub-$800,000 price range is expected to continue to be in demand however it is becoming increasingly difficult to find good quality homes under this level. Units in these areas are a little difficult to gauge. The larger permanent occupancy style product has become increasingly popular with empty nesters.
When we turn a little further inland, estates of Aura at Caloundra South and Harmony at Palmview are still generating some good interest but it

RE
SID
ENTI
AL
Month in ReviewDecember 2019
40
small lots (sub 500 square metres) there is little developed land available at market attuned prices. A number of developers with significant stocks of 600 to 800 square metre lots have increased their sales rates by combining two lots to form larger allotments that are definitely more attractive to purchasers looking for space for the shed or pool.
Mortgagee in possession activity has continued in 2019, however we have started to see slight declines in the volume of these transactions over the past couple of months.
BundabergThe Bundaberg residential market has been as predicted - steady as she goes. Whilst sales have been regular, values do not appear to have strengthened in the past year.
Rentals are tightening and it appears that the lower end of the market has a lot of competition with up to ten groups turning up to inspect the open houses. Hopefully this demand will begin putting pressure on the contract prices and we may see an increase in the new year.
MackayWow, I can’t believe we are writing the year that was already and that the year 2020 is just around the corner!! It’s always with a bit of trepidation we write this column, as we get to test our predictions from the start of the year against the events that happened through the year. So here we go. At the start of the year we predicted;
out of the ground.
Something we had not anticipated in the Rockhampton market has been the premium purchasers have been prepared to pay for very well presented, renovated properties. There have been a number of cases across all locations and price points where a well-presented property has generated strong interest in the market, often attracting multiple offers, resulting in a sale price right at the upper end of a supportable market value range.
2020 will be a year to watch our local market closely.
GladstoneIt’s always nice to know you are able to predict the future. I really wish I could do the same with my lotto numbers!
The Gladstone residential market behaved almost identically to the way we predicted at the beginning of 2019.
All market sectors in the Gladstone region have shown some form of recovery across 2019. We have seen value increases as high as 15 per cent for different property types. This year we also saw two $1 million plus sales in Gladstone, the first that have occurred in over four years.
Affordability is still the key driver of the market and is bringing newcomers to the region.
Rents continued to rise across 2019 on the back of tightening vacancy rates. The current vacancy rate is approximately 1.8 per cent. The last time we saw a rate that low was in mid 2012 at the height of the LNG boom.
The new construction trend has continued albeit slower than we had anticipated. Apart from
Upon reflection, the market didn’t fully react the way we had anticipated, however there are glimpses of positivity, mostly surfacing in the past two months.
We had predicted the price point sub-$250,000 would start to move as a result of the tightening trend in vacancy rates. In reality, this has not occurred. Whilst these rates have continued to fluctuate between 2.2 per cent and 3.3 per cent for the course of the year (a balanced market for Rockhampton has historically been between two per cent and three per cent), the sub $250,000 price bracket has continued to remain fairly flat. Whilst some local banks are reporting a definite increase in first home buyer loan applications, they have their sights set on the $250,000 to $350,000 price point, leaving market conditions in the sub-$250,000 category relatively unchanged from 2018.
At the other end of the scale, the prestige market sector has had a stellar year with a new price ceiling achieved and an unrivalled number of sales in the calendar year, compared to number of sales in previous years.
The Capricorn Coast has performed as expected with a continuation of improved activity and modest price increases for most market sectors. The coastal unit market and vacant land (particularly sloping allotments) remain weak.
Fortunately, we highlighted the risk of a number, if not all, of the planned infrastructure projects being unable to come to fruition as per the planned commencement dates. This has indeed happened. Whilst each project remains in the pipeline, only the northern access corridor and Capricorn Highway duplication have commenced construction. The Rookwood Weir, South Rockhampton Flood Levy and GKI are all yet to get
GLADSTONE VACANCY RATES
1.8%

RE
SID
ENTI
AL
Month in ReviewDecember 2019
41
There are still a few hangovers from the downturn that haunt the Mackay market. Firstly, even with increased demand and slight increases in value, the median house price for Mackay is still down around 20 per cent than the peak or between $60,000 and $100,000. This equity erosion will limit potential purchasing power and ability to sell for those who bought during the peak times. Also, the lending policies of the banks for our postcode 4740 are still causing some concern.
EmeraldAt the beginning of 2019, we predicted steady growth but cautioned keeping an eye on coal prices. The first half of 2019 was steadier than we were expecting. The election may have had something to do with that as after the election, the market started moving in a positive direction with more turnover and rents increasing.
Coal prices dropped throughout the year and the median sale price fluctuated about three to five per cent over the past 12 months to land in a similar position as the start of the year at $310,000. Jobs growth has remained high throughout 2019 and rent is what stood out to have the most growth.
We definitely saw values increase for good quality properties that had multiple potential buyers, with two sales hitting over the $1 million mark. All in all, a slightly steadier year than we anticipated unless you had a property which offered uniqueness or the lot with pool, shed and size, although the second half of the year appeared much stronger than the first. Buyers in general appear to be showing caution in the main with perhaps the last boom still fresh in many minds.
1. Bringing investors back into the Mackay market based on increasing yields and potential for capital growth; and
2. Increasing demand for owner occupier purchases as cost of rents increase and become more difficult to secure.”
This prediction was half right. Yields on residential properties have increased as rental value increases have surpassed capital value increases. The tightening of the rental market has also seen the number of tenants leaving to purchase property increase. However, investors have not returned to the market in numbers predicted at the start of the year. This can be possibly attributed to a number of factors, including more difficult lending criteria for investment purchases and costs associated with things such as insurance eroding net yields.
Lastly, we stated at the beginning of the year, “The difficult part is predicting the extent (of price growth). Momentum is a funny thing in real estate. At the moment, there is a definite shift in sentiment, both in the general economy and residential market, with all the momentum on the positive side of the ledger. We are quite optimistic about the year ahead and after the downturn we experienced between 2013 and 2017, that makes a refreshing change!”
We think it is pretty safe to say that 2019 was a good year for the Mackay residential market and general economy. With record low interest rates, increased employment opportunities and continued relative affordability in Mackay, it’s seen as an ideal time to enter the property market.
“We think the residential market will continue its momentum throughout 2019, following through from 2018. There appears to be no slowdown in employment opportunities related to the resource sector and infrastructure projects throughout Mackay and the adjoining Bowen Basin. These increased employment opportunities, coupled with (relatively speaking) cheaper cost of housing and rentals (compared to boom time levels) have seen many people move to the Mackay region. Notwithstanding any major economic crisis associated with world trade and the market for our most valuable export (metallurgical coal), we think the Mackay residential market will go from strength to strength during 2019 with growth predicted in both rental values and market values.”
So how did we go? Not too bad at all!
Besides a lull in the market just before the federal election, the Mackay market has continued to press ahead throughout 2019. Agents have reported strong demand across all market sectors throughout 2019, with market values rising slightly (between three per cent and five per cent generally, slightly higher in some areas).
The big mover in 2019 was the rental market. Vacancy rates for residential property remained low right throughout 2019 and have sat below two per cent all year. Market rents have also increased during the past 12 to 18 months, between ten per cent and 20 per cent.
At the start of the year, we stated, “The tightening of the rental market will see increases in weekly rentals, which will have the two-fold effect of:
We think it is pretty safe to say that 2019 was a good year for the Mackay residential market and general economy.
MACKAY VACANCY RATES
2.2% - 3.3%for sub $250,000 throughout 2019
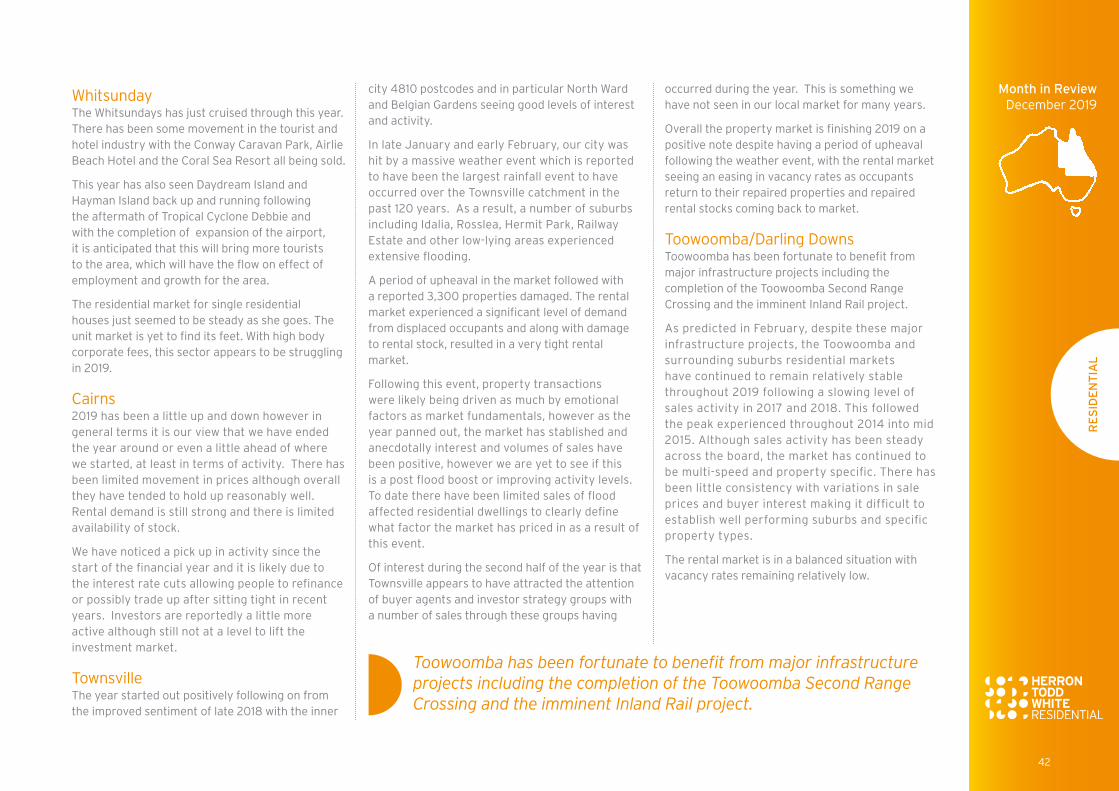
RE
SID
ENTI
AL
42
Month in ReviewDecember 2019
occurred during the year. This is something we have not seen in our local market for many years.
Overall the property market is finishing 2019 on a positive note despite having a period of upheaval following the weather event, with the rental market seeing an easing in vacancy rates as occupants return to their repaired properties and repaired rental stocks coming back to market.
Toowoomba/Darling DownsToowoomba has been fortunate to benefit from major infrastructure projects including the completion of the Toowoomba Second Range Crossing and the imminent Inland Rail project.
As predicted in February, despite these major infrastructure projects, the Toowoomba and surrounding suburbs residential markets have continued to remain relatively stable throughout 2019 following a slowing level of sales activity in 2017 and 2018. This followed the peak experienced throughout 2014 into mid 2015. Although sales activity has been steady across the board, the market has continued to be multi-speed and property specific. There has been little consistency with variations in sale prices and buyer interest making it difficult to establish well performing suburbs and specific property types.
The rental market is in a balanced situation with vacancy rates remaining relatively low.
city 4810 postcodes and in particular North Ward and Belgian Gardens seeing good levels of interest and activity.
In late January and early February, our city was hit by a massive weather event which is reported to have been the largest rainfall event to have occurred over the Townsville catchment in the past 120 years. As a result, a number of suburbs including Idalia, Rosslea, Hermit Park, Railway Estate and other low-lying areas experienced extensive flooding.
A period of upheaval in the market followed with a reported 3,300 properties damaged. The rental market experienced a significant level of demand from displaced occupants and along with damage to rental stock, resulted in a very tight rental market.
Following this event, property transactions were likely being driven as much by emotional factors as market fundamentals, however as the year panned out, the market has stablished and anecdotally interest and volumes of sales have been positive, however we are yet to see if this is a post flood boost or improving activity levels. To date there have been limited sales of flood affected residential dwellings to clearly define what factor the market has priced in as a result of this event.
Of interest during the second half of the year is that Townsville appears to have attracted the attention of buyer agents and investor strategy groups with a number of sales through these groups having
Whitsunday The Whitsundays has just cruised through this year. There has been some movement in the tourist and hotel industry with the Conway Caravan Park, Airlie Beach Hotel and the Coral Sea Resort all being sold.
This year has also seen Daydream Island and Hayman Island back up and running following the aftermath of Tropical Cyclone Debbie and with the completion of expansion of the airport, it is anticipated that this will bring more tourists to the area, which will have the flow on effect of employment and growth for the area.
The residential market for single residential houses just seemed to be steady as she goes. The unit market is yet to find its feet. With high body corporate fees, this sector appears to be struggling in 2019.
Cairns2019 has been a little up and down however in general terms it is our view that we have ended the year around or even a little ahead of where we started, at least in terms of activity. There has been limited movement in prices although overall they have tended to hold up reasonably well. Rental demand is still strong and there is limited availability of stock.
We have noticed a pick up in activity since the start of the financial year and it is likely due to the interest rate cuts allowing people to refinance or possibly trade up after sitting tight in recent years. Investors are reportedly a little more active although still not at a level to lift the investment market.
TownsvilleThe year started out positively following on from the improved sentiment of late 2018 with the inner
Toowoomba has been fortunate to benefit from major infrastructure projects including the completion of the Toowoomba Second Range Crossing and the imminent Inland Rail project.

RE
SID
ENTI
AL
Month in ReviewDecember 2019
43
West of Toowoomba, the towns within the coal seam gas hub of the Surat Basin have reverted to levels which are more aligned with their predominantly rural based economies. As such local employment factors are now contributing to the trends witnessed in each of these towns. Enhanced interest for dwellings is being experienced from owner occupiers as affordability has returned. A significant over supply situation remains in the unit market which continues to place downward pressure on this sector. The Roma market is relatively inactive and downward pressure appears to remain while Dalby is showing good signs of stabilisation with a strong occupancy rate currently being enjoyed leading to positive movement in rental values.
In general, there were no surprises in the Toowoomba market and predictions made at the beginning of the year appear to have been relatively accurate. We give our predictions a score of eight out of ten!
Source: SQM Research
The infrastructure projects are believed to have assisted in holding vacancy rates low with many employees living in the Toowoomba area throughout the construction processes.
As mentioned in February, the key development areas for new housing included the suburbs of Glenvale, Cotswold Hills, Torrington, Kleinton, Highfields, Cambooya and Westbrook. Demand for vacant land has slowed significantly as a result of reduced investor demand and limited local buyer enquiry for lots less than 500 square metres in size. Sales rates for land in new housing estates are slower compared to recent years when projects often sold out off the plan. Developers are starting to look at buyer incentives to attract interest in their respective projects.
Unit development has also slowed as evidenced by the Building Approvals graph below:
Source: RP Data and ABS

44
RE
SID
ENTI
AL
Month in ReviewDecember 2019
AdelaideThe South Australian market is renowned for shadowing the major east coast markets; always a step behind. This shadowing has always provided those in South Australia a crystal ball into how our market may track. The back end of 2018 and beginning of 2019 saw these major markets head into negative territory. After a period of sustained growth dating back to 2017, the South Australian metropolitan market was put to the test. Would the market be a bull and be outstanding in its field or continue to shadow?
In our 2019 February edition, the middle ring was tipped as being the segment to watch in 2019 with an entry price point of $300,000 to $500,000 providing options for both first home buyers and investors. The suburbs of Hope Valley, Dover Gardens and Ingle Farm were our picks to watch. On the most recent quarterly data, these suburbs achieved year on year median dwelling value growth of 1.45 per cent, 0.21 per cent and 2.62 per cent respectively. This year saw Dover Gardens achieve its highest residential dwelling transaction since November 2015 with 1 Seaforth Avenue, Dover Gardens achieving a sale price of $745,000. This property comprises a circa 2006 modern four-bedroom, two-bathroom dwelling on 600 square metres. In a market that has trended downwards, our call on these suburbs deserves a tick.
1 Seaforth Avenue Dover Gardens Source: realestate.com.au
The suburb of Campbelltown, north-east of the city, was tipped to be treated with caution in 2019. The local council had announced that they would be increasing the minimum allotment sizes to try to stifle the excessive townhouse development occurring within the council area. Broadly, Campbelltown achieved quarterly year-on-year price growth of 4.05 per cent which bucked the trend of the greater market. More specifically development sites have had mixed results through the year on the back of the zoning changes. As one sale faltered another would catch the market by surprise. The sales of both 3 Grivell Street, Campbelltown and 32 Downer Avenue, Campbelltown tell a vastly different story on how the market treated development sites in 2019. These properties
transacted in mid 2017 and early 2018 for $700,000 and $560,500 respectively. Both transacted again in 2019 with 3 Grivell Street having a $25,000 loss and 32 Downer Avenue having a $104,500 gain.
3 Grivell Street Campbelltown Source: realestate.com.au
32 Downer Avenue Campbelltown Source: realestate.com.au
Both Port Adelaide (and surrounds) and Mount Barker were tipped to watch in 2019 with the substantial development occurring within their vicinities (seven years into Renewal SA’s Port
South Australia
After a period of sustained growth dating back to 2017, the South Australian metropolitan market was put to the test.

RE
SID
ENTI
AL
Month in ReviewDecember 2019
45
followed by two quarters of decline with the most recent September quarter data indicating a median house price of $471,900. The non-metropolitan (major towns) median house price has also fallen to $265,000 which is the lowest point it’s been since December 2017. The South Australian market typically lags behind the larger capital city markets; with declines being felt around the country it was only a matter of time before South Australia followed suit.
Speaking to both buyers and agents in the field, the ability to borrow was put down as a major factor in the lack of activity in the market. Agents operating
At the beginning of 2019 the year’s outlook was somewhat murky. The South Australian metropolitan house price had grown quarter by quarter since September 2017. At the back end of 2018 the sluggish east coast market, banking Royal Commission and tightening lending conditions were making national news whilst locally the state government’s proposed land tax shake up was striking fear into the hearts of all property owners. If there was ever a time for the South Australian market to hit a speed bump this would be it. The metropolitan median house price hit a peak of $480,000 in the March quarter which was
Adelaide rejuvenation project and the early 2019 announcement of the Dock One development). The Port was considered an area to watch for increased market activity as early adopters jumped in. Port Adelaide and the surrounding suburbs had mixed results in 2019 with price levels fluctuating and no visible price growth across the board. Our prediction looks to be premature but there is plenty of time for The Port to live up to the hype with another eight years remaining in Renewal SA’s rejuvenation project.
Dock One Source: realestate.com.au
Mount Barker has continued to undergo significant residential development with former agricultural land being carved up. The abundance and availability of stock was considered a negating factor in any immediate and sustained price growth. It was pleasantly surprising to see Mount Barker have a 5.56 per cent increase in its quarterly year on year median dwelling price. The increase provides an indication that demand is meeting supply in this developing suburb. The map below provides an indication of the development occurring within Mount Barker with the red lines representing proposed subdivisions and the pink shaded areas representing land zoned for residential development.
Mount Barker Map Development Source: xgxgxgx

RE
SID
ENTI
AL
Month in ReviewDecember 2019
46
price range provides an entry point for first home buyers, people looking to upgrade their home and investors given the good rental returns. A price range which has seen an increase in sales numbers is $400,000 to $500,000. Typically this price point has been less active, however a number of well-located central houses have sold, as well as higher end modern houses. Sales in this price range have doubled since 2014 which does show confidence in the local property market with higher value properties selling.
In summary, the housing market for Mount Gambier has remained stable which in our view is positive for the region. One thing that has surprised us this year is the continued strength in the rural and rural residential market. Sale prices of rural lifestyle and rural properties have exceeded expectations on a number of occasions. We expect further surprises could continue in this sector into 2020.
correct. House sales volumes for 2019 were at similar levels to where they have been since 2014, as there have been no obvious indicators that have had a significant impact on the local economy and property sector. Overall, we score ourselves a ten out of ten for our predictions at the beginning of the year.
Mount Gambier sales per annum Source: RP Data Professional
The Mount Gambier property market has performed at a similar level to 2018 with a slight increase in the median house price (approximately four per cent). House sales are currently sitting at a similar level to the preceding years with total houses sales at year end expected to be 400 to 450. This is expected given there have been no major employment or population boosts over the past 12 months. The market has generally remained stable, which considering current economic conditions provides confidence in the local market.
The best performing price range over 2019, which has been the best performing price range over the past few years, is $200,000 to $300,000 which is where the median house price sits. The
in the inner ring have indicated that properties typical of a sale by auction were receiving mixed results with purchasers struggling to obtain finance. Within the middle and outer rings, first home buyers and mum and dad investors faced similar finance issues. The real winners have been cashed up purchasers who have reduced reliance on lending institutions. These buyers have had the pick of properties in a subdued market with declining interest rates.
A few surprises were thrown up during the year but none more than the transaction of 19 Statenborough Street, Leabrook. This property was transferred off market for a staggering $8 million in June. This has become the highest property transaction in the metropolitan area’s history, eclipsing the previous record holder by $1 million. Available information indicates the property has a living area of some 1,300 square metres across three levels on an allotment of 2,200 square metres.
Throughout 2019 the market provided some surprises however wasn’t able to buck the shadow of the east coast markets and keep on the upwards trend. Recent data suggests price growth in a number of the major metropolitan markets, so don’t hit the panic button yet.
Mount GambierMount Gambier is the second largest city in South Australia with a population of approximately 28,000 people. We are famous for the Blue Lake which is a dormant volcano sitting quietly providing fresh drinking water for the region.
At the beginning of the year, our outlook for 2019 was that the housing market would remain relatively stable throughout the year. As can be seen in the graph below, our predictions were
One thing that has surprised us this year is the continued strength in the rural and rural residential market.

47
RE
SID
ENTI
AL
Month in ReviewDecember 2019
PerthOur property market predictions in February’s edition of the Month in Review forecast a reasonably stable 2019 overall. We were concerned about the gap between value growth in the inner versus the outer suburbs and expected greater Perth to continue its downward trend towards the bottom of the market, driven mostly by poor performances of newer land estates on Perth’s urban fringe. The most positive news was the strength of Perth’s rental market. This has continued throughout the interim, as the median weekly rental has held up at $350 per week.
REIWA states that the rental vacancy rate has improved for the second quarter in a row, lowering to 2.5 per cent. This is likely due to Western Australia’s net migration figures. From mid 2016 to late in 2017, Western Australia was receiving less people than were leaving the state, however this has since been reversed and we are now seeing
an upward trend, pushing net migration into the positive again.
Significant mineral resource investment is one factor influencing Western Australia’s population over the year. In an article in August 2019 by Mark Beyer in Business News, he said:
“Of the 12 biggest mining projects under way or likely to proceed this year, seven are in the iron ore sector. The expected investment in the iron ore projects is $17 billion, out of a total investment of $20 billion across the top 12 mining projects.” (BusinessNews.com.au, 2019).
These mining ventures by the likes of BHP, FMG, Rio Tinto and more are presumed to create 11,000 jobs for the construction stage alone. There is no doubt that these projects have already and will continue to generate demand for a number of skilled and specialised employees. Historically, resource sector wages have been very attractive to local, national,
and international workers so this could help to bolster Western Australia’s population again. As stated in previous editions, large net migration figures impact the rental market first, as many migrants choose to rent before looking to purchase a property.
Due to the known effects of the last mining boom and bust, workers from interstate or overseas are hesitant to purchase property when moving to Western Australia, as the well-documented slump of Perth’s property market could have imposed a more conservative and cautious attitude in potential buyers. Perth has however, felt the effects of the net migration increase over the past few quarters as negative median house price growth has continued to diminish.
With the data available in February we reported a median house price of $510,000 for greater Perth, however after sales had settled it turns out that the median was closer to $500,000. The September 2019 quarter has shown a median house price of $480,000, equalling a decrease of four per cent from February to September.
Sales activity in the greater Perth region decreased by four per cent during the September 2019 quarter with 7,050 sales recorded. REIWA reported a three
Western Australia
WA Population Growth Source: REIWA
$500,000 Perth median house price
February 2019
$480,000Perth median house price
September 2019

RE
SID
ENTI
AL
Month in ReviewDecember 2019
48
The property in Figure 5 was purchased in May 2014 for $392,000. The circa 2011 flute-style property comprises three bedrooms, two bathrooms and a rear double garage on a 240 square metre allotment. It sold in June 2019 for $272,500 showing a decrease of just under $120,000 or 30 per cent.
These examples paint a very poor picture for developing suburbs on the outskirts of Perth, but it is an unfortunate reality. The examples shown were extreme however it is very common to see properties in these locations having extended selling periods and selling with heavy discounts of between 10 and 20 per cent. As covered in previous editions, suburbs with a large oversupply of land are seeing consistent median house price decreases, the reason being that the public can purchase their own land and build to their own specification cheaper than the established homes were previously bought for, so vendors must give significant discounts to sell established housing stock, otherwise they may face extended selling periods. This also ties in with the number of mortgagee properties that we have been seeing. The number of mortgagee-in-possession jobs received by our firm has almost doubled over the past three years.
Though the greater Perth market softened overall, there were some suburbs that bucked the trend and showed strong performances. These were mostly in affluent locations with median house prices that far surpassed the Perth median. As at August 2019 Swanbourne, Menora, Shelley, Mount Pleasant, Hillarys, Cottesloe, Trigg, Kensington and Waterford all had year-on-year median house price growth rates of between five and 20 per cent. Those suburbs also took fewer days to achieve a sale than the Perth September 2019 quarter average of 84 days. This was four days slower than
The property in Figure 3 was purchased in May 2015 for $498,000. The circa 2014 Byford property comprises four bedrooms, two bathrooms and a double garage on a 42 square metre allotment. It sold again in August 2019 for $418,000 after 121 days on the market, showing a loss of $80,000 or 16 per cent.
Durant Way, Ellenbrook Source: CoreLogic
The property in Figure 4 was purchased in September 2014 for $535,000. The circa 2007 Ellenbrook dwelling comprises four bedrooms, two bathrooms and a double garage on a 495 square metre allotment. It sold again exactly three years later in September 2019 for $380,000 showing a loss of $155,000 or 29 per cent.
Carrabelle Street, Butler Source: CoreLogic
per cent fall in house sales, two per cent rise in unit sales and a 17 per cent fall in vacant land sales. This decrease indicates that Perth’s developing suburbs are suffering. The oversupply of land in fringe locations continues to be detrimental to greater Perth’s overall median house price.
Vivien Avenue, Baldivis Source: CoreLogic
The property shown in Figure 2 was purchased in April 2014 for $410,000. The circa 2006 Baldivis home comprises four bedrooms, two bathrooms and a double garage on a 511 square metre allotment. It sold again in September 2019 for $280,000 after more than three years on the market showing a loss of $130,000 or 32 per cent.
Horrocks Road, Byford Source: CoreLogic

RE
SID
ENTI
AL
Month in ReviewDecember 2019
49
The increase in first home buyer activity may be attributed somewhat to changes to Keystart’s eligibility criteria. From 1 July 2019, Keystart’s income limit thresholds were increased by $15,000 for singles and couples to $105,000 and $130,000 respectively and increased by $20,000 for families to $155,000 for the metropolitan region. This would have allowed many more residents to qualify for stamp duty exemptions allowing more people to enter the market.
There were plenty more changes to economic, monetary and housing policy in 2019 in a bid to stimulate the overall economy, some of which we have covered in previous editions. On 2 October 2019, the cash rate was decreased by 25 basis points to a 60 year low of 0.75 per cent. This was a relief for financiers and the Perth property market as a whole. The RBA was hoping the full 0.25 per cent cut would be passed on to the end consumer, but unfortunately this did not prevail for most lenders.
The West Australian government has also introduced a 75 per cent stamp duty discount for property buyers purchasing off-the-plan, pre-construction, multi-level apartments in an effort to attract more density to inner areas of the Perth region.
Liberal’s federal election win was a positive for Perth’s housing market as Labor’s plans to limit negative gearing to new housing, halve the capital gains tax discount from 50 per cent to 25 per cent and limit negative gearing to new investment properties only may have increased the pain levels within an already suffering property market.
with existing companies expanding their workforce and new companies needing accommodation for their workers in the area.”
Karratha’s median house price settled at $350,000 for the September 2019 quarter, showing an increase of 1.3 per cent. Port Hedland was the other regional centre to record an improvement in the median house price, increasing by 2.8 per cent to $236,500. Overall the regional Western Australian median settled at $315,000 for the September 2019 quarter, decreasing 1.6 per cent but showing an increase in sales volumes of three per cent.
Back in Perth, first home buyer activity showed an improvement over the last quarter as seen in Figure 6. There were more sales under $599,000 in the September 2019 quarter than in the June quarter and REIWA states that 24 per cent of all house transactions occurred at or below $350,000.
the quarter previous which was unsurprising since the September quarters usually see the least sales activity throughout the winter months.
In the year to September 2019, the highest growth suburbs in Western Australia were Newman, Pegs Creek, Lamington, Rossmoyne, Katanning, Nickol, South Hedland, Mullaloo, Port Hedland and South Bunbury, showing growth rates of between ten and 35 per cent. Only two out of the ten suburbs listed were within greater Perth, showing that some regional locations are flourishing.
REIWA has recently reported that five of Western Australia’s nine regional centres have recorded an increase in sales activity of more than 19 per cent over the September 2019 quarter. REIWA Deputy President Lisa Joyce said, “From a rental market perspective, properties are in high demand in the Karratha region, which is demonstrated by a 27 per cent reduction in leasing activity and an increase of $68 per week in median rent – the highest of all regional centres for the quarter.” Ms Joyce attributes this to “an increase of jobs in the area,
Though the Greater Perth market softened overall, there were some suburbs that bucked the trend and showed strong performances.
REIWA September Quarter Market Update Source: REIWA.com.au, 2019

RE
SID
ENTI
AL
Month in ReviewDecember 2019
50
challenging economic climate.
Our score for South West WA’s 2019 prediction is six out of ten.
Bunbury). The exportation of iron ore from the Pilbara has also increased, albeit with slightly lower prices. This improvement in the resources market is having a modest positive effect on the residential property in the South West of WA due to resurgence in the FIFO workforce from the area. One noticeable effect is the bottoming of the rental market which was anticipated 12 months ago.
The South West of WA remains a leading growth area for both residential and commercial development and the majority of the demographic of the new residents is made up of young families who are supporting the local economy and schools, improving community resilience. There was also an anticipated growth of retirees relocating to the region which has seen new development of over 55s retirement accommodation in Kealy and Dunsborough.
A significant win for the region was the announcement in November that Jetstar will be commencing direct flights from Busselton-Margaret River Regional Airport to Melbourne from March 2020. It is anticipated that this will provide stimulus for market improvement in the local economy.
As the current year comes to a close, analysis has revealed that residential property values have dropped six per cent in the Busselton region and other areas such as Collie and Dalyellup have performed even more poorly, but the upside of this trading climate is that investors are cautiously returning to the market as returns on investments begin to look more attractive.
In conclusion, the regional residential property market was at best benign during 2019 against the
APRA made a few big changes in 2019, removing the cap on interest only loans and changing lending criteria guidelines to allow brokers and banks more flexibility. The guideline changes will allow the average home owner to borrow an extra nine per cent, which goes a long way in the search for your perfect home.
To wrap up, I would score our February predictions an eight out of ten. We did not expect big changes in the property market and we thought 2019 would be a year spent searching for the market floor. The consensus remains that if we aren’t quite there, we are likely to be very close!
South West WA2019 has seen a regional residential property market in the South West of WA that has shown noticeable resilience generally against the backdrop of the banking Royal Commission and state debt remaining high (albeit beginning to reduce) and unemployment rates not improving much over the past 12 months. Bank interest rates were predicted to reduce during 2019 which has transpired, but household income has appeared to decline, as utility charges continue to rise year on year. This has resulted in a weak residential property market that was anticipated but realistically priced and well-presented dwellings are selling, albeit slowly, in a market where the buyer remains in the better position.
At the start of the year there was talk of improvement in the trading of the Western Australian minerals resources sector and this was notable in the growth of lithium production, particularly at the world’s largest lithium mine at Greenbushes (80 kilometres south-west of
In conclusion, the South West WA regional residential property market was at best benign during 2019 against the challenging economic climate.

51
RE
SID
ENTI
AL
Month in ReviewDecember 2019
DarwinAs 2019 draws to a close, we have the opportunity to reflect on the year that was in the Darwin residential property market. Our February Month in Review charted a likely course and it will come as no surprise that our expectations earlier in the year for a subdued 2019 have transpired.
In reference to the state of the economy, we commented that “…the residential property market is unlikely to show much growth under these conditions and critically, sentiment will likely remain weak across many aspects of the economy”.
The most recent stats to come out of the Real Estate Institute of the Northern Territory (REINT) show that as at September 2019, total sales volumes declined by some $9 million since the same period in 2018, a reduction of over eight per cent. This was mirrored by the reduction in median price from $497,500 in 2018 down 7.5 per cent to $460,000 in 2019.
Interestingly the unit market actually showed an increase in total sales volume, up $2.7 million, however this is largely due to the increase in sales volume up 37 sales to 153 from September 2018 to September 2019. However, the contraction in median price from $352,500 to $294,000 in 2019 reflects the continuing weak segment plagued with
over supply issues and distressed sales.
One of the key drivers in the market throughout 2019 has been the house and land construction in the new estates of Darwin and Palmerston. The NT Government released a suite of concessions and bonuses for eligible applicants across an array of categories which include new construction, first home owners and existing Territory home owners. Anecdotally the more popular of these has been the Build Bonus Grant which is a grant of $20,000 for new constructions. Under a first home owner qualification, the total maximum benefit available is $50,601 which includes a stamp duty concession and household goods grant. The impact on the market has seen new constructions and land sales dominate activity in these areas, taking demand away from older and more established suburbs. This is seeing these established areas presenting real value for money - an opportunity we see emerging in the market going forward.
In line with our comments in February, the market
Northern Territoryremains a buyer’s market. Despite the contraction in median value across some asset types, the market remains fluid with agents reporting good demand for reasonably priced good quality property. We would expect that this trend and sentiment will continue throughout the balance of 2019.
Zuccoli Source: domain.com.au
Alice SpringsThe local market remains about as flat as the terrain around Lake Eyre, with little for property owners to get excited about. Demand continues to be soft and the fallout from the banking Royal Commission continues to be felt. Easing of interest rates by the Reserve Bank over recent months has had minimal impact on consumer confidence which remains subdued, with some financial commentators blaming a lack of wage growth and dwindling household disposable income. This seems to be the state of play Australia-wide and Alice Springs is no exception.
Houses at the lower end of the market ($350,000
$497,500 Darwin median
house price 2018
$460,000Darwin median
house price 2018
Anecdotally, the more popular of the government bonuses has been the Build Bonus Grant which is a grant of $20,000 for new constructions.

RE
SID
ENTI
AL
Month in ReviewDecember 2019
52
market is concerned and the market is expected to continue to bounce along at or near the bottom in the foreseeable future.
to $400,000) continue to move quickly if reasonably priced, with some bargains out there for those not scared of a bit of hard work, but the lack of capital gain in the market place is proving to be a deterrent to flippers. Older two-bedroom units continue to slide in value, due in part to the recent abundance of new or near new units coming on line in recent years. This oversupply has seen a number of unit developments stall or be deferred in the absence of sufficient pre-sales.
A recent sale of a beautifully renovated 1990s, three-bedroom unit with golf course frontage has been a highlight, with a price tag in excess of $600,000. The quality renovation and stunning views of the golf course and MacDonnell Ranges ensured a good outcome for the vendors.
The real estate market over December and January is historically quiet with the town population shrinking as a result of the annual exodus of Centralians back to their former home states for the holidays. This coincides with the off season for tourism and so the streets will be looking decidedly quiet for the next few months.
In the coming months, there seems little to get excited about as far as an upturn in the real estate
1990’s, three-bedroom unit with golf course frontage Source: HTW

53
RE
SID
ENTI
AL
CanberraOverall the Canberra property market has been in a stable market position from the end of 2018 to early 2019.
Most Canberra suburbs have maintained median price points for standard dwellings while medium density and unit stock have seen some small declines.
Active sections of the market include standard housing at the entry level price points in some of the Canberra fringe and outer suburban locations. Generally purchasers are looking for large blocks in established suburbs that provide access to good education and employment services. Entry level price points for this style of housing range between $550,000 and $650,000. Most homes within this section of the market provide three and four-bedroom accommodation, generally 30 to 60 years old, and in many cases the dwellings are ready for some renovation and upgrading.
Inner suburban location in Canberra’s north and south set a higher price point, generally $1 million plus. This section of the market is also relatively stable with families looking to move up the property ladder with their second or third acquisition. Again block size, location and proximity to schools and other services are the main drivers. This section of the market ranges from the $1 million to around $3 million. Market activity for property in the $3 million plus price point is slower, with buyers generally more discerning. Location, block size, build quality and level of inclusions are major factors influencing this section of the market.
Price points in the medium density unit market range from $200,000 to $275,00 for a one-bedroom unit recently constructed in a fringe Town Centre location to $400,000 to $500,000 for a centrally located unit in Canberra’s inner north or inner south. Investors and owner occupiers are active, however strong supply within the medium density market has had an impact on activity. Being in close proximity to or directly in Town Centres including Tuggeranong, Woden, Canberra City, Belconnen or Gungahlin is important for rental return, low vacancy and potential future growth.
Month in ReviewDecember 2019Australian Capital Territory
Investors and owner occupiers are active, however strong supply within the medium density market has had an impact on activity.

54
RE
SID
ENTI
AL
Month in ReviewDecember 2019
Hobart/Launceston/RegionalWell, what a year we have had in the country’s best performing market.
Time to ask how we went calling the year ahead.
Back in February, we called Hobart as continuing to grow with a levelling off in the inner ring suburbs, Launceston to continue to push ahead and the north-west coast to strengthen its recovery.
So, what actually happened?
Hobart has continued to lead the nation in capital growth notwithstanding a levelling off from the double-digit growth of the past few years. The inner ring suburbs evened off a little but still achieved reasonable growth in the order of five per cent. However, some of the other suburbs such as Oakdowns (western side of the river) achieved an outstanding lift of 22 per cent in median pricing. The established suburb of Howrah lifted its median house price to $535,000 (eight per cent increase) and median unit price to $415,000 (twelve per cent increase).
In the north, Launceston has continued in leaps and bounds. The city is up broadly across all price segments, from Ravenswood (lower socio-economic suburb to the east of the city centre) up 13 per cent to Newstead (higher priced inner suburb) up 11 per cent.
On the north-west coast Devonport is continuing
its steady rise, however Burnie appears to have levelled off, which may be a reflection of a more stagnant population base.
Interestingly the stand out performers came from the north-east. Centres such as Bridport (coastal holiday township) and Scottsdale (rural town near the mountain bike tracks) are both up 15 per cent and more.
The west coast is the dampener on the story however with centres such as Queenstown, Zeehan and Roseberry continuing to struggle on the back of a reduced mining sector.
Score out of ten? An eight with marks off for not quite nailing Burnie slightly coming off or the strength in the Launceston market.
Happy new year everyone! :)
Tasmania
Well, what a year we have had in the country’s best performing market.
2019 value increases:
5% Inner Hobart
22% Oakdowns (Hobart)
13% Ravenswood (Launceston)
11% Newstead
(Launceston)
15% Bridport
(Regional)

RuralDecember 2019

RU
RA
L
Month in ReviewDecember 2019
56
OverviewWith 2019 all but closed, it has been an interesting year dominated by weather related events and the water debate. Add in the banking enquiry and adjusted lending conditions now becoming evident with many borrowers, one could easily think the market values would be under pressure to reduce but that has not been the case in 2019.
In most regions and commodity classes, near or new record prices have been evident this year. The cost of debt is low from an interest rate perspective however the real cost to repay debt as we know is a borrower’s marginal tax rate and that has not altered however often appears overlooked in any discussion around affordability.
The team has reflected on the past 12 months’ activity and provides some thoughts for readers with an overall view about being cautious in the current market as there does appear to be some recent sales which have not fully met vendor expectations and a consolidation year in terms of asset value growth would not surprise.
As we look into 2020, the team will host events in Melbourne and Brisbane in the last week of February to once again provide the formal picture of the year that was and also provide our perspective of the 2020 year. We are also pleased to advise that the team from Mercado Analysis will be providing a commodity overview on the main classes of beef, sheep, wool and grains to help put into perspective some of the background to what is influencing buyer and seller activity.
We wish all clients in the fire affected regions our best and hope for rain for them all soon as we do
the entire eastern states and hope everyone can have a safe and happy festive break.
TamworthWe are continuing to witness a decrease in cattle livestock prices for unfinished cattle in the Tamworth region with the general quality of the yardings being well below average. We have researched the Eastern Young Cattle Indicator (EYCI) for the past five year period together with store sales from the Tamworth Regional Livestock Exchange (TRLX) for cows, steers and heifers which shows a downward trend across most beef cattle classes.
The table below shows the results of our research.
NSW North CoastDry weather and numerous bush fires dominate the landscape at present on the New South Wales North Coast. The rural property market theme during 2019 has continued the strong demand for macadamia nut tree farms and cattle grazing properties. There have been some sales of specialised properties. These include a 12.14 hectare going concern wholesale nursery property at Rous of which the real estate interest sold for $1.925 million in November, and a 183.4 hectare contract breeding unit piggery supplying weaners located at Kilgra which sold for $2.84 million in August. The upcoming auction in December 2019 of a 5,974 avocado tree farm at Fishermans Reach will be of much interest for this market segment.
Dry weather and numerous bushfires dominate the landscape at present on the NSW North Coast.

RU
RA
L
Month in ReviewDecember 2019
57
below $200 per megalitre, this cost rose to around $400 per megalitre at the start of 2019 and looks set to finish the year at over $900 per megalitre.
Most Victorian Murray irrigators expected that they would once again receive close to 100 per cent allocations in 2019/2020 and the mid-year realisation that they are only likely to receive around 50 per cent has pushed many normally self-sufficient irrigators into the temporary market.
The high cost of leasing water will cause some growers of lower value crops such as white wine grapes and dried fruit to re-assess whether they can continue growing these crops next season. There is a real risk that the dried fruit industry will contract significantly in 2020 should the cost of leasing water remain above $500 per megalitre.
Values of citrus orchard and table grape vineyards appear to have remained relatively stable for the past 12 to 18 months following a significant spike between 2014 and early 2018. Returns from these crops have been strong, which has helped build some resilience among growers.
The high cost of leasing water and concerns around water availability has not surprisingly put a brake on the expansion plans of many irrigators. Further contributing to this slow down was the decision by the Victorian state government in late 2018 to apply a moratorium on the issuing of Water Use Licences for greenfield development sites in order to cap the extraction of water. A number of dryland properties that are suited to horticultural development have now been sitting on the market and it appears that we are now well past the peak for this class of property.
However, there is always an exception, as shown by the recent sale of a 977-hectare parcel of land in the Robinvale district at a price that shows a
The sale price, which equated to $610 per hectare for the arable land component, shows that values in the Millewa have remained stable over recent years, despite the impact of drought.
Most dryland farmers in the local Millewa region have had an extremely poor year, but you only have to drive 100 kilometres south from Mildura to find crops that received maybe an extra 20 millimetres of in-crop rainfall and as a result produced reasonable yields. While there have been few sales in the Mallee region during 2019, we expect that demand in the Mallee will remain strong. A couple of notable sales in the Chinkapook and Piangil West areas of the Mallee showed higher values from previous levels, with better arable cropping land showing between $2,600 per hectare and $3,275 per hectare.
In the Western Division of New South Wales, we continue to observe strong demand for well improved properties, particularly if they have some standing feed. A pending sale of two significant properties in the Menindee district and two in the Ivanhoe district will show much higher values from previous levels. One of these properties previously sold in 2017 and if the current sale proceeds, it will show around a 20 per cent increase in value over two years.
Irrigators throughout the Murray Darling basin have all been affected by low irrigation allocations and the resulting high cost of leasing water via the temporary market is causing plenty of headaches for the vast majority of local horticulturalists. After several years of water being able to be leased for
The sugar cane farm market remains relatively subdued with continued low world sugar prices during 2019. The dry conditions during 2019 will likely have some negative impacts on the 2020 New South Wales North Coast sugar cane crop, particularly in the Broadwater and Harwood Mill areas. The continued flow of subsidised Indian sugar onto the world market disappoints many in this industry. On a positive note many growers, particularly in the Condong Mill area have been able to take advantage of dry conditions by cutting the cane green and bale a significant proportion of the post harvest leaf residue.
Soya bean growers will be attracted to reported grain pricing of $800 to $850 per tonne delivered for edible standard beans. Adequate soil moisture for planting will be an issue.
Mildura/SunraysiaThere is always some unpredictability about how rural markets will perform and 2019 has been no exception.
The recent sale of Koleya Park, a 2,170-hectare dryland farming property in the central Millewa district, highlighted that even in a region where drought has resulted in successive crop failures there is demand for farming land. The buyer came from a southern region where the significant value growth over the past four to five years has made buying large parcels of land very expensive and was prepared to offset the risk of lower yields in a marginal rainfall area with the potential to buy a relatively large parcel of land at an affordable price.
After several years of water being able to be leased for below $200 per megalitre, this cost rose to around $400 per megalitre at the start of 2019 and looks set to finish the year at over $900 per megalitre.

RU
RA
L
Month in ReviewDecember 2019
58
holding, however should the seasons not improve in 2020 there is a real and high risk that low buyer confidence may weaken value trends. The low costs of borrowing and low Australian dollar has assisted with underpinning the market to date.
On a finishing note and given that this is the last issue before Christmas, it is only appropriate to touch on the pork industry.
Pig meat consumption in Australia has continued to rise and is second only to the rise experienced in poultry consumption. Pig meat consumption fell in 2017/2018 to approximately 25 kilograms per capita but expected growth forecasts that pig meat consumption per capita will increase to 27 kilograms per capita by 2020/2021. The outbreak of African Swine Fever (ASF) is likely to impact on future demand for Australian pork but also for blood stock as impacted countries such as China try to rebuild their herds. It’s been reported that China will have a shortage of 10 million tonnes pork by the end of the year.
Despite the real risk of ASF reaching Australia, some growers are seeing it as a real opportunity to expand by acquiring other grower facilities or converting and expanding existing facilities into larger full farrow to finish operations. Australia is very well positioned to capitalise on these market and growth potentials in the industry especially as it has suffered to some degree over the past few years with falling pig prices and increased operational costs. However, should the industry be successful both our border and farm gate security must be at the highest standards. We are aware of two recent transactions of grower facilities in the south-east being circa 5,000 to 6,500 Standard Pig Unit (SPU) operations that on analysis reflected between $120 to $200 per SPU.
We wish all our clients and readers a merry and
have only recorded circa 25 per cent of the annual average rainfall, which has been further compounded by previous dry years. The issue now with the days warming up and strong south-westerly winds has been bush fires in the southern part of the state. Large areas have been impacted including property losses in local townships, surrounding grazing country and state forestry plantation assets. All we can hope for by Christmas is some reprieve to dampen the risk of continued fires.
The drought conditions are undoubtedly having an impact on broad market confidence with a weakening in sales trends in the south-east. Those areas that have been lucky enough to be under a storm cloud or received flood waters down the western channels systems are currently experiencing strong demand. In the Quilpie district, there have been a number of transactions over the past six months including:
◗ Conliston, a 28,500 hectare holding sold for $4.8 million or $168 per hectare;
◗ Retreat, a 142,601 hectare holding that reportedly sold for $17 million excluding livestock and equipment reflecting $119 per hectare;
◗ Clifton Station, a 48,800 hectare holding sold for $4.15 million WIWO;
◗ Canaway Downs, a 93,316 hectare holding selling for $8.13795 million including plant and equipment;
Many of these transactions reflected a strengthening in values which is likely created by those chasing grass. Further east however there has been a weakening sales trend. In some areas, country in the Meandarra and Southern Downs areas, particularly those reliant on surface water, are now fully destocked. Despite the poor conditions the market to date seems to have been
healthy capital gain over its previous sale in 2015. This property was developed many years ago for large scale vegetable and salad crop production and is currently being used for that purpose, however is understood to have been purchased by a local table grape growing family intending to complete a large scale vineyard development.
The strength of this sale is likely to have been influenced by the current moratorium on issuing Water Use Licences to develop virgin land in Victoria.
Southern QueenslandWe would have liked to finish the year on a positive note, however reflecting back on the 2019 year it has been one of the driest years on record unless something dramatically changes in the next few weeks. In the south-east part of Queensland much of the talk is not when the drought will likely break but how much longer producers can sustain such conditions. There has been plenty of talk surrounding how it is impacting rural producers and many of the town water supplies are on restrictions or at critical water levels.
According to the Bureau of Meteorology recording station, the following annual totals for the 2019 year to date as at mid-November are summarised:
◗ Toowoomba Airport - 324 mm (12.96”);
◗ Clifton – 155.6 mm (6.2”);
◗ Texas Post Office - 130 mm (5.2”);
◗ Charleville – 228 mm (9.1”);
◗ Cunnamulla – 157.2 mm (6.3”);
◗ Dalby – 154.4 mm (6.1”);
◗ Gatton – 187.5 mm (7.5”).
Many of these areas in south-east Queensland

RU
RA
L
Month in ReviewDecember 2019
59
safe Christmas and a successful and wet new year.
North QueenslandThe market continued to surprise for coastal horticultural land in far north Queensland throughout 2019. Despite sustained low sugar prices and continuing volatile banana prices in 2019, sale numbers and sale prices were quite healthy. The sale of a $5 million grazing and banana farm on red soil country west of Innisfail was a welcome boost for the beleaguered banana industry, still dealing with the outbreak of the Panama Tropical Race 4 fungal outbreak further south in the Tully Valley. There have been very few sales of going concern banana farms in recent years, which is mainly due to the fear that the TR4 outbreak may spread, however to date, this has been unfounded. A sale of this magnitude is a strong vote of confidence in the industry, particularly as the sale was to a long term local grower. A total of six sales over $1 million during 2019 was a positive sign for the local Cassowary Coast sugar, banana and grazing industries.
Figure 1 shows the median per hectare sale price of rural property sales in the Cassowary Coast region. Reported sale prices included in the analysis do not necessarily relate directly to land values, as the source data does not separate out the value of any buildings, machinery, crop or livestock included in each sale. Our analysis covers all rural properties 20 hectares or more in size and excludes sales that are not arm’s length transactions, such as intra-family and part sales.
As a general trend, Figure 1 shows fluctuating value
growth during the 1980s, strong value growth through the 1990s and then a steady fall from 1999 until 2003, which coincided with a collapse in world sugar prices. Values rose strongly again from 2003 to 2008, before dropping through to 2011 when sale values also reflected property damage from Cyclone Yasi. Though values have tended to recover since 2011, prices over the past three years can best be described as flat. The median rural property price thus far during 2019 stands at around $11,000 per hectare. Over the entire period from 1979 to 2019, rural property values in the region have increased at a long term average trend rate of 3.9 per cent per annum.
Source: HTW
Figure 2 shows the median per hectare sale price of rural property sales in the Cassowary Coast region according to the type of property. Property types are distinguished according to land use codes assigned by the Queensland Department of Natural Resources, Mines and Energy. Despite considerable inherent fluctuation due to the often low numbers of sales involved, the figures indicate a distinct price differential for cane and horticultural (banana) land over
and above grazing uses, with the latter providing the floor to the market. That differential all but disappeared during the early 2000s, but is now back in evidence again.
Source: HTW
The period from 2004 to 2008 saw the plantation timber industry become a major buyer of farming lands in the Cassowary Coast region, with three timber companies in particular acquiring over 10,000 hectares of mainly former cane land for plantation forestry purposes, at values ranging from $9,000 to $12,000 per hectare ex-structures. The Tully Sugar Mill responded to the loss of significant areas of productive sugar lands by purchasing a number of larger farms, even though in some instances timber companies were paying up to 30 per cent above those that traditional sugar producers were willing to pay. With the demise of the MIS forestry companies there was some easing in rural land values as many of the plantations involved were subsequently bought back to revert to cane or banana production, but this process has now well and truly run its course.
Though Cyclones Larry and Yasi severely damaged crop production and property in the region, the ultimate effect of the cyclones on underlying market values was relatively slight. This arises as
The market continued to surprise for coastal horticultural land in far north Queensland throughout 2019.

RU
RA
L
Month in ReviewDecember 2019
60
Going into 2020, sellers and buyers will need to have their wits about them and do their homework properly before making property sales or purchasing decisions.
There are many dynamics at play that need to be considered. Food for your thoughts includes:
• Low interest rate environment - the cost of debt is low. Bond markets indicate that this phase of the cycle could be around for a while. This is positive in the first instance, however what happens down the track when there is a rise in interest rates?
• Cattle prices - market sentiment is positive for the northern cattle prices and market security.
• Rain - well, there are a few storm clouds brewing, so we shall all wait and see. If it does rain all the way down the eastern seaboard, the market chatter is that this downs country will come off the boil. Perhaps there will be a couple of new owners who will sell to retract their business back to their home territory. On the other hand, perhaps their home country will take a while to recover once it rains. Having moved cattle to the Downs, they may do very well on the back of strong cattle prices and keep their new Downs blocks. The market may
reported to have had the main impact.
This cooler temperature is thought to have impacted grass response too. As a result, not the greatest body of grass grew. Of note is a rain event in June where there were warm temperatures that followed. More grass (and better quality) grew in the ensuing period.
For the purposes of market perspective:
2016 Mitchell Grass Downs market conditions:
◗ Sales included a full range of lighter downs to good quality Flinders River frontage country.
◗ Sales included highly sought after country to the north of Julia Creek and Neila (golden triangle market area).
◗ Local buyers were active.
2019 Mitchell Grass Downs market conditions:
◗ High volume of lighter to mixed downs transactions.
◗ Best sale is a good piece of country, however not frontage country. Better country was not for sale.
◗ Etta Plains has not been included (emerging higher and better agricultural use).
◗ Apart from Etta Plains, there were no sales in the golden triangle to the north of Julia Creek or Richmond.
◗ Dominant demand from out of region buyers.
The graph below shows the top and the lower priced sale hectare rates for each year.
the market over the longer term tends to factor in events such as floods and cyclones that are prone to occur in the region from time to time.
Land values for sugar cane farms currently range between $8,000 and $12,000 per planted hectare inclusive of stools, exclusive of buildings, crop and machinery. Land suitable for conversion to banana production is towards the upper end of this range. Land values for banana farms currently range between $20,000 and $25,000 per planted hectare inclusive of stools and irrigation, exclusive of buildings, crop and machinery, although sales are non-existent in the Tully Valley and very limited further north in the Innisfail locality.
North West Queensland The north-west Queensland flood affected 13.5 million hectares in February.
Demand peaked within a month of the monsoonal event. The expectation was that a substantial body of grass would grow post flood. This would have been the only available grass in Australia given the national drought situation.
Demand was driven by out of region buyers. Initially phone calls were for agistment or country to lease. There was no country available for lease or agistment. The only option for drought affected graziers was to purchase country.
This saw six downs blocks sell within a short period thereafter. It was sell time! Not every property sold. Those who played hard ball too much still have their country. Those who saw the opportunity of a good price took the money that was on the table and settled their deal.
Towards the end of the rain event, the rapid drop in temperature created havoc for livestock. Cattle had endured enough, but the temperature drop is

RU
RA
L
Month in ReviewDecember 2019
61
vegetable growing operation to Lancelin north of Perth. There is also a recent report that Erregulla Plains at Mingenew is now under offer to an un-named corporate purchaser. This property has been owned and operated by the Smart family for a number of generations and spans 22,191 hectares of the mid-west cropping and grazing regions. After the Nicoletti sale, this will be one of the largest transactions in Western Australia for 2019 and is evidence of the continued purchaser demand from international and corporate purchasers in the Western Australian cropping regions.
Elsewhere in the state, a sale of note in the south-west that transacted early in the year was a vineyard and wine storage property located at Clews Road, Cowaramup that sold for $7.6 million. The property includes 104 hectares of land which is predominantly developed with mixed variety vineyard and wine storage. The property has significant dams supplying irrigation to the vineyard and is located within the Margaret River wine region which is known for premium quality wines.
We have also continued to see the clearing of timber plantations and reversion to grazing or cropping as commodity prices and demand for quality land continues. Costings vary from $500 to $1,500 per hectare dependant on the works program and standard of rehabilitation required.
Overall, the year which started on a high has finished on a low for some however as noted above it was great to hear about the spirit of the bush so many people talk about and I am sure everyone will spare a thought for those who are doing it tough this year either due to drought or fires.
just level off for a while too.
• Northern development - there are irrigation schemes on the horizon. Should these come into play, then the northern agricultural sector (and property market) will take advantage of new opportunities that arise.
The new year brings many challenges to north and north-west Queensland.
Compliments to all for the 2019 Christmas period and the wet season.
West AustraliaAs the year draws to an end in Western Australia, a number of records are being set and unfortunately, it is at the speed that the headers are able to cross the paddocks.
The 2018/2019 near record harvest and high commodity prices resulted in many farmers seeing in this year on a high. This translated into confidence in the market place and a number of properties were purchased along with a number of new machines and big boy’s toys. Unfortunately, like other states, the climate has not been kind this year and many areas have had very low rainfall which has resulted in a poor start and finish with yields significantly down as a result.
Some areas also suffered from frost with crops being cut for hay and in one area I heard that a producer donated the hay to eastern states to help feed stock in the drought ridden areas. As they say, every cloud has a silver lining and in this instance, we witnessed the testament to the character of country folk that although facing adversity, you can still lend a hand to those worse off.
Some sales of note this year included the settlement of the Nicoletti cropping and grazing portfolio and the Galati family have expanded their

Property Market IndicatorsDecember 2019

Month in Review |December 2019
Capital City Property Market Indicators – Houses
Factor Sydney Melbourne Brisbane Adelaide Perth Hobart Darwin Canberra
Rental Vacancy Situation Balanced market Balanced market Balanced market Balanced market Shortage of available property relative to demand
Severe shortage of available property relative to demand
Over-supply of available property relative to demand
Severe shortage of available property relative to demand
Rental Vacancy Trend Increasing Tightening Steady Steady Tightening Steady Increasing Steady
Demand for New Houses Fair Strong Fair Fair Fair Fair Soft Strong
Trend in New House Construction Increasing Steady Increasing Steady Steady Declining Increasing Increasing
Volume of House Sales Increasing Increasing Steady Steady Steady Steady Steady Steady
Stage of Property Cycle Start of recovery Start of recovery Start of recovery Bottom of market Bottom of market Rising market Bottom of market Peak of market
Are New Properties Sold at Prices Exceeding Their Potential Resale Value
Occasionally Almost never Occasionally Occasionally Occasionally Occasionally Frequently Occasionally
Red entries indicate change from previous month to a higher risk-rating Blue entries indicate change from previous month to a lower risk-rating
0
1
2
3
4
5
6
Sydney
Melbourn
e
Brisbane
AdelaidePerth
Hobart
Darwin
Canberra
Rental Vacancy Trend
Increasing Sharply
Increasing
Steady
Tightening
0
1
2
3
4
5
6
Sydney
Melbourn
e
Brisbane
AdelaidePerth
Hobart
Darwin
Canberra
Demand for New Houses
Very Soft
Soft
Fair
Strong
Very Strong0
1
2
3
4
5
6
7
8
9
Sydney
Melbourn
e
Brisbane
AdelaidePerth
Hobart
Darwin
Canberra
Stage of Property Cycle
Peak of Market
Starting to
Decline
Approaching Peak
Declining Market
Approaching
Bottom
Rising Market

Month in Review |December 2019
Capital City Property Market Indicators – Units
Factor Sydney Melbourne Brisbane Adelaide Perth Hobart Darwin Canberra
Rental Vacancy Situation Over-supply of available property relative to demand
Over-supply of available property relative to demand
Balanced market Balanced market Balanced market Severe shortage of available property relative to demand
Large over-supply of available property relative to demand
Balanced market
Rental Vacancy Trend Increasing Steady Steady Steady Tightening Steady Increasing Steady
Demand for New Units Soft Fair Fair Fair Soft Fair Soft Soft
Trend in New Unit Construction Increasing Declining Steady Steady Increasing Declining Increasing strongly Declining
Volume of Unit Sales Steady Steady Steady Steady Declining Steady Declining Declining
Stage of Property Cycle Bottom of market Start of recovery Bottom of market Bottom of market Declining market Rising market Bottom of market Declining market
Are New Properties Sold at Prices Exceeding Their Potential Resale Value
Frequently Almost never Very frequently Occasionally Very frequently Occasionally Frequently Occasionally
Red entries indicate change from previous month to a higher risk-rating Blue entries indicate change from previous month to a lower risk-rating
0
1
2
3
4
5
6
Sydney
Melbourn
e
Brisbane
AdelaidePerth
Hobart
Darwin
Canberra
Rental Vacancy Trend
Increasing harply
Increasing
Steady
Tightening
Tightening Sharply
0
1
2
3
4
5
6
Sydney
Melbourn
e
Brisbane
AdelaidePerth
Hobart
Darwin
Canberra
Demand for New Units
Very Soft
Soft
Fair
Strong
Very Strong
0
1
2
3
4
5
6
7
8
9
Sydney
Melbourn
e
Brisbane
AdelaidePerth
Hobart
Darwin
Canberra
Stage of Property Cycle
Peak of Market
Starting to Decline
Approaching Peak
Declining Market
Approaching Bottom
Rising Market
Bottom of MarketStart of Recovery

1
1
Month in Review |December 2019
Capital City Property Market Indicators – Office
Factor Sydney Melbourne Brisbane Adelaide Perth Hobart Darwin Canberra
Rental Vacancy Situation Shortage of available property relative to demand
Shortage of available property relative to demand
Over-supply of available property relative to demand
Over-supply of available property relative to demand
Over-supply of available property relative to demand
Over-supply of available property relative to demand
Over-supply of available property relative to demand
Balanced market
Rental Vacancy Trend Tightening Tightening Tightening Steady Steady Steady Steady Steady
Rental Rate Trend Increasing Increasing Stable Stable Stable Declining Stable Stable
Volume of Property Sales Steady Steady Steady Declining Declining Steady Steady Steady
Stage of Property Cycle Peak of market Peak of market Rising market Start of recovery Bottom of market Bottom of market Bottom of market Start of recovery
Local Economic Situation Flat Steady growth Steady growth Flat Flat Flat Severe contraction Steady growth
Value Difference between Quality Properties with National Tenants, and Comparable Properties with Local Tenants
Small Small Large Significant Large Significant Large Significant
Red entries indicate change from 3 months ago to a higher risk-rating Blue entries indicate change from 3 months ago to a lower risk-rating
0
1
2
3
4
5
6
Sydney
Melbourn
e
Brisbane
AdelaidePerth
Hobart
Darwin
Canberra
Rental Vacancy Trend
Increasing Sharply
Increasing
Steady
Tightening
Tightening Sharply
0
1
2
3
4
5
6
Sydney
Melbourn
e
Brisbane
AdelaidePerth
Hobart
Darwin
Canberra
Local Economic Situation
Severe Contraction
Contraction
Flat
Steady Growth
High Growth
0
1
2
3
4
5
6
7
8
9
Sydney
Melbourn
e
Brisbane
AdelaidePerth
Hobart
Darwin
Canberra
Stage of Property Cycle
Peak of Market
Starting to Decline
Approaching Peak
Declining Market
Approaching
Bottom
Rising Market
Bottom of MarketStart of Recovery

Month in Review |December 2019
East Coast New South Wales Property Market Indicators – Houses Factor Canberra Central Coast Coffs Harbour Lismore Byron
Bay/Ballina Newcastle Southern Highlands
Southern Tableands Sydney
Rental Vacancy Situation Severe shortage of available property relative to demand
Balanced market Shortage of available property relative to demand
Balanced market Balanced market Balanced market Over-supply of available property relative to demand
Balanced market Balanced market
Rental Vacancy Trend Steady Steady Tightening sharply
Steady Steady Steady Increasing Steady Increasing
Demand for New Houses Strong Fair Fair Fair Fair Fair Fair Soft Fair
Trend in New House Construction
Increasing Steady Steady Steady Declining Steady Increasing Declining Increasing
Volume of House Sales Steady Declining Steady Steady Increasing Declining Steady Increasing Increasing
Stage of Property Cycle Peak of market Starting to decline Start of recovery Start of recovery Start of recovery Start of recovery Bottom of market Bottom of market Start of recovery
Are New Properties Sold at Prices Exceeding Their Potential Resale Value
Occasionally Frequently Almost never Almost never Almost never Occasionally Frequently Occasionally Occasionally
Red entries indicate change from previous month to a higher risk-rating Blue entries indicate change from previous month to a lower risk-rating
0
1
2
3
4
5
6
Canberr
a
Centra
l Coas
t
Coffs H
arbour
Lismore
Ballina/B
yron Bay
Newcastl
e
South
ern Highla
nds
South
ern Ta
blenads
Sydney
Rental Vacancy Trend
Increasing Sharply
Increasing
Steady
Tightening
Tightening Sharply
0
1
2
3
4
5
6
Canberra
Central C
oast
Coffs H
arbour
Lismore
Ballina/B
yron…
Newca
stle
Southe
rn…
Southe
rn…
Sydney
Demand for New Houses
Very Soft
Soft
Fair
Strong
Very Strong
0
1
2
3
4
5
6
7
8
9
Canberra
Central C
oast
Coffs H
arbour
Lismore
Ballina/B
yron…
Newca
stle
Southe
rn…
Southe
rn…
Sydney
Stage of Property CyclePeak of Market
Starting to Decline
Approaching Peak
Declining Market
Approaching Bottom
Rising Market
Bottom of
Market

Month in Review |December 2019
Country New South Wales Property Market Indicators – Houses Factor Albury Bathurst Wodonga Dubbo Tamworth Illawarra
Rental Vacancy Situation Balanced market Balanced market Balanced market Balanced market Severe shortage of available property relative to demand
Balanced market
Rental Vacancy Trend Steady Steady Steady Steady Steady Steady
Demand for New Houses Soft Fair Fair Fair Fair Fair
Trend in New House Construction Increasing Declining Steady Steady Increasing Steady
Volume of House Sales Steady Steady Declining Increasing Steady Steady
Stage of Property Cycle Peak of market Peak of market Starting to decline Peak of market Peak of market Start of recovery
Are New Properties Sold at Prices Exceeding Their Potential Resale Value
Occasionally Occasionally Occasionally Very frequently Occasionally Frequently
Red entries indicate change from previous month to a higher risk-rating Blue entries indicate change from previous month to a lower risk-rating
0
1
2
3
4
5
6
Albury
Bathurst
Wodon
ga
Dubbo
Tamworth
Illawarra
Rental Vacancy Trend
Increasing Sharply
Increasing
Steady
Tightening
0
1
2
3
4
5
6
7
8
9
Albury
Bathurst
Wodonga
Dubbo
Tamworth
Illawarra
Stage of Property Cycle
Peak of Market
Starting to Decline
Approaching Peak
Declining Market
Approaching Bottom
Rising Market
Bottom of MarketStart of Recovery 0
1
2
3
4
5
6
Albury
Bathurst
Wodonga
Dubbo
Tamworth
Illawarra
Demand for New Houses
Very Soft
Soft
Fair
Strong

Month in Review |December 2019East Coast New South Wales Property Market Indicators - Units
Factor Canberra Central Coast Coffs Harbour Lismore Byron Bay/Ballina Newcastle Southern
Highlands Southern Tableands Sydney
Rental Vacancy Situation
Balanced market Shortage of available property relative to demand
Shortage of available property relative to demand
Balanced market Shortage of available property relative to demand
Balanced market Balanced market Balanced market Over-supply of available property relative to demand
Rental Vacancy Trend Steady Steady Tightening sharply Steady Steady Steady Steady Steady Increasing
Demand for New Units Soft Strong Fair Fair Strong Fair Soft Soft Soft
Trend in New Unit Construction
Declining Steady Steady Steady Declining Steady Increasing Increasing Increasing
Volume of Unit Sales Declining Steady Steady Steady Increasing Declining Steady Steady Steady
Stage of Property Cycle Declining market Starting to decline Bottom of market Start of recovery Start of recovery Start of recovery Bottom of market Declining market Bottom of market
Are New Properties Sold at Prices Exceeding Their Potential Resale Value
Occasionally Occasionally Almost never Almost never Almost never Occasionally Occasionally Occasionally Frequently
Red entries indicate change from previous month to a higher risk-rating Blue entries indicate change from previous month to a lower risk-rating
0
1
2
3
4
5
6
Canberr
a
Centra
l Coas
t
Coffs H
arbour
Lismore
Ballina/B
yron Bay
Newcastl
e
South
ern Highla
nds
South
ern Ta
bleands
Sydney
Rental Vacancy Trend
Increasing Sharply
Increasing
Steady
Tightening
Tightening Sharply
0
1
2
3
4
5
6
Canberra
Central C
oast
Coffs H
arbour
Lismore
Ballina/B
yron…
Newca
stle
Southe
rn…
Southe
rn…
Sydney
Demand for New Units
Very Soft
Soft
Fair
Strong
Very Strong
0
1
2
3
4
5
6
7
8
9
Canberra
Central C
oast
Coffs H
arbour
Lismore
Ballina/B
yron…
Newca
stle
Southe
rn…
Southe
rn…
Sydney
Stage of Property CyclePeak of Market
Starting to
Decline
Approaching
Peak
Declining
Market
Approaching

Month in Review |December 2019Country New South Wales Property Market Indicators - Units
Factor Albury Wodonga Bathurst Dubbo Tamworth Illawarra
Rental Vacancy Situation Balanced market Balanced market Balanced market Balanced market Balanced market Over-supply of available property relative to demand
Rental Vacancy Trend Steady Steady Steady Steady Steady Steady
Demand for New Units Soft Soft Fair Fair Soft Fair
Trend in New Unit Construction
Increasing Increasing Increasing Declining Declining Steady
Volume of Unit Sales Steady Declining Steady Steady Declining Steady
Stage of Property Cycle Peak of market Peak of market Peak of market Rising market Peak of market Start of recovery
Are New Properties Sold at Prices Exceeding Their Potential Resale Value
Occasionally Occasionally Occasionally Occasionally Occasionally Very frequently
Red entries indicate change from previous month to a higher risk-rating Blue entries indicate change from previous month to a lower risk-rating
0
1
2
3
4
5
6
Albury
Wodon
ga
Bathurst
Dubbo
Tamworth
Illawara
Rental Vacancy Trend
Increasing Sharply
Increasing
Steady
Tightening
0
1
2
3
4
5
6
7
8
9
Albury
Wodonga
Bathurst
Dubbo
Tamworth
Illawara
Stage of Property Cycle
Peak of Market
Starting to
Decline
Approaching
Peak
Declining Market0
1
2
3
4
5
6
Albury
Wodonga
Bathurst
Dubbo
Tamworth
Illawara
Demand for New Units
Very Soft
Soft
Fair
Strong

Month in Review |December 2019
East Coast & Country New South Wales Property Market Indicators – Office Factor Canberra Central Coast Coffs Harbour Lismore Ballina/Byron Bay Mid-North Coast Newcastle SE NSW
Sydney
Rental Vacancy Situation Over-supply of available property relative to demand
Balanced market Over-supply of available property relative to demand
Balanced market Shortage of available property relative to demand
Balanced market Balanced market
Balanced market
Shortage of available property relative to demand
Rental Vacancy Trend Tightening Tightening Steady Steady Tightening Tightening Steady Steady Tightening
Rental Rate Trend Increasing Stable Stable Stable Increasing Stable Stable Stable Increasing
Volume of Property Sales Steady Increasing Steady Steady Steady Declining Steady Steady Steady
Stage of Property Cycle Start of recovery Start of recovery Peak of market Peak of market Peak of market Starting to decline Start of recovery
Peak of market Peak of market
Local Economic Situation Steady growth Steady growth Flat Flat Steady growth Flat Flat Steady growth Flat
Value Difference between Quality Properties with National Tenants, and Comparable Properties with Local Tenants
Significant Significant Significant Significant Small Large Significant Significant Small
Red entries indicate change from 3 months ago to a higher risk-rating Blue entries indicate change from 3 months ago to a lower risk-rating
0
1
2
3
4
5
6
Canberra
Central C
oast
Coffs H
arbour
Lismore
Byron…
Mid Nort
h…
Newca
stle
South E
ast…
Sydney
Rental Vacancy Trend
0
1
2
3
4
5
6
Canberra
Central C
oast
Coffs H
arbour
Lismore
Byron…
Mid Nort
h…
Newca
stle
South E
ast…
Sydney
Local Economic Situation
Severe Contraction.
Contraction
Flat
Steady Growth
High Growth0
1
2
3
4
5
6
7
8
9
Canberra
Central C
oast
Coffs H
arbour
Lismore
Byron…
Mid Nort
h…
Newca
stle
South E
ast…
Sydney
Stage of Property Cycle

Month in Review |December 2019
Victorian and Tasmanian Property Market Indicators – Houses Factor Geelong Melbourne Shepparton Mildura Mount Gambier
Hobart Burnine/
Devenport Launceston
Rental Vacancy Situation Balanced market Balanced market Shortage of available property relative to demand
Shortage of available property relative to demand
Shortage of available property relative to demand
Severe shortage of available property relative to demand
Balanced market Severe shortage of available property relative to demand
Rental Vacancy Trend Steady Tightening Tightening Tightening Tightening Steady Steady Steady
Demand for New Houses Fair Strong Strong Fair Fair Fair Fair Fair
Trend in New House Construction Steady Steady Steady Steady Steady Declining Steady Declining
Volume of House Sales Increasing Increasing Steady Steady Steady Steady Steady Steady
Stage of Property Cycle Start of recovery Start of recovery Rising market Rising market Rising market Rising market Rising market Rising market
Are New Properties Sold at Prices Exceeding Their Potential Resale Value
Occasionally Almost never Almost never Almost never Occasionally Occasionally Occasionally Occasionally
Red entries indicate change from previous month to a higher risk-rating Blue entries indicate change from previous month to a lower risk-rating
0
1
2
3
4
5
6
Geelon
g
Melbourne
Shepparto
n
Mildiura
Mount G
ambier
Hobart
Launce
ston
Burnie/
Deven
port
Rental Vacancy Trend
Increasing Sharply
Increasing
Steady
Tightening
Tightening Sharply
0
1
2
3
4
5
6
7
8
9
Geelon
g
Melbourne
Shepparto
n
Mildiura
Mount G
ambier
Hobart
Launce
ston
Burnie/
Deven
port
Stage of Property Cycle
Peak of Market
Starting to Decline
Approaching Peak
Declining Market
Approaching
Bottom
Rising Market
Bottom of MarketStart of Recovery
0
1
2
3
4
5
6
Geelon
g
Melbourne
Shepparto
n
Mildiura
Mount G
ambier
Hobart
Launce
ston
Burnie/
Deven
port
Demand for New Houses
Very Soft
Soft
Fair
Strong
Very Strong

Month in Review |December 2019
Victorian and Tasmanian Property Market Indicators – Units
Factor Geelong Melbourne Shepparton Mildura Hobart Launceston Burnie/Develport
Rental Vacancy Situation Balanced market Over-supply of available property relative to demand
Shortage of available property relative to demand
Shortage of available property relative to demand
Severe shortage of available property relative to demand
Severe shortage of available property relative to demand
Balanced market
Rental Vacancy Trend Steady Steady Tightening Tightening Steady Steady Steady
Demand for New Units Fair Fair Fair Fair Fair Fair Fair
Trend in New Unit Construction Steady Declining Steady Steady Declining Declining Steady
Volume of Unit Sales Steady Steady Steady Steady Steady Steady Steady
Stage of Property Cycle Start of recovery Start of recovery Start of recovery Rising market Rising market Rising market Rising market
Are New Properties Sold at Prices Exceeding Their Potential Resale Value
Occasionally Almost never Almost never Almost never Occasionally Occasionally Occasionally
Red entries indicate change from previous month to a higher risk-rating Blue entries indicate change from previous month to a lower risk-rating
0
1
2
3
4
5
6
Geelon
g
Melbourne
Shepparto
n
Mildura
Hobart
Launce
ston
Burnie/
Deven
port
Rental Vacancy Trend
I
0
1
2
3
4
5
6
Geelon
g
Melbourne
Shepparto
n
Mildura
Hobart
Launce
ston
Burnie/
Deven
port
Demand for New Units
Very Soft
Soft
Fair
Strong
Very Strong
0
1
2
3
4
5
6
7
8
9
Geelon
g
Melbourne
Shepparto
n
Mildura
Hobart
Launce
ston
Burnie/
Deven
port
Stage of Property Cycle

Month in Review |December 2019Victorian and Tasmanian Property Market Indicators – Office
Factor Dubbo Illawarra Ballarat Echuca Melbourne Geelong Mildura Hobart Launceston
Rental Vacancy Situation Shortage of available property relative to demand
Balanced market Balanced market Over-supply of available property relative to demand
Shortage of available property relative to demand
Balanced market Over-supply of available property relative to demand
Over-supply of available property relative to demand
Over-supply of available property relative to demand
Rental Vacancy Trend Steady Steady Tightening Steady Tightening Steady Steady Steady Steady
Rental Rate Trend Stable Stable Increasing Declining Increasing Stable Stable Declining Declining
Volume of Property Sales Steady Declining Increasing Steady Steady Steady Steady Steady Steady
Stage of Property Cycle Peak of market Approaching peak of market
Rising market Declining market Peak of market Start of recovery Start of recovery Bottom of market Bottom of market
Local Economic Situation Steady growth Steady growth Steady growth Flat Steady growth Steady growth Steady growth Flat Flat
Value Difference between Quality Properties with National Tenants, and Comparable Properties with Local Tenants
Large Significant Small Small Small Small Significant Significant Significant
Red entries indicate change from 3 months ago to a higher risk-rating Blue entries indicate change from 3 months ago to a lower risk-rating
0
1
2
3
4
5
6
Dubbo
Illawarra
Ballara
t
Echuca
Melbourne
Geelon
g
Mildura
Hobart
Launce
ston
Rental Vacancy Trend
Increasing Sharply
Increasing
Steady
Tightening
Tightening 0
1
2
3
4
5
6
Dubbo
Illawarra
Ballara
t
Echuca
Melbourne
Geelon
g
Mildura
Hobart
Launce
ston
Local Economic Situation
Severe Contraction
Contraction
Flat
Steady Growth
High Growth0
1
2
3
4
5
6
7
8
9
Dubbo
Illawarra
Ballara
t
Echuca
Melbourne
Geelon
g
Mildura
Hobart
Launce
ston
Stage of Property Cycle
Peak of Market
Starting to Decline
Approaching Peak
Declining Market
Approaching
Bottom
Rising Market
Bottom of MarketStart of Recovery

Month in Review |December 2019
Queensland Property Market Indicators – Houses Factor Cairns Townsville Whitsunday Mackay Rockhampton Emerald Gladstone Bundaberg Hervey Bay Sunshine
Coast Brisbane Ipswich Gold Coast Toowoomba
Rental Vacancy Situation
Shortage of available property relative to demand
Shortage of available property relative to demand
Shortage of available property relative to demand
Shortage of available property relative to demand
Balanced market
Balanced market
Balanced market
Balanced market
Shortage of available property relative to demand
Balanced market
Balanced market
Over-supply of available property relative to demand
Balanced market
Shortage of available property relative to demand
Rental Vacancy Trend
Steady Steady Tightening Tightening Tightening Steady Steady Steady Tightening Steady Steady Steady Steady Tightening
Demand for New Houses
Fair Fair Fair Fair Fair Fair Fair Fair Fair Fair Fair Fair Fair Soft
Trend in New House Construction
Steady Steady Declining Steady Steady Steady Steady Steady Steady Steady Increasing Increasing Increasing
Increasing
Volume of House Sales
Steady Steady Steady Increasing Steady Increasing Steady Increasing Steady Steady Steady Steady Declining Declining
Stage of Property Cycle
Start of recovery
Start of recovery
Start of recovery
Start of recovery
Bottom of market
Rising market Start of recovery
Start of recovery
Rising market
Peak of market
Start of recovery
Bottom of market
Start of recovery
Bottom of market
Are New Properties Sold at Prices Exceeding Their Potential Resale Value
Almost never
Almost never
Almost never Occasionally Occasionally Occasionally Occasionally Almost never
Occasionally Occasionally Occasion-ally
Occasionally Frequently
Frequently
Red entries indicate change from previous month to a higher risk-rating Blue entries indicate change from previous month to a lower risk-rating
0
1
2
3
4
5
6
Cairns
Townsv
ille
Whitsunday
Mackay
Rockha
mpton
Emerald
Gladstone
Bundaberg
Hervey B
ay
Sunshine Coast
Brisban
e
Ipswich
Gold Coast
Toow
oomba
Rental Vacancy Trend
Increasing Sharply
Increasing
Steady
Tightening
Tightening Sharply
0
1
2
3
4
5
6
Cairns
Townsv
ille
Whitsunday
Mackay
Rockha
mpton
Emerald
Gladstone
Bundaberg
Hervey B
ay
Sunshine Coast
Brisban
e
Ipswich
Gold Coast
Toow
oomba
Demand for New Houses
Very Soft
Soft
Fair
Strong
Very Strong
0
1
2
3
4
5
6
7
8
9
Cairns
Townsv
ille
Whitsunday
Mackay
Rockha
mpton
Emerald
Gladstone
Bundaberg
Hervey B
ay
Sunshine Coast
Brisban
e
Ipswich
Gold Coast
Toow
oomba
Stage of Property Cycle
Peak of Market
Starting to Decline
Approaching Peak
Declining Market
Approaching
Bottom
Rising Market
Bottom of MarketStart of Recovery

Month in Review |December 2019
Queensland Property Market Indicators – Units
Factor Cairns Townsville Whitsunday Mackay Rock-hampton Emerald Gladstone Bundaberg Hervey Bay Sunshine
Coast Brisbane Ipswich Gold Coast Toowoomba
Rental Vacancy Situation
Shortage of available property relative to demand
Shortage of available property relative to demand
Over-supply of available property relative to demand
Shortage of available property relative to demand
Balanced market
Balanced market
Balanced market
Balanced market
Shortage of available property relative to demand
Balanced market
Balanced market
Over-supply of available property relative to demand
Balanced market
Shortage of available property relative to demand
Rental Vacancy Trend Steady Steady Steady Tightening Tightening Steady Steady Steady Tightening Steady Steady Steady Steady Steady
Demand for New Units
Fair Soft Very soft Fair Fair Very soft Fair Fair Fair Fair Fair Soft Soft Soft
Trend in New Unit Construction
Steady Steady Declining significantly
Increasing Steady Increasing strongly
Steady Steady Steady Steady Steady Steady Steady Increasing
Volume of Unit Sales Steady Increasing Steady Steady Steady Steady Steady Steady Increasing Steady Steady Steady Steady Declining
Stage of Property Cycle
Start of recovery
Start of recovery
Bottom of market
Start of recovery
Bottom of market
Start of recovery
Start of recovery
Start of recovery
Rising market
Peak of market
Bottom of market
Bottom of market
Bottom of market
Bottom of market
Are New Properties Sold at Prices Exceeding Their Potential Resale Value
Almost never Almost never Occasionally Occasionally Almost never
Occasionally Occasionally Almost never Occasionally Occasionally Very frequently
Very frequently
Frequently Very frequently
Red entries indicate change from previous month to a higher risk-rating Blue entries indicate change from previous month to a lower risk-rating
0
1
2
3
4
5
6
Cairns
Townsv
ille
Whitsunday
Mackay
Rockha
mpton
Emerald
Gladstone
Bundaberg
Hervey B
ay
Sunshine Coast
Brisban
e
Ipswich
Gold Coast
Toow
oomba
Rental Vacancy Trend
Increasing Sharply
Increasing
Steady
Tightening
Tightening Sharply
0
1
2
3
4
5
6
Cairns
Townsv
ille
Whitsunday
Mackay
Rockha
mpton
Emerald
Gladstone
Bundaberg
Hervey B
ay
Sunshine Coast
Brisban
e
Ipswich
Gold Coast
Toow
oomba
Demand for New Units
Very Soft
Soft
Fair
Strong
Very Strong
0
1
2
3
4
5
6
7
8
9
Cairns
Townsv
ille
Whitsunday
Mackay
Rockha
mpton
Emerald
Gladstone
Bundaberg
Hervey B
ay
Sunshine Coast
Brisban
e
Ipswich
Gold Coast
Toow
oomba
Stage of Property Cycle
Peak of Market
Starting to
Decline
Approaching Peak
Declining Market
Approaching
Bottom
Rising Market
Bottom of Market
Month in Review |December 2019
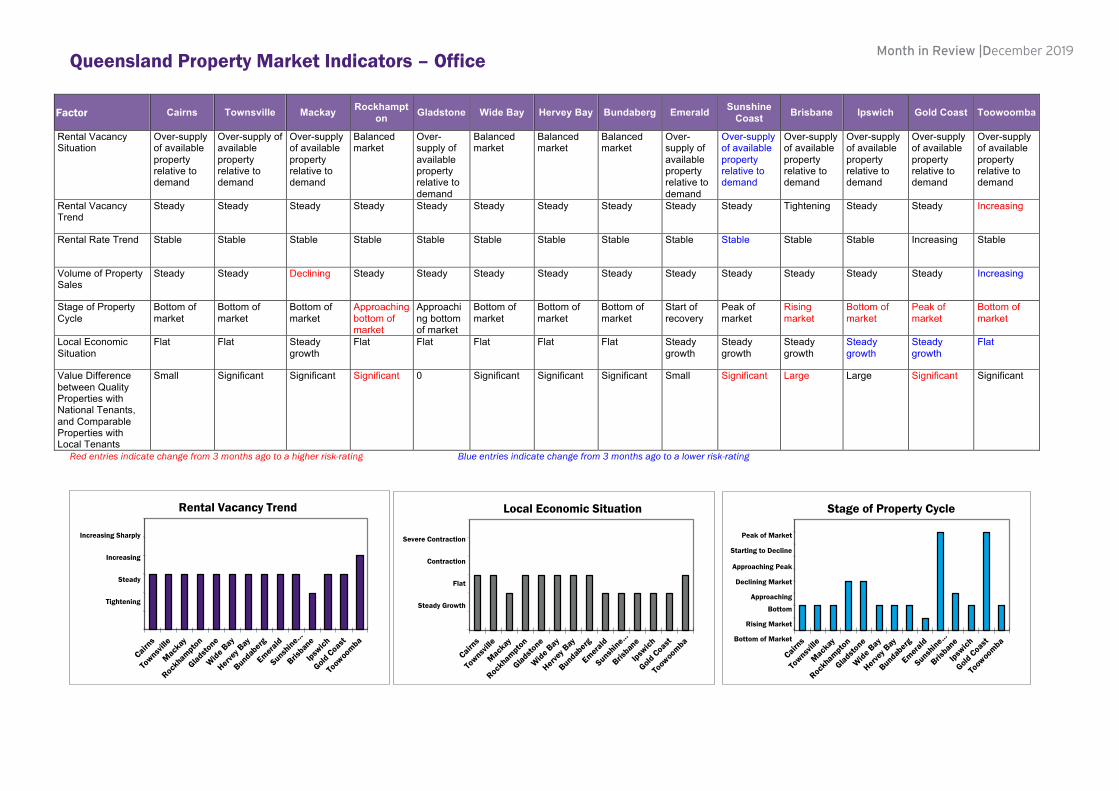
Month in Review |December 2019Queensland Property Market Indicators – Office
Factor Cairns Townsville Mackay Rockhampton Gladstone Wide Bay Hervey Bay Bundaberg Emerald Sunshine
Coast Brisbane Ipswich Gold Coast Toowoomba
Rental Vacancy Situation
Over-supply of available property relative to demand
Over-supply of available property relative to demand
Over-supply of available property relative to demand
Balanced market
Over-supply of available property relative to demand
Balanced market
Balanced market
Balanced market
Over-supply of available property relative to demand
Over-supply of available property relative to demand
Over-supply of available property relative to demand
Over-supply of available property relative to demand
Over-supply of available property relative to demand
Over-supply of available property relative to demand
Rental Vacancy Trend
Steady Steady Steady Steady Steady Steady Steady Steady Steady Steady Tightening Steady Steady Increasing
Rental Rate Trend Stable Stable Stable Stable Stable Stable Stable Stable Stable Stable Stable Stable Increasing Stable
Volume of Property Sales
Steady Steady Declining Steady Steady Steady Steady Steady Steady Steady Steady Steady Steady Increasing
Stage of Property Cycle
Bottom of market
Bottom of market
Bottom of market
Approaching bottom of market
Approaching bottom of market
Bottom of market
Bottom of market
Bottom of market
Start of recovery
Peak of market
Rising market
Bottom of market
Peak of market
Bottom of market
Local Economic Situation
Flat Flat Steady growth
Flat Flat Flat Flat Flat Steady growth
Steady growth
Steady growth
Steady growth
Steady growth
Flat
Value Difference between Quality Properties with National Tenants, and Comparable Properties with Local Tenants
Small Significant Significant Significant 0 Significant Significant Significant Small Significant Large Large Significant Significant
Red entries indicate change from 3 months ago to a higher risk-rating Blue entries indicate change from 3 months ago to a lower risk-rating
0
1
2
3
4
5
6
Cairns
Townsv
ille
Mackay
Rockha
mpton
Gladstone
Wide Bay
Hervey B
ay
Bundaberg
Emerald
Sunshine…
Brisban
e
Ipswich
Gold Coast
Toow
oomba
Rental Vacancy Trend
Increasing Sharply
Increasing
Steady
Tightening
0
1
2
3
4
5
6
Cairns
Townsv
ille
Mackay
Rockha
mpton
Gladstone
Wide Bay
Hervey B
ay
Bundaberg
Emerald
Sunshine…
Brisban
e
Ipswich
Gold Coast
Toow
oomba
Local Economic Situation
Severe Contraction
Contraction
Flat
Steady Growth
0
1
2
3
4
5
6
7
8
9
Cairns
Townsv
ille
Mackay
Rockha
mpton
Gladstone
Wide Bay
Hervey B
ay
Bundaberg
Emerald
Sunshine…
Brisban
e
Ipswich
Gold Coast
Toow
oomba
Stage of Property Cycle
Peak of Market
Starting to Decline
Approaching Peak
Declining Market
Approaching
Bottom
Rising Market
Bottom of Market

Month in Review |December 2019
SA, NT and WA Property Market Indicators - Houses Factor Adelaide Adelaide Hills Barossa Valley Alice Springs Darwin Perth Geraldton Kalgoorlie Karratha Port Hedland Broome South West WA
Rental Vacancy Situation
Balanced market
Balanced market
Balanced market
Balanced market
Over-supply of available property relative to demand
Shortage of available property relative to demand
Over-supply of available property relative to demand
Over-supply of available property relative to demand
Shortage of available property relative to demand
Balanced market
Balanced market
Balanced market
Rental Vacancy Trend
Steady Steady Steady Steady Increasing Tightening Tightening Increasing Tightening Tightening Steady Steady
Demand for New Houses
Fair Fair Fair Fair Soft Fair Fair Fair Fair Fair Fair Soft
Trend in New House Construction
Steady Declining significantly
Steady Steady Increasing Steady Steady Steady Steady Steady Steady Increasing
Volume of House Sales
Steady Steady Steady Steady Steady Steady Increasing Declining Increasing strongly
Increasing Declining Declining
Stage of Property Cycle
Bottom of market
Bottom of market
Bottom of market
Bottom of market
Bottom of market
Bottom of market
Approaching bottom of market
Declining market
Rising market Start of recovery
Approaching bottom of market
Approaching bottom of market
Are New Properties Sold at Prices Exceeding Their Potential Resale Value
Occasionally Occasionally Occasionally Almost never Frequently Occasionally Almost never
Almost never
Almost never Almost never Almost never Almost never
Red entries indicate change from 3 months ago to a higher risk-rating Blue entries indicate change from 3 months ago to a lower risk-rating
0
1
2
3
4
5
6
Adelaide
Adelaide H
ills
Baross
a Valley
Alice Sprin
gs
Darwin
Perth
Geraldto
n
Kalgoorlie
Karrath
a
Port H
edland
Broom
e
South W
est W
A
Rental Vacancy Trend
Increasing Sharply
Increasing
Steady
Tightening
Tightening Sharply
0
1
2
3
4
5
6
Adelaide
Adelaide H
ills
Baross
a Valley
Alice Sprin
gs
Darwin
Perth
Geraldto
n
Kalgoorlie
Karrath
a
Port H
edland
Broom
e
South W
est W
A
Demand for New Houses
Very Soft
Soft
Fair
Strong
Very Strong
0
1
2
3
4
5
6
7
8
9
Adelaide
Adelaide H
ills
Baross
a Valley
Alice Sprin
gs
Darwin
Perth
Geraldto
n
Kalgoorlie
Karrath
a
Port H
edland
Broom
e
South W
est W
A
Stage of Property CyclePeak of Market
Starting to Decline
Approaching Peak
Declining Market
Approaching Bottom
Rising Market
Bottom of MarketStart of Recovery

Month in Review |December 2019
SA, NT and WA Property Market Indicators – Units
Factor Adelaide Adelaide Hills Barossa Valley
Mount Gambier Alice Springs Darwin Perth Geraldton Kalgoorlie Karratha Port Hedland Broome South West WA
Rental Vacancy Situation
Balanced market
Balanced market
Balanced market
Shortage of available property relative to demand
Balanced market
Large over-supply of available property relative to demand
Balanced market
Over-supply of available property relative to demand
Over-supply of available property relative to demand
Shortage of available property relative to demand
Balanced market
Balanced market
Balanced market
Rental Vacancy Trend
Steady Steady Steady Tightening Steady Increasing Tightening Tightening Increasing Tightening Tightening Steady Steady
Demand for New Units
Fair Fair Fair Fair Fair Soft Soft Fair Fair Fair Fair Fair Soft
Trend in New Unit Construction
Steady Increasing Steady Steady Steady Increasing strongly
Increasing Steady Steady Steady Steady Steady Increasing
Volume of Unit Sales
Steady Steady Steady Steady Steady Declining Declining Increasing Declining Increasing strongly
Increasing Declining Declining
Stage of Property Cycle
Bottom of market
Bottom of market
Bottom of market
Rising market Bottom of market
Bottom of market
Declining market
Approaching bottom of market
Declining market
Rising market
Start of recovery
Approaching bottom of market
Approaching bottom of market
Are New Properties Sold at Prices Exceeding Their Potential Resale Value
Occasionally Occasionally Occasionally Occasionally Almost never Frequently Very frequently
Almost never
Almost never
Almost never Almost never Almost never Almost never
Red entries indicate change from 3 months ago to a higher risk-rating Blue entries indicate change from 3 months ago to a lower risk-rating
0
1
2
3
4
5
6
Adelaide
Adelaide H
ills
Baross
a Valley
Mount G
ambier
Alice Sprin
gs
Darwin
Perth
Geraldto
n
Kalgoorlie
Karrath
a
Port H
edland
Broom
e
South W
est W
A
Rental Vacancy Trend
0
1
2
3
4
5
6
Adelaide
Adelaide H
ills
Baross
a Valley
Mount G
ambier
Alice Sprin
gs
Darwin
Perth
Geraldto
n
Kalgoorlie
Karrath
a
Port H
edland
Broom
e
South W
est W
A
Demand for New Units
Very Soft
Soft
Fair
Strong
0
1
2
3
4
5
6
7
8
9
Adelaide
Adelaide H
ills
Baross
a Valley
Mount G
ambier
Alice Sprin
gs
Darwin
Perth
Geraldto
n
Kalgoorlie
Karrath
a
Port H
edland
Broom
e
South W
est W
A
Stage of Property Cycle
Peak of Market
Starting to
Decline
Approaching
Peak
Declining Market
Approaching
Bottom

Month in Review |December 2019
SA, NT and WA Property Market Indicators – Office
Factor Adelaide Adelaide Hills Darwin Perth South West WA
Rental Vacancy Situation Over-supply of available property relative to demand
Over-supply of available property relative to demand
Over-supply of available property relative to demand
Over-supply of available property relative to demand
Over-supply of available property relative to demand
Rental Vacancy Trend Steady Steady Steady Steady Increasing
Rental Rate Trend Stable Declining Stable Stable Declining
Volume of Property Sales Declining Steady Steady Declining Declining
Stage of Property Cycle Start of recovery Declining market Bottom of market Bottom of market Approaching bottom of market
Local Economic Situation Flat Flat Severe contraction Flat Contraction
Value Difference between Quality Properties with National Tenants, and Comparable Properties with Local Tenants
Significant Small Large Large Small
Red entries indicate change from 3 months ago to a higher risk-rating Blue entries indicate change from 3 months ago to a lower risk-rating
0
1
2
3
4
5
6
Adelaide
Alice Sprin
gs
Darwin
Perth
South W
est W
A
Rental Vacancy Trend
Increasing Sharply
Increasing
Steady
Tightening
0
1
2
3
4
5
6
Adelaide
Alice Sprin
gs
Darwin
Perth
South W
est W
A
Local Economic Situation
Severe Contraction
Contraction
Flat
Steady Growth
0
1
2
3
4
5
6
7
8
9
Adelaide
Alice Sprin
gs
Darwin
Perth
South W
est W
A
Stage of Property CyclePeak of Market
Starting to Decline
Approaching Peak
Declining Market
Approaching
Bottom
Rising Market
Bottom of Market

Telephone 1300 880 [email protected]
Local expertise. National strength. Trusted solutions.Herron Todd White is Australia’s leading independent property valuation and advisory group. For more than 50 years, we’ve helped our customers make the most of their property assets by providing sound valuations and insightful analytical advice.
With offices in every capital city, most regional centres and right across rural Australia, we are where you are. Our valuers work in the property market every day, providing professional services for all classes of property including commercial, industrial, retail, rural and residential.
Herron Todd White is Australian owned and operated. With directors who are owners in the business, our team has a personal stake in providing you with the best service possible.
Liability limited by a scheme approved under Professional Standards Legislation.
TALK TO YOUR LOCAL EXPERT
Commercial
Residential
Rural