Monograph+2+(29+Dec+2014)
172
description
Singapore
Transcript of Monograph+2+(29+Dec+2014)
Public Housing in Singapore:Social Well-Being of HDB Communities
HDB Sample Household Survey 2013
Published by Housing & Development Board HDB Hub 480 Lorong 6 Toa Payoh Singapore 310480 Research Team
Goh Li Ping (Team Leader) William Lim Teong Wee Tan Hui Fang Wu Juan Juan Tan Tze Hui Clara Wong Lee Hua Lim E-Farn Fiona Lee Yiling Esther Chua Jia Ping Sangeetha d/o Panearselvan Amy Wong Jin Ying Phay Huai Yu Nur Asykin Ramli Wendy Li Xin Yvonne Tan Ci En Choo Kit Hoong Advisor: Dr Chong Fook Loong Raymond Toh Chun Parng Research Advisory Panel: Professor Aline Wong Associate Professor Tan Ern Ser Dr Lai Ah Eng Dr Kang Soon Hock Associate Professor Pow Choon Piew Dr Kevin Tan Siah Yeow Assistant Professor Chang Jiat Hwee Published Dec 2014 All information is correct at the time of printing. © 2014 Housing & Development Board. All rights reserved. No part of this publication may be reproduced or transmitted in any form or by any means. Produced by HDB Research and Planning Group ISBN 978-981-09-3829-1 Printed by Oxford Graphic Printers Pte Ltd 11 Kaki Bukit Road 1 #02-06/07/08 Eunos Technolink Singapore 415939 Tel: 6748 3898 Fax: 6747 5668 www.oxfordgraphic.com.sg

PUBLIC HOUSING IN SINGAPORE: Social Well-Being of HDB Communities
HDB Sample Household Survey 2013


i
FOREWORD HDB homes have evolved over the years, from basic flats catering to simple, everyday needs, to homes that meet higher aspirational desires for quality living. Over the last 54 years, since its formation, HDB has made the transformation of public housing its key focus. In the process, the changes have impacted on the physical and social landscape of Singapore. More importantly, they have shaped the way residents live, work and play. In our endeavour to positively impact the lives of our residents, we carry out surveys to find out what HDB residents like, or do not like, so that we can make changes and improvements, and plan our future designs and policies around them. The large-scale Sample Household Surveys (SHS) conducted every five years are an important platform for HDB to gather residents’ views and feedback. HDB has completed ten SHSs, with the first survey carried out in 1968, and the latest in 2013. This latest survey covered 7,800 households living in all 23 HDB towns and three estates. High-rise, high-density living in Singapore is liveable and a way of life. Findings from SHS 2013 survey show that residents are satisfied with their flat and the convenient access to estate facilities within their neighbourhood. Findings also show that family ties remained strong with frequent visits and strong familial support between parents and married children. Residents feel a greater sense of belonging and are proud to be part of their communities. These are just some of the interesting insights from the survey. The salient findings are published in the following two monographs: i) Public Housing in Singapore: Residents' Profile, Housing Satisfaction
and Preferences; and
ii) Public Housing in Singapore: Social Well-Being of HDB Communities. We deeply appreciate the cooperation, time and feedback given by residents. Their responses, observations and comments will go a long way in helping HDB provide better homes and towns for all. Dr. Cheong Koon Hean Chief Executive Officer Housing & Development Board


iii
Contents Page FOREWORD i
CONTENTS iii
LIST OF TABLES v
LIST OF CHARTS ix
KEY INDICATORS xiv
GLOSSARY OF TERMS AND DEFINITIONS xxi
CHAPTER 1 INTRODUCTION
1.1 Background 3 1.2 Objectives 4 1.3 Sampling Design 4 1.4 Outline of Monograph 5
SOCIAL WELL-BEING OF HDB COMMUNITIES 9
CHAPTER 2 COMMUNITY BONDING 13
2.1 Neighbourly Relations 14
2.2 Sense of Attachment & National Pride 29
2.3 Community Engagement 35
2.4 Summary of Findings 39
CHAPTER 3 FAMILY TIES 45
3.1 Physical Living Arrangement 47
3.2 Social Living Arrangement 51
3.3 Depth of Interaction 53
3.4 Forms and Extent of Family Support 59
3.5 Well-Being and Family Life 65
3.6 Impact of Proximity on Frequency of Visits, Familial Support 66 and Sense of Closeness
3.7 Ideal Elderly Living Arrangement and Caregiving 71 for Elderly Parents
3.8 Summary of Findings 73

iv
Contents Page
CHAPTER 4 WELL-BEING OF THE ELDERLY 77
4.1 Personal Aspects 79
4.1.1 Financial Well-Being
4.1.2 Perceived Level of Health
4.2 Social Aspects 91
4.2.1 Family Ties
4.2.2 Community Bonding
4.3 Housing Aspects 114
4.3.1 Satisfaction with Physical Living Environment
4.3.2 Satisfaction and Usage of Estate Facilities
4.3.3 Residential Mobility and Housing Aspirations
4.4 Summary of Findings 131
CONCLUSION 137
v
List of Tables Page
Table 2.1 Frequency of Neighbourly Interaction ...................................................................16
Table 2.2 Neighbourly Interaction by Ethnic Group ............................................................17
Table 2.3 Neighbourly Interaction by Type of Block ..........................................................18
Table 2.4 Reasons for Not Interacting with Neighbours .................................................19 of Other Ethnic Groups and/or Nationalities
Table 2.5 Types of Help Received/Provided ............................................................................20
Table 2.6 Received Help from/Provided Help to Neighbours ....................................21 by Attributes
Table 2.7 Tolerance Level for Types of Nuisances Faced by Year .....................23
Table 2.8 Whether Residents Did Anything with Nuisances Faced .....................25 by Attributes
Table 2.9 Places where Neighbours Meet for Interaction by Year ........................26
Table 2.10 Types of Shared Experience/Memory ...................................................................27
Table 2.11 Face-to-Face Interaction with Social Network by Age Group ..........29
Table 2.12 Virtual Mode of Interaction with Social Network by Age Group ......29
Table 2.13 Sense of Belonging by Length of Residence ..................................................31
Table 2.14 Intensity of Sense of Belonging by Age Group .............................................31
Table 2.15 Sense of Community Score by Year ......................................................................32
Table 2.16 Sense of Community Scores by Attributes .......................................................33
Table 2.17 Sense of Pride towards Community by Attributes ......................................34
Table 2.18 Reasons for Not Participating in Community Activities ..........................37
Table 2.19 Community Participation over Past 12 Months by Attributes ............37
Table 2.20 Contribution of Services for Benefit of Community .....................................38 by Age Group
Table 2.21 Whether Contributed Services and Reasons for Not ...............................39 Contributing/Not Willing to Contribute
Table 3.1 Age Distribution of Younger Married Residents ...........................................47 and Older Residents
Table 3.2 Present and Preferred Physical Living Arrangements ............................48 of Younger Married Residents vis-à-vis their Parents by Year
Table 3.3 Present Physical Living Arrangement ...................................................................49 of Younger Married Residents vis-à-vis their Parents by Resident Life-Cycle Stage
Table 3.4 Preferred Physical Living Arrangement ...............................................................49 of Younger Married Residents vis-à-vis their Parents by Resident Life-Cycle Stage
Table 3.5 Present and Preferred Physical Living Arrangements .............................51 of Older Residents with Married Children vis-à-vis their Married Children by Year

vi
List of Tables Page
Table 3.6 Present and Preferred Social Living Arrangements ...................................52 of Younger Married Residents by Year
Table 3.7 Present and Preferred Social Living Arrangements ...................................53 of Older Residents with Married Children by Year
Table 3.8 Frequency of Visits between Younger Married Residents ..................54 and their Parents by Year
Table 3.9 Frequency of Visits between Older Residents ...............................................54 and their Married Children by Year
Table 3.10 Frequency of Visits between Younger Married Residents ..................55 and their Parents by Attributes
Table 3.11 Frequency of Visits between Older Residents ...............................................55 and their Married Children by Flat Type
Table 3.12 Modes of Interaction with Family Members Not Living Together ....57
Table 3.13 Childcare Arrangements of Younger Married Residents ......................58 with Children Aged Twelve Years and Below by Year
Table 3.14 Proximity of Grandparents’ Home to Married Children by Year .....58
Table 3.15 Regular Financial Support from Younger Married Residents ...........60 to Parents by Year
Table 3.16 Regular Financial Support from Younger Married Residents ...........60 to Parents by Attributes
Table 3.17 Amount Contributed to Parents from Younger Married .........................61 Residents by Attributes
Table 3.18 Regular Financial Support Received by Older Residents ...................61 with Married Children by Year
Table 3.19 Regular Financial Support Received by Older Residents ...................62 with Married Children by Attributes
Table 3.20 Amount of Financial Support Received by Older Residents .............62 with Married Children by Attributes
Table 3.21 Person/Source Paying for Medical Bills ...............................................................63
Table 3.22 Younger Married Residents’ Reliance on Family Members ..............64 for Physical, Emotional and Financial Support
Table 3.23 Older Residents’ Reliance on Family Members ...........................................65 for Physical, Emotional and Financial Support
Table 3.24 Average Score for Sense of Closeness to Family Members ............66
Table 3.25 Frequency of Visits between Younger Married Residents ..................67 and their Parents by Proximity
Table 3.26 Frequency of Visits between Older Residents ...............................................68 and their Married Children by Proximity
Table 3.27 Residents’ Preferred Housing Type for Old Age ..........................................71
Table 3.28 Caregiving for Elderly Parents .....................................................................................73
vii
List of Tables Page
Table 4.1 Reasons for Not Having Financial Planning for Old Age .....................81 Needs among Elderly and Future Elderly
Table 4.2 Financial Planning for Retirement Needs among Elderly ....................82 and Future Elderly by Attributes
Table 4.3 Number of Financial Resources of Elderly and Future Elderly .......84 by Attributes
Table 4.4 Reasons for Having Inadequate Sources of Income ...............................85 among Elderly and Future Elderly
Table 4.5 Ways for Elderly and Future Elderly to Meet Any Shortfall ................85
Table 4.6 Adequacy of Sources of Income for Elderly and Future .........................86 Elderly by Attributes
Table 4.7 Options among Elderly and Future Elderly Who Had .............................89 No Intention to Monetise in the Next Five Years When They Encounter Major Financial Difficulties
Table 4.8 Preferred Monetisation Options among Elderly and .................................89 Future Elderly Who Intended to Monetise in the Next Five Years
Table 4.9 Perceived General Health of Elderly and Future Elderly ......................91 by Attributes
Table 4.10 Present and Preferred Physical Living Arrangements ............................93 of Elderly vis-à-vis their Married Children by Year
Table 4.11 Present and Preferred Physical Living Arrangements ............................94 of Future Elderly vis-à-vis their Married Children by Year
Table 4.12 Present and Preferred Social Living Arrangements ...................................95 of Elderly by Year
Table 4.13 Present and Preferred Social Living Arrangements ..................................95 of Future Elderly by Year
Table 4.14 Frequency of Visits between Elderly and Future Elderly ......................96 with their Married Children by Year
Table 4.15 Elderly Residents’ Reliance on Children for Physical, ...........................98 Emotional and Financial Support
Table 4.16 Future Elderly Residents’ Reliance on Children for Physical, ..........99 Emotional and Financial Support
Table 4.17 Regular Financial Support Received by Elderly ........................................ 101 and Future Elderly from All Children by Attributes
Table 4.18 Amount of Financial Support Received by Elderly .................................. 101 and Future Elderly from All Children by Attributes
Table 4.19 Elderly and Future Elderly Residents’ Perceived Ideal Living ..... 104 Arrangement for Elderly Persons Unable to Live on their Own
Table 4.20 Types of Neighbourly Interaction among Elderly ..................................... 105 and Future Elderly by Year
Table 4.21 Types and Frequency of Neighbourly Interaction ................................... 106 among Elderly

viii
List of Tables Page
Table 4.22 Places where Neighbours Meet among Elderly ....................................... 108 and Future Elderly
Table 4.23 Common Modes of Interaction among Elderly .......................................... 109 and Future Elderly by Year
Table 4.24 Sense of Belonging among Elderly and Future Elderly ....................... 109 by Year
Table 4.25 Sense of Community (SOC) Score among Elderly ................................ 110 and Future Elderly by Year
Table 4.26 Community Participation of Elderly and Future Elderly ..................... 111 in the Last Twelve Months by Year
Table 4.27 Reasons for Not Participating in Community Activities ...................... 111 among Elderly and Future Elderly
Table 4.28 Types of Community Participation among Elderly ................................. 113 and Future Elderly over Past Twelve Months by Year
Table 4.29 Whether Participate in Community Activities .............................................. 113 among Elderly and Future Elderly by Attributes Table 4.30 Elderly and Future Elderly with No Dislikes about Living in ........... 116 HDB Towns/Estates by Year
Table 4.31 Most-Liked Aspects about HDB Living Environment ........................... 117 among Elderly and Future Elderly
Table 4.32 Most-Disliked Aspects about HDB Living Environment ..................... 118 among Elderly and Future Elderly
Table 4.33 Satisfaction with Various Types of Estate Facilities .............................. 121 among Elderly and Future Elderly by Year
Table 4.34 Satisfaction with Elderly-Friendly Facilities by Year ............................. 122
Table 4.35 Proportion who had Utilised Eldercare Services ....................................... 123
Table 4.36 Proportion who Agreed that Eldercare Services were ........................ 124 Essential for Ageing-In-Place
Table 4.37 Usage Level of Estate Facilities among Elderly ....................................... 126 and Future Elderly by Year
Table 4.38 Housing Type Content With among Elderly ................................................. 130 and Future Elderly by Year
Table 4.39 Preferred Housing Type for Old Age among Elderly ............................ 131 and Future Elderly by Year
ix
List of Charts Page
Chart 2.1 Households Engaging in Various Types of Neighbourly ......................15 Interaction by Year
Chart 2.2 Engagement in Inter-Ethnic/Nationality Interaction by Year ..............19
Chart 2.3 Whether Received/Provided Help in Times of Emergencies ............20
Chart 2.4 Nuisances Faced From Neighbours by Year ..................................................22
Chart 2.5 Ways of Resolving Nuisances ......................................................................................24
Chart 2.6 Whether Had Shared Memories/Experiences with Neighbours .....27 by Year
Chart 2.7 Common Modes of Interaction with Social Networks by Year .........28
Chart 2.8 Intensity of Sense of Belonging by Length of Residence .....................30
Chart 2.9 Sense of Belonging by Year ..........................................................................................30
Chart 2.10 Sense of Pride towards Community by Year ..................................................33
Chart 2.11 Households with Positive Sentiments towards Singapore ..................34 by Year
Chart 2.12 Community Participation over Past 12 Months by Year ........................35
Chart 2.13 Types and Frequency of Community Activities Participated .............36 over Past 12 Months
Chart 2.14 Contribution of Services for Benefit of Community by Year ..............38
Chart 3.1 Types of Activities Carried Out between Younger Married ................56 Residents and their Parents
Chart 3.2 Types of Activities Carried Out between Older Residents ..................56 and their Married Children
Chart 3.3 Frequency of Keeping in Touch with Family Members Not ...............57 Living Together
Chart 3.4 Whether Faced Problems when Communicating with Children .....59 and Grandchildren
Chart 3.5 Importance of and Satisfaction with Family Life by Year ......................66
Chart 3.6 Younger Married Residents’ Reliance on Parents .....................................69 for Physical, Emotional and Financial Support by Proximity
Chart 3.7 Older Residents’ Reliance on Married Children ...........................................69 for Physical, Emotional and Financial Support by Proximity
Chart 3.8 Younger Married Residents’ Provision of Physical, Emotional .......70 and Financial Support to Parents by Proximity
Chart 3.9 Average Score for Sense of Closeness to Family Members ............70 by Proximity
Chart 3.10 Perceived Ideal Living Arrangement for Elderly Persons .....................72 Unable to Live on their Own

x
List of Charts Page
Chart 4.1 Elderly and Future Elderly who had Undertaken At Least One ......80 Financial Option in Planning for Retirement Needs
Chart 4.2 Financial Options for Retirement Planning among Elderly .................80 and Future Elderly
Chart 4.3 Regular Financial Sources of Elderly and Future Elderly ....................83
Chart 4.4 Number of Regular Financial Sources of Elderly ........................................83 and Future Elderly
Chart 4.5 Adequacy of Sources of Income to Meet Daily Expenses ..................84 for Elderly and Future Elderly by Year
Chart 4.6 Monetisation Options Taken after 50 Years Old ..........................................87 among Elderly and Future Elderly
Chart 4.7 Whether Monetised after Turning 50 Years Old for Elderly ...............88 and Future Elderly by Flat Type
Chart 4.8 Intention to Monetise in the Next Five Years among Elderly ............88 and Future Elderly
Chart 4.9 Intention to Monetise in the Next Five Years among Elderly ............90 and Future Elderly by Flat Type
Chart 4.10 Perceived General Health of Elderly and Future Elderly ......................90 by Year Chart 4.11 Types of Activities Carried Out between Elderly ..........................................97 and their Married Children
Chart 4.12 Types of Activities Carried Out between Future Elderly .......................97 and their Married Children
Chart 4.13 Person/Source Paying Medical Bills for Elderly ....................................... 102 and Future Elderly
Chart 4.14 Keeping in Touch with Family Members whom Elderly ..................... 103 and Future Elderly Do Not Live with
Chart 4.15 Whether Elderly and Future Elderly Faced Problems .......................... 103 when Communicating with Children and Grandchildren
Chart 4.16 Interaction with Neighbours of Other .................................................................. 107 Ethnic Groups/Nationalities among Elderly and Future Elderly by Year
Chart 4.17 Comparison of Community Participation Rate of Elderly ................. 112 by Year (Include and Exclude Sole Participation in Religious Activities)
Chart 4.18 Satisfaction with Flat & Neighbourhood ........................................................... 115 among Elderly by Year
Chart 4.19 Satisfaction with Flat & Neighbourhood ........................................................... 115 among Elderly and Future Elderly
Chart 4.20 Perception of Lift Reliability among Elderly and Future Elderly .. 119

xi
List of Charts Page
Chart 4.21 Value for Money of HDB Flat among Elderly .............................................. 119 and Future Elderly by Year (Sold and Rental Flats)
Chart 4.22 Sense of Pride towards HDB Flat among Elderly ................................... 120 and Future Elderly by Year (Sold and Rental Flats)
Chart 4.23 Awareness of Eldercare Services ......................................................................... 123
Chart 4.24 Intention to Move within Next Five Years among Elderly ................. 127 and Future Elderly by Year
Chart 4.25 Where the Elderly and Future Elderly Intended to Live ..................... 128 in Old Age
Chart 4.26 Housing Type Content With among Elderly ................................................. 129 and Future Elderly by Present Flat Type and Year

Key Indicators

xiv
Key Indicators of HDB Population by Ethnic Group (2008 & 2013)
Total Chinese Malay Indian Others
2008 2013 2008 2013 2008 2013 2008 2013 2008 2013
Demographic Characteristics Resident Population (‘000) (Excluding subtenants) (%)
2,923 100.0
3,058 100.0
2,158 73.8
2,248 73.5
478 16.3
476 15.6
240 8.2
272 8.9
47 1.6
62 2.0
Sex (%) Male Female
49.4 50.6
48.8 51.2
49.7 50.3
49.1 50.9
48.8 51.2
48.0 52.0
49.1 50.9
49.2 50.8
47.8 52.2
42.2 57.8
Average Age (Years) Median Age (Years) Persons Aged Below 15 Years (%) Persons Aged 15–64 Years (%) Persons Aged 65 Years & Above (%)
Based on Per 100 Population Aged 15-64
Old-Age Dependency Ratio Child Dependency Ratio
36.9 37 17.7 72.6 9.8
13.5 24.4
37.9 39 16.7 72.3 11.0
15.2 23.1
38.4 39 15.8 73.2 11.0
15.0 21.6
39.5 40 15.1 72.3 12.6
17.4 20.9
32.4 30 23.7 70.2 6.1
8.7 33.8
33.7 31 19.9 73.1 7.0 9.6 27.2
33.7 34 22.3 71.2
6.5
9.1 31.3
33.2 34 23.2 70.9
5.9
8.3 32.7
34.2 35 21.1 72.2 6.7
9.3 29.2
32.5 34 23.0 72.8 4.2
5.8 31.6
Flat Type (%) 1-Room 2-Room 3-Room 4-Room 5-Room Executive
1.2 2.2 19.6 41.0 26.7 9.3
1.6 2.8 19.3 41.1 26.6 8.6
1.1 1.9 19.7 40.6 27.4 9.4
1.2 1.9 19.3 41.2 27.6 8.8
1.4 3.5
17.8 44.0 24.8
8.6
2.9 6.3
19.8 41.6 22.0
7.4
1.6 3.0
21.0 39.8 24.4 10.3
2.2 3.7
19.1 39.6 25.9
9.5
1.4 1.7
21.7 39.2 27.0
9.0
2.6 2.1
17.4 39.9 28.0 10.0
Economic Characteristics (Persons Aged 15 Years & Above)
Persons Aged 15 Years & Above (‘000)
2,403
2,543
1,815
1,907
364
380
187
209
37
48
Sex (%) Male Female
49.0 51.0
48.4 51.6
49.2 50.8
48.7 51.3
48.1 51.9
47.8 52.2
48.8 51.2
48.7 51.3
46.4 53.6
41.4 58.6
Economically Active (‘000)
Employed Unemployed
1,539
1,480 59
1,649
1,583 66
1,183
1,141 42
1,246
1,202 44
214
204 10
236
222 14
118
112 6
133
126 7
24
23 1
33
32 1
Labour Force Participation Rate (%) (LFPR)
Male LFPR Female LFPR
64.0 75.4 53.1
64.9 74.6 55.8
65.2 75.3 55.4
65.5 73.7 57.8
58.8 75.0 43.8
62.4 76.0 50.0
63.2 77.1 49.9
64.0 80.7 48.0
63.8 78.4 51.2
69.5 79.5 62.5

xv
Key Indicators of HDB Population by Flat Type (2008 & 2013)
Total 1-Room 2-Room 3-Room 4-Room 5-Room Executive
2008 2013 2008 2013 2008 2013 2008 2013 2008 2013 2008 2013 2008 2013
Demographic Characteristics
Resident Population (‘000) (Excluding subtenants) (%)
2,923 100.0
3,058100.0
351.2
481.6
652.2
852.8
572
19.6
592
19.31,199
41.0 1,256
41.1
780
26.7 813
26.62739.3
2648.6
Sex (%) Male Female
49.4 50.6
48.851.2
54.046.0
52.447.6
48.651.4
47.752.3
48.251.8
47.952.1
49.7 50.3
48.9 51.1
50.4 49.6
48.8 51.2
47.952.1
49.8 50.2
Average Age (Years) Median Age (Years) Persons Aged Below 15 years (%) Persons Aged 15–64 Years (%) Persons Aged 65 Years & Above (%)
Based on Per 100 Population Aged 15-64
Old-Age Dependency Ratio Child Dependency Ratio
36.9 37
17.7 72.6
9.8
13.5 24.4
37.9 39
16.772.311.0
15.223.1
55.9 58
4.8
56.638.6
68.28.5
49.9 55
9.6
58.631.8
54.316.4
45.3 48
12.165.023.0
35.418.6
40.5 44
18.562.219.3
31.029.7
42.0 44
12.8 71.6
15.6
21.817.9
42.7 45
12.5 70.3
17.2
24.517.8
36.1 36
17.6 74.4
8.1
10.9 23.7
37.2 37
16.4 74.1
9.5
12.8 22.1
34.3 35
20.9 71.7 7.4
10.3 29.1
35.3 36 19.9 72.3 7.8
10.8 27.5
33.2 34 22.5 72.5 5.0
6.9 31.0
35.236
19.073.6
7.4
10.125.8
Economic Characteristics (Persons Aged 15 Years & Above)
Persons Aged 15 Years & Above (‘000)
2,403 2,543 33 43 57
69
498
518
988
1,050
615
650 211
213
Sex (%) Male Female
49.0 51.0
48.451.6
53.946.1
53.646.4
48.351.7
46.953.1
47.952.1
47.552.5
49.7 50.3
48.6 51.4
49.1 50.9
48.651.4
47.352.7
49.051.0
Economically Active (‘000)
Employed Unemployed
1,539
1,480 59
1,649
1,58366
18
171
23
212
32
293
41
374
315
30015
332
31814
634
610 24
697
669 28
402
391 12
423
41112
137
1334
133
1285
Labour Force Participation Rate (%) (LFPR)
Male LFPR Female LFPR
64.0 75.4 53.1
64.9 74.655.8
55.7 66.942.6
52.8 63.041.1
55.9 69.543.3
59.7 68.346.3
63.2 75.651.8
64.2 74.055.4
64.2
75.8 52.7
66.6
76.5 57.2
65.4 75.6 55.6
65.3 75.355.9
64.9 75.855.1
62.6 70.954.5
xvi
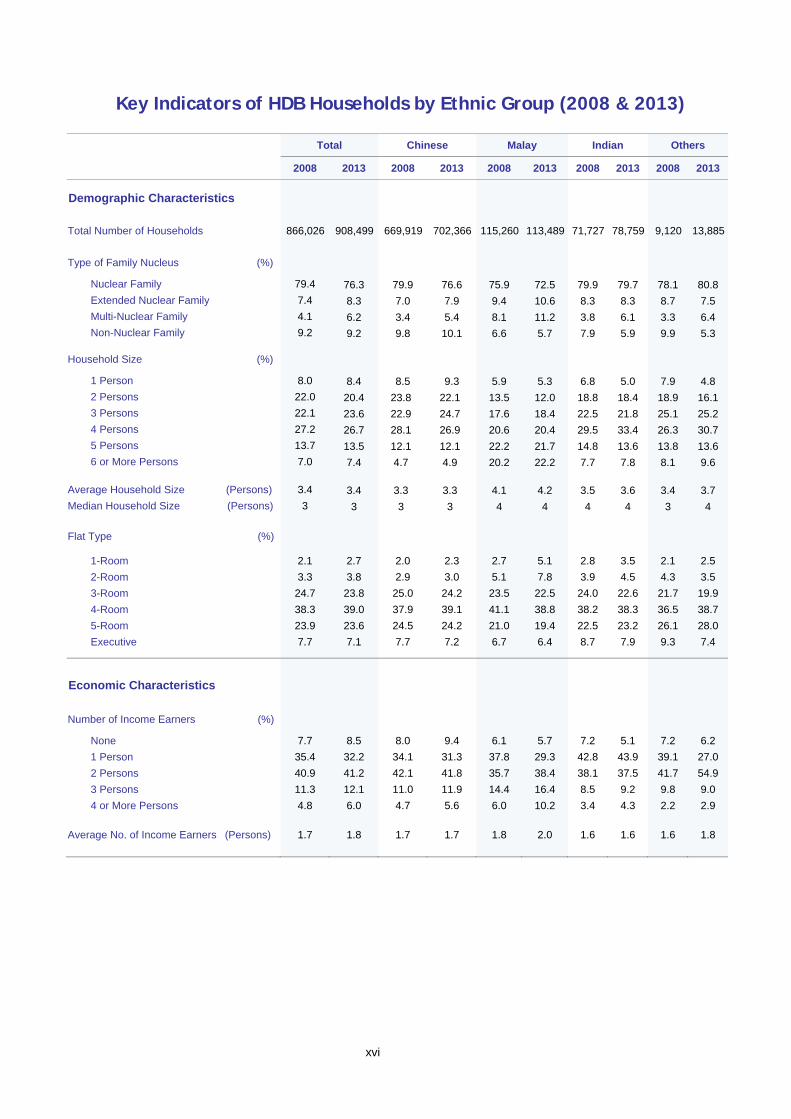
Key Indicators of HDB Households by Ethnic Group (2008 & 2013)
Total Chinese Malay Indian Others
2008 2013 2008 2013 2008 2013 2008 2013 2008 2013
Demographic Characteristics
Total Number of Households 866,026 908,499 669,919 702,366 115,260 113,489 71,727 78,759 9,120 13,885
Type of Family Nucleus (%)
Nuclear Family Extended Nuclear Family Multi-Nuclear Family Non-Nuclear Family
79.4 7.4 4.1 9.2
76.3 8.3 6.2 9.2
79.9 7.0 3.4 9.8
76.6 7.9 5.4
10.1
75.9 9.4 8.1 6.6
72.5 10.6 11.2 5.7
79.9 8.3 3.8 7.9
79.7 8.3 6.1 5.9
78.1 8.7 3.3 9.9
80.8 7.5 6.4 5.3
Household Size (%)
1 Person 2 Persons 3 Persons 4 Persons 5 Persons 6 or More Persons
Average Household Size (Persons) Median Household Size (Persons)
8.0 22.0 22.1 27.2 13.7 7.0
3.4 3
8.4 20.4 23.6 26.7 13.5 7.4
3.4 3
8.5 23.8 22.9 28.1 12.1 4.7
3.3 3
9.3 22.1 24.7 26.9 12.1 4.9
3.3 3
5.9 13.5 17.6 20.6 22.2 20.2
4.1 4
5.3 12.0 18.4 20.4 21.7 22.2
4.2 4
6.8 18.8 22.5 29.5 14.8 7.7
3.5 4
5.0 18.4 21.8 33.4 13.6 7.8
3.6 4
7.9 18.9 25.1 26.3 13.8 8.1
3.4 3
4.8 16.1 25.2 30.7 13.6 9.6
3.7 4
Flat Type (%) 1-Room 2-Room 3-Room 4-Room 5-Room Executive
2.1 3.3
24.7 38.3 23.9 7.7
2.7 3.8
23.8 39.0 23.6 7.1
2.0 2.9
25.0 37.9 24.5 7.7
2.3 3.0
24.2 39.1 24.2 7.2
2.7 5.1
23.5 41.1 21.0 6.7
5.1 7.8
22.5 38.8 19.4 6.4
2.8 3.9
24.0 38.2 22.5 8.7
3.5 4.5
22.6 38.3 23.2 7.9
2.1 4.3
21.7 36.5 26.1 9.3
2.5 3.5
19.9 38.7 28.0 7.4
Economic Characteristics
Number of Income Earners (%) None 1 Person 2 Persons 3 Persons 4 or More Persons
7.7 35.4 40.9 11.3 4.8
8.5 32.2 41.2 12.1 6.0
8.0 34.1 42.1 11.0 4.7
9.4 31.3 41.8 11.9 5.6
6.1 37.8 35.7 14.4 6.0
5.7 29.3 38.4 16.4 10.2
7.2 42.8 38.1 8.5 3.4
5.1 43.9 37.5 9.2 4.3
7.2 39.1 41.7 9.8 2.2
6.2 27.0 54.9 9.0 2.9
Average No. of Income Earners (Persons) 1.7 1.8 1.7 1.7 1.8 2.0 1.6 1.6 1.6 1.8
xvii
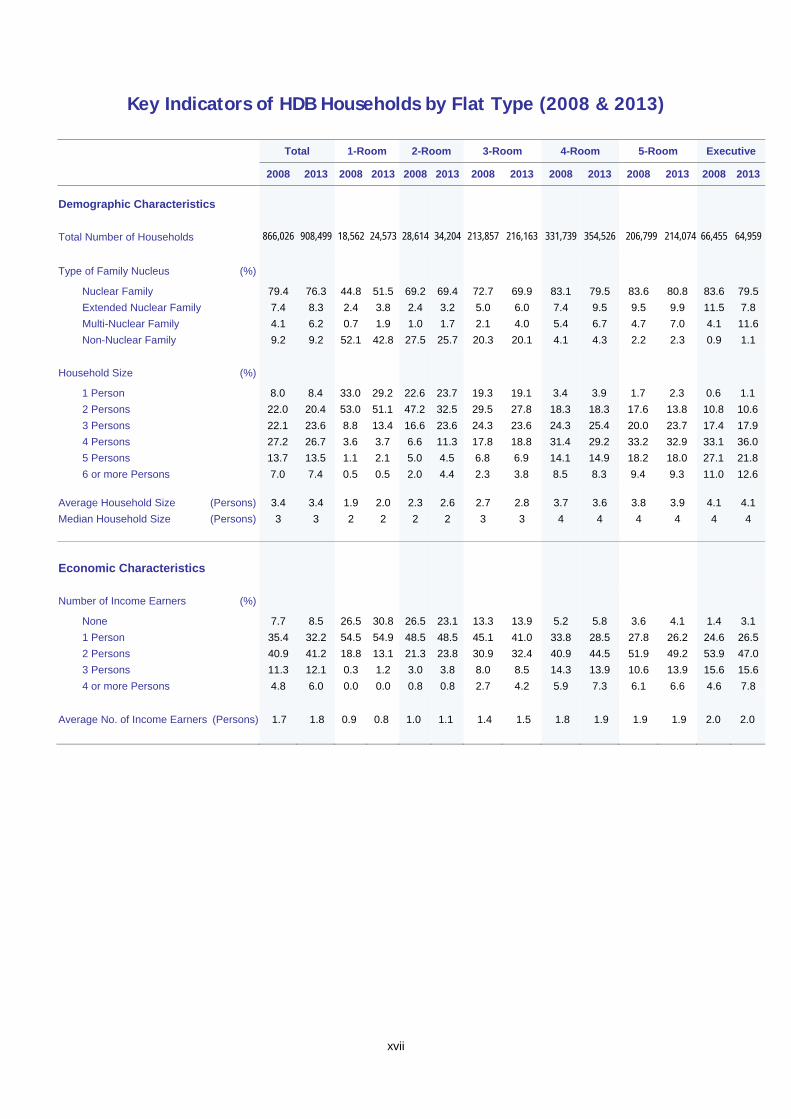
Key Indicators of HDB Households by Flat Type (2008 & 2013)
Total 1-Room 2-Room 3-Room 4-Room 5-Room Executive
2008 2013 2008 2013 2008 2013 2008 2013 2008 2013 2008 2013 2008 2013
Demographic Characteristics
Total Number of Households
866,026
908,499
18,562
24,573
28,614
34,204
213,857
216,163
331,739
354,526
206,799
214,074
66,455
64,959
Type of Family Nucleus (%)
Nuclear Family Extended Nuclear Family Multi-Nuclear Family Non-Nuclear Family
79.4 7.4 4.1 9.2
76.3 8.3 6.2 9.2
44.8 2.4 0.7
52.1
51.5 3.8 1.9
42.8
69.2 2.4 1.0
27.5
69.4 3.2 1.7
25.7
72.7 5.0 2.1
20.3
69.9 6.0 4.0
20.1
83.1 7.4 5.4 4.1
79.5 9.5 6.7 4.3
83.6 9.5 4.7 2.2
80.8 9.9 7.0 2.3
83.6 11.5 4.1 0.9
79.5 7.8
11.6 1.1
Household Size (%)
1 Person 2 Persons 3 Persons 4 Persons 5 Persons 6 or more Persons
8.0 22.0 22.1 27.2 13.7 7.0
8.4 20.4 23.6 26.7 13.5 7.4
33.0 53.0 8.8 3.6 1.1 0.5
29.2 51.1 13.4 3.7 2.1 0.5
22.6 47.2 16.6 6.6 5.0 2.0
23.7 32.5 23.6 11.3 4.5 4.4
19.3 29.5 24.3 17.8 6.8 2.3
19.1 27.8 23.6 18.8 6.9 3.8
3.4 18.3 24.3 31.4 14.1 8.5
3.9 18.3 25.4 29.2 14.9 8.3
1.7 17.6 20.0 33.2 18.2 9.4
2.3 13.8 23.7 32.9 18.0 9.3
0.6 10.8 17.4 33.1 27.1 11.0
1.1 10.6 17.9 36.0 21.8 12.6
Average Household Size (Persons) Median Household Size (Persons)
3.4 3
3.4 3
1.9 2
2.0 2
2.3 2
2.6 2
2.7 3
2.8 3
3.7 4
3.6 4
3.8 4
3.9 4
4.1 4
4.1 4
Economic Characteristics
Number of Income Earners (%)
None 1 Person 2 Persons 3 Persons 4 or more Persons
7.7 35.4 40.9 11.3 4.8
8.5 32.2 41.2 12.1 6.0
26.5 54.5 18.8 0.3 0.0
30.8 54.9 13.1 1.2 0.0
26.5 48.5 21.3 3.0 0.8
23.1 48.5 23.8 3.8 0.8
13.3 45.1 30.9 8.0 2.7
13.9 41.0 32.4 8.5 4.2
5.2 33.8 40.9 14.3 5.9
5.8 28.5 44.5 13.9 7.3
3.6 27.8 51.9 10.6 6.1
4.1 26.2 49.2 13.9 6.6
1.4 24.6 53.9 15.6 4.6
3.1 26.5 47.0 15.6 7.8
Average No. of Income Earners (Persons) 1.7 1.8 0.9 0.8 1.0 1.1 1.4 1.5 1.8 1.9 1.9 1.9 2.0 2.0


Glossary of Terms and Definitions


xxi
Glossary of Terms and Definitions
HDB Resident Population
Resident population refers to Singapore citizens and Singapore permanent
residents (SPRs) residing in HDB flats, excluding subtenants.
Elderly resident population refers to Singapore citizens and SPRs who are
aged 65 years and above.
Future elderly resident population refers to Singapore citizens and SPRs who
are aged between 55 and 64 years.
Age Dependency Ratio
(i) Based on Per 100 Population Aged 15 to 64 Years
The old-age dependency ratio is a measure of the relative size of the
elderly resident population aged 65 years and above to that of the resident
population aged between 15 years and 64 years. It is computed as follows:
Years 64 to 15 Aged Population Resident
Above and Years 65 Aged Population Resident Ratio Dependency Age‐Old
The child dependency ratio is a measure of the relative size of non-working
age resident population aged below 15 years to that of the resident
population aged between 15 years and 64 years. It is computed as follows:
Years 64 to 15 Aged Population Resident
Years 15Below Aged Population Resident Ratio Dependency Child
The total dependency ratio is made out of old-age dependency ratio and
child dependency ratio. It is computed as follows:
Years 64 to 15 Aged Population Resident
Years 15Below Aged Above and Years 65 Aged Population Resident
Ratio DependencyChild RatioDependencyAge‐Old Ratio DependencyTotal

xxii
(ii) Based on Per 100 Population Aged 20 to 64 Years
The old-age dependency ratio is a measure of the relative size of the
elderly resident population aged 65 years and above to that of the resident
population aged between 20 years and 64 years. It is computed as follows:
Years 64 to 20 Aged Population Resident
Above and Years 65 Aged Population Resident Ratio Dependency Age‐Old
The child dependency ratio is a measure of the relative size of non-working
age resident population aged below 20 years to that of the resident
population aged between 20 years and 64 years. It is computed as follows:
Years 64 to 20 Aged Population Resident
Years 20Below Aged Population Resident Ratio Dependency Child
The total dependency ratio is made out of old-age dependency ratio and
child dependency ratio. It is computed as follows:
Years 64 to 20 Aged Population Resident
Years 20Below Aged Above and Years 65 Aged Population Resident
Ratio DependencyChild RatioDependencyAge‐Old Ratio DependencyTotal
Economic Status
Labour force participation refers to persons who are economically active and
aged 15 years and over, either employed or unemployed during the survey
period.
Unemployed persons refer to persons aged 15 years and over who are
currently not working but were actively looking for work at the point of survey.
They include persons who are not working but are taking steps to start their own
business or taking up a new job after the survey period.

xxiii
Households
A household is defined as an entire group of persons, who may or may not be
related, living together in a housing unit. There may also be one-person
households, where a person lives alone in a single housing unit. The household
is equated with the housing unit and there is usually one household per housing
unit. Subtenants or maids dwelling in the same housing unit as the lessee(s) or
registered tenant(s) do not constitute part of the household. This definition is
often known as the household-dwelling unit concept.
An elderly household refers to a household in which the head (i.e. main lessee
or registered tenant) is aged 65 years and above.
A future elderly household refers to a household in which the head (i.e. main
lessee or registered tenant) is aged between 55 and 64 years.
Type of Family Nucleus
Family-based households refer to nuclear family, extended nuclear family and
multi-nuclear family.
Nuclear family refers to either:
(i) a married couple with or without children; or
(ii) a family consisting of immediate related members, without the presence of
a married couple, e.g. one parent only with their unmarried child(ren).
Extended nuclear family comprises a nuclear family with one or more relatives
who, by themselves, do not form a nuclear family.
Multi-nuclear family refers to a family comprising two or more nuclear families.
Non-family based households refer to:
(i) single-person households (a person living alone who could be single,
widowed or divorced); or
(ii) unrelated or distantly related persons staying together.
xxiv
Number of Generations in Family-Based Household
One generation refers to households where family members are from the same
generation, such as a married couple or siblings living together.
Two generations refers to households where family members are from two
different generations, such as parents and children, or grandparents and
grandchildren living together.
Three generations refers to households where family members are from three
different generations, such as grandparents, parents and children all living
together.
Note: Non-family based households are excluded.
Resident or Household Life-Cycle Stage
A family with young children refers to a family in which the eldest child is aged
12 years and below.
A family with teenaged children refers to a family in which the eldest child is
aged between 13 and 20 years.
A family with unmarried grown-up children refers to a family in which the
eldest child is aged 21 years and above.
An elderly couple living alone refers to a married couple with at least one
spouse aged 65 years and above.
A non-family household refers to either:
(i) a single-person household (a person living alone who could be single,
widowed or divorced); or
(ii) unrelated, siblings or distantly related persons living together.

xxv
Categories of Towns
Mature Towns/Estates refer to towns and estates that were developed before
the 1980s. Most flats in these towns were built before the 1980s.
Middle-Aged Towns/Estate refer to towns and the estate that were developed
in the 1980s. Most flats in these towns were built in the 1980s and early 1990s.
Young Towns refer to towns that were developed in the 1990s, where
development is ongoing.
Towns and Estates by Category
Mature Towns/Estates Middle-Aged Towns/Estate Young Towns
1. Queenstown 1. Bukit Batok 1. Punggol 2. Bukit Merah 2. Bukit Panjang 2. Sengkang 3. Toa Payoh 3. Choa Chu Kang 3. Sembawang 4. Ang Mo Kio 4. Jurong East 5. Bedok 5. Jurong West
6. Clementi 6. Bishan
7. Kallang / Whampoa 7. Hougang
8. Geylang 8. Serangoon
9. Tampines
Estates : 10. Pasir Ris
1. Marine Parade 11. Woodlands
2. Central Area* 12. Yishun
Estate :
1. Bukit Timah
* Covering areas such as Tanjong Pagar Plaza, Cantoment Road, Jalan Kukoh, Chin Swee Road, York Hill, Upper Cross Street, Sago Lane, Selegie Road


1
Introduction


3
Chapter 1 Introduction
1.1 Background
HDB has conducted Sample Household Surveys (SHSs) of residents living in
HDB flats since 1968, at interval of five years. SHS 2013 is the 10th survey in
the series. It contains a comprehensive range of topics, and is an in-depth
survey of both physical and social aspects of public housing in Singapore. These
large-scale surveys with their historical continuity have facilitated trend analysis
over time, even as the research coverage of the SHS changes over time to
reflect the emphasis of public housing.
From assessing the impact of relocation of residents to public housing,
adaptation to high-rise, high-density living, community formation, to the present
emphasis on social diversity and community cohesion, the research focus of the
SHS reflects the evolving role of HDB and its mission.
The HDB Research Advisory Panel, chaired by Professor Aline Wong,
comprising academics in sociology, geography and architectural, was formed in
2008 and their main role was to provide advice on salient research projects and
socio-economic studies relevant to HDB. The panel was actively involved in SHS
2013, lending their expertise to HDB in the research scope, as well as the
analysis of survey findings to further enhance the utility.
The survey findings serve as important inputs for HDB’s policy reviews and help
identify aspects of the HDB environment to improve. Starting from
conceptualisation of the research scope to the analysis of survey findings, HDB
Groups were also consulted so that the survey could cater more specifically to
their operational needs.

4
1.2 Objectives
The two key objectives of the SHS are to:
a) Obtain demographic and socio-economic profile of residents and identify
changing needs and expectations. These information are useful in the
assessment of HDB’s operations and policies; and
b) Monitor residents’ level of satisfaction with various aspects of public
housing and identify areas for improvement to the physical and social
environment in HDB towns.
1.3 Sampling Design
A total of 7,755 households were successfully interviewed, yielding an overall
sampling error of ±1.1% at 95% confidence level. A set of weights was used to
generalise the survey data to the population level, so that the findings reported
are representative of all HDB households.
A dual-modal data collection method was used, encompassing Internet survey
(e-survey), as well as the conventional face-to-face interviews at residents’
homes. Fieldwork was carried out between the months of January and August
2013.
A crucial requirement for collecting reliable primary data was to maintain high
quality fieldwork control. This was achieved by adhering to the procedures of the
Survey Fieldwork Management Quality System that has been developed in
accordance with the requirements of SS ISO 9001: 2008.

5
1.4 Outline of Monograph
This monograph explores the extent of community bonding and family ties of
HDB residents to give an indication on how active and cohesive the HDB
community is. It also examines the well-being of elderly residents, especially in
the face of ageing population in Singapore.
In the other monograph, Public Housing in Singapore: Residents’ Profile,
Housing Satisfaction and Preferences, the findings were presented in two parts.
The first part analyses the profile of HDB population and households, specifically,
the demographic and socio-economic profile of HDB residents. The second part
focuses on residents’ physical living environment, in terms of their housing
satisfaction and preferences. It is important for HDB to keep tab of how our
residents adapt to and assess the quality of their physical living environment,
which HDB has played a key role in creating and maintaining it.

Social Well- Being of HDB Communities


9
Social Well-Being of HDB Communities
With majority of the Singapore resident population living in HDB estates and
towns, the HDB living experience continues to play an important role in the lives
of Singaporeans. Public housing policies and schemes are formulated not only
to meet changing needs and aspirations, but also to support national objectives
such as maintaining social harmony and building stronger family ties, and focus
on the needs of the elderly. In the recent years, HDB has proactively organised
various activities to foster community bonding among its residents at precinct
level, such as welcome parties for new residents in newly completed blocks.
Families are the key societal units and strong inter-generational relationships are
important in achieving healthy families and a cohesive society. The strength of
family ties is a key ingredient for a strong inter-generational support especially in
terms of care provisions to ageing parents and other family members. Inter-
generational relationships of residents could be examined by the extent of their
interaction with and support for family members. With the trend of children
setting up their own home after marriage, the geographical proximity between
parents and married children also plays a key role in determining the levels of
mutual care and support they can provide for each other.
With the growing number of elderly residents in HDB communities, it is also
crucial to ensure that the well-being of elderly residents, in terms of their current
financial situation, community involvement and satisfaction with physical living
environment, are being looked after, so as to provide a quality living environment
for them to age comfortably.


2
Community Bonding


13
Chapter 2 Community Bonding
Introduction
A community is usually defined as people living in the same geographical area,
sharing common interests or experiences, and in the process, developing a sense
of shared identity and belonging. In this regard, residents living in HDB towns and
estates, or distinct parts of them, can be viewed as local communities living in
planned residential areas with shared amenities. Community bonding is seen as
a multi-dimensional concept linking people to other people and to the place where
they live.
One of the key priorities of HDB is the building of cohesive communities within its
towns. Living environments are provided with community spaces for residents to
mingle and interact. Activities, be it government-led or resident-led, are organised
to facilitate residents moving beyond their flats to enjoy the company of
neighbours and friends in the community.
Objectives
The objectives of this chapter are:
a) To examine residents’ level of engagement with the community, e.g.
community participation, types and frequency of neighbourly interaction;
b) To assess residents’ tolerance level towards nuisances caused by
neighbours, e.g. noise, littering; and
c) To assess sense of attachment to the town/estate, as well as to Singapore.

14
Framework
This chapter provides insight into trends in community development by
monitoring changes in the indicators of community bonding. These include
neighbourly relations, sense of attachment and national pride, as well as
community engagement.
Framework for Community Bonding
2.1 Neighbourly Relations
Nearly all HDB residents agreed unanimously (97.8%) that maintaining a good
neighbourly relation is important. This is especially so when one needed help in
times of emergency. Neighbours living in close proximity would be able to attend
to crises more promptly compared with family members or friends who live
elsewhere in Singapore. In addition, good neighbourly relations bring about a
harmonious living environment.
Almost all residents engaged in exchanging greetings and casual conversation, less engaged in more intense interactions
Twelve types of neighbourly contacts were used to assess the intensity of
interactions among HDB residents. These ranged from less intense interactions,
such as exchanging greetings to more intense interactions, such as providing or
receiving financial help. Residents who engaged in more intense forms of
interaction, such as keeping house keys for neighbours and providing financial
Community Bonding
Neighbourly Relations
Neighbourly Interactions Inter-Ethnic /Inter-
Nationality Interactions Tolerance towards
Nuisances
Sense of Belonging to Town/Estate Sense of Community Sense of Belonging
and Pride to Singapore
Participation in Community Activities Reason for Non-
Participation
Sense of Attachment & National Pride
Community Engagement
15
help to one another, were assumed to have forged deeper and closer
relationships.
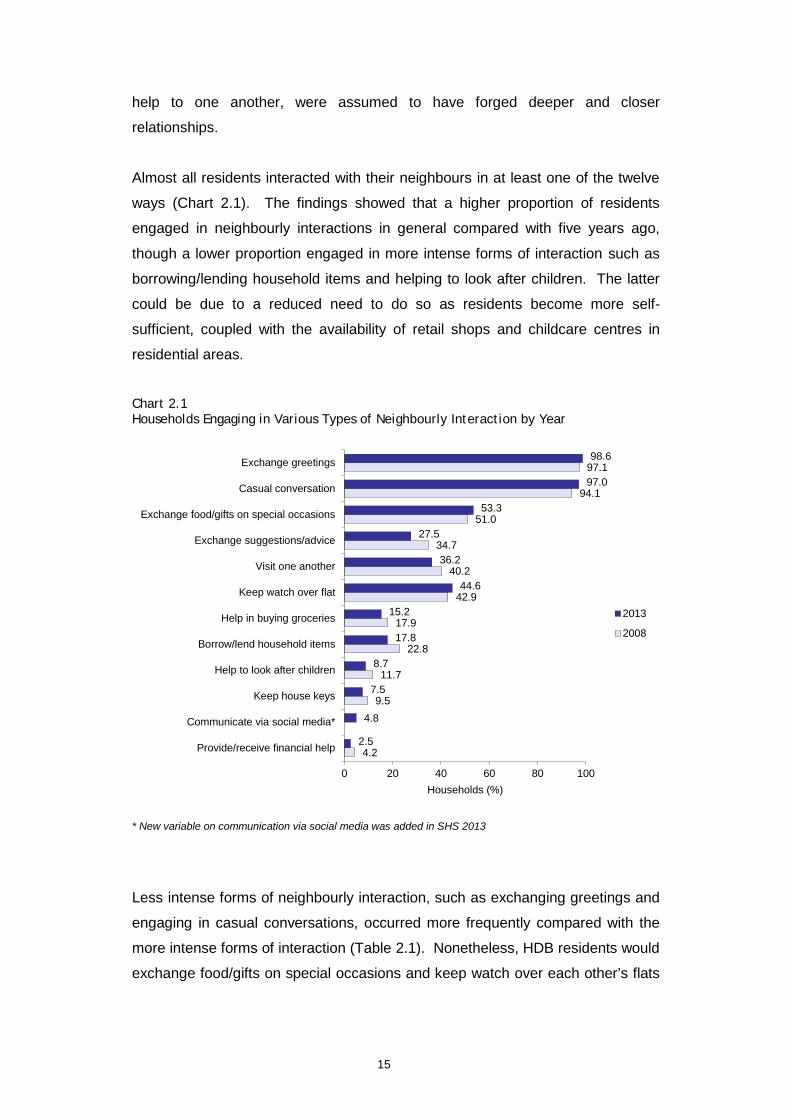
Almost all residents interacted with their neighbours in at least one of the twelve
ways (Chart 2.1). The findings showed that a higher proportion of residents
engaged in neighbourly interactions in general compared with five years ago,
though a lower proportion engaged in more intense forms of interaction such as
borrowing/lending household items and helping to look after children. The latter
could be due to a reduced need to do so as residents become more self-
sufficient, coupled with the availability of retail shops and childcare centres in
residential areas. Chart 2.1 Households Engaging in Various Types of Neighbourly Interaction by Year
* New variable on communication via social media was added in SHS 2013
Less intense forms of neighbourly interaction, such as exchanging greetings and
engaging in casual conversations, occurred more frequently compared with the
more intense forms of interaction (Table 2.1). Nonetheless, HDB residents would
exchange food/gifts on special occasions and keep watch over each other’s flats
4.2
9.5
11.7
22.8
17.9
42.9
40.2
34.7
51.0
94.1
97.1
2.5
4.8
7.5
8.7
17.8
15.2
44.6
36.2
27.5
53.3
97.0
98.6
0 20 40 60 80 100
Provide/receive financial help
Communicate via social media*
Keep house keys
Help to look after children
Borrow/lend household items
Help in buying groceries
Keep watch over flat
Visit one another
Exchange suggestions/advice
Exchange food/gifts on special occasions
Casual conversation
Exchange greetings
Households (%)
2013
2008

16
when a family was not at home. Such gestures imply that neighbourly ties are
still alive and strong.
Table 2.1 Frequency of Neighbourly Interaction
Types of Neighbourly Interaction Daily
At Least Once a Week
At Least Once a Month
Occasionally None at All
Total
% N*
Exchange Greetings 57.0 23.0 1.5 17.2 1.3 100.0 908,340
Casual Conversation 40.6 29.6 3.5 23.3 3.0 100.0 908,340
Exchange Food/Gifts on Special Occasions 0.8 2.1 2.9 47.5 46.7 100.0 908,096
Exchange Suggestions/Advice 0.6 1.3 1.2 24.4 72.5 100.0 908,412
Visit One Another 1.0 1.7 2.2 31.3 63.8 100.0 908,330
Keep Watch Over Flat 6.0 1.5 1.2 35.9 55.4 100.0 908,295
Help in Buying Groceries 0.5 0.9 0.7 13.1 84.8 100.0 908,008
Borrow/Lend Household Items 0.1 0.5 0.7 16.5 82.2 100.0 907,898
Help to Look After Children 0.5 0.4 0.3 7.4 91.4 100.0 908,143
Keep House Keys 0.8 0.2 0.2 6.2 92.6 100.0 907,705
Communicate via Social Media 0.5 0.6 0.4 3.4 95.1 100.0 907,342
Provide/Receive Financial Help 0.2 0.1 0.1 2.1 97.5 100.0 907,599
* Excluding non-response cases
Types of neighbourly interaction differed across ethnic groups
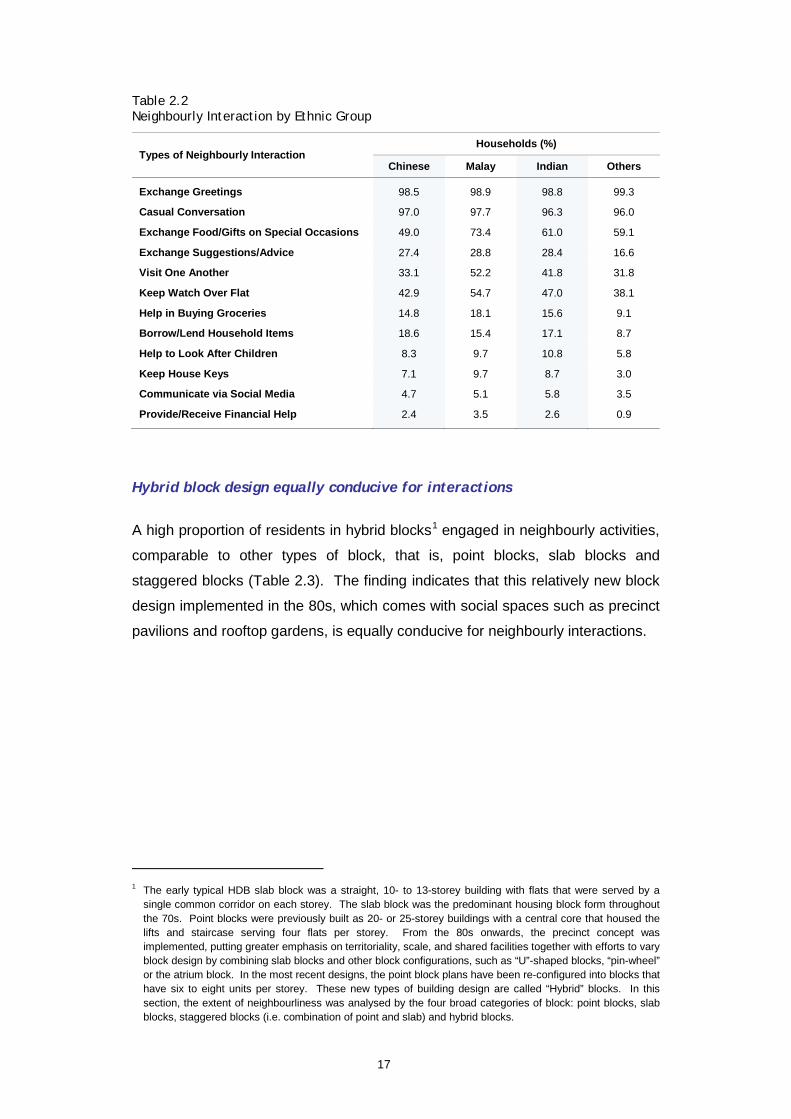
While all ethnic groups mostly engaged in exchanging greetings and having
casual conversations, significantly higher proportions of Malays and Indians
engaged in more intense forms of interaction. Due to lifestyle and cultural
influences, proportionately more Malays and Indians tended to engage in social
activities with their neighbours, such as exchanging food or gifts on special
occasions and visiting one another (Table 2.2).
The Chinese and Others appeared less involved in intense forms of interaction
compared with Malays and Indians.
17
Table 2.2 Neighbourly Interaction by Ethnic Group
Types of Neighbourly Interaction Households (%)
Chinese Malay Indian Others
Exchange Greetings 98.5 98.9 98.8 99.3
Casual Conversation 97.0 97.7 96.3 96.0
Exchange Food/Gifts on Special Occasions 49.0 73.4 61.0 59.1
Exchange Suggestions/Advice 27.4 28.8 28.4 16.6
Visit One Another 33.1 52.2 41.8 31.8
Keep Watch Over Flat 42.9 54.7 47.0 38.1
Help in Buying Groceries 14.8 18.1 15.6 9.1
Borrow/Lend Household Items 18.6 15.4 17.1 8.7
Help to Look After Children 8.3 9.7 10.8 5.8
Keep House Keys 7.1 9.7 8.7 3.0
Communicate via Social Media 4.7 5.1 5.8 3.5
Provide/Receive Financial Help 2.4 3.5 2.6 0.9
Hybrid block design equally conducive for interactions
A high proportion of residents in hybrid blocks1 engaged in neighbourly activities,
comparable to other types of block, that is, point blocks, slab blocks and
staggered blocks (Table 2.3). The finding indicates that this relatively new block
design implemented in the 80s, which comes with social spaces such as precinct
pavilions and rooftop gardens, is equally conducive for neighbourly interactions.
1 The early typical HDB slab block was a straight, 10- to 13-storey building with flats that were served by a
single common corridor on each storey. The slab block was the predominant housing block form throughout the 70s. Point blocks were previously built as 20- or 25-storey buildings with a central core that housed the lifts and staircase serving four flats per storey. From the 80s onwards, the precinct concept was implemented, putting greater emphasis on territoriality, scale, and shared facilities together with efforts to vary block design by combining slab blocks and other block configurations, such as “U”-shaped blocks, “pin-wheel” or the atrium block. In the most recent designs, the point block plans have been re-configured into blocks that have six to eight units per storey. These new types of building design are called “Hybrid” blocks. In this section, the extent of neighbourliness was analysed by the four broad categories of block: point blocks, slab blocks, staggered blocks (i.e. combination of point and slab) and hybrid blocks.

18
Table 2.3 Neighbourly Interaction by Type of Block
Types of Neighbourly Interaction Households (%)
Hybrid Block
Point Block Slab Block Staggered
Block
Exchange Greetings 98.7 99.7 98.6 98.6
Casual Conversation 96.7 97.9 97.1 96.6
Exchange Food/Gifts on Special Occasions 56.1 56.6 50.6 57.4
Exchange Suggestions/Advice 30.0 25.3 26.8 27.9
Visit One Another 41.1 40.3 33.1 38.8
Keep Watch Over Flat 47.0 51.2 41.4 51.3
Help in Buying Groceries 14.4 14.7 14.9 15.3
Borrow/Lend Household Items 19.4 20.9 16.6 16.9
Help to Look After Children 10.3 10.6 7.5 9.0
Keep House Keys 7.3 9.0 7.2 7.5
Communicate via Social Media 6.7 6.4 3.8 2.3
Provide/Receive Financial Help 2.4 1.7 2.3 3.4
More residents engaged in inter-ethnic/nationality interactions
HDB put in place the Ethnic Integration Policy (EIP) in 1989 to prevent the
formation of ethnic enclaves and to ensure a balanced mix of the different ethnic
groups in HDB estates. The SPR quota was introduced in 2010 to ensure better
integration of SPR families into the local community for social cohesion and to
prevent enclaves from forming in the public housing estates2. Tolerance and
acceptance of one another’s racial and cultural background are pivotal in a more
diverse society, especially in a high-rise, high-density living environment where
residents share common facilities. Social engagements among the various
ethnic and nationality groups could bring about a better understanding, help
bridge differences and strengthen social cohesion and harmony.
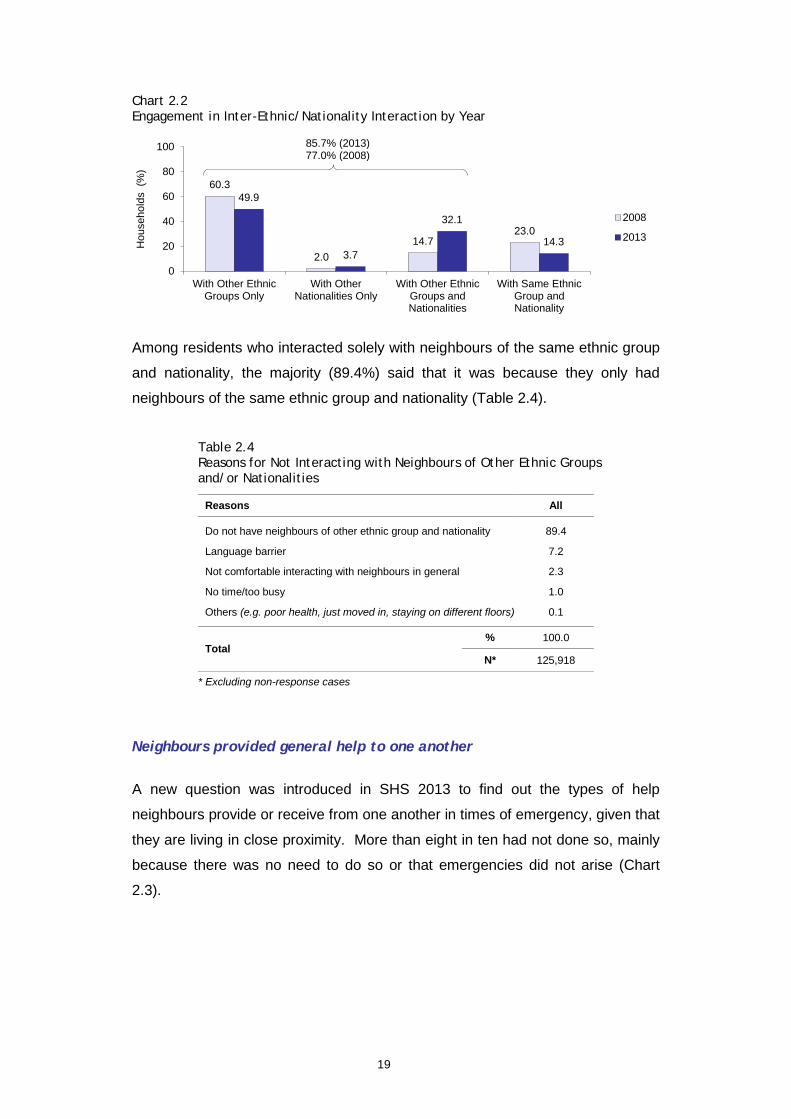
Chart 2.2 showed that over the past five years, the proportion of residents who
had interacted with neighbours of other ethnic groups and/or nationalities had
increased (85.7% in 2013, 77.0% in 2008).
2 This quota only applies to non-Malaysian SPRs. Malaysian SPRs will not be subjected to the SPR quota, in
view of their close cultural and historical similarities with Singaporeans. When the ethnic group proportion or SPR quota or both have reached the block/neighbourhood limit, a buyer will not be allowed to buy a flat in that block/neighbourhood as it will lead to an increase in that ethnic proportion or SPR quota or both.
19
Chart 2.2 Engagement in Inter-Ethnic/Nationality Interaction by Year
Among residents who interacted solely with neighbours of the same ethnic group
and nationality, the majority (89.4%) said that it was because they only had
neighbours of the same ethnic group and nationality (Table 2.4).
Table 2.4 Reasons for Not Interacting with Neighbours of Other Ethnic Groups and/or Nationalities
Reasons All
Do not have neighbours of other ethnic group and nationality 89.4
Language barrier 7.2
Not comfortable interacting with neighbours in general 2.3
No time/too busy 1.0
Others (e.g. poor health, just moved in, staying on different floors) 0.1
Total % 100.0
N* 125,918
* Excluding non-response cases
Neighbours provided general help to one another
A new question was introduced in SHS 2013 to find out the types of help
neighbours provide or receive from one another in times of emergency, given that
they are living in close proximity. More than eight in ten had not done so, mainly
because there was no need to do so or that emergencies did not arise (Chart
2.3).
60.3
2.0 14.7
23.0
49.9
3.7
32.1
14.3
0
20
40
60
80
100
With Other EthnicGroups Only
With OtherNationalities Only
With Other EthnicGroups andNationalities
With Same EthnicGroup andNationality
Hou
seho
lds
(%)
2008
2013
85.7% (2013) 77.0% (2008)

20
Chart 2.3 Whether Received/Provided Help in Times of Emergencies
Among the 17.0% who had received or rendered help, more than four in ten
(43.0%) provided general help, such as lending household items (Table 2.5).
Another 15.0% helped to take care of elderly neighbours or neighbour’s
child/parent, while 13.0% overcame occasional inconveniences with their
neighbours, such as lift breakdowns or blackouts. Residents would also render
help during emergencies like sending their neighbour to the hospital/putting out a
fire (11.6%), or helping to inform the authorities (8.3%).
Table 2.5 Types of Help Received/Provided
Types of Help All
Provide general help (e.g. lend household items) 43.0
Help to take care of elderly neighbours/neighbour’s child/parent 15.0
Overcome occasional inconveniences (e.g. blackouts, lift breakdowns) 13.0
Help to send neighbour to hospital/put out fire 11.6
Help to inform authorities in times of emergency 8.3
Help to inform family members of neighbours in times of emergency 3.3
Provide financial help 2.1
Help with funeral preparations 1.7
Others (e.g. help to move into block, provide advice to neighbours on handling sick children) 2.0
Total % 100.0
N* 150,044
* Excluding non-response cases
Neither received nor provided help
82.9%
Provided help 7.6%
Received help 4.8%
Received & provided help
4.6%

21
Residents more likely to provide or receive help with increased length of residence
Findings showed that the likelihood of providing help to or receiving help from
neighbours increased with age of residents, which could also be largely attributed
to their longer length of residence compared with their younger counterparts.
With a longer length of residence, familiarity and comfort among neighbours
could increase, thus increasing the opportunities and likelihood to help one
another (Table 2.6). On the other hand, incidences of elderly residents providing
help to others were lower, possibly due to their physical limitations.
Table 2.6 Received Help from/Provided Help to Neighbours by Attributes
Attributes Whether Received/
Provided Help Total
Yes No % N*
Age Group (Years) Below 35 14.8 85.2 100.0 83,336
35 - 44 16.7 83.3 100.0 204,499
45 - 54 18.1 81.9 100.0 257,573
55 - 64 18.6 81.4 100.0 206,410
65 & Above 15.2 84.9 100.0 141,540
Length of Residence (Years) Below 6 12.4 87.7 100.0 252,432
6 - 10 18.9 81.1 100.0 139,251
11 - 15 18.2 81.8 100.0 219,404
16 - 20 19.0 81.0 100.0 96,684
21 - 30 20.0 80.0 100.0 130,466
31 & Above 20.0 80.0 100.0 55,554
* Excluding non-response cases
More faced intolerable nuisances from neighbours
In a high-rise, high-density environment, it can be a challenge to accommodate
more people and at the same time achieve a cohesive living environment. Many
a time, due to diversities in cultural backgrounds and lifestyle patterns, different
behaviours and attitudes would arise, which may be viewed as nuisances for
some. Such incidences could also lead to conflicts and disputes between
neighbours, which may affect the relationships between them, hence bringing
adverse effects on community bonding.

22
About half of the households (48.1%) claimed that they had faced some forms of
nuisance from neighbours, be it minimal, tolerable or intolerable. This proportion
was comparable to 50.4% in 2008 (Chart 2.4). For nuisances that were minimal
or tolerable, it means that the residents did not find such behaviours affecting
their daily lives, neither were they bothered by these nuisances. However, if the
nuisances were deemed intolerable, it means that such behaviours could
possibly have an impact on their daily lives or they were bothered by the
nuisances. Overall, about seven in ten of the households either did not face any
nuisance in their living environment or found the nuisances to be
minimal/tolerable. It was observed that there was an increase in the proportion of
residents facing intolerable nuisances caused by neighbours, from 26.6% in 2008
to 32.1% in 2013.
Chart 2.4 Nuisances Faced From Neighbours by Year
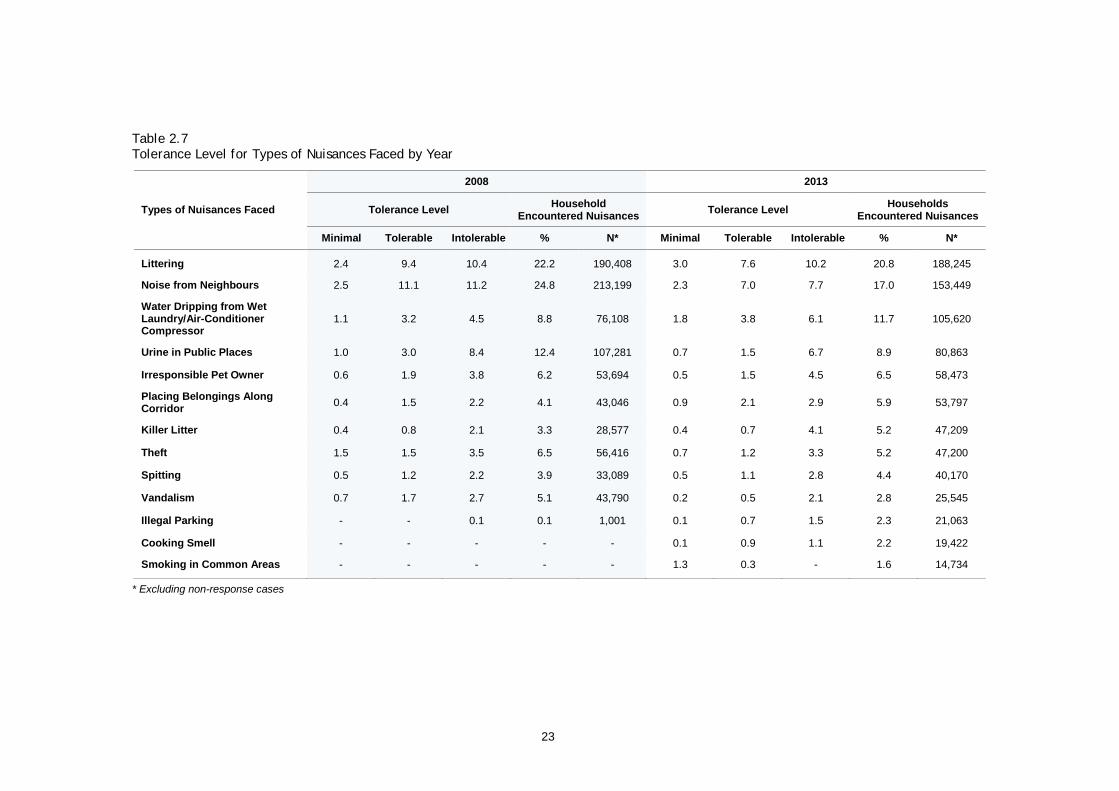
The main types of nuisances were littering, noise from neighbours and water
dripping from wet laundry/air-conditioner compressor (Table 2.7). A higher
proportion of residents faced intolerable nuisances such as littering, noise from
neighbours and urine in public places. Compared with 2008, intolerable
nuisances such as noise from neighbours and urine in public places had
decreased, from 11.2% in 2008 to 7.7% in 2013 for the former and from 8.4% in
2008 to 6.7% in 2013 for the latter.
49.6 51.9
23.8 16.0
26.6 32.1
0
20
40
60
80
100
2008 2013
Hou
seho
lds
(%)
Intolerable nuisances
Minimal/Tolerable nuisances
Did not face nuisances
50.4% 48.1%
23
Table 2.7 Tolerance Level for Types of Nuisances Faced by Year
Types of Nuisances Faced
2008 2013
Tolerance Level Household Encountered Nuisances Tolerance Level Households
Encountered Nuisances
Minimal Tolerable Intolerable % N* Minimal Tolerable Intolerable % N*
Littering 2.4 9.4 10.4 22.2 190,408 3.0 7.6 10.2 20.8 188,245
Noise from Neighbours 2.5 11.1 11.2 24.8 213,199 2.3 7.0 7.7 17.0 153,449
Water Dripping from Wet Laundry/Air-Conditioner Compressor
1.1 3.2 4.5 8.8 76,108 1.8 3.8 6.1 11.7 105,620
Urine in Public Places 1.0 3.0 8.4 12.4 107,281 0.7 1.5 6.7 8.9 80,863
Irresponsible Pet Owner 0.6 1.9 3.8 6.2 53,694 0.5 1.5 4.5 6.5 58,473
Placing Belongings Along Corridor 0.4 1.5 2.2 4.1 43,046 0.9 2.1 2.9 5.9 53,797
Killer Litter 0.4 0.8 2.1 3.3 28,577 0.4 0.7 4.1 5.2 47,209
Theft 1.5 1.5 3.5 6.5 56,416 0.7 1.2 3.3 5.2 47,200
Spitting 0.5 1.2 2.2 3.9 33,089 0.5 1.1 2.8 4.4 40,170
Vandalism 0.7 1.7 2.7 5.1 43,790 0.2 0.5 2.1 2.8 25,545
Illegal Parking - - 0.1 0.1 1,001 0.1 0.7 1.5 2.3 21,063
Cooking Smell - - - - - 0.1 0.9 1.1 2.2 19,422
Smoking in Common Areas - - - - - 1.3 0.3 - 1.6 14,734
* Excluding non-response cases

24
Few took action to address nuisances
Of the 48.1% of residents who faced nuisances in their neighbourhood, the
majority (29.6%) did not take any action to address these nuisances (Chart 2.5).
It would seem that they were tolerant or that they would rather live with the
nuisances than to resolve them. Only about one in ten (9.1%) resolved
nuisances personally, lower than the proportion of 12.0% in 2008. Another 9.4%
of them took action by reporting the nuisances faced to the authorities.
Chart 2.5 Ways of Resolving Nuisances
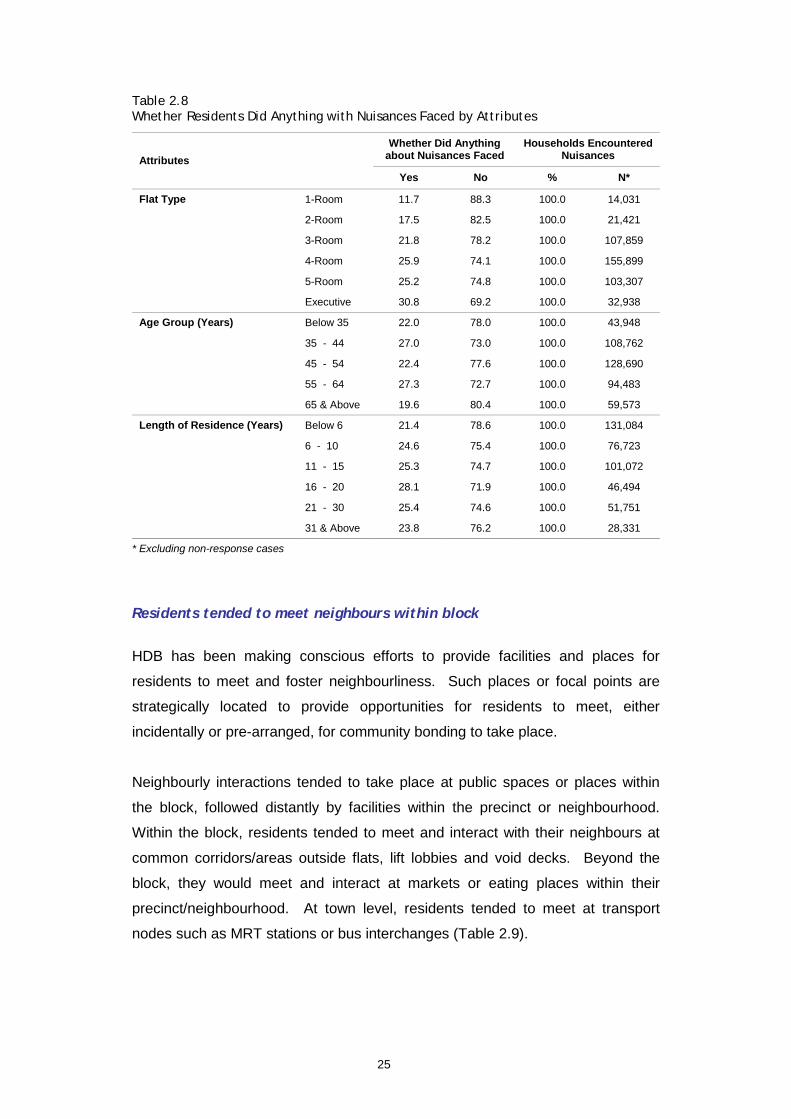
Elderly residents and those living in smaller flat types preferred not to deal with
their neighbours for a resolution when faced with nuisances (Table 2.8). This
could be due to factors such as language barrier or that they did not know how to
handle and mediate the situation.
The finding showed that length of residence did not affect whether or not
residents took initiatives to resolve nuisances faced.
12.0 7.4
30.9
49.7
9.1 9.4
29.6
51.9
0
20
40
60
Resolvednuisancespersonally
Referred toauthorities
Did not doanything
Did not faceany nuisances
Hou
seho
lds
(%)
2008
2013
25
Table 2.8 Whether Residents Did Anything with Nuisances Faced by Attributes
Attributes Whether Did Anything
about Nuisances Faced Households Encountered
Nuisances
Yes No % N*
Flat Type 1-Room 11.7 88.3 100.0 14,031
2-Room 17.5 82.5 100.0 21,421
3-Room 21.8 78.2 100.0 107,859
4-Room 25.9 74.1 100.0 155,899
5-Room 25.2 74.8 100.0 103,307
Executive 30.8 69.2 100.0 32,938
Age Group (Years) Below 35 22.0 78.0 100.0 43,948
35 - 44 27.0 73.0 100.0 108,762
45 - 54 22.4 77.6 100.0 128,690
55 - 64 27.3 72.7 100.0 94,483
65 & Above 19.6 80.4 100.0 59,573
Length of Residence (Years) Below 6 21.4 78.6 100.0 131,084
6 - 10 24.6 75.4 100.0 76,723
11 - 15 25.3 74.7 100.0 101,072
16 - 20 28.1 71.9 100.0 46,494
21 - 30 25.4 74.6 100.0 51,751
31 & Above 23.8 76.2 100.0 28,331
* Excluding non-response cases
Residents tended to meet neighbours within block
HDB has been making conscious efforts to provide facilities and places for
residents to meet and foster neighbourliness. Such places or focal points are
strategically located to provide opportunities for residents to meet, either
incidentally or pre-arranged, for community bonding to take place.
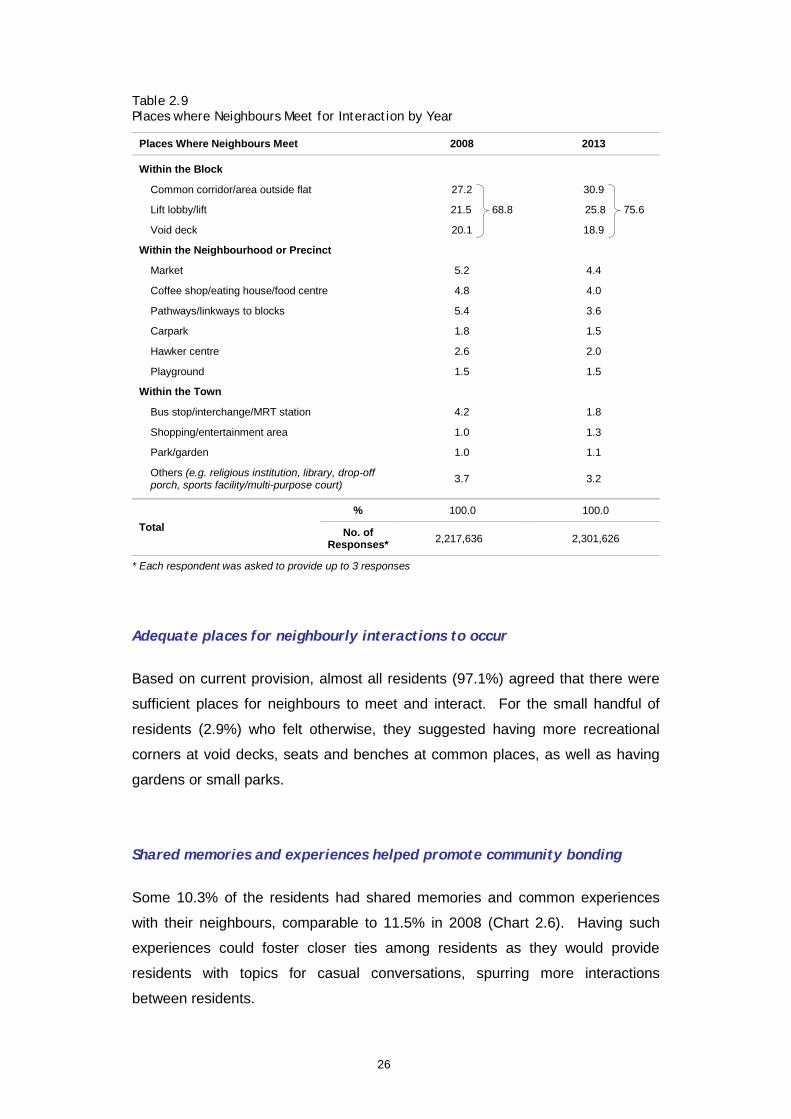
Neighbourly interactions tended to take place at public spaces or places within
the block, followed distantly by facilities within the precinct or neighbourhood.
Within the block, residents tended to meet and interact with their neighbours at
common corridors/areas outside flats, lift lobbies and void decks. Beyond the
block, they would meet and interact at markets or eating places within their
precinct/neighbourhood. At town level, residents tended to meet at transport
nodes such as MRT stations or bus interchanges (Table 2.9).
26
Table 2.9 Places where Neighbours Meet for Interaction by Year
Places Where Neighbours Meet 2008 2013
Within the Block
Common corridor/area outside flat 27.2 30.9
Lift lobby/lift 21.5 68.8 25.8 75.6
Void deck 20.1 18.9
Within the Neighbourhood or Precinct
Market 5.2 4.4
Coffee shop/eating house/food centre 4.8 4.0
Pathways/linkways to blocks 5.4 3.6
Carpark 1.8 1.5
Hawker centre 2.6 2.0
Playground 1.5 1.5
Within the Town
Bus stop/interchange/MRT station 4.2 1.8
Shopping/entertainment area 1.0 1.3
Park/garden 1.0 1.1
Others (e.g. religious institution, library, drop-off porch, sports facility/multi-purpose court) 3.7 3.2
Total % 100.0 100.0
No. of Responses* 2,217,636 2,301,626
* Each respondent was asked to provide up to 3 responses
Adequate places for neighbourly interactions to occur Based on current provision, almost all residents (97.1%) agreed that there were
sufficient places for neighbours to meet and interact. For the small handful of
residents (2.9%) who felt otherwise, they suggested having more recreational
corners at void decks, seats and benches at common places, as well as having
gardens or small parks.
Shared memories and experiences helped promote community bonding
Some 10.3% of the residents had shared memories and common experiences
with their neighbours, comparable to 11.5% in 2008 (Chart 2.6). Having such
experiences could foster closer ties among residents as they would provide
residents with topics for casual conversations, spurring more interactions
between residents.

27
Chart 2.6 Whether Had Shared Memories/Experiences with Neighbours by Year
Some of such common memories/experiences shared were celebrations or get-
together during festivities, experiences with raising children, issues related to re-
settlement/Selective En Bloc Redevelopment Scheme (SERS), as well as the joy
of doing things together (Table 2.10).
Table 2.10 Types of Shared Experience/Memory
Types of Shared Experience/Memory All
Festival celebrations 16.4
Bringing up children 13.3
Issues on re-settlement/SERS 8.6
Performed chores together 8.1
Renovation experiences 7.7
Rendered help 7.3
Share information on holidays/tours 6.2
Reminiscing yester-year 5.8
Common interests/hobbies 5.7
Go for dining/shopping together 4.7
Share general views 3.2
Share work experiences 2.9
Overcame/shared occasional problems faced with the living environment 2.7
Help take care of neighbour’s child/pet/parent 1.8
Others (e.g. attend funeral of neighbours’ family members, visit one another, experienced similar bad experiences) 5.6
Total % 100.0
N* 89,382
* Excluding non-response cases
11.5
88.5
10.3
89.7
0
20
40
60
80
100
Shared memories/experiences
Did not have sharedmemories/ experiences
Hou
seho
ld (%
)
2008
2013

28
Face-to-face meetings remained as popular mode of interaction
Interactions via face-to-face meetings continued to be the most popular way by
which residents kept in touch with members in their social network (e.g.
neighbours, friends, and family members), followed by telephone calls (Chart 2.7).
Sending text messages and e-mail/internet chat/video conferencing had also
risen over the past five years.
In tandem with improving technology, interactions via social networking sites
such as Facebook, Twitter, or Linkedln, was mentioned as a mode of interaction.
With increased usage of such networking sites, the proportion who engaged in
such interactions with their social network is expected to increase over time.
Chart 2.7 Common Modes of Interaction with Social Networks by Year
While it was found that the majority engaged in face-to-face meetings with those
in their social circle, the proportion of residents who engaged in such mode of
interaction was found to increase with age (Table 2.11).
1.6
19.2
32.3
66.3
88.9
1.3
12.8
25.0
36.5
74.4
91.1
0 20 40 60 80 100
Snail mail
Social networking sites(e.g. Facebook, Twitter, LinkedIn)
E-mail/internet chat/video conferencing
Text messaging (e.g. SMS, Whatsapp)
Telephone calls
Face-to-face meeting
Households (%)
20132008

29
Table 2.11 Face-to-Face Interaction with Social Network by Age Group
Age Group (Years) Whether Engaged in
Face-to-Face Interactions Total
Yes No % N*
Below 35 88.6 11.4 100.0 85,068
35 - 44 90.6 9.4 100.0 207,522
45 - 54 90.4 9.6 100.0 262,984
55 - 64 92.5 7.5 100.0 209,714
65 & Above 92.8 7.2 100.0 143,211
* Excluding non-response cases
Conversely, residents who engaged in virtual modes of interaction, e.g. text
messaging, internet chat and social media, tended to be younger (Table 2.12).
Table 2.12 Virtual Mode of Interaction with Social Network by Age Group
Age Group (Years) Whether Engaged in
Virtual Mode of Interactions Total
Yes No % N*
Below 35 66.4 33.6 100.0 81,670
35 - 44 57.5 42.5 100.0 202,741
45 - 54 41.3 58.7 100.0 261,732
55 - 64 26.6 73.4 100.0 208,879
65 & Above 9.1 90.9 100.0 143,211
* Excluding non-response cases
2.2 Sense of Attachment & National Pride
In this study, a sense of attachment refers to how much feelings residents have
towards the place they live in, their community, as well as to the country. It is
often this sense of attachment that brews familiarity, belonging and pride among
residents, making them reluctant to move elsewhere. In addition, it enhances
one’s willingness to do things for the benefit of the community.
Sense of belonging increased over the years and with length of residence
The sense of belonging to one’s town/estate could also be viewed as one’s
familiarity to the people and one’s sense of having a stake in the living
environment. Sense of belonging is often developed over time, increasing with
30
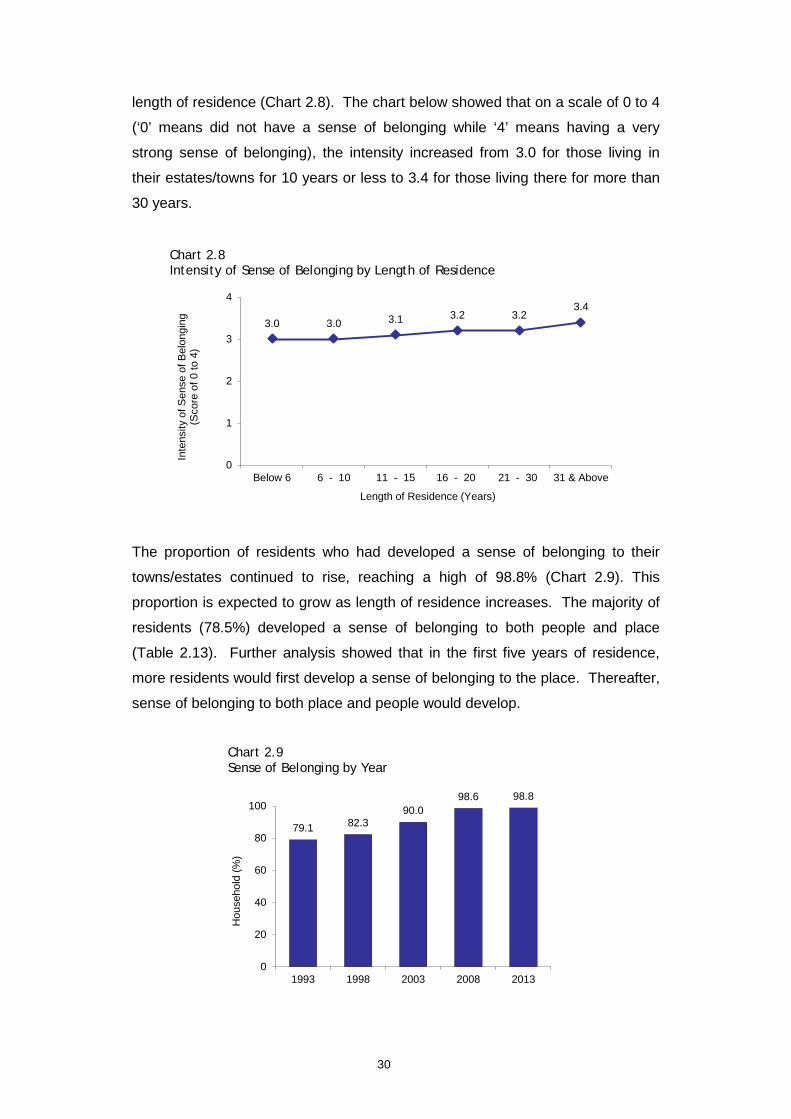
length of residence (Chart 2.8). The chart below showed that on a scale of 0 to 4
(‘0’ means did not have a sense of belonging while ‘4’ means having a very
strong sense of belonging), the intensity increased from 3.0 for those living in
their estates/towns for 10 years or less to 3.4 for those living there for more than
30 years.
Chart 2.8 Intensity of Sense of Belonging by Length of Residence
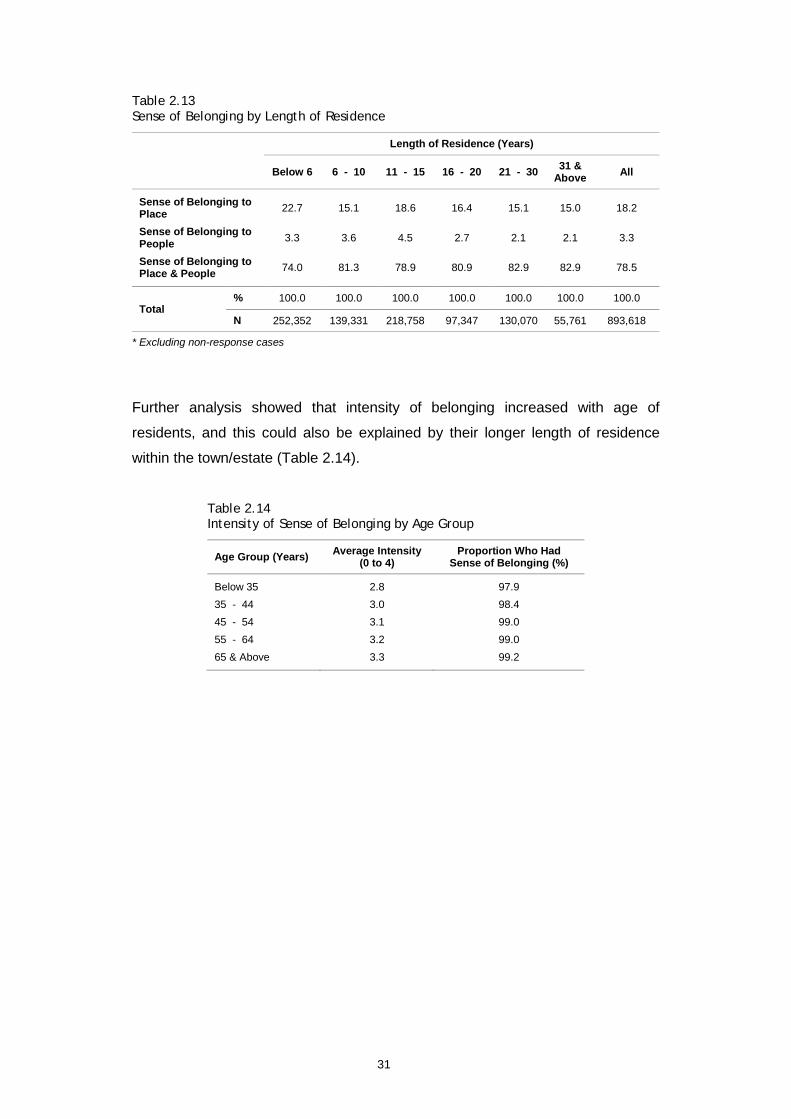
The proportion of residents who had developed a sense of belonging to their
towns/estates continued to rise, reaching a high of 98.8% (Chart 2.9). This
proportion is expected to grow as length of residence increases. The majority of
residents (78.5%) developed a sense of belonging to both people and place
(Table 2.13). Further analysis showed that in the first five years of residence,
more residents would first develop a sense of belonging to the place. Thereafter,
sense of belonging to both place and people would develop.
Chart 2.9 Sense of Belonging by Year
3.0 3.0 3.1 3.2 3.2 3.4
0
1
2
3
4
Below 6 6 - 10 11 - 15 16 - 20 21 - 30 31 & Above
Inte
nsity
of S
ense
of B
elon
ging
(S
core
of 0
to 4
)
Length of Residence (Years)
79.1 82.3 90.0
98.6 98.8
0
20
40
60
80
100
1993 1998 2003 2008 2013
Hou
seho
ld (%
)
31
Table 2.13 Sense of Belonging by Length of Residence
Length of Residence (Years)
Below 6 6 - 10 11 - 15 16 - 20 21 - 30 31 & Above All
Sense of Belonging to Place 22.7 15.1 18.6 16.4 15.1 15.0 18.2
Sense of Belonging to People 3.3 3.6 4.5 2.7 2.1 2.1 3.3
Sense of Belonging to Place & People 74.0 81.3 78.9 80.9 82.9 82.9 78.5
Total % 100.0 100.0 100.0 100.0 100.0 100.0 100.0
N 252,352 139,331 218,758 97,347 130,070 55,761 893,618
* Excluding non-response cases
Further analysis showed that intensity of belonging increased with age of
residents, and this could also be explained by their longer length of residence
within the town/estate (Table 2.14).
Table 2.14 Intensity of Sense of Belonging by Age Group
Age Group (Years) Average Intensity (0 to 4)
Proportion Who Had Sense of Belonging (%)
Below 35 2.8 97.9 35 - 44 3.0 98.4 45 - 54 3.1 99.0 55 - 64 3.2 99.0 65 & Above 3.3 99.2

32
Strong sense of community among residents
Sense of community (SOC) refers to shared sentiments enabling residents to feel
that they are living among people who are friendly, helpful and tolerant. Based
on six indicators3, sense of community among residents was found to increase
over the past ten years (Table 2.15). However, among the various indicators,
tolerance towards noise still remained a challenge.
Table 2.15 Sense of Community Score by Year
SOC Indicators 2003 2008 2013
a. “It is very easy to talk to people living in my HDB estate.” 75.0 75.0 75.0
b. “Noise from my neighbours is not annoying.” 67.5 65.0 66.0
c. “I can always get help from my neighbours when in need.” 70.0 72.5 74.3
d. “Residents in this block can recognise one another easily.” 72.5 72.5 74.3
e. “Residents here care about the maintenance of their block.” 67.5 70.0 71.8
f. “I feel a sense of belonging to this housing estate/town.” 67.5 72.5 77.5
Overall score (Over maximum of 100) 70.0 71.3 73.2
Sense of community increased with age and length of residence
Similar to sense of belonging, sense of community increased with length of
residence. Residents who lived in a town/estate for a longer period of time, as
well as elderly residents, had developed a stronger sense of community that
made them less willing to uproot from their present living environment (Table
2.16).
3 Based on the dimensions discussed in “Oddvar, S., Garling, T. and Maeland, J.G., “A Multi-dimensional
Measure of Neighbouring”, in American Journal of Community Psychology, Vol. 24, No.3, (1996), an additional statement was appended to the initial five statements. The respondents were asked how strongly they agreed or disagreed with the following six statements:
a) “It is very easy to talk to people living in my HDB estate.” b) “Noise from my neighbours can be very annoying.” c) “I can always get help from my neighbours when in need.” d) “Residents in this block can recognise one another easily.” e) “Residents here care about the maintenance of their block.” f) “I developed a sense of belonging to the estate/town I am living in.”
The average scores of all five statements together with the question on sense of belonging were summed up and expressed as a percentage of a maximum score of 100. Any score above 50 would indicate that residents had positive and shared community sentiments.

33
Table 2.16 Sense of Community Scores by Attributes
Attributes SOC Score (Over maximum of 100)
Length of Residence (Years) Below 6 71.9
6 - 10 72.7
11 - 15 73.1
16 - 20 73.8
21 - 30 74.9
31 & Above 75.2
Age Group (Years) Below 35 70.9
35 - 44 72.0
45 - 54 73.4
55 - 64 73.8
65 & Above 74.5
Majority proud to be part of the community
Nine in ten of the residents felt proud to be part of the community and this
proportion had risen over the past five years (Chart 2.10).
Chart 2.10 Sense of Pride towards Community by Year
Among the handful of residents who were not proud, they tended to be younger,
with shorter length of residence (Table 2.17). Lower sense of pride to the
community was more apparent among residents living in 1-room flats or rental
flats due to the transient nature of their tenure, which resulted in shorter length of
residence in the rental flats.
89.9
10.1
93.4
6.6
0
20
40
60
80
100
Proud Not Proud
Hou
seho
lds
(%)
2008
2013

34
Table 2.17 Sense of Pride towards Community by Attributes
Attributes Proud Not Proud Total
% N*
Length of Residence (Years) Below 6 92.1 7.9 100.0 256,105
6 - 10 93.4 6.6 100.0 141,269
11 - 15 92.4 7.6 100.0 221,414
16 - 20 92.8 7.2 100.0 98,105
21 - 30 96.5 3.5 100.0 130,579
31 & Above 96.9 3.1 100.0 56,150
Age Group (Years) Below 35 90.4 9.6 100.0 83,755
35 - 44 92.0 8.0 100.0 206,761
45 - 54 93.5 6.5 100.0 261,685
55 - 64 94.3 5.7 100.0 208,782
65 & Above 95.7 4.4 100.0 142,148
Flat Type 1-Room 88.7 11.3 100.0 24,261
2-Room 92.0 8.0 100.0 34,040
3-Room 95.1 4.9 100.0 215,603
4-Room 93.9 6.1 100.0 351,847
5-Room 91.4 8.6 100.0 212,928
Executive 93.6 6.4 100.0 64,943
Tenure Sold 93.5 6.5 100.0 854,936
Rental 90.8 9.2 100.0 48,686
* Excluding non-response cases
Strong sense of belonging and pride to Singapore
Sentiments towards Singapore in terms of belonging and national pride were
generally very high among HDB residents, based on the three statements shown
in Chart 2.11.
Chart 2.11 Households with Positive Sentiments towards Singapore by Year
96.0 96.7 97.1 95.0 94.9 97.3
0
20
40
60
80
100
I feel a strong sense ofbelonging to Singapore
I am proud to be aSingaporean (Excluding
non-citizens)
I will always regardSingapore as my home
Hou
seho
lds
(%)
2008
2013
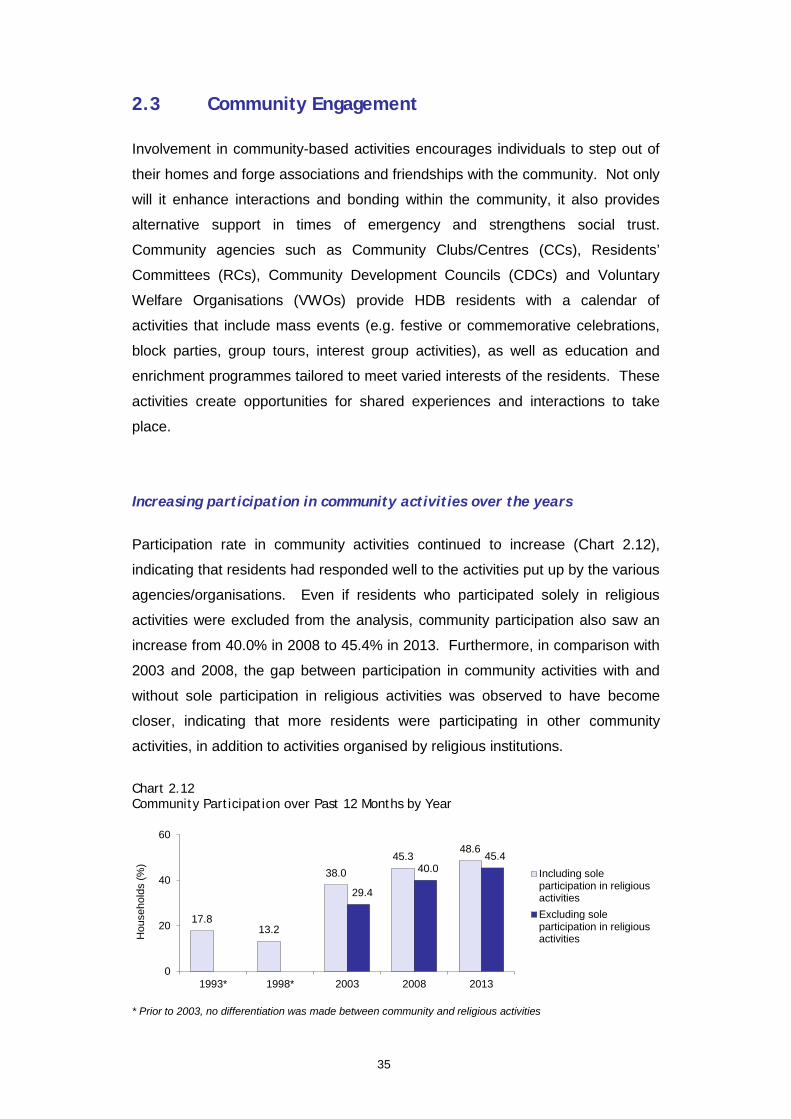
35
2.3 Community Engagement
Involvement in community-based activities encourages individuals to step out of
their homes and forge associations and friendships with the community. Not only
will it enhance interactions and bonding within the community, it also provides
alternative support in times of emergency and strengthens social trust.
Community agencies such as Community Clubs/Centres (CCs), Residents’
Committees (RCs), Community Development Councils (CDCs) and Voluntary
Welfare Organisations (VWOs) provide HDB residents with a calendar of
activities that include mass events (e.g. festive or commemorative celebrations,
block parties, group tours, interest group activities), as well as education and
enrichment programmes tailored to meet varied interests of the residents. These
activities create opportunities for shared experiences and interactions to take
place.
Increasing participation in community activities over the years
Participation rate in community activities continued to increase (Chart 2.12),
indicating that residents had responded well to the activities put up by the various
agencies/organisations. Even if residents who participated solely in religious
activities were excluded from the analysis, community participation also saw an
increase from 40.0% in 2008 to 45.4% in 2013. Furthermore, in comparison with
2003 and 2008, the gap between participation in community activities with and
without sole participation in religious activities was observed to have become
closer, indicating that more residents were participating in other community
activities, in addition to activities organised by religious institutions.
Chart 2.12 Community Participation over Past 12 Months by Year
* Prior to 2003, no differentiation was made between community and religious activities
17.8 13.2
38.0 45.3
48.6
29.4
40.0 45.4
0
20
40
60
1993* 1998* 2003 2008 2013
Hou
seho
lds
(%)
Including soleparticipation in religiousactivitiesExcluding soleparticipation in religiousactivities
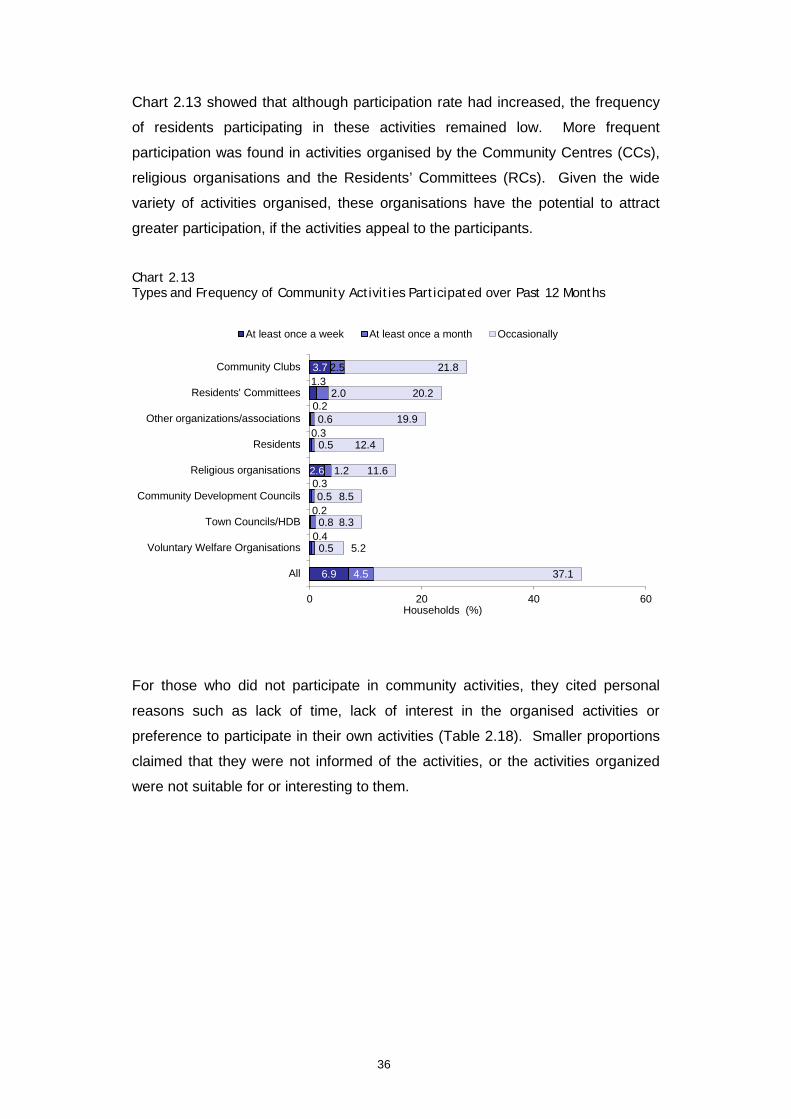
36
Chart 2.13 showed that although participation rate had increased, the frequency
of residents participating in these activities remained low. More frequent
participation was found in activities organised by the Community Centres (CCs),
religious organisations and the Residents’ Committees (RCs). Given the wide
variety of activities organised, these organisations have the potential to attract
greater participation, if the activities appeal to the participants.
Chart 2.13 Types and Frequency of Community Activities Participated over Past 12 Months
For those who did not participate in community activities, they cited personal
reasons such as lack of time, lack of interest in the organised activities or
preference to participate in their own activities (Table 2.18). Smaller proportions
claimed that they were not informed of the activities, or the activities organized
were not suitable for or interesting to them.
6.9
0.4
0.2
0.3 2.6
0.3
0.2
1.3 3.7
4.5
0.5
0.8
0.5
1.2
0.5
0.6
2.0
2.5
37.1
5.2
8.3
8.5
11.6
12.4
19.9
20.2
21.8
0 20 40 60
All
Voluntary Welfare Organisations
Town Councils/HDB
Community Development Councils
Religious organisations
Residents
Other organizations/associations
Residents' Committees
Community Clubs
Households (%)
At least once a week At least once a month Occasionally

37
Table 2.18 Reasons for Not Participating in Community Activities
Reasons Household (%)
No time/busy/always not at home 58.4
Not interested in any activity 13.2
Prefer to participate in own activities 11.2
Not informed of these activities 4.4
Activities organised were not suitable for residents/family 3.7
Activities organised were not interesting 3.2
Health problems 2.9
Others (e.g. old age, just moved in, no companion) 3.0
Total % 100.0
N* 482,022
* Excluding non-response cases
Children as catalysts for community participation
Participation rate for families with children was higher than that of families without
children (Table 2.19). Activities that appealed to children could indirectly
increase the involvement of parents or even grandparents. This also explained
why participation levels in community activities was higher among residents aged
35 and above, where they were more likely to have children or grandchildren.
Thus, organising more of such activities could help increase community
participation levels, and at the same time, promote stronger family ties.
Table 2.19 Community Participation over Past 12 Months by Attributes
Attributes Community Participation Total
Participated Did Not Participate % N*
Age Group (Years) Below 35 41.7 58.3 100.0 84,578
35 - 44 51.8 48.2 100.0 207,522
45 - 54 49.2 50.8 100.0 262,984
55 - 64 48.3 51.7 100.0 209,714
65 & Above 47.0 53.0 100.0 143,069
Family Structure Families with Children 50.1 49.9 100.0 730,087
Families without Children 42.2 57.8 100.0 63,534
* Excluding non-response cases

38
More residents willing to contribute their services for community
Some 27.1% of residents had performed services or contributed towards the
benefit of the community (Chart 2.14). This could be in the form of informing the
Town Council of any external improvements required or helping to raise funds for
the needy living in the vicinity. Over the past five years, there was an increase in
the proportion of residents (34.5%) who had not done so but expressed their
willingness to contribute. This indicates that more residents care for and are
willing to take ownership of their community.
Chart 2.14 Contribution of Services for Benefit of Community by Year
Higher proportions of residents between the age of 35 and 64 years old had
contributed their services for the benefit of the community (Table 2.20). Younger
residents were less likely to do so probably due to their commitment to career
and friends, leaving them less time for the community. Elderly residents aged 65
years and above also tended to contribute less, partly due to health or mobility
issues, limiting their ability to contribute.
Table 2.20 Contribution of Services for Benefit of Community by Age Group
Age Group (Years) Contribution of Services Total
Have Contributed Have Not Contributed % N*
Below 35 21.4 78.6 100.0 84,305
35 - 44 28.7 71.3 100.0 207,522
45 - 54 29.2 70.8 100.0 262,893
55 - 64 27.6 72.4 100.0 209,714
65 & Above 23.7 76.3 100.0 143,069
* Excluding non-response cases
26.5 31.7
41.8
27.1
34.5 38.4
0
20
40
60
Have contributed Have not contributedbut willing to do so
Have not contributedand not willing to do so
Hou
seho
lds
(%)
2008
2013

39
Lack of time the main factor for not contributing services to community
Of the 38.4% who had not contributed their services and were not willing to do so,
27.0% of them maintained that they did not have the time due to work and/or
family commitments. Other reasons included lack of information on how to
contribute, not interested in contributing, poor health or old age (Table 2.21).
Table 2.21 Whether Contributed Services and Reasons for Not Contributing/Not Willing to Contribute
Reasons All
Have contributed 27.1
Have not contributed but willing to do so 34.5
Have not contributed and not willing to do so
No time/busy 27.0
38.4
Not informed of the activities 3.5
Not interested/did not see the need 2.2
Old age 2.0
Heath issues 2.0
Others (e.g. prefer own activities, keep to oneself,
never thought of it, does not serve any purpose) 1.7
Total % 100.0
N* 908,136
* Excluding non-response cases
2.4 Summary of Findings
Almost all residents engaged in neighbourly interactions. The different types of
neighbourly activities engaged by residents reflected the depth of relationship
among residents. In 2013, the findings showed that a higher proportion of
residents engaged in neighbourly interactions compared with five years ago,
though a lower proportion engaged in more intense forms of interaction.
Compared with 2008, a higher proportion of residents had interacted with
neighbours of other ethnic groups and/or nationalities, from 77.0% in 2008 to
85.7% in 2013. Even among residents who reported interacting with neighbours
of the same ethnic group and nationality only, the majority of them informed that it
was because they only had neighbours of the same ethnic group and nationality.

40
Overall, about seven in ten of the households either did not face any nuisance in
their living environment or found the nuisances to be minimal or tolerable.
Among the remaining 32.1% of them who found the nuisances to be intolerable,
common types of nuisances faced were littering, noise from neighbours and
water dripping from wet laundry/air-conditioner compressor.
Almost all residents (97.1%) agreed that there were adequate places for
interactions in their precincts. They tended to meet and interact with their
neighbours within the block, mainly at common corridors/areas outside flats, lift
lobbies and void decks. Beyond the block, they would meet and interact at
markets or eating places within their precinct/neighbourhood, followed by
incidental meetings along linkways/pathways.
The proportion of residents who had developed a sense of belonging to their
towns/estates continued to climb, reaching a high of 98.8% in 2013. This
proportion continued to grow as length of residence increased. Further analysis
showed that during the first five years of residence, more residents would first
develop a sense of belonging to the place. Thereafter, sense of belonging to
both place and people would develop.
Residents’ sense of community was found to increase over the past ten years.
Similar to sense of belonging, residents’ sense of community increased with their
length of residence. The findings also showed that residents’ tolerance towards
noise remained a challenge over the years.
Sense of pride towards community had risen over the past five years, from 89.9%
in 2008 to 93.4% in 2013. Among the minority who were not proud, they tended
to be younger and having shorter length of residence. Generally, residents had
positive sentiments towards Singapore, in terms of belonging and national pride.
Participation in community activities continued to increase from 38.0% in 2003 to
48.6% in 2013. Higher proportions of them comprised families with younger
children, which showed that children could be catalysts in fostering higher
community participation. For those who did not participate in community
activities, they gave personal reasons such as lack of time, lack of interest in the
organised activities or a preference to participate in their own activities.
41
More residents were willing or had contributed their services (61.6%) for the
benefit of the community, higher than 58.2% in 2008. Among those who did not
contribute and were not willing to do so, apart from lack of time, they also cited
that they were unaware of such activities.


3
Family Ties

45
Chapter 3 Family Ties
Introduction
The family unit plays a vital role in ensuring social cohesion, hence it is important
that family ties are maintained and strengthened. This chapter analyses family
ties of two major groups of residents, younger married residents with parents and
older residents with married children. The well-being and caregiving preferences
for elderly parents are also examined. Over the years, HDB has introduced
various schemes such as the Married Child Priority Scheme (MCPS) and the
Multi-Generation Priority Scheme (MGPS) to encourage married children and
parents to live together or near to each other. These schemes facilitate mutual
care and support between family members. In this chapter, residents’ physical
and social living arrangements, frequency and depth of interaction between
family members, extent of family support, as well as residents’ views on
caregiving for elderly parents are covered.
Objectives
The objectives of the chapter are:
a) To examine residents’ physical and social living arrangements, frequency
and depth of interaction between family members, extent of family support,
and strength of relationships; and
b) To gather residents’ views on caregiving for elderly parents so as to
understand the preferences of HDB residents regarding responsibilities
towards parental care, especially in view of an ageing population.

46
Framework
The framework focuses on inter-generational relationships between children and
parents, familial support and caregiving for elderly parents. The specific aspects
to be examined are listed in the framework. Findings in relation to residents from
both younger and older age groups are analysed separately as views from these
two cohorts might differ.
The details of the two groups of residents covered are as shown:
a) Younger married residents with parents. This group comprises
residents aged 54 years and below who have parents living in Singapore.
There are presently about 272,619 of such households, and they provide a
basis to examine family ties from the viewpoint of younger married
residents with parents.
b) Older residents with married children. This group comprises residents
aged 55 years and above who have married children. There are presently
about 207,620 of such households. The analysis examines family ties from
the viewpoint of older residents with married children.
Framework for Family Ties
Ties between Parents and Children
Younger Married Residents with Parents*
55 Years & Above (N = 207,620)
54 Years & Below (N = 272,619)
Older Residents with Married Children
* This group excludes parents who are not living in Singapore
Living Arrangement
Present and Preferred Physical & Social Living Arrangement
Types & Levels of Interaction Communication
with Children & Grandchildren
Importance & Satisfaction with Family Life Strength of
Family Ties
Depth of Interaction
Well-Being of Family Life
Regular Financial Support Physical,
Emotional & Financial Support
Extent of Support
Preferred Housing Type when Old Ideal Elderly Living
Arrangement & Caregiving of Elderly Parents
Ideal Elderly Living Arrangement

47
The age distribution of the two groups of residents is as shown in Table 3.1. The
majority of the younger married residents were aged between 30 and 49, while
about one-third of older residents were aged 70 years and above.
Table 3.1 Age Distribution of Younger Married Residents and Older Residents
Age Group (Years) Younger Married Residents
Older Residents with Married Children
21 - 29 4.9 -
30 - 39 31.4 -
40 - 49 44.8 -
50 - 54 18.9 -
55 - 59 - 22.3
60 - 64 - 25.0
65 - 69 - 20.7
70 & Above - 32.0
Total % 100.0 100.0
N* 272,619 207,620
* Excluding non-response cases
3.1 Physical Living Arrangement
Physical living arrangement refers to the geographical proximity between parents’
and children’s residence. The present and preferred living arrangement of
residents vis-à-vis their parents or married children are examined.
More married children living with or within close proximity to parents
Some 36.7% of younger married residents lived in the same flat or within close
proximity4 to their parents (Table 3.2). Comparing with findings from the previous
years, higher proportions of younger married residents were living with or near
their parents in 2013. This could partly be attributed to policies such as the
Married Child Priority Scheme5, Multi-Generation Priority Scheme (MGPS)6 and
the CPF Housing Grant for Family, which encourage and provide the opportunity
4 Living “within close proximity” to their parents is defined as living next door, in the same block, in a nearby
block, or in the same estate as their parents. 5 From November 2014 BTO exercise onwards, the Married Child Priority Scheme has been enhanced to set
aside up to 30% of the public flat supply for first-timer families, and up to 15% for second-timer families. Details in http://www.hdb.gov.sg/fi10/fi10321p.nsf/w/BuyingNewFlatPriority?OpenDocument#MCPS
6 The Multi-Generation Priority Scheme (MGPS) encourages families to stay close to each other in Build-To-Order (BTO) projects where Studio Apartments (SA) or 2-room flats are integrated with other flat types. From September 2013 BTO exercise onwards, the parents may apply for a 3-room flat and enjoy the priority under the MGPS.

48
for married children and parents to live within close proximity to each other. The
findings also showed that the gap between residents’ present and preferred living
arrangements had narrowed as residents’ preference was increasingly being met.
In contrast, the proportion that lived elsewhere in Singapore had decreased
slightly over the years, from 45.1% in 2008 to 41.5% in 2013.
Table 3.2 Present and Preferred Physical Living Arrangements of Younger Married Residents vis-à-vis their Parents by Year
Physical Living Arrangement
2003 2008 2013
Present Preferred Present Preferred Present Preferred
In the Same Flat 11.2 23.1 14.0 18.4 15.7 17.5
Next Door 1.2 7.4 0.6 3.1 0.4 2.4
In the Same Block 2.1 31.4 9.5 73.3 2.1 35.5 4.6 52.8 1.4 36.7 4.1 49.9
In a Nearby Block 6.1 17.2 9.0 13.0 8.4 12.3
In the Same Estate 10.8 16.1 9.8 13.7 10.8 13.6
In a Nearby Estate 21.2 14.1 16.9 16.2 21.8 21.3
Elsewhere in Singapore 44.7 11.4 45.1 29.3 41.5 28.7
Short-Term Stay with Different Children 1.4 1.1 1.2 1.2 - -
Each Parent Staying at a Different Place 1.3 0.1 1.3 0.5 - -
Overseas - - - - - 0.1
Total % 100.0 100.0 100.0 100.0 100.0 100.0
N* 335,129 334,211 303,846 303,647 272,018 271,820
* Excluding non-response cases
Families with younger children preferred to live closer to parents
Higher proportions of younger married residents with young (42.2%) and
teenaged children (38.0%) were living within close proximity to their parents
compared with 26.1% of families with grown-up children and 33.0% of families
without children (Table 3.3).
The same was observed with their preferred living arrangement, where higher
proportions (ranging from 50.1% to 55.1%) of younger married residents with
eldest child below 21 years old, preferred to live in closer proximity to their
parents, compared with 41.1% of those with grown-up children (Table 3.4).
This suggests that families with younger children may prefer to live closer to their
parents due to their needs for childcare arrangements, as grandparents remained
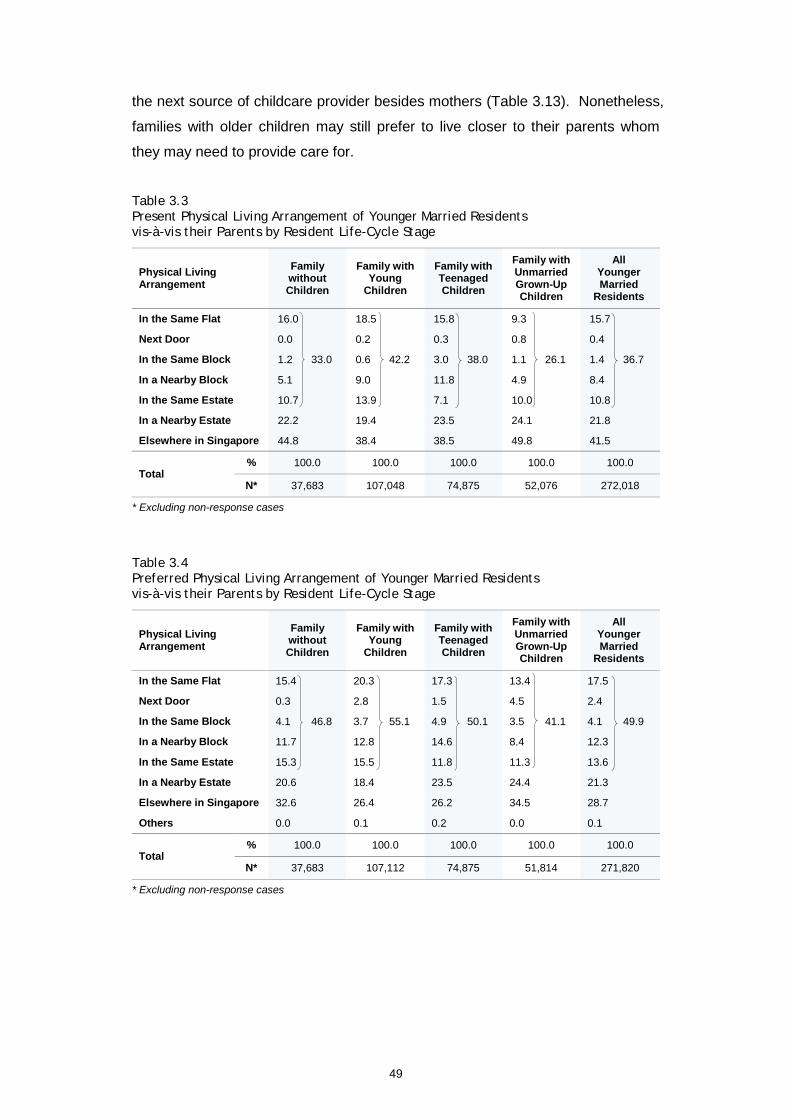
49
the next source of childcare provider besides mothers (Table 3.13). Nonetheless,
families with older children may still prefer to live closer to their parents whom
they may need to provide care for.
Table 3.3 Present Physical Living Arrangement of Younger Married Residents vis-à-vis their Parents by Resident Life-Cycle Stage
Physical Living Arrangement
Family without Children
Family with Young
Children
Family with Teenaged Children
Family with Unmarried Grown-Up Children
All Younger Married
Residents
In the Same Flat 16.0 18.5 15.8 9.3 15.7
Next Door 0.0 0.2 0.3 0.8 0.4
In the Same Block 1.2 33.0 0.6 42.2 3.0 38.0 1.1 26.1 1.4 36.7
In a Nearby Block 5.1 9.0 11.8 4.9 8.4
In the Same Estate 10.7 13.9 7.1 10.0 10.8
In a Nearby Estate 22.2 19.4 23.5 24.1 21.8
Elsewhere in Singapore 44.8 38.4 38.5 49.8 41.5
Total % 100.0 100.0 100.0 100.0 100.0
N* 37,683 107,048 74,875 52,076 272,018
* Excluding non-response cases
Table 3.4 Preferred Physical Living Arrangement of Younger Married Residents vis-à-vis their Parents by Resident Life-Cycle Stage
Physical Living Arrangement
Family without Children
Family with Young
Children
Family with Teenaged Children
Family with Unmarried Grown-Up Children
All Younger Married
Residents
In the Same Flat 15.4 20.3 17.3 13.4 17.5
Next Door 0.3 2.8 1.5 4.5 2.4
In the Same Block 4.1 46.8 3.7 55.1 4.9 50.1 3.5 41.1 4.1 49.9
In a Nearby Block 11.7 12.8 14.6 8.4 12.3
In the Same Estate 15.3 15.5 11.8 11.3 13.6
In a Nearby Estate 20.6 18.4 23.5 24.4 21.3
Elsewhere in Singapore 32.6 26.4 26.2 34.5 28.7
Others 0.0 0.1 0.2 0.0 0.1
Total % 100.0 100.0 100.0 100.0 100.0
N* 37,683 107,112 74,875 51,814 271,820
* Excluding non-response cases

50
More married children living in parents’ home temporarily while waiting for their flats
Over the years, there was a slight increase in the proportion of married children
living together with older residents, from 14.3% in 2008 to 19.1% in 2013 (Table
3.5). Similarly, there was an increased preference for them to live together, from
14.7% in 2008 to 17.3% in 2013. However, it was noted that the proportion that
preferred to live with married children was lower compared with actual living
arrangement in 2013. Further analysis showed that married children living with
parents could be a temporary arrangement as close to half of the 19.1% (i.e.
8.8%) were waiting for their new flat to be completed or renovated.
On the other hand, the proportion that was living in the same flat or within close
proximity to their married children7 remained constant over the years (42.6%,
42.7% and 40.5% in 2003, 2008 and 2013, respectively). Higher proportion of
older residents would prefer to have such living arrangement even though this
preference was increasingly being met over the years. As shown in Table 3.5,
the gap between older residents’ present and preferred living arrangements had
narrowed.
The findings indicate that there could be increasing acceptance for married
children and parents to live apart from each other due to greater accessibility and
improvements in Singapore’s transport network. Many of the older residents also
preferred to age-in-place. Living in close proximity could be the preferred living
arrangement for many as it provides the physical proximity and at the same time,
privacy for both the younger and older residents.
7 Married child refers to the one who lives nearest to the parents if parents have more than one married child.
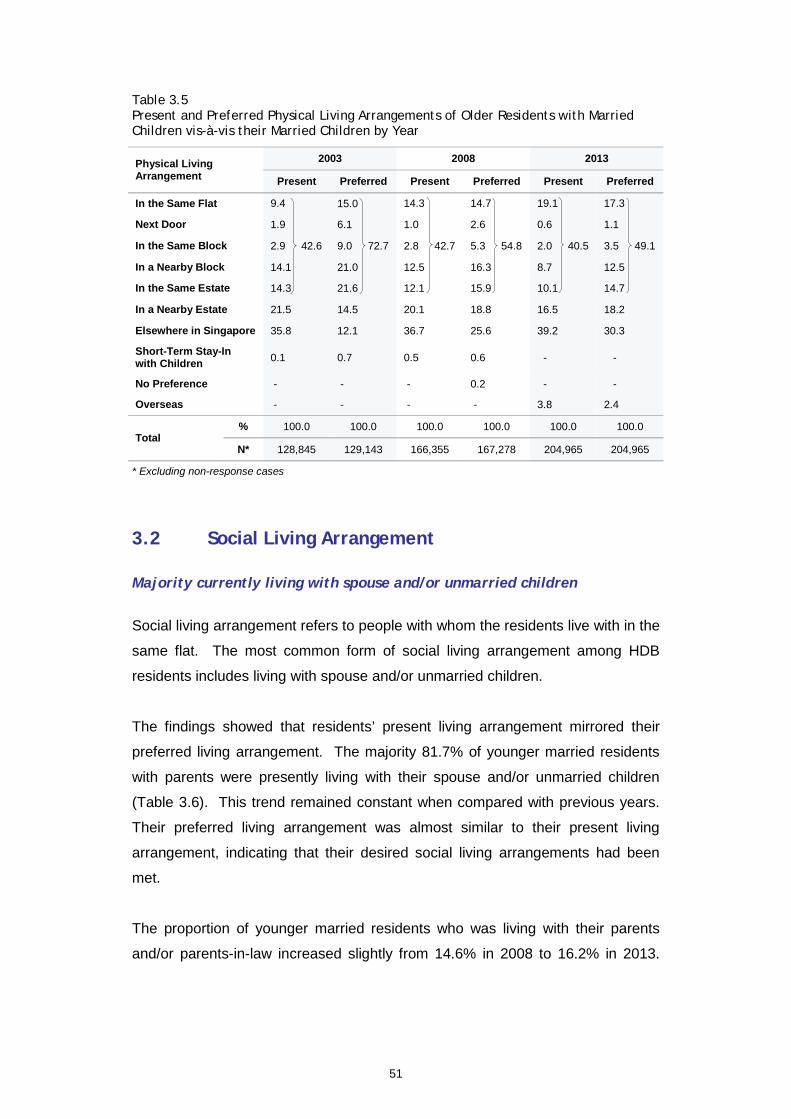
51
Table 3.5 Present and Preferred Physical Living Arrangements of Older Residents with Married Children vis-à-vis their Married Children by Year
Physical Living Arrangement
2003 2008 2013
Present Preferred Present Preferred Present Preferred
In the Same Flat 9.4 15.0 14.3 14.7 19.1 17.3
Next Door 1.9 6.1 1.0 2.6 0.6 1.1
In the Same Block 2.9 42.6 9.0 72.7 2.8 42.7 5.3 54.8 2.0 40.5 3.5 49.1
In a Nearby Block 14.1 21.0 12.5 16.3 8.7 12.5
In the Same Estate 14.3 21.6 12.1 15.9 10.1 14.7
In a Nearby Estate 21.5 14.5 20.1 18.8 16.5 18.2
Elsewhere in Singapore 35.8 12.1 36.7 25.6 39.2 30.3
Short-Term Stay-In with Children 0.1 0.7 0.5 0.6 - -
No Preference - - - 0.2 - -
Overseas - - - - 3.8 2.4
Total % 100.0 100.0 100.0 100.0 100.0 100.0
N* 128,845 129,143 166,355 167,278 204,965 204,965
* Excluding non-response cases
3.2 Social Living Arrangement
Majority currently living with spouse and/or unmarried children
Social living arrangement refers to people with whom the residents live with in the
same flat. The most common form of social living arrangement among HDB
residents includes living with spouse and/or unmarried children.
The findings showed that residents’ present living arrangement mirrored their
preferred living arrangement. The majority 81.7% of younger married residents
with parents were presently living with their spouse and/or unmarried children
(Table 3.6). This trend remained constant when compared with previous years.
Their preferred living arrangement was almost similar to their present living
arrangement, indicating that their desired social living arrangements had been
met.
The proportion of younger married residents who was living with their parents
and/or parents-in-law increased slightly from 14.6% in 2008 to 16.2% in 2013.

52
The introduction of 3Gen flats8 in September 2013 would help facilitate this group
of residents to live with their extended families, as well as promote mutual care
and support.
Table 3.6 Present and Preferred Social Living Arrangements of Younger Married Residents by Year
Social Living Arrangement 2003 2008 2013
Present Preferred Present Preferred Present Preferred
Live with Spouse and/or Unmarried Children
82.4 64.3 81.5 78.2 81.7 81.6
Live with Spouse and/or Unmarried Children and Parents and/or Parents-in-law
15.3 28.1 14.6 17.6 16.2 16.1
Live with Married Children 0.5 1.8 0.8 1.0 1.9 2.2
Live Alone 0.3 1.0 0.1 0.2 0.2 0.1
Other Living Arrangements (e.g. with companion/friends/relatives) 1.5 4.8 3.0 3.0 - -
Total % 100.0 100.0 100.0 100.0 100.0 100.0
N* 335,680 335,174 304,965 304,455 272,619 272,369
* Excluding non-response cases
Similar to younger married residents, the majority of older residents with married
children were living with spouse and/or unmarried children. However, this
proportion continued to decline over the years, from 73.3% in 2003 to 68.1% in
2008, and dipping further to 65.8% in 2013. On the other hand, the proportion
with married children living with them increased steadily to 18.5% in 2013, from
5.0% in 2003 and 13.8% in 2008 (Table 3.7). However, in 2013, a lower
proportion of older residents actually preferred such a living arrangement. Hence,
this could be a temporary living arrangement while their married children wait for
their new flats to be completed or renovated.
8 3Gen flats - Introduced in September 2013, flats designed with additional bedroom with attached bathroom, to
facilitate multi-generation families to stay under one roof.

53
Table 3.7 Present and Preferred Social Living Arrangements of Older Residents with Married Children by Year
Social Living Arrangement 2003 2008 2013
Present Preferred Present Preferred Present Preferred
Live with Spouse and/or Unmarried Children
73.3 61.1 68.1 65.7 65.8 67.5
Live with Spouse and/or Unmarried Children and Parents and/or Parents-in-law
5.2 4.8 1.4 1.7 2.0 2.0
Live with Married Children 5.0 17.4 13.8 16.9 18.5 17.6
Live Alone 11.3 13.0 10.3 9.7 11.1 10.7
Other Living Arrangements (e.g. with companion/friends/relatives) 5.2 3.7 6.4 6.0 2.6 2.2
Total % 100.0 100.0 100.0 100.0 100.0 100.0
N* 132,094 131,977 172,040 171,790 207, 620 207,620
* Excluding non-response cases
3.3 Depth of Interaction
Interaction with family members is a crucial part of building and sustaining long
term relationships. Maintaining such ties is not only important for personal well-
being, but also essential for familial support, especially in times of need.
This section examines the frequency and depth of interactions between family
members who are not living together in the same flat. Residents who live in the
same flat as their family members would already have daily contact. Hence, they
are excluded from the analyses in this section. Such interactions include visiting
patterns and frequency of keeping in touch with family members. These will give
insights on residents’ interaction and bonding with family members, as well as
provide a good indication on the strength of family ties.
High frequency of visits between parents and married children indicating strong inter-generational relationships
Visiting patterns refer to the frequency of visits between children and their
parents who are not living together. By looking at how frequently they visit one
another, the strength of inter-generational relationships could be inferred.
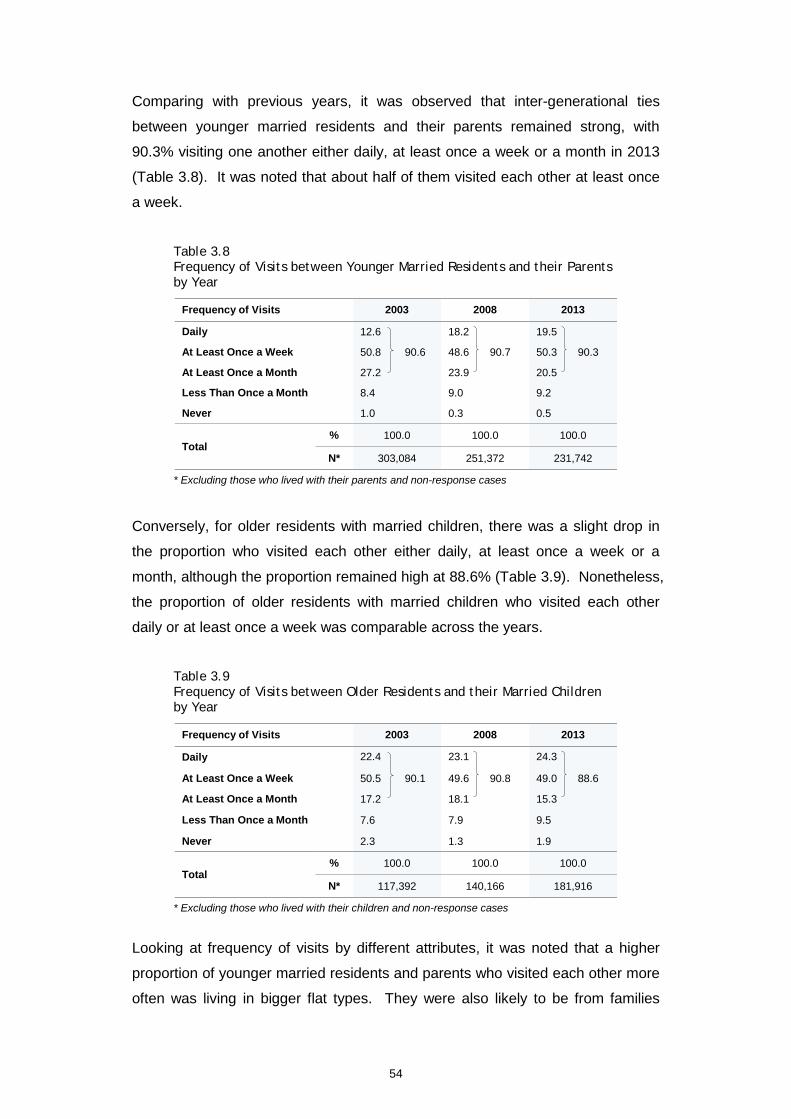
54
Comparing with previous years, it was observed that inter-generational ties
between younger married residents and their parents remained strong, with
90.3% visiting one another either daily, at least once a week or a month in 2013
(Table 3.8). It was noted that about half of them visited each other at least once
a week.
Table 3.8 Frequency of Visits between Younger Married Residents and their Parents by Year
Frequency of Visits 2003 2008 2013
Daily 12.6 18.2 19.5
At Least Once a Week 50.8 90.6 48.6 90.7 50.3 90.3
At Least Once a Month 27.2 23.9 20.5
Less Than Once a Month 8.4 9.0 9.2
Never 1.0 0.3 0.5
Total % 100.0 100.0 100.0
N* 303,084 251,372 231,742
* Excluding those who lived with their parents and non-response cases
Conversely, for older residents with married children, there was a slight drop in
the proportion who visited each other either daily, at least once a week or a
month, although the proportion remained high at 88.6% (Table 3.9). Nonetheless,
the proportion of older residents with married children who visited each other
daily or at least once a week was comparable across the years.
Table 3.9 Frequency of Visits between Older Residents and their Married Children by Year
Frequency of Visits 2003 2008 2013
Daily 22.4 23.1 24.3
At Least Once a Week 50.5 90.1 49.6 90.8 49.0 88.6
At Least Once a Month 17.2 18.1 15.3
Less Than Once a Month 7.6 7.9 9.5
Never 2.3 1.3 1.9
Total % 100.0 100.0 100.0
N* 117,392 140,166 181,916
* Excluding those who lived with their children and non-response cases
Looking at frequency of visits by different attributes, it was noted that a higher
proportion of younger married residents and parents who visited each other more
often was living in bigger flat types. They were also likely to be from families

55
without children or with young children (Table 3.10). Residents at their earlier
life-cycle stages had more visits with their parents as they were likely to have
meals at their parents’ home or to pick up their children from their parents’ home
after work.
Table 3.10 Frequency of Visits between Younger Married Residents and their Parents by Attributes
Attributes Visited
At Least Once a Month
Visited Less Than
Once a Month or Never
Total
% N*
Flat Type 1- & 2-Room 3-Room 4-Room 5-Room & Bigger
79.5 84.1 90.2 93.0
20.5 15.9 9.8 7.0
100.0 100.0 100.0 100.0
7,386 29,469 92,637
102,250
Resident Life-Cycle Stage
Family without Children Family with Young Children Family with Teenaged Children Family with Unmarried Grown-Up Children
92.6 93.4 89.8 83.5
7.4 6.6
10.2 16.5
100.0 100.0 100.0 100.0
31,663 88,879 63,513 47,549
* Excluding those living with parents and non-response cases
Similar to younger married residents, it was noted that a higher proportion of
older residents and married children who visited each other more regularly was
living in larger flat types (Table 3.11).
Table 3.11 Frequency of Visits between Older Residents and their Married Children by Flat Type
Flat Type Visited
At Least Once a Month
Visited Less Than Once a Month
or Never
Total
% N*
1- & 2-Room 3-Room 4-Room 5-Room & Bigger
75.1 87.7 90.7 92.2
24.9 12.3 9.3 7.8
100.0 100.0 100.0 100.0
18,208 58,106 64,249 41,353
* Excluding non-response cases
The most frequent activities carried out by younger married residents with their
parents when visiting each other were having meals together, exchanging
suggestions and advice about personal problems, going for outings together and
taking care of parents (Chart 3.1). Helping with daily chores such as buying
groceries or doing housework occurred less frequently, suggesting that the
interactions largely centred around leisure activities rather than performing
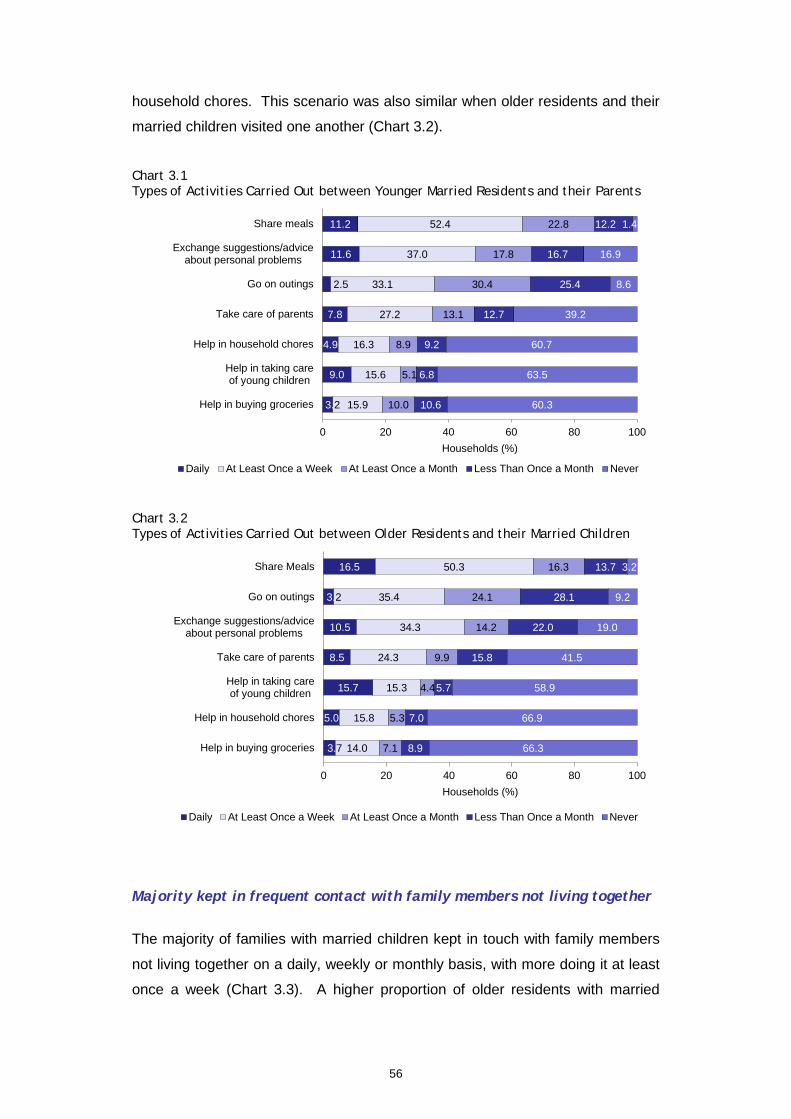
56
household chores. This scenario was also similar when older residents and their
married children visited one another (Chart 3.2).
Chart 3.1 Types of Activities Carried Out between Younger Married Residents and their Parents
Chart 3.2 Types of Activities Carried Out between Older Residents and their Married Children
Majority kept in frequent contact with family members not living together
The majority of families with married children kept in touch with family members
not living together on a daily, weekly or monthly basis, with more doing it at least
once a week (Chart 3.3). A higher proportion of older residents with married
3.2
9.0
4.9
7.8
2.5
11.6
11.2
15.9
15.6
16.3
27.2
33.1
37.0
52.4
10.0
5.1
8.9
13.1
30.4
17.8
22.8
10.6
6.8
9.2
12.7
25.4
16.7
12.2
60.3
63.5
60.7
39.2
8.6
16.9
1.4
0 20 40 60 80 100
Help in buying groceries
Help in taking careof young children
Help in household chores
Take care of parents
Go on outings
Exchange suggestions/adviceabout personal problems
Share meals
Households (%)
Daily At Least Once a Week At Least Once a Month Less Than Once a Month Never
3.7
5.0
15.7
8.5
10.5
3.2
16.5
14.0
15.8
15.3
24.3
34.3
35.4
50.3
7.1
5.3
4.4
9.9
14.2
24.1
16.3
8.9
7.0
5.7
15.8
22.0
28.1
13.7
66.3
66.9
58.9
41.5
19.0
9.2
3.2
0 20 40 60 80 100
Help in buying groceries
Help in household chores
Help in taking careof young children
Take care of parents
Exchange suggestions/adviceabout personal problems
Go on outings
Share Meals
Households (%)
Daily At Least Once a Week At Least Once a Month Less Than Once a Month Never
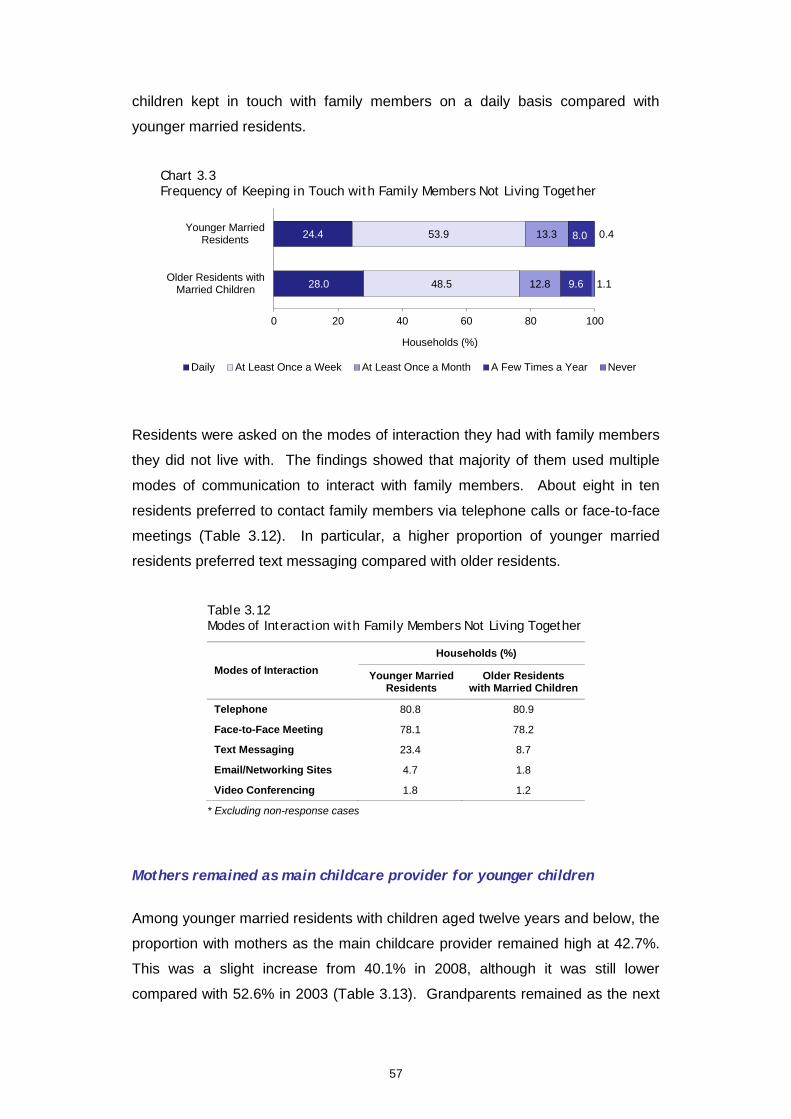
57
children kept in touch with family members on a daily basis compared with
younger married residents.
Chart 3.3 Frequency of Keeping in Touch with Family Members Not Living Together
Residents were asked on the modes of interaction they had with family members
they did not live with. The findings showed that majority of them used multiple
modes of communication to interact with family members. About eight in ten
residents preferred to contact family members via telephone calls or face-to-face
meetings (Table 3.12). In particular, a higher proportion of younger married
residents preferred text messaging compared with older residents.
Table 3.12 Modes of Interaction with Family Members Not Living Together
Modes of Interaction Households (%)
Younger Married Residents
Older Residents with Married Children
Telephone 80.8 80.9
Face-to-Face Meeting 78.1 78.2
Text Messaging 23.4 8.7
Email/Networking Sites 4.7 1.8
Video Conferencing 1.8 1.2
* Excluding non-response cases
Mothers remained as main childcare provider for younger children
Among younger married residents with children aged twelve years and below, the
proportion with mothers as the main childcare provider remained high at 42.7%.
This was a slight increase from 40.1% in 2008, although it was still lower
compared with 52.6% in 2003 (Table 3.13). Grandparents remained as the next
28.0
24.4
48.5
53.9
12.8
13.3
9.6
8.0
1.1
0.4
0 20 40 60 80 100
Older Residents withMarried Children
Younger MarriedResidents
Households (%)
Daily At Least Once a Week At Least Once a Month A Few Times a Year Never

58
source of help, followed by childcare centres/baby sitters and maids. Conversely,
there was an increasing trend for childcare centres or baby sitters to be the main
childcare provider, although the proportion remained relatively low at 12.4%.
This shows that there is an increasing demand for professional childcare services,
which is especially desired by households where both parents are working.
Table 3.13 Childcare Arrangements of Younger Married Residents with Children Aged Twelve Years and Below by Year
Main Childcare Provider 2003 2008 2013
Mother** 52.6 40.1 42.7
Father** 2.4 1.4 2.1
Grandparents** 19.7 29.6 27.7
Childcare Centre/Baby Sitter 8.3 11.0 12.4
Maids 10.1 13.9 11.6
Children Themselves 1.6 0.3 0.6
Relatives 2.0 1.4 1.4
Other Arrangements 3.3 2.3 1.5
Total % 100.0 100.0 100.0
N* 212,739 166,117 148,484
* Excluding non-response cases ** The relationship is with reference to the children aged twelve years and below
Among the grandparents who were the main childcare provider, 75.5% of them
were living in close proximity to their grandchildren (Table 3.14).
Table 3.14 Proximity of Grandparents’ Home to Married Children by Year
Location of Grandparents’** Home 2003 2008 2013
Same Flat/Next Door 23.9 24.5 31.6
Same/Nearby Block 10.7 17.6 10.6
Same/Nearby Estate 23.2 29.2 33.3
Elsewhere in Singapore 39.1 26.5 24.5
Others 3.1 2.2 -
Total % 100.0 100.0 100.0
N* 41,968 48,839 40,961
* Excluding non-response cases ** Grandparents who were main childcare provider
75.5 57.8 71.3

59
Majority could communicate well with children and grandchildren
Residents were asked whether they had any problems communicating with their
children and grandchildren. The findings showed that the majority of both
younger and older residents did not encounter any problems most of the time
(Chart 3.4). For the minority who encountered problems communicating with
children and grandchildren, the main reason cited was personality conflict with
children, thus resulting in infrequent interaction with grandchildren as well.
Chart 3.4 Whether Faced Problems when Communicating with Children and Grandchildren
3.4 Forms and Extent of Family Support
A new section was included in SHS 2013 to examine the forms and extent of
support rendered by family members. The types of support covered include
regular financial support and the ability to rely on family members for physical,
emotional and financial support in times of emergency.
Majority of younger married residents provided regular financial support to parents
The level of financial support parents received from their children is one of the
indicators of familial support. The proportion of younger married residents that
provided regular financial support to their parents increased slightly from 70.2%
in 2008 to 74.9% in 2013 (Table 3.15). The average amount they contributed to
their parents increased to $400 per month, compared with about $340 in 2008.
95.0 93.4 95.3
4.2 3.9 2.5 0.8 2.7 2.2
0
20
40
60
80
100
Younger MarriedResidents
Older Residents withMarried Children
All Older Residentswith Grandchildren
Hou
seho
lds
(%)
No problem most of the time
Faced problems sometimes
Faced problems very often/Did not usually communicatewith them
Communication with Grandchildren
Communication with Children

60
Table 3.15 Regular Financial Support from Younger Married Residents to Parents by Year
Financial Support to Parents 2008 2013
Provided Financial Support to Parents (%) 70.2 74.9
Amount Contributed to Parents per month ($)
Average 336 400 Median 300 300
Younger married residents who provided regular financial support were more
likely to be males or economically active. Higher proportions of younger married
residents without children, as well as younger married residents with young
children were also providing regular financial support (Table 3.16).
Table 3.16 Regular Financial Support from Younger Married Residents to Parents by Attributes
Attributes Supported
Parents Financially
Did Not Support Parents
Financially
Total
% N*
Sex Male Female
77.5 71.8
22.5 28.2
100.0 100.0
147,774 124,845
Economic Status
Economically Active Economically Inactive
77.5 59.2
22.5 40.8
100.0 100.0
234,015 38,237
Resident Life-Cycle Stage
Family without Children Family with Young Children Family with Teenaged Children Family with Unmarried Grown-Up Children
82.2 78.1
72.2 67.3
17.8 21.9
27.8 32.7
100.0 100.0
100.0 100.0
37,780 107,236
75,121 52,148
* Excluding non-response cases
The amount of regular financial support given to parents varies. Those who
contributed more generously were likely to be males, economically active, or
families with young children (Table 3.17).
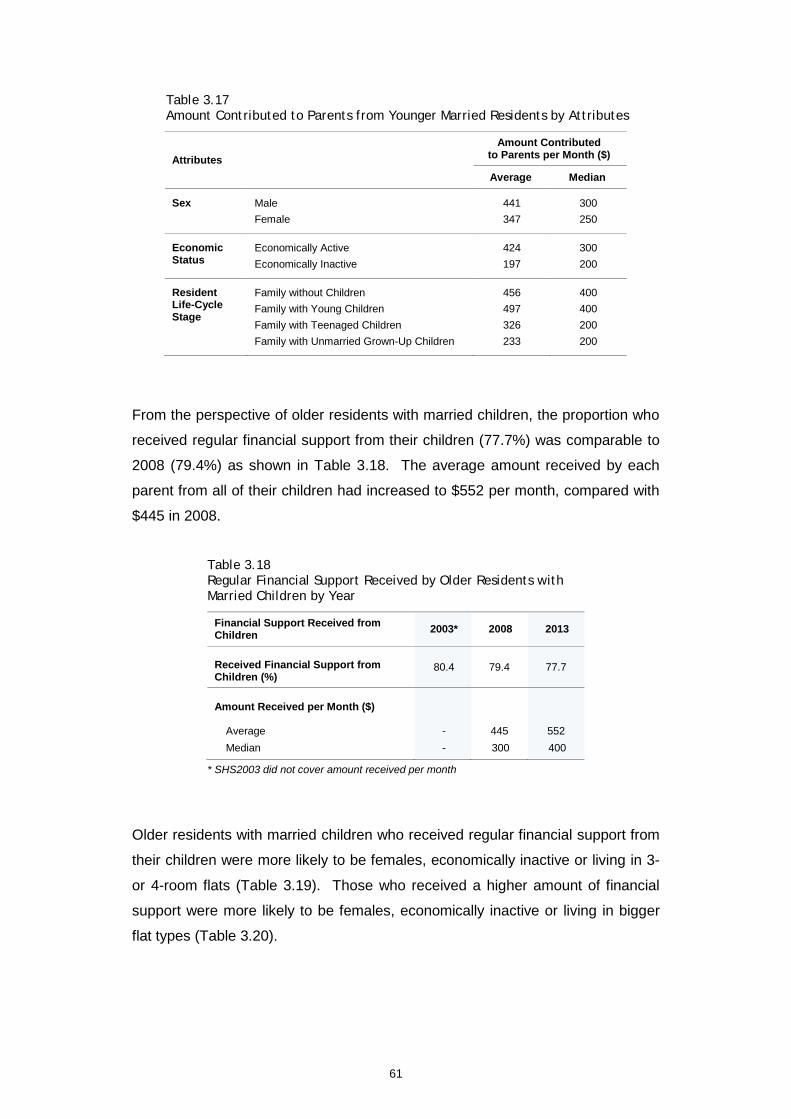
61
Table 3.17 Amount Contributed to Parents from Younger Married Residents by Attributes
Attributes Amount Contributed
to Parents per Month ($)
Average Median
Sex Male Female
441 347
300 250
Economic Status
Economically Active Economically Inactive
424 197
300 200
Resident Life-Cycle Stage
Family without Children Family with Young Children Family with Teenaged Children Family with Unmarried Grown-Up Children
456 497 326 233
400 400 200 200
From the perspective of older residents with married children, the proportion who
received regular financial support from their children (77.7%) was comparable to
2008 (79.4%) as shown in Table 3.18. The average amount received by each
parent from all of their children had increased to $552 per month, compared with
$445 in 2008.
Table 3.18 Regular Financial Support Received by Older Residents with Married Children by Year
Financial Support Received from Children 2003* 2008 2013
Received Financial Support from Children (%)
80.4 79.4 77.7
Amount Received per Month ($)
Average - 445 552 Median - 300 400
* SHS2003 did not cover amount received per month
Older residents with married children who received regular financial support from
their children were more likely to be females, economically inactive or living in 3-
or 4-room flats (Table 3.19). Those who received a higher amount of financial
support were more likely to be females, economically inactive or living in bigger
flat types (Table 3.20).

62
Table 3.19 Regular Financial Support Received by Older Residents with Married Children by Attributes
Attributes Received Financial Support
Did Not Receive Financial Support
Total
% N*
Sex Male Female
70.8 83.8
29.2 16.2
100.0 100.0
96,549 111,071
Economic Status
Economically Active Economically Inactive
65.8 84.5
34.2 15.5
100.0 100.0
75,188 132,206
Flat Type 1- & 2-Room 3-Room 4-Room 5-Room & Bigger
72.6 83.4 79.8 69.2
27.4 16.6 20.2 30.8
100.0 100.0 100.0 100.0
18,553 63,862 75,861 49,345
* Excluding non-response cases
Table 3.20 Amount of Financial Support Received by Older Residents with Married Children by Attributes
Attributes Amount Received per Month ($)
Average Median
Sex Male Female
490 599
350 500
Economic Status
Economically Active Economically Inactive
439 601
300 500
Flat Type 1- & 2-Room 3-Room 4-Room 5-Room & Bigger
311 504 593 661
300 400 500 500
Majority would pay for own medical bills
The majority of younger and older residents would pay for their own medical bills
when they fell ill (Table 3.21). Those with adult children were able to rely on their
children to pay for medical bills. A higher proportion of younger married residents
would also rely on their employers to pay for their medical bills as they were more
likely to be working compared with older residents.
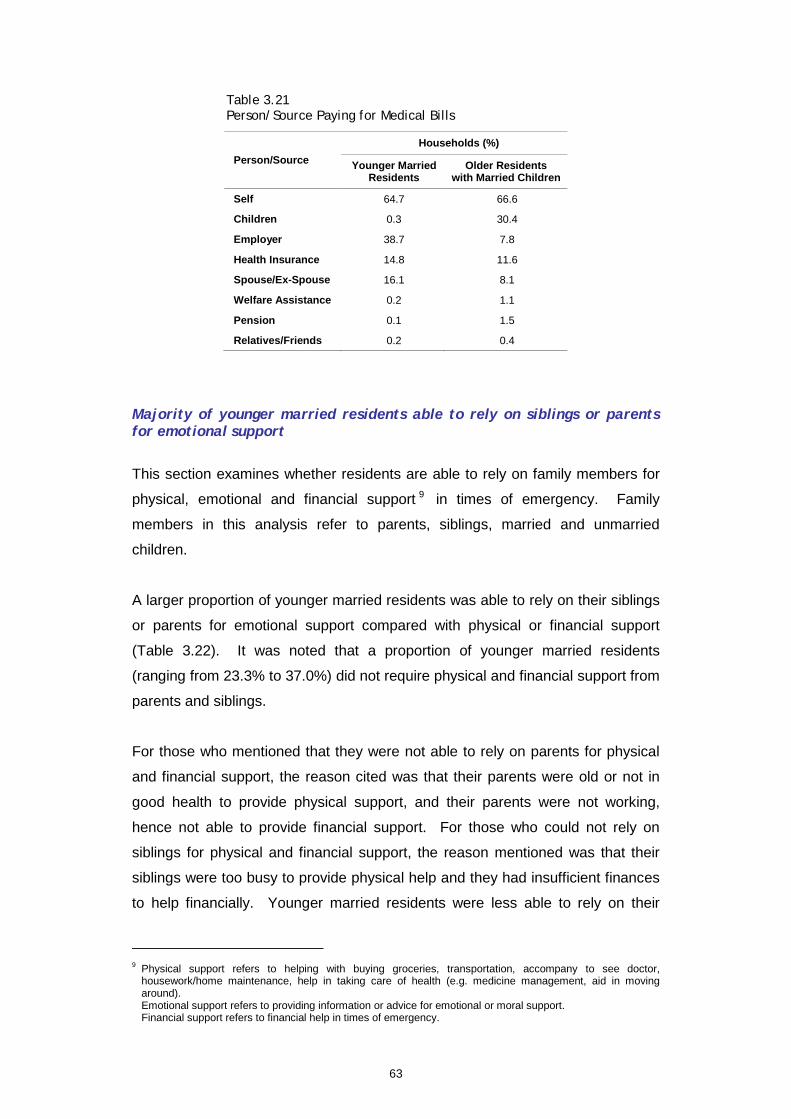
63
Table 3.21 Person/Source Paying for Medical Bills
Person/Source Households (%)
Younger Married Residents
Older Residents with Married Children
Self 64.7 66.6
Children 0.3 30.4
Employer 38.7 7.8
Health Insurance 14.8 11.6
Spouse/Ex-Spouse 16.1 8.1
Welfare Assistance 0.2 1.1
Pension 0.1 1.5
Relatives/Friends 0.2 0.4
Majority of younger married residents able to rely on siblings or parents for emotional support
This section examines whether residents are able to rely on family members for
physical, emotional and financial support 9 in times of emergency. Family
members in this analysis refer to parents, siblings, married and unmarried
children.
A larger proportion of younger married residents was able to rely on their siblings
or parents for emotional support compared with physical or financial support
(Table 3.22). It was noted that a proportion of younger married residents
(ranging from 23.3% to 37.0%) did not require physical and financial support from
parents and siblings.
For those who mentioned that they were not able to rely on parents for physical
and financial support, the reason cited was that their parents were old or not in
good health to provide physical support, and their parents were not working,
hence not able to provide financial support. For those who could not rely on
siblings for physical and financial support, the reason mentioned was that their
siblings were too busy to provide physical help and they had insufficient finances
to help financially. Younger married residents were less able to rely on their
9 Physical support refers to helping with buying groceries, transportation, accompany to see doctor,
housework/home maintenance, help in taking care of health (e.g. medicine management, aid in moving around). Emotional support refers to providing information or advice for emotional or moral support. Financial support refers to financial help in times of emergency.

64
unmarried children for all forms of support, as their children were too young and
still dependent on them for support.
Table 3.22 Younger Married Residents’ Reliance on Family Members for Physical, Emotional and Financial Support
Types of Support Parents Siblings Unmarried Children
Physical Able to rely Not able to rely Do not require support
55.6 21.1 23.3
57.0 14.8 28.2
53.0 40.4 6.6
Total % 100.0 100.0 100.0
N* 271,642 256,181 231,535
Emotional Able to rely Not able to rely Do not require support
79.7 6.3
14.0
81.2 2.2
16.6
51.2 40.9 7.9
Total % 100.0 100.0 100.0
N* 271,642 256,181 231,535
Financial Able to rely Not able to rely Do not require support
44.2 26.1 29.7
55.6 7.4
37.0
17.6 75.2 7.2
Total % 100.0 100.0 100.0
N* 271,494 256,050 231,706
* Excluding non-response cases
Majority of older residents able to rely on children for support
The majority of older residents was able to rely on both their married and
unmarried children for all three forms of support, indicating strong presence of
care and support from children to parents (Table 3.23).
Higher proportion of older residents was not able to rely on parents and
grandchildren for all forms of support. This was mainly due to parents not
working, being too old or not in good health and grandchildren being too young to
provide them with the support required. They could not rely on siblings for
physical and emotional support as well, mainly because their siblings were living
far away from them to render physical help and they were not in close
relationship with their siblings, hence not able to share emotionally. Neither
could they rely on siblings for financial support, as their siblings had insufficient
finances to provide assistance.
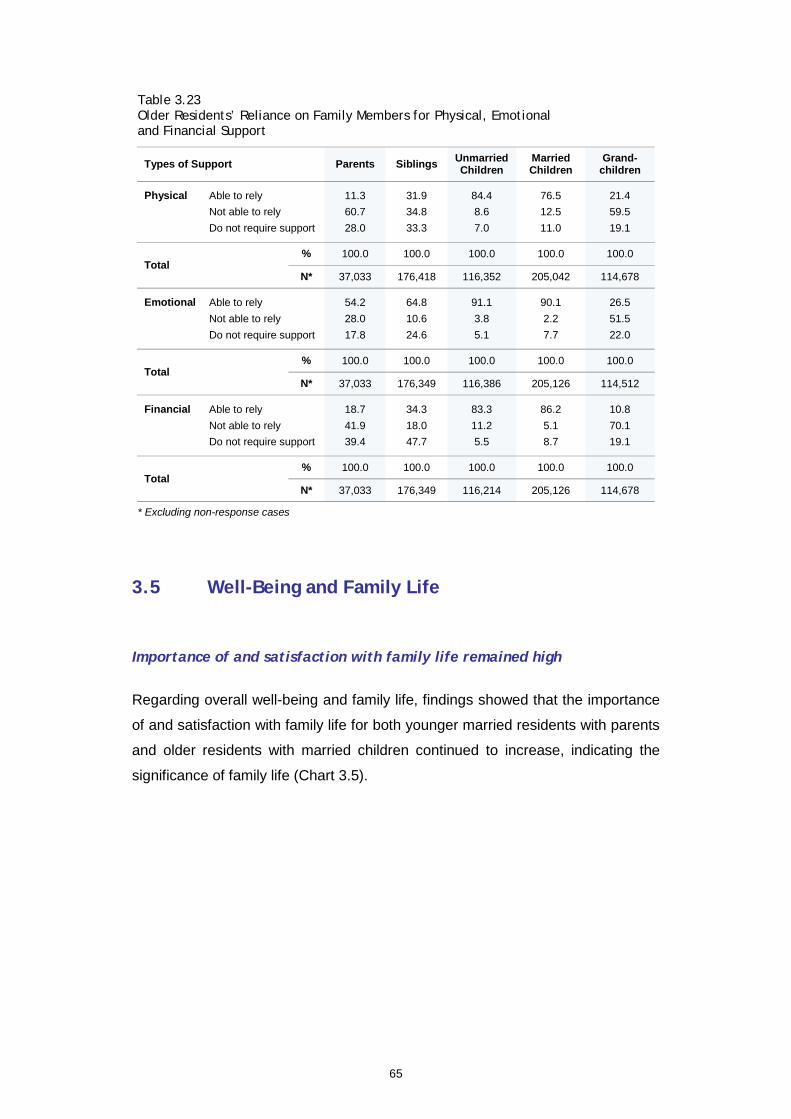
65
Table 3.23 Older Residents’ Reliance on Family Members for Physical, Emotional and Financial Support
Types of Support Parents Siblings Unmarried Children
Married Children
Grand-children
Physical Able to rely Not able to rely Do not require support
11.3 60.7 28.0
31.9 34.8 33.3
84.4 8.6 7.0
76.5 12.5 11.0
21.4 59.5 19.1
Total % 100.0 100.0 100.0 100.0 100.0
N* 37,033 176,418 116,352 205,042 114,678
Emotional Able to rely Not able to rely Do not require support
54.2 28.0 17.8
64.8 10.6 24.6
91.1 3.8 5.1
90.1 2.2 7.7
26.5 51.5 22.0
Total % 100.0 100.0 100.0 100.0 100.0
N* 37,033 176,349 116,386 205,126 114,512
Financial Able to rely Not able to rely Do not require support
18.7 41.9 39.4
34.3 18.0 47.7
83.3 11.2 5.5
86.2 5.1 8.7
10.8 70.1 19.1
Total % 100.0 100.0 100.0 100.0 100.0
N* 37,033 176,349 116,214 205,126 114,678
* Excluding non-response cases
3.5 Well-Being and Family Life
Importance of and satisfaction with family life remained high
Regarding overall well-being and family life, findings showed that the importance
of and satisfaction with family life for both younger married residents with parents
and older residents with married children continued to increase, indicating the
significance of family life (Chart 3.5).
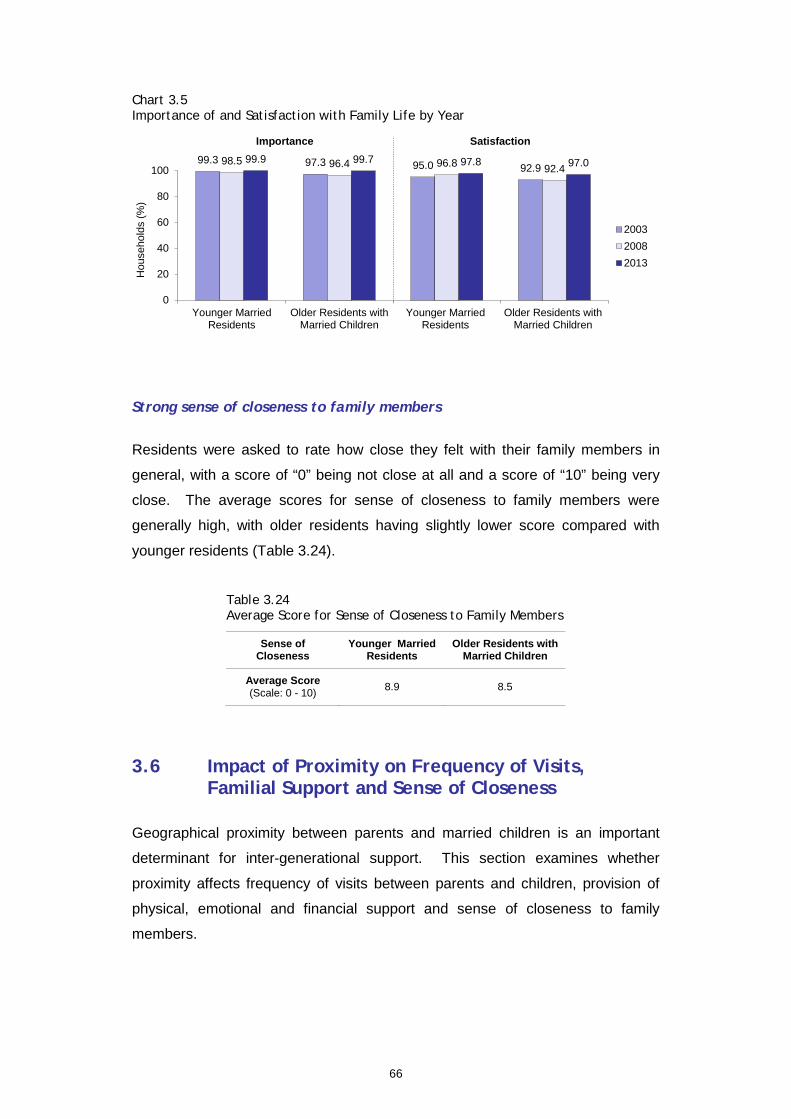
66
Chart 3.5 Importance of and Satisfaction with Family Life by Year
Strong sense of closeness to family members
Residents were asked to rate how close they felt with their family members in
general, with a score of “0” being not close at all and a score of “10” being very
close. The average scores for sense of closeness to family members were
generally high, with older residents having slightly lower score compared with
younger residents (Table 3.24).
Table 3.24 Average Score for Sense of Closeness to Family Members
Sense of Closeness
Younger Married Residents
Older Residents with Married Children
Average Score (Scale: 0 - 10) 8.9 8.5
3.6 Impact of Proximity on Frequency of Visits, Familial Support and Sense of Closeness
Geographical proximity between parents and married children is an important
determinant for inter-generational support. This section examines whether
proximity affects frequency of visits between parents and children, provision of
physical, emotional and financial support and sense of closeness to family
members.
99.3 97.3 95.0 92.9 98.5 96.4 96.8 92.4
99.9 99.7 97.8 97.0
0
20
40
60
80
100
Younger MarriedResidents
Older Residents withMarried Children
Younger MarriedResidents
Older Residents withMarried Children
Hou
seho
lds
(%)
200320082013
Satisfaction Importance

67
Closer proximity encouraged frequent visits between parents and married children
It was found that there was a strong correlation between proximity and frequency
of visits. The nearer the younger married residents lived in relation to their
parents, the higher the proportion visiting one another at least once a week,
especially on a daily basis (Table 3.25). In nearby estates or beyond, frequency
of visits declined as higher proportion of them would tend to visit on a weekly
rather than daily basis.
Table 3.25 Frequency of Visits between Younger Married Residents and their Parents by Proximity
Frequency of Visits Within Close Proximity
In Nearby Estate
Elsewhere in Singapore
Daily 37.2 16.5 11.7
At Least Once a Week 46.7 51.8 51.7
At Least Once a Month 11.2 22.7 24.3
Less Than Once a Month 4.8 9.0 11.3
Never 0.1 - 1.0
Total % 100.0 100.0 100.0
N* 56,714 58,965 112,606
* Excluding those living with parents and non-response cases
A similar pattern was observed for older residents with married children (Table
3.26). These findings indicated that proximity played an important role in
encouraging frequent visits between parents and married children and in
promoting interactions between them. Nonetheless, it was noted that residents
also made use of other modes of communication to interact with family members
besides face-to-face meeting, as shown in Section 3.3.
83.9 68.3 63.4

68
Table 3.26 Frequency of Visits between Older Residents and their Married Children by Proximity
Frequency of Visits Within Close Proximity
In Nearby Estate
Elsewhere in Singapore
Daily 41.9 25.7 15.1
At Least Once a Week 48.6 55.7 51.2
At Least Once a Month 7.3 14.3 18.7
Less Than Once a Month 1.6 4.2 12.0
Never 0.6 0.1 3.0
Total % 100.0 100.0 100.0
N* 43,108 33,850 79,754
* Excluding those living with married children and non-response cases
Closer proximity facilitated physical support between parents and married children
Similarly, a strong correlation was found between proximity and physical support.
It was observed that a higher proportion of younger married residents living
nearer to their parents could rely on them for physical support (Chart 3.6). While
the same pattern was observed for emotional and financial support, proximity
played a less significant role as these forms of support would likely not require
the physical presence of family members for help to be rendered.
In comparison, for financial support in times of emergency, the proportion of
younger married residents who could rely on parents for help was lower, as the
parents were likely to be economically inactive. Nonetheless, it was noted that
when parents lived further away, the possibility of younger married residents
relying on their parents for financial support decreased. However, for younger
married residents with parents living with them, a lower proportion could rely on
parents for financial support in times of emergency as these parents would likely
be relying on their married children for financial support instead.
90.5 81.4 66.3

69
Chart 3.6 Younger Married Residents’ Reliance on Parents for Physical, Emotional and Financial Support by Proximity
For older residents with married children, a comparable relationship was
observed between proximity, physical and emotional support. This was also
similar to the case for younger married residents (Chart 3.7). Parents could be
more reliant on married children for all forms of support as they are likely to be
economically inactive or faced health issues.
Chart 3.7 Older Residents’ Reliance on Married Children for Physical, Emotional and Financial Support by Proximity
However, when younger married residents were asked whether they were able to
provide support to their parents, proximity played a less pronounced role, as
most residents cited that they were able to provide the required forms of support
when needed, regardless of where they were living (Chart 3.8).
40.0
49.6
50.7
39.4
74.8
80.8
82.9
86.8
44.0
57.5
64.0
72.4
0 20 40 60 80 100
Elsewhere inSingapore
In Nearby Estate
Within CloseProximity
In Same Flat
Households (%)
PhysicalEmotionalFinancial
82.7
87.8
89.5
93.1
85.9
92.0
93.2
95.6
71.1
80.6
82.5
88.0
0 20 40 60 80 100
Elsewhere inSingapore
In Nearby Estate
Within CloseProximity
In Same Flat
Households (%)
PhysicalEmotionalFinancial
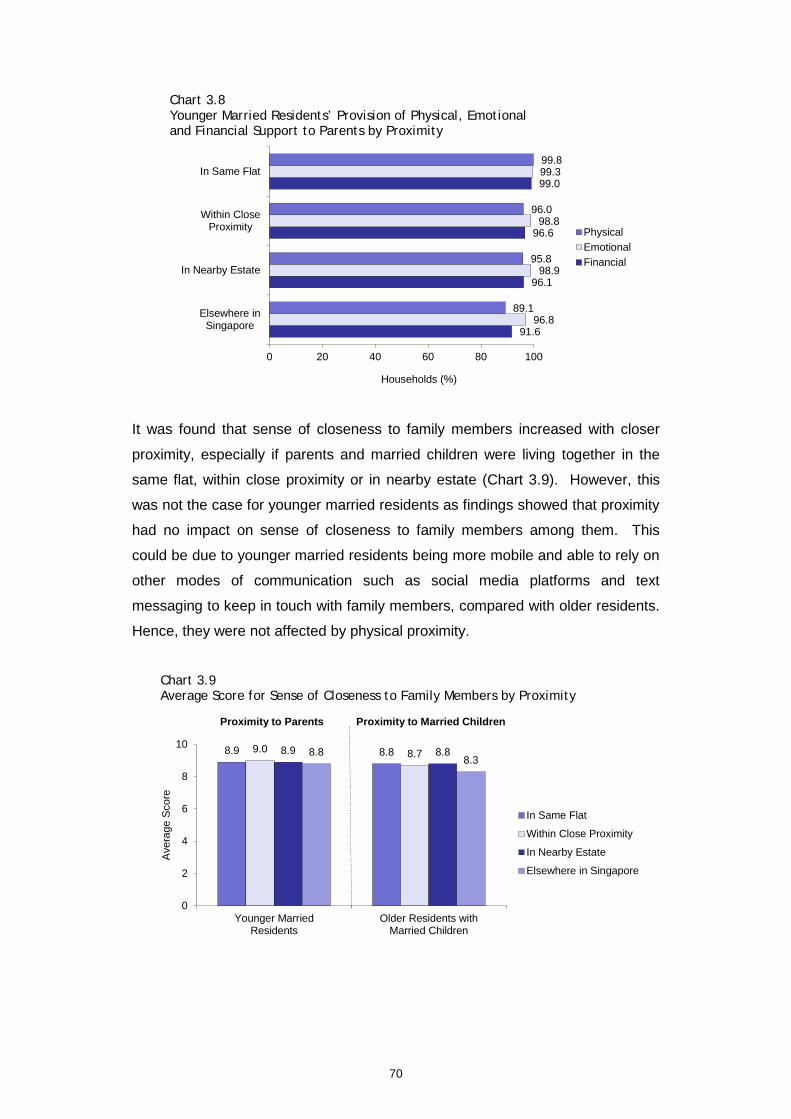
70
Chart 3.8 Younger Married Residents’ Provision of Physical, Emotional and Financial Support to Parents by Proximity
It was found that sense of closeness to family members increased with closer
proximity, especially if parents and married children were living together in the
same flat, within close proximity or in nearby estate (Chart 3.9). However, this
was not the case for younger married residents as findings showed that proximity
had no impact on sense of closeness to family members among them. This
could be due to younger married residents being more mobile and able to rely on
other modes of communication such as social media platforms and text
messaging to keep in touch with family members, compared with older residents.
Hence, they were not affected by physical proximity.
Chart 3.9 Average Score for Sense of Closeness to Family Members by Proximity
91.6
96.1
96.6
99.0
96.8
98.9
98.8
99.3
89.1
95.8
96.0
99.8
0 20 40 60 80 100
Elsewhere inSingapore
In Nearby Estate
Within CloseProximity
In Same Flat
Households (%)
PhysicalEmotionalFinancial
8.9 8.8 9.0 8.7 8.9 8.8 8.8 8.3
0
2
4
6
8
10
Younger MarriedResidents
Older Residents withMarried Children
Ave
rage
Sco
re
In Same Flat
Within Close Proximity
In Nearby Estate
Elsewhere in Singapore
Proximity to Parents Proximity to Married Children
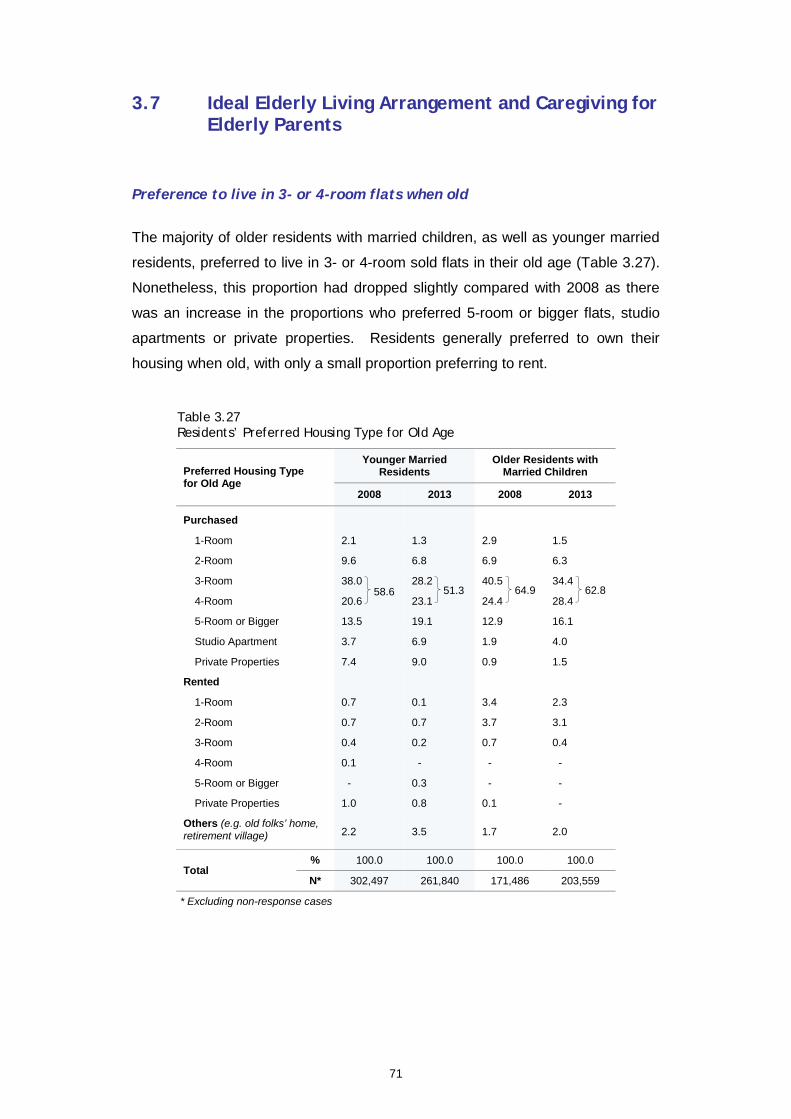
71
3.7 Ideal Elderly Living Arrangement and Caregiving for Elderly Parents
Preference to live in 3- or 4-room flats when old
The majority of older residents with married children, as well as younger married
residents, preferred to live in 3- or 4-room sold flats in their old age (Table 3.27).
Nonetheless, this proportion had dropped slightly compared with 2008 as there
was an increase in the proportions who preferred 5-room or bigger flats, studio
apartments or private properties. Residents generally preferred to own their
housing when old, with only a small proportion preferring to rent.
Table 3.27 Residents’ Preferred Housing Type for Old Age
Preferred Housing Type for Old Age
Younger Married Residents
Older Residents with Married Children
2008 2013 2008 2013
Purchased
1-Room 2.1 1.3 2.9 1.5
2-Room 9.6 6.8 6.9 6.3
3-Room 38.0 28.2 40.5 34.4
4-Room 20.6 23.1 24.4 28.4
5-Room or Bigger 13.5 19.1 12.9 16.1
Studio Apartment 3.7 6.9 1.9 4.0
Private Properties 7.4 9.0 0.9 1.5
Rented
1-Room 0.7 0.1 3.4 2.3
2-Room 0.7 0.7 3.7 3.1
3-Room 0.4 0.2 0.7 0.4
4-Room 0.1 - - -
5-Room or Bigger - 0.3 - -
Private Properties 1.0 0.8 0.1 -
Others (e.g. old folks’ home, retirement village) 2.2 3.5 1.7 2.0
Total % 100.0 100.0 100.0 100.0
N* 302,497 261,840 171,486 203,559
* Excluding non-response cases
51.3 62.8 58.6 64.9

72
Moving in with children the ideal living arrangement when elderly persons unable to live on their own
Residents were asked what they felt would be the ideal elderly living
arrangement when an elderly person was unable to live on his or her own. The
majority of the younger married residents (63.4%) felt that moving in with children,
would be the best option (Chart 3.10). In contrast, although the majority of older
residents (47.0%) also chose to move in with children as the ideal living
arrangement, there were higher proportion of them (35.4%) who felt that living in
their own home with increased care-giving by family members or domestic
helpers, was the ideal arrangement. This reflects a preference to age-in-place.
Chart 3.10 Perceived Ideal Living Arrangement for Elderly Persons Unable to Live on their Own
Majority would take care of parents in their old age regardless of circumstances
To gain insights into residents’ opinions on caregiving for elderly parents,
residents were asked whether they agreed or disagreed to the three statements
as shown in Table 3.28.
Nine in ten of residents agreed with the first statement “I would take care of my
parents in their old age, regardless of circumstances”, indicating the strong
presence of family values among residents, such as filial piety. The proportion
dropped slightly when the condition “if circumstances allowed” is added to the
statement. Close to nine in ten of residents disagreed with the last statement, “I
would leave matters to my parents or to the government”, which revealed a high
sense of responsibility among children.
47.0
63.4
35.4
22.2
5.6
6.4
10.5
7.3
1.5
0.7
0 20 40 60 80 100
Older Residents withMarried Children
Younger MarriedResidents
Households (%)
Move in with children (may hire maids)Live in own home with increased care-giving by family members and/or maidsLive in own home with help from professional support services (e.g. daycare centres)Live in institutions (e.g. nursing home, hospital, old folks' home)Others (e.g. retirement village, move in with other relatives)
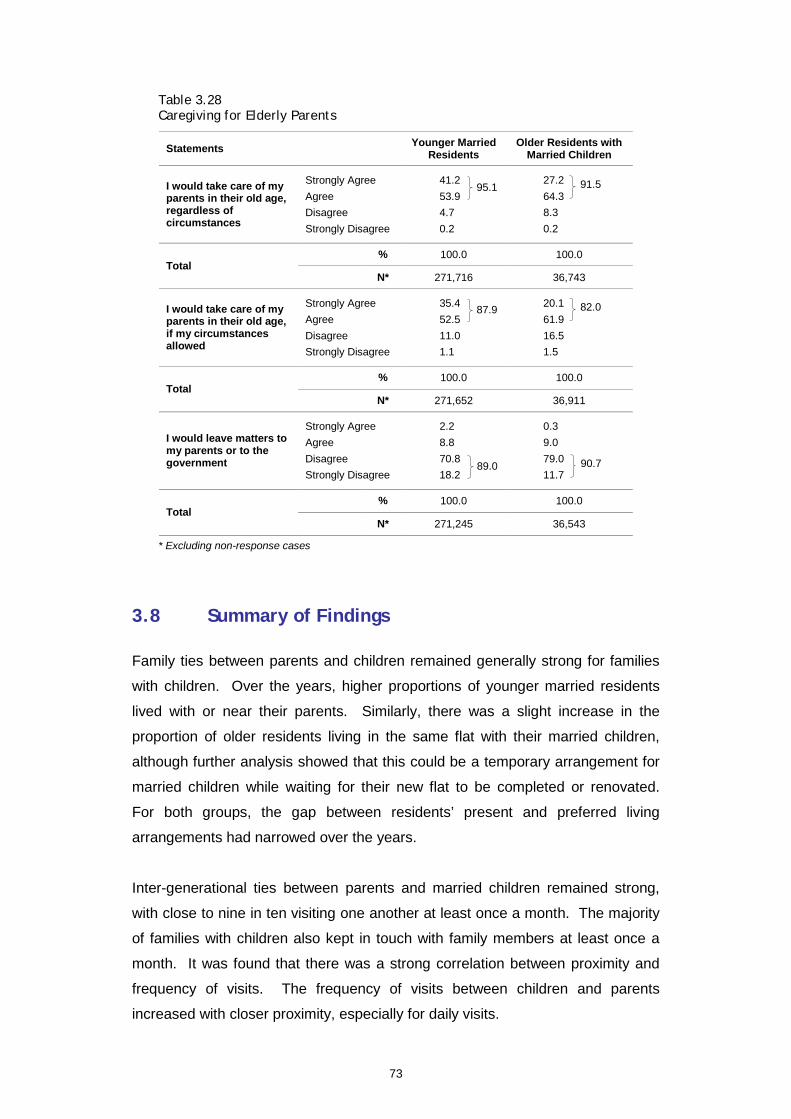
73
Table 3.28 Caregiving for Elderly Parents
Statements Younger Married Residents
Older Residents with Married Children
I would take care of my parents in their old age, regardless of circumstances
Strongly Agree Agree Disagree Strongly Disagree
41.2 53.9 4.7 0.2
27.2 64.3 8.3 0.2
Total % 100.0 100.0
N* 271,716 36,743
I would take care of my parents in their old age, if my circumstances allowed
Strongly Agree Agree Disagree Strongly Disagree
35.4 52.5 11.0 1.1
20.1 61.9 16.5 1.5
Total % 100.0 100.0
N* 271,652 36,911
I would leave matters to my parents or to the government
Strongly Agree Agree Disagree Strongly Disagree
2.2 8.8 70.8 18.2
0.3 9.0 79.0 11.7
Total % 100.0 100.0
N* 271,245 36,543
* Excluding non-response cases
3.8 Summary of Findings
Family ties between parents and children remained generally strong for families
with children. Over the years, higher proportions of younger married residents
lived with or near their parents. Similarly, there was a slight increase in the
proportion of older residents living in the same flat with their married children,
although further analysis showed that this could be a temporary arrangement for
married children while waiting for their new flat to be completed or renovated.
For both groups, the gap between residents’ present and preferred living
arrangements had narrowed over the years.
Inter-generational ties between parents and married children remained strong,
with close to nine in ten visiting one another at least once a month. The majority
of families with children also kept in touch with family members at least once a
month. It was found that there was a strong correlation between proximity and
frequency of visits. The frequency of visits between children and parents
increased with closer proximity, especially for daily visits.
95.1 91.5
87.9 82.0
89.0 90.7
74
Similarly, with regard to reliance on family for support, a higher proportion of
older residents was able to rely on their married children living closer to them for
physical support. This trend was also observed among younger married
residents. However, proximity was a less significant factor for the provision of
emotional and financial support in times of emergency, as these two forms of
support could still be rendered without being physically close by.
The proportion of older residents receiving regular financial support from their
children remained high at 77.7%. Compared with 2008, the average monthly
amount received by one parent, from all his/her children, had increased from
$445 to $552.
The average score for sense of closeness to family members was generally high.
Sense of closeness to family members was found to correlate with proximity
among older residents with married children, as the average scores for sense of
closeness to family members were higher when parents and married children live
nearer to each other. However, sense of closeness was not dependent on
proximity among younger married residents, possibly because they were more
mobile and able to rely on other modes of communication (e.g. social media and
text messaging) to keep in touch with family members.
With regard to ideal living arrangement for elderly persons who could no longer
live on their own, a high proportion of younger married residents felt that the ideal
living arrangement was for elderly persons to move in with their children. In
contrast, more older residents with married children felt that living in their own
home with increased caregiving by family members or domestic workers, was the
ideal arrangement. This reflects older residents’ preference to age-in-place as
they are comfortable and familiar with their existing home.
The majority of residents would take care of their parents regardless of
circumstances, reflecting a strong presence of filial responsibility towards ageing
parents.
4
Well-Being of the Elderly


77
Chapter 4 Well-Being of the Elderly
Introduction
Singapore’s population has been experiencing a rapid increase in ageing due to
increasing life expectancy and declining birth rates and it is projected that there
will be 900,000 elderly citizens by 203010. This would have a significant impact
on the old-age support ratio and the economic growth of Singapore due to
manpower inadequacy.
In the past decades, several committees such as the Committee on Ageing
Issues (CAI) and the Ministerial Committee on Ageing (MCA), set up in 2004 and
2007, respectively, have been formed by the Singapore government to prepare
for an ageing society. It coordinates the efforts by various ministries to provide a
holistic approach towards addressing the challenges and opportunities of
Singapore’s ageing population11. Since the formation of MCA, various initiatives
such as the Wellness Programme and the City for All Ages (CFAA) Project have
been rolled out to various constituencies. In addition, more Senior Activity
Centres (SACs) have been set up near rental flats and studio apartments, while
HDB has also introduced the Enhancement for Active Seniors (EASE)
programme to provide home modification services to flats12.
SHS 2013 findings showed that the proportion of elderly and future elderly
population residing in HDB flats was 11.0% and 13.3%, respectively. Compared
10 January 2013. Population White Paper: A Sustainable Population for a Dynamic Singapore. National
Population and Talent Division. Retrieved on 29 September 2014 (http://www.population.sg/whitepaper/downloads/population-white-paper.pdf).
11 Ministerial Committee on Ageing 2007, Ministerial Committee to Spearhead Successful Ageing for Singapore: Committee will build on strong family ties and enable families to support senior members, Retrieved on 13 October 2014 (http://app.msf.gov.sg/portals/0/summary/pressroom/10-2007.pdf)
12 Ministry of Health: Update on Ministerial Committee on Ageing, Oct 2013, Retrieved on 13 October 2014 (http://www.moh.gov.sg/content/moh_web/home/pressRoom/Parliamentary_QA/2013/update-on-ministerial-committee-on-ageing-.html)

78
with national statistics 13 , there were proportionately more elderly and future
elderly residents residing in HDB flats compared with private housing. Hence, it
is important to keep tabs on the well-being of elderly and future elderly residents
living in HDB towns and estates in terms of their financial well-being, community
involvement and satisfaction with the living environment. This would facilitate the
building of a conducive environment where elderly residents can age comfortably
in their later years.
Objectives
The objectives of this chapter are to examine elderly residents in three main
aspects:
a) Personal aspects in terms of their financial well-being, views on
monetisation and perceived health;
b) Social aspects which comprise their family ties and community bonding;
c) Housing aspects with regard to their satisfaction with the living environment,
usage of estate facilities, housing preferences and preference to age-in-
place.
Framework
As shown in the framework, elderly residents’ well-being is examined through
three main aspects, namely, personal, social and housing. Comparison of
findings on elderly residents are made with all HDB households and future elderly
residents, as well as past SHS findings to provide a more comprehensive picture
of the well-being of elderly residents in HDB estates. The two cohorts are
defined as follows:
Elderly household is defined as one where the head of household is aged 65
years and above. There are presently about 113,294 such households.
Future elderly household is defined as one where the head of household is
aged between 55 to 64 years. There are presently about 144,792 such
households. 13 Population Trends 2013, Singapore Department of Statistics. The national data indicated that 10.5% of
resident population were aged 65 years and above, and 13.1% were those aged between 55 and 64 years.

79
Framework for Well-Being of the Elderly
4.1 Personal Aspects
This section examines the personal well-being of elderly residents by looking at
their current financial situation, financial planning for old age and perceived
health. It is important to monitor such aspects to enable elderly residents to live
comfortably in their later years.
4.1.1 Financial Well-Being
As both life expectancy and cost of living rise, it is inevitable that elderly residents
would require more financial resources for old age. Hence, more financially
vulnerable groups such as elderly residents living alone, those without sufficient
financial support from family members or having insufficient income or assets,
would require greater assistance. This section examines whether elderly
residents have planned financially for their retirement needs, their regular
sources of income, adequacy of resources to meet daily expenses and
preference for various monetisation options.
More future elderly had at least one financial option for retirement needs
Four in ten of elderly residents (40.9%) had taken up at least one financial option
in planning for their retirement needs (Chart 4.1). In comparison, a higher
Well-Being of the Elderly
Future Elderly
55 - 64 Years (N = 144,792)*
Elderly
65 Years & Above (N = 113,294)*
* The figures are based on heads of elderly and future elderly households who responded to the survey
Personal Aspects
Financial Well-being Views on Monetisation Perceived Health
Social Aspects
Family Ties Community
Bonding
Housing Aspects
Satisfaction with Physical Living Environment Satisfaction & Usage of Estate Facilities Residential Mobility & Housing Aspirations Perceptions on Ageing-in-Place
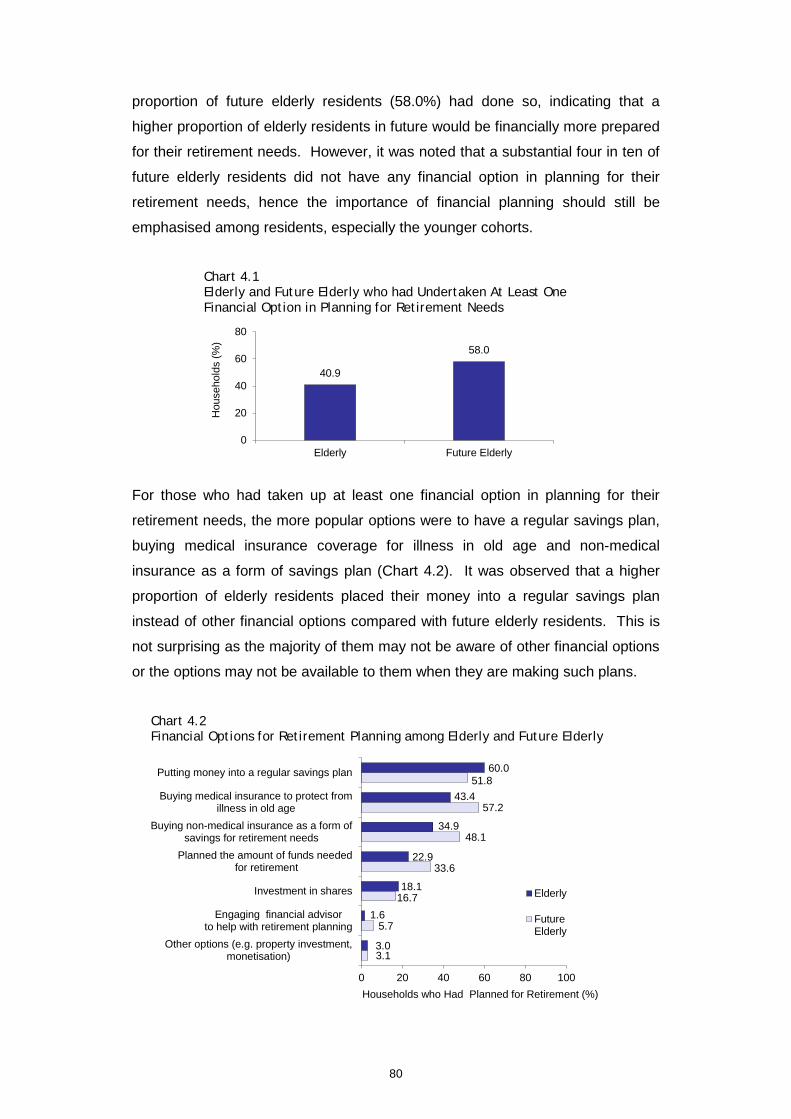
80
proportion of future elderly residents (58.0%) had done so, indicating that a
higher proportion of elderly residents in future would be financially more prepared
for their retirement needs. However, it was noted that a substantial four in ten of
future elderly residents did not have any financial option in planning for their
retirement needs, hence the importance of financial planning should still be
emphasised among residents, especially the younger cohorts.
Chart 4.1 Elderly and Future Elderly who had Undertaken At Least One Financial Option in Planning for Retirement Needs
For those who had taken up at least one financial option in planning for their
retirement needs, the more popular options were to have a regular savings plan,
buying medical insurance coverage for illness in old age and non-medical
insurance as a form of savings plan (Chart 4.2). It was observed that a higher
proportion of elderly residents placed their money into a regular savings plan
instead of other financial options compared with future elderly residents. This is
not surprising as the majority of them may not be aware of other financial options
or the options may not be available to them when they are making such plans.
Chart 4.2 Financial Options for Retirement Planning among Elderly and Future Elderly
40.9
58.0
0
20
40
60
80
Elderly Future Elderly
Hou
seho
lds
(%)
3.1
5.7
16.7
33.6
48.1
57.2
51.8
3.0
1.6
18.1
22.9
34.9
43.4
60.0
0 20 40 60 80 100
Other options (e.g. property investment,monetisation)
Engaging financial advisorto help with retirement planning
Investment in shares
Planned the amount of funds needed for retirement
Buying non-medical insurance as a form ofsavings for retirement needs
Buying medical insurance to protect fromillness in old age
Putting money into a regular savings plan
Households who Had Planned for Retirement (%)
Elderly
FutureElderly

81
Among elderly residents who did not plan financially for retirement, 39.4% of
them cited that they had never thought about it or did not see the need to plan
(Table 4.1). Another 20.5% of elderly residents said that they did not need to
plan as they could rely on their children, spouse or other relatives for financial
needs. Some 16.9% of them also mentioned that they did not know how to plan.
For future elderly residents who did not plan financially, 39.8% of them had not
thought about it or did not see the need to plan, while 25.2% of them cited a lack
of funds to plan for their old age needs.
Table 4.1 Reasons for Not Having Financial Planning for Old Age Needs among Elderly and Future Elderly
Reasons Elderly Future Elderly
Never thought about it/Do not see the need to plan/Too late to plan Depend on children/spouse/other relatives Do not know how to plan Insufficient income to plan Sufficient income at present, no need to plan Rely on pension/government welfare
39.4 20.5 16.9 15.9 6.9 0.4
39.8 7.6 13.2 25.2 12.6 1.6
Total % 100.0 100.0
N* 66,699 60,468
* Excluding non-response cases
Profile analysis showed that higher proportions of elderly and future elderly
residents who did not plan financially were living in rental flats or smaller flat
types. More of them were female or less educated (Table 4.2). This is most
likely due to the fact that residents living in rental flats or smaller flat types have
insufficient income to plan for retirement needs. Elderly females were more likely
to be economically inactive and therefore dependent on their children and spouse
for financial support.

82
Table 4.2 Financial Planning for Retirement Needs among Elderly and Future Elderly by Attributes
Attributes
Elderly Future Elderly
Whether Planned Financially Total Whether Planned
Financially Total
Yes No % N* Yes No % N*
Economic Status
Economically Active Economically Inactive
40.5
41.2 59.5
58.8 100.0
100.0 31,870
81,059 58.9
55.4 41.1
44.6 100.0
100.0 105,136
38,920
Tenure Sold Rental
45.5 11.6
54.5 88.4
100.0 100.0
98,024 15,132
61.8 19.0
38.2 81.0
100.0 100.0
131,615 12,691
Flat Type 1- & 2-Room 3-Room 4-Room 5-Room & Bigger
17.8 36.7 46.7 64.7
82.2 63.3 53.3 35.3
100.0 100.0 100.0 100.0
19,024 42,107 34,356 17,668
20.5 48.3 64.2 73.4
79.5 51.7 35.8 26.6
100.0 100.0 100.0 100.0
14,402 41,198 46,384 42,324
Education Primary & Below** Secondary Post-secondary & Above
29.6
52.0 75.3
70.4
48.0 24.7
100.0
100.0 100.0
66,571
34,407 11,355
40.0
58.6 84.5
60.0
41.4 15.5
100.0
100.0 100.0
45,298
69,723 28,854
Sex Male Female
44.7 35.3
55.3 64.7
100.0 100.0
68,213 44,942
60.5 53.3
39.5 46.7
100.0 100.0
94,025 50,282
* Excluding non-response cases ** Those with no formal education and with primary education are grouped together to ensure sufficient sample
size
Majority of elderly relied on personal savings and financial support from children as regular sources of income
Elderly residents were asked to identify the sources of regular income they
received monthly from a list of possible financial sources. The major sources of
regular income they cited were from their personal savings and financial support
from children (Chart 4.3). Close to seven in ten of future elderly residents had
regular income from employment, higher compared with elderly residents as a
higher proportion of them was economically active. Hence, it was not surprising
that only four in ten of future elderly residents were relying on their children for
regular allowances.

83
Chart 4.3 Regular Financial Sources of Elderly and Future Elderly
The proportion of future elderly residents having two or more regular financial
sources (83.2%) was comparable to elderly residents (81.6%) as shown in Chart
4.4. However, it was noted that a higher proportion of future elderly residents
had three or more regular financial sources (37.0%), compared with elderly
residents (31.3%).
Chart 4.4 Number of Regular Financial Sources of Elderly and Future Elderly
A higher proportion of elderly and future elderly residents living in 4-room or
bigger flats had two or more regular financial sources, compared with those living
in 3-room or smaller flats (Table 4.3). However, there was no significant
difference among genders for both elderly and future elderly residents.
0.4
0.4
0.1
0.1
2.2
2.2
0.7
1.2
3.2
4.3
2.2 9.2
69.6 43.1
78.5
0.9
0.2
0.2
0.3
0.8
1.9
2.0
2.7
2.8
3.1
4.2
17.5
27.7 67.6
79.1
0 20 40 60 80 100
Other sources (e.g. money from friends)
Rental from private property
Lease Buyback Scheme
Rental from commercial properties
Money from spouse
Money from relatives
Welfare assistance
Pensions
Returns from investments
Rental income from subletting of HDB
Annuity
CPF withdrawals
Income from work
Money from children
Draw down savings
Households (%)
Elderly
Future Elderly
17.3
50.3
24.7
6.6 1.1
16.3
46.2
28.3
8.7 0.5
0
20
40
60
80
One Two Three More thanthree
None
Hou
seho
lds
(%)
Elderly
Future Elderly

84
Table 4.3 Number of Financial Resources of Elderly and Future Elderly by Attributes
Attributes
Elderly Future Elderly
No. of Financial Resources Total No. of Financial
Resources Total
One or None
Two or More % N* One or
None Two or More % N*
Flat Type 1- & 2-Room 3-Room 4-Room 5-Room & Bigger
32.8 18.2 14.4 11.0
67.2 81.8 85.6 89.0
100.0 100.0 100.0 100.0
19,048 42,222 34,356 17,668
24.5 20.2 13.9 13.9
75.5 79.8 86.1 86.1
100.0 100.0 100.0 100.0
14,401 41,508 46,445 42,437
Sex Male Female
17.5 19.8
82.5 80.2
100.0 100.0
68,328 44,966
17.5 15.3
82.5 84.7
100.0 100.0
94,491 50,301
* Excluding non-response cases
Majority felt income adequate to meet daily needs albeit declining proportions over past five years
More than seven in ten of elderly and future elderly residents felt that their
sources of income were sufficient to cover their daily expenses (Chart 4.5). This
was a decline from 2008, where eight in ten in both groups felt that their income
was adequate.
Chart 4.5 Adequacy of Sources of Income to Meet Daily Expenses for Elderly and Future Elderly by Year
High cost of living was the main reason cited among elderly residents who felt
that their income was inadequate. Other reasons stated were low income and
high medical costs (Table 4.4). Similar reasons were cited by future elderly
residents.
8.7 4.1 9.1 5.8
71.9 70.8
71.9 67.7
15.4 17.5 13.7 19.6
4.0 7.6 5.3 6.9
0
20
40
60
80
100
2008 2013 2008 2013
Hou
seho
lds
(%)
Usually inadequate
Occasionally inadequate
Adequate
More than adequate
Elderly Future Elderly
80.6 81.0 73.5 74.9
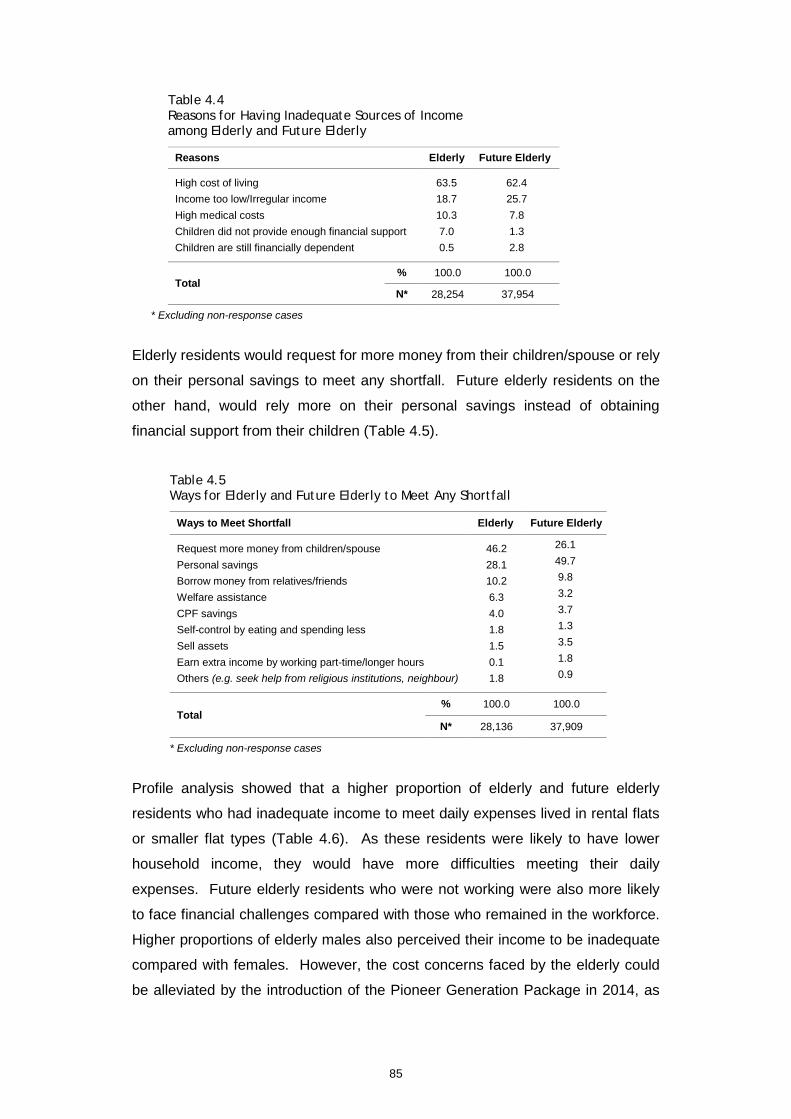
85
Table 4.4 Reasons for Having Inadequate Sources of Income among Elderly and Future Elderly
Reasons Elderly Future Elderly
High cost of living Income too low/Irregular income High medical costs Children did not provide enough financial support Children are still financially dependent
63.5 18.7 10.3 7.0 0.5
62.4 25.7 7.8 1.3 2.8
Total % 100.0 100.0
N* 28,254 37,954
* Excluding non-response cases
Elderly residents would request for more money from their children/spouse or rely
on their personal savings to meet any shortfall. Future elderly residents on the
other hand, would rely more on their personal savings instead of obtaining
financial support from their children (Table 4.5).
Table 4.5 Ways for Elderly and Future Elderly to Meet Any Shortfall
Ways to Meet Shortfall Elderly Future Elderly
Request more money from children/spouse Personal savings Borrow money from relatives/friends Welfare assistance CPF savings Self-control by eating and spending less Sell assets Earn extra income by working part-time/longer hours Others (e.g. seek help from religious institutions, neighbour)
46.2 28.1 10.2 6.3 4.0 1.8 1.5 0.1 1.8
26.1 49.7 9.8 3.2 3.7 1.3 3.5 1.8 0.9
Total % 100.0 100.0
N* 28,136 37,909
* Excluding non-response cases
Profile analysis showed that a higher proportion of elderly and future elderly
residents who had inadequate income to meet daily expenses lived in rental flats
or smaller flat types (Table 4.6). As these residents were likely to have lower
household income, they would have more difficulties meeting their daily
expenses. Future elderly residents who were not working were also more likely
to face financial challenges compared with those who remained in the workforce.
Higher proportions of elderly males also perceived their income to be inadequate
compared with females. However, the cost concerns faced by the elderly could
be alleviated by the introduction of the Pioneer Generation Package in 2014, as

86
they will now benefit from extra subsidies for Medisheld Life and outpatient
treatment, as well as annual Medisave top-ups.
Table 4.6 Adequacy of Sources of Income for Elderly and Future Elderly by Attributes
Attributes
Elderly Future Elderly
Adequacy of Income Total Adequacy
of Income Total
Yes No % N* Yes No % N*
Economic Status
Economically Active Economically Inactive
76.2
74.3 23.8
25.7 100.0
100.0 31,496
80,717 75.0
69.5 25.0
30.5 100.0
100.0 104,674
38,646
Tenure Sold Rental
77.4 58.9
22.6 41.1
100.0 100.0
97,324 15,116
75.9 48.8
24.1 51.2
100.0 100.0
130,879 12,691
Flat Type 1- & 2-Room 3-Room 4-Room 5-Room & Bigger
61.2 72.7 77.6 89.5
38.8 27.3 22.4 10.5
100.0 100.0 100.0 100.0
19,032 41,948 33,905 17,554
51.7 73.4 75.4 79.1
48.3 26.6 24.6 20.9
100.0 100.0 100.0 100.0
14,402 41,030 46,278 41,861
Sex Male Female
73.2 77.5
26.8 22.5
100.0 100.0
67,952 44,487
73.1 74.4
26.9 25.6
100.0 100.0
93,270 50,301
* Excluding non-response cases
Majority of elderly did not take up any monetisation option after turning 50 years old
As the majority of elderly and future elderly residents are homeowners, their HDB
flat is an important monetary asset. To help them unlock the value of their flat,
HDB has in place various monetisation options for elderly residents to
supplement their retirement income if necessary. The different options available
are subletting of whole flat or one or more room(s), right-sizing to HDB Studio
Apartment or a smaller flat, cashing out and living with children or other family
members or renting a flat/room, and applying for the Enhanced Lease Buyback
Scheme (LBS)14.
14 The Enhanced Lease Buyback Scheme (LBS) is an additional monetisation option to help low-income elderly
flat owners living in 3-room and smaller flats to unlock part of their housing equity while continuing to live in their homes, and receive a lifelong income stream to supplement their retirement income. Under the Enhanced LBS, the elderly flat owners sell part of their flat lease to HDB and retain a 30-year lease. Their proceeds from selling part of the flat lease will be used to top up their CPF Retirement Accounts (RAs). Eligible flat owners will use their full CPF RA savings to purchase a CPF LIFE plan to give them a monthly income for life. Each household will receive a LBS cash bonus of up to $20,000. Enhanced LBS is available to those who meet the following criteria: - Age of youngest lessee is CPF Draw-Down Age (currently 63 years) or older; - At least one owner is a Singapore citizen - Household income of $3,000 or less; - No concurrent ownership of second property; - Have lived in existing flat for 5 years or more. From 1 Apr 2015, the LBS will be extended to elderly flat owners living in 4-room flat as well, and the income ceiling will be raised from $3,000 to $10,000. All other eligibility criteria remain the same.

87
A question in SHS 2013 was asked on whether elderly and future elderly
residents had taken any monetisation options after turning 50 years old. Before
turning 50 years old, any transactions made on the flat (e.g. cashing out, right-
sizing, subletting) would not be regarded as monetisation as they could be for
other purposes such as meeting one’s aspirations. Given that the minimum age
criteria for purchasing a studio apartment is 55 years old, a cut-off age of 50
years old was used. This is five years prior to 55 years old and in this timeframe,
residents would have sufficient time to decide whether to exercise any
monetisation options for retirement needs.
It was found that 11.8% of elderly residents and 11.0% of future elderly residents
had taken up at least one monetisation option after turning 50 years old. The
most popular option chosen by those who had opted to monetise was subletting
of rooms. Other popular options included right-sizing to a smaller resale HDB flat
or a smaller new HDB flat (Chart 4.6).
Chart 4.6 Monetisation Options Taken after 50 Years Old among Elderly and Future Elderly
5.8
2.4
0.2
3.0
0.7
0.3
10.5
7.2
24.6
54.3
2.7
0.9
1.2
2.6
3.2
3.8
5.3
11.1
11.9
30.4
37.1
0 20 40 60 80 100
Others (e.g. SERS,sublet private property)
Moved from private propertyto Studio Apartment
Moved from private propertyto new HDB flat
Sublet whole flat
Sold HDB/private property andrented whole HDB flat
Sold HDB flat/private property andmoved in with relatives
Lease Buyback Scheme
Moved from HDB flatto Studio Apartment
Moved to smaller new HDB flat
Moved from private propertyto resale HDB flat
Moved to smaller resale HDB flat
Sublet of room(s)
Households who Had Taken At Least One Monetisation Option (%)
Elderly
FutureElderly

88
Analysis by flat type showed that higher proportions of elderly residents living in
3- and 4-room flats had taken at least one monetisation option after turning 50
years old. For future elderly residents, close to one in five living in 3-room flats
had taken at least one monetisation option after turning 50 years old (Chart 4.7).
Chart 4.7 Whether Monetised after Turning 50 Years Old for Elderly and Future Elderly by Flat Type
* Excluding non-response cases
When asked whether they would consider monetising in the next five years,
82.5% of elderly residents and 76.4% of future elderly residents indicated they
would not do so (Chart 4.8). For those who had no intention to monetise, most
would rely on children or other family members if they were to encounter major
financial difficulties, such as not being able to work or having insufficient savings
(Table 4.7). For those who intended to monetise in the next five years, the most
common option was to sublet rooms (Table 4.8).
Chart 4.8 Intention to Monetise in the Next Five Years among Elderly and Future Elderly
* Excluding residents living in rental flats and non-response cases
6.8 15.0 12.2 8.6 1.3 18.9 9.6 8.2
93.2 85.0 87.8 91.4 98.7 81.1 90.4 91.8
0
20
40
60
80
100
1- & 2-Room
3-Room 4-Room 5-Room& Bigger
1- & 2-Room
3-Room 4-Room 5-Room& Bigger
Hou
seho
lds
(%)
No
Yes
17.5 23.6
82.5 76.4
0
20
40
60
80
100
Elderly Future Elderly
Hou
seho
lds
(%)
No
Yes
Future Elderly Elderly
(N= 97,922) (N= 130,843)

89
Table 4.7 Options among Elderly and Future Elderly Who Had No Intention to Monetise in the Next Five Years When They Encounter Major Financial Difficulties
Options in the Event of Major Financial Difficulties Elderly Future Elderly
Rely on children/family members Have sufficient savings/assets in the event of financial difficulties Rely on public assistance Have not thought about it Borrow from friends Others (e.g. move overseas)
90.3 4.1 4.0 1.2 0.3 0.1
82.6 4.8 9.7 1.3 1.1 0.5
Total % 100.0 100.0
N* 80,013 97,230
* Excluding residents living in rental flats and non-response cases
Table 4.8 Preferred Monetisation Options among Elderly and Future Elderly Who Intended to Monetise in the Next Five Years
Monetisation Options Elderly Future Elderly
Sublet room(s) Sell flat and move to smaller flat Sell flat and move to Studio Apartment Sublet whole flat Lease Buyback Scheme Sell flat and move in with children/relatives Sell flat and move to rental flat/rent room(s) Others (e.g. sell flat and move to cheaper flat of same size, SERS/En bloc)
55.0 12.2 8.9 8.2
7.7 4.2 0.6 3.2
43.9 28.0 13.3 5.4 5.0 2.1 1.4 0.9
Total % 100.0 100.0
N* 17,099 30,883
* Excluding residents living in rental flats and non-response cases
Analysis by flat type showed that a higher proportion of elderly residents living in
4-room and smaller flats intended to monetise in the next five years. For future
elderly residents, close to one in three living in 3-room and smaller flats intended
to do so in the next five years (Chart 4.9).

90
Chart 4.9 Intention to Monetise in the Next Five Years among Elderly and Future Elderly by Flat Type
* Excluding residents living in rental flats and non-response cases ** 1- to 3-room flats are grouped together to ensure sufficient sample size
4.1.2 Perceived Level of Health
Most elderly and future elderly perceived themselves as healthy Elderly and future elderly residents were asked to rate their general health on a
five-point scale ranging from ‘Very Good’ to ‘Very Poor’. The majority of elderly
and future elderly residents perceived their health to be very good, good or fair
(Chart 4.10). The proportion of future elderly residents who perceived
themselves as being healthy was also slightly higher compared with 2008.
Chart 4.10 Perceived General Health of Elderly and Future Elderly by Year
For elderly and future elderly residents who perceived their health to be poor or
very poor, higher proportions of them were economically inactive, living in rental
flats or smaller flat types or with lower levels of education (Table 4.9). For future
elderly residents, a higher proportion of females perceived their health to be poor
19.0 19.0 10.5 31.4
18.5 21.3
81.0 81.0 89.5 68.6
81.5 78.7
0
20
40
60
80
100
3-Room& Smaller
4-Room 5-Room& Bigger
3-Room& Smaller
4-Room 5-Room& Bigger
Hou
seho
lds
(%)
NoYes
8.9 6.0 13.6 7.7
46.9 48.8 47.7 60.0
33.2 35.4 31.6 26.5
9.9 9.0 6.0 5.3 1.1 0.8 1.1 0.5
0
20
40
60
80
100
2008 2013 2008 2013
Hou
seho
lds
(%)
Very PoorPoorFairGoodVery Good
Future Elderly Elderly
94.2 92.9 90.2 89.0
Elderly Future Elderly

91
compared with males. There was no difference in perception of their health
between genders among elderly residents.
Table 4.9 Perceived General Health of Elderly and Future Elderly by Attributes
Attributes
Elderly Future Elderly
Perception of Health Total Perception
of Health Total
Very Good/ Good/ Fair
Poor/ Very Poor
% N* Very
Good/ Good /Fair
Poor/ Very Poor
% N*
Economic Status
Economically Active Economically Inactive
94.5
88.4 5.5
11.6 100.0
100.0 31,773
80,836 95.3
91.5 4.7
8.5 100.0
100.0 104,860
38,982
Tenure Sold Rental
91.7 80.1
8.3 19.9
100.0 100.0
97,703 15,132
94.9 87.8
5.1 12.2
100.0 100.0
131,402 12,691
Flat Type 1- & 2-Room 3-Room 4-Room 5- Room & Bigger
80.6 90.5 91.8 96.3
19.4 9.5 8.2 3.7
100.0 100.0 100.0 100.0
19,048 41,986 34,133 17,668
88.6 92.1 94.9 97.6
11.4 7.9 5.1 2.4
100.0 100.0 100.0 100.0
14,402 41,213 46,315 42,163
Education Primary & Below** Secondary Post-secondary & Above
87.1
92.9 98.7
12.9
7.1 1.3
100.0
100.0 100.0
66,262
34,396 11,355
90.7
94.6 98.8
9.3
5.4 1.2
100.0
100.0 100.0
45,356
69,614 28,691
Sex Male Female
90.8 89.1
9.2 10.9
100.0 100.0
67,869 44,966
96.3 90.5
3.7 9.5
100.0 100.0
93,792 50,301
* Excluding non-response cases ** Those with no formal education and with primary education are grouped together to ensure sufficient
sample size
4.2 Social Aspects
As seen from the findings on family ties, frequent interactions and regular support
from family members are vital in maintaining the positive well-being of elderly
residents. It is also important to examine elderly residents’ interactions with their
neighbours and participation in activities, to ascertain the level of support they
can obtain from the wider community. The following sections examine family ties
and community bonding as indicators of social well-being of elderly residents in
HDB estates.

92
4.2.1 Family Ties
In Chapter 3, the family ties between parents and children are examined. This
section examines more specifically the family ties of elderly residents aged 65
years and above, as well as future elderly residents aged 55 to 64 years old. The
strength of family ties is examined by looking at elderly and future elderly
residents’ living arrangements in relation to their children, depth of interaction and
support, sense of closeness to family members and caregiving for elderly parents.
More elderly preferred to live with or within close proximity to married children
Out of a total of 113,294 elderly households, 76.1% had married children.
Among those with married children, the proportion of elderly residents who lived
in the same flat with their married child had increased from 12.0% in 2008 to
17.3% in 2013 (Table 4.10). However, their preference to do so was lower than
their present living arrangement. As mentioned in the chapter on Family Ties,
the increase could be attributed to the married children living temporarily with
their parents while waiting for their new flat to be ready. The proportion who
were currently living elsewhere in relation to their married children had also
increased from 2008.
Looking at their preferred living arrangement over time, the proportion of elderly
residents who preferred to live in the same flat or within close proximity15 to their
married children continued to decline from 69.1% in 2003 to 53.5% in 2008 and
48.8% in 2013. Correspondingly, there was increasing preference for married
children to live elsewhere (17.2% in 2003 to 23.8% in 2008 and 35.5% in 2013).
The preference to live elsewhere could possibly be attributed to a more
comprehensive transport network, enabling elderly residents and their children to
enjoy greater ease in meeting up.
15 Living “within close proximity” to their married children is defined as living together, next door, in the same
block, in a nearby block, and in the same estate as their married children.

93
Table 4.10 Present and Preferred Physical Living Arrangements of Elderly vis-à-vis their Married Children by Year
Physical Living Arrangement
2003 2008 2013
Present Preferred Present Preferred Present Preferred
In the Same Flat 7.6 16.2 12.0 13.3 17.3 16.9
Next Door 2.0 3.9 1.5 2.9 1.0 1.4
In the Same Block 5.0 11.0 3.4 7.0 3.0 4.8
In a Nearby Block 16.6 19.6 11.7 14.7 9.4 12.9
In the Same Estate 12.0 18.4 11.6 15.6 10.1 12.8
In a Nearby Estate 17.8 13.7 24.6 22.7 13.8 15.7
Elsewhere (includes overseas)
39.0 17.2 35.2 23.8 45.4 35.5
Total % 100.0 100.0 100.0 100.0 100.0 100.0
N* 53,357 53,357 74,593 74,187 84,024 84,024
* Excluding non-response cases
For future elderly residents, 42.4% of the 144,792 households had married
children. Among those with married children, about 36.7% lived in the same flat
or within close proximity to their nearest married child. This proportion was
comparable to 2008 (Table 4.11). Similar to the trend observed for elderly
residents, the proportion living in the same flat had increased compared with
2008, while the preference to do so was lower than their present living
arrangement. In contrast to elderly residents, a slightly higher proportion of
future elderly residents was living in nearby estates to their married children
compared with 2008.
Looking at preferred living arrangement of future elderly residents, those who
preferred to live in the same flat or within close proximity to their married children
had decreased from 52.2% in 2008 to 46.3% in 2013. These findings were
similar to those of elderly residents.
However, it was also observed that among both elderly and future elderly
residents, a much higher proportion would still prefer their married children to live
in closer proximity, compared with their present living arrangement. Hence, more
housing schemes are now available16 to encourage married children and parents
to live nearer to one another for mutual care and support.
16 The existing schemes to encourage parents and children to live near each other include the Multi-Generation
Priority Scheme (MGPS), Married Child Priority Scheme (MCPS), Studio Apartment Priority Scheme (SAPS) and CPF Housing Grant for Family. In September 2013, 3-Generation Family Flats (3GEN) were also introduced to enable multi-generation families to live under one roof.
43.2 69.1 40.2 53.5 40.8 48.8

94
Table 4.11 Present and Preferred Physical Living Arrangements of Future Elderly vis-à-vis their Married Children by Year
Physical Living Arrangement 2008 2013
Present Preferred Present Preferred
In the Same Flat 15.5 14.1 19.5 16.2
Next Door 0.0 2.1 0.2 1.2
In the Same Block 1.1 3.4 0.8 2.2
In a Nearby Block 9.9 16.8 5.9 10.0
In the Same Estate 10.8 15.8 10.3 16.7
In a Nearby Estate 17.3 16.9 20.2 20.7
Elsewhere (includes overseas) 45.4 30.9 43.1 33.0
Total % 100.0 100.0 100.0 100.0
N* 56,884 56,870 58,819 58,819
* Excluding non-response cases
Preference to live with spouse and/or unmarried children among elderly mirrored current living arrangement
Close to six in ten (58.3%) of elderly residents lived with their spouse and/or
unmarried children, which was comparable to previous years (Table 4.12).
Another 12.7% of them lived with their married children and close to one in four
were living alone (23.1%).
The proportion of elderly residents who lived alone had increased from 19.3% in
2008 to 23.1% in 2013. Their preference to do so had also increased from
18.0% in 2008 to 22.5% in 2013. Further analysis on the profile of elderly
residents living alone showed that most of them were female (68.0%) or widowed
(53.4%). Their socio-economic profiles revealed that 77.4% of them were
economically inactive, 76.9% lived in 3-room or smaller flats, and 67.9% had
primary or lower levels of education.
The present and preferred social living arrangement of elderly residents matched
quite closely. Close to six in ten of elderly residents (59.8%) also preferred to live
with their spouse and/or unmarried children, comparable to 59.6% in 2008. With
regard to living with married children, the gap had narrowed as increasing
proportions were living with married children while preference to do so continued
to decline to 12.3% in 2013, from 14.6% in 2008. The proportion that was living
37.3 52.2 36.7 46.3

95
with unrelated persons had decreased, from 9.3% in 2008 to 2.2% in 2013, which
mirrored their preference.
Table 4.12 Present and Preferred Social Living Arrangements of Elderly by Year
Social Living Arrangement 2003 2008 2013
Present Preferred Present Preferred Present Preferred
Live with Spouse and/or Unmarried Children 63.8 52.6 60.3 59.6 58.3 59.8
Live with Married Children 7.2 16.5 10.9 14.6 12.7 12.3
Live with Siblings/Relatives 3.8 5.4 0.2 0.3 3.7 3.8
Live Alone 21.1 24.3 19.3 18.0 23.1 22.5
Live with Unrelated Persons 4.1 1.2 9.3 7.5 2.2 1.6
Total % 100.0 100.0 100.0 100.0 100.0 100.0
N* 66,722 66,722 92,817 92,760 113,294 113,075
* Excluding non-response cases
In comparison with elderly residents, there was a higher proportion of future
elderly residents who lived with their spouse and/or unmarried children as their
children were likely to be younger (Table 4.13). The proportion living with
married children and preferred to do so was lower compared with elderly
residents. There was also a lower proportion of future elderly residents who lived
alone, possibly because fewer were widowed compared with elderly residents.
However, similar to the trends observed for elderly residents, the proportion of
future elderly residents living alone had increased from 8.6% in 2008 to 14.5% in
2013. The proportion of those living with unrelated persons had also decreased
from 7.2% in 2008 to 1.9% in 2013. Hence, future elderly residents’ preferred
living arrangement mirrored their present living arrangement.
Table 4.13 Present and Preferred Social Living Arrangements of Future Elderly by Year
Social Living Arrangement 2008 2013
Present Preferred Present Preferred
Live with Spouse and/or Unmarried Children 77.1 75.5 73.1 73.7
Live with Married Children 6.5 7.4 7.2 7.1
Live with Siblings/Relatives 0.6 0.7 3.3 3.5
Live Alone 8.6 9.0 14.5 14.3
Live with Unrelated Persons 7.2 7.4 1.9 1.4
Total % 100.0 100.0 100.0 100.0
N* 129,397 129,331 144,792 144,534
* Excluding non-response cases
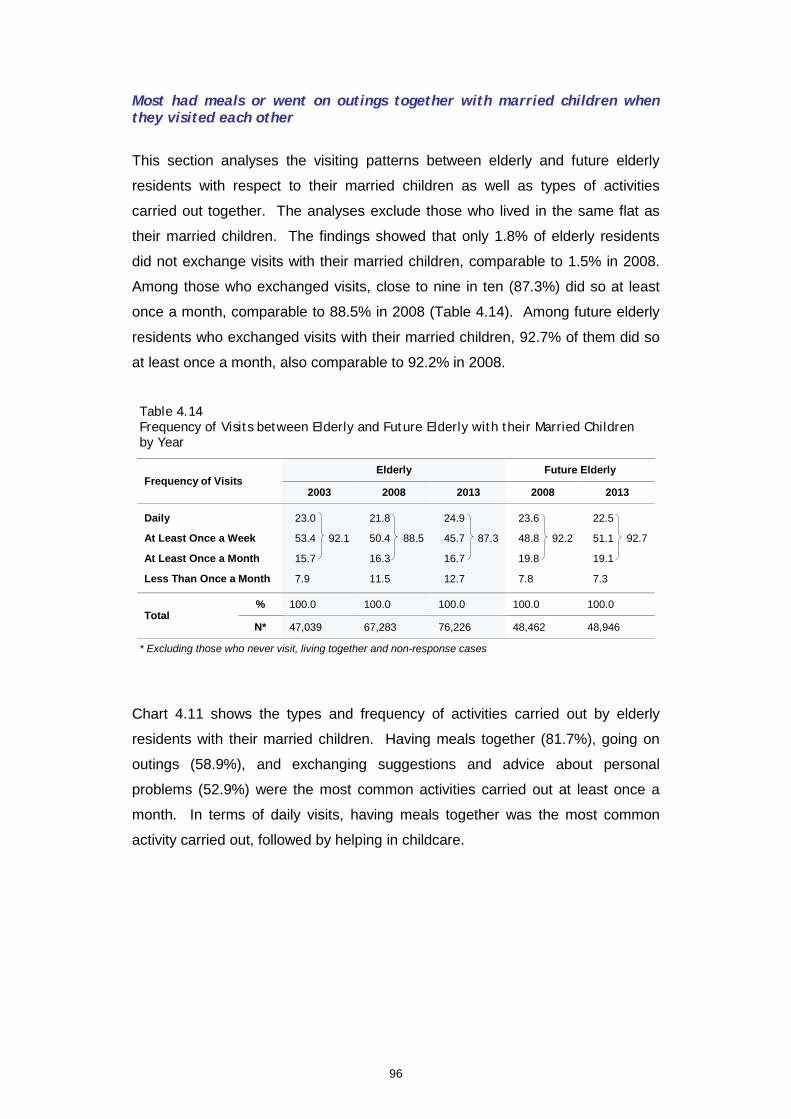
96
Most had meals or went on outings together with married children when they visited each other
This section analyses the visiting patterns between elderly and future elderly
residents with respect to their married children as well as types of activities
carried out together. The analyses exclude those who lived in the same flat as
their married children. The findings showed that only 1.8% of elderly residents
did not exchange visits with their married children, comparable to 1.5% in 2008.
Among those who exchanged visits, close to nine in ten (87.3%) did so at least
once a month, comparable to 88.5% in 2008 (Table 4.14). Among future elderly
residents who exchanged visits with their married children, 92.7% of them did so
at least once a month, also comparable to 92.2% in 2008.
Table 4.14 Frequency of Visits between Elderly and Future Elderly with their Married Children by Year
Frequency of Visits Elderly Future Elderly
2003 2008 2013 2008 2013
Daily 23.0 21.8 24.9 23.6 22.5
At Least Once a Week 53.4 92.1 50.4 88.5 45.7 87.3 48.8 92.2 51.1 92.7
At Least Once a Month 15.7 16.3 16.7 19.8 19.1
Less Than Once a Month 7.9 11.5 12.7 7.8 7.3
Total % 100.0 100.0 100.0 100.0 100.0
N* 47,039 67,283 76,226 48,462 48,946
* Excluding those who never visit, living together and non-response cases
Chart 4.11 shows the types and frequency of activities carried out by elderly
residents with their married children. Having meals together (81.7%), going on
outings (58.9%), and exchanging suggestions and advice about personal
problems (52.9%) were the most common activities carried out at least once a
month. In terms of daily visits, having meals together was the most common
activity carried out, followed by helping in childcare.
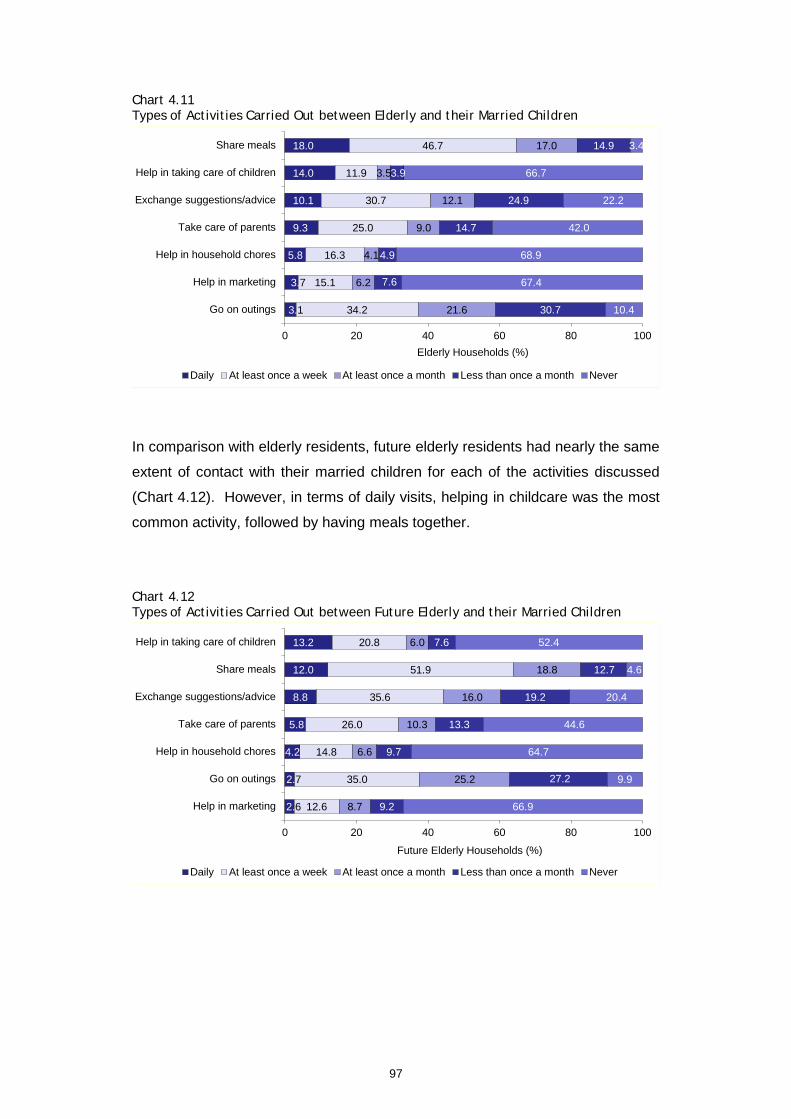
97
Chart 4.11 Types of Activities Carried Out between Elderly and their Married Children
In comparison with elderly residents, future elderly residents had nearly the same
extent of contact with their married children for each of the activities discussed
(Chart 4.12). However, in terms of daily visits, helping in childcare was the most
common activity, followed by having meals together.
Chart 4.12 Types of Activities Carried Out between Future Elderly and their Married Children
3.1
3.7
5.8
9.3
10.1
14.0
18.0
34.2
15.1
16.3
25.0
30.7
11.9
46.7
21.6
6.2
4.1
9.0
12.1
3.5
17.0
30.7
7.6
4.9
14.7
24.9
3.9
14.9
10.4
67.4
68.9
42.0
22.2
66.7
3.4
0 20 40 60 80 100
Go on outings
Help in marketing
Help in household chores
Take care of parents
Exchange suggestions/advice
Help in taking care of children
Share meals
Elderly Households (%)
Daily At least once a week At least once a month Less than once a month Never
2.6
2.7
4.2
5.8
8.8
12.0
13.2
12.6
35.0
14.8
26.0
35.6
51.9
20.8
8.7
25.2
6.6
10.3
16.0
18.8
6.0
9.2
27.2
9.7
13.3
19.2
12.7
7.6
66.9
9.9
64.7
44.6
20.4
4.6
52.4
0 20 40 60 80 100
Help in marketing
Go on outings
Help in household chores
Take care of parents
Exchange suggestions/advice
Share meals
Help in taking care of children
Future Elderly Households (%)
Daily At least once a week At least once a month Less than once a month Never

98
Majority could rely on children for physical, emotional and financial support
This section looks at the extent of support between children and older residents.
As mentioned in the chapter on Family Ties, in addition to assessing whether
elderly residents receive regular financial contributions from their children, it also
examines for the first time whether family members provide physical, emotional
and financial support17 to one another.
About three in four of both elderly and future elderly residents could rely on their
married children for physical support, and about nine in ten could rely on both
married and unmarried children for emotional support (Tables 4.15 and 4.16). As
higher proportions of elderly and future elderly residents were living with their
unmarried children, slightly higher proportions mentioned that they could rely on
them for physical support compared with married children.
Table 4.15 Elderly Residents’ Reliance on Children for Physical, Emotional and Financial Support
Types of Support Married Children
Unmarried Children
Physical Support
Able to rely Not able to rely Do not require support
76.4 12.6 11.0
81.5 11.4 7.1
Total % 100.0 100.0
N* 84,034 51,320
Emotional Support
Able to rely Not able to rely Do not require support
87.1 3.2 9.7
88.8 5.5 5.7
Total % 100.0 100.0
N* 84,118 51,320
Financial Support in Times of Emergency
Able to rely Not able to rely Do not require support
86.8 4.6 8.6
86.7 8.1 5.2
Total % 100.0 100.0
N* 84,118 51,320
* Excluding non-response cases
17 Physical support refers to helping with buying groceries, transportation, escorting to see doctor,
housework/home maintenance, helping in taking care of health (e.g. medicine management, aid in moving around).
Emotional support refers to providing information/advice or moral support. Financial support refers to financial help in times of emergency.
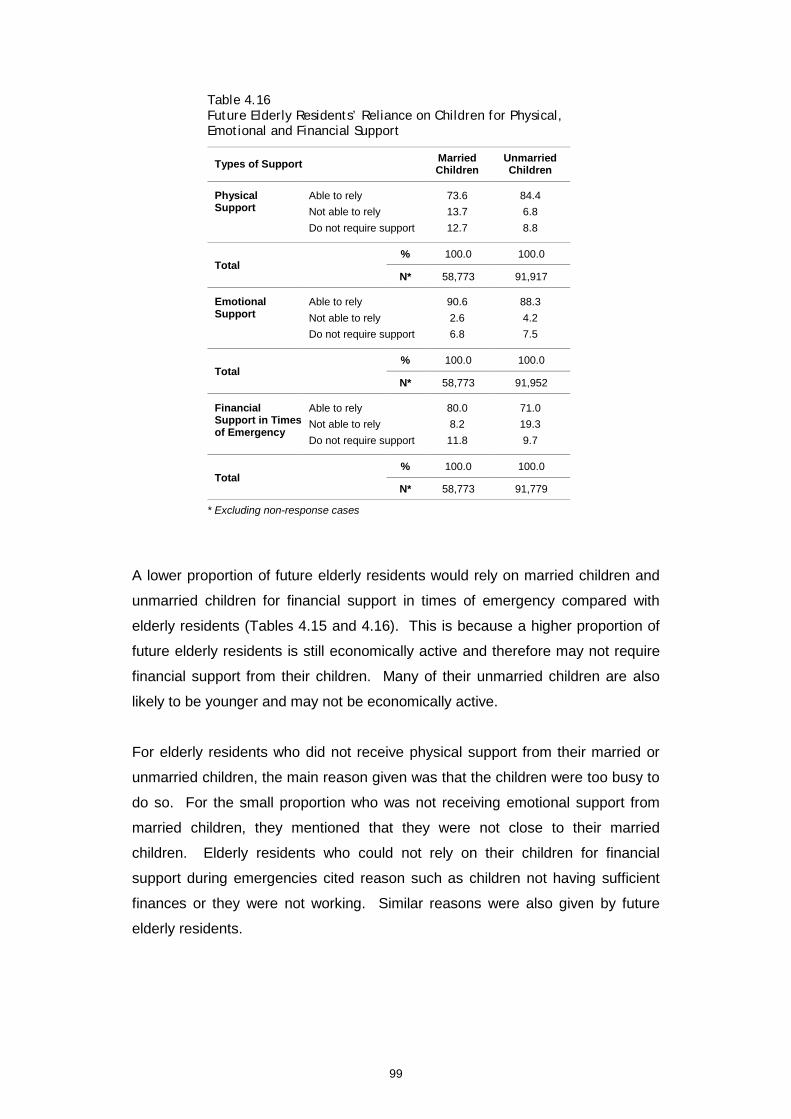
99
Table 4.16 Future Elderly Residents’ Reliance on Children for Physical, Emotional and Financial Support
Types of Support Married Children
Unmarried Children
Physical Support
Able to rely Not able to rely Do not require support
73.6 13.7 12.7
84.4 6.8 8.8
Total % 100.0 100.0
N* 58,773 91,917
Emotional Support
Able to rely Not able to rely Do not require support
90.6 2.6 6.8
88.3 4.2 7.5
Total % 100.0 100.0
N* 58,773 91,952
Financial Support in Times of Emergency
Able to rely Not able to rely Do not require support
80.0 8.2 11.8
71.0 19.3 9.7
Total % 100.0 100.0
N* 58,773 91,779
* Excluding non-response cases
A lower proportion of future elderly residents would rely on married children and
unmarried children for financial support in times of emergency compared with
elderly residents (Tables 4.15 and 4.16). This is because a higher proportion of
future elderly residents is still economically active and therefore may not require
financial support from their children. Many of their unmarried children are also
likely to be younger and may not be economically active.
For elderly residents who did not receive physical support from their married or
unmarried children, the main reason given was that the children were too busy to
do so. For the small proportion who was not receiving emotional support from
married children, they mentioned that they were not close to their married
children. Elderly residents who could not rely on their children for financial
support during emergencies cited reason such as children not having sufficient
finances or they were not working. Similar reasons were also given by future
elderly residents.
100
Majority of elderly received regular financial allowances from children
The level of financial support received from children is another indicator of inter-
generational support. Among elderly residents with children (87.2%), 77.5% of
them received regular financial support from their children. This proportion was
lower compared with 85.6% in 2008. However, the average amount received by
one parent from all their children was $535 per month, higher compared with
$461 per month in 2008. The decline in the proportion of elderly residents
receiving regular financial support could be due to a higher proportion of them
being economically active (16.4% in 2008 and 20.6% in 2013) and hence not
requiring financial support from children.
Among future elderly residents with children (77.6%), 55.6% of them were
financially supported by their children. This proportion was also lower compared
with 62.3% in 2008. The average amount received by future elderly residents
was slightly higher compared with elderly residents, at $553 per month. Similar
to elderly residents, the decline in proportion of future elderly residents receiving
financial support compared with 2008 could be due to a slightly higher proportion
of them being economically active (62.7% in 2008 and 63.2% in 2013).
Further analysis showed that a higher proportion of elderly and future elderly who
received financial support from their children was females or economically
inactive (Table 4.17). In terms of flat type, both elderly and future elderly
residents living in 1- and 2-room flats, as well as those in 5-room and bigger flats
were less likely to receive regular financial support from their children. The
children of the elderly and future elderly residents living in smaller flats were likely
to be earning lower household incomes and hence might not be able to provide
regular financial support. For elderly and future elderly residents living in 5-room
and bigger flats, they could possibly draw upon their savings, thus did not require
financial support from their children.
Economically inactive or female elderly and future elderly residents also received
a higher amount compared with the economically active or male residents (Table
4.18). Those living in 5-room and bigger flats who received financial support also
received a higher amount.

101
Table 4.17 Regular Financial Support Received by Elderly and Future Elderly from All Children by Attributes
Attributes
Elderly Future Elderly
Financial Support Received Total Financial Support
Received Total
Yes No % N* Yes No % N*
Economic Status
Economically Active Economically Inactive
63.4
82.7 36.6
17.3 100.0
100.0 26,882
71,676 47.1
77.4 52.9
22.6 100.0
100.0 80,483
31,571
Flat Type 1- & 2-Room 3-Room 4-Room 5-Room & Bigger
75.3 79.3 78.5 73.3
24.7 20.7 21.5 26.7
100.0 100.0 100.0 100.0
12,915 37,670 31,080 17,120
52.2 61.0 60.2 48.1
47.8 39.0 39.8 51.9
100.0 100.0 100.0 100.0
7,677 25,343 40,032 39,254
Sex Male Female
71.3 87.6
28.7 12.4
100.0 100.0
61,212 37,573
47.7 72.5
52.3 27.5
100.0 100.0
76,597 35,708
* Excluding non-response cases
Table 4.18 Amount of Financial Support Received by Elderly and Future Elderly from All Children by Attributes
Attributes Average Amount
Received per Month ($)
Elderly Future Elderly
Economic Status Economically Active Economically Inactive
474 554
493 644
Flat Type 1- & 2-Room 3-Room 4-Room 5-Room & Bigger
336 524 571 671
234 433 526 762
Sex Male Female
511 568
536 575
Overall 535 553
* Excluding non-response cases and those without children
Elderly would rely on themselves or children to pay for their medical bills
A question was also asked on who would pay for the medical bills of elderly
residents when they needed to seek medical treatments. It was found that the
majority of elderly (67.0%) and future elderly (78.0%) residents would usually pay
for their own medical bills, higher compared with 42.0% and 56.3% respectively,
in 2008. A higher proportion of future elderly residents (22.7%), who were more
likely to be economically active, would also rely on their employers to pay for their

102
medical bills than elderly residents. For elderly residents, about one in three
would rely on children to pay for their medical bills (Chart 4.13).
Chart 4.13 Person/Source Paying Medical Bills for Elderly and Future Elderly
Both elderly and future elderly had strong sense of closeness to family members
Elderly residents were asked to give a score on a scale of “0” to “10”, to indicate
how close they were to their family members. A response of “0” means “not
close at all” and “10” means “very close”. Both elderly and future elderly
residents expressed comparably high scores for sense of closeness to family
members, with an average score of 8.2 and 8.6, respectively.
Majority of elderly and future elderly kept in touch regularly with family members not living with them
In addition to having strong bonds between elderly residents and their children,
about eight in ten of both elderly and future elderly residents kept in touch with
family members who were not living with them on a daily, weekly or monthly
basis (Chart 4.14).
0.7
0.6
3.1
1.1
22.7
13.3
9.5
78.0
2.4
0.9
1.1
2.8
4.0
11.0
33.1
67.0
0 20 40 60 80 100
Pension
Relatives/Friends
Spouse
Welfare Assistance
Employer
Health Insurance
Children
Myself
Households (%)
ElderlyFuture Elderly
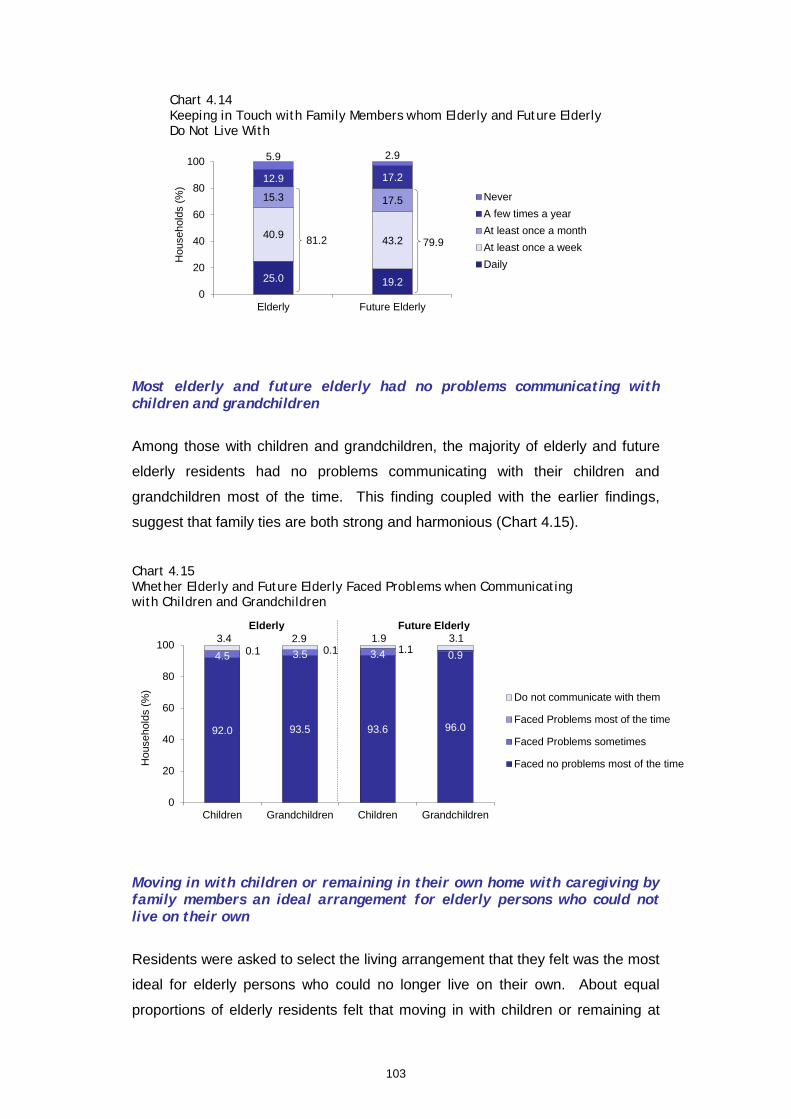
103
Chart 4.14 Keeping in Touch with Family Members whom Elderly and Future Elderly Do Not Live With
Most elderly and future elderly had no problems communicating with children and grandchildren
Among those with children and grandchildren, the majority of elderly and future
elderly residents had no problems communicating with their children and
grandchildren most of the time. This finding coupled with the earlier findings,
suggest that family ties are both strong and harmonious (Chart 4.15).
Chart 4.15 Whether Elderly and Future Elderly Faced Problems when Communicating with Children and Grandchildren
Moving in with children or remaining in their own home with caregiving by family members an ideal arrangement for elderly persons who could not live on their own
Residents were asked to select the living arrangement that they felt was the most
ideal for elderly persons who could no longer live on their own. About equal
proportions of elderly residents felt that moving in with children or remaining at
25.0 19.2
40.9 43.2
15.3 17.5
12.9 17.2
5.9 2.9
0
20
40
60
80
100
Elderly Future Elderly
Hou
seho
lds
(%)
NeverA few times a yearAt least once a monthAt least once a weekDaily
92.0 93.5 93.6 96.0
4.5 3.5 3.4 0.9 0.1 0.1 1.1 3.4 2.9 1.9 3.1
0
20
40
60
80
100
Children Grandchildren Children Grandchildren
Hou
seho
lds
(%) Do not communicate with them
Faced Problems most of the time
Faced Problems sometimes
Faced no problems most of the time
81.2 79.9
Elderly Future Elderly

104
their current home with family members as caregivers would be the ideal living
arrangement (Table 4.19). Less than one in ten felt that remaining in their home
with professional caregivers was the ideal living arrangement, while 14.1% of
elderly residents felt that elderly persons should move into an institution if they
could no longer take care of themselves. For future elderly residents, similar
trends were observed except a higher proportion of them felt that moving in with
children would be the ideal living arrangement compared with remaining at their
current home.
Table 4.19 Elderly and Future Elderly Residents’ Perceived Ideal Living Arrangement for Elderly Persons Unable to Live on their Own
Ideal Living Arrangement Elderly Future Elderly
Move in with children 37.8 45.7
Remain at home and rely on family members for caregiving 38.2 30.8
Remain at home and rely on professional caregiver 8.2 6.6
Move into an institution 14.1 15.2
Others (e.g. move in with siblings, friends) 1.7 1.7
Total % 100.0 100.0
N* 112,702 143,819
* Excluding non-response cases
4.2.2 Community Bonding
This section on community bonding analyses aspects such as elderly residents’
social interactions with neighbours, sense of attachment to the living environment
and their involvement in community activities.
Almost all elderly and future elderly had casual interactions with neighbours
Table 4.20 shows the types of neighbourly interactions among elderly and future
elderly residents. Almost all elderly residents exchanged greetings and had
casual conversations with their neighbours. However, the other more intense
forms of neighbourly interactions such as visiting each other and exchanging
suggestions/advice declined from 2008.
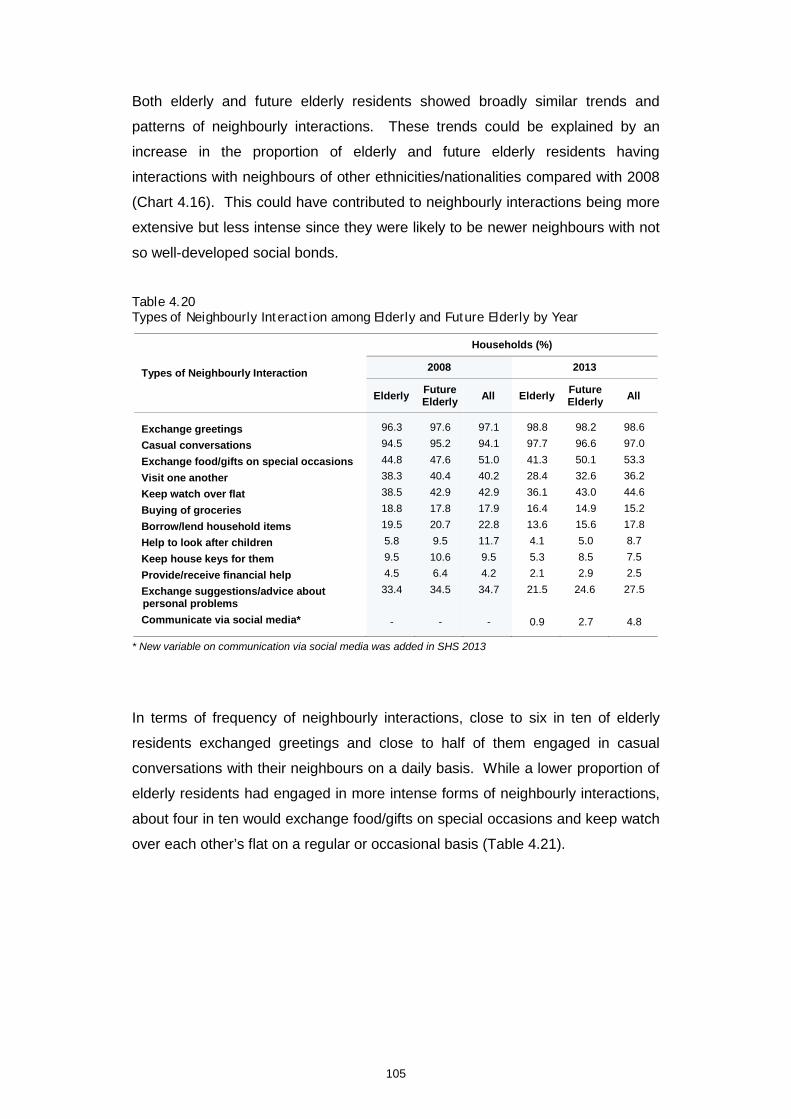
105
Both elderly and future elderly residents showed broadly similar trends and
patterns of neighbourly interactions. These trends could be explained by an
increase in the proportion of elderly and future elderly residents having
interactions with neighbours of other ethnicities/nationalities compared with 2008
(Chart 4.16). This could have contributed to neighbourly interactions being more
extensive but less intense since they were likely to be newer neighbours with not
so well-developed social bonds.
Table 4.20 Types of Neighbourly Interaction among Elderly and Future Elderly by Year
Types of Neighbourly Interaction
Households (%)
2008 2013
Elderly Future Elderly All Elderly Future
Elderly All
Exchange greetings Casual conversations Exchange food/gifts on special occasions Visit one another Keep watch over flat Buying of groceries Borrow/lend household items Help to look after children Keep house keys for them Provide/receive financial help Exchange suggestions/advice about personal problems Communicate via social media*
96.3 94.5 44.8 38.3 38.5 18.8 19.5 5.8 9.5 4.5 33.4
-
97.6 95.2 47.6 40.4 42.9 17.8 20.7 9.5 10.6 6.4 34.5
-
97.1 94.1 51.0 40.2 42.9 17.9 22.8 11.7 9.5 4.2 34.7
-
98.8 97.7 41.3 28.4 36.1 16.4 13.6 4.1 5.3 2.1 21.5
0.9
98.2 96.6 50.1 32.6 43.0 14.9 15.6 5.0 8.5 2.9
24.6
2.7
98.6 97.0 53.3 36.2 44.6 15.2 17.8 8.7 7.5 2.5 27.5
4.8
* New variable on communication via social media was added in SHS 2013
In terms of frequency of neighbourly interactions, close to six in ten of elderly
residents exchanged greetings and close to half of them engaged in casual
conversations with their neighbours on a daily basis. While a lower proportion of
elderly residents had engaged in more intense forms of neighbourly interactions,
about four in ten would exchange food/gifts on special occasions and keep watch
over each other’s flat on a regular or occasional basis (Table 4.21).

106
Table 4.21 Types and Frequency of Neighbourly Interaction among Elderly
Types of Neighbourly Interaction Daily At Least Once a Week
At Least Once a Month
Occa-sionally
None at All
Total
% N*
Exchange greetings Casual conversations Exchange food/gifts on special occasions Visit one another Keep watch over flat Buying of groceries Borrow/lend household items Help to look after children Keep house keys for them Provide/receive financial help Exchange suggestions/advice about personal problems Communicate via social media
59.5 45.2 0.8 0.6 2.0 0.2 0.1 0.3 0.5 0.3 0.5
0.1
22.8 28.7 1.7 1.4 1.0 1.6 0.5 0.1 0.1 0.1 0.9
0.2
0.8 1.8 1.5 1.7 1.1 0.7 0.4 -
0.1 -
0.6 -
15.7 22.0 37.3 24.7 32.0 13.9 12.6 3.7 4.6 1.7
19.5
0.6
1.2 2.3
58.7 71.6 63.9 83.6 86.4 95.9 94.7 97.9 78.5
99.1
100.0 100.0 100.0 100.0 100.0 100.0 100.0 100.0 100.0 100.0 100.0
100.0
113,135 113,135 113,023 113,222 113,222 113,222 113,108 113,125 113,125 113,222 113,222 112,657
* Excluding non-response cases
More elderly and future elderly interacted with neighbours of other ethnic groups and/or nationalities
Apart from interacting with neighbours of their own ethnic group, 84.5% of elderly
residents also interacted with neighbours of other ethnic groups and/or
nationalities, an increase from 72.3% in 2008 (Chart 4.16). As mentioned earlier,
elderly residents could have more new neighbours from other ethnic groups
and/or nationalities. A similar increase was also seen in the proportion of future
elderly residents interacting with neighbours of other ethnic groups and/or
nationalities.
For elderly residents who did not interact with other ethnic groups or nationalities,
this was mainly because they did not know neighbours of other ethnic groups or
nationalities, or due to language barriers.
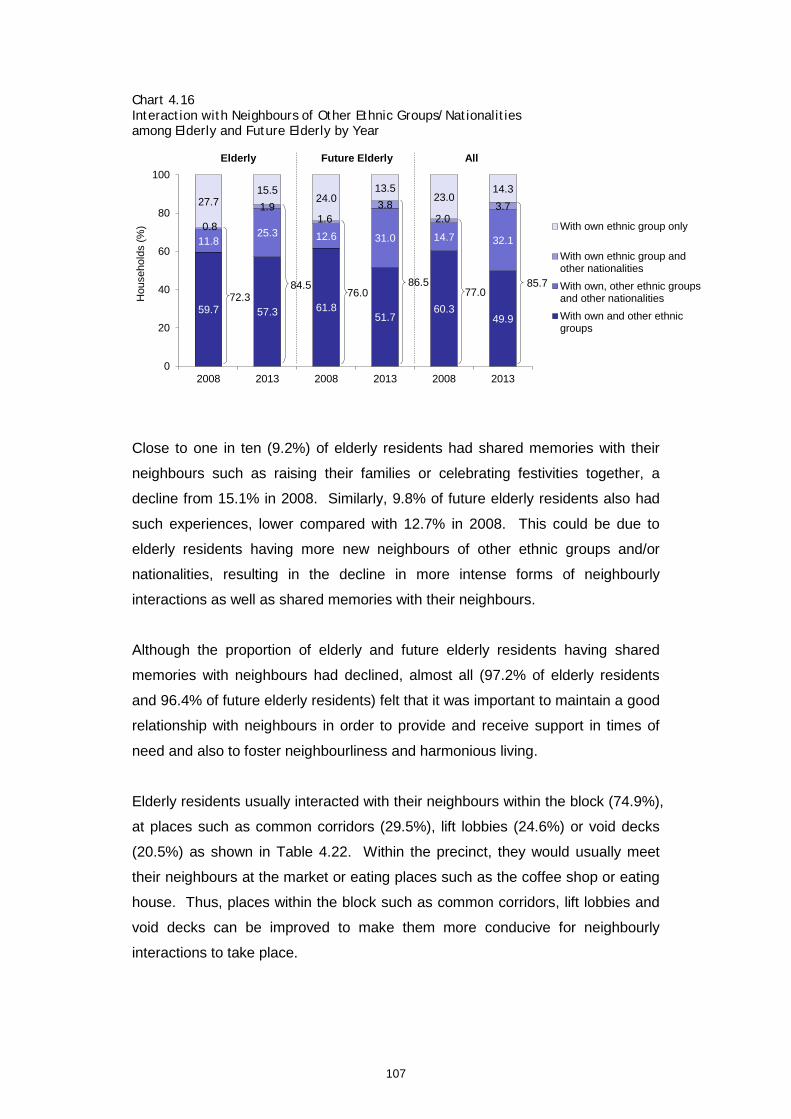
107
Chart 4.16 Interaction with Neighbours of Other Ethnic Groups/Nationalities among Elderly and Future Elderly by Year
Close to one in ten (9.2%) of elderly residents had shared memories with their
neighbours such as raising their families or celebrating festivities together, a
decline from 15.1% in 2008. Similarly, 9.8% of future elderly residents also had
such experiences, lower compared with 12.7% in 2008. This could be due to
elderly residents having more new neighbours of other ethnic groups and/or
nationalities, resulting in the decline in more intense forms of neighbourly
interactions as well as shared memories with their neighbours.
Although the proportion of elderly and future elderly residents having shared
memories with neighbours had declined, almost all (97.2% of elderly residents
and 96.4% of future elderly residents) felt that it was important to maintain a good
relationship with neighbours in order to provide and receive support in times of
need and also to foster neighbourliness and harmonious living.
Elderly residents usually interacted with their neighbours within the block (74.9%),
at places such as common corridors (29.5%), lift lobbies (24.6%) or void decks
(20.5%) as shown in Table 4.22. Within the precinct, they would usually meet
their neighbours at the market or eating places such as the coffee shop or eating
house. Thus, places within the block such as common corridors, lift lobbies and
void decks can be improved to make them more conducive for neighbourly
interactions to take place.
59.7 57.3 61.8 51.7
60.3 49.9
11.8 25.3 12.6 31.0 14.7 32.1
0.8
1.9 1.6
3.8 2.0
3.7 27.7 15.5
24.0 13.5
23.0 14.3
0
20
40
60
80
100
2008 2013 2008 2013 2008 2013
Hou
seho
lds
(%) With own ethnic group only
With own ethnic group andother nationalitiesWith own, other ethnic groupsand other nationalitiesWith own and other ethnicgroups
Future Elderly Elderly All
72.3 76.0 77.0 85.7 84.5 86.5

108
Table 4.22 Places where Neighbours Meet among Elderly and Future Elderly
Places where Neighbours Meet Elderly Future Elderly All
Within the Block Common corridor Lift lobby/Within lift Void deck Others (e.g. drop-off porch, neighbour’s flat)
Within Neighbourhood/Precinct Market Coffee shop/Eating house/Food court Pathway/Linkway Hawker centre Fitness Corner Playground Carpark Others (e.g. multi-purpose court, precinct pavilion)
Within Town Bus stop/Bus interchange Park/Garden MRT station Shopping/Entertainment area Community club/centre Others (e.g. religious institution)
74.9 29.5 24.6 20.5 0.3
20.1 5.2 5.2 3.7 3.4 0.7 0.6 0.5 0.8
5.0 2.3 0.9 0.5 0.4 0.3 0.6
77.1 30.8 25.4 20.5 0.4
17.8 3.3 5.3 3.5 2.5 0.6 0.6 1.6 0.4
5.1 1.3 1.1 0.5 1.1 0.5 0.6
76.2 30.9 25.8 18.9 0.6
18.1 4.4 4.0 3.6 2.0 0.4 1.5 1.5 0.7
5.7 1.8 1.1 0.7 1.3 0.3 0.5
Total % 100.0 100.0 100.0
No. of Responses* 293,715 365,115 2,301,626
* Excluding non-response cases and each respondent was asked to provide up to 3 responses
Elderly residents were more likely to keep in touch with their social networks
through face-to-face meetings and communicating via the telephone. A higher
proportion of them was also using these modes compared with 2008 (Table 4.23).
There was also an increase in the proportion of elderly residents using non-
traditional modes of communication such as Short Message Services (SMS) and
other online communication channels, although lower compared with future
elderly residents. The usage of SMS and online communication channels among
future elderly residents had also increased from 2008. Hence, it can be seen that
both elderly and future elderly residents are adapting well to newer forms of
communication, albeit at a slower pace for elderly residents.

109
Table 4.23 Common Modes of Interaction among Elderly and Future Elderly by Year
Modes of Interaction
Household (%)
Elderly Future Elderly All
2008 2013 2008 2013 2008 2013
Face-to-Face Meeting Telephone Text Messaging (e.g. SMS, Whatsapp) Email/Internet Chat/Video Conferencing Social Networking Sites (e.g. Facebook, Twitter, LinkedIN) Snail Mail
88.8 54.4 3.3 2.2
-
0.8
93.6 70.0 8.7 6.9
1.2
0.5
87.6 63.6 18.9 9.9
-
2.2
93.1 71.7 27.1 16.4
5.0
1.3
88.9 66.3 32.3 19.2
-
1.6
91.1 74.4 36.5 25.0
12.8
1.3
Sense of belonging to towns/estates remained high among elderly and future elderly
As shown in the section on housing aspects, elderly residents showed a strong
preference to age-in-place. Hence, it was not surprising that almost all elderly
residents (99.1%) felt a sense of belonging to their towns/estates, comparable to
the proportion in 2008 (Table 4.24). A similar trend was observed for future
elderly residents.
Table 4.24 Sense of Belonging among Elderly and Future Elderly by Year
Sense of Belonging
2003 2008 2013
Elderly All Elderly Future Elderly All Elderly Future
Elderly All
Yes No
96.4 3.6
90.0 10.0
99.5 0.5
98.7 1.3
98.6 1.4
99.1 0.9
98.9 1.1
98.8 1.2
Total % 100.0 100.0 100.0 100.0 100.0 100.0 100.0 100.0
N* 66,722 821,126 92,764 129,660 864,246 112,724 144,704 906,831
* Excluding non-response cases
More than eight in ten of elderly residents attributed their sense of belonging
mainly to both place and people (81.6%), an increase from 75.7% in 2008 while
another 16.4% attributed it to the place itself. A similar trend was also noted for
future elderly residents. However, the proportion who attributed their sense of
belonging to both place and people for future elderly residents was slightly lower
(77.6%) compared with elderly residents, while a higher proportion (19.9%)
attributed it to the place itself.

110
Sense of community among elderly and future elderly increased over past five years
Sense of Community (SOC) score is also used as an indicator to gauge the
degree of neighbourliness. The indicators that comprise the Sense of
Community score are listed in Table 4.25. For both elderly and future elderly
residents, their sense of community had increased to a score of 73.2 and 72.8,
from 72.5 and 71.3 in 2008, respectively. The increase in SOC could be
attributed to higher average scores pertaining to ease of communicating with
neighbours, tolerance towards noise from neighbours, being able to get help from
neighbours when in need and care about maintenance of their block.
Table 4.25 Sense of Community (SOC) Score among Elderly and Future Elderly by Year
SOC Indicators
Average Score (Over maximum of 100)
2008 2013
Elderly Future Elderly All Elderly Future
Elderly All
a. “It is very easy to talk to people living in my HDB estate.”
75.0 72.5 75.0 76.1 74.6 75.0
b. “I can tolerate noise created by my neighbours.” 65.0 65.0 65.0 67.7 66.3 66.0
c. “I can always get help from my neighbours when in need.” 72.5 70.0 72.5 73.9 73.5 74.3
d. “Residents in this block can recognise one another easily.” 75.0 72.5 72.5 74.5 75.1 74.3
e. “Residents here care about the maintenance of their block.” 70.0 70.0 70.0 71.7 72.1 71.8
f. “I feel a sense of belonging to this housing estate.” 77.5 77.5 72.5 75.2 75.4 77.5
Overall Score (Over maximum of 100) 72.5 71.3 71.3 73.2 72.8 73.2
Elderly and future elderly remained active in the community
This section analyses elderly residents’ social ties with the wider community,
through their participation in community activities and willingness to contribute
services for the benefits of the community. The proportion of elderly residents
who participated in community activities (47.1%) was comparable to 2008
(46.9%). This proportion was also comparable to that of future elderly residents
but slightly lower compared with all households (Table 4.26).

111
Table 4.26 Community Participation of Elderly and Future Elderly in the Last Twelve Months by Year
Community Participation
2003 2008 2013
Elderly All Elderly Future Elderly All Elderly Future
Elderly All
Yes No
40.7 59.3
38.0 62.0
46.9 53.1
45.0 55.0
45.3 54.7
47.1 52.9
46.9 53.1
48.6 51.4
Total % 100.0 100.0 100.0 100.0 100.0 100.0 100.0 100.0
N* 66,503 817,530 92,870 129,660 866,026 113,294 144,792 908,499
* Excluding non-response cases
For the 52.9% of elderly residents who did not participate in community activities,
the main reason cited was that the activities were not interesting/suitable (Table
4.27). For the 53.1% of future elderly residents who did not participate in
community activities at all, the main reason cited was a lack of time, as a higher
proportion of them was still working.
Table 4.27 Reasons for Not Participating in Community Activities among Elderly and Future Elderly
Reasons Elderly Future Elderly
Activities organised are not interesting/suitable No time/Too busy to participate Do not participate due to old age/poor health Not informed of any activities Prefer not to socialise/keep to myself Others (e.g. activities are too far, cannot afford to participate)
49.4 25.9 18.7 3.4 0.2 2.4
30.1 60.2 3.0 4.1 0.8 1.8
Total % 100.0 100.0
N* 59,495 76,584
* Excluding non-response cases
It was observed that the participation rate of elderly residents increased from
31.5% in 2008 to 42.8% in 2013 if the proportion of elderly residents who
participated solely in religious activities was excluded (Chart 4.17). The findings
show that efforts put in by agencies in organising activities for elderly residents
have been fruitful. Moving forward, more active engagement with the seniors to
encourage them to participate in a variety of activities would enhance their ties
with the wider community.
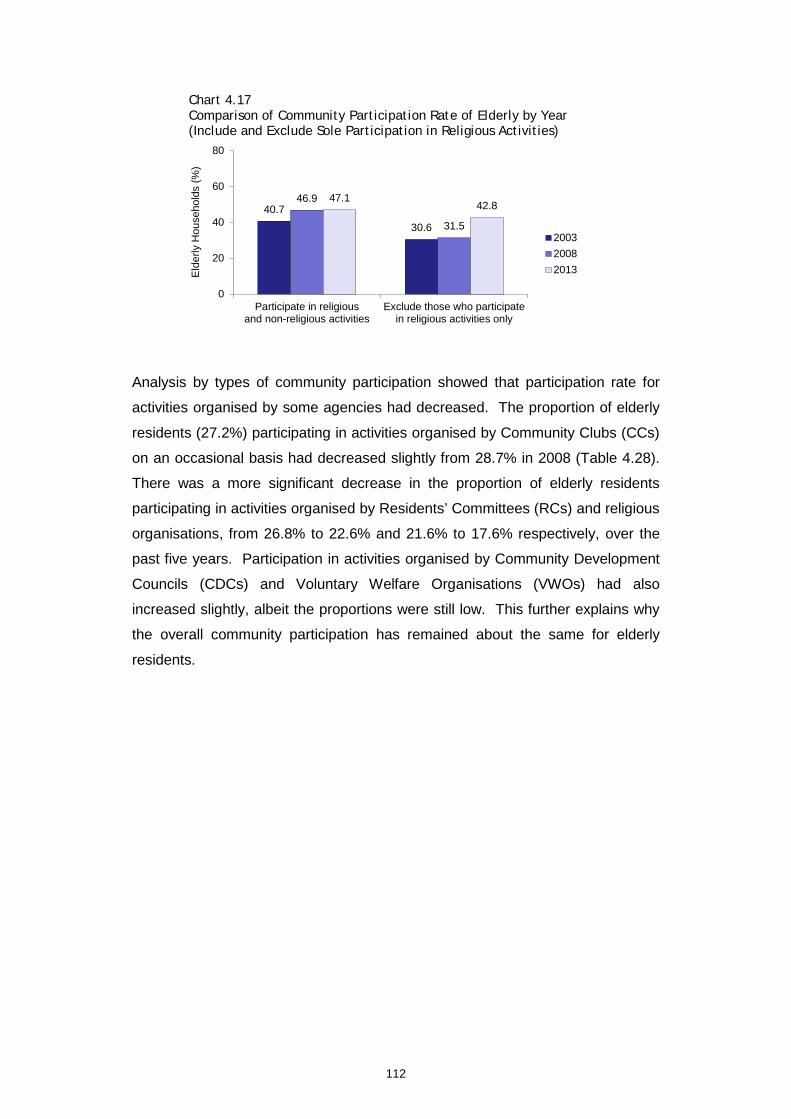
112
Chart 4.17 Comparison of Community Participation Rate of Elderly by Year (Include and Exclude Sole Participation in Religious Activities)
Analysis by types of community participation showed that participation rate for
activities organised by some agencies had decreased. The proportion of elderly
residents (27.2%) participating in activities organised by Community Clubs (CCs)
on an occasional basis had decreased slightly from 28.7% in 2008 (Table 4.28).
There was a more significant decrease in the proportion of elderly residents
participating in activities organised by Residents’ Committees (RCs) and religious
organisations, from 26.8% to 22.6% and 21.6% to 17.6% respectively, over the
past five years. Participation in activities organised by Community Development
Councils (CDCs) and Voluntary Welfare Organisations (VWOs) had also
increased slightly, albeit the proportions were still low. This further explains why
the overall community participation has remained about the same for elderly
residents.
40.7
30.6
46.9
31.5
47.1 42.8
0
20
40
60
80
Participate in religiousand non-religious activities
Exclude those who participatein religious activities only
Eld
erly
Hou
seho
lds
(%)
200320082013

113
Table 4.28 Types of Community Participation among Elderly and Future Elderly over Past Twelve Months by Year
Types of Community Participation
Households who Participated At Least Occasionally (%)
2008 2013
Elderly Future Elderly All Elderly Future
Elderly All
Community Clubs Residents’ Committees Other Organisations/Associations Religious Organisations Residents’ Own Activities Town Councils/HDB* Community Development Councils Voluntary Welfare Organisations
28.7 26.8 18.4 21.6 14.3
- 7.0 5.9
21.5 19.7 18.9 22.2 15.9
- 9.3 6.8
22.9 21.5 20.0 20.7 14.5
- 10.0 6.6
27.2 22.6 19.8 17.6 13.9 8.2 7.4 7.6
25.4 20.9 17.8 16.8 12.8 8.5 8.0 7.1
28.0 23.5 20.7 15.4 13.2 9.3 9.3 6.1
* Town Councils/HDB was added in SHS 2013
A higher proportion of elderly residents who participated in community activities
was living in 3-room or bigger flat types or better educated (Table 4.29). Both the
elderly and future elderly females were also more likely to participate in
community activities.
Table 4.29 Whether Participate in Community Activities among Elderly and Future Elderly by Attributes
Attributes
Elderly Future Elderly
Whether Participated in
Community Activities
Total Whether
Participated in Community Activities
Total
Yes No % N* Yes No % N*
Economic Status
Economically Active Economically Inactive
45.9
47.7 54.1
52.3 100.0
100.0 31,870
81,198 46.6
47.5 53.4
52.5 100.0
100.0 105,559
38,982
Flat Type 1- & 2-Room 3-Room 4-Room 5- Room & Bigger
40.6 49.1 45.9 51.7
59.4 50.9 54.1 48.3
100.0 100.0 100.0 100.0
19,048 42,222 34,356 17,668
37.9 46.1 49.0 48.4
62.1 53.9 51.0 51.6
100.0 100.0 100.0 100.0
14,402 41,508 46,445 42,437
Education Primary & Below** Secondary Post-secondary & Above
46.5
46.7 51.3
53.5
53.3 48.7
100.0
100.0 100.0
66,696
34,420 11,355
41.8
47.0 55.1
58.2
53.0 44.9
100.0
100.0 100.0
45,765
69,742 28,854
Sex Male Female
45.4 49.7
54.6 50.3
100.0 100.0
68,328 44,966
44.0 52.3
56.0 47.7
100.0 100.0
94,491 50,301
* Excluding non-response cases ** Those with no formal education and with primary education are grouped together to ensure sufficient sample
size

114
4.3 Housing Aspects
Elderly residents have consistently shown a strong preference to live in
communities they have resided in for many years, where they can rely on the
long-term relationships they have cultivated in the community for support. To
enable elderly residents to age-in-place, it is vital that the flats where they reside
as well as the estate amenities they utilise are made accessible and barrier-free.
A Barrier-Free Accessibility (BFA) Masterplan was announced in 200618, and
HDB had worked with the Town Councils to ensure that all towns and estates are
barrier-free by 2012. HDB has also implemented programmes such as Lift
Upgrading Programme (LUP) 19 and Neighbourhood Renewal Programme
(NRP)20, to ensure that elderly residents would have access to lifts on every floor
and possible neighbourhood improvements such as residents’ corners, seating
areas at void decks and covered linkways. In addition, HDB has also stepped up
efforts to install elderly-friendly fittings/fixtures in flats of elderly residents through
its Enhancement for Active Seniors (EASE) 21 programme and Home
Improvement Programme (HIP). As the proportion of elderly residents in HDB
communities increases, the key challenge will be to facilitate the building of a
conducive environment where they can enjoy quality of life in their later years.
Hence, it is important to examine their satisfaction with the living environment,
usage of estate facilities and housing aspirations.
The analysis concerning housing aspects focuses on three main areas:
• Satisfaction with Physical Living Environment
• Satisfaction and Usage of Estate Facilities
• Residential Mobility and Housing Aspirations
18 BCA's Masterplan key to accessibility improvements in Singapore. Retrieved on 13 October 2014
(http://www.bca.gov.sg/Newsroom/pr29032012_UD.html) 19 Under the Lift Upgrading Programme, lift services in old apartment blocks will be upgraded to achieve direct
lift access for all flats, where feasible. This would benefit the elderly, families with very young children and the disabled. It is heavily subsidised, making it very affordable for citizens.
20 The Neighbourhood Renewal Programme (NRP) was introduced in Aug 2007 in response to feedback received from residents for more active consultation on the improvements to be provided in their precincts. Blocks built up to 1989 and have not undergone the Main Upgrading Programme (MUP), Interim Upgrading Programme (IUP) or IUP Plus are eligible for NRP. This programme is fully funded by the Government and implemented by the Town Councils.
21 Enhancement for Active Seniors (EASE) was introduced under the Home Improvement Programme (HIP) from July 2012. Under EASE, elderly and vulnerable residents can apply for the following improvements to their flats at a subsidised rate: - Slip-resistant treatment to bathroom/ toilet floor tiles - Grab bars within the flat (where technically feasible) - Ramp(s) to negotiate level differences in the flat at the main entrance (where technically feasible)

115
4.3.1 Satisfaction with Physical Living Environment
This section examines elderly residents’ satisfaction with their living environment
in terms of their overall satisfaction with flat and neighbourhood, the aspects they
liked and disliked about living in HDB estates, whether they faced any
maintenance issues within the flat and the reliability of lifts in the blocks. In
addition, elderly residents’ sense of pride with their homes, whether they found
their flats to be of value for money and the aspects which they viewed as
important when it comes to making a flat feel like a home are also discussed.
Most elderly and future elderly satisfied with their flat and neighbourhood
Almost all elderly and future elderly residents were satisfied with both their flat
and neighbourhood (Chart 4.18, Chart 4.19). While there was a slight decrease
in satisfaction with flat among elderly residents compared with five years ago, the
proportion was still higher (95.1%) compared with future elderly residents and all
households.
Chart 4.18 Satisfaction with Flat & Neighbourhood among Elderly by Year
Chart 4.19 Satisfaction with Flat & Neighbourhood among Elderly and Future Elderly
97.9 94.7 98.5 97.0 95.1 96.4
0
20
40
60
80
100
Satisfaction withFlat
Satisfaction withNeighbourhood
Hou
seho
lds
(%)
2003
2008
2013
95.1 96.4 92.4 92.0 91.6 92.0
0
20
40
60
80
100
Satisfaction withFlat
Satisfaction withNeighbourhood
Hou
seho
lds
(%)
ElderlyFuture ElderlyAll
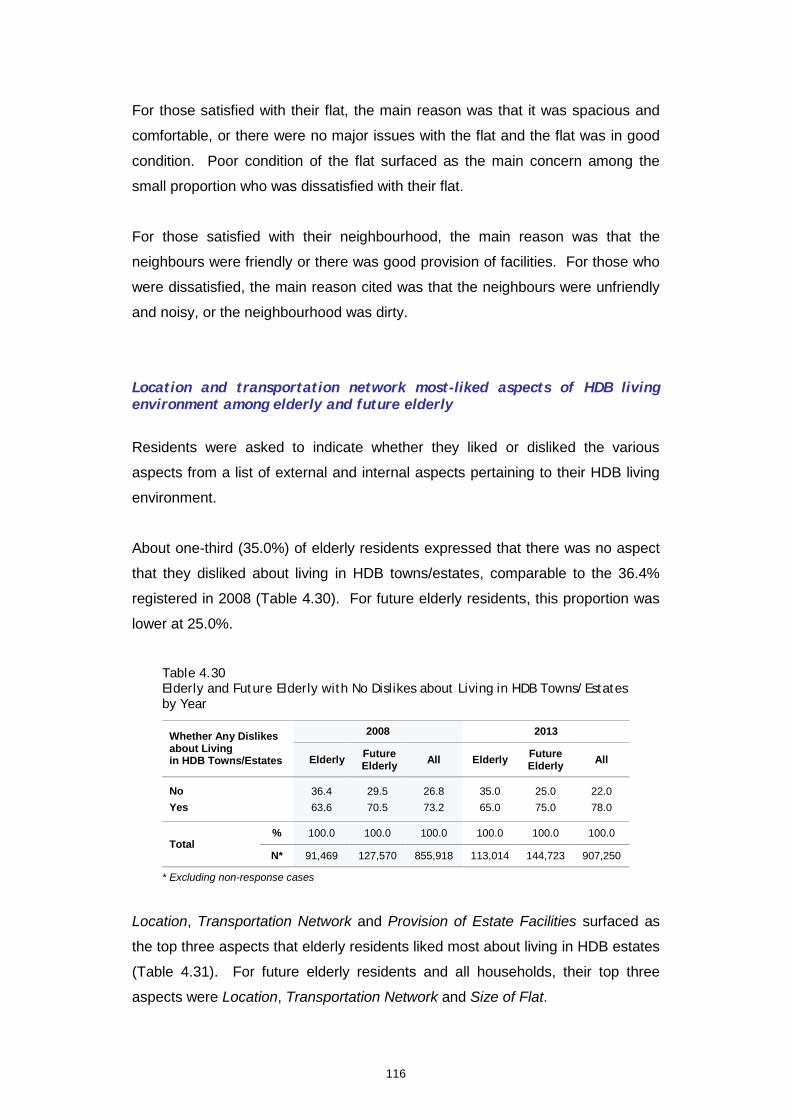
116
For those satisfied with their flat, the main reason was that it was spacious and
comfortable, or there were no major issues with the flat and the flat was in good
condition. Poor condition of the flat surfaced as the main concern among the
small proportion who was dissatisfied with their flat.
For those satisfied with their neighbourhood, the main reason was that the
neighbours were friendly or there was good provision of facilities. For those who
were dissatisfied, the main reason cited was that the neighbours were unfriendly
and noisy, or the neighbourhood was dirty.
Location and transportation network most-liked aspects of HDB living environment among elderly and future elderly
Residents were asked to indicate whether they liked or disliked the various
aspects from a list of external and internal aspects pertaining to their HDB living
environment.
About one-third (35.0%) of elderly residents expressed that there was no aspect
that they disliked about living in HDB towns/estates, comparable to the 36.4%
registered in 2008 (Table 4.30). For future elderly residents, this proportion was
lower at 25.0%.
Table 4.30 Elderly and Future Elderly with No Dislikes about Living in HDB Towns/Estates by Year
Whether Any Dislikes about Living in HDB Towns/Estates
2008 2013
Elderly Future Elderly All Elderly Future
Elderly All
No Yes
36.4 63.6
29.5 70.5
26.8 73.2
35.0 65.0
25.0 75.0
22.0 78.0
Total % 100.0 100.0 100.0 100.0 100.0 100.0
N* 91,469 127,570 855,918 113,014 144,723 907,250
* Excluding non-response cases
Location, Transportation Network and Provision of Estate Facilities surfaced as
the top three aspects that elderly residents liked most about living in HDB estates
(Table 4.31). For future elderly residents and all households, their top three
aspects were Location, Transportation Network and Size of Flat.
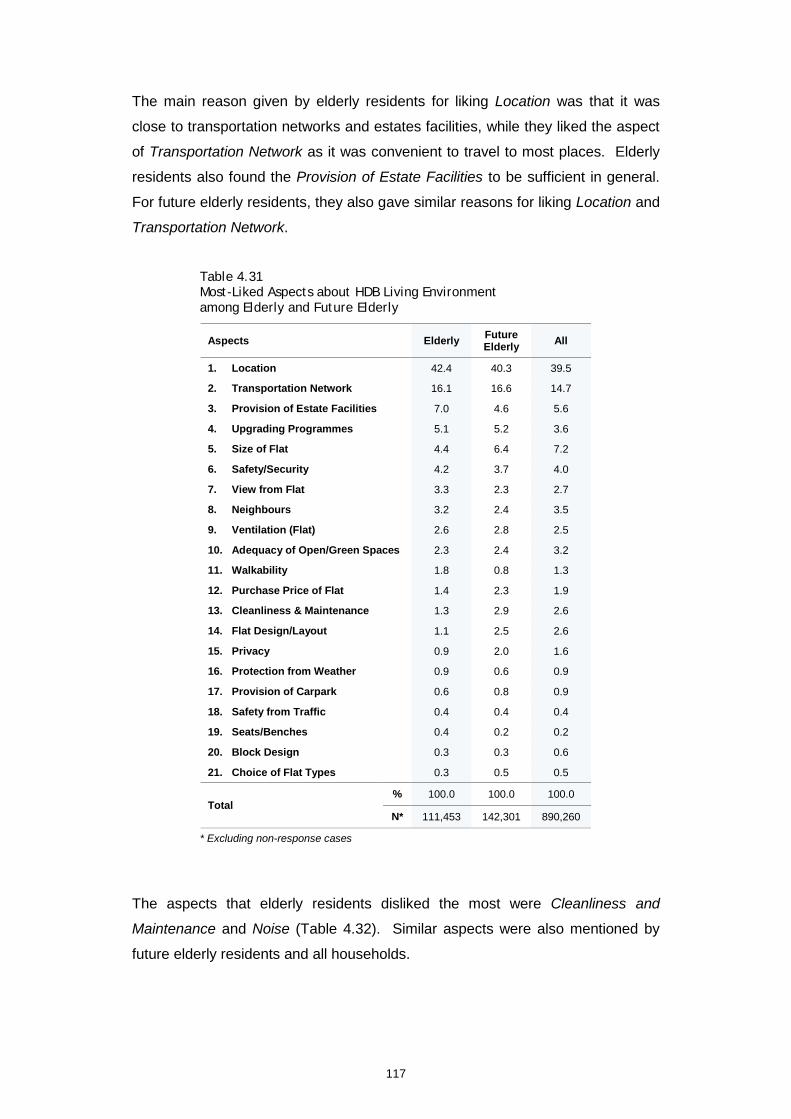
117
The main reason given by elderly residents for liking Location was that it was
close to transportation networks and estates facilities, while they liked the aspect
of Transportation Network as it was convenient to travel to most places. Elderly
residents also found the Provision of Estate Facilities to be sufficient in general.
For future elderly residents, they also gave similar reasons for liking Location and
Transportation Network.
Table 4.31 Most-Liked Aspects about HDB Living Environment among Elderly and Future Elderly
Aspects Elderly Future Elderly All
1. Location 42.4 40.3 39.5
2. Transportation Network 16.1 16.6 14.7
3. Provision of Estate Facilities 7.0 4.6 5.6
4. Upgrading Programmes 5.1 5.2 3.6
5. Size of Flat 4.4 6.4 7.2
6. Safety/Security 4.2 3.7 4.0
7. View from Flat 3.3 2.3 2.7
8. Neighbours 3.2 2.4 3.5
9. Ventilation (Flat) 2.6 2.8 2.5
10. Adequacy of Open/Green Spaces 2.3 2.4 3.2
11. Walkability 1.8 0.8 1.3
12. Purchase Price of Flat 1.4 2.3 1.9
13. Cleanliness & Maintenance 1.3 2.9 2.6
14. Flat Design/Layout 1.1 2.5 2.6
15. Privacy 0.9 2.0 1.6
16. Protection from Weather 0.9 0.6 0.9
17. Provision of Carpark 0.6 0.8 0.9
18. Safety from Traffic 0.4 0.4 0.4
19. Seats/Benches 0.4 0.2 0.2
20. Block Design 0.3 0.3 0.6
21. Choice of Flat Types 0.3 0.5 0.5
Total % 100.0 100.0 100.0
N* 111,453 142,301 890,260
* Excluding non-response cases
The aspects that elderly residents disliked the most were Cleanliness and
Maintenance and Noise (Table 4.32). Similar aspects were also mentioned by
future elderly residents and all households.

118
The main reason given by elderly residents for their dislikes in the area of
Cleanliness and Maintenance was the irregular cleaning schedule or prevalence
of littering. For Noise, the main reason cited was noise from neighbours and the
external environment, e.g. from vehicles, precinct pavilions and void decks.
Table 4.32 Most-Disliked Aspects about HDB Living Environment among Elderly and Future Elderly
Aspects Elderly Future Elderly All
1. Cleanliness & Maintenance 26.8 20.7 19.1
2. Noise 18.5 20.7 19.2
3. Protection from Weather 5.5 5.3 5.8
4. Transportation Network 5.1 7.4 8.2
5. Upgrading Programmes 4.7 5.2 3.5
6. Provision of Carpark 3.9 6.5 7.1
7. Provision of Estate Facilities 3.9 2.9 3.6
8. Seats/Benches 3.9 3.2 2.5
9. Neighbours 3.6 3.5 2.6
10. Safety/Security 3.4 4.2 4.3
11. Safety from Traffic 3.3 5.2 4.4
12. View from Flat 3.0 2.0 2.1
13. Ventilation (Flat) 3.0 1.9 2.2
14. Flat Design/Layout 2.8 1.9 2.9
15. Purchase Price of Flat 1.8 2.4 4.1
16. Block Design 1.4 1.6 1.3
17. Adequacy of Open/Green Spaces 1.0 1.3 1.3
18. Size of Flat 0.9 1.3 1.8
19. Location 0.8 0.4 0.9
20. Privacy 0.8 1.0 1.1
21. Walkability 0.3 0.6 0.7
22. Choice of Flat Types 0.2 - 0.1
23. Others (e.g. pests, workmanship of flat) 1.4 0.8 1.2
Total % 100.0 100.0 100.0
N* 73,525 108,530 707,799
* Excluding non-response cases
Majority of elderly and future elderly found lifts to be reliable
Regarding the lifts, close to nine in ten elderly residents agreed that the lifts were
reliable (Chart 4.20). This proportion was higher compared with future elderly
residents and all households. For those who disagreed, the main reason
mentioned was that they experienced frequent lift breakdowns.

119
Chart 4.20 Perception of Lift Reliability among Elderly and Future Elderly
Majority of elderly and future elderly perceived their flat to be value for money
A high 95.9% of elderly residents agreed that their flats were value for money
(Chart 4.21), higher than the 93.0% in 2008. Compared with future elderly
residents and all households, a higher proportion of elderly residents found their
flats to be value for money.
About half of elderly and future elderly residents who felt that their flats were
value for money attributed it to the appreciation in the value of the flat, followed
by affordable flat prices at the time of purchase. Some also mentioned that the
flat was in a good location and close to facilities. The minority who felt otherwise
attributed it to the high purchase price.
Chart 4.21 Value for Money of HDB Flat among Elderly and Future Elderly by Year (Sold and Rental Flats)
89.6 83.8 85.6
0
20
40
60
80
100
Elderly Future Elderly All
Hou
seho
lds
(%)
93.0 90.2 85.8 95.9 93.1 90.3
0
20
40
60
80
100
Elderly Future Elderly All
Hou
seho
lds
(%)
2008
2013

120
Majority of elderly and future elderly proud of their flat
Compared with 2008, a slightly lower proportion of elderly residents was proud of
their flat (Chart 4.22). In comparison, the decline for future elderly residents was
more significant, with a higher proportion feeling neutral towards their flat.
Chart 4.22 Sense of Pride towards HDB Flat among Elderly and Future Elderly by Year (Sold and Rental Flats)
Those who were proud attributed it mainly to the good and convenient location of
their flat or benefits derived from sense of ownership such as sense of
achievement and having a comfortable home to live in. For the minority who was
not proud of their flat, the key reason given was that the HDB flat was merely a
basic housing necessity and there was nothing special about living in one.
4.3.2 Satisfaction and Usage of Estate Facilities
HDB residents rely extensively on estate facilities to meet their daily needs, such
as shopping for groceries and spending time at eating and recreational facilities.
They also use these facilities as meeting places for interaction and bonding with
family members, friends and neighbours. It is therefore important to monitor the
trend in their usage pattern as well as satisfaction with the provision of estate
facilities.
81.5 77.0 81.7 71.9 80.7
70.4
15.7 18.8 13.4 24.1 15.2 25.5
2.8 4.2 4.9 4.0 4.1 4.1
0
20
40
60
80
100
2008 2013 2008 2013 2008 2013
Hou
seho
lds
(%)
Not Proud
Neutral
Proud
Elderly Future Elderly All
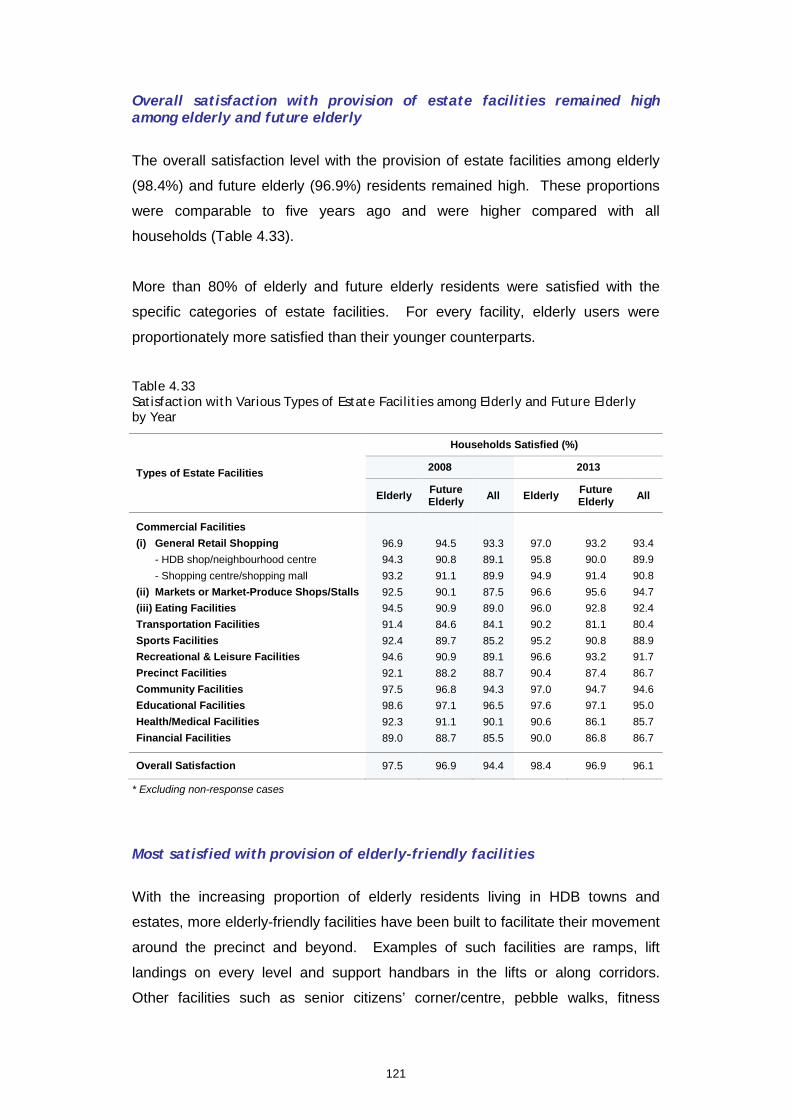
121
Overall satisfaction with provision of estate facilities remained high among elderly and future elderly
The overall satisfaction level with the provision of estate facilities among elderly
(98.4%) and future elderly (96.9%) residents remained high. These proportions
were comparable to five years ago and were higher compared with all
households (Table 4.33).
More than 80% of elderly and future elderly residents were satisfied with the
specific categories of estate facilities. For every facility, elderly users were
proportionately more satisfied than their younger counterparts.
Table 4.33 Satisfaction with Various Types of Estate Facilities among Elderly and Future Elderly by Year
Types of Estate Facilities
Households Satisfied (%)
2008 2013
Elderly Future Elderly All Elderly Future
Elderly All
Commercial Facilities (i) General Retail Shopping
- HDB shop/neighbourhood centre - Shopping centre/shopping mall
(ii) Markets or Market-Produce Shops/Stalls (iii) Eating Facilities Transportation Facilities Sports Facilities Recreational & Leisure Facilities Precinct Facilities Community Facilities Educational Facilities Health/Medical Facilities Financial Facilities
96.9 94.3 93.2 92.5 94.5 91.4 92.4 94.6 92.1 97.5 98.6 92.3 89.0
94.5 90.8 91.1 90.1 90.9 84.6 89.7 90.9 88.2 96.8 97.1 91.1 88.7
93.3 89.1 89.9 87.5 89.0 84.1 85.2 89.1 88.7 94.3 96.5 90.1 85.5
97.0 95.8 94.9 96.6 96.0 90.2 95.2 96.6 90.4 97.0 97.6 90.6 90.0
93.2 90.0 91.4 95.6 92.8 81.1 90.8 93.2 87.4 94.7 97.1 86.1 86.8
93.4 89.9 90.8 94.7 92.4 80.4 88.9 91.7 86.7 94.6 95.0 85.7 86.7
Overall Satisfaction 97.5 96.9 94.4 98.4 96.9 96.1
* Excluding non-response cases
Most satisfied with provision of elderly-friendly facilities
With the increasing proportion of elderly residents living in HDB towns and
estates, more elderly-friendly facilities have been built to facilitate their movement
around the precinct and beyond. Examples of such facilities are ramps, lift
landings on every level and support handbars in the lifts or along corridors.
Other facilities such as senior citizens’ corner/centre, pebble walks, fitness
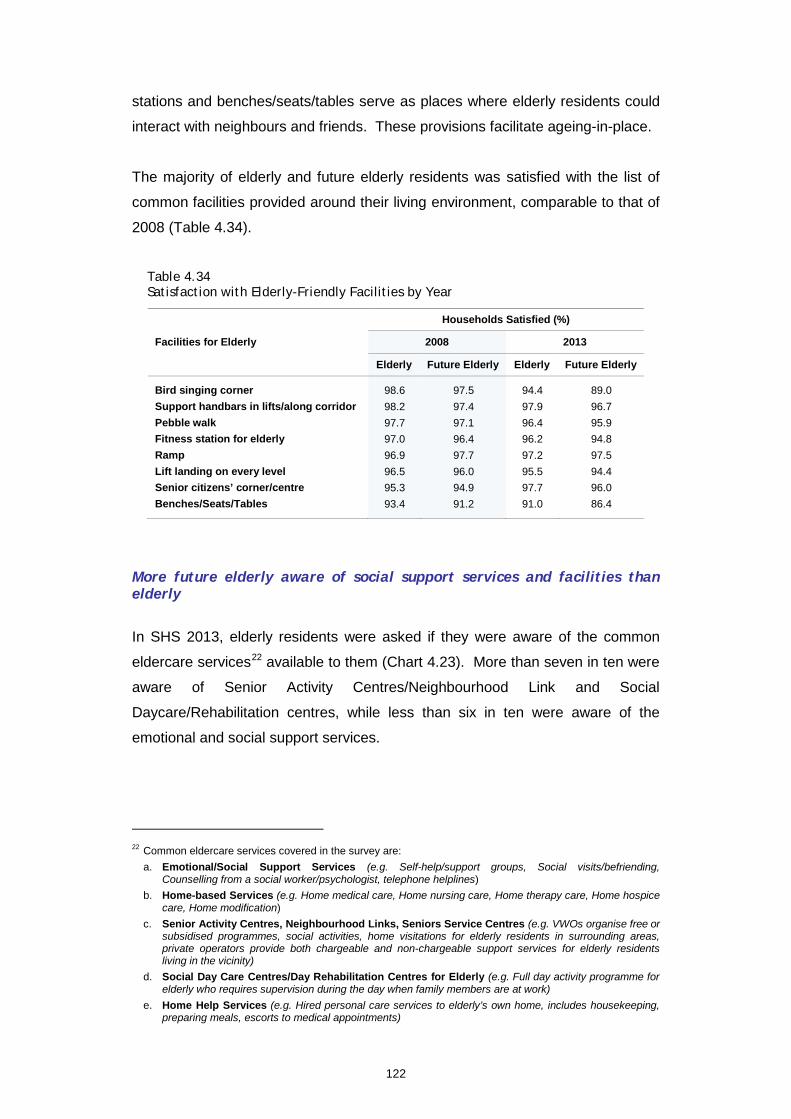
122
stations and benches/seats/tables serve as places where elderly residents could
interact with neighbours and friends. These provisions facilitate ageing-in-place.
The majority of elderly and future elderly residents was satisfied with the list of
common facilities provided around their living environment, comparable to that of
2008 (Table 4.34).
Table 4.34 Satisfaction with Elderly-Friendly Facilities by Year
Facilities for Elderly
Households Satisfied (%)
2008 2013
Elderly Future Elderly Elderly Future Elderly
Bird singing corner Support handbars in lifts/along corridor Pebble walk Fitness station for elderly Ramp Lift landing on every level Senior citizens’ corner/centre Benches/Seats/Tables
98.6 98.2 97.7 97.0 96.9 96.5 95.3 93.4
97.5 97.4 97.1 96.4 97.7 96.0 94.9 91.2
94.4 97.9 96.4 96.2 97.2 95.5 97.7 91.0
89.0 96.7 95.9 94.8 97.5 94.4 96.0 86.4
More future elderly aware of social support services and facilities than elderly
In SHS 2013, elderly residents were asked if they were aware of the common
eldercare services22 available to them (Chart 4.23). More than seven in ten were
aware of Senior Activity Centres/Neighbourhood Link and Social
Daycare/Rehabilitation centres, while less than six in ten were aware of the
emotional and social support services.
22 Common eldercare services covered in the survey are:
a. Emotional/Social Support Services (e.g. Self-help/support groups, Social visits/befriending, Counselling from a social worker/psychologist, telephone helplines)
b. Home-based Services (e.g. Home medical care, Home nursing care, Home therapy care, Home hospice care, Home modification)
c. Senior Activity Centres, Neighbourhood Links, Seniors Service Centres (e.g. VWOs organise free or subsidised programmes, social activities, home visitations for elderly residents in surrounding areas, private operators provide both chargeable and non-chargeable support services for elderly residents living in the vicinity)
d. Social Day Care Centres/Day Rehabilitation Centres for Elderly (e.g. Full day activity programme for elderly who requires supervision during the day when family members are at work)
e. Home Help Services (e.g. Hired personal care services to elderly’s own home, includes housekeeping, preparing meals, escorts to medical appointments)

123
Chart 4.23 Awareness of Eldercare Services
However, the majority of elderly residents had not used these services. Among
those who were aware of such services, only 6.6% of them utilised the Senior
Activity Centres (Table 4.35). This could be due to the limited availability of such
centres as they are mostly located near rental flats and Studio Apartments.
Utilisation rates could increase when more of these centres are available in more
locations in the future. Other services garnered lower usage levels as the
majority of elderly residents surveyed was ambulant, hence they did not require
such services at the moment.
Table 4.35 Proportion who had Utilised Eldercare Services
Eldercare Services Households (%)
Elderly Future Elderly
Senior Activity Centre/Neighbourhood Link Emotional/Social Support Services Home-help Services Social Daycare/Rehabilitation Centres Home-based Services
6.6 2.4 2.3 2.0 1.7
3.0 3.0 2.2 1.7 2.0
Although usage levels for support services were low, close to nine in ten agreed
that these services would be essential to facilitate ageing-in-place for elderly
residents (Table 4.36). These proportions were even higher among future elderly
residents, indicating the importance of such facilities to meet the needs of an
ageing population.
67.4
68.1
72.2
77.2
74.5
57.9
63.3
63.5
70.9
71.1
0 20 40 60 80 100
Emotional/SocialSupport Services
Home-Help Services
Home-Based Services
Social Daycare/Rehabilitation Centre
Senior Activity Centre/Neighbourhood Link
Households (%)
Elderly
Future Elderly
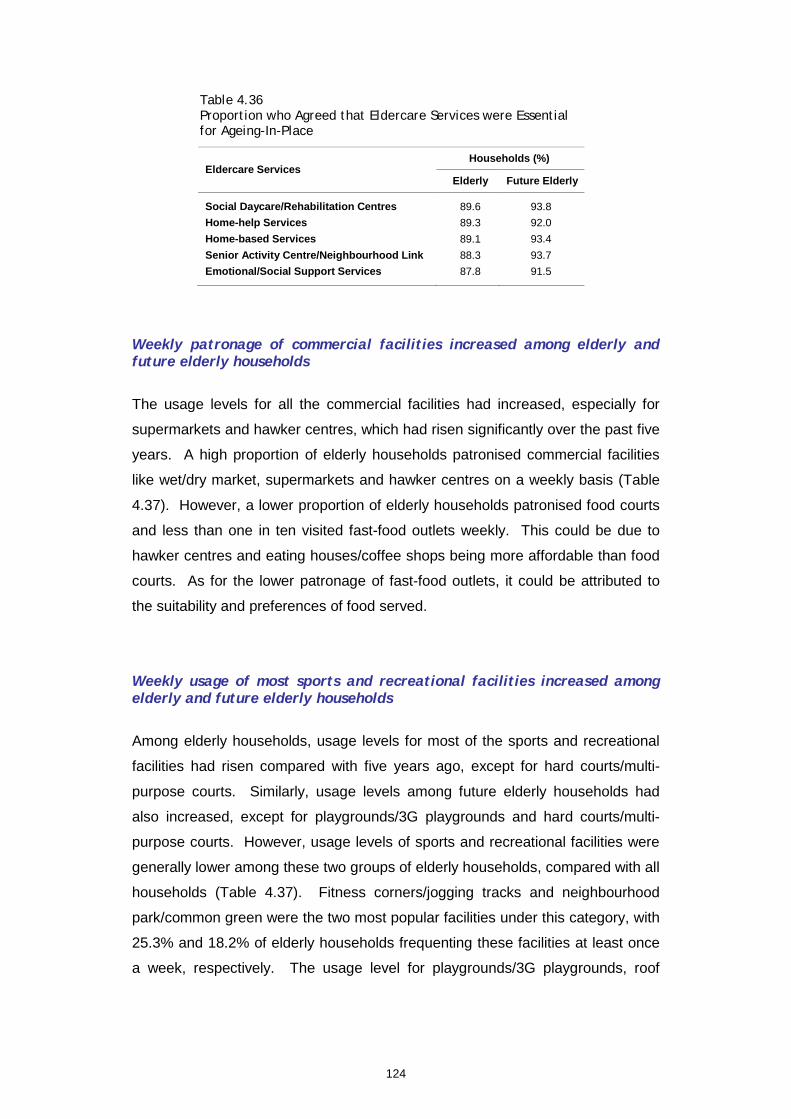
124
Table 4.36 Proportion who Agreed that Eldercare Services were Essential for Ageing-In-Place
Eldercare Services Households (%)
Elderly Future Elderly
Social Daycare/Rehabilitation Centres Home-help Services Home-based Services Senior Activity Centre/Neighbourhood Link Emotional/Social Support Services
89.6 89.3 89.1 88.3 87.8
93.8 92.0 93.4 93.7 91.5
Weekly patronage of commercial facilities increased among elderly and future elderly households
The usage levels for all the commercial facilities had increased, especially for
supermarkets and hawker centres, which had risen significantly over the past five
years. A high proportion of elderly households patronised commercial facilities
like wet/dry market, supermarkets and hawker centres on a weekly basis (Table
4.37). However, a lower proportion of elderly households patronised food courts
and less than one in ten visited fast-food outlets weekly. This could be due to
hawker centres and eating houses/coffee shops being more affordable than food
courts. As for the lower patronage of fast-food outlets, it could be attributed to
the suitability and preferences of food served.
Weekly usage of most sports and recreational facilities increased among elderly and future elderly households
Among elderly households, usage levels for most of the sports and recreational
facilities had risen compared with five years ago, except for hard courts/multi-
purpose courts. Similarly, usage levels among future elderly households had
also increased, except for playgrounds/3G playgrounds and hard courts/multi-
purpose courts. However, usage levels of sports and recreational facilities were
generally lower among these two groups of elderly households, compared with all
households (Table 4.37). Fitness corners/jogging tracks and neighbourhood
park/common green were the two most popular facilities under this category, with
25.3% and 18.2% of elderly households frequenting these facilities at least once
a week, respectively. The usage level for playgrounds/3G playgrounds, roof

125
gardens at multi-storey carpark (MSCP) and hard courts/multi-purpose courts
were relatively low among elderly and future elderly households.
Covered linkway most well-utilised by elderly and future elderly households
The usage level of covered linkways on a weekly basis among both elderly and
future elderly households remained high (Table 4.37). This proportion had also
increased compared with five years ago, which could be due to the completion of
more linkways under upgrading programmes such as Neighbourhood Renewal
Programme (NRP).
Besides covered linkways, void deck areas and drop-off porches also saw higher
usage levels for both elderly and future elderly households, compared with other
precinct and community facilities. On the other hand, facilities such as
community clubs/centres and libraries were relatively less popular. The usage
levels for most of these facilities had also declined compared with five years ago,
especially for precinct pavilions.

126
Table 4.37 Usage Level of Estate Facilities among Elderly and Future Elderly Households by Year
Type of Facilities
Households Using Facilities At Least Once a Week (%)*
2003 2008 2013
Elderly All Elderly Future Elderly All Elderly Future Elderly All
Commercial Facilities Dry market 60.6 62.1 61.3 Wet market 85.5 85.7 72.6 68.9 66.4 Supermarket 57.0 70.3 72.6 67.5 77.0 80.0 Shop 56.2 63.6 48.4 52.8 59.3 54.2 57.4 63.5 Hawker centre 56.6 60.6 48.3 58.3 57.7 61.3 66.0 64.4 Eating house/coffee shop
50.0 59.1 59.5 54.8 62.6 61.6 Food court 23.6 40.3 44.4 29.3 40.6 45.3 Fast food outlet - - - - - 6.9 17.6 22.7
Sports & Recreational Facilities Fitness station/jogging track 14.7 18.8 21.2 23.2 24.6 25.3 25.3 27.4 Playground 4.7 17.9 7.0 8.4 16.3 8.9 6.6 16.5 Regional/town park
8.9 11.4 11.3 13.4 14.5 16.9
Neighbourhood park/common green 15.3 17.5 18.3 18.2 18.8 19.8 Hard/multi-purpose court 0.9 5.3 3.0 6.0 5.9 2.5 3.2 4.7 Roof garden at top level of MSCP - - - - - 3.6 6.8 8.4
Precinct & Community Facilities Covered linkway 57.3 69.1 69.8 78.6 77.3 78.4 82.1 82.3 Drop-off porch 13.4 20.5 25.6 32.5 35.7 23.8 31.4 36.2 Precinct pavilion 29.0 23.7 39.1 42.6 42.6 18.2 14.8 16.6 Pavilion shelter 16.9 12.3 20.6 18.7 20.6 18.0 15.3 16.4 Trellis - - 16.6 11.9 13.8 13.4 12.6 13.6 Void deck 27.4 20.3 35.7 34.3 32.3 30.9 25.8 25.6 Regional/community library 5.2 20.1 5.1 9.9 17.7 6.2 9.9 15.4 Community club 5.6 7.1 6.1 8.2 8.9 8.8 6.0 9.0
* Analysis is based on responses of households who were aware of such a facility in their estate/neighbourhood/town. Excluding non-response cases. ^ Items mentioned were grouped for the purpose of trend analysis
49.9
15.7
57.3
16.1
83.2^ 75.6^
16.3^
50.8^
86.8^ 73.2^
19.4^
62.3^
87.1^ 70.9^
20.7^
62.8^
84.6^ 76.8
19.6^
58.9^
87.7^ 72.4
20.3^
66.6^
89.2^ 72.0
22.4^
66.3^

127
4.3.3 Residential Mobility and Housing Aspirations
This section examines elderly residents’ preference to age-in-place, by analysing
their intention to move within the next five years, whether they wanted to age in
the same flat or town and the housing type that they would be contented with in
old age.
Most elderly had no intention to move, majority intended to age in existing flat
The majority of both elderly and future elderly residents had no intention to move
within the next five years (Chart 4.24). The proportion of elderly residents with
the intention to move declined from 7.8% in 2003 to 4.2% in 2013.
Chart 4.24 Intention to Move within Next Five Years among Elderly and Future Elderly by Year
For those with the intention to move, the main reason given by elderly residents
was to right-size to a smaller flat or to move in with their children. For future
elderly residents, they mainly wanted to right-size to a smaller flat, upgrade or
move to a better environment.
Elderly residents were asked where they intended to live in old age, in terms of
living in the same flat, moving to a different flat in the same town or moving to a
different town. The majority of elderly residents (80.9%) intended to age in the
same flat, with only 6.4% planning to live in a different flat but same or different
town. For future elderly residents, a lower proportion (61.7%) intended to age in
existing flat, while a higher proportion (15.2%) intended to live in a different flat
79.4 85.0 85.3 73.5 75.0 81.4
68.6 69.7
12.8 7.7 10.5 17.7 16.8
19.9 17.9
7.8 7.3 4.2 8.8 8.2 18.6 11.5 12.4
0
20
40
60
80
100
2003 2008 2013 2008 2013 2003 2008 2013
Hou
seho
lds
(%)
Moving
Unsure
Not Moving
Future Elderly All Elderly

128
but same or different town (Chart 4.25). Another 10.1% of elderly residents and
18.1% of future elderly residents had not thought about where they would want to
live in old age.
Chart 4.25 Where the Elderly and Future Elderly Intended to Live in Old Age
The main reason given by elderly residents who wanted to live in the same flat
was that the present flat was comfortable, they had an emotional attachment to
the flat or they wanted their children to inherit the flat. Similar reasons were cited
by future elderly residents. Hence, these findings indicate elderly residents’
preference to age-in-place.
Elderly residents who did not mind living in a different flat but same town cited
reasons such as wanting to cash out on their flat, moving into a smaller home for
easier maintenance, health reasons or due to decrease in household size.
However, they did not want to move away from their town due to centralised
location, good transportation network, familiar environment or sense of
attachment to their town. Similar reasons were given by future elderly residents.
For elderly residents who intended to move away from the town, they planned to
move in with children, move to a smaller flat for easier maintenance or health
reasons, or cash out on their flat for additional income. They did not mind moving
to another town with good transportation network, nearer to facilities or children’s
place. For future elderly residents, they intended to cash out on their flats, move
in with children or move to a smaller flat as household size had decreased.
Similar to elderly residents, they would move to another town with good
transportation networks and facilities or to be nearer to their children.
80.9 61.7
3.3 7.3
3.1 7.9
10.1 18.1
1.8 2.4 0.8 2.6
0
20
40
60
80
100
Elderly Future Elderly
Hou
seho
lds
(%)
Same Flat
Different Flat and Same Town
Different Town
Never Thought About It
Not Sure
Others (e.g. old folks' home, migrate)

129
Majority of elderly content with present flat
Overall, the majority of elderly (77.5%) and future elderly (65.2%) residents was
content with the flat types that they were currently residing in, similar to that of
2008 (Chart 4.26). These proportions were higher compared with that of all
households (57.5%), showing the stronger preference among elderly and future
elderly residents to age-in-place. Some 15.6% of elderly residents and 24.7% of
future elderly residents aspired to upgrade to better housing while lower
proportions (6.9% for elderly residents and 10.1% for future elderly residents)
were content with smaller flat types. The proportion that aspired for better
housing was also higher for both elderly and future elderly residents, compared
with 2008.
Chart 4.26 Housing Type Content With among Elderly and Future Elderly by Present Flat Type and Year
The most common housing type that elderly residents were content with
continued to be 3-room, followed by 4-room flats (Table 4.38). For future elderly
residents, 4-room and 3-room flats were the most popular, followed by 5-room
flats. The proportions who aspired to upgrade to private properties had increased
since 2008 for both elderly and future elderly residents.
12.1 6.9 14.7 10.1 12.7 7.5
77.4 77.5 65.6
65.2 58.7 57.5
10.5 15.6 19.7 24.7 28.6 35.0
0
20
40
60
80
100
2008 2013 2008 2013 2008 2013
Hou
seho
lds
(%) Content with
Better Housing or Flat Type
Content withPresent Flat Type
Content withSmaller Flat Type
Elderly All Future Elderly

130
Table 4.38 Housing Type Content With among Elderly and Future Elderly by Year
Housing Type Content With
2008 2013
Elderly Future Elderly All Elderly Future
Elderly All
HDB 1-Room 2-Room 3-Room 4-Room 5-Room Executive Apartment/ HUDC (Non-privatised) Studio Apartment
Private Property **
8.6 10.7 39.6 24.1 11.0 2.5
0.9
2.6
3.0 6.6 27.0 34.4 16.4 5.1
1.2
6.3
1.9 3.5 21.4 34.0 19.8 6.1
0.7
12.6
7.8 8.5 33.6 27.6 12.0 3.8
1.1
5.6
2.1 5.8 26.0 28.5 17.4 8.0
2.1
10.1
1.6 3.2 18.3 30.9 20.4 8.8
0.9
15.9
Total % 100.0 100.0 100.0 100.0 100.0 100.0
N* 91,493 128,179 858,316 112,712 144,442 905,882
* Excluding non-response cases ** Includes private apartment, private/executive condominium, terrace house, semi-detached
house, bungalow, private studio apartment, retirement village and overseas property
Elderly and future elderly preferred to live in 3- or 4-room flats when old
For both elderly and future elderly residents, 3- or 4-room flats were the preferred
type of housing for old age, similar to 2008. As the majority of elderly and future
elderly residents was currently residing in these flat types, it reinforced earlier
findings that showed older residents were strongly inclined to age-in-place (Table
4.39). The proportions who preferred to live in 5-room and bigger flat type and
Studio Apartment for old age had increased slightly from 2008 for both elderly
and future elderly residents, while those who preferred smaller flat types had
decreased slightly. This could be due to a higher proportion of elderly and future
elderly residents currently living in 5-room or bigger flat types compared with
2008 and wanting to age in their existing flat.

131
Table 4.39 Preferred Housing Type for Old Age among Elderly and Future Elderly by Year
Preferred Housing Type 2008 2013
Elderly Future Elderly Elderly Future Elderly
Purchased 1-Room 3.2 3.4 2.2 1.6 2-Room 9.5 7.3 8.2 5.9 3-Room 39.8 38.9 35.8 31.9 4-Room 22.1 22.8 23.4 24.9 5-Room & Bigger 10.0 13.1 13.5 16.4 Studio Apartment 1.8 3.2 2.7 6.7 Private Properties 0.4 1.3 0.7 2.1
Rented 1-Room 5.4 2.6 6.1 1.9 2-Room 4.8 3.6 4.5 3.6 3-Room 0.5 0.4 0.2 0.5 Private Properties - 0.1 0.3 -
Others (e.g. old folks’ home, retirement village) 2.5 3.3 2.4 4.5
Total % 100.0 100.0 100.0 100.0
N* 92,428 129,094 112,104 141,580
* Excluding non-response cases
4.4 Summary of Findings
Personal Aspects
In terms of their financial well-being, the regular sources of income that elderly
residents relied on were financial support from children, personal savings and
income from work. A higher proportion of future elderly residents would rely on
their personal savings and income from work, with fewer relying on their children
for financial support. Less than half of all elderly residents (40.9%) had
undertaken at least one financial option in planning for their retirement needs. In
comparison, a higher proportion of future elderly residents (58.0%) had done so,
indicating that they would be better prepared financially for retirement.
Compared with elderly and future elderly males, lower proportions of both elderly
and future elderly females had planned financially for retirement. However,
slightly higher proportions of both elderly and future elderly females had more
financial sources compared with males, as they were more likely to receive
financial support from children. They also received a higher average monthly
amount of financial support compared with male residents.
56.8 59.2 61.7 61.9
132
The majority of elderly (74.9%) and future elderly (73.5%) residents felt that their
sources of income were sufficient to cover their daily expenses. However, this
was lower compared with 2008, where eight in ten in both groups felt that their
income was adequate. A higher proportion of elderly residents who encountered
financial difficulties was living in smaller flat types. Despite being concerned
about rising cost of living and not having planned for retirement, only 11.8% of
elderly residents and 11.0% of future elderly residents had taken up at least one
monetisation option after turning 50 years old. The more popular options were
subletting a room in the flat for income, moving to a smaller resale HDB flat and
moving to a smaller new HDB flat. The majority of elderly residents (82.5%) also
had no intention to monetise in the next five years. They would rely on their
children or family members for financial support in the event that they
encountered major financial difficulties.
Social Aspects
Ties between elderly residents and their children remained strong. About nine in
ten of elderly residents with married children not living with them visited each
other at least once a month. About three in four of both elderly and future elderly
residents could also rely on their married children for physical support, and about
nine in ten could rely on married children for emotional support.
Elderly residents were engaging in less intensive neighbourly interactions
compared with 2008. Almost all elderly residents had casual interactions with
their neighbours through exchanging of greetings and casual conversations.
However, the proportions having more intense forms of interaction such as
visiting each other and exchanging food and gifts on festive occasions were lower.
Around half of elderly residents interacted with neighbours beyond their own
ethnic group. One in four (25.3%) of elderly residents also had interactions with
neighbours of different ethnic groups and nationalities, a significant increase from
2008 (11.8%). This could be due to elderly residents having more new
neighbours who would have resided in HDB estates for a shorter duration of time,
which might be a reason that neighbourly interactions were less intense as social
bonds would require time to develop. Common interaction places for both elderly
and future elderly residents with neighbours were along common corridors, lift
lobbies or void decks.
133
Community participation rate among elderly residents (47.1%) remained the
same compared with five years ago. Those who participated in community
activities were more likely to be living in bigger flat types and better educated.
Both elderly and future elderly residents also had a strong sense of community
and almost all of them felt a sense of belonging to their towns/estates.
Housing Aspects
Elderly residents were highly satisfied with their living environment. Overall, the
majority of elderly residents was satisfied with both their flat and neighbourhood,
citing the spaciousness of their flats or the friendly living environment as main
reason for their satisfaction. Most of them also viewed their flat to be value for
money and were proud of their home. Compared with 2008, they were more
satisfied with most aspects of the HDB living environment and were also satisfied
with the provision of estate facilities as well as elderly-friendly facilities.
Commercial facilities were popular among elderly residents as more than half of
elderly households patronised most of the commercial facilities in their
estates/neighbourhoods at least once a week. The usage levels of all
commercial facilities had increased compared with five years ago. The wet/dry
market and supermarket also garnered higher patronage levels compared with
the other commercial facilities. Higher weekly usage levels were also observed
for most sports and recreational facilities compared with five years ago. Elderly
residents also showed a strong preference to age-in-place as most had no
intention to move and were content with their current flat.

134
Conclusion
Social Well- Being of HDB Communities


137
Social Well-Being of HDB Communities
Conclusion
The SHS 2013 findings revealed that the overall social well-being of HDB
communities is high. Among a confluence of factors, this promising level of
social health could be attributed to the continual efforts of various agencies –
private and government, in keeping families together and engaging HDB
residents. These efforts ranged from pro-family policies, organised activities to
the provision of adequate spaces for residents to meet and interact. In this
respect, HDB is taking on an expanded role, going beyond being a provider of
public housing and facilities, to being a cultivator of community and family
relations, so as to help realise active and harmonious living in its towns/estates.
At the community level, while it was found that almost all HDB residents engaged
in some forms of neighbourly interactions, these interactions could be further
enhanced beyond the casual greetings of “hi” and “bye”. Residents could be
encouraged to engage in more intense forms of neighbourly interactions, such as
visiting one another, exchanging food and gifts during special occasions, hence
increasing familiarity among neighbours, strengthening their relationships. With
stronger bonds and accumulated wealth of goodwill, residents would be more
able to empathise with one another and display greater tolerance towards
neighbourly nuisances that might inevitable arise in today’s high-rise, high-
density living environment. Recognising this, HDB has initiated the Good
Neighbour Project, which encourages students and members in the community to
propose projects that could promote neighbourliness and bonding in HDB
neighbourhoods. Some of these programmes include helping residents with
writing their resumes, teaching fellow residents to check blood pressure and
drawing residents together to create art pieces.

138
Community activities are effective means to bring residents in the different
precincts or neighbourhoods together and for them to get to know one
another. While it was observed that participation level has increased over the
years, more efforts on finding out residents’ interests for specific courses or
activities can be made to increase participation further. Increasing participation
rate can also be achieved with greater awareness of activities being
organised. One of the ways is through the use of social media. In addition,
activities can be designed to cater for families with young children as children are
often catalysts for community participation among caregivers, e.g. parents and
grandparents. Activities could also be tailored to better suit the needs of elderly
residents to increase their participation rate.
Family ties have remained strong among HDB residents, with an increasing
proportion of married children living together or near their parents. For those not
living together, high proportions of married children and parents visited each
other at least once a month, engaging in activities such as sharing meals and
going on outings together. In terms of mutual care and support, a high proportion
of parents was able to rely on married children for physical, emotional and
financial support, and this increased with closer proximity. Frequency of visits
and sense of closeness to family members also increased with closer
proximity. Hence, the Married Child Priority Scheme and CPF Housing Grant for
Family are important HDB schemes and policies to encourage parents and
married children to live closer to one another for the provision of mutual care and
support.
On elderly residents’ financial well-being, the majority felt that their sources of
income were sufficient to cover their daily expenses, although this proportion was
lower than that of five years ago. While the majority could rely on their children
or other family members for financial assistance in the event that they encounter
financial difficulties, there were monetisation options that could be utilised by
elderly residents as potential sources of income should they wish to do so.
These included subletting of whole flat or one or more room(s), right-sizing to an
HDB Studio Apartment or a smaller flat, and applying for the Enhanced Lease
Buyback Scheme (LBS).

139
With regard to the built environment, most elderly residents were satisfied with
their flat and neighbourhood, as well as the provision of estate facilities. They
also intended to age in the same community, as only a small proportion intended
to move in the next five years and the majority intended to continue living in their
existing flat. With a strong preference to age-in-place, it is important to provide
more social support services and facilities for the growing proportion of elderly
residents in HDB estates. Hence, HDB initiatives and schemes such as
Enhancement for Active Seniors (EASE) and Home Improvement Programme
(HIP) would facilitate them to age-in-place.


TOA PAYOH
BUKIT PANJANG
CHOA CHU KANG
FARRER ROAD
BUKIT MERAH
CENTRAL AREA
PUNGGOL
HOUGANG ANG MO KIO
BISHAN
KALLANG WHAMPOA
GEYLANG
BEDOK
TAMPINES
PASIR RIS
CHANGI VILLAGE
YISHUN
SEMBAWANG WOODLANDS
BUKIT BATOK
JURONG EAST
JURONG WEST
CLEMENTI
QUEENSTOWN
MARINE PARADE ESTATE
BUKIT TIMAH ESTATE
CHANGI AIRPORT
SERANGOON
SENGKANG
HDB DEVELOPMENT AREAS
EXPRESSWAY
0 2000 4000
1000 3000 5000 Metres
HDB TOWNS AND ESTATES
HDB Hub 480 Lorong 6 Toa Payoh Singapore 310480HDB InfoWEB: www.hdb.gov.sg
ISBN 978-981-09-3829-1