Monitoring the Ocean from Observations - Euro-Argo RI · Monitoring the Ocean from Observations ......
18
20 years of progress in radar altimetry, Venice, September 2012 - 1 - Monitoring the Ocean from Observations Stéphanie Guinehut Marie-Hélène Rio Sandrine Mulet Anne-Lise Dhomps Gilles Larnicol
Transcript of Monitoring the Ocean from Observations - Euro-Argo RI · Monitoring the Ocean from Observations ......

20 years of progress in radar altimetry, Venice, September 2012 - 1 -
Monitoring the Ocean from Observations
Stéphanie Guinehut Marie-Hélène Rio
Sandrine Mulet Anne-Lise Dhomps
Gilles Larnicol

20 years of progress in radar altimetry, Venice, September 2012 - 2 -
Introduction Our approach :
– Consists of estimating 3D-thermohaline and current fields using ONLY observations and statistical methods
– Represents a complementary approach to the one developed by forecasting centers – based on model/assimilation techniques
– “Observation-based” component of the Global MyOcean Monitoring and Forecasting Center lead by Mercator Océan
Outline : Cooking method & ingredients Validation examples Ocean state estimates: T/S variability patterns, AMOC variability at 25°N Contribution and complementarities of the different observing system

20 years of progress in radar altimetry, Venice, September 2012 - 3 -
+ MDT estimate
The principle
Global 3D Ocean State [T,S,U,V,H]
Weekly – 1993-2010 [0-1500m] 24 levels
[1/3°]
MyOcean RT/REP
The products The method The observations
altimeter, SST, winds, geoid
T/S profiles, surface drifters
Guinehut et al., 2004 Guinehut et al., 2006 Larnicol et al., 2006
Rio et al., 2011 Guinehut et al., 2012
Mulet et al., 2012

20 years of progress in radar altimetry, Venice, September 2012 - 4 -
Global T/S Armor3D - Method 1
2
SLA, SST
in-situ T(z), S(z)
multiple linear regression
2
1
Armor3D T(z), S(z)
optimal interpolation
synthetic T(z), S(z)
vertical projection of satellite data (SLA, SST) combination of synthetic and in-situ profiles
T(x,y,z,t) = α(x,y,z,t).SLAsteric + β(x,y,z,t).SST’ + Tclim (x,y,z,t) S(x,y,z,t) = α’(x,y,z,t).SLAsteric + Sclim (x,y,z,t)
Guinehut, S., P.-Y. Le Traon, G. Larnicol and S. Philipps, 2004: Combining Argo and remote-sensing data to estimate the ocean three-dimensional temperature fields- A first approach based on simulated observations, J. Mar. Sys., 46 (1-4), 85-98.
Guinehut S., A.-L. Dhomps, G. Larnicol and P.-Y. Le Traon, 2012: High resolution 3D temperature and salinity fields derived from in situ and satellite observations. Accepted for publication in Ocean Sci.

20 years of progress in radar altimetry, Venice, September 2012 - 5 -
Relationship between surface and subsurface fields – Calculated from historical in situ observations – Estimates now global and seasonal thanks to the Argo array
Global T/S Armor3D - Method
DH-1500m/T-100m annual correlation
Very similar structures as a function of lat. and depth for all three oceans
Except for DH-S(z) in the NH
Baroclinic structures in the tropics
Barotropic structures at high lat
Seasonal variations found between SST-T(z) in direct relation to the variation of the mixed layer depth

20 years of progress in radar altimetry, Venice, September 2012 - 6 -
Armor3D - 1993-2010 reanalysis
Synthetic T’ – at 100m
SSALTO-DUACS MSLA 1/3° weekly DT - 04/07/2007 NCEP Reynolds OI-SST 1/4° daily - 04/07/2007
Arivo climatology – July – T at 100 m

20 years of progress in radar altimetry, Venice, September 2012 - 7 -
Armor3D - 1993-2010 reanalysis
Synthetic T’ – at 100m
Armor3D T’ Argo T’
In-situ observations – Coriolis data center

20 years of progress in radar altimetry, Venice, September 2012 - 8 -
Armor3D - Validation along the 2008 OVIDE cruise
Lherminier et al., 2007
Better estimation of the mesoscale structures (well constrained by satellite obs.)
Induce a better estimation of the large-scale signals

20 years of progress in radar altimetry, Venice, September 2012 - 9 -
Armor3D - From mesoscale to large-scale signals
Lherminier et al., 2007
Temperatures anomalies from the OVIDE 2008 section
inst
anta
neou
s La
rge-
scal
e
(> 4
00 k
m)
In situ only – OVIDE
Better estimation of the mesoscale structures
Induce a better estimation of the large-scale signals
Combined field – OVIDE
20 years of progress in radar altimetry, Venice, September 2012 - 10 -
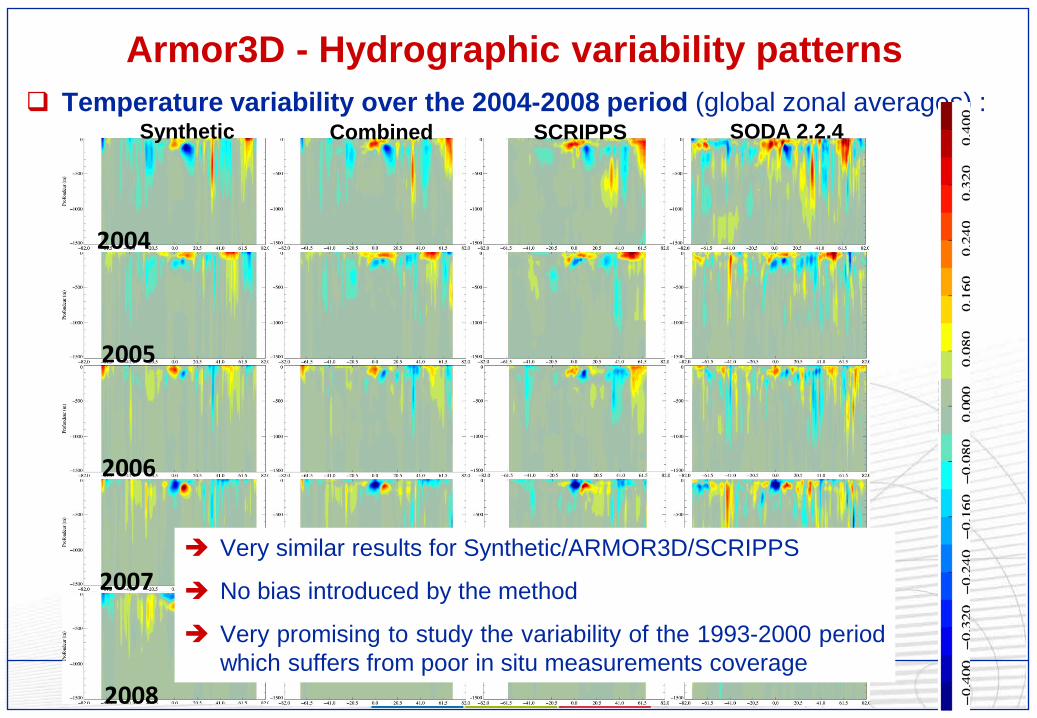
Temperature variability over the 2004-2008 period (global zonal averages) :
Armor3D - Hydrographic variability patterns
Combined SCRIPPS SODA 2.2.4
2004
2008
Synthetic
2005
2006
2007 Very similar results for Synthetic/ARMOR3D/SCRIPPS
No bias introduced by the method
Very promising to study the variability of the 1993-2000 period which suffers from poor in situ measurements coverage

20 years of progress in radar altimetry, Venice, September 2012 - 11 -
Temperature variability from 1993 to 2008 (global zonal averages) :
Hydrographic variability patterns
1993 1997 2001 2005
2008
1994
1995
1996
1998
1999
2000
2002
2003
2004
2006
2007

20 years of progress in radar altimetry, Venice, September 2012 - 12 -
Armor3D - Hydrographic variability patterns Salinity variability over the 2004-2008 period (global zonal averages) :
ARMOR3D SCRIPPS SODA 2.2.4 Synthetic
2004
2005
2006
2007
2008
Argo obs sys mandatory
Salinity also a challenge for model solutions
20 years of progress in radar altimetry, Venice, September 2012 - 13 -
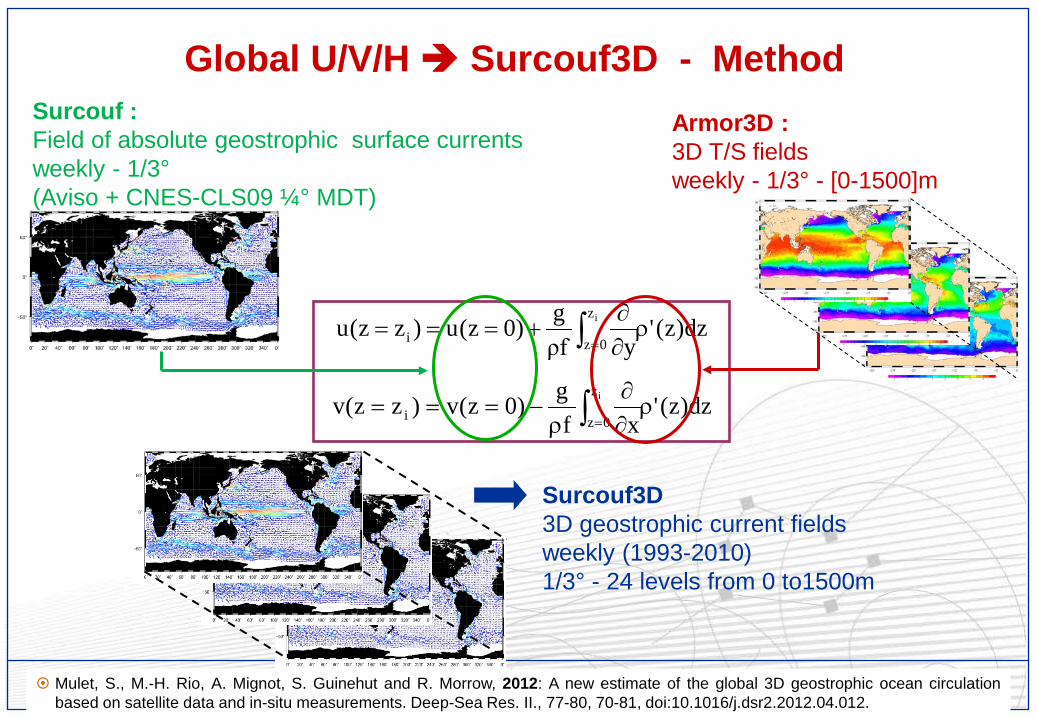
Global U/V/H Surcouf3D - Method
dz)z('yρf
g)0z(u)zz(u iz
0zi ρ∂∂
+=== ∫ =
dz)z('xf
g)0z(v)zz(v iz
0zi ρ∂∂
ρ−=== ∫ =
Surcouf : Field of absolute geostrophic surface currents weekly - 1/3° (Aviso + CNES-CLS09 ¼° MDT)
Armor3D : 3D T/S fields weekly - 1/3° - [0-1500]m
Surcouf3D 3D geostrophic current fields weekly (1993-2010) 1/3° - 24 levels from 0 to1500m
Mulet, S., M.-H. Rio, A. Mignot, S. Guinehut and R. Morrow, 2012: A new estimate of the global 3D geostrophic ocean circulation based on satellite data and in-situ measurements. Deep-Sea Res. II., 77-80, 70-81, doi:10.1016/j.dsr2.2012.04.012.

20 years of progress in radar altimetry, Venice, September 2012 - 14 -
Surcouf3D - Validation of the method * Parent et al., Poster : Global Eddy-Permitting
Ocean Reanalysis and Simulations of the Period 1992 to Present
2006 annual mean zonal velocities (cm/s) along a section in the Gulf Stream at 60°W
Higher values obtained in the Ekman layer than in the ocean interior, where error is less than 15%
Very similar results for the meridional component
Standard deviation of the differences between the GLORYS native and the reconstructed zonal current - % of the standard deviation of the native field
Using simulated fields from the Glorys reanalysis*

20 years of progress in radar altimetry, Venice, September 2012 - 15 -
Surcouf3D - Validation of 1000-m currents Global statistics over the Atlantic outside the equator (10°S-10°N) Comparison between 3 different methods (Surcouf3D, GLORYS, Armor3D) and in-situ
observations (ANDRO) at 1000 m over the 2006/2007 period (Taylor, 2001)
skill score
Meridional component
Standard deviation (cm/s)
Sta
ndar
d de
viat
ion
(cm
/s)
● SURCOUF3D (weekly, 1/3°)
▲GLORYS = Mercator-Ocean reanalysis (weekly, 1/4°) Ferry et al., 2010
♦ Armor3D = geostrophic current with level of no-motion at 1500m (weekly, 1/3°)
● ANDRO = 1000-m currents from drifting velocities from the Argo floats (≈10days, ≈50/100km) Ollitraut et al, 2010
Results are very similar for the zonal component
20 years of progress in radar altimetry, Venice, September 2012 - 16 -
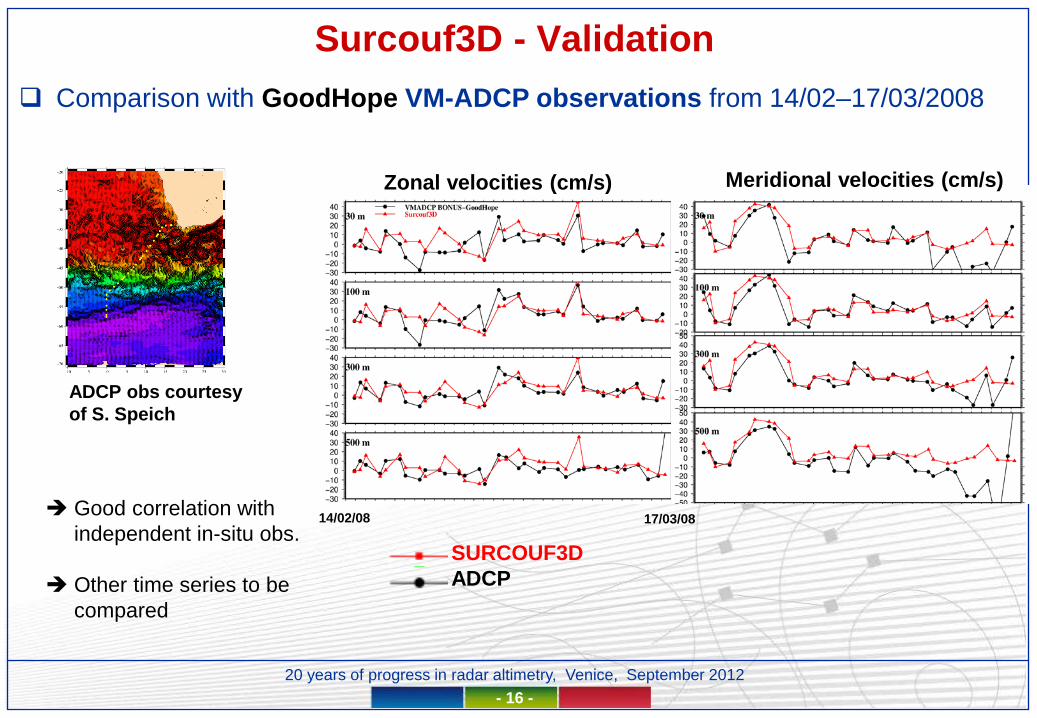
Surcouf3D - Validation Comparison with GoodHope VM-ADCP observations from 14/02–17/03/2008
SURCOUF3D ADCP
Good correlation with independent in-situ obs.
Other time series to be compared
ADCP obs courtesy of S. Speich
Zonal velocities (cm/s) Meridional velocities (cm/s)
14/02/08 17/03/08

20 years of progress in radar altimetry, Venice, September 2012 - 17 -
Surcouf3D - AMOC variability at 25°N
Very consistent with Bryden et al, 2005 High inter-annual variability Hard to distinguish a long-term trend
Floride Strait Transport from electrical cable
AMOC = Geost + Ekman + Florida (Surcouf3D, Bryden et al., 2005)
Ekman Transport from wind stress ERAInterim
Geostrophic Transport from 75°W to 15°W and from the surface to 1000m (Surcouf3D, Bryden et al., 2005)
Comparison with Bryden et al, 2005 (section at 24.5° from Africa to 73°W and at 26.5°N off Bahamas)
(Bryden et al,2005)
20 years of progress in radar altimetry, Venice, September 2012 - 18 -
Conclusions / Perspectives
All available observations of the ocean (satellite observations of SLA, SST, geoid and in situ observations of T/S profiles and drifting buoy velocities) are merged to produce weekly 3D maps of Temperature, Salinity, SSH and horizontal velocities from the surface to 1500m depth
Observation-based products (RT, REP) are distributed as part of the MyOcean EU project
They are very useful : to study the interannual variability of the hydrographic patterns, the AMOC … to perform intercomparison exercices to study the contribution and complementarities of the different observing systems
This will be continued in the future (MyOcean, GODAE/CLIVAR/GSOP)
The relevance and accuracy of the observation-based product estimates depend strongly on the existence of a complete, homogeneous, and sustainable ocean observing system (satellite & in situ)