Monitoring Storm Tide From Hurricane Michael Along the ...
20
Prepared in cooperation with the Federal Emergency Management Agency and Florida Division of Emergency Management Monitoring Storm Tide From Hurricane Michael Along the Northwest Coast of Florida, October 2018 Open-File Report 2019 – 1059 U.S. Department of the Interior U.S. Geological Survey
Transcript of Monitoring Storm Tide From Hurricane Michael Along the ...
Prepared in cooperation with the Federal Emergency Management Agency and Florida Division of Emergency Management
Monitoring Storm Tide From Hurricane Michael Along the Northwest Coast of Florida, October 2018
Open-File Report 2019–1059
U.S. Department of the InteriorU.S. Geological Survey

Front cover. Mexico Beach, Florida coastline. Photograph by John Moran. Copyrighted; used with permission.
Back cover. Mexico Beach, Fla. Photograph by John Moran. Copyrighted; used with permission.

Monitoring Storm Tide From Hurricane Michael Along the Northwest Coast of Florida, October 2018
By Michael J. Byrne, Sr.
Prepared in cooperation with the Federal Emergency Management Agency and Florida Division of Emergency Management
Open-File Report 2019–1059
U.S. Department of the InteriorU.S. Geological Survey

U.S. Department of the InteriorDAVID BERNHARDT, Secretary
U.S. Geological SurveyJames F. Reilly II, Director
U.S. Geological Survey, Reston, Virginia: 2019
For more information on the USGS—the Federal source for science about the Earth, its natural and living resources, natural hazards, and the environment—visit https://www.usgs.gov or call 1–888–ASK–USGS.
For an overview of USGS information products, including maps, imagery, and publications, visit https://store.usgs.gov.
Any use of trade, firm, or product names is for descriptive purposes only and does not imply endorsement by the U.S. Government.
Although this information product, for the most part, is in the public domain, it also may contain copyrighted materials as noted in the text. Permission to reproduce copyrighted items must be secured from the copyright owner.
Suggested citation:Byrne, M.J., Sr., 2019, Monitoring storm tide from Hurricane Michael along the northwest coast of Florida, October 2018: U.S. Geological Survey Open-File Report 2019–1059, 10 p., https://doi.org/10.3133/ofr20191059.
ISSN 0196-1497 (print)ISSN 2331-1258 (online)

iii
Acknowledgments
This mission would not be possible without the dedication of the U.S. Geological Survey field crews and office personnel as well as the generosity of the private citizens who granted access to their property to survey high water from Hurricane Michael.


v
ContentsAbstract ...........................................................................................................................................................1Introduction.....................................................................................................................................................1Hurricane Michael Storm-Tide Monitoring ..............................................................................................1
Instrumentation .....................................................................................................................................1Data Collection ......................................................................................................................................4Elevation Surveys..................................................................................................................................5Storm-Tide Data ...................................................................................................................................5
Conclusion.......................................................................................................................................................5References Cited ...........................................................................................................................................9
Figures
1. Map showing Hurricane Michael path and intensity, October 2018 ....................................2 2. Map showing location of water-level sensors used to monitor the timing,
areal extent, and magnitude of storm tide generated by Hurricane Michael, October 2018 ..................................................................................................................................3
3. Photograph of U.S. Geological Survey hydrologic technician Mose Willis installing a water-level sensor in St. Marks Florida .................................................................................4
4. Photograph of U.S. Geological Survey rapid deployment gage collecting real-time water-level and barometric pressure data at U.S. Highway 98 in Panama City Beach, Florida, August 2015 ........................................................................................................4
5. Map showing peak summary values with adjacent high-water marks from Ft. Walton Beach to Cedar Key, Florida, generated by Hurricane Michael, October 2018 ..................................................................................................................................6
6. Photograph of high-water mark in Port St. Joe, Florida, October 2018 ...............................7 7. Screenshot of an example hydrograph from the U.S. Geological Survey Flood Event
Viewer displaying storm-tide elevation and barometric pressure data recorded during Hurricane Michael at Mexico Beach, Florida, October 2018 ....................................7
8. Photograph of a Global Positioning System used to survey storm-tide elevation for Hurricane Michael in Mexico Beach, Florida, October 2017 ..........................................8
Tables
1. Hurricane Michael peak storm-tide data recorded at real-time monitoring stations in Florida ..........................................................................................................................5
2. Hurricane Michael representative sample of high-water marks .........................................9

vi
Conversion Factors
U.S. customary units to International System of Units
Multiply By To obtain
Length
foot (ft) 0.3048 meter (m)Velocity
mile per hour (mi/h) 1.609 kilometer per hour (km/h)
DatumVertical coordinate information is referenced to the North American Vertical Datum of 1988 (NAVD 88).
Horizontal coordinate information is referenced to the North American Datum of 1983 (NAD 83) unless otherwise noted.
Elevation, as used in this report, refers to distance above the vertical datum.
Abbreviations
ASCII American Standard Code for Information InterchangeGNSS Global Navigation Satellite SystemHWM high-water mark NetCDF Network Common Data FormNOAA National Oceanic and Atmospheric AdministrationRDG rapid deployment gageUSGS U.S. Geological Survey

Monitoring Storm Tide From Hurricane Michael Along the Northwest Coast of Florida, October 2018
By Michael J. Byrne, Sr.
AbstractHurricane Michael made landfall near Mexico Beach
and Tyndall Air Force Base in the Florida Panhandle, with maximum sustained winds over 160 miles per hour, on October 10, 2018. The maximum recorded storm tide was 15.55 feet above the North American Vertical Datum of 1988 (NAVD 88). The elevation of the maximum high-water mark, found in Port St. Joe, Florida, exceeded 20 feet above NAVD 88. The storm tide and winds destroyed much of the tourist town of Mexico Beach and caused extensive damage to the surrounding communities, including Tyndall Air Force Base, Panama City Beach, Port St. Joe, and Cape San Blas, Fla.
The U.S. Geological Survey (USGS), in cooperation with Federal Emergency Management Agency and Florida Division of Emergency Management, deployed a temporary monitoring network of water-level and barometric pressure sensors at 34 sites along the northwest coast of Florida to record the timing, areal extent, and magnitude of hurricane storm tide generated by Hurricane Michael. A total of 522 high-water marks were recovered and surveyed from 331 sites from Seaside, Fla. to Cedar Key, Fla. The USGS, in cooperation with Federal Emergency Management Agency and Florida Division of Emergency Management, displays real-time water-level data from long-term USGS streamflow stations, rapid deployment gages and National Oceanic and Atmospheric Administration tide-gage stations, updated hourly (or, in some cases, more frequently), through satellite telemetry, on the USGS Flood Event Viewer (https://stn.wim.usgs.gov/FEV/#Michael2018).
IntroductionHurricane Michael made landfall near Mexico Beach
and Tyndall Air Force Base in the Florida Panhandle, with maximum sustained winds over 160 miles per hour, on October 10, 2018 (fig. 1; Beven and others, 2019). The storm tide and winds destroyed much of the tourist town of Mexico Beach, population 1,285 (University of Florida Bureau of Economic and Business Research, 2018), and caused extensive damage to the surrounding communities, including Tyndall Air
Force Base, Panama City Beach, Port St. Joe, and Cape San Blas, Florida. The storm tide and high winds predominately impacted the Florida Panhandle from Panama City Beach through Apalachee Bay. The storm tide swept buildings off their foundations, undermined roads, and flooded homes and businesses. The estimated cost of damages from the storm tide exceeds $25 billion (National Oceanic and Atmospheric Administration [NOAA] National Centers for Environmental Information, 2019).
The U.S. Geological Survey (USGS), in cooperation with Federal Emergency Management Agency and Florida Division of Emergency Management, deployed a temporary monitoring network of water-level and barometric pressure sensors and rapid deployment gages (RDGs) at 36 sites along the northwestern coast of Florida to record the timing, areal extent, and magnitude of hurricane storm tide generated by Hurricane Michael (fig. 2). Storm tide, as defined by the National Oceanic and Atmospheric Administration (NOAA, 2013), is the water-level rise generated by a combination of storm surge and astronomical tide.
The deployment of sensors to measure water-level and barometric pressure and subsequent collection of high-water marks (HWMs) was completed as part of a coordinated Federal emergency response as outlined by the Robert T. Stafford Disaster Relief and Emergency Assistance Act (42 U.S.C. 5121 et seq.) under a directed mission assignment by the Federal Emergency Management Agency and Florida Division of Emergency Management.
Hurricane Michael Storm-Tide Monitoring
Instrumentation
Water-level and barometric pressure sensors (non-real-time sensors and real-time RDGs) were placed at sites selected to augment existing streamgage and tide-gage networks to ensure adequate monitoring in areas forecasted to experience storm tide. Non-real-time sensors record continuous data and must be manually downloaded to retrieve the data. Real-time RDGs record continuous data and transmit

2 Monitoring Storm Tide From Hurricane Michael Along the Northwest Coast of Florida, October 2018
Cedar Key
Tulsa
Tampa
Miami
Houston
Memphis
Orlando
Raleigh
Atlanta
Albany
Nashville
Charlotte
LouisvilleWashington
Kansas City
New Orleans
Saint Louis
JacksonvilleTallahassee
Virginia Beach
85° 70°75°80°90°95°
35°
30°
25°
20°
EXPLANATIONStorm category
Tropical depression
Tropical storm
Category 1
Category 2
Category 3
Category 4
Category 5
Florida Panhandle
Base from U.S. Geological Survey digital data 1:10,000,000 scale
FLORIDA
CUBA
MEXICO
GEORGIA
SOUTHCAROLINA
NORTHCAROLINA
ALABAMAMISSISSIPPI
TENNESSEE
VIRGINIA
WESTVIRGINIA
KENTUCKY
MISSOURIILLINOIS
INDIANAOHIO
LOUISIANA
ARKANSAS
OKLAHOMA
KANSAS
TEXAS
ATLANTIC OCEAN
GULF OF MEXICO
Seaside
Cape San BlasMexico Beach
Panama City Beach
Tallahassee
ApalacheeBay
Florida Panhandle
GULF OF MEXICO
Tyndall Air Force Base
0 100 200 300 MILES
0 100 200 300 KILOMETERS
Figure 1. Hurricane Michael path and intensity, October 2018. Map image is the intellectual property of Esri and is used herein under license. Copyright © 2018 Esri and its licensors. All rights reserved.

Introduction 3
X
X
X
X
X
X
X
X
X
X X
X
X
X
X
XX
X
X
X
X
X
X
X
X
X
X
X
X
X
X
X
XX
401
401
10
75
275
Seaside
St Marks
Cedar Key
Port St Joe
Mexico Beach
Apalachicola
Cape San Blas
Panama City
Beach
83°84°85°86°87°
31°
30°
29°
28°
0 20 40 MILES
0 20 40 KILOMETERS
Base from U.S. Census Bureau digital data 1:500,000-scale, 2017
Base from U.S. Geological Survey digital data 1:2,000,000-scale
EXPLANATION
X Water-level sensor
FLORIDA
GEORGIAALABAMASOUTH
CAROLINA
Studyarea
FLORIDAALABAMA
GEORGIA
GULF OF MEXICO
GULF OF MEXICO
ApalacheeBay
St. GeorgeIsland
Tyndall Air Force
Base
Figure 2. Location of water-level sensors used to monitor the timing, areal extent, and magnitude of storm tide generated by Hurricane Michael, October 2018.
4 Monitoring Storm Tide From Hurricane Michael Along the Northwest Coast of Florida, October 2018
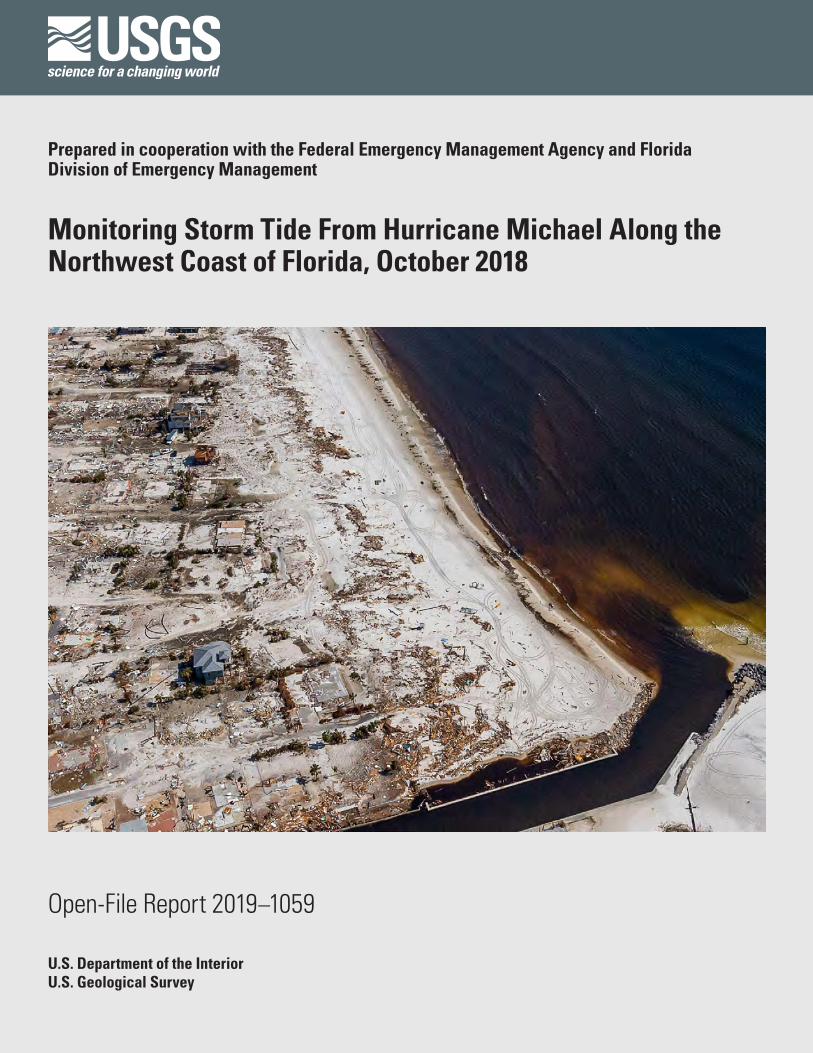
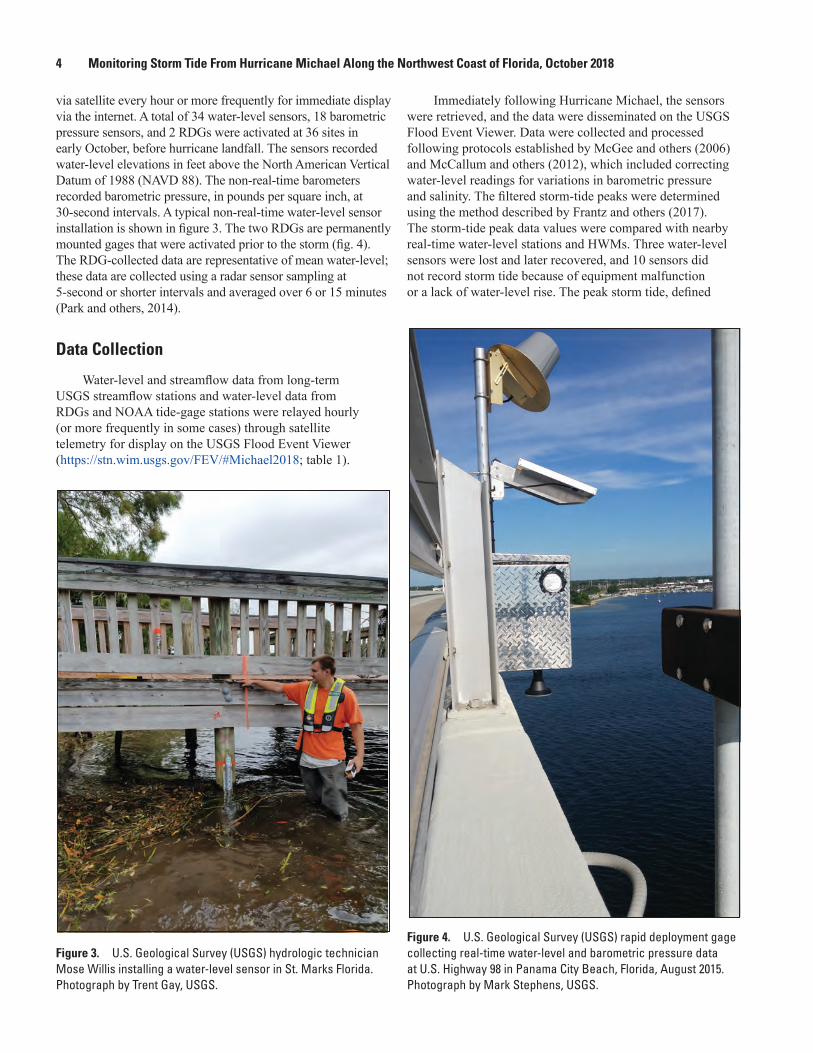
via satellite every hour or more frequently for immediate display via the internet. A total of 34 water-level sensors, 18 barometric pressure sensors, and 2 RDGs were activated at 36 sites in early October, before hurricane landfall. The sensors recorded water-level elevations in feet above the North American Vertical Datum of 1988 (NAVD 88). The non-real-time barometers recorded barometric pressure, in pounds per square inch, at 30-second intervals. A typical non-real-time water-level sensor installation is shown in figure 3. The two RDGs are permanently mounted gages that were activated prior to the storm (fig. 4). The RDG-collected data are representative of mean water-level; these data are collected using a radar sensor sampling at 5-second or shorter intervals and averaged over 6 or 15 minutes (Park and others, 2014).
Data Collection
Water-level and streamflow data from long-term USGS streamflow stations and water-level data from RDGs and NOAA tide-gage stations were relayed hourly (or more frequently in some cases) through satellite telemetry for display on the USGS Flood Event Viewer (https://stn.wim.usgs.gov/FEV/#Michael2018; table 1).
Figure 3. U.S. Geological Survey (USGS) hydrologic technician Mose Willis installing a water-level sensor in St. Marks Florida. Photograph by Trent Gay, USGS.
Immediately following Hurricane Michael, the sensors were retrieved, and the data were disseminated on the USGS Flood Event Viewer. Data were collected and processed following protocols established by McGee and others (2006) and McCallum and others (2012), which included correcting water-level readings for variations in barometric pressure and salinity. The filtered storm-tide peaks were determined using the method described by Frantz and others (2017). The storm-tide peak data values were compared with nearby real-time water-level stations and HWMs. Three water-level sensors were lost and later recovered, and 10 sensors did not record storm tide because of equipment malfunction or a lack of water-level rise. The peak storm tide, defined
Figure 4. U.S. Geological Survey (USGS) rapid deployment gage collecting real-time water-level and barometric pressure data at U.S. Highway 98 in Panama City Beach, Florida, August 2015. Photograph by Mark Stephens, USGS.

Conclusion 5
Table 1. Hurricane Michael peak storm-tide data recorded at real-time monitoring stations in Florida.
[Dates shown as month, day, year. Time shown in 24-hour format. Elevations are in feet above the North American Vertical Datum of 1988 (NAVD 88). USGS, U.S. Geological Survey; NOAA, National Oceanic and Atmospheric Administration; UTC, Coordinated Universal Time; N/A, not available]
Site identification Agency CountyLatitude Longitude
Site typePeak
storm-tide elevation
Peak storm-tide date and time
(UTC)Decimal degrees
8727520 NOAA Levy 29.1338 −83.0309 Real-time tide-gage 5.63 10/10/2018 1954
8728690 NOAA Franklin 29.7244 −84.9806 Real-time tide-gage 8.55 10/10/2018 1848
2327031 USGS Wakulla 30.0727 −84.3274 Real-time streamgage N/A N/A
2326550 USGS Taylor 30.1123 −83.9798 Real-time tide-gage 9.14 10/10/2018 2148
301116085443000 USGS Bay 30.1878 −85.7417 Rapid deployment gage 4.42 10/10/2018 1630
302341086305600 USGS Okaloosa 30.3948 −86.5156 Rapid deployment gage 3.72 10/10/2018 1235
8729210 NOAA Bay 30.2137 −85.8786 Real-time tide-gage 4.83 10/10/2018 1548
8729108 NOAA Bay 30.1517 −85.6664 Real-time tide-gage 6.09 10/10/2018 1806
as the maximum water elevation without wave action, was determined for 29 sites (fig. 5).
A total of 522 HWMs at 331 sites between Seaside, Fla. and Cedar Key, Fla. were flagged and surveyed relative to NAVD 88 following the techniques described in Koenig and others (2016) (fig. 6). HWM quality, which is an assessment of how accurately the mark represents the true storm-tide elevation, depends on the type and location of the mark. In general, marks found in enclosed spaces represent a more reliable measure of storm tide without wave action than debris lines found on the ground or along highways (Koenig and others, 2016). The location, description, surveyed water-level elevation, estimated survey measurement precision, and quality assessment for all HWMs can be found on the USGS Flood Event Viewer website (https://stn.wim.usgs.gov/FEV/#Michael2018). The data are updated every hour on USGS web pages, and an example of the data is shown in figure 7.
Elevation Surveys
Benchmarks throughout the study area were surveyed for vertical control. This control was established on permanent objects near the water-level sensors to relate the recorded water-surface elevation to NAVD 88. Graduated steel tapes were used to relate the elevations of the reference points to those of the water-level sensors. Survey-grade Global Navigation Satellite System (GNSS) equipment (fig. 8) was used to determine the NAVD 88 elevation of the reference points and HWMs, in accordance with USGS technical guidance (Rydlund and Densmore, 2012). All GNSS-determined NAVD 88 elevations in this report were derived using the GEOID12B model (National Geodetic Survey, 2017).
Storm-Tide Data
The maximum recorded storm tide was 15.55 ft above NAVD 88 (table 1). The maximum HWM (table 2), found in Port St. Joe, exceeded 20 ft above NAVD 88. The data from the Hurricane Michael storm-tide network are available in tab-delimited, American Standard Code for Information Interchange (ASCII) format and Network Common Data Form (NetCDF) format by site for each sensor by using the USGS Flood Event Viewer. Digital photographs for selected sites are also available on the viewer. Data available for each sensor include location, date, time, water level, water-level uncertainty, and barometric pressure. Data available for HWMs include location, description and quality of the mark, and elevation. The peak storm-tide values recorded at NOAA and USGS permanent stations are listed in table 1. A representative sample of HWMs is listed in table 2.
For GNSS-established elevations, the survey uncertainty of the recorded peak storm tide is available in the USGS Flood Event Viewer. The survey uncertainty was calculated using the methods described in Rydlund and Densmore (2012). The recorded peak storm tide at the long-term USGS monitoring sites and NOAA tide-gages (https://tidesandcurrents.noaa.gov/stations.html?type=Water+Levels) in the study area are shown in table 1 (NOAA, 2018).
ConclusionHurricane Michael made landfall near Mexico Beach
and Tyndall Air Force Base in the Florida Panhandle, with maximum sustained winds over 160 miles per hour, on October 10, 2018 (Beven and others, 2019). The U.S.

6 Monitoring Storm Tide From Hurricane Michael Along the Northwest Coast of Florida, October 2018
X
X
X
XX
XXX
X X
X
XX
X
X
X
X
XX
XX
X
XXXX
X
X
X
98.72
7.3N/A
6.2N/A
5.9N/A
6.2N/A
9.389.6
7.716.8
8.758.7
3.72N/A
3.31N/A
4.93N/A
9.79.24
8.228.4
5.936.1
8.428.72
7.635.54
8.268.51
4.864.52
5.485.75
5.475.62
8.678.95
8.019.24
4.424.54
5.1611.4
7.9110.42
15.5517.9
5.395.53
7.738.09
6.78N/A
Base from U.S. Census Bureau digital data 1:500,000-scale, 2017
Base from U.S. Geological Survey digital data 1:2,000,000-scale
Studyarea Cedar
Key
FLORIDA
GEORGIAALABAMASOUTH
CAROLINA
0 20 40 MILES
0 20 40 KILOMETERS
EXPLANATION
Water-level sensor and peak storm-tide elevation—in feet above North American Vertical Datum of 1988. Top value represents the peak storm tide elevation. Bottom value represents adjacent high-water mark
7.635.54
X
N/A Data not available
401
401
10
75
275
Seaside
Fort WaltonBeach
St Marks
CedarKey
Port St Joe
Mexico Beach
Apalachicola
Cape San Blas
Panama City
Beach
83°84°85°86°87°
31°
30°
29°
28°
GULF OF MEXICO
ApalacheeBay
GULF OF MEXICO
St. GeorgeIsland
FLORIDAALABAMA
GEORGIA
Figure 5. Peak summary values with adjacent high-water marks from Ft. Walton Beach to Cedar Key, Florida, generated by Hurricane Michael, October 2018.

Hurricane Michael Storm-Tide Monitoring 7
Figure 6. High-water mark in Port St. Joe, Florida, October 2018. Photograph by Michael Byrne, U.S. Geological Survey.
Figure 7. Example hydrograph from the U.S Geological Survey Flood Event Viewer (https://stn.wim.usgs.gov/FEV/#Michael2018) displaying storm-tide elevation and barometric pressure data recorded during Hurricane Michael at Mexico Beach, Florida, October 2018.

8 Monitoring Storm Tide From Hurricane Michael Along the Northwest Coast of Florida, October 2018
Figure 8. Global Positioning System used to survey storm-tide elevation for Hurricane Michael in Mexico Beach, Florida, October 2017. Photograph by Cody Hazelbaker, U.S. Geological Survey.
Geological Survey measured storm tide at 36 locations along the northwestern area of Florida. After the storm. The U.S. Geological Survey recovered and surveyed 522 high-water marks from Seaside, Florida to Cedar Key, Fla. The maximum recorded storm tide was 15.55 feet above the North American Vertical Datum of 1988 (NAVD 88) and the maximum high-water mark exceeded 20 feet. All the data are available on the U.S. Geological Survey Flood Event Viewer (https://stn.wim.usgs.gov/FEV/#Michael2018).
Real-time data provides emergency managers, first responders, the media, and the public with critical information
for identifying flood-affected areas and accurately directing assistance to affected communities. Data (real-time and non-real-time) collected during Hurricane Michael and other hurricanes can be used to calibrate and evaluate the performance of storm-tide models used to predict maximum and incremental water levels, the flood extent, and the site-specific effects of storm tide on natural and anthropogenic features of the environment (Frantz and others, 2017). These data can also guide future development, providing insight into areas potentially vulnerable to storm tide.

References Cited 9
Table 2. Hurricane Michael representative sample of high-water marks.
[USGS, U.S. Geological Survey; HWM, high-water mark; ft, foot; NAVD 88, North American Vertical Datum of 1988; ±, plus or minus]
USGSsite identification
CityLatitude Longitude HWM surveyed
elevation (ft above NAVD 88)
HWM survey uncertainty (± ft)Decimal degrees
FLBAY27793 Panama City 30.1760 −85.7069 4.98 0.02FLBAY27785 Panama City 30.1633 −85.6830 5.74 0.02FLBAY27782 Panama City 30.1423 −85.6486 6.85 0.04FLBAY27665 Mexico Beach 29.9612 −85.4404 18.70 0.06FLBAY27701 Mexico Beach 29.9533 −85.4286 17.12 0.01FLBAY27715 Mexico Beach 29.9472 −85.4172 18.22 0.04FLBAY27720 Mexico Beach 29.9383 −85.4028 16.60 0.06FLGUL27658 Port St. Joe 29.9252 −85.3882 21.16 0.05FLGUL27583 Port St. Joe 29.8135 −85.3053 10.13 0.01FLGUL27587 Port St. Joe 29.8128 −85.3019 11.18 0.01FLGUL27663 Port St. Joe 29.9221 −85.3846 20.35 0.05FLGUL27814 Cape San Blas 29.7760 −85.4024 9.93 0.00FLGUL27597 Cape San Blas 29.7485 −85.3976 9.38 0.02FLGUL27708 Cape San Blas 29.6943 −85.3738 10.51 0.02FLGUL27632 Cape San Blas 29.6852 −85.2966 11.42 0.02FLFRA27672 Apalachicola 29.7138 −85.0157 9.17 0.01FLFRA27667 Apalachicola 29.7186 −84.9878 8.95 0.01FLFRA27661 Apalachicola 29.7296 −84.9873 8.27 0.01FLFRA27600 St. George Island 29.6400 −84.9208 7.96 0.06FLFRA27699 St. George Island 29.6661 −84.8609 8.43 0.07FLFRA27681 St. George Island 29.6734 −84.8267 5.48 0.01FLFRA27694 St. George Island 29.6897 −84.7886 8.70 0.01
References Cited
Beven, J.L. II, Berg, R., and Hagen, A., 2019, Tropical cyclone report, Hurricane Michael: National Weather Service, National Hurricane Center Tropical Cyclone Report AL142018, 86 p., accessed April 29, 2019, at https://www.nhc.noaa.gov/data/tcr/AL142018_Michael.pdf.
Frantz, E.R., Byrne, M.J., Caldwell, A.W., and Harden, S.L., 2017, Monitoring storm tide and flooding from Hur-ricane Matthew along the Atlantic Coast of the United States, October 2016: U.S. Geological Survey Open-File Report 2017–1122, 37 p., accessed November 8, 2018, at https://doi.org/10.3133/ofr20171122.
Koenig, T.A., Bruce, J.L., O’Connor, J.E., McGee, B.D., Holmes, R.R., Jr., Hollins, R., Forbes, B.T., Kohn, M.S., Schellekens, M.F., Martin, Z.W., and Peppler, M.C., 2016, Identifying and preserving high-water mark data: U.S. Geological Survey Techniques and Methods, book 3, chap. A24, 47 p., accessed November 8, 2018, at https://doi.org/10.3133/tm3A24.
McCallum, B.E., Painter, J.A., and Frantz, E.R., 2012, Monitoring storm tide and flooding from Hurricane Irene along the Atlantic Coast of the United States, August 2011: U.S. Geological Survey Open-File Report 2012–1022. [Also available at https://pubs.usgs.gov/of/2012/1022/.]
10 Monitoring Storm Tide From Hurricane Michael Along the Northwest Coast of Florida, October 2018
McGee, B.D., Goree, B.B., Tollett, R.W., Woodward, B.K., and Kress, W.H., 2006, Hurricane Rita surge data, southwestern Louisiana and southeastern Texas, September to November 2005: U.S. Geological Survey Data Series 220. [Also available at https://pubs.usgs.gov/ds/2006/220/.]
National Geodetic Survey, 2017, Notice—NGS update, May 16, 2017, Technical details for GEOID12/12A/12B: National Geodetic Survey Geoid web page, accessed February 27, 2018, at https://www.ngs.noaa.gov/GEOID/GEOID12B/GEOID12B_TD.shtml.
National Oceanic and Atmospheric Administration [NOAA], 2013, Storm QuickLook: National Oceanic and Atmospheric Administration web page, accessed February 27, 2018, at https://tidesandcurrents.noaa.gov/quicklook.html.
National Oceanic and Atmospheric Administration [NOAA], 2018, Tides & currents: National Oceanic and Atmospheric Administration web page, accessed November 8, 2018, at https://tidesandcurrents.noaa.gov/sta-tions.html?type=Water+Levels.
National Oceanic and Atmospheric Administration [NOAA] National Centers for Environmental Information, 2019, U.S. billion-dollar weather and climate disasters: National Oceanic and Atmospheric Administration website, accessed April 29, 2019, at https://www.ncdc.noaa.gov/billions/.
Park, J., Heitsenrether, R., and Sweet, W., 2014, Water level and wave height estimates at NOAA tide stations from acoustic and microwave sensors: Journal of Atmospheric and Oceanic Technology, v. 31, p. 2294–2308, accessed November 8, 2018, at https://journals.ametsoc.org/doi/abs/10.1175/JTECH-D-14-00021.1.
Rydlund, P.H., Jr., and Densmore, B.K., 2012, Methods of practice and guidelines for using survey-grade Global Navi-gation Satellite Systems (GNSS) to establish vertical datum in the United States Geological Survey: U.S. Geological Survey Techniques and Methods, book 11, chap. D1, 102 p., with appendixes. [Also available at https://pubs.usgs.gov/tm/11d1/tm11-D1.pdf.]
University of Florida Bureau of Economic and Business Research, 2018, Mexico City Beach Population: Accessed November 20, 2018, at https://www.bebr.ufl.edu/.

For more information about this publication, contact
Director, Caribbean-Florida Water Science CenterU.S. Geological Survey4446 Pet Lane, Suite 108Lutz, FL 33559(813) 498-5000
For additional information visit https://www2.usgs.gov/water/caribbeanflorida/index.html
Publishing support provided byLafayette Publishing Service Center

Byrne—M
onitoring Storm Tide From
Hurricane M
ichael Along the N
orthwest Coast of Florida, O
ctober 2018—Open-File Report 2019–1059
ISSN 0196-1497 (print)ISSN 2331-1258 (online)https://doi.org/10.3133/seriesofr20191059