MONITORING POST-FIRE VEGETATION RECOVERY · PDF filemonitoring post-fire vegetation recovery...
10
MONITORING POST-FIRE VEGETATION RECOVERY OF WILDLAND FIRE AREAS IN THE WESTERN UNITED STATES USING MODIS DATA Brad Quayle Ken Brewer Kelly Williams USDA Forest Service Remote Sensing Applications Center Salt Lake City, UT 84119 [email protected] [email protected] [email protected] ABSTRACT Satellite-based remote sensing provides land managers with an excellent tool to assess and monitor post-fire vegetation conditions. Information gleaned from multi-temporal analyses facilitates an understanding of the overall vegetation recovery within burned areas and the ability to identify localized areas that may require mitigation. The vast majority of wildland fires that occur annually in the United States are distributed widely throughout the western states. Consequently, the utilization of relatively high-resolution sensors for comprehensive, long-term vegetation recovery monitoring of numerous wildland fire areas over such a large geographic area can be prohibitive. This is particularly true when high frequency observations are desirable to assess intra- and inter-annual changes in post-fire vegetation conditions. This paper demonstrates the use of synoptic, moderate resolution image data acquired by MODIS (Moderate Resolution Imaging Spectroradiometer) as a cost effective means for comprehensive, long-term vegetation recovery monitoring of recent wildland fires in the western United States. MODIS’ high temporal resolution and extensive data record can be leveraged with established remote sensing-based techniques to monitor and quantify vegetation recovery in burned areas. INTRODUCTION In the past several years, wildland fire has become an increasingly dominant agent of change across Forest Service and other public lands in the western United States. Since the year 2000, over 3.2 million hectares have burned on National Forest System lands (National Interagency Coordination Center 2005a; National Interagency Coordination Center 2005b). The majority of this fire activity has occurred on Forest Service land holdings in 15 western states including Arizona, California, Colorado, Idaho, Kansas, Montana, Nebraska, Nevada, New Mexico, North Dakota, Oregon, South Dakota, Utah, Washington and Wyoming (Figure 1). These fire areas are widely distributed geographically and characterized by several large catastrophic wildfire events. The regeneration of vegetation cover after fire is a key component to restoring fire impacted watersheds and ecosystems, particularly, following high severity fire events. Remote sensing technologies can be used to assess and map the effects of fire on vegetation conditions and subsequent vegetation recovery trends over time (White et al. 1996). Since the 2000 fire season, the Forest Service has conducted operational satellite-based post-fire vegetation assessments for most large and/or significant wildland fires on Forest Service lands using relatively high- resolution sensor data acquired primarily by Landsat 5 TM and Landsat 7 ETM+ (Gmelin and Brewer, 2002; Orelmann 2002). These rapid, post-fire assessments are conducted for designated fires immediately after fire containment and suppression to support the efforts of Burned Area Emergency Response (BAER) teams. Geospatial data gleaned from these emergency assessments provide remote sensing-based estimates of burn severity - empirically categorized as unburned, low, moderate and high - used by BAER teams to target locations for land stabilization measures and mitigate potential hazards. Pecora 16 “Global Priorities in Land Remote Sensing” October 23 – 27, 2005 * Sioux Falls, South Dakota
Transcript of MONITORING POST-FIRE VEGETATION RECOVERY · PDF filemonitoring post-fire vegetation recovery...
MONITORING POST-FIRE VEGETATION RECOVERY OF WILDLAND FIRE AREAS IN THE WESTERN UNITED STATES USING MODIS DATA
Brad Quayle Ken Brewer
Kelly Williams USDA Forest Service
Remote Sensing Applications Center Salt Lake City, UT 84119
[email protected]@fs.fed.us
ABSTRACT Satellite-based remote sensing provides land managers with an excellent tool to assess and monitor post-fire vegetation conditions. Information gleaned from multi-temporal analyses facilitates an understanding of the overall vegetation recovery within burned areas and the ability to identify localized areas that may require mitigation. The vast majority of wildland fires that occur annually in the United States are distributed widely throughout the western states. Consequently, the utilization of relatively high-resolution sensors for comprehensive, long-term vegetation recovery monitoring of numerous wildland fire areas over such a large geographic area can be prohibitive. This is particularly true when high frequency observations are desirable to assess intra- and inter-annual changes in post-fire vegetation conditions. This paper demonstrates the use of synoptic, moderate resolution image data acquired by MODIS (Moderate Resolution Imaging Spectroradiometer) as a cost effective means for comprehensive, long-term vegetation recovery monitoring of recent wildland fires in the western United States. MODIS’ high temporal resolution and extensive data record can be leveraged with established remote sensing-based techniques to monitor and quantify vegetation recovery in burned areas.
INTRODUCTION
In the past several years, wildland fire has become an increasingly dominant agent of change across Forest Service and other public lands in the western United States. Since the year 2000, over 3.2 million hectares have burned on National Forest System lands (National Interagency Coordination Center 2005a; National Interagency Coordination Center 2005b). The majority of this fire activity has occurred on Forest Service land holdings in 15 western states including Arizona, California, Colorado, Idaho, Kansas, Montana, Nebraska, Nevada, New Mexico, North Dakota, Oregon, South Dakota, Utah, Washington and Wyoming (Figure 1). These fire areas are widely distributed geographically and characterized by several large catastrophic wildfire events.
The regeneration of vegetation cover after fire is a key component to restoring fire impacted watersheds and ecosystems, particularly, following high severity fire events. Remote sensing technologies can be used to assess and map the effects of fire on vegetation conditions and subsequent vegetation recovery trends over time (White et al. 1996). Since the 2000 fire season, the Forest Service has conducted operational satellite-based post-fire vegetation assessments for most large and/or significant wildland fires on Forest Service lands using relatively high-resolution sensor data acquired primarily by Landsat 5 TM and Landsat 7 ETM+ (Gmelin and Brewer, 2002; Orelmann 2002). These rapid, post-fire assessments are conducted for designated fires immediately after fire containment and suppression to support the efforts of Burned Area Emergency Response (BAER) teams. Geospatial data gleaned from these emergency assessments provide remote sensing-based estimates of burn severity - empirically categorized as unburned, low, moderate and high - used by BAER teams to target locations for land stabilization measures and mitigate potential hazards.
Pecora 16 “Global Priorities in Land Remote Sensing” October 23 – 27, 2005 * Sioux Falls, South Dakota

Figure 1. Areas of wildland fire activity (red) in the western United States from 2000 through August 2005. Forest
Service lands are highlighted in green. (Fire polygon data courtesy of USGS GeoMAC; Note: Data may be incomplete in some areas).
In the years following a fire, local Forest Service land managers are directed to monitor the effectiveness of
emergency stabilization measures implemented by BAER teams as well as the general vegetation recovery throughout the fire area (Forest Service Handbook 2509.13-95-13). Consequently, continued long-term, multi-temporal remote sensing-based assessments could improve the ability of Forest Service land managers to monitor the dynamics of post-fire vegetation regeneration at a landscape level. These assessments could be conducted at user-defined intervals and provide synoptic coverage of large areas. Information gleaned from operational remote sensing-based post-fire vegetation assessments could also be used in the context of other available information and environmental indicators to assess the recovery state of impacted watersheds and ecosystems.
Currently, however, such a program for post-fire vegetation monitoring of large fire areas on Forest Service lands is not provided. To maximize the utility of such a program, multiple image acquisitions on an annual basis would be desirable to provide land managers with an assessment of vegetation conditions at various phenological stages. The implementation of a comprehensive, long-term monitoring program for the numerous fires throughout the western United States using Landsat or similar resolution commercial sensors would be logistically and economically prohibitive. Objective
The objective of this study is to investigate the utility of the Moderate Resolution Imaging Spectroradiometer (MODIS) to monitor trends of vegetation recovery at a landscape scale for selected fire areas in the western United States. The Forest Service Remote Sensing Applications Center (RSAC) has experience using MODIS imagery for active fire detection and assessment (Quayle and Lannom, 2004), and higher resolution imagery (e.g., Landsat) for
Pecora 16 “Global Priorities in Land Remote Sensing” October 23 – 27, 2005 * Sioux Falls, South Dakota

BAER assessments. The use of MODIS for ongoing, post-fire vegetation assessments could complement observations by higher resolution sensors and assist Forest Service land managers in meeting monitoring objectives. MODIS, the Normalized Difference Vegetation Index and the Regeneration Index
Post-fire vegetation conditions can be assessed and monitored using Normalized Difference Vegetation Index (NDVI) information derived from relatively high-resolution remote sensing data (Riano et al., 2002; Sun et al., 2002; Diaz-Delgado et al., 1998; Viedma et al., 1997; White et al., 1996). Based on the fact that wildland fire areas in the western United States can frequently range from several tens of thousands to hundreds of thousands of acres in size, 250-meter MODIS NDVI information can effectively be used to monitor the spatial and temporal variations in post-fire vegetation conditions and trends at a landscape level. Additionally, MODIS provides daily observations of the mid to high latitudes maximizing the opportunity for cloud-free observations. The MODIS data record (year 2000 to present) also coincides with overall trend of increased fire activity in the western United States over the past six years. Furthermore, MODIS image data is available free of charge providing a cost-effective alternative for long-term vegetation monitoring of burned areas.
To be useful for monitoring, vegetation index data needs to be comparable over time and space (Huete et al., 1999). As a result, using NDVI data derived from multi-temporal imagery for post-fire vegetation monitoring requires image normalization to remove the effects of environmental and instrument-related “noise factors that reduce the detection of regeneration patterns” (Riano et al., 2002). These factors may include sensor calibration issues, imperfect atmospheric correction, terrain effects, and differences in phenology (Riano et al., 2002). To remove these “noise factors” from the process of assessing vegetation regeneration using NDVI, Diaz-Delgado and others (1998) implemented an approach that utilizes a nearby unburned control area with spectral and environmental characteristics similar to the pre-burn state of the fire area. For each image observation, the mean NDVI value of the fire area is calculated and divided by the calculated mean NDVI value of the control area. This ratio, referred to as the Regeneration Index (RI), removes the various effects that can impact radiometric consistency for multi-temporal images and thus standardizes multi-temporal measures of NDVI (Riano et al., 2002). RI is calculated as follows:
control
fireNDVI
NDVINDVIRI =
RI values range between 0 and 1. As the RI approaches a value of 1, the fire area is nearing its pre-fire
greenness condition based on comparison to the control area vegetation conditions (Riano et al. 2002; Diaz-Delgado et al., 1998). This evaluation of post-fire vegetation monitoring with MODIS will also utilize RI to normalize NDVI results from multi-temporal MODIS image acquisitions.
Study Area
To maximize the temporal extent of the MODIS data record, three large fires in the western United States from the 2000 fire season were selected for this evaluation. The selected fires included the Clear Creek fire, the Diamond Complex and the R1 Wilderness Complex. All three fires occurred in an approximately 100x80 kilometer area within the Salmon River Canyon area of central Idaho (Figure 2). The Salmon River Canyon area is a rugged area, dominated by evergreen forest. Open, relatively dry ponderosa pine and Douglas Fir forests are prevalent on southerly aspects with dense lodgepole pine, grand fir and subalpine fir forests on northerly slopes (Finco et al., 1999). The area is largely under Forest Service management with the Frank Church-River of No Return Wilderness encompassing the majority of the general area.
The Diamond Complex and R1 Wilderness Complex consisted of multiple fires that merged during the course of the summer. For analysis purposes, individual fire areas within each complex were treated as one fire area for this study. Fire area calculated from incident GIS perimeter data and best available detection and control dates from interagency fire records for each fire are listed in Table 1. Although official fire control dates are listed for late in the year, visual analysis of September 26, 2000 MODIS image in Figure 2 shows that fire activity had essentially concluded for all three fires.
Pecora 16 “Global Priorities in Land Remote Sensing” October 23 – 27, 2005 * Sioux Falls, South Dakota

Figure 2. September 26, 2000 post-fire MODIS false color composite (MODIS bands 2, 1, & 1) of the general area
surrounding the Clear Creek, Diamond Complex and R1 Wilderness Complex fire areas.
Table 1. Fire acreages and associated fire detection and control dates. Fire Area (ha) Detection Date Control Date
Clear Creek 80,543 July 8, 2000 December 11, 2000 Diamond Complex 73,733 July 31, 2000 November 22, 2000
R1 Wilderness Complex 44,874 July 31, 2000 November 22, 2000
METHODS Fire Perimeters
Fire perimeter data for the year 2000 fires were acquired from the USGS GeoMAC (http://geomac.usgs.gov) in vector format. These data are typically delineated at individual incidents using airborne Global Positioning Systems (GPS). The geographic location and extent of each fire area was determined from fire perimeter data. Fire perimeter data for each of the fire areas were projected to a localized Lambert Azimuthal Equal Area projection centered on the general location of the three fires and rasterized at a spatial resolution of 250 meters. MODIS Image Data Acquisition and Processing
A cursory review of daily MODIS Land Global Browse images (http://landweb.nascom.nasa.gov/browse/) and MODIS Rapid Response Near Real Time Level 2 Browse images (http://rapidfire.sci.gsfc.nasa.gov/) was conducted for the years 2000 through 2005 to identify suitable image acquisitions for vegetation recovery monitoring. Best available, temporally distributed Terra MODIS data acquisitions between the dates of June 1 to October 15 for the years 2000, 2001, 2002, 2003, 2004 and 2005 were considered. Additionally, to eliminate effects of extreme off-nadir views, the only image acquisitions considered were those with sensor view angles of 45 degrees or less for the majority of the general area containing the three fires. Images were selected based upon the overall quality for the entire general fire area, not individual fires.
A total of twenty-seven cloud-free, or nearly cloud-free dates were identified (Table 2). Due to the truncated MODIS data record for the first half of 2000, only one suitable pre-burn image was identified – June 25, 2000. Perennially cloudy conditions during the June timeframe limited the number of quality, early summer observations for the general fire area.
Pecora 16 “Global Priorities in Land Remote Sensing” October 23 – 27, 2005 * Sioux Falls, South Dakota
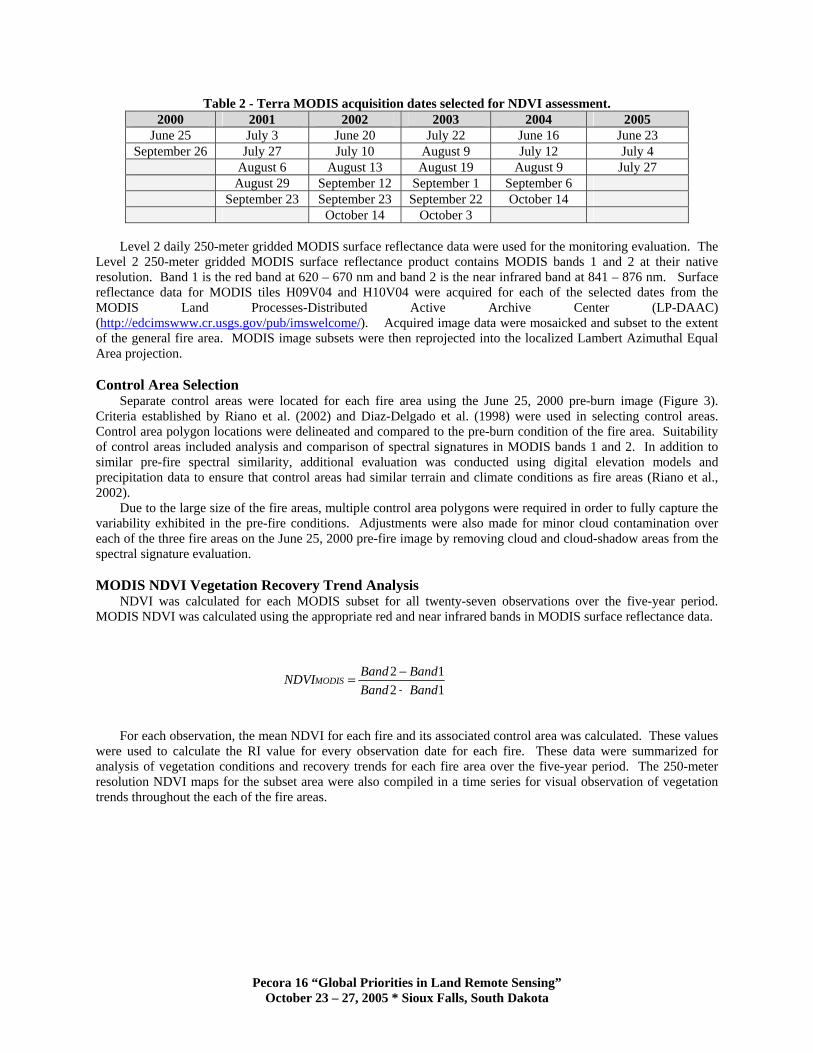
Table 2 - Terra MODIS acquisition dates selected for NDVI assessment. 2000 2001 2002 2003 2004 2005
June 25 July 3 June 20 July 22 June 16 June 23 September 26 July 27 July 10 August 9 July 12 July 4
August 6 August 13 August 19 August 9 July 27 August 29 September 12 September 1 September 6 September 23 September 23 September 22 October 14 October 14 October 3
Level 2 daily 250-meter gridded MODIS surface reflectance data were used for the monitoring evaluation. The
Level 2 250-meter gridded MODIS surface reflectance product contains MODIS bands 1 and 2 at their native resolution. Band 1 is the red band at 620 – 670 nm and band 2 is the near infrared band at 841 – 876 nm. Surface reflectance data for MODIS tiles H09V04 and H10V04 were acquired for each of the selected dates from the MODIS Land Processes-Distributed Active Archive Center (LP-DAAC) (http://edcimswww.cr.usgs.gov/pub/imswelcome/). Acquired image data were mosaicked and subset to the extent of the general fire area. MODIS image subsets were then reprojected into the localized Lambert Azimuthal Equal Area projection. Control Area Selection
Separate control areas were located for each fire area using the June 25, 2000 pre-burn image (Figure 3). Criteria established by Riano et al. (2002) and Diaz-Delgado et al. (1998) were used in selecting control areas. Control area polygon locations were delineated and compared to the pre-burn condition of the fire area. Suitability of control areas included analysis and comparison of spectral signatures in MODIS bands 1 and 2. In addition to similar pre-fire spectral similarity, additional evaluation was conducted using digital elevation models and precipitation data to ensure that control areas had similar terrain and climate conditions as fire areas (Riano et al., 2002).
Due to the large size of the fire areas, multiple control area polygons were required in order to fully capture the variability exhibited in the pre-fire conditions. Adjustments were also made for minor cloud contamination over each of the three fire areas on the June 25, 2000 pre-fire image by removing cloud and cloud-shadow areas from the spectral signature evaluation. MODIS NDVI Vegetation Recovery Trend Analysis
NDVI was calculated for each MODIS subset for all twenty-seven observations over the five-year period. MODIS NDVI was calculated using the appropriate red and near infrared bands in MODIS surface reflectance data.
1212
BandBandBandBandNDVIMODIS
+−=
For each observation, the mean NDVI for each fire and its associated control area was calculated. These values were used to calculate the RI value for every observation date for each fire. These data were summarized for analysis of vegetation conditions and recovery trends for each fire area over the five-year period. The 250-meter resolution NDVI maps for the subset area were also compiled in a time series for visual observation of vegetation trends throughout the each of the fire areas.
Pecora 16 “Global Priorities in Land Remote Sensing” October 23 – 27, 2005 * Sioux Falls, South Dakota
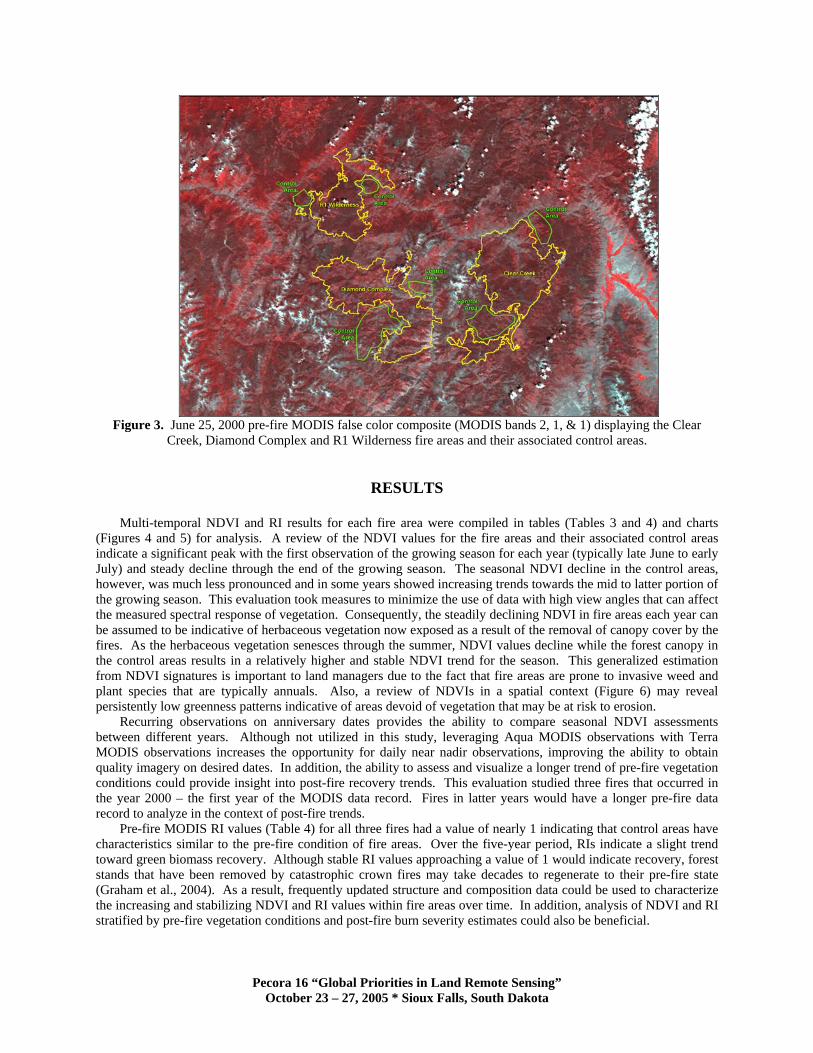
Figure 3. June 25, 2000 pre-fire MODIS false color composite (MODIS bands 2, 1, & 1) displaying the Clear
Creek, Diamond Complex and R1 Wilderness fire areas and their associated control areas.
RESULTS
Multi-temporal NDVI and RI results for each fire area were compiled in tables (Tables 3 and 4) and charts
(Figures 4 and 5) for analysis. A review of the NDVI values for the fire areas and their associated control areas indicate a significant peak with the first observation of the growing season for each year (typically late June to early July) and steady decline through the end of the growing season. The seasonal NDVI decline in the control areas, however, was much less pronounced and in some years showed increasing trends towards the mid to latter portion of the growing season. This evaluation took measures to minimize the use of data with high view angles that can affect the measured spectral response of vegetation. Consequently, the steadily declining NDVI in fire areas each year can be assumed to be indicative of herbaceous vegetation now exposed as a result of the removal of canopy cover by the fires. As the herbaceous vegetation senesces through the summer, NDVI values decline while the forest canopy in the control areas results in a relatively higher and stable NDVI trend for the season. This generalized estimation from NDVI signatures is important to land managers due to the fact that fire areas are prone to invasive weed and plant species that are typically annuals. Also, a review of NDVIs in a spatial context (Figure 6) may reveal persistently low greenness patterns indicative of areas devoid of vegetation that may be at risk to erosion.
Recurring observations on anniversary dates provides the ability to compare seasonal NDVI assessments between different years. Although not utilized in this study, leveraging Aqua MODIS observations with Terra MODIS observations increases the opportunity for daily near nadir observations, improving the ability to obtain quality imagery on desired dates. In addition, the ability to assess and visualize a longer trend of pre-fire vegetation conditions could provide insight into post-fire recovery trends. This evaluation studied three fires that occurred in the year 2000 – the first year of the MODIS data record. Fires in latter years would have a longer pre-fire data record to analyze in the context of post-fire trends.
Pre-fire MODIS RI values (Table 4) for all three fires had a value of nearly 1 indicating that control areas have characteristics similar to the pre-fire condition of fire areas. Over the five-year period, RIs indicate a slight trend toward green biomass recovery. Although stable RI values approaching a value of 1 would indicate recovery, forest stands that have been removed by catastrophic crown fires may take decades to regenerate to their pre-fire state (Graham et al., 2004). As a result, frequently updated structure and composition data could be used to characterize the increasing and stabilizing NDVI and RI values within fire areas over time. In addition, analysis of NDVI and RI stratified by pre-fire vegetation conditions and post-fire burn severity estimates could also be beneficial.
Pecora 16 “Global Priorities in Land Remote Sensing” October 23 – 27, 2005 * Sioux Falls, South Dakota
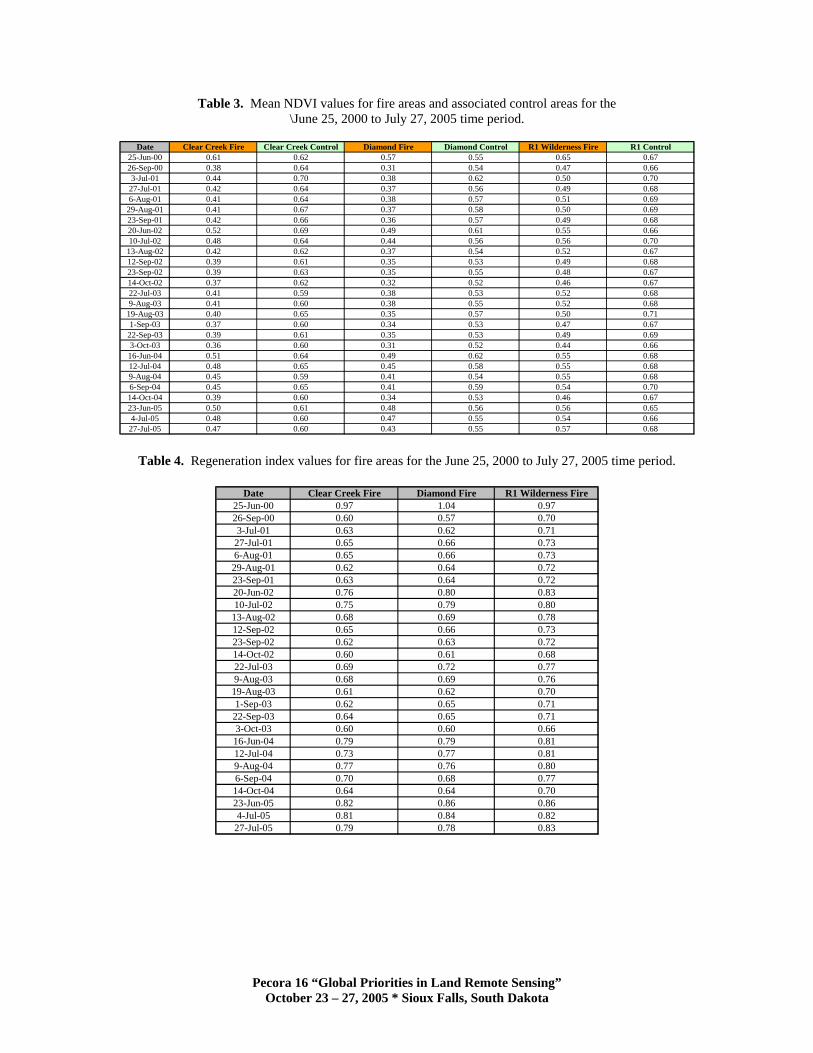
Table 3. Mean NDVI values for fire areas and associated control areas for the \June 25, 2000 to July 27, 2005 time period.
Date Clear Creek Fire Clear Creek Control Diamond Fire Diamond Control R1 Wilderness Fire R1 Control
25-Jun-00 0.61 0.62 0.57 0.55 0.65 0.6726-Sep-00 0.38 0.64 0.31 0.54 0.47 0.663-Jul-01 0.44 0.70 0.38 0.62 0.50 0.70
27-Jul-01 0.42 0.64 0.37 0.56 0.49 0.686-Aug-01 0.41 0.64 0.38 0.57 0.51 0.69
29-Aug-01 0.41 0.67 0.37 0.58 0.50 0.6923-Sep-01 0.42 0.66 0.36 0.57 0.49 0.6820-Jun-02 0.52 0.69 0.49 0.61 0.55 0.6610-Jul-02 0.48 0.64 0.44 0.56 0.56 0.70
13-Aug-02 0.42 0.62 0.37 0.54 0.52 0.6712-Sep-02 0.39 0.61 0.35 0.53 0.49 0.6823-Sep-02 0.39 0.63 0.35 0.55 0.48 0.6714-Oct-02 0.37 0.62 0.32 0.52 0.46 0.6722-Jul-03 0.41 0.59 0.38 0.53 0.52 0.689-Aug-03 0.41 0.60 0.38 0.55 0.52 0.68
19-Aug-03 0.40 0.65 0.35 0.57 0.50 0.711-Sep-03 0.37 0.60 0.34 0.53 0.47 0.67
22-Sep-03 0.39 0.61 0.35 0.53 0.49 0.693-Oct-03 0.36 0.60 0.31 0.52 0.44 0.6616-Jun-04 0.51 0.64 0.49 0.62 0.55 0.6812-Jul-04 0.48 0.65 0.45 0.58 0.55 0.689-Aug-04 0.45 0.59 0.41 0.54 0.55 0.686-Sep-04 0.45 0.65 0.41 0.59 0.54 0.7014-Oct-04 0.39 0.60 0.34 0.53 0.46 0.6723-Jun-05 0.50 0.61 0.48 0.56 0.56 0.654-Jul-05 0.48 0.60 0.47 0.55 0.54 0.66
27-Jul-05 0.47 0.60 0.43 0.55 0.57 0.68
Table 4. Regeneration index values for fire areas for the June 25, 2000 to July 27, 2005 time period.
Date Clear Creek Fire Diamond Fire R1 Wilderness Fire25-Jun-00 0.97 1.04 0.9726-Sep-00 0.60 0.57 0.703-Jul-01 0.63 0.62 0.71
27-Jul-01 0.65 0.66 0.736-Aug-01 0.65 0.66 0.7329-Aug-01 0.62 0.64 0.7223-Sep-01 0.63 0.64 0.7220-Jun-02 0.76 0.80 0.8310-Jul-02 0.75 0.79 0.80
13-Aug-02 0.68 0.69 0.7812-Sep-02 0.65 0.66 0.7323-Sep-02 0.62 0.63 0.7214-Oct-02 0.60 0.61 0.6822-Jul-03 0.69 0.72 0.779-Aug-03 0.68 0.69 0.7619-Aug-03 0.61 0.62 0.701-Sep-03 0.62 0.65 0.7122-Sep-03 0.64 0.65 0.713-Oct-03 0.60 0.60 0.6616-Jun-04 0.79 0.79 0.8112-Jul-04 0.73 0.77 0.819-Aug-04 0.77 0.76 0.806-Sep-04 0.70 0.68 0.7714-Oct-04 0.64 0.64 0.7023-Jun-05 0.82 0.86 0.864-Jul-05 0.81 0.84 0.82
27-Jul-05 0.79 0.78 0.83
Pecora 16 “Global Priorities in Land Remote Sensing” October 23 – 27, 2005 * Sioux Falls, South Dakota

Figure 4. Mean NDVI for fire areas and their associated control areas by observation date from June 25, 2000 to July 27, 2005.
Pecora 16 “Global Priorities in Land Remote Sensing” October 23 – 27, 2005 * Sioux Falls, South Dakota

Figure 5. Regeneration Index for each fire area by observation date from June 25, 2000 to July 27, 2005.
Figure 6. July 12, 2004 and October 14, 2004 NDVI maps for the Clear Creek, Diamond Complex
and R1 Wilderness Complex fires.
CONCLUSIONS
Results from this evaluation demonstrate the utility of synoptic, high temporal image data collected by MODIS for long-term post-fire vegetation monitoring. The Regeneration Index normalizes the common “noise factors” associated with multi-temporal remote sensing-based vegetation assessments using NDVI as well as the unique factors associated with wide view sensors such as MODIS. Evaluation results demonstrate that normalized 250-meter spatial resolution NDVI data can be used to provide Forest Service land managers with the ability quantify and visualize vegetation dynamics for large fire areas across the western United States. Moderate resolution, landscape assessments provided by MODIS can also augment periodic assessments by relatively high-resolution sensors such as Landsat. Continued testing this approach for post-fire vegetation monitoring is required in the various vegetation cover types that occur on Forest Service lands throughout the western United States.
A significant degree of wildland fire activity has occurred on Forest Service lands coinciding with the time period of the MODIS data record (2000 to present). RSAC plans to continue to apply this methodology on
Pecora 16 “Global Priorities in Land Remote Sensing” October 23 – 27, 2005 * Sioux Falls, South Dakota

additional fires that occurred during this time period. It is anticipated that this approach will provide an effective long-term post-fire vegetation monitoring tool for wildland fire areas throughout the western United States.
REFERENCES Díaz-Delgado, R., R. Salvador, and X. Pons (1998). Monitoring of plant community regeneration after fire by remote
sensing. In: Fire management and landscape ecology, International Association of Wildland Fire, Fairfield,, pp. 315–324.
Finco, M., H. Lachowski, S. Fider, B. Sanders and A. Cochrane (1999). Integrated Analysis and Management of the Salmon River Canyon. RSAC-10-RPT1. USDA Forest Service Remote Sensing Applications Center Project Report.
Gmelin, M., and K. Brewer (2002). Operational change detection-based fire severity mapping using Landsat TM data. In: Rapid Delivery of Remote Sensing Products; Proceedings of the Ninth Forest Service Remote Sensing Conference, April 5-9, 2004. Salt Lake City, UT.
Graham, R. T., S. McCaffrey, and T. Jain (2004). Science Basis for Changing Forest Structure to Modify Wildfire Behavior and Severity. General Technical Report. RMRS-GTR-120. Fort Collins, CO. U.S. Department of Agriculture, Forest Service, Rocky Mountain Research Station.
Huete, A., C. Justice, and W. van Leeuwen (1999). MODIS Vegetation Index (MOD13) Algorithm Theoretical Basis Document, Version 3.
National Interagency Coordination Center (2005a). 2004 Statistics and Summary. (Accessed August 2005). <http://www.nifc.gov/nicc/predictive/intelligence/2004_statssumm/2004Stats&Summ.html>.
National Interagency Coordination Center (2005b). Year to Date and Historical Fire Data. (Accessed August 2005). < http://www.nifc.gov/nicc/YTD_Graphics.pdf>.
Orlemann, A. (2002). BAER Imagery Support. USDA Forest Service Engineering Field Notes. Quayle, B. and K. Lannom (2004). Leveraging synoptic, moderate resolution imagery for USDA Forest Service fire
management. In: Proceedings of SPACE 2004 Conference Proceedings, September 28-30, 2004. San Diego, CA. Riano, D., E. Chuvieco, S. Ustin, R. Zomer, Dennison, P., D. Roberts, and J. Salas (2002). Assessment of vegetation
regeneration after fire through multitemporal analysis of AVIRIS images in the Santa Monica Mountains. Remote Sensing of Environment, 79: 60– 71.
Sun, G. L. Rocchio, J. Masek, D. Williams and K. J. Ranson (2002). Characterization of forest recovery from fire using Landsat and SAR data. In: Proceedings of IGARSS ’02, June 24-28, 2002. Toronto, ON, Canada.
Viedma, O., J. Meliá, D. Segarra, and J., García-Haro (1997). Modeling rates of ecosystem recovery after fires using Landsat TM data. Remote Sensing of Environment, 61:383–398.
White, J.D., K.C. Ryan, C.C. Key, and S.W. Running, (1996). Remote sensing of forest fire severity and vegetation recovery. International Journal of Wildland Fire, 6(3):125–136.
Pecora 16 “Global Priorities in Land Remote Sensing” October 23 – 27, 2005 * Sioux Falls, South Dakota