Monitoring of the atmospheric ozone layer and natural ultraviolet radiation … · ·...
37
Annual report 2007 Monitoring of the atmospheric ozone layer and natural ultraviolet radiation 2541 2009
Transcript of Monitoring of the atmospheric ozone layer and natural ultraviolet radiation … · ·...
Annual report 2007
Monitoring of the atmospheric ozone layer and natural ultraviolet radiation
2541 2009

Statlig program for forurensningsovervåking: Overvåking av ozonlaget og naturlig ultrafiolett stråling SPFO-rapport: 1035/2008 TA-2541/2009 ISBN 978-82-425-2004-3 (trykt) ISBN 978-82-425-2005-0 (elektronisk) Oppdragsgiver: Statens forurensningstilsyn (SFT) Utførende institusjon: Norsk institutt for luftforskning (NILU)
Monitoring of the atmospheric ozone
layer and natural ultraviolet radiation Rapport 2541/2009
Annual report 2007
Author(s): C. Lund Myhre, K. Edvardsen, K. Stebel, T.M. Svendby, G.H. Hansen (NILU), A. Dahlback (UiO) NILU project no.: O-106007/O-106008 NILU report no.: OR 46/2008 ISSN 0807-7207

Monitoring of the atmospheric ozone layer and natural ultraviolet radiation –Feil! Stil er ikke definert. TA-2541/2009
2
Monitoring of the atmospheric ozone layer and natural ultraviolet radiation –Feil! Stil er ikke definert. TA-2541/2008
3
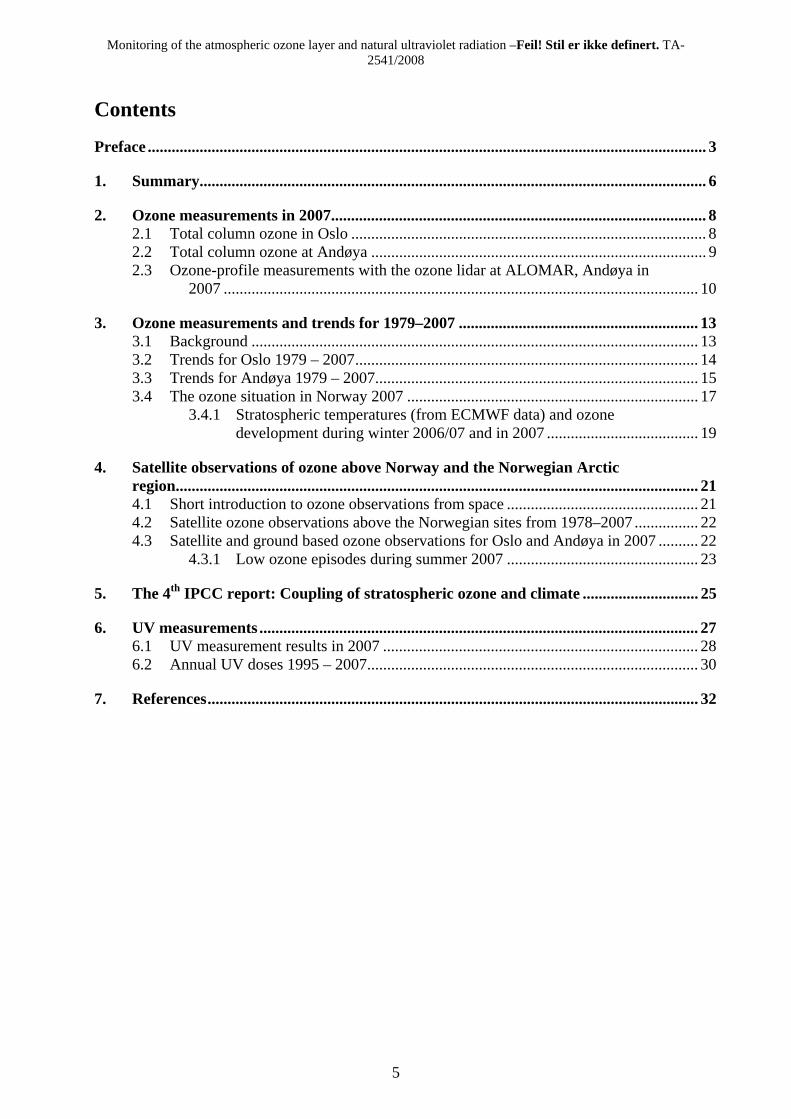
Preface In 1985, an English scientist (Farman et al., 1985) discovered the Antarctic ozone hole. It soon became apparent that man-made halogen-containing substances (CFCs and halons) were responsible for the dramatic ozone loss during the austral spring. In 1987 the Montreal Protocol was put into effect in order to reduce the production and use of these ozone-depleting substances (ODS). This international agreement has later been revised several times and the amount of ODS in the troposphere reached a maximum around 1995. The amount of most of the ODS in the troposphere is now declining slowly and one expects to be back to pre-1980 levels around year 2050. In the stratosphere the peak is reached somewhat later. It is now important to follow the development of the ozone layer in order to verify that the Montreal Protocol and its amendments work as expected. For this, we need daily ground based measurements at a large number of sites distributed globally in combination with satellite observations. It is the duty of every industrialised nation to follow up with national monitoring programmes. The Norwegian Pollution Control Authority established the programme “Monitoring of the atmospheric ozone layer” in 1990, which at that time included measurements of total ozone only. In 1995 UV measurements were also included in the programme. The Norwegian Institute for Air Research (NILU) is responsible for the operation and maintenance of the monitoring programme. The purpose of the programme is to:
1. Provide continuous measurements of total ozone and natural ultraviolet radiation that reach the ground.
2. Provide data that can be used for trend analysis of both total ozone and natural ultraviolet radiation.
3. Provide information on the status and the development of the ozone layer and natural ultraviolet radiation
4. Notify the Norwegian Pollution Control Authority when low ozone/high UV episodes occur.
In 2007 the monitoring programme included measurements of total ozone and UV at two locations, Oslo (60°N) and Andøya (69°N) and ozone profiles measurements at one location, Andøya. This report summaries the activities and results of the monitoring programme during the year 2007. The report includes trend analyses of total ozone for the period 1979-2007 for both sites and comments on the expected ozone recovery at northern latitudes. Further the total yearly UV dose for 2007 at Oslo and Andøya is included. Kjeller, June 2008 Cathrine Lund Myhre Senior Scientist

Monitoring of the atmospheric ozone layer and natural ultraviolet radiation –Feil! Stil er ikke definert. TA-2541/2009
4
Monitoring of the atmospheric ozone layer and natural ultraviolet radiation –Feil! Stil er ikke definert. TA-2541/2008
5
Contents
Preface ............................................................................................................................................ 3
1. Summary............................................................................................................................... 6
2. Ozone measurements in 2007.............................................................................................. 8 2.1 Total column ozone in Oslo ......................................................................................... 8 2.2 Total column ozone at Andøya .................................................................................... 9 2.3 Ozone-profile measurements with the ozone lidar at ALOMAR, Andøya in
2007 ....................................................................................................................... 10
3. Ozone measurements and trends for 1979–2007 ............................................................ 13 3.1 Background ................................................................................................................ 13 3.2 Trends for Oslo 1979 – 2007...................................................................................... 14 3.3 Trends for Andøya 1979 – 2007................................................................................. 15 3.4 The ozone situation in Norway 2007 ......................................................................... 17
3.4.1 Stratospheric temperatures (from ECMWF data) and ozone development during winter 2006/07 and in 2007 ...................................... 19
4. Satellite observations of ozone above Norway and the Norwegian Arctic region................................................................................................................................... 21 4.1 Short introduction to ozone observations from space ................................................ 21 4.2 Satellite ozone observations above the Norwegian sites from 1978–2007 ................ 22 4.3 Satellite and ground based ozone observations for Oslo and Andøya in 2007 .......... 22
4.3.1 Low ozone episodes during summer 2007 ................................................ 23
5. The 4th IPCC report: Coupling of stratospheric ozone and climate ............................. 25
6. UV measurements .............................................................................................................. 27 6.1 UV measurement results in 2007 ............................................................................... 28 6.2 Annual UV doses 1995 – 2007................................................................................... 30
7. References........................................................................................................................... 32
Monitoring of the atmospheric ozone layer and natural ultraviolet radiation –Feil! Stil er ikke definert. TA-2541/2009
6
1. Summary
This annual report describes the activities and main results of the programme “Monitoring of the atmospheric ozone layer and natural ultraviolet radiation” for 2007, which is a part of the governmental programme for monitoring pollution in Norway. Measurements of total ozone The Brewer instrument at Oslo has been in operation at the University of Oslo since the summer of 1990. Total ozone data from a Dobson spectrophotometer are available for the period from 1979 to 1998. By combining the two data series, we have been able to study the changes in the ozone layer above Oslo for the period 1979–2007. During this period the ozone layer has a total yearly decrease of 3.4 %, and as much as 5.9 % decrease is observed during the spring months since 1979. No significant trends are observed for the winter, summer, and autumn months in Oslo. For Andøya a similar trend analysis is performed for the period 1979–2007. The total ozone values for the period 1979-1994 are based on measurements from the satellite instrument TOMS (Total Ozone Mapping Spectrometer), whereas for the period 1994–2007 total ozone values from the Brewer instrument are used. The results from the trend analysis show no significant trends in total ozone for Andøya. The stratospheric winter 2006/07 can be classified as a cold winter, giving rise to conditions were chemical ozone destruction might occur. According to the observation this was also the case. Significant ozone loss was observed during winter and spring 2007. In April the monthly mean ozone value was more than 12% below the long term mean ozone level both over Oslo and Andøya. There are several satellite dataset with ozone data available for the region. A great benefit of using these data in the annual analysis of the Norwegian ozone layer is the increased knowledge of the spatial coverage. A first comparison of the ground based data with satellite data for selected years show good agreement during the summer, while the deviations are larger in the winter months. Further these first results indicate that the ozone satellite data underestimate slightly the ozone layer in our region. Recent global ozone data indicate that there might be signs of ozone recovery from mid 1990s in most of the world. However this is uncertain, particularly at high latitudes and in the Arctic region. The uncertainty is caused by the high natural variability in this region, and the influence of factors like decreasing temperatures in the stratosphere, which is partly due to the increase of greenhouse gases in the troposphere. Considerably longer data series and improved understanding of atmospheric processes and dynamics are needed to predict the development of the ozone layer with acceptable confidence. Extension of the monitoring programme to the Arctic atmosphere would also contribute significantly to this. The Zeppelin research station at Ny-Ålesund on Svalbard would be an excellent site for observations of the ozone development in this particular important region.
Monitoring of the atmospheric ozone layer and natural ultraviolet radiation –Feil! Stil er ikke definert. TA-2541/2008
7
Measurements of ozone profiles The ozone lidar at Andøya provides measurements of the ozone concentration at altitudes from approximately 8 km to 50 km on days with clear sky. The measurements from the ozone lidar are very useful for studying rapid variations in the ozone profiles and are important for detection of chemical ozone loss during spring and for the understanding of the processes that leads to changes in the ozone layer. The development of the stratospheric ozone layer in 2007 shows ozone destruction in springtime, but not as much as in the year 2005. The latest measured raw data profiles and the latest analysed ozone data are available at http://alomar.rocketrange.no/alomar-lidar.html. UV measurements The Norwegian UV network was established in 1994/95 and consists of nine 5-channels GUV instruments located from 58°N to 79°N. From 2006 the instrument at Ny-Ålesund has been excluded from the network. As a part of the 2007 monitoring programme NILU has been responsible for the daily operation of two of the instruments, located at Oslo (60°N) and Andøya (69°N). After the exclusion of the instrument in Ny-Ålesund, the site closest to Arctic is Andøya. The highest UV dose rate in Oslo, 141.3 mW/m2, was observed 10 June and is equivalent to a UV index of 5.7. At Andøya the highest UV index, 4.5, was observed on the 2 June. Personnel and institutions Several persons and institutions are involved in the operation and maintenance of the monitoring programme and have given valuable contributions to this report. Prof. Arne Dahlback at the University of Oslo (UiO) is responsible for ozone and UV measurements in Oslo. Kåre Edvardsen (NILU) is responsible for ozone and UV measurements at Andøya. Dr. Tove Svendby, (NILU) ensures the data submission to The World Ozone Data Centre (http://www.msc-smc.ec.gc.ca/woudc/). The ozone lidar at ALOMAR is owned and operated by NILU (Georg Hansen and Kerstin Stebel) and the Andøya Rocket Range. Acknowledgment Based on a project jointly financed by The European Space Agency (ESA; http://www.esa.int/) and The Norwegian Space Centre (Norsk Romsenter, http://www.romsenter.no/) we are now in a position where we will explore ozone satellite observations in a better way in the National monitoring of the ozone and UV radiation. Both institutions are highly acknowledged for their support.
Monitoring of the atmospheric ozone layer and natural ultraviolet radiation –Feil! Stil er ikke definert. TA-2541/2009
8
2. Ozone measurements in 2007
Daily measurements of total column ozone, which means the total amount of ozone from the earth surface to the top of the atmosphere, are performed in Oslo (60°N) and at Andøya (69°N). Total ozone is measured by Brewer spectrophotometers at both locations. At Andøya also the ozone profile from 8-45 km i measured, providing information about the ozone height distribution at clear weather conditions. We have also included analysis of ozone satellite data to have a more complete description of the ozone situation in Norway and the European Arctic region. The International Ozone Services, Canada, has calibrated both Brewer instruments against a reference instrument on a yearly basis, last time in June 2007. In addition, the instruments are regularly calibrated against standard lamps in order to check the stability of the instruments. The calibrations indicate that both instruments have been stable during the years of operation. Calibration reports are available on request. In the following sections the results of the ground based ozone measurements at Oslo and Andøya are presented, and in section 4.3 on page 22 are satellite data of ozone presented. 2.1 Total column ozone in Oslo
Daily ozone values for Oslo in 2007, based on measurements with the Brewer spectrometer no. 42, are shown in Figure 1. The black curve shows the daily ozone values measured in 2007, whereas the red curve shows the long-term monthly mean values for the years 1979-1989. The total ozone values are based on direct-sun measurements, when available. In 2007 this is the case for 147 days. For overcast days and days where the solar zenith angle is larger than 72° (sun lower than 18° above the horizon), the ozone values are based on the global irradiance method (Stamnes et al., 1991). This is the case for 193 days in 2007. In 2007 there are missing data for 25 days (4.9%). This is due to technical problems (2 days) or not suitable weather and cloud conditions. This is nearly a doubling since 2006 and is caused by cloudy weather conditions in 2007. At 9 of the cloudy days ozone values are retrieved from the GUV measurements. Figure 1a) displays the daily total ozone values for Oslo together with the long-term mean values. Large day-to-day fluctuations are observed particularly in the spring, and there are periods during spring with ozone values significantly below the long-term mean, as was also registered in e.g. 2005. Furthermore, there is a period from 24 May to 13 June with values considerable below the long-term mean. The most extreme day was 9 June with ozone values 16% below the long term mean and a UV Index of 5.7 (see section 6.1). The monthly mean total ozone values for 2007 are shown in Figure 1b) and compared with the long-term monthly mean values for the period 1979-1989. As seen from the Figure the 2007 ozone values were close to the mean values in all months, except for April. Section 3.4 includes a broader discussion and interpretation of the ozone situation in Norway in 2007.
Monitoring of the atmospheric ozone layer and natural ultraviolet radiation –Feil! Stil er ikke definert. TA-2541/2008
9
Jan Feb Mar Apr May Jun Jul Aug Sep Oct Nov Dec
250
300
350
400
450
500
Oslo Daily ozone values 2007 Longterm mean 1979-1989
Month
Tota
l ozo
ne /D
U
Jan Feb Mar Apr May Jun Jul Aug Sep Oct Nov Dec
200
300
400
500
Monthly means 2007 Longterm mean 1979-1989
Month
Tota
l ozo
ne /D
U
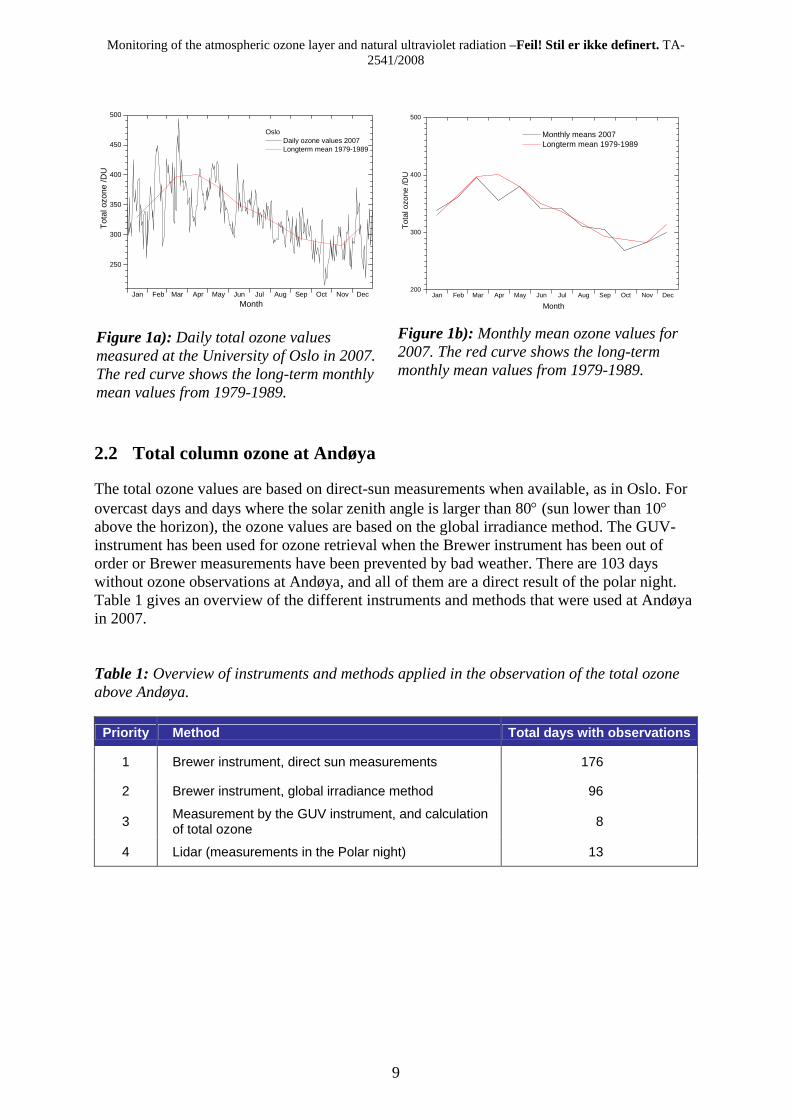
Figure 1a): Daily total ozone values measured at the University of Oslo in 2007. The red curve shows the long-term monthly mean values from 1979-1989.
Figure 1b): Monthly mean ozone values for 2007. The red curve shows the long-term monthly mean values from 1979-1989.
2.2 Total column ozone at Andøya
The total ozone values are based on direct-sun measurements when available, as in Oslo. For overcast days and days where the solar zenith angle is larger than 80° (sun lower than 10° above the horizon), the ozone values are based on the global irradiance method. The GUV-instrument has been used for ozone retrieval when the Brewer instrument has been out of order or Brewer measurements have been prevented by bad weather. There are 103 days without ozone observations at Andøya, and all of them are a direct result of the polar night. Table 1 gives an overview of the different instruments and methods that were used at Andøya in 2007. Table 1: Overview of instruments and methods applied in the observation of the total ozone above Andøya.
Priority Method Total days with observations
1 Brewer instrument, direct sun measurements 176
2 Brewer instrument, global irradiance method 96
3 Measurement by the GUV instrument, and calculation of total ozone 8
4 Lidar (measurements in the Polar night) 13
Monitoring of the atmospheric ozone layer and natural ultraviolet radiation –Feil! Stil er ikke definert. TA-2541/2009
10
Jan Feb Mar Apr May Jun Jul Aug Sep Oct Nov Dec123
200
250
300
350
400
450
500
550Andøya
Longterm mean 1979 -1989 Daily ozone values 2007 Total ozone from lidar measurements Instrument type
LIDAR =
Brewer =
To
tal o
zone
/DU
Month
GUV =
Jan Feb Mar Apr May Jun Jul Aug Sep Oct Nov Dec200
250
300
350
400
450
500
550
Monthly means 2007 Longterm mean 1979 -1989
Month
Tota
l ozo
ne /D
U
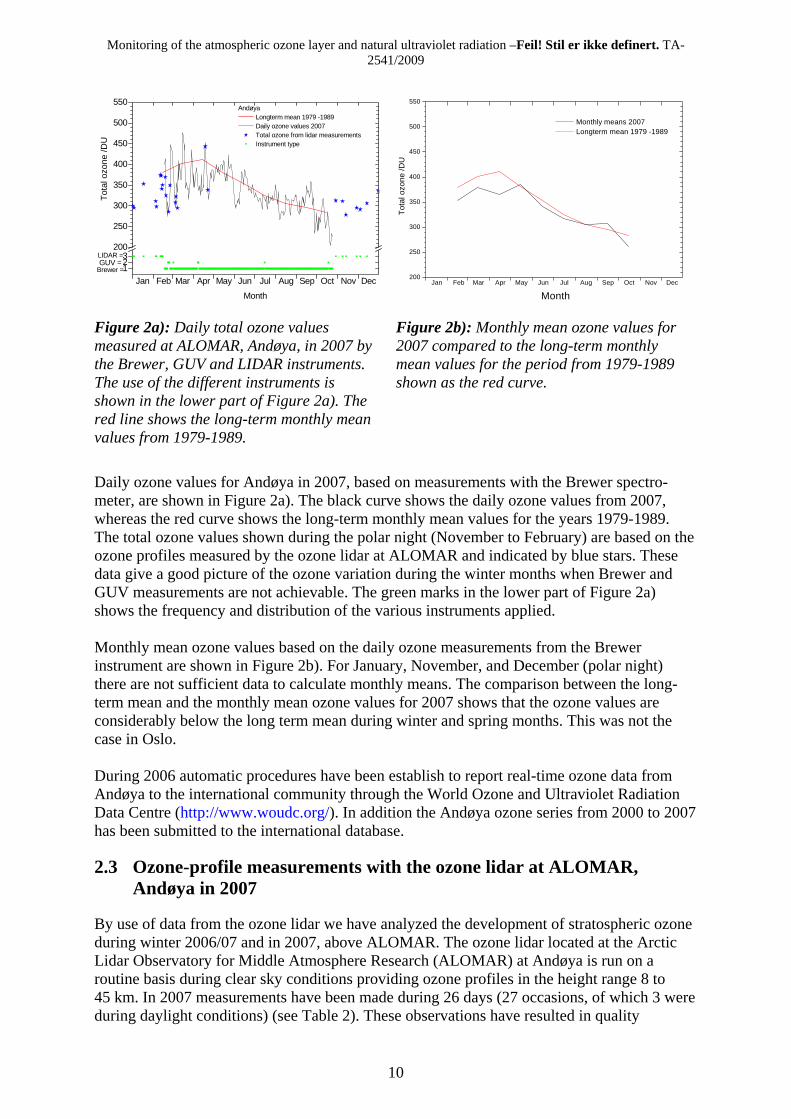
Figure 2a): Daily total ozone values measured at ALOMAR, Andøya, in 2007 by the Brewer, GUV and LIDAR instruments. The use of the different instruments is shown in the lower part of Figure 2a). The red line shows the long-term monthly mean values from 1979-1989.
Figure 2b): Monthly mean ozone values for 2007 compared to the long-term monthly mean values for the period from 1979-1989 shown as the red curve.
Daily ozone values for Andøya in 2007, based on measurements with the Brewer spectro-meter, are shown in Figure 2a). The black curve shows the daily ozone values from 2007, whereas the red curve shows the long-term monthly mean values for the years 1979-1989. The total ozone values shown during the polar night (November to February) are based on the ozone profiles measured by the ozone lidar at ALOMAR and indicated by blue stars. These data give a good picture of the ozone variation during the winter months when Brewer and GUV measurements are not achievable. The green marks in the lower part of Figure 2a) shows the frequency and distribution of the various instruments applied. Monthly mean ozone values based on the daily ozone measurements from the Brewer instrument are shown in Figure 2b). For January, November, and December (polar night) there are not sufficient data to calculate monthly means. The comparison between the long-term mean and the monthly mean ozone values for 2007 shows that the ozone values are considerably below the long term mean during winter and spring months. This was not the case in Oslo. During 2006 automatic procedures have been establish to report real-time ozone data from Andøya to the international community through the World Ozone and Ultraviolet Radiation Data Centre (http://www.woudc.org/). In addition the Andøya ozone series from 2000 to 2007 has been submitted to the international database.
2.3 Ozone-profile measurements with the ozone lidar at ALOMAR, Andøya in 2007
By use of data from the ozone lidar we have analyzed the development of stratospheric ozone during winter 2006/07 and in 2007, above ALOMAR. The ozone lidar located at the Arctic Lidar Observatory for Middle Atmosphere Research (ALOMAR) at Andøya is run on a routine basis during clear sky conditions providing ozone profiles in the height range 8 to 45 km. In 2007 measurements have been made during 26 days (27 occasions, of which 3 were during daylight conditions) (see Table 2). These observations have resulted in quality
Monitoring of the atmospheric ozone layer and natural ultraviolet radiation –Feil! Stil er ikke definert. TA-2541/2008
11
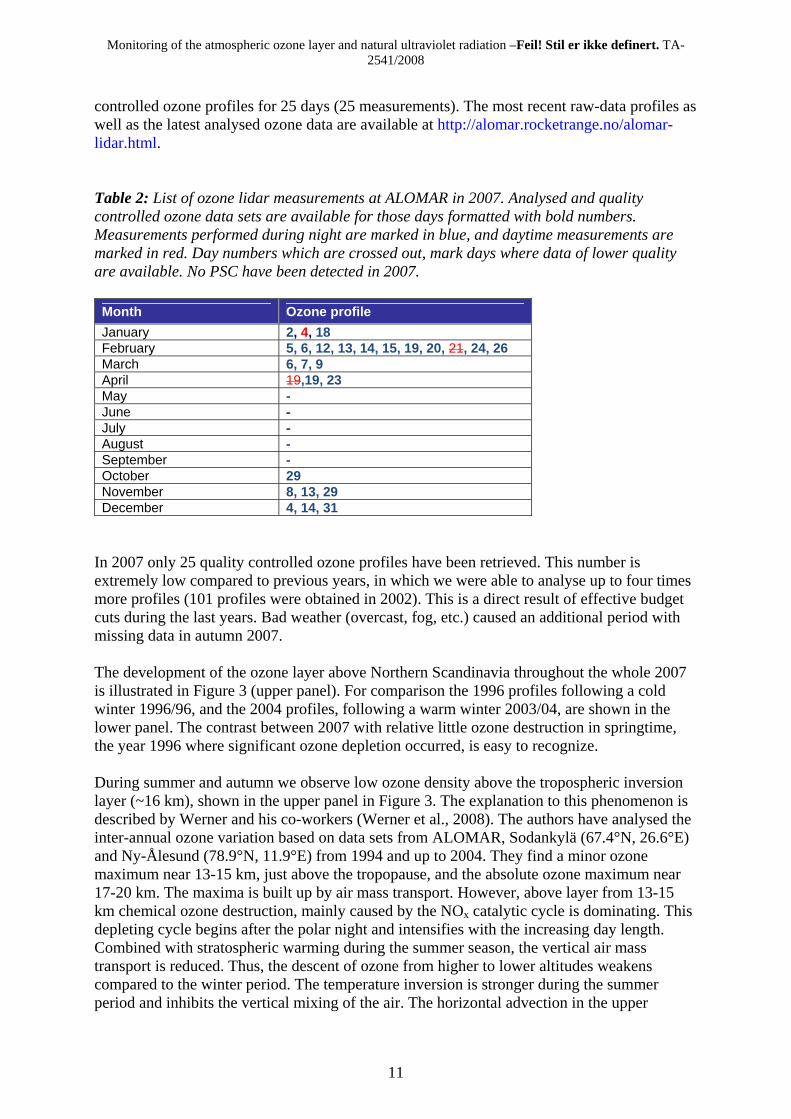
controlled ozone profiles for 25 days (25 measurements). The most recent raw-data profiles as well as the latest analysed ozone data are available at http://alomar.rocketrange.no/alomar-lidar.html. Table 2: List of ozone lidar measurements at ALOMAR in 2007. Analysed and quality controlled ozone data sets are available for those days formatted with bold numbers. Measurements performed during night are marked in blue, and daytime measurements are marked in red. Day numbers which are crossed out, mark days where data of lower quality are available. No PSC have been detected in 2007.
Month Ozone profile January 2, 4, 18 February 5, 6, 12, 13, 14, 15, 19, 20, 21, 24, 26 March 6, 7, 9 April 19,19, 23 May - June - July - August - September - October 29 November 8, 13, 29 December 4, 14, 31
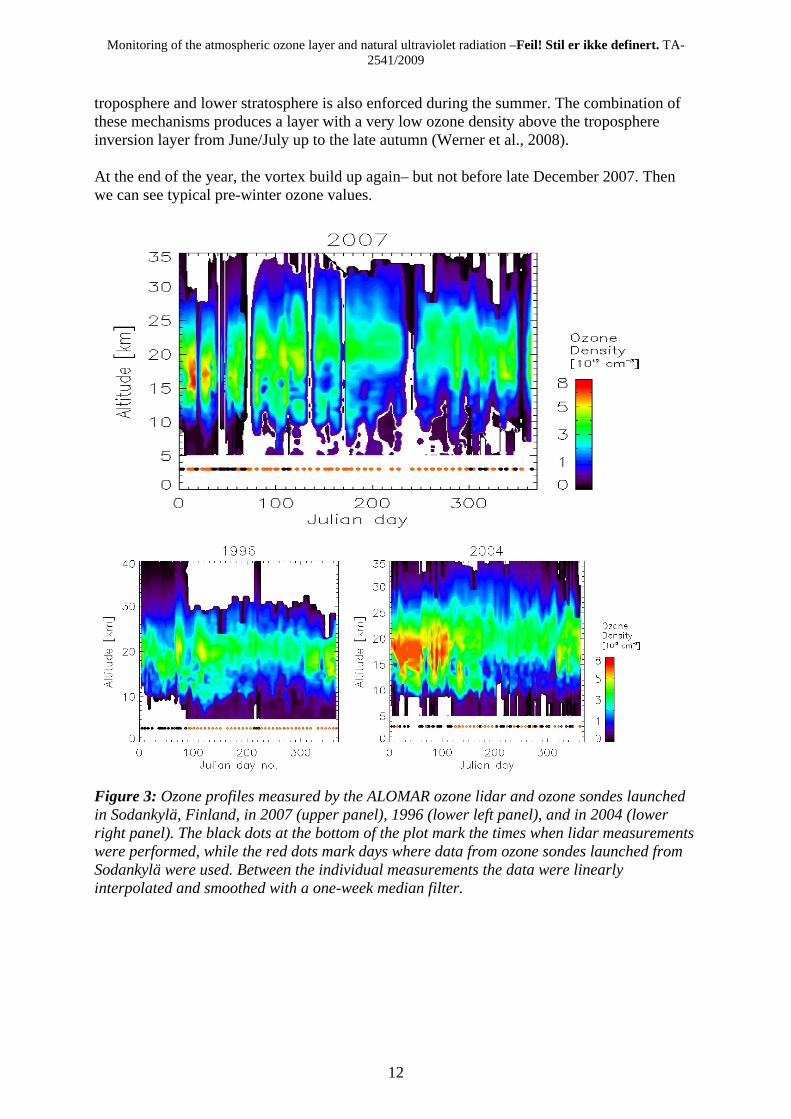
In 2007 only 25 quality controlled ozone profiles have been retrieved. This number is extremely low compared to previous years, in which we were able to analyse up to four times more profiles (101 profiles were obtained in 2002). This is a direct result of effective budget cuts during the last years. Bad weather (overcast, fog, etc.) caused an additional period with missing data in autumn 2007. The development of the ozone layer above Northern Scandinavia throughout the whole 2007 is illustrated in Figure 3 (upper panel). For comparison the 1996 profiles following a cold winter 1996/96, and the 2004 profiles, following a warm winter 2003/04, are shown in the lower panel. The contrast between 2007 with relative little ozone destruction in springtime, the year 1996 where significant ozone depletion occurred, is easy to recognize. During summer and autumn we observe low ozone density above the tropospheric inversion layer (~16 km), shown in the upper panel in Figure 3. The explanation to this phenomenon is described by Werner and his co-workers (Werner et al., 2008). The authors have analysed the inter-annual ozone variation based on data sets from ALOMAR, Sodankylä (67.4°N, 26.6°E) and Ny-Ålesund (78.9°N, 11.9°E) from 1994 and up to 2004. They find a minor ozone maximum near 13-15 km, just above the tropopause, and the absolute ozone maximum near 17-20 km. The maxima is built up by air mass transport. However, above layer from 13-15 km chemical ozone destruction, mainly caused by the NOx catalytic cycle is dominating. This depleting cycle begins after the polar night and intensifies with the increasing day length. Combined with stratospheric warming during the summer season, the vertical air mass transport is reduced. Thus, the descent of ozone from higher to lower altitudes weakens compared to the winter period. The temperature inversion is stronger during the summer period and inhibits the vertical mixing of the air. The horizontal advection in the upper
Monitoring of the atmospheric ozone layer and natural ultraviolet radiation –Feil! Stil er ikke definert. TA-2541/2009
12
troposphere and lower stratosphere is also enforced during the summer. The combination of these mechanisms produces a layer with a very low ozone density above the troposphere inversion layer from June/July up to the late autumn (Werner et al., 2008). At the end of the year, the vortex build up again– but not before late December 2007. Then we can see typical pre-winter ozone values.
Figure 3: Ozone profiles measured by the ALOMAR ozone lidar and ozone sondes launched in Sodankylä, Finland, in 2007 (upper panel), 1996 (lower left panel), and in 2004 (lower right panel). The black dots at the bottom of the plot mark the times when lidar measurements were performed, while the red dots mark days where data from ozone sondes launched from Sodankylä were used. Between the individual measurements the data were linearly interpolated and smoothed with a one-week median filter.
Monitoring of the atmospheric ozone layer and natural ultraviolet radiation –Feil! Stil er ikke definert. TA-2541/2008
13
3. Ozone measurements and trends for 1979–2007
3.1 Background
In 2007 World Metrological Organisation (WMO) and UNEP published the Scientific Assessment of Ozone Depletion: 2006 (WMO, 2007). This report summarizes the state of the art with respect to ozone, ozone recovery and UV changes. The most relevant conclusions are briefly summarised below.
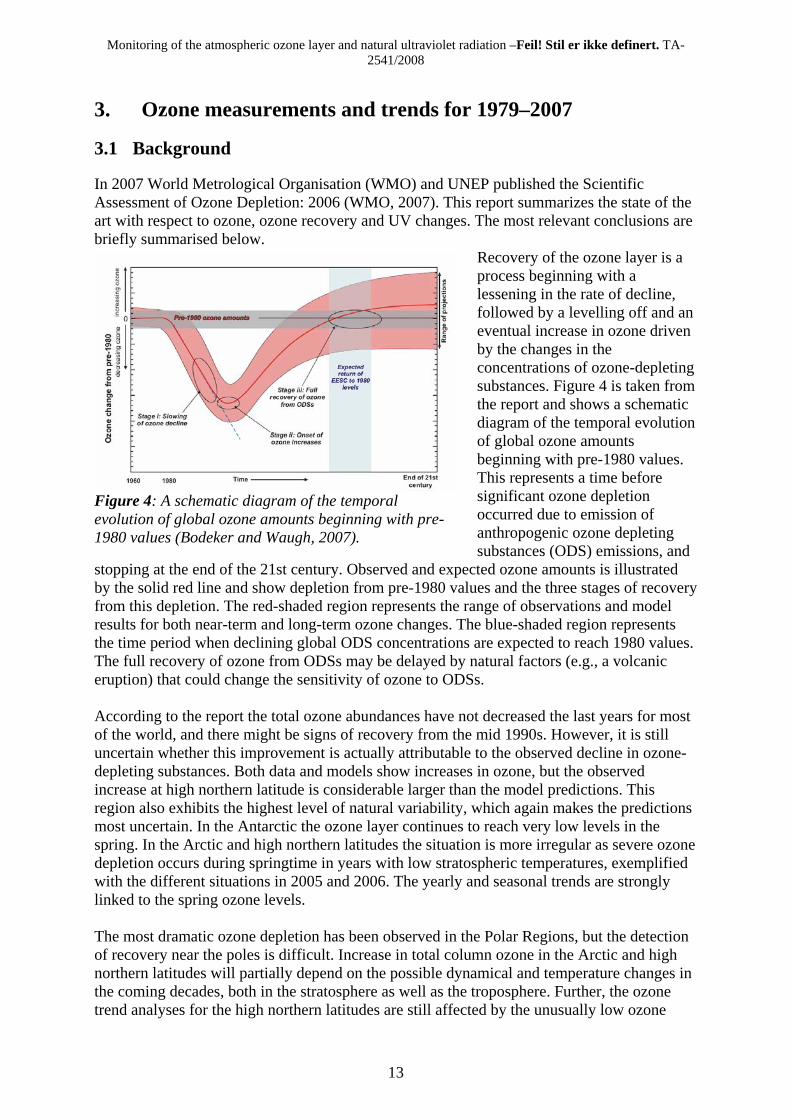
Recovery of the ozone layer is a process beginning with a lessening in the rate of decline, followed by a levelling off and an eventual increase in ozone driven by the changes in the concentrations of ozone-depleting substances. Figure 4 is taken from the report and shows a schematic diagram of the temporal evolution of global ozone amounts beginning with pre-1980 values. This represents a time before significant ozone depletion occurred due to emission of anthropogenic ozone depleting substances (ODS) emissions, and
stopping at the end of the 21st century. Observed and expected ozone amounts is illustrated by the solid red line and show depletion from pre-1980 values and the three stages of recovery from this depletion. The red-shaded region represents the range of observations and model results for both near-term and long-term ozone changes. The blue-shaded region represents the time period when declining global ODS concentrations are expected to reach 1980 values. The full recovery of ozone from ODSs may be delayed by natural factors (e.g., a volcanic eruption) that could change the sensitivity of ozone to ODSs. According to the report the total ozone abundances have not decreased the last years for most of the world, and there might be signs of recovery from the mid 1990s. However, it is still uncertain whether this improvement is actually attributable to the observed decline in ozone-depleting substances. Both data and models show increases in ozone, but the observed increase at high northern latitude is considerable larger than the model predictions. This region also exhibits the highest level of natural variability, which again makes the predictions most uncertain. In the Antarctic the ozone layer continues to reach very low levels in the spring. In the Arctic and high northern latitudes the situation is more irregular as severe ozone depletion occurs during springtime in years with low stratospheric temperatures, exemplified with the different situations in 2005 and 2006. The yearly and seasonal trends are strongly linked to the spring ozone levels. The most dramatic ozone depletion has been observed in the Polar Regions, but the detection of recovery near the poles is difficult. Increase in total column ozone in the Arctic and high northern latitudes will partially depend on the possible dynamical and temperature changes in the coming decades, both in the stratosphere as well as the troposphere. Further, the ozone trend analyses for the high northern latitudes are still affected by the unusually low ozone
Figure 4: A schematic diagram of the temporal evolution of global ozone amounts beginning with pre-1980 values (Bodeker and Waugh, 2007).
Monitoring of the atmospheric ozone layer and natural ultraviolet radiation –Feil! Stil er ikke definert. TA-2541/2009
14
levels in the mid 1990s following the Mt. Pinatubo eruption. Thus, any upward trend from this point might be misleading, as the ozone levels were particularly low during the 1990s (illustrated in Figure 7 and Figure 8). The solar cycle and its peak in 2000-2002 also contribute to the uncertainty of ozone recovery in our region. These two factors are often omitted from the models and can explain the underestimation of the modelled ozone levels compared to the measurements in this region. The ozone levels in the Arctic and high northern latitudes will be strongly influenced by changes in stratospheric temperatures during the next years, and possibly result in delayed recovery or record low ozone observations. Considerably longer data series and improved understanding of atmospheric processes and their effect on ozone are needed to estimate future ozone levels with confidence. Further, anthropogenic changes of the atmosphere (like change in temperature profile, emission of greenhouse gases like N2O, and increase of stratospheric water vapour as a result of increase of atmospheric CH4) might affect the ozone recovery. Whether ozone stabilizes at a higher or lower level than the pre-1980 level is uncertain. However, the vertical distribution of ozone in the future is almost certain to be different from the pre-depleting period. According to WMO studies of long-tem trends of ozone, as presented in the next sections 3.2 and 3.3, are essential in the assessment of the ozone recovery. 3.2 Trends for Oslo 1979 – 2007
Total ozone measurements using the Dobson spectrophotometer (No. 56) was performed on a regular basis in Oslo from 1978 to 1998. The data from this instrument has been re-evaluated and published (Svendby and Dahlback, 2002). The complete set of revised Dobson total ozone values from Oslo is available at The World Ozone Data Centre (http://www.msc-smc.ec.gc.ca/woudc/). The Brewer instrument has been in operation at the University of Oslo since the summer 1990. The International Ozone Services, Canada, calibrated the Brewer instrument in Oslo in June 2007. In addition, the Brewer instrument is regularly calibrated against standard lamps in order to check the stability of the instrument. The calibrations show that the Brewer instrument has been stable during the 17 years of observations. The total ozone measurements from the Brewer instrument agree well with the Dobson measurements. However, there is a seasonal variation in the difference between the Brewer and Dobson instrument that has not been accounted for in the trend analysis presented here. Figure 5a) shows the variations in the monthly mean ozone values in Oslo from 1979 to 2007. The total ozone values from 1979 to 1998 are from the Dobson instrument, whereas for the period 1999-2007 the Brewer measurements have been used. The large seasonal variations are typical for stations at high latitudes. This is a dynamic phenomenon and is explained by the springtime transport of ozone from the source regions in the stratosphere above the equator.
Monitoring of the atmospheric ozone layer and natural ultraviolet radiation –Feil! Stil er ikke definert. TA-2541/2008
15
1978 1983 1988 1993 1998 2003 2008200
250
300
350
400
450
500
Tota
l ozo
ne /D
U
Year 1978 1983 1988 1993 1998 2003 2008
200
250
300
350
400
450
Monthly means after seasonal variation are removed Linear trend -0.12 % per year +/- 0.04
Tota
l ozo
ne /D
U
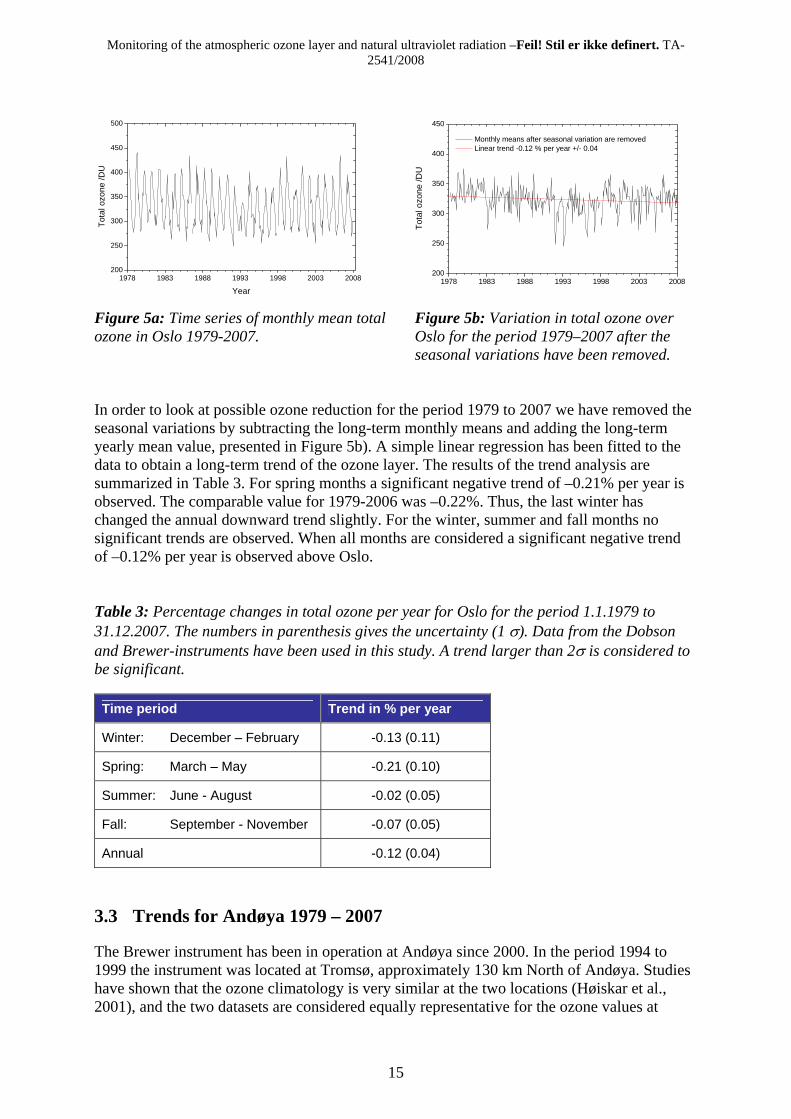
Figure 5a: Time series of monthly mean total ozone in Oslo 1979-2007.
Figure 5b: Variation in total ozone over Oslo for the period 1979–2007 after the seasonal variations have been removed.
In order to look at possible ozone reduction for the period 1979 to 2007 we have removed the seasonal variations by subtracting the long-term monthly means and adding the long-term yearly mean value, presented in Figure 5b). A simple linear regression has been fitted to the data to obtain a long-term trend of the ozone layer. The results of the trend analysis are summarized in Table 3. For spring months a significant negative trend of –0.21% per year is observed. The comparable value for 1979-2006 was –0.22%. Thus, the last winter has changed the annual downward trend slightly. For the winter, summer and fall months no significant trends are observed. When all months are considered a significant negative trend of –0.12% per year is observed above Oslo. Table 3: Percentage changes in total ozone per year for Oslo for the period 1.1.1979 to 31.12.2007. The numbers in parenthesis gives the uncertainty (1 σ). Data from the Dobson and Brewer-instruments have been used in this study. A trend larger than 2σ is considered to be significant.
Time period Trend in % per year
Winter: December – February -0.13 (0.11)
Spring: March – May -0.21 (0.10)
Summer: June - August -0.02 (0.05)
Fall: September - November -0.07 (0.05)
Annual -0.12 (0.04)
3.3 Trends for Andøya 1979 – 2007
The Brewer instrument has been in operation at Andøya since 2000. In the period 1994 to 1999 the instrument was located at Tromsø, approximately 130 km North of Andøya. Studies have shown that the ozone climatology is very similar at the two locations (Høiskar et al., 2001), and the two datasets are considered equally representative for the ozone values at
Monitoring of the atmospheric ozone layer and natural ultraviolet radiation –Feil! Stil er ikke definert. TA-2541/2009
16
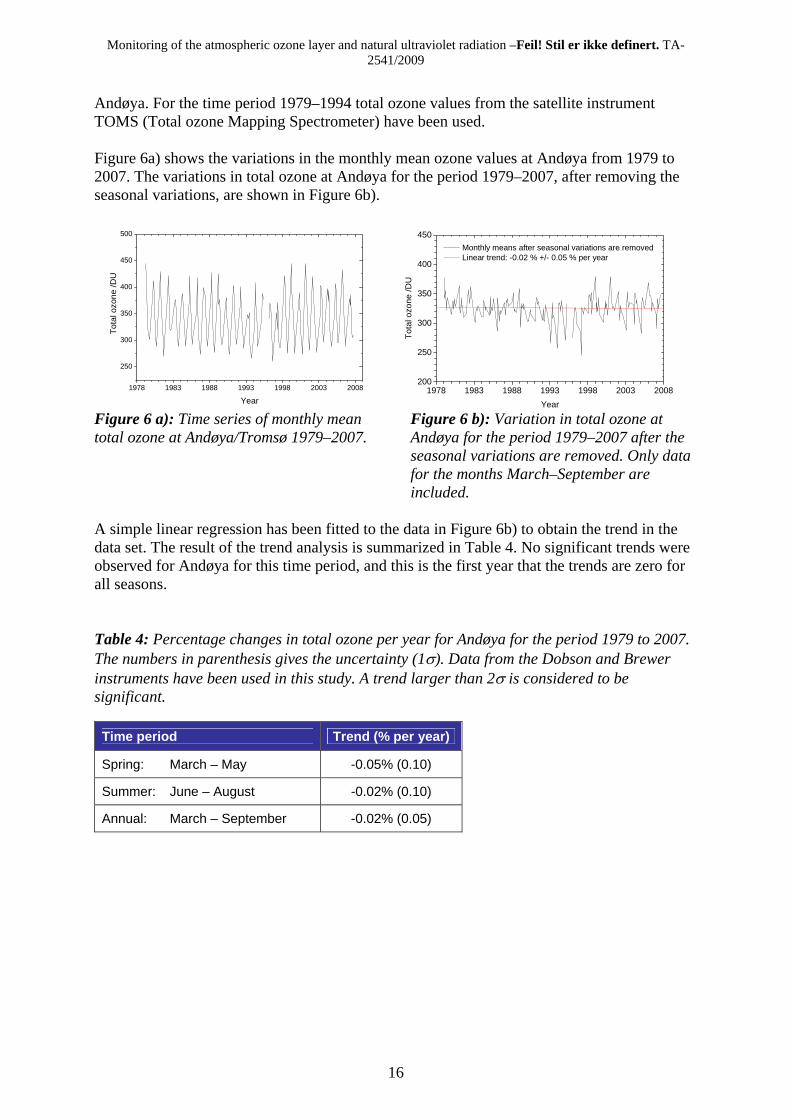
Andøya. For the time period 1979–1994 total ozone values from the satellite instrument TOMS (Total ozone Mapping Spectrometer) have been used. Figure 6a) shows the variations in the monthly mean ozone values at Andøya from 1979 to 2007. The variations in total ozone at Andøya for the period 1979–2007, after removing the seasonal variations, are shown in Figure 6b).
1978 1983 1988 1993 1998 2003 2008
250
300
350
400
450
500
Tota
l ozo
ne /D
U
Year1978 1983 1988 1993 1998 2003 2008
200
250
300
350
400
450 Monthly means after seasonal variations are removed Linear trend: -0.02 % +/- 0.05 % per year
Tota
l ozo
ne /D
UYear
Figure 6 a): Time series of monthly mean total ozone at Andøya/Tromsø 1979–2007.
Figure 6 b): Variation in total ozone at Andøya for the period 1979–2007 after the seasonal variations are removed. Only data for the months March–September are included.
A simple linear regression has been fitted to the data in Figure 6b) to obtain the trend in the data set. The result of the trend analysis is summarized in Table 4. No significant trends were observed for Andøya for this time period, and this is the first year that the trends are zero for all seasons. Table 4: Percentage changes in total ozone per year for Andøya for the period 1979 to 2007. The numbers in parenthesis gives the uncertainty (1σ). Data from the Dobson and Brewer instruments have been used in this study. A trend larger than 2σ is considered to be significant.
Time period Trend (% per year)
Spring: March – May -0.05% (0.10)
Summer: June – August -0.02% (0.10)
Annual: March – September -0.02% (0.05)
Monitoring of the atmospheric ozone layer and natural ultraviolet radiation –Feil! Stil er ikke definert. TA-2541/2008
17
3.4 The ozone situation in Norway 2007
Table 5 gives the percentage difference between the monthly mean total ozone values for 2007 and the long-term monthly values. Both Oslo and Andøya are listed in the table. Table 5: Percentage difference between the monthly mean total ozone values for 2007 and the long-term mean for Oslo and Andøya.
Month Oslo Andøya
January 2.8 - February -1.01 -7.4 March -0.2 -6.1 April -12.7 -12.8 May <+/- 0.5 1.4 June -2.8 -3.5 July 1.5 -3.0 August -1.7 <+/- 0.5 September 3.7 3.9 October -7.2 -8.6 November 0.2 - December -4.8 -
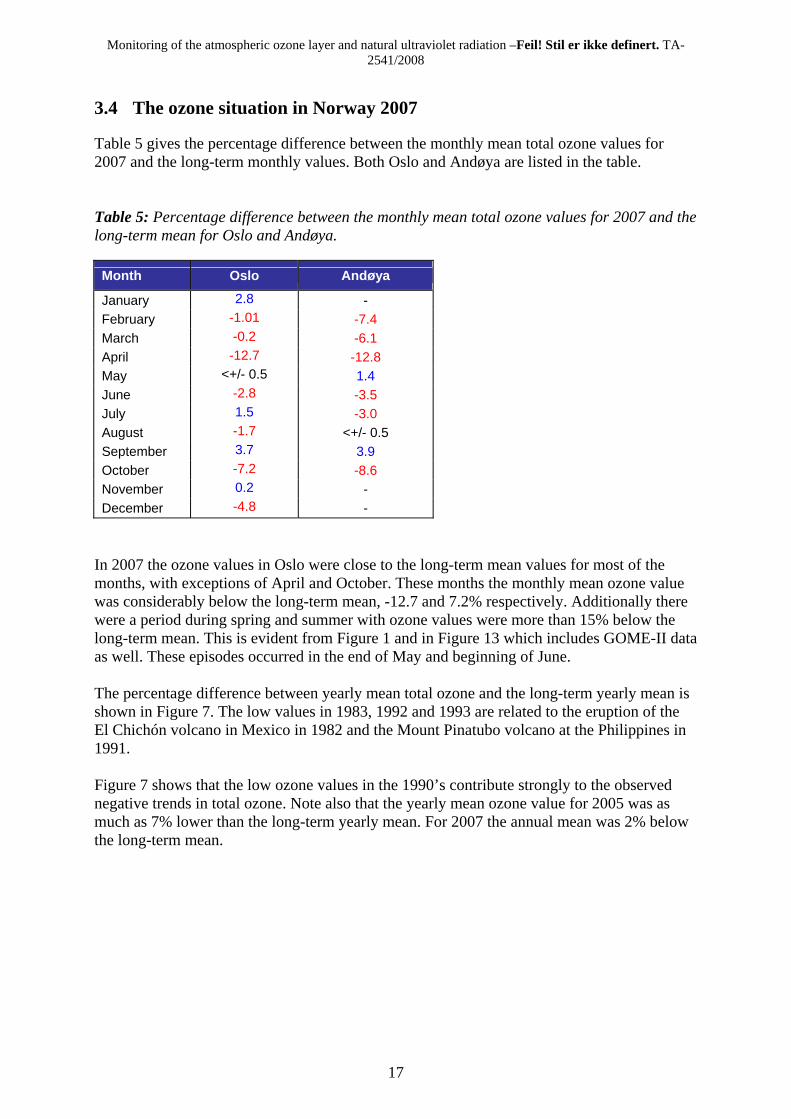
In 2007 the ozone values in Oslo were close to the long-term mean values for most of the months, with exceptions of April and October. These months the monthly mean ozone value was considerably below the long-term mean, -12.7 and 7.2% respectively. Additionally there were a period during spring and summer with ozone values were more than 15% below the long-term mean. This is evident from Figure 1 and in Figure 13 which includes GOME-II data as well. These episodes occurred in the end of May and beginning of June. The percentage difference between yearly mean total ozone and the long-term yearly mean is shown in Figure 7. The low values in 1983, 1992 and 1993 are related to the eruption of the El Chichón volcano in Mexico in 1982 and the Mount Pinatubo volcano at the Philippines in 1991. Figure 7 shows that the low ozone values in the 1990’s contribute strongly to the observed negative trends in total ozone. Note also that the yearly mean ozone value for 2005 was as much as 7% lower than the long-term yearly mean. For 2007 the annual mean was 2% below the long-term mean.
Monitoring of the atmospheric ozone layer and natural ultraviolet radiation –Feil! Stil er ikke definert. TA-2541/2009
18
1978 1983 1988 1993 1998 2003 2008-10
-5
0
5
10
Diff
eren
ce /%
Year
Figure 7: Percentage difference between yearly mean total ozone in Oslo and the long term yearly mean for 1979-1989.
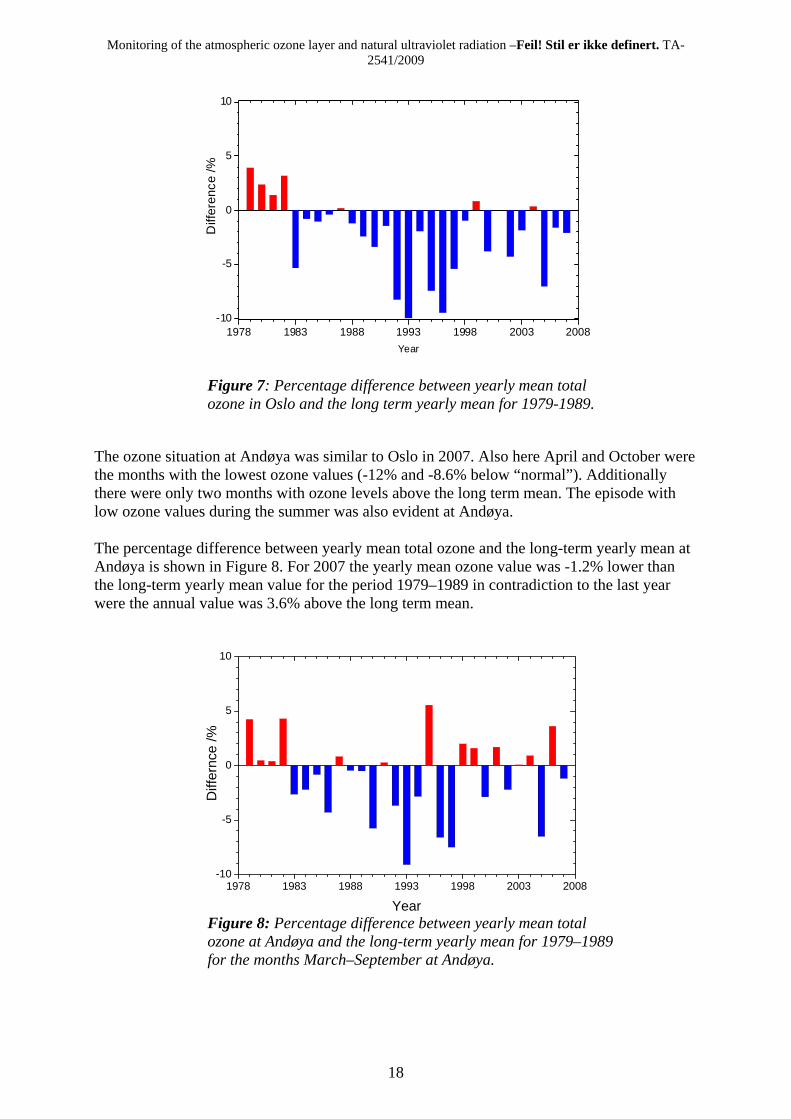
The ozone situation at Andøya was similar to Oslo in 2007. Also here April and October were the months with the lowest ozone values (-12% and -8.6% below “normal”). Additionally there were only two months with ozone levels above the long term mean. The episode with low ozone values during the summer was also evident at Andøya. The percentage difference between yearly mean total ozone and the long-term yearly mean at Andøya is shown in Figure 8. For 2007 the yearly mean ozone value was -1.2% lower than the long-term yearly mean value for the period 1979–1989 in contradiction to the last year were the annual value was 3.6% above the long term mean.
1978 1983 1988 1993 1998 2003 2008-10
-5
0
5
10
Diff
ernc
e /%
Year Figure 8: Percentage difference between yearly mean total ozone at Andøya and the long-term yearly mean for 1979–1989 for the months March–September at Andøya.
Monitoring of the atmospheric ozone layer and natural ultraviolet radiation –Feil! Stil er ikke definert. TA-2541/2008
19
The low ozone values commonly observed in the spring the last decades are a direct result of the stratospheric conditions, and the chlorine and bromine compounds emitted by anthropogenic sources. The polar stratospheric vortex1 leads to chemical ozone destruction when air masses, quasi-isolated in the polar vortex, are illuminated by sunlight. Sunlight initiates the formation of active chlorine and bromine compounds (e.g. HCl and HBr) by heterogeneous chemistry on polar stratospheric clouds (PSC). The active chlorine and bromine reacts with ozone and results in severe ozone depletion. The PSCs are a basis for the chemical ozone destructions observed in the Antarctica and the Arctic. There are two main types of PSCs, called PSC I and PSC II. The approximate threshold formation temperature for type I is 195 K (-78 oC) and for type II, 188 K (-85 oC) and the first observation of PSC type II in the Arctic was in 2005. A colder upper stratosphere is a suggested feedback to the increased level of greenhouse gases in the troposphere. Thus, it is important to detect signs of climate changes from the increased occurrence of PSCs and particularly the abundance of PSC type II. However, the observations of the latest years clearly manifest the great variability of the ozone layer typical for the Northern region (WMO, 2007; Weatherhead and Andersen, 2006). To analyze the variability and better explain the observed ozone values, we have assessed the stratospheric temperature development in 2007 and compared it to previous years. 3.4.1 Stratospheric temperatures (from ECMWF data) and ozone development during
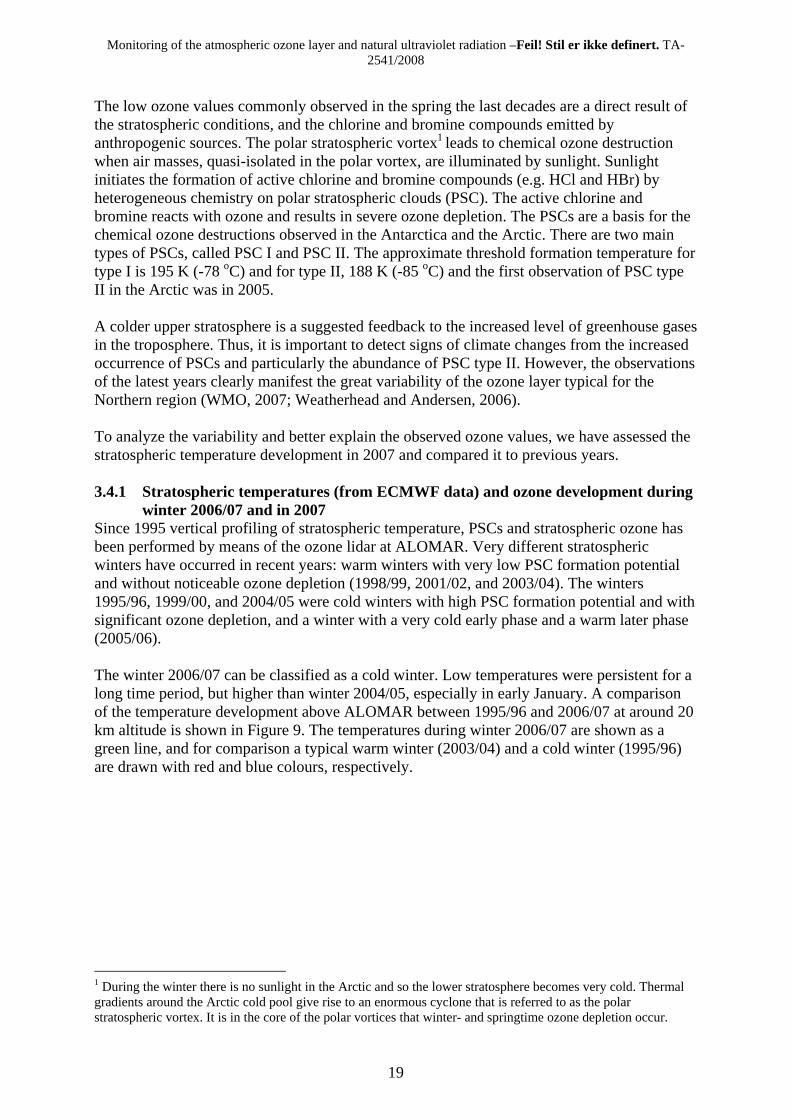
winter 2006/07 and in 2007 Since 1995 vertical profiling of stratospheric temperature, PSCs and stratospheric ozone has been performed by means of the ozone lidar at ALOMAR. Very different stratospheric winters have occurred in recent years: warm winters with very low PSC formation potential and without noticeable ozone depletion (1998/99, 2001/02, and 2003/04). The winters 1995/96, 1999/00, and 2004/05 were cold winters with high PSC formation potential and with significant ozone depletion, and a winter with a very cold early phase and a warm later phase (2005/06). The winter 2006/07 can be classified as a cold winter. Low temperatures were persistent for a long time period, but higher than winter 2004/05, especially in early January. A comparison of the temperature development above ALOMAR between 1995/96 and 2006/07 at around 20 km altitude is shown in Figure 9. The temperatures during winter 2006/07 are shown as a green line, and for comparison a typical warm winter (2003/04) and a cold winter (1995/96) are drawn with red and blue colours, respectively.
1 During the winter there is no sunlight in the Arctic and so the lower stratosphere becomes very cold. Thermal gradients around the Arctic cold pool give rise to an enormous cyclone that is referred to as the polar stratospheric vortex. It is in the core of the polar vortices that winter- and springtime ozone depletion occur.
Monitoring of the atmospheric ozone layer and natural ultraviolet radiation –Feil! Stil er ikke definert. TA-2541/2009
20
Figure 9: Stratospheric temperatures at ca. 20 km altitude above ALOMAR during the winters 1995/96 and 2006/07 (data from ECMWF). The temperature development during the winter 2006/07(green), the cold winter 1995/96 (blue) and a warm winter (red) are highlighted.
During winter 2006/07 the polar vortex formed already on 10th December and centred around the pole until the end of January. After that it was displaced toward sunlit areas allowing catalytic ozone destruction to occur. Temperatures below 194 K were measured from December 2006 to the end of February 2007. Minor warmings occurred in early January and in February; a final warming was seen on 10 March 2007. The vortex was split and weakened, but a bulb of the vortex still persisted in the Arctic in March 31 (Goutail et al., 2007). Significant ozone loss was observed in spring 2007. According to the SAOZ network measurements, the loss occurred during 2 periods: between 1 Jan. and 20 Jan. and 10 Feb. and 10 Mar. at a rate of 0.5% per day leading to a cumulative loss of 26%. After that date the loss stopped. A cumulative ozone loss of 26% is smaller than the 30% observed in 1994/95 and 1995/96 values but larger than the 5-10% observed in winter 1998/99, 2000/01, 2001/02, and 2005/06 (Goutail et al., 2007). Although PSC could have been expected form the ECMWF temperature development above ALOMAR during winter 2006/07, as shown in Figure 9 (see chapter 2.3) none have been measured by the ozone lidar, which has its main reason in the low observational coverage.
30. Jan 1. Mar 31. Mar 1. Dec
Monitoring of the atmospheric ozone layer and natural ultraviolet radiation –Feil! Stil er ikke definert. TA-2541/2008
21
4. Satellite observations of ozone above Norway and the Norwegian Arctic region
4.1 Short introduction to ozone observations from space
The amount and distribution of ozone in the stratosphere varies greatly over the globe mainly controlled by two factors: the fact that the maximum production of ozone take place at 40 km height in the tropical region, and secondly the large scale stratospheric transport patterns towards the mid- and high latitudes. In addition there are small scale transport and circulation patterns in the stratosphere determining the daily ozone levels. Thus, observing ozone fluctuations over just one spot is not sufficient to give a precise description of the ozone situation in a larger region.
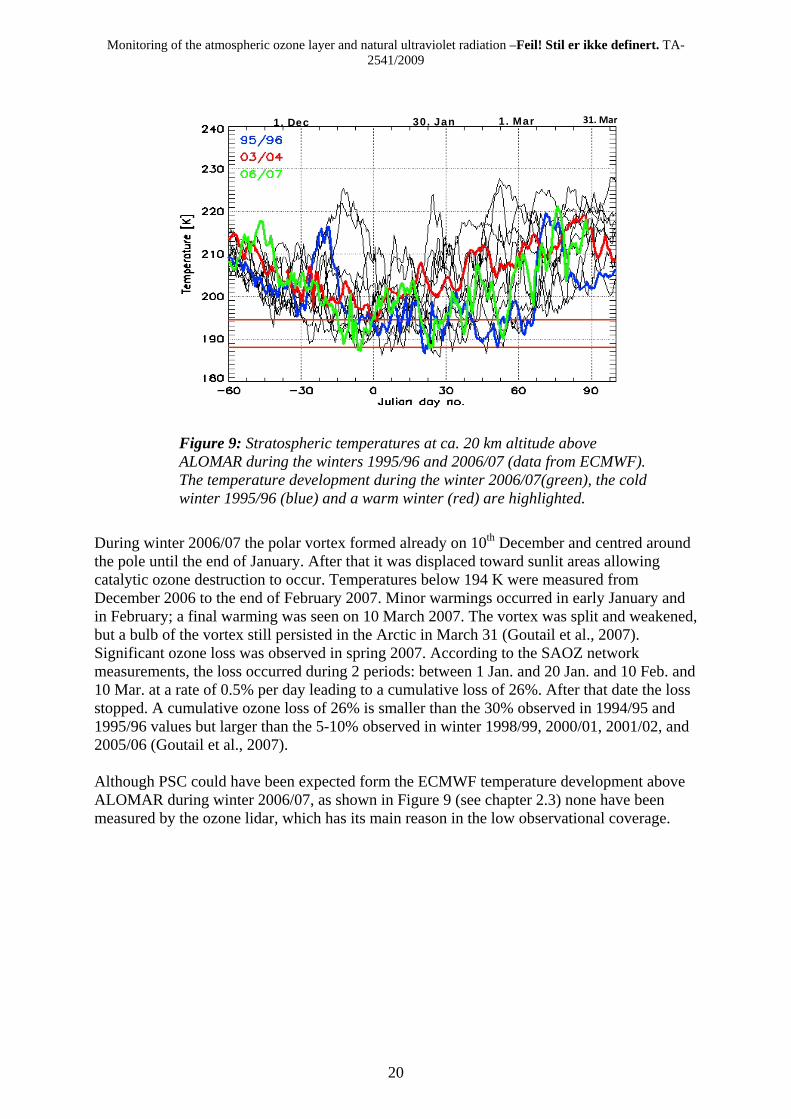
Satellite observations are filling these gaps. However, satellite observations rely on proper ground based monitoring as satellites have varying and unpredictable life times, and need calibration and validation relying on high quality ground based observations. Thus satellite observations are complementary to ground based observations, and both are highly necessary. Observations of seasonal, latitudinal, and longitudinal ozone distribution from space have been performed over more than 40 years using a variety of satellite instruments. The American institutions NASA and NOAA (National Oceanic and Atmospheric Administration) started these observations and later The European Space Agency also initiated their ozone programmes. Figure 10 gives a brief overview of the various ozone satellite missions measuring total column ozone since the beginning of 1970’s. It is of high interest to explore the available ozone measurements from satellite in the Scandinavian and Arctic region, and compare the results with our ground-based observations. A great benefit of using the satellite data in the annual analysis of the Norwegian ozone layer is the increased knowledge of the spatial coverage. This will improve the national monitoring of the ozone layer and the UV radiation as it allows for a better investigation of point observations, e.g. in Oslo and at Andøya. Satellites also make it possible to investigate the geographical extent of low ozone episodes during spring and summer and thereby discover enhanced UV intensity on a regional level. Based on a project jointly financed by The European Space Agency (ESA) (http://www.esa.int/) and The Norwegian Space Centre (NRS) (Norsk Romsenter, http://www.romsenter.no/) we are now in a position where we can explore and utilize ozone satellite observations in a better way in the National monitoring of the ozone and UV radiation in the future. The project started in October 2007 and the first results from this work are included in this report.
Figure 10: An overview of the various satellites and their instruments measuring ozone from space since the beginning of 1970’s (Figure from NASA).
Year
Monitoring of the atmospheric ozone layer and natural ultraviolet radiation –Feil! Stil er ikke definert. TA-2541/2009
22
4.2 Satellite ozone observations above the Norwegian sites from 1978–2007
1980 1985 1990 1995 2000 2005 2010100
150
200
250
300
350
400
450
500
550
600
650
700AURA OMI
Earth Probe TOMS
Tota
l ozo
ne/D
U
Year
Nimbus TOMS Meteor TOMS
1980 1985 1990 1995 2000 2005 2010
100
150
200
250
300
350
400
450
500
550
600
650
700
Envisat SCIAMACHYNimbus TOMS v2
Earth Probe TOMS
Tota
l ozo
ne/D
U
Year
Nimbus TOMS v1
Meteor TOMS
ERS-2 GOME
AURA OMI
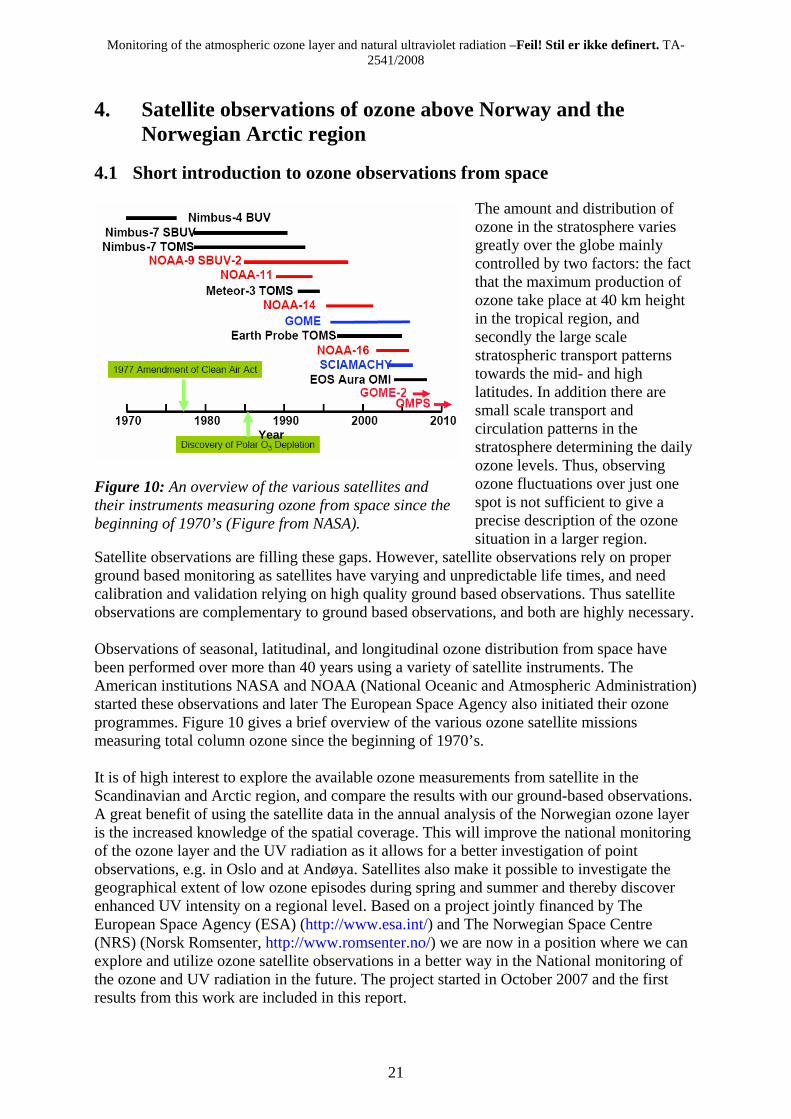
Figure 11: Ozone observations from satellite overpasses above Oslo (left panel) and Andøya (right panel). The coloured arrows indicate the various satellites and instruments. Figure 11 shows selected ozone observations from satellite overpasses above the two Norwegian ozone sites in the period from 1978-2007. Observations above Oslo are shown in the left panel, and observations above Andøya are shown in the right panel. The colors and the arrows indicate the various data sources. Data from the satellites Nimbus, Meteor, Earth Probe, ERS-2, Envisat and AURA is included, and the observations are based on measurements performed by the instruments TOMS, GOME, OMI and SCIAMACHY. More data will be downloaded for Oslo in the near future.
4.3 Satellite and ground based ozone observations for Oslo and Andøya in 2007
200
300
400
500
Tota
l ozo
ne /D
U
Month in 2007
Groundbased data from Oslo Satellite overpass data from OMI
Jan Feb Mar Apr May Jun Jul Aug Sep Oct Nov Dec-20
020
Diff
eren
ce in
%
200
300
400
500
Tota
l ozo
ne /D
U
Groundbased data from Andøya Satellite overpass data from OMI Satellite overpass data from SCIAMACHY
-200
20
Diff
eren
ce in
%
Jan Feb Mar Apr May Jun Jul Aug Sep Oct Nov Dec-20
020
Month in 2007
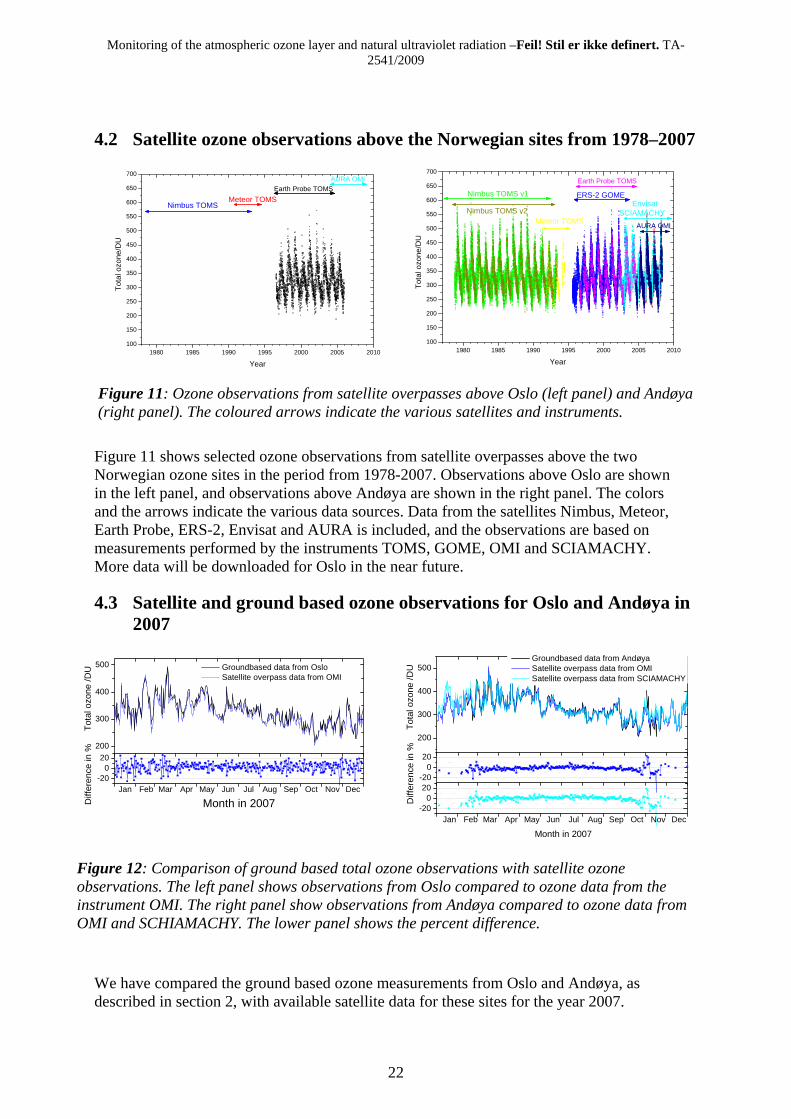
Figure 12: Comparison of ground based total ozone observations with satellite ozone observations. The left panel shows observations from Oslo compared to ozone data from the instrument OMI. The right panel show observations from Andøya compared to ozone data from OMI and SCHIAMACHY. The lower panel shows the percent difference.
We have compared the ground based ozone measurements from Oslo and Andøya, as described in section 2, with available satellite data for these sites for the year 2007.
Monitoring of the atmospheric ozone layer and natural ultraviolet radiation –Feil! Stil er ikke definert. TA-2541/2008
23
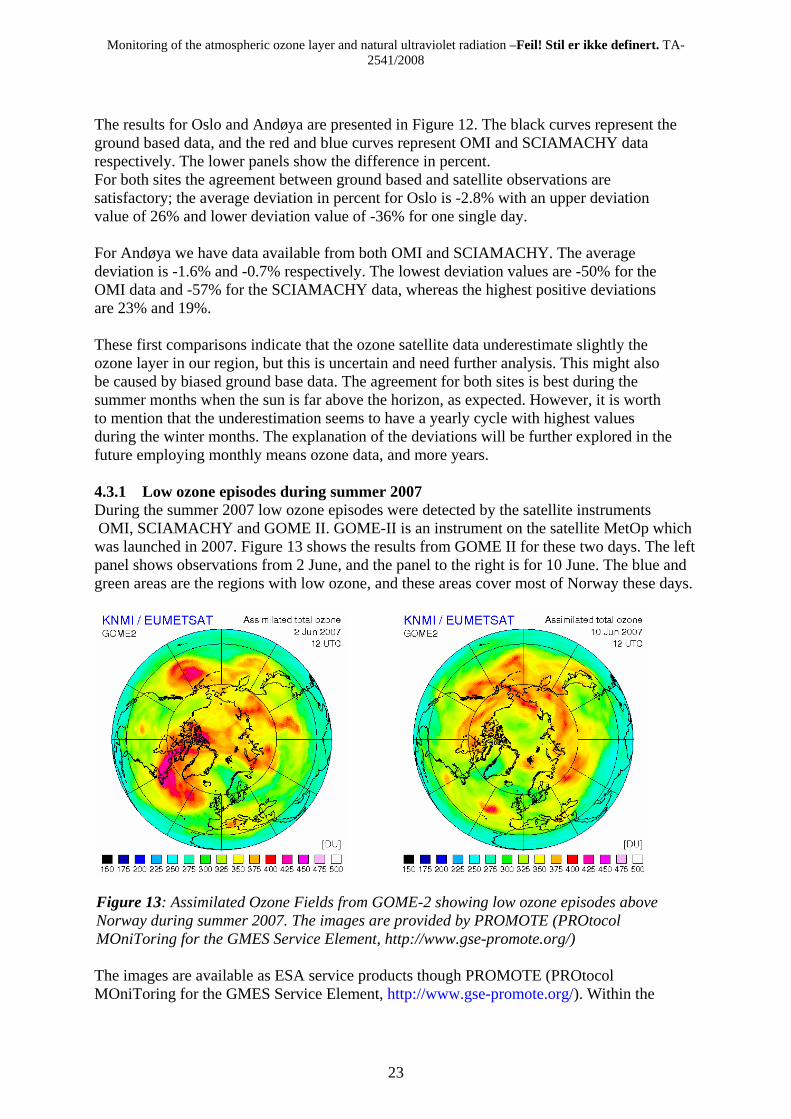
The results for Oslo and Andøya are presented in Figure 12. The black curves represent the ground based data, and the red and blue curves represent OMI and SCIAMACHY data respectively. The lower panels show the difference in percent. For both sites the agreement between ground based and satellite observations are satisfactory; the average deviation in percent for Oslo is -2.8% with an upper deviation value of 26% and lower deviation value of -36% for one single day. For Andøya we have data available from both OMI and SCIAMACHY. The average deviation is -1.6% and -0.7% respectively. The lowest deviation values are -50% for the OMI data and -57% for the SCIAMACHY data, whereas the highest positive deviations are 23% and 19%. These first comparisons indicate that the ozone satellite data underestimate slightly the ozone layer in our region, but this is uncertain and need further analysis. This might also be caused by biased ground base data. The agreement for both sites is best during the summer months when the sun is far above the horizon, as expected. However, it is worth to mention that the underestimation seems to have a yearly cycle with highest values during the winter months. The explanation of the deviations will be further explored in the future employing monthly means ozone data, and more years. 4.3.1 Low ozone episodes during summer 2007 During the summer 2007 low ozone episodes were detected by the satellite instruments OMI, SCIAMACHY and GOME II. GOME-II is an instrument on the satellite MetOp which was launched in 2007. Figure 13 shows the results from GOME II for these two days. The left panel shows observations from 2 June, and the panel to the right is for 10 June. The blue and green areas are the regions with low ozone, and these areas cover most of Norway these days.
Figure 13: Assimilated Ozone Fields from GOME-2 showing low ozone episodes above Norway during summer 2007. The images are provided by PROMOTE (PROtocol MOniToring for the GMES Service Element, http://www.gse-promote.org/) The images are available as ESA service products though PROMOTE (PROtocol MOniToring for the GMES Service Element, http://www.gse-promote.org/). Within the
Monitoring of the atmospheric ozone layer and natural ultraviolet radiation –Feil! Stil er ikke definert. TA-2541/2009
24
ESA/NRS project "Satluft" NILU plans to pursue improved methods for flagging low-ozone events over Norway in 2009.
Monitoring of the atmospheric ozone layer and natural ultraviolet radiation –Feil! Stil er ikke definert. TA-2541/2008
25
5. The 4th IPCC report: Coupling of stratospheric ozone and climate
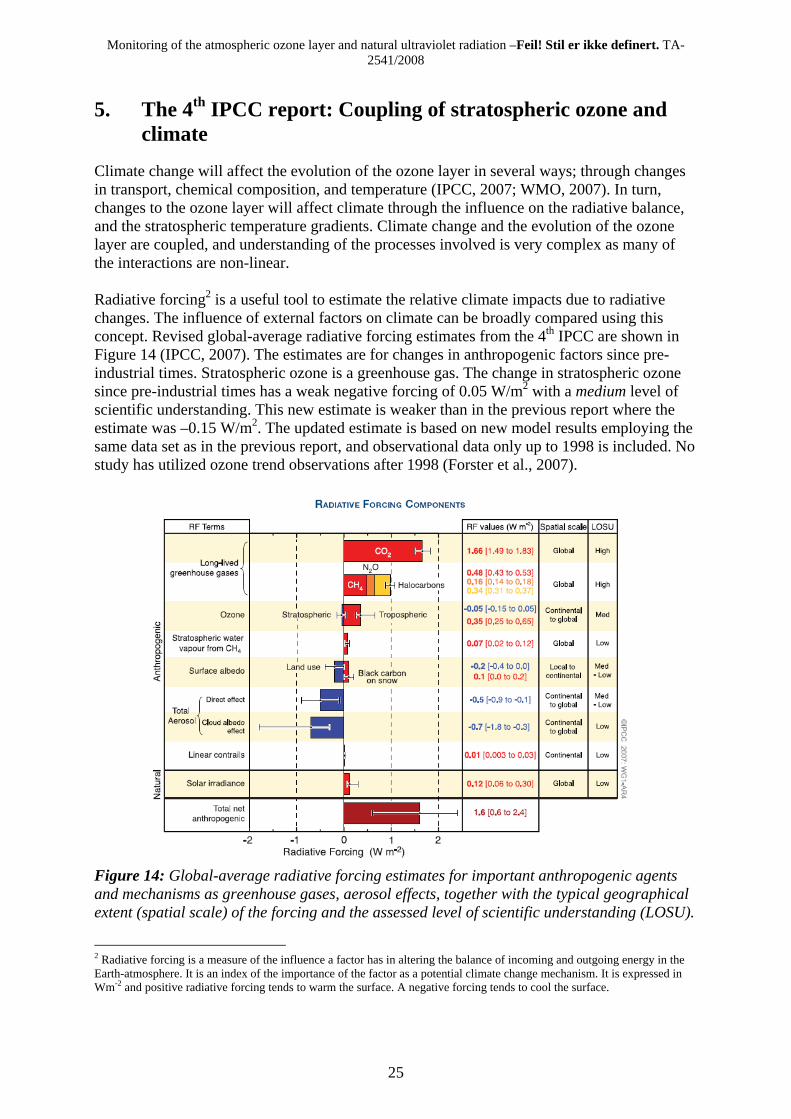
Climate change will affect the evolution of the ozone layer in several ways; through changes in transport, chemical composition, and temperature (IPCC, 2007; WMO, 2007). In turn, changes to the ozone layer will affect climate through the influence on the radiative balance, and the stratospheric temperature gradients. Climate change and the evolution of the ozone layer are coupled, and understanding of the processes involved is very complex as many of the interactions are non-linear. Radiative forcing2 is a useful tool to estimate the relative climate impacts due to radiative changes. The influence of external factors on climate can be broadly compared using this concept. Revised global-average radiative forcing estimates from the 4th IPCC are shown in Figure 14 (IPCC, 2007). The estimates are for changes in anthropogenic factors since pre-industrial times. Stratospheric ozone is a greenhouse gas. The change in stratospheric ozone since pre-industrial times has a weak negative forcing of 0.05 W/m2 with a medium level of scientific understanding. This new estimate is weaker than in the previous report where the estimate was –0.15 W/m2. The updated estimate is based on new model results employing the same data set as in the previous report, and observational data only up to 1998 is included. No study has utilized ozone trend observations after 1998 (Forster et al., 2007).
Figure 14: Global-average radiative forcing estimates for important anthropogenic agents and mechanisms as greenhouse gases, aerosol effects, together with the typical geographical extent (spatial scale) of the forcing and the assessed level of scientific understanding (LOSU).
2 Radiative forcing is a measure of the influence a factor has in altering the balance of incoming and outgoing energy in the Earth-atmosphere. It is an index of the importance of the factor as a potential climate change mechanism. It is expressed in Wm-2 and positive radiative forcing tends to warm the surface. A negative forcing tends to cool the surface.
Monitoring of the atmospheric ozone layer and natural ultraviolet radiation –Feil! Stil er ikke definert. TA-2541/2009
26
The temporarily and seasonally non-uniform nature of the ozone trends has important implications for the radiative forcing. Total column ozone changes over mid latitudes is considerable larger at the southern hemisphere (-6%) than at the northern hemisphere (-3%). According to the IPCC report the negative ozone trend has slowed down the last decade, also described in section 2.1 of this report. However, it is not yet clear whether these recent changes are indicative of ozone recovery (Forster et al., 2007). Stratospheric ozone is indirectly affected by climate change through changes in dynamics and in the chemical composition of the troposphere and stratosphere (Denman et al., 2007). An increase in the greenhouse gases, especially CO2, cools the stratosphere. In general a decrease in stratospheric temperature reduces ozone depletion leading to higher ozone column. However, there is a possible exception in the Polar Regions where lower stratospheric temperatures lead to more favourable PSC conditions and possible formation of more PSCs. This is of particular importance in the Arctic region (WMO, 2007). Moreover, ozone absorbs UV radiation. Absorption of UV radiation provides the heating responsible for the observed temperature profile above the tropopause. Changes in stratospheric temperatures, induced by changes in ozone or greenhouse gas concentrations will alter dynamic processes. A long-term increase in stratospheric water content is observed. This might have important consequences for the ozone layer as stratospheric water vapour is among the main sources of OH in the stratosphere. OH is one of the key species in the chemical cycles regulating the ozone levels. There are several sources for stratospheric water where CH4 is one of the most important. Other sources are volcanoes, natural and anthropogenic biomass burning and air crafts. In the new IPCC report, the increase in stratospheric water vapour resulting from anthropogenic emissions of methane (CH4) has a positive forcing of 0.07 W/m2, shown in Figure 14. The evolution of stratospheric ozone over the next few decades will depend on natural, and human-caused factors such as stratospheric halogen loading. The evolution of ozone will also depend on changes in many stratospheric constituents: it is expected that the reduction of ozone-depleting substances in the 21st century will cause ozone to increase via chemical processes. However, this increase could be strongly affected by temperature changes (due to greenhouse gases), other chemical changes (e.g., due to water vapour) and transport changes. According to model studies presented in the new IPCC report (Denman et al., 2007) Antarctic ozone development follows mainly the behavior of chlorine and bromine compounds. The peak depletion is expected to have occured around the year 2000 followed by a slow increase. Most models predict that Antarctic ozone amounts will increase to 1980 levels close to the time when modelled halogen amounts decrease to 1980 values, which is in the year 2065. Increased atmospheric fluxes of chlor-fluor-carbons (CFCs) have recently been reported which may point to a still later recovery. The various models do not predict consistent values for minimum arctic column ozone. However, in all stratsopheric ozone model results included in the IPCC report, Arctic ozone increases to 1980 values before the Antarctic ozone does, mainly explained by circulation differences combined with a reduction in stratospheric temperatures.
Monitoring of the atmospheric ozone layer and natural ultraviolet radiation –Feil! Stil er ikke definert. TA-2541/2008
27
6. UV measurements
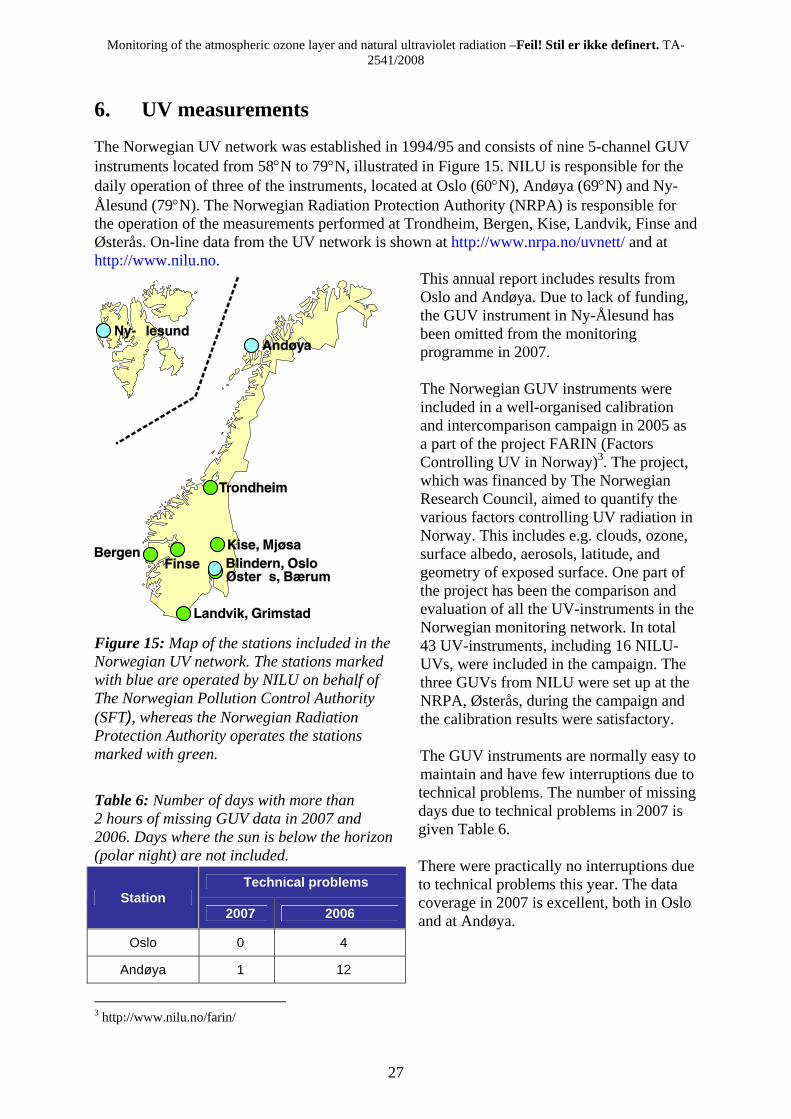
The Norwegian UV network was established in 1994/95 and consists of nine 5-channel GUV instruments located from 58°N to 79°N, illustrated in Figure 15. NILU is responsible for the daily operation of three of the instruments, located at Oslo (60°N), Andøya (69°N) and Ny-Ålesund (79°N). The Norwegian Radiation Protection Authority (NRPA) is responsible for the operation of the measurements performed at Trondheim, Bergen, Kise, Landvik, Finse and Østerås. On-line data from the UV network is shown at http://www.nrpa.no/uvnett/ and at http://www.nilu.no.
This annual report includes results from Oslo and Andøya. Due to lack of funding, the GUV instrument in Ny-Ålesund has been omitted from the monitoring programme in 2007. The Norwegian GUV instruments were included in a well-organised calibration and intercomparison campaign in 2005 as a part of the project FARIN (Factors Controlling UV in Norway)3. The project, which was financed by The Norwegian Research Council, aimed to quantify the various factors controlling UV radiation in Norway. This includes e.g. clouds, ozone, surface albedo, aerosols, latitude, and geometry of exposed surface. One part of the project has been the comparison and evaluation of all the UV-instruments in the Norwegian monitoring network. In total 43 UV-instruments, including 16 NILU-UVs, were included in the campaign. The three GUVs from NILU were set up at the NRPA, Østerås, during the campaign and the calibration results were satisfactory. The GUV instruments are normally easy to maintain and have few interruptions due to technical problems. The number of missing days due to technical problems in 2007 is given Table 6. There were practically no interruptions due to technical problems this year. The data coverage in 2007 is excellent, both in Oslo and at Andøya.
3 http://www.nilu.no/farin/
Figure 15: Map of the stations included in the Norwegian UV network. The stations marked with blue are operated by NILU on behalf of The Norwegian Pollution Control Authority (SFT), whereas the Norwegian Radiation Protection Authority operates the stations marked with green.
Table 6: Number of days with more than 2 hours of missing GUV data in 2007 and 2006. Days where the sun is below the horizon (polar night) are not included.
Technical problems Station
2007 2006
Oslo 0 4
Andøya 1 12
Monitoring of the atmospheric ozone layer and natural ultraviolet radiation –Feil! Stil er ikke definert. TA-2541/2009
28
6.1 UV measurement results in 2007
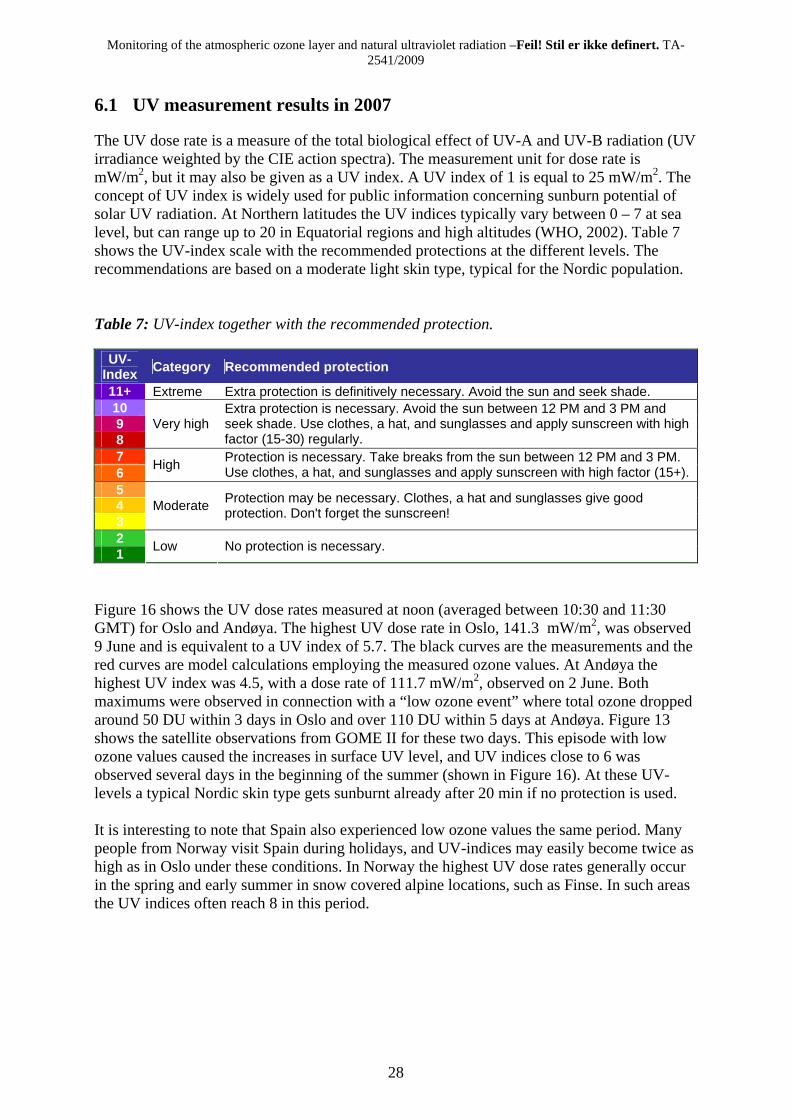
The UV dose rate is a measure of the total biological effect of UV-A and UV-B radiation (UV irradiance weighted by the CIE action spectra). The measurement unit for dose rate is mW/m2, but it may also be given as a UV index. A UV index of 1 is equal to 25 mW/m2. The concept of UV index is widely used for public information concerning sunburn potential of solar UV radiation. At Northern latitudes the UV indices typically vary between 0 – 7 at sea level, but can range up to 20 in Equatorial regions and high altitudes (WHO, 2002). Table 7 shows the UV-index scale with the recommended protections at the different levels. The recommendations are based on a moderate light skin type, typical for the Nordic population. Table 7: UV-index together with the recommended protection.
UV-Index Category Recommended protection
11+ Extreme Extra protection is definitively necessary. Avoid the sun and seek shade. 10 9 8
Very high Extra protection is necessary. Avoid the sun between 12 PM and 3 PM and seek shade. Use clothes, a hat, and sunglasses and apply sunscreen with high factor (15-30) regularly.
7 6 High Protection is necessary. Take breaks from the sun between 12 PM and 3 PM.
Use clothes, a hat, and sunglasses and apply sunscreen with high factor (15+). 5 4 3
Moderate Protection may be necessary. Clothes, a hat and sunglasses give good protection. Don't forget the sunscreen!
2 1 Low No protection is necessary.
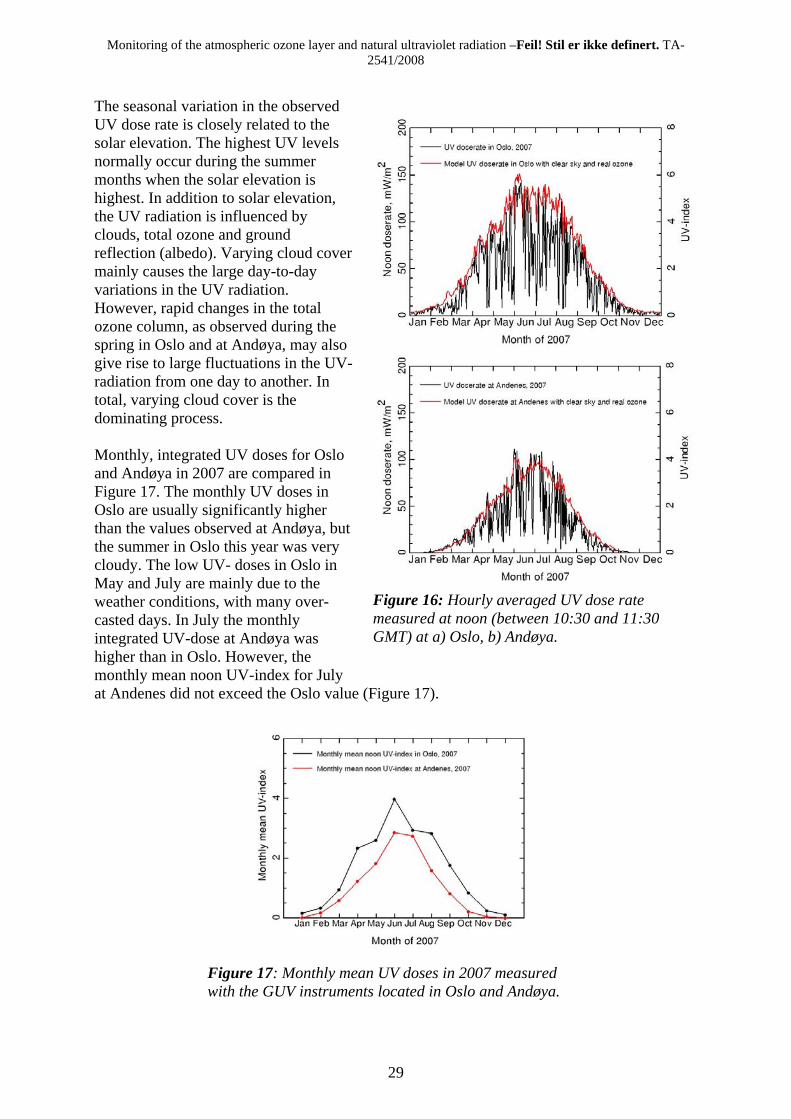
Figure 16 shows the UV dose rates measured at noon (averaged between 10:30 and 11:30 GMT) for Oslo and Andøya. The highest UV dose rate in Oslo, 141.3 mW/m2, was observed 9 June and is equivalent to a UV index of 5.7. The black curves are the measurements and the red curves are model calculations employing the measured ozone values. At Andøya the highest UV index was 4.5, with a dose rate of 111.7 mW/m2, observed on 2 June. Both maximums were observed in connection with a “low ozone event” where total ozone dropped around 50 DU within 3 days in Oslo and over 110 DU within 5 days at Andøya. Figure 13 shows the satellite observations from GOME II for these two days. This episode with low ozone values caused the increases in surface UV level, and UV indices close to 6 was observed several days in the beginning of the summer (shown in Figure 16). At these UV-levels a typical Nordic skin type gets sunburnt already after 20 min if no protection is used. It is interesting to note that Spain also experienced low ozone values the same period. Many people from Norway visit Spain during holidays, and UV-indices may easily become twice as high as in Oslo under these conditions. In Norway the highest UV dose rates generally occur in the spring and early summer in snow covered alpine locations, such as Finse. In such areas the UV indices often reach 8 in this period.
Monitoring of the atmospheric ozone layer and natural ultraviolet radiation –Feil! Stil er ikke definert. TA-2541/2008
29
The seasonal variation in the observed UV dose rate is closely related to the solar elevation. The highest UV levels normally occur during the summer months when the solar elevation is highest. In addition to solar elevation, the UV radiation is influenced by clouds, total ozone and ground reflection (albedo). Varying cloud cover mainly causes the large day-to-day variations in the UV radiation. However, rapid changes in the total ozone column, as observed during the spring in Oslo and at Andøya, may also give rise to large fluctuations in the UV-radiation from one day to another. In total, varying cloud cover is the dominating process. Monthly, integrated UV doses for Oslo and Andøya in 2007 are compared in Figure 17. The monthly UV doses in Oslo are usually significantly higher than the values observed at Andøya, but the summer in Oslo this year was very cloudy. The low UV- doses in Oslo in May and July are mainly due to the weather conditions, with many over-casted days. In July the monthly integrated UV-dose at Andøya was higher than in Oslo. However, the monthly mean noon UV-index for July at Andenes did not exceed the Oslo value (Figure 17).
Figure 17: Monthly mean UV doses in 2007 measured with the GUV instruments located in Oslo and Andøya.
Figure 16: Hourly averaged UV dose rate measured at noon (between 10:30 and 11:30 GMT) at a) Oslo, b) Andøya.
Monitoring of the atmospheric ozone layer and natural ultraviolet radiation –Feil! Stil er ikke definert. TA-2541/2009
30
6.2 Annual UV doses 1995 – 2007
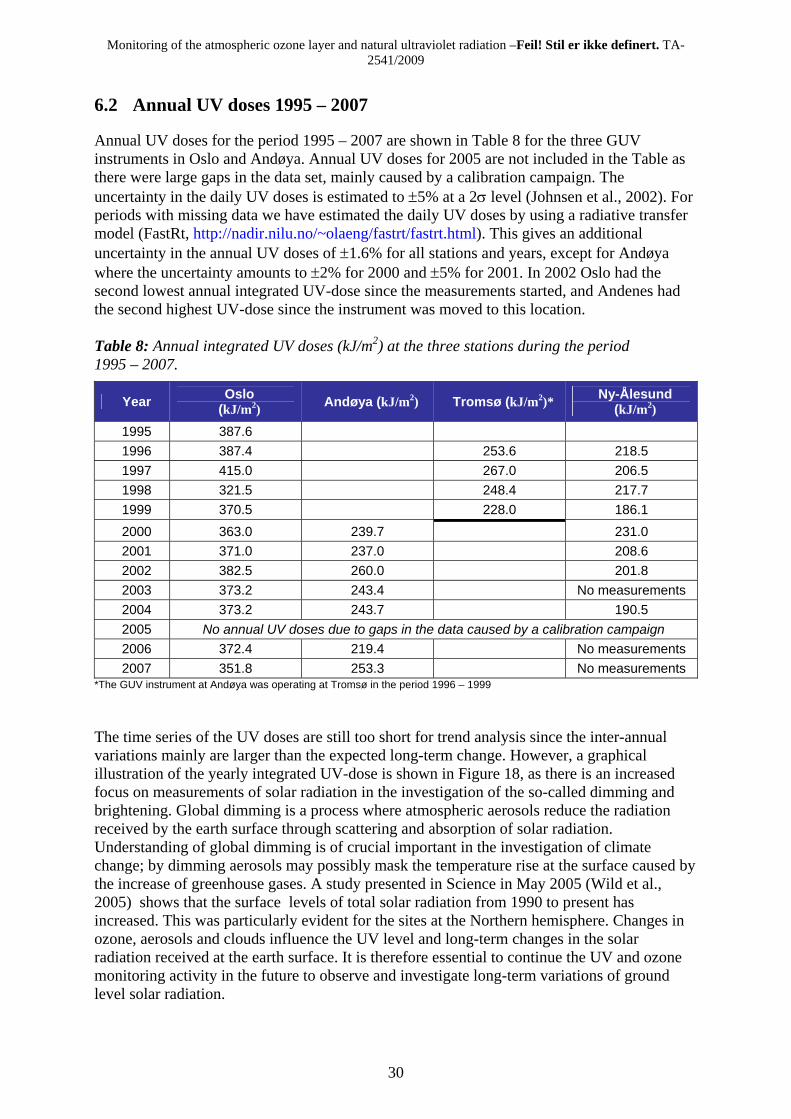
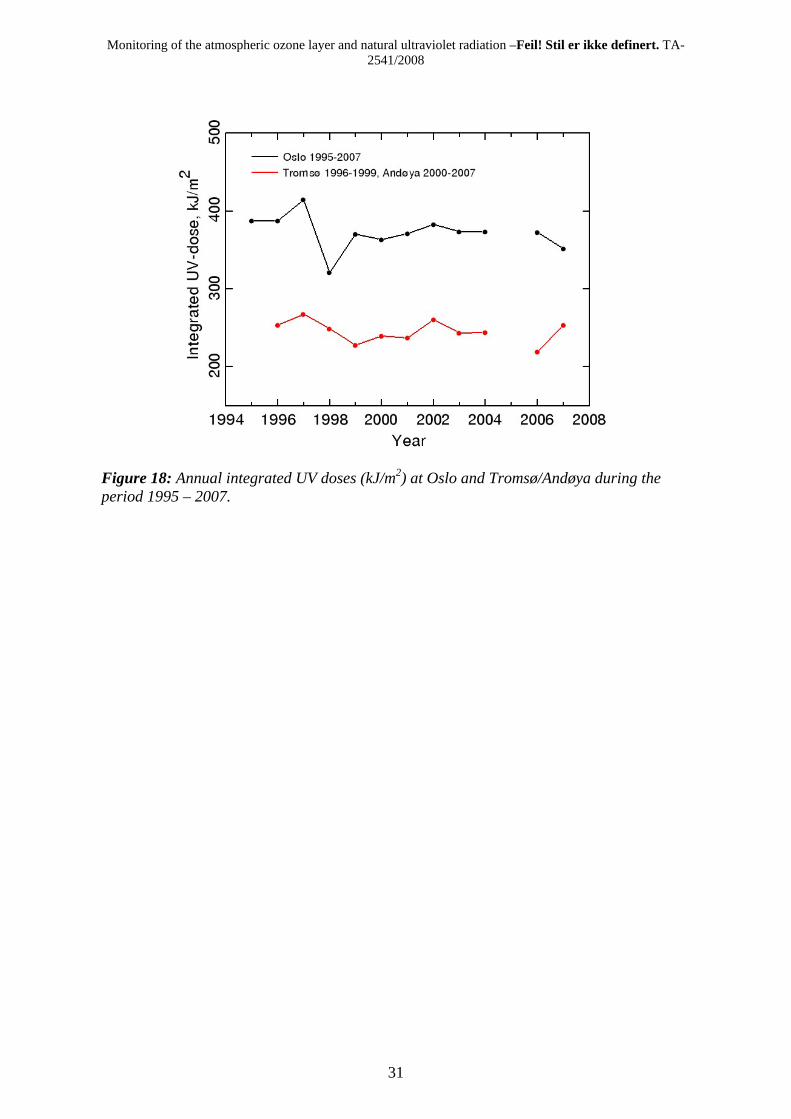
Annual UV doses for the period 1995 – 2007 are shown in Table 8 for the three GUV instruments in Oslo and Andøya. Annual UV doses for 2005 are not included in the Table as there were large gaps in the data set, mainly caused by a calibration campaign. The uncertainty in the daily UV doses is estimated to ±5% at a 2σ level (Johnsen et al., 2002). For periods with missing data we have estimated the daily UV doses by using a radiative transfer model (FastRt, http://nadir.nilu.no/~olaeng/fastrt/fastrt.html). This gives an additional uncertainty in the annual UV doses of ±1.6% for all stations and years, except for Andøya where the uncertainty amounts to ±2% for 2000 and ±5% for 2001. In 2002 Oslo had the second lowest annual integrated UV-dose since the measurements started, and Andenes had the second highest UV-dose since the instrument was moved to this location. Table 8: Annual integrated UV doses (kJ/m2) at the three stations during the period 1995 – 2007.
Year Oslo (kJ/m2) Andøya (kJ/m2) Tromsø (kJ/m2)* Ny-Ålesund
(kJ/m2) 1995 387.6 1996 387.4 253.6 218.5 1997 415.0 267.0 206.5 1998 321.5 248.4 217.7 1999 370.5 228.0 186.1 2000 363.0 239.7 231.0 2001 371.0 237.0 208.6 2002 382.5 260.0 201.8 2003 373.2 243.4 No measurements 2004 373.2 243.7 190.5 2005 No annual UV doses due to gaps in the data caused by a calibration campaign 2006 372.4 219.4 No measurements 2007 351.8 253.3 No measurements
*The GUV instrument at Andøya was operating at Tromsø in the period 1996 – 1999 The time series of the UV doses are still too short for trend analysis since the inter-annual variations mainly are larger than the expected long-term change. However, a graphical illustration of the yearly integrated UV-dose is shown in Figure 18, as there is an increased focus on measurements of solar radiation in the investigation of the so-called dimming and brightening. Global dimming is a process where atmospheric aerosols reduce the radiation received by the earth surface through scattering and absorption of solar radiation. Understanding of global dimming is of crucial important in the investigation of climate change; by dimming aerosols may possibly mask the temperature rise at the surface caused by the increase of greenhouse gases. A study presented in Science in May 2005 (Wild et al., 2005) shows that the surface levels of total solar radiation from 1990 to present has increased. This was particularly evident for the sites at the Northern hemisphere. Changes in ozone, aerosols and clouds influence the UV level and long-term changes in the solar radiation received at the earth surface. It is therefore essential to continue the UV and ozone monitoring activity in the future to observe and investigate long-term variations of ground level solar radiation.
Monitoring of the atmospheric ozone layer and natural ultraviolet radiation –Feil! Stil er ikke definert. TA-2541/2008
31
Figure 18: Annual integrated UV doses (kJ/m2) at Oslo and Tromsø/Andøya during the period 1995 – 2007.
Monitoring of the atmospheric ozone layer and natural ultraviolet radiation –Feil! Stil er ikke definert. TA-2541/2009
32
7. References
Bodeker, G.E. and Waugh, D.W. (Lead Authors), Akiyoshi, H., Braesicke, P., Eyring, V., Fahey, D.W., Manzini, E., Newchurch, M.J., Portmann, R.W., Robock, A., Shine, K.P., Steinbrecht, W. and Weatherhead, E.C. (2007) The Ozone Layer in the 21st Century. In: Scientific Assessment of Ozone Depletion: 2006. Geneva, World Meteorological Organization (Global Ozone Research and Monitoring Project—Report No. 50).
Denman, K.L., Brasseur, G., Chidthaisong, A., Ciais, P., Cox, P.M., Dickinson, R.E., Hauglustaine, D., Heinze, C., Holland, E., Jacob, D., Lohmann, U., Ramachandran, S., da Silva Dias, P.L., Wofsy, S.C. and Zhang, X. (2007) Couplings between changes in the climate system and biogeochemistry. In: Climate Change 2007: The physical science basis. Contribution of Working Group I to the fourth assessment report of the Intergovernmental Panel on Climate Change [Solomon, S., D. Qin, M. Manning, Z. Chen, M. Marquis, K.B. Averyt, M.Tignor and H.L. Miller (eds.)]. Cambridge, Cambridge University Press.
Farman, J.C., Gardiner, B.G. and Shanklin, J.D. (1985) Large losses of total ozone in Antarctica reveal seasonal ClOx/NOx interaction. Nature, 315, 207-210.
Forster, P., Ramaswamy, V., Artaxo, P., Berntsen, T., Betts, R., Fahey, D.W., Haywood, J., Lean, J., Lowe, D.C., Myhre, G., Nganga, J., Prinn, R., Raga, G., Schulz, M. and Van Dorland, R. (2007) Changes in atmospheric constituents and in radiative forcing. In: Climate Change 2007: The physical science basis. Contribution of Working Group I to the fourth assessment report of the Intergovernmental Panel on Climate Change [Solomon, S., D. Qin, M. Manning, Z. Chen, M. Marquis, K.B. Averyt, M.Tignor and H.L. Miller (eds.)]. Cambridge, Cambridge University Press.
Goutail, F., Lefèvre, F., Pommereau, J.P., Van Roozendael, M., Chipperfield, M., Feng, W., Kyro, E., Andersen, S.B., Stebel, K. and Dorokhov, V. (2006) Total ozone loss during the 2005/2006 Arctic winter and comparison to previous years. Poster presented at General Assembly of the European Geosciences Union (EGU) Vienna, Austria, 02 – 07 April 2006. Kjeller (NILU PP 38/2006).
Goutail, F., Lefèvre, F., Pommereau, J.P., Chipperfield, M., Feng, W., Van Roozendael, M., Andersen, S.B., Stebel, K., Dorokhov, V., Kyro, E., Fraser, A.C. and Strong, K. (2007) Total ozone loss during the 2006/2007 Arctic winter and comparison to previous years. Geophys. Res. Abstr., 9, 01912.
Høiskar, B.A.K., Braathen, G.O., Dahlback, A., Bojkov, B.R., Edvardsen, K., Hansen, G.H. and Svenøe, T. (2001) Monitoring of the atmospheric ozone layer and natural ultraviolet radiation. Annual report 2000. Kjeller (NILU OR 35/2001) (in Norwegian).
IPCC (2007) Summary for policymakers. In: Climate Change 2007: The physical science basis. contribution of Working Group I to the fourth assessment report of the Intergovernmental Panel on Climate Change [Solomon, S., D. Qin, M. Manning, Z. Chen, M. Marquis, K.B. Averyt, M.Tignor and H.L. Miller (eds.)]. Cambridge, Cambridge University Press.
Monitoring of the atmospheric ozone layer and natural ultraviolet radiation –Feil! Stil er ikke definert. TA-2541/2008
33
Johnsen, B., Mikkelborg, O., Hannevik, M., Nilsen, L.T., Saxebø, G. and Blaasaas, K.G. (2002) The Norwegian UV-monitoring program, Period 1995/96 to 2001. Østerås, Statens strålevern (Strålevern Rapport 2002:4).
Stamnes, K., Slusser, J. and Bowen, M. (1991) Derivation of total ozone abundance and cloud effects from spectral irradiance measurements. Appl. Opt., 30, 4418-4426.
Svendby, T.M. and Dahlback, A. (2002) Twenty years of revised Dobson total ozone measurements in Oslo, Norway. J. Geophys. Res., 107D, 4369, doi: 10.1029/2002JD002260.
Weatherhead, E.C. and Andersen, S.B. (2006) The search for signs of recovery of the ozone layer. Nature, 441, 39-45.
Werner, R., K. Stebel, H.G. Hansen, U.-P. Hoppe, M. Gausa, R. Kivi, P. von der Gathen, and Y. Orsolini, Study of the inter-annual ozone variation at European high latitudes, poster presentation at Quadrennial Ozone Symposium, Tromsø, Norway, June 29th - July 5th, 2008.
WHO (2002) Ultraviolet radiation: Global solar UV-index. Geneva, World Health Organization (Revised Fact Sheet No 271). URL: http://www.who.int/mediacentre/factsheets/fs271/en/.
Wild, M., Gilgen, H., Roesch, A., Ohmura, A., Long, C.N., Dutton, E.G., Forgan, B., Kallis, A., Russak, V. and Tsvetkov, A. (2005) From dimming to brightening: Decadal changes in solar radiation at Earth's surface. Science, 308, 847-850.
WMO (2007) Scientific assessment of ozone depletion: 2006. Geneva, World Meteorological Organization (Global Ozone Research and Monitoring Project – Report No. 50).
Monitoring of the atmospheric ozone layer and natural ultraviolet radiation –Feil! Stil er ikke definert. TA-2541/2009
34
Statlig program for forurensningsovervåking Overvåking av ozonlaget og naturlig ultrafiolett stråling Statens forurensningstilsyn (SFT) Postboks 8100 Dep, 0032 Oslo - Besøksadresse: Strømsveien 96 Telefon: 22 57 34 00 - Telefaks: 22 67 67 06 E-post: [email protected] - Internett: www.sft.no
Utførende institusjon Norsk institutt for luftforskning
ISBN-nummer 978-82-425-2004-3 (trykt) 978-82-425-2005-0 (elektronisk)
Oppdragstakers prosjektansvarlig Cathrine Lund Myhre
Kontaktperson SFT Harold Leffertstra
TA-nummer 2541/2009
År
2008 Sidetall 32
SFTs kontraktnummer (4007)115
Utgiver Norsk institutt for luftforskning NILU OR 46/2008 ISSN 0807-7207
Prosjektet er finansiert av SFT
Forfatter(e) C. Lund Myhre, K. Edvardsen, K. Stebel, T.M. Svendby, G.H. Hansen (NILU), A. Dahlback (UiO)
Tittel - norsk og engelsk Monitoring of the atmospheric ozone layer and natural ultraviolet radiation. Annual report 2007.
Overvåkning av ozonlaget og naturlig ultrafiolett stråling. Årsrapport 2007.
Sammendrag – summary Rapporten presenterer måledata for totalozon, vertikalfordelingen av ozon og UV-stråling over norske målestasjoner i 2007. For Oslo og Andøya er trenden i totalozon beregnet for perioden 1979-2007.
This is an annual report describing the activities and main results of the monitoring programme “Monitoring of the atmospheric ozone layer and natural ultraviolet radiation” for 2007.
4 emneord Stratosfærisk ozon UV-stråling Målinger og observasjoner Montreal-protokollen
4 subject words Stratospheric ozone UV radiation Measurements and observations Montreal protocol

Statens forurensningstilsyn Postboks 8100 Dep, 0032 Oslo Besøksadresse: Strømsveien 96 Telefon: 22 57 34 00 Telefaks: 22 67 67 06 E-post: [email protected] www.sft.no
Statlig program for forurensningsovervåking omfatter overvåking av forurensningsforholdene i luft og nedbør, skog, vassdrag, fjorder og havområder. Overvåkingsprogrammet dekker langsiktige undersøkelser av:
• overgjødsling • forsuring (sur nedbør) • ozon (ved bakken og i stratosfæren) • klimagasser • miljøgifter
Overvåkingsprogrammmet skal gi informasjon om tilstanden og utviklingen av forurensningssituasjonen, og påvise eventuell uheldig utvikling på et tidlig tidspunkt. Programmet skal dekke myndighetenes informasjonsbehov om forurensningsforholdene, registrere virkningen av iverksatte tiltak for å redusere forurensningen, og danne grunnlag for vurdering av nye tiltak. SFT er ansvarlig for gjennomføringen av overvåkningsprogrammet. TA-2433/2008 ISBN 978-82-425-2004-3 (trykt) ISBN 978-82-425-2005-0 (elektronisk)