MONITORING OF SOLID WASTE IN HONG KONG - Waste Statistics ... · MONITORING OF SOLID WASTE IN HONG...
35
MONITORING OF SOLID WASTE IN HONG KONG Waste Statistics for 2016 Environmental Protection Department
Transcript of MONITORING OF SOLID WASTE IN HONG KONG - Waste Statistics ... · MONITORING OF SOLID WASTE IN HONG...

MONITORING OF SOLID WASTE IN
HONG KONG
Waste Statistics for 2016
Environmental Protection Department

Monitoring of Solid Waste in Hong Kong
Waste Statistics for 2016
Date of issue: December 2017 (1st revision: April 2018)
Work done by: Statistics Unit,
Environmental Protection Department
Security classification: Unrestricted
Cover photos
Top left: Recycling plant for waste construction materials and waste glass in EcoPark
Bottom left: Waste composition survey in progress under the supervision of EPD supervisor
Top right: Bird’s eye view of T ▪ PARK in Tuen Mun
Bottom right: South East New Territories Landfill receiving only construction and demolition waste as from 6 January 2016
Remarks: The 1st revision includes update of footnotes of Plate 2.13a, revision of statistics on clinical waste treated at the Chemical Waste Treatment Centre in Plate 2.13b, and textual amendments on dewatered sludges throughout the report.
Information contained in this publication, which is the best available at the time of preparation, may be freely used. Reproduction of materials is permitted with notification to the Director of Environmental Protection. Acknowledgment must be made by indicating the title of this publication.
Monitoring of Solid Waste in Hong Kong - Waste Statistics for 2016
ii

Contents Page
Abbreviations iv
1. Introduction 1
2. Waste Quantities and Characteristics Plate 2.1 Disposal of total solid waste at landfills in 2016–By main waste category 4 Plate 2.2 Disposal of total solid waste at landfills in 2015 and 2016–By main waste category 5 Plate 2.3 Disposal of total solid waste at landfills from 2012 to 2016–By main waste category 5 Plate 2.4 Waste management facilities in Hong Kong 6 Plate 2.5 Total solid waste received by RTSs and landfills in 2016–By main waste category 7 Plate 2.6 Arisings of solid waste disposed of at landfills in 2016–By district by main waste category 8 Plate 2.7 Per capita disposal rates of MSW, domestic waste and commercial & industrial waste from 2007 to 2016 9 Plate 2.8 Composition of MSW disposed of at landfills in 2016–By waste type 10 Plate 2.9 Composition of MSW disposed of at landfills in 2016–By major waste type 11 Plate 2.10 Composition of MSW disposed of at landfills in percentages in 2015 and 2016– By major waste type 12 Plate 2.11 Composition of municipal food waste disposed of at landfills in percentages in 2015 and 2016
- By waste category 12
Plate 2.12 Disposal and reuse of overall construction waste in 2015 and 2016 13 Plate 2.13a Disposal of special waste at landfills in 2016–By special waste type 14 Plate 2.13b Treatment of special waste in 2016 (Not disposed of at landfills)–By special waste type 15 Plate 2.14 Composition of MSW disposed of at landfills in percentages from 2012 to 2016
–By major waste type 16
Plate 2.15 Composition of MSW disposed of at landfills in quantities from 2012 to 2016 –By major waste type 17
Plate 2.16
Plate 2.17
Disposal and reuse of overall construction waste from 2012 to 2016
Overall construction waste received by treatment facilities from 2012 to 2016 18
19
3. Resource Recovery and Recycling Plate 3.1 Generation, disposal and recovery of MSW in 2015 and 2016 20 Plate 3.2 Recovery rates of MSW, domestic waste, and commercial and industrial waste from 2012 to 2016 20 Plate 3.3 Recyclables recovered from MSW in 2016–By type of recyclable 21 Plate 3.4 Recyclables recovered from MSW in percentages in 2015 and 2016–By type of recyclable 21 Plate 3.5 Total quantities and export values of recyclable materials recovered from MSW from 2012 to 2016 22 Plate 3.6 Values of exported recyclable materials recovered from MSW in percentages in 2015 and 2016
–By major type of recyclable material 22
Plate 3.7 Quantities and values of exported recyclable materials recovered from MSW in 2016 –By major type of recyclable material 23
Plate 3.8 Generation, disposal and recovery of MSW from 2012 to 2016 24
Plate 3.9 Recyclables recovered from MSW in percentages from 2012 to 2016 –By major type of recyclable 25
Plate 3.10 Recyclables recovered from MSW in quantities from 2012 to 2016 –By major type of recyclable 26
Plate 3.11 Values of exported recyclable materials recovered from MSW in percentages from 2012 to 2016 –By major type of recyclable material 27
Plate 3.12 Values of exported recyclable materials recovered from MSW from 2012 to 2016 –By major type of recyclable material 28
Appendix 1 Classification of Solid Waste and Monitoring Methodology 29
Appendix 2 Terminology of Waste Management System 31
Monitoring of Solid Waste in Hong Kong - Waste Statistics for 2016
iii

Abbreviations
AFCD Agriculture, Fisheries and Conservation Department
AWCP Animal Waste Composting Plant
C&D Construction and Demolition
C&SD Census and Statistics Department
CEDD Civil Engineering and Development Department
CWTC Chemical Waste Treatment Centre
EPD Environmental Protection Department
FEHD Food and Environmental Hygiene Department
IETS Island East Transfer Station
IWTS Island West Transfer Station
KBTS Kowloon Bay Transfer Station
MSW Municipal Solid Waste
N/A Not Available
NENT North East New Territories Landfill
NLTS North Lantau Transfer Station
NT New Territories
NWNTRTS North West New Territories Refuse Transfer Station
OITF Outlying Islands Transfer Facilities
ORRC Organic Resources Recovery Centre
PET Polyethylene Terephthalate
RTS(s) Refuse Transfer Station(s)
SENT South East New Territories Landfill
SLCP Shaling Composting Plant
STTS Sha Tin Transfer Station
tpd tonnes per day
WEEE Waste electrical and electronic equipment
WENT West New Territories Landfill
WKTS West Kowloon Transfer Station
Monitoring of Solid Waste in Hong Kong - Waste Statistics for 2016
iv

1. Introduction
Introduction
This report presents the statistics on disposal and recovery/recycling of solid waste generated in Hong Kong in 2016. The information contained in this report is compiled from the data collected from various sources, including the ongoing solid waste monitoring work at waste treatment facilities undertaken by the Environmental Protection Department (EPD). The classification of solid waste and the methodology adopted in data collection are explained in Appendix 1, whereas terms related to Waste Management System of Hong Kong are elaborated in Appendix 2. Abbreviations used in this report are listed on page iv for ease of reference. Readers may wish to note that due to rounding off, figures of various plates may not add up to total and percentages may not add up to 100.
Key observations of the local waste disposal and resource recovery scene are summarised in the ensuing paragraphs, with a view to facilitating readers to have a quick overview of the achievements and challenges of our waste management efforts. Detailed statistics on waste disposal and resource recovery are provided in Chapters 2 and 3 respectively.
Waste Disposal in 2016
Total Solid Waste
Solid waste comprises municipal solid waste (MSW), overall construction waste, and special waste. In 2016, the total quantity of solid waste disposed of at the strategic landfills was 5.61 million tonnes. The average daily quantity was 15,332 tonnes per day (tpd), which has increased by 1.5% as compared to 2015 (Plate 2.1). The growth rate of total solid waste disposal remained steady (it was 1.6% in 2015 and 3.8% in 2014).
Municipal Solid Waste
Municipal solid waste includes three categories: domestic waste, commercial waste and industrial waste.
In 2016, the quantity of MSW disposal was 10,345 tpd (3.79 million tonnes), which represented an increase of 1.8% as compared to 2015. The major component of MSW is domestic waste. Its quantity of disposal was 6,391 tpd (2.34 million tonnes) in 2016, which has decreased by 1.1% as compared to 2015. Separately, the quantity of commercial and industrial (C&I) waste being disposed was 3,954 tpd (1.45 million tonnes) in 2016, which has increased by 7.0% when compared to 2015.
Discounting the factor of population growth, the disposal rate of MSW was 1.41 kg/person/day, as compared to 1.39 kg/person/day in 2015. The disposal rate of domestic waste, being 0.87 kg/person/day, has dropped slightly as compared to 0.89 kg/person/day in 2015. The relatively stable domestic waste disposal rate in recent years implies that the growth in domestic waste disposal has broadly been in line with the growth in population.
Monitoring of Solid Waste in Hong Kong - Waste Statistics for 2016
1

However, the increase in the disposal quantity of C&I waste, which rose by 7.0% as compared to 2015, offset the reduction in domestic waste. Generally speaking, commercial waste arising correlates with the level of consumption activities. The increase in commercial waste disposal in 2016 could be partly due to a relatively buoyant local economy. Plates 2.8 and 2.9 show the composition of MSW disposed of at landfills in 2016. Of the 10,345 tonnes of MSW landfilled each day in 2016, some 3,600 tonnes (35% of MSW) were food waste. In 2016, food waste disposal at landfills had increased by 6.5% as compared to 2015, as driven by the increase in food waste disposal from C&I sectors. On the contrary, domestic food waste disposal rate dropped to 0.32 kg/person/day in 2016. This showed that households are gradually becoming more aware of food waste reduction. The increase in C&I food waste disposal suggested that more efforts are needed to continue promoting food waste avoidance, reduction and recycling in C&I sectors. In particular, the commencement of Organic Resources Recovery Centre (ORRC) Phase 1 in early 2018 and implementation of MSW Charging by end of 2019 at the earliest are expected to bring down C&I food waste disposal and boost up recovery. The second largest constituent of MSW was waste paper. Some 2,244 tonnes per day (22% of MSW) were disposed of at landfills in 2016. It was followed by waste plastics, with a daily disposal quantity of 2,132 tonnes per day (21% of MSW) in 2016. Overall Construction Waste The quantity of overall construction waste disposed of at landfills in 2016 was 4,422 tpd (1.62 million tonnes), which has increased by 5.3% as compared to 2015. The increase was consistent with the increase in construction work in Hong Kong. In recent years, the reuse rate of inert materials sorted out from construction waste has remained at above 90%, and was 93% in 2016. These materials were delivered to the public fill reception facilities and other outlets for beneficial direct reuse. The increase in construction waste disposal charges, with effect from April 2017, is expected to provide further incentives for the trade to reduce and reuse construction waste. Special Waste In 2016, the quantity of special waste disposed of at landfills was 565 tpd (0.21 million tonnes), which has further decreased by 24.1% as compared to 2015. After the commissioning of the Sludge Treatment Facility (T ▪ PARK) in Tuen Mun in April 2015, which treats dewatered sewage sludge from major sewage treatment works managed by Drainage Services Department by incineration, dewatered sewage sludge disposal has dropped remarkably. On average, 1,144 tonnes of dewatered sludges per day was treated at the T ▪ PARK in 2016, leading to a drop in disposal quantity by 78% as compared to 2015. Resource Recovery in 2016 As one of the world's most service-oriented economies, Hong Kong’s capacity to consume raw or recycled materials in local production is severely limited, compared to countries that rely heavily on primary or secondary industries to sustain and promote their economies. As a result, over 90% of MSW recyclables locally recovered are exported for recycling outside Hong Kong.
Monitoring of Solid Waste in Hong Kong - Waste Statistics for 2016
2
In 2016, the quantity of MSW recyclables recovered was 1.91 million tonnes, which decreased by 5.9% as compared to 2015. Most of the recovered materials (97%) were exported to the Mainland and other countries for recycling, and the export value of 2016 was $4.0 billion, as compared to $4.6 billion in 2015 (Plate 3.7). The overall MSW recovery rate was 34%, which slightly decreased from 35% in 2015 (Plate 3.2). Similar to other industries that constitute our economy, the local recycling industry is subject to fluctuations induced by business cycles and market conditions. The challenging conditions of international markets that lasted for years have had a dampening effect on the demand and thus prices of local recyclables, and are expected to continue to affect the overall performance of the recycling industry. In addition, authorities in nearby cities and countries have tightened their import control regimes in recent years. Local recyclables falling short of a good quality or unable to meet import standards could no longer easily enter such places for further processing. Plate 3.3 shows the quantity of recovered recyclables from MSW by type. The recovery performance of major types of recyclables is summarised below. Metal recyclables have the highest recovery rate at 91% in 2016 among all recyclable types, as they are highly reusable and relatively valuable in international markets. There is a strong economic incentive for the recycling industry to recover metal waste as far as practicable. Waste electrical and electronic equipment (WEEE) has the second highest recovery rate among MSW recyclables, at 74% in 2016. Similar to metal recyclables, the recyclable value of WEEE is relatively high which attracts local recyclers to actively engage in WEEE recycling and reuse. Paper recyclables’ recovery rate continued to decline and dropped from 63% in 2012 to 50% in 2016. The decline in export quantity of paper recyclables was mainly due to a generally reduced scale and level of economic activities and tightening of import control of the importing countries. Plastics recyclables’ recovery rate has slightly increased from 11% in 2015 to 14% in 2016. In particular, the quantity of plastic recyclables recovered from MSW had increased by 34%. With the rebound of crude oil price in 2016, the demand for plastics recyclables gradually bounced back.
Monitoring of Solid Waste in Hong Kong - Waste Statistics for 2016
3

2. Waste Quantities and CharacteristicsPlate 2.1 Disposal of total solid waste at landfills in 2016
- By main waste category
Waste category(1) Average daily quantity
(tpd)
a. Municipal solid waste 10,345 (1.8%)
(i) Domestic waste 6,391 (-1.1%)
(ii) Commercial waste 3,029 (8.1%)
(iii) Industrial waste 925 (3.8%)
b. Overall construction waste 4,422 (5.3%)
c. Special waste(2) 565 (-24.1%)
d.Total waste received at landfills(a+b+c)
15,332 (1.5%)
Notes: (1) Please refer to Appendix 1 for classification of solid waste. (2) The quantity does not include special waste not disposed of at landfills. From April 2015 onwards, dewatered
sludge from major sewage treatment works managed by Drainage Services Department has been treated by incineration at T▪PARK, and the residue and ash of incineration have been disposed of at the West New Territories Landfill (WENT).
(3) Figures in brackets refer to year-on-year (y-o-y) growth rates.
Monitoring of Solid Waste in Hong Kong - Waste Statistics for 2016
4

Plate 2.2 Disposal of total solid waste at landfills in 2015 and 2016 - By main waste category
Special waste (1)
743 tpd (5%)Overall construction waste 4,200 tpd (28%)
Municipal solid waste 10,159 tpd
(67%)
Overall construction waste 4,422tpd (29%)
Special waste (1)
565 tpd (4%)
Municipal solid waste 10,345 tpd
(67%)
Total disposal: 15,102 tpd Total disposal: 15,332 tpd
2015 2016 Note: (1) The quantity does not include special waste not disposed of at landfills. From April 2015 onwards, dewatered sludge from
major sewage treatment works managed by Drainage Services Department has been treated by incineration at T ▪ PARK, and the residue and ash of incineration have been disposed of at WENT.
Plate 2.3 Disposal of total solid waste at landfills from 2012 to 2016 - By main waste category
6,286 6,359 6,418 6,464 6,391
2,992 3,188 3,364 3,694 3,954
3,440 3,591 3,942 4,200 4,422 1,127 1,173 1,135 743 565
0
2,000
4,000
6,000
8,000
10,000
12,000
14,000
16,000
18,000
2012 2013 2014 2015 2016
Ton
nes
per
day
Year
Domestic waste Commercial & industrial waste Overall construction waste Special wasteMunicipal solid waste (1)
Total(tpd)
13,844 14,311 14,859 15,102 15,332y-o-y change
(% )2.9 3.4 3.8 1.6 1.5
Note: (1) The quantity does not include special waste not disposed of at landfills. From April 2015 onwards, dewatered sludge from
major sewage treatment works managed by Drainage Services Department has been treated by incineration at T ▪ PARK, and the residue and ash of incineration have been disposed of at WENT.
Monitoring of Solid Waste in Hong Kong - Waste Statistics for 2016
5

Plate 2.4 Waste management facilities in Hong Kong
WENT
SENT
NENT
CWTC
WKTS
KBTSNLTS
STTS
OITF
NWNTRTS
IETSIWTS
♦EcoPark
▲SLCP
▲AWCP
Guangdong Sheng
▼ORRC(2021)
▼ORRC(2018)
T·PARK
Landfill ●
▪
▲
♦▼
WENT - West New Territories Landfill SENT - South East New Territories Landfill (1)
NENT - North East New Territories Landfill RTS
IETS - Island East Transfer Station(2)
IWTS - Island West Transfer Station(2)
WKTS - West Kowloon Transfer Station(2)
OITF - Outlying Islands Transfer Facilities(2)
NLTS - North Lantau Transfer Station(2)
STTS - Sha Tin Transfer Station(3)
NWNTRTS - North West New Territories Refuse Transfer Station(4)
KBTS - Kowloon Bay Transfer Station(5)
CWTC CWTC - Chemical Waste Treatment Centre
Composting Plant AWCP - Animal Waste Composting Plant
SLCP - Shaling Composting Plant(6)
EcoPark EcoPark
ORRC ORRC - Organic Resources Recovery Centre (7)
Sludge Treatment Facility T ▪ PARK (8)
Notes:
(1) From 6 January 2016 onwards, SENT Landfill has been designated to accept only C&D waste. (2) Waste from IETS, IWTS, WKTS, OITF and NLTS was transferred to WENT by sea. (3) Waste from STTS was transferred to NENT by road. (4) Waste from NWNTRTS was transferred to WENT by road. (5) KBTS was closed in April 2005 and converted to a waste recycling centre. (6) SLCP has stopped operation since October 2010. (7) Phase 1 of the ORRC at Siu Ho Wan is scheduled for commissioning in the first half of 2018, whilst Phase 2 of
the ORRC at Shaling has commenced tendering in December 2016 with a view to commencing operation in 2021.(8) From April 2015 onwards, dewatered sludge from major sewage treatment works managed by Drainage Services
Department has been treated by incineration at T ▪ PARK, and the residue and ash of incineration have been disposed of at WENT.
Monitoring of Solid Waste in Hong Kong - Waste Statistics for 2016
6

Plate 2.5 Total solid waste received by RTSs and landfills in 2016 - By main waste category
Disposal facility - RTS
Average daily quantity (tpd)
MSW Overall
construction waste
Special waste(1)
Total
IETS - Island East Transfer Station 1,175 (30.9%) - - - - 1,175 (30.9%)
STTS - Sha Tin Transfer Station 1,369 (17.2%) - - - - 1,369 (17.2%)
IWTS - Island West Transfer Station 1,111 (29.3%) - - - - 1,111 (29.3%)
WKTS - West Kowloon Transfer Station 2,665 (12.2%) - - 371 (-9.7%) 3,036 (9.0%)
OITF - Outlying Islands Transfer Facilities 84 (2.2%) 45 (-16.2%) 5 (11.8%) 134 (-4.6%)
NLTS - North Lantau Transfer Station 635 (74.7%) - 1 (-24.1%) 635 (74.4%)
NWNTRTS - North West New Territories Refuse Transfer Station
1,165 (4.2%) - - - - 1,165 (4.2%)
Disposal facility - Landfill(2)
Average daily quantity (tpd)
MSW
Overall construction
waste
Special waste(1)
Total
WENT - West New Territories Landfill 7,405(2)
(20.0%) 1,020(2)
(6.7%) 389 (-15.3%) 8,814(2)
(16.2%)
SENT - South East New Territories Landfill(3)
- - 2,482 (-1.0%) - - 2,500(3)
(-39.0%)
NENT - North East New Territories Landfill
2,923(2)
(17.8%) 920 (25.2%) 176 (-13.1%) 4,019(2)
(17.5%)
Landfills’ total(3) 10,345 (1.8%) 4,422 (5.3%) 565 (-24.1%) 15,332 (1.5%)
Notes: (1) Please refer to Plate 2.13b for special waste not disposed of at landfills. From April 2015 onwards, dewatered sludge from major sewage
treatment works managed by Drainage Services Department has been treated by incineration at T ▪ PARK, and the residue and ash of incineration have been disposed of at WENT.
(2) Solid waste delivered to RTSs will be transferred to specified landfills after compression. The quantities include solid waste directly delivered to landfills and those transferred from RTSs to landfills.
(3) From 6 January 2016 onwards, SENT Landfill has been designated to accept only C&D waste. The total intake of solid waste of SENT in tonnes per day is computed based on the intake of overall construction waste in 2016 and the intakes of MSW and special waste from 1st to 5th January 2016.
(4) Figures in brackets refer to year-on-year (y-o-y) growth rates.
Monitoring of Solid Waste in Hong Kong - Waste Statistics for 2016
7

Plate 2.6 Arisings of solid waste disposed of at landfills in 2016 - By district by main waste category
District(4)
Average daily quantity(1) (2)(3) (tpd)
Domestic waste
(a)
Commercial & industrial
waste
(b)
Municipal solid waste
(c) =(a)+(b)
Overall construction
waste
(d) Central & Western 336 199 535 183 Eastern 442 162 604 89Southern 234 66 300 84Wanchai 237 104 341 102
Hong Kong Island Sub-total 1,249 530 1,779 459 Kowloon City 298 83 382 329Kwun Tong 470 246 716 360Sham Shui Po 382 92 473 91 Wong Tai Sin 249 93 342 45 Yau Tsim Mong 544 309 854 267
Kowloon Sub-total 1,944 824 2,767 1,092 Kwai Tsing 377 394 770 180North 296 268 564 91Sai Kung 326 89 415 1,190 Sha Tin 441 427 868 148Tai Po 304 143 446 77 Tsuen Wan 277 207 484 91 Tuen Mun 397 387 785 798Yuen Long 618 470 1,088 189
NT- Mainland Sub-total 3,036 2,384 5,420 2,764 Cheung Chau 25 - - -Hei Ling Chau 2 - - -Lamma Island 8 - - -Ma Wan 11 - - -Mui Wo 23 - - -North Lantau 87 - - -Peng Chau 6 - - -
NT-Outlying Islands Sub-total 163 216(5) 379(5) 108(5)
Total 6,391 3,954 10,345 4,422
Notes: (1) The geographical distribution of solid waste arisings is mainly estimated from waste intake records taken at waste treatment facilities and
should be regarded as indicative reference only. (2) Special waste is not included. (3) Statistics in this table are not directly comparable with those of previous years, as a revised estimation methodology has been adopted. (4) Districts under each main region are sorted in alphabetical order. (5) Breakdown into individual islands / areas is not available.
Monitoring of Solid Waste in Hong Kong - Waste Statistics for 2016
8

Plate 2.7 Per capita disposal rates of MSW, domestic waste and commercial & industrial waste from 2007 to 2016
1.331.30 1.29 1.30
1.271.30
1.33 1.351.39 1.41
0.920.87 0.86 0.87
0.840.88 0.89 0.89 0.89 0.87
0.41 0.42 0.42 0.42 0.43 0.420.44 0.47
0.510.54
0.00
0.20
0.40
0.60
0.80
1.00
1.20
1.40
1.60
2007 2008 2009 2010 2011 2012 2013 2014 2015 2016
kg/p
erso
n/da
y
Year
Municipal solid waste Domestic waste Commercial & Industrial waste
Note: (1) The per capita disposal rates are calculated based on the population data (mid-year) updated by the C&SD in August 2017.
Monitoring of Solid Waste in Hong Kong - Waste Statistics for 2016
9

Plate 2.8 Composition of MSW disposed of at landfills in 2016 - By waste type
Composition
Average daily quantity (tpd) and percentage shares by weight
Domestic waste
(a)
Commercialwaste
(b)
Industrial waste
(c)
Commercial & industrial waste
(d)=(b)+(c)
Municipal solid waste
(e)=(a)+(d) Glass 193
(3.0%)
98
(3.2%)
37
(4.0%)
136
(3.4%)
329
(3.2%) Metals 139
(2.2%)
73
(2.4%)
30
(3.2%)
103
(2.6%)
242
(2.3%)
Paper 1,358
(21.2%)
707
(23.3%)
179
(19.4%)
886
(22.4%)
2,244
(21.7%) Plastics 1,257
(19.7%)
650
(21.5%)
225
(24.3%)
875
(22.1%)
2,132
(20.6%)
Putrescibles 2,893
(45.3%)
1,235
(40.8%)
151
(16.3%)
1,386
(35.0%)
4,279
(41.4%) Textiles 230
(3.6%)
69
(2.3%)
44
(4.7%)
113
(2.9%)
343
(3.3%)
Wood/Rattan 84
(1.3%)
104
(3.4%)
138
(14.9%)
241
(6.1%)
325
(3.1%) Household hazardous wastes (HHWs)(1)
109
(1.7%)
32
(1.1%)
24
(2.6%)
56
(1.4%)
165
(1.6%) (2)Others 129
(2.0%)
60
(2.0%)
98
(10.6%)
159
(4.0%)
287
(2.8%)
Total 6,391
(100%)
3,029
(100%)
925
(100%)
3,954
(100%)
10,345
(100%)
Notes: (1) Household hazardous wastes (HHWs) include paints, pesticides, fuels, cylinders, batteries, electrical appliances, computer
products, mercury-containing fluorescent lamps and medicines, etc. (2) Others include bulky items directly disposed of at landfills and other miscellaneous waste materials. (3) Figures in brackets refer to percentage shares by weight.
Monitoring of Solid Waste in Hong Kong - Waste Statistics for 2016
10

Plate 2.9 Composition of MSW disposed of at landfills in 2016 – By major waste type
Composition
Average daily quantity (tpd) and percentage shares by weight
Domestic waste
(a)
Commercial & industrial waste
(b)
Municipal solid waste
(c) = (a) + (b)
Glass
- Glass bottles 157 (2.5%) 86 (2.2%) 243 (2.3%) - Other glass 37 (0.6%) 49 (1.2%) 86 (0.8%)
(Glass) Sub-total 193 (3.0%) 136 (3.4%) 329 (3.2%)
Metals
- Aluminium cans 18 (0.3%) 7 (0.2%) 25 (0.2%) - Ferrous metals 102 (1.6%) 79 (2.0%) 181 (1.7%) - Other non-ferrous metals 19 (0.3%) 17 (0.4%) 36 (0.4%)
(Metals) Sub-total 139 (2.2%) 103 (2.6%) 242 (2.3%)
Paper
- Cardboard 235 (3.7%) 283 (7.2%) 518 (5.0%) - Newsprint 313 (4.9%) 76 (1.9%) 389 (3.8%) - Office paper 76 (1.2%) 56 (1.4%) 132 (1.3%) - Tetrapak 44 (0.7%) 39 (1.0%) 83 (0.8%) - Others (1) 690 (10.8%) 431 (10.9%) 1,121 (10.8%)
(Paper) Sub-total 1,358 (21.2%) 886 (22.4%) 2,244 (21.7%)
Plastics
- Non-PET plastic bottles 52 (0.8%) 17 (0.4%) 69 (0.7%) - PET plastic bottles 79 (1.2%) 78 (2.0%) 158 (1.5%) - Plastic bags 443 (6.9%) 247 (6.3%) 690 (6.7%) - Plastic dining wares 83 (1.3%) 71 (1.8%) 154 (1.5%) - Polyfoam-dining wares 28 (0.4%) 11 (0.3%) 39 (0.4%) - Polyfoam-others 24 (0.4%) 28 (0.7%) 53 (0.5%) - Others (2) 548 (8.6%) 422 (10.7%) 970 (9.4%)
(Plastics) Sub-total 1,257 (19.7%) 875 (22.1%) 2,132 (20.6%)
Putrescibles
- Food waste 2,326 (36.4%) 1,274 (32.2%) 3,600 (34.8%) - Yard waste(3) 140 (2.2%) 37 (0.9%) 177 (1.7%) - Others(4) 427 (6.7%) 75 (1.9%) 502 (4.8%)
(Putrescibles) Sub-total 2,893 (45.3%) 1,386 (35.0%) 4,279 (41.4%)
Notes: (1) Other paper waste includes tissue paper, paper bags, etc. (2) Other plastics waste includes packaging materials, toys, off-cuts, scrap, etc. (3) Yard waste not disposed of at landfills is not included. For example, part of the yard waste collected by AFCD is treated in country
parks managed by the Department. (4) Other putrescibles waste includes cotton personal care products, other organic waste, etc. (5) Figures in brackets refer to percentage shares by weight.
Monitoring of Solid Waste in Hong Kong - Waste Statistics for 2016
11

Plate 2.10 Composition of MSW disposed of at landfills in percentages in 2015 and 2016 – By major waste type
Paper22%
Metals2%
Glass4%
Plastics21%
Food Waste 33%
Other Putrescibles
5%
Others12%
(1)Paper22%
Metals2%
Glass3%
Plastics21%
Food Waste 35%
Other Putrescibles
7%
Others11%
Total disposal: 10,159 tpd Total disposal: 10,345 tpd
2015 2016
(1)
Note: (1) Others include textiles, wood/rattan, household hazardous wastes, bulky items directly disposed of at landfills, and
miscellaneous waste materials.
Plate 2.11 Composition of municipal food waste disposed of at landfills in percentages in 2015 and 2016 - By waste category
Domestic food waste
2,326 tpd (65%)
Commercialfood waste 1,137 tpd
(32%)
Industrial food waste
138 tpd (4%)
Domestic food waste 2,397 tpd
(71%)
Commercial food waste
914 tpd (27%)
Industrial food waste
71 tpd (2%)
Municipal food waste disposal: 3,382 tpd (33% of MSW)
Municipal food waste disposal: 3,600 tpd (35% of MSW)
2015 2016
Monitoring of Solid Waste in Hong Kong - Waste Statistics for 2016
12

Plate 2.12 Disposal and reuse of overall construction waste in 2015 and 2016
Waste concrete disposed of at
landfills709 tpd (1%)
C&D waste disposed of at
landfills3,491 tpd (5%)
Public fill transferred to
projects for direct reuse
18,575 tpd (28%)
Public fill received at public fill reception
facilities (1)
43,800 tpd (66%)
Waste concrete disposed of at
landfills396 tpd (1%)
C&D waste disposed of at
landfills4,027 tpd (6%)
Public fill transferred to
projects for direct reuse
21,257 tpd (32%)
Public fill received at public fill reception
facilities (1)
41,117 tpd (62%)
Total generation: 66,575 tpd Total generation: 66,796 tpd
2015 2016
Note:
(1) Public fill reception facilities (PFRFs) are managed by CEDD for receiving inert construction waste (also known as public fill) appropriate for reuse. At present, four PFRFs are in operation, namely Tseung Kwan O Area 137 Fill Bank, Tuen Mun Area 38 Fill Bank, Chai Wan Public Fill Barging Point and Mui Wo Temporary Public Fill Reception Facility.
Monitoring of Solid Waste in Hong Kong - Waste Statistics for 2016
13
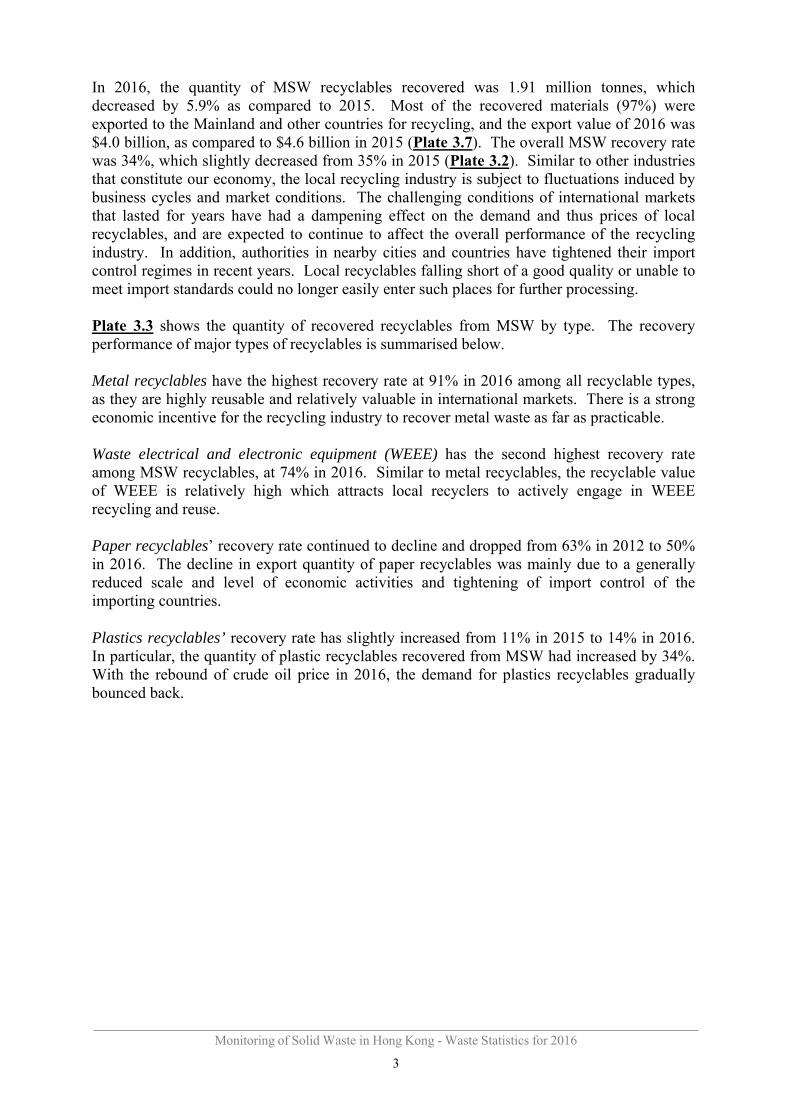
Plate 2.13a Disposal of special waste at landfills in 2016 - By special waste type
Special waste type Average daily quantity(1) (tpd)
Abattoir waste 9 (7.1%)
Animal carcasses and kennel waste 7 (-22.0%)
Asbestos waste 4 (40.9%)
Chemical waste other than asbestos waste 9 (106.1%)
Clinical waste (with package material) (2) 1 (5.9%)
Condemned goods 32 (-26.7%)
Dewatered dredged materials 4 (1,849.9%)
Dewatered sludges(3) 68 (-77.7%)
Dewatered waterworks sludge 58 (0.3%)
Incineration ash and stabilised residue 173 (25.2%)
Livestock waste(4) 63 (3.6%)
Sewage works screenings 65 (1.4%)
Waste tyres(5) 71 (45.5%) Disposal at Landfills Sub-total 565 (-24.1%)
Notes: (1) Some types of special waste may not arise and be disposed of daily throughout the whole year. The average daily quantity is
obtained by dividing the total amount of waste disposed of at landfills in the whole year by the number of days in the whole year. (2) Clinical waste is incinerated at CWTC except during normal maintenance or emergency shut-down maintenance of the incineration
treatment system for more than two days. During the shutdown, clinical waste is packed and transferred to designated landfill for disposal in accordance with the Clinical Waste Disposal License of CWTC.
(3) Dewatered sludges originate from sewage treatment works managed by the Drainage Services Department, wastewater treatment facilities and grease trap waste treatment facility at refuse transfer stations managed by the EPD, and private sewage treatment plants. Except that dewatered sludge from major sewage treatment works managed by Drainage Services Department is treated by incineration at T ▪ PARK, other dewatered sludges are disposed of at WENT and NENT Landfills.
(4) In 2016, the generation of livestock waste amounted to 160 tpd, out of which 63 tpd were disposed of at landfills. Livestock waste disposed of at landfills mainly include the livestock waste collected by the free collection service for solid livestock waste provided to local livestock farmers by the Government. The remaining livestock waste was treated by other environmentally-acceptable means such as on-site composting, aerobic treatment, and dry muck-out.
(5) Waste tyres are shredded or cut prior to disposal at landfills. (6) Figures in brackets refer to year-on-year (y-o-y) growth rates. It should be noted that special waste types with small tpd figures may
be subject to strong y-o-y fluctuations due to small base numbers.
Monitoring of Solid Waste in Hong Kong - Waste Statistics for 2016
14

Plate 2.13b Treatment of special waste in 2016 (Not disposed of at landfills) - By special waste type
Special waste type Treatment method Average daily quantity(1) (tpd)
Chemical waste other than asbestos waste CWTC 35 (11.1%)
Clinical waste CWTC 6 (5.5%)
Grease trap waste WKTS(2) 371 (-9.7%)
Horse stable waste AWCP 21 (5.5%)
Dredged mud and excavated materials Marine dumping(3) 53,552 (-27.6%)
Dewatered sewage sludge(4) Incineration at T ▪ PARK 1,144 (42.8%)
Furnace bottom ash Concrete manufacturing, stored in lagoon(5) 115 (6.5%)
Pulverised fuel ash Concrete manufacturing, stored
in lagoon(5) 1,236 (9.7%)
Monitoring of Solid Waste in Hong Kong - Waste Statistics for 2016
15
Notes: (1) Some types of special waste may not arise and be treated daily throughout the whole year. The average daily quantity is obtained
by dividing the total amount of waste treated outside landfills in the whole year by the number of days in the whole year. (2) The figure is the quantity of grease trap waste treated by the Grease Trap Waste Treatment Facility at WKTS. (3) The density of the dredged mud and excavated materials is assumed to be one tonne per cubic metre. (4) Dewatered sewage sludge from major sewage treatment works managed by Drainage Services Department has been treated by
incineration at T ▪ PARK from April 2015 onwards. (5) Furnace bottom ash and pulverised fuel ash are wastes resulting from coal-fired electricity generation. Their figures are
provided by the Power Companies. (6) Figures in brackets refer to year-on-year (y-o-y) growth rates. It should be noted that special waste types with small tpd figures
may be subject to strong y-o-y fluctuations due to small base numbers.

Plate 2.14 Composition of MSW disposed of at landfills in percentages from 2012 to 2016 – By major waste type
36% 38% 37%33% 35%
6%6% 5%
5%7%
21% 19% 20%22%
22%
20% 20% 21% 21%21%
3% 4% 3% 4% 3%3% 2% 2% 2% 2%
11% 11% 12% 12% 11%
0%
10%
20%
30%
40%
50%
60%
70%
80%
90%
100%
2012 2013 2014 2015 2016
Per
cent
age
Year
Food Waste Other Putrescibles Paper Plastics Glass Metals Others(1)
Total(tpd) 9,278 9,547 9,782 10,159 10,345
y-o-y change(%) 3.1 2.9 2.5 3.9 1.8
Note: (1) Others include textiles, wood/rattan, household hazardous wastes, bulky items directly disposed of at landfills, and
miscellaneous waste materials.
Monitoring of Solid Waste in Hong Kong - Waste Statistics for 2016
16

Plate 2.15 Composition of MSW disposed of at landfills in quantities from 2012 to 2016 – By major waste type
3,337 3,648 3,640 3,382 3,600
528 541 516
535 678
1,905 1,823 1,922 2,257
2,244
1,826 1,866 2,015 2,183
2,132 289 353 285
367 329
239 177 209
236 242
1,154 1,138
1,194 1,197
1,120
0
1,000
2,000
3,000
4,000
5,000
6,000
7,000
8,000
9,000
10,000
2012 2013 2014 2015 2016
Ton
nes
per
day
Year
Food Waste Other Putrescibles Paper Plastics Glass Metals Others(1)
Total(tpd) 9,278 9,547 9,782 10,159 10,345
y-o-y change(%) 3.1 2.9 2.5 3.9 1.8
Note: (1) Others include textiles, wood/rattan, household hazardous wastes, bulky items directly disposed of at landfills and
miscellaneous waste materials.
Monitoring of Solid Waste in Hong Kong - Waste Statistics for 2016
17

Plate 2.16 Disposal and reuse of overall construction waste from 2012 to 2016
35,054(52%)
35,420(54%)
34,400(60%)
43,800(66%) 41,117
(62%)
28,634(43%)
26,959(41%)
19,205(33%)
18,575(28%) 21,257
(32%)
2,720(4%) 2,869
(4%)
3,167(6%)
3,491(5%)
4,027(6%)
719(1%) 722
(1%)
775(1%)
709(1%)
396(1%)
0
10,000
20,000
30,000
40,000
50,000
60,000
70,000
2012 2013 2014 2015 2016
Ton
nes
per
day
Year
Waste concrete disposed of at landfillsC&D waste disposed of at landfillsPublic fill transferred to projects for direct reusePublic fill received at public fill reception facilities
(1)
Total(tpd) 67,127 65,971 57,547 66,575 66,796
y-o-y change (%) 30.5 -1.7 -12.8 15.7 0.3
Notes: (1) Public fill reception facilities (PFRFs) are managed by CEDD for receiving inert construction waste (also known as public
fill) appropriate for reuse. At present, four PFRFs are in operation, namely Tseung Kwan O Area 137 Fill Bank, Tuen Mun Area 38 Fill Bank, Chai Wan Public Fill Barging Point and Mui Wo Temporary Public Fill Reception Facility.
(2) Figures in brackets refer to percentage shares by weight.
Monitoring of Solid Waste in Hong Kong - Waste Statistics for 2016
18

Plate 2.17 Overall construction waste received by treatment facilities from 2012 to 2016
90% 89% 89% 90% 89%
3% 3% 4% 4% 5%5% 5% 5% 5% 6%2% 2% 2% 1% 1%
0%
10%
20%
30%
40%
50%
60%
70%
80%
90%
100%
2012 2013 2014 2015 2016
Per
cent
sha
re
Year
Waste concrete received by landfillsC&D waste directly received by landfillsC&D materials received by sorting facilitiesPublic fill directly received by public fill reception facilities
(3)
(2)
Public fillreception facilities(tpd)
34,529 34,867 33,947 43,211 40,395
Sorting facilities(tpd)
1,197 1,361 1,591 1,863 2,191
Landfills(tpd)
2,764 2,759 2,811 2,917 2,940
Waste concrete(tpd)
719 722 775 709 396
C&D waste(tpd) 2,044 2,037 2,037 2,208 2,544
Notes: (1) Under the Construction Waste Disposal Charging Scheme, 71 dollars is charged per tonne of public fill disposed of at
public fill reception facilities, 175 dollars per tonne of construction waste at sorting facilities and 200 dollars per tonne of construction waste at landfills.
(2) C&D waste directly received by landfills excludes C&D waste from sorting facilities, but includes a small quantity of C&D waste from OITF.
(3) After sorting, inert material will be transferred from sorting facilities to public fill banks, and non-inert construction and demolition waste (C&D waste) to landfills.
Monitoring of Solid Waste in Hong Kong - Waste Statistics for 2016
19

3. Resource Recovery and Recycling
Plate 3.1 Generation, disposal and recovery of MSW in 2015 and 2016
Total generation(1): 5.74 million tonnes Total generation(1): 5.70 million tonnes
2015 2016
Disposed of at landfills 3.71 million tonnes (65%)
Recovered 2.03 million tonnes (2) (35%)
Recovered 1.91 million tonnes (3)
(34%) Disposed of at landfills 3.79 million tonnes (66%)
Notes: (1) Generation of MSW is the sum of MSW disposed of at landfills and MSW recovered for recycling. (2) A total of 2.03 million tonnes of recyclables were recovered for recycling in 2015, of which, 1.99 million tonnes (98%)
were exported for recycling and 0.05 million tonnes (2%) recycled locally. (3) A total of 1.91 million tonnes of recyclables were recovered for recycling in 2016, of which, 1.86 million tonnes (97%)
were exported for recycling and 0.06 million tonnes (3%) recycled locally.
Plate 3.2 Recovery rates of MSW, domestic waste, and commercial and industrial waste from 2012 to 2016
39% 37% 37% 35% 34%
28%24% 26% 25% 24%
53% 52% 50% 48%45%
0%
20%
40%
60%
80%
2012 2013 2014 2015 2016
Rec
over
y R
ate
(%)
Year
MSW Domestic waste Commercial & industrial waste
Monitoring of Solid Waste in Hong Kong - Waste Statistics for 2016
20

Plate 3.3 Recyclables recovered from MSW in 2016 - By type of recyclable
Recyclable type
Quantity of recovered recyclables (thousand tonnes)
Exported for recycling
(a)
Recycled locally
(b)
Total recovered for recycling
(c) = (a) + (b)
Paper 805.7 (43.4%) 0.0 (0.0%) 805.7 (42.1%) Plastics 118.7 (6.4%) 7.2 (12.9%) 125.9 (6.6%) Ferrous metals 807.9 (43.5%) 0.2 (0.3%) 808.1 (42.3%) Non-ferrous metals 71.5 (3.9%) 0.1 (0.1%) 71.6 (3.7%) Glass(1) 0.1 (0.0%) 9.2 (16.4%) 9.3 (0.5%) Rubber tyres(2) 0.0 (0.0%) 12.5 (22.3%) 12.5 (0.7%) Textiles 0.3 (0.0%) 3.9 (6.9%) 4.2 (0.2%) Wood 1.0 (0.1%) 2.9 (5.2%) 3.9 (0.2%) Food waste(3) 0.0 (0.0%) 15.6 (27.8%) 15.6 (0.8%) Electrical and electronic equipment(4) 51.0 (2.7%) 4.4 (7.9%) 55.4 (2.9%)
Total 1,856.4 (100.0%) 55.9 (100.0%) 1,912.3 (100.0%)
Notes: (1) Glass beverage bottles recovered for reuse through deposit-and-refund system operated by local beverage manufacturers are
not included. (2) The quantity includes reuse, retreading and recycling of vehicle tyres and retreading of aircraft tyres in Hong Kong. (3) The quantity of food waste recycled locally includes those recycled by industrial operators, those recycled at OITF, and those
recycled at EPD’s composting facilities at Kowloon Bay. (4) The volume of waste electrical and electronic equipment recovered for recycling is compiled from results of a biennial survey
on “Generation & Disposal Practice of Used/ End-of-Life Electrical & Electronic Equipment and Batteries in Hong Kong” commissioned by EPD.
(5) Figures less than 50 tonnes are shown as 0.0. (6) Figures in brackets refer to percentage shares.
Plate 3.4 Recyclables recovered from MSW in percentages in 2015 and 2016 - By type of recyclable
Ferrous Metals42%
Non-Ferrous Metals
4%Paper42%
Plastics7%
Others5%
(1)
Ferrous Metals42%
Non-Ferrous Metals
4%Paper44%
Plastics5%
Others5%
(1)
Total resource recovery: 2.03 million tonnes Total resource recovery: 1.91 million tonnes
2015 2016
Note: (1) Others include glass, wood, rubber tyres, textiles, food waste and electrical and electronic equipment.
Monitoring of Solid Waste in Hong Kong - Waste Statistics for 2016
21

Plate 3.5 Total quantities and export values of recyclable materials recovered from MSW from 2012 to 2016
7.0
6.06.0
5.5
5.05.0 4.6
4.04.0
3.0
2.16 2.01 2.05 2.03 1.912.0
1.0
0.02012 2013 2014 2015 2016
Year
Value of exported recyclable materials ($ billion) Total quantity of recovered recyclables (million tonnes)
Plate 3.6 Values of exported recyclable materials recovered from MSW in percentages in 2015 and 2016 - By major type of recyclable material
Ferrous metals38%
Non-ferrous metals30%
Paper27%
Plastics5%
Others0.1%
(1)
Ferrous metals36%
Non-ferrous metals30%
Paper29%
Plastics5%
Others0.1%
(1)
Total value: HK$4.6 billion Total value: HK$4.0 billion
2015 2016
Note: (1) Others include glass, wood, textiles and rubber tyres only.
Monitoring of Solid Waste in Hong Kong - Waste Statistics for 2016
22

Plate 3.7 Quantities and values of exported recyclable materials recovered from MSW in 2016 - By major type of recyclable material
Recyclable type Quantity
(tonnes)
Value
($ thousand)
Value per unit
($ / tonne)
a. Ferrous metals
- Alloy steel scrap 14,280 (1.8%) 121,764 (8.5%) 8,527
- Pig or cast iron 0 (0.0%) 0 (0.0%) -
- Tinplate 0 (0.0%) 0 (0.0%) -
- Other scraps 793,605 (98.2%) 1,304,848 (91.5%) 1,644
(Ferrous metals) Sub-total 807,885 (100.0%) 1,426,612 (100.0%) 1,766
b. Non-ferrous metals
- Aluminium 49,874 (69.7%) 319,990 (27.3%) 6,416
- Copper & alloys 16,675 (23.3%) 489,014 (41.7%) 29,326
- Lead 601 (0.8%) 4,669 (0.4%) 7,767
- Metal ash & residues 0 (0.0%) 0 (0.0%) -
- Nickel 99 (0.1%) 996 (0.1%) 10,110
- Precious metal 4,280 (6.0%) 358,150 (30.5%) 83,688
- Tin 0 (0.0%) 0 (0.0%) -
- Zinc 0 (0.0%) 0 (0.0%) -
(Non-ferrous metals) Sub-total 71,529 (100.0%) 1,172,820 (100.0%) 16,396
c. Plastics- Polyethylene (PE) 33,194 (28.0%) 52,432 (25.8%) 1,580 - Polyethylene terephthalate (PET) 5,365 (4.5%) 19,070 (9.4%) 3,554 - Polypropylene (PP) 180 (0.2%) 281 (0.1%) 1,560 - Polystyrene & copolymers (PS) 36,964 (31.1%) 57,973 (28.5%) 1,568 - Polyvinyl chloride (PVC) 21,040 (17.7%) 33,096 (16.3%) 1,573
- Others(1) 21,964 (18.5%) 40,241 (19.8%) 1,832
(Plastics) Sub-total 118,706 (100.0%) 203,093 (100.0%) 1,711
d. Textiles
- Cotton 0.2 (0.1%) 6 (0.2%) 30,000
- Man-made fibres 0 (0.0%) 0 (0.0%) -
- Old clothing & other textile articles, rags, etc.
345 (99.9%) 3,590 (99.8%) 10,396
(Textiles) Sub-total 346 (100.0%) 3,596 (100.0%) 10,408
e. Wood & paper
- Paper 805,718 (99.9%) 1,142,663 (99.9%) 1,418
- Wood (include sawdust) 1,042 (0.1%) 1,487 (0.1%) 1,428
(Wood & paper) Sub-total 806,760 (100.0%) 1,144,151 (100.0%) 1,418
f. Glass
(Glass) Sub-total 148 (100.0%) 177 (100.0%) 1,195
g. Electrical and electronic equipment
(Electrical and electronic equipment) Sub-total
50,984 (100.0%) N/A N/A
Notes: (1) Other recyclable plastics include waste, parings and scrap not elsewhere classified. (2) Figures in brackets refer to percentage shares.
Monitoring of Solid Waste in Hong Kong - Waste Statistics for 2016
23

Plate 3.8 Generation, disposal and recovery of MSW from 2012 to 2016
3.40(61%)
3.48(63%)
3.57(63%)
3.71(65%)
3.79(66%)
2.16(39%)
2.01(37%)
2.05(37%)
2.03(35%)
1.91(34%)
0.00
1.00
2.00
3.00
4.00
5.00
6.00
7.00
2012 2013 2014 2015 2016
Mill
ion
tonn
es
Year
MSW landfilled quantity MSW recovered quantity
Total(million tonnes) 5.56 5.49 5.62 5.74 5.70
y-o-y change(%) (-11.8%) (-1.2%) (2.4%) (2.1%) (-0.7%)
Note: (1) Generation of MSW is the sum of MSW disposed of at landfills and MSW recovered for recycling.
Monitoring of Solid Waste in Hong Kong - Waste Statistics for 2016
24

Plate 3.9 Recyclables recovered from MSW in percentages from 2012 to 2016 - By major type of recyclable
23%26%
41% 42% 42%4%
4%
4%4% 4%
54%52%
46% 44%42%
15% 12%
5% 5%7%
5% 6% 4% 5% 5%
0%
10%
20%
30%
40%
50%
60%
70%
80%
90%
100%
2012 2013 2014 2015 2016
Per
cent
age
Year
Ferrous Metals Non-Ferrous Metals Paper Plastics Others (1)
Total(million tonnes) 2.16 2.01 2.05 2.03 1.91
y-o-y change(%) (-28.4%) (-7.1%) (2.2%) (-1.0%) (-5.9%)
Note: (1) Others include glass, wood, rubber tyres, textiles, food waste, and electrical and electronic equipment.
Monitoring of Solid Waste in Hong Kong - Waste Statistics for 2016
25

Plate 3.10 Recyclables recovered from MSW in quantities from 2012 to 2016 - By major type of recyclable
500 523
845 864 808
78 79
76 84 72
1,162 1,035
948 896
806
317
243
99 94
126
106
130 86 95
101
0
500
1,000
1,500
2,000
2,500
2012 2013 2014 2015 2016
Qua
ntit
y (t
hous
and
tonn
es)
Year
Ferrous metals Non-ferrous metals Paper Plastics Others (1)
Total(million tonnes) 2.16 2.01 2.05 2.03 1.91
y-o-y change(%)
(-28.4%) (-7.1%) (2.2%) (-1.0%) (-5.9%)
Note: (1) Others include glass, wood, rubber tyres, textiles, food waste, and electrical and electronic equipment.
Monitoring of Solid Waste in Hong Kong - Waste Statistics for 2016
26

Plate 3.11 Values of exported recyclable materials recovered from MSW in percentages from 2012 to 2016
– By major type of recyclable material
26% 28%
41% 38% 36%
30%
34%
32%30%
30%
32%
31%
25%27% 29%
12%6%
3% 5% 5%0.4% 0.3% 0.2% 0.1% 0.1%
0%
10%
20%
30%
40%
50%
60%
70%
80%
90%
100%
2012 2013 2014 2015 2016
Per
cent
age
Year
Ferrous metals Non-ferrous metals Paper Plastics Others(1)
Total(HK$ billion) 6.0 5.0 5.5 4.6 4.0y-o-y change
(%) (-26.9%) (-16.7%) (10.2%) (-17.6%) (-13.2%)
Note: (1) Others include glass, wood, textiles and rubber tyres only.
Monitoring of Solid Waste in Hong Kong - Waste Statistics for 2016
27

Plate 3.12 Values of exported recyclable materials recovered from MSW from 2012 to 2016 - By major type of recyclable material
1.6 1.4
2.21.8
1.4
1.81.7
1.8
1.3
1.2
1.9
1.6
1.4
1.2
1.1
0.7
0.3
0.1
0.2
0.2
0.03
0.02
0.01
0.00
0.01
0.0
1.0
2.0
3.0
4.0
5.0
6.0
7.0
2012 2013 2014 2015 2016
HK
$ bi
llio
n
Year
Ferrous metals Non-ferrous metals Paper Plastics Others(1)
Total(HK$ billion) 6.0 5.0 5.5 4.6 4.0y-o-y change
(%) (-26.9%) (-16.7%) (10.2%) (-17.6%) (-13.2%)
Notes: (1) Others include glass, wood, textiles and rubber tyres only. (2) Values less than HK$5 million are shown as 0.00.
Monitoring of Solid Waste in Hong Kong - Waste Statistics for 2016
28

Appendix 1: Classification of Solid Waste and Monitoring Methodology
Waste Classification and Terminology
Solid waste is classified into three main categories by making reference to the sources of waste and the institutional arrangements for waste collection and disposal. These three m a i n categories of solid waste are municipal solid waste, overall construction waste and special waste. The detailed interpretations of some commonly used terms are described below.
Municipal solid waste includes three categories: domestic waste, commercial waste and industrial waste.
Domestic waste refers to household waste, waste generated from daily activities ininstitutional premises (e.g. schools, government offices) and refuse collected from publiccleansing services. Public cleansing waste includes dirt and litter collected by the Foodand Environmental Hygiene Department, marine refuse collected by the MarineDepartment and waste from country parks collected by the Agriculture, Fisheries andConservation Department.
Commercial waste is waste arising from commercial activities taking place in shops,restaurants, hotels, offices, markets in private housing estates, etc. It is collected mainlyby private waste collectors.
Industrial waste is waste arising from industrial activities and does not includeconstruction waste and chemical waste. It is usually collected by private waste collectors.However, some industries may deliver their industrial waste directly to landfills fordisposal.
Municipal solid waste contains a small portion of bulky items like furniture and domesticappliances which cannot be handled by conventional compactor type refuse collectionvehicles. These items are regarded as bulky waste and are usually collected separately.
Overall construction waste includes waste or surplus materials arising from construction activities such as site clearance, refurbishment, renovation, demolition, land excavation and road works. It also includes waste concrete that is generated from concrete batching plants, cement plaster/mortar plants not set up inside construction sites. The overall construction waste is sorted into inert materials (called public fill) and construction and demolition (C&D) waste (basically non-inert waste), where inert materials like debris, rubble, concrete and earth are reused in construction sites, or as fill in reclamation sites when available. C&D waste are disposed of at landfills.
Special waste is waste that requires special disposal arrangement. It includes abattoir waste, animal carcasses, asbestos, chemical waste, clinical waste, condemned goods, CWTC stabilized residue and incineration ash, dredged mud and excavated materials, sewage treatment and water treatment sludge, T ▪ PARK incineration ash and residue, grease trap waste, livestock waste, sewage works screenings, waste tyres, furnace bottom ash, pulverised fuel ash, etc.
Monitoring of Solid Waste in Hong Kong - Waste Statistics for 2016
29

Chemical waste is defined in the Waste Disposal (Chemical Waste) (General) Regulationunder the Waste Disposal Ordinance (Cap. 354). Chemical waste can be any substancearising from any process or trade activity which contains chemical in such form, quantityor concentration that can cause pollution to the environment or become a risk to health.
Current classification of solid waste
Solid Waste
Municipal Solid Waste
Domestic waste
- Household - Institutional
(e.g. schools, government offices, FEHD public markets, etc.)
- Public cleansing
Commercial waste
- Shops, restaurants, offices, hotels, non- FEHD markets, etc.
Industrial waste
- Industrial activities
Overall Construction
Waste
- Construction activities such as demolition, excavation, renovation works, road works, site clearance, etc.
- Concrete batching plants, etc.
Special Waste
- Abattoir waste - Animal carcasses - Asbestos - Chemical waste - Clinical waste - Condemned goods - CWTC stabilized residue
and incineration ash - Dredged mud and
excavated materials - Sewage treatment and
water treatment sludge - T ▪ PARK incineration
ash and residue - Grease trap waste - Livestock waste - Sewage works screenings - Waste tyres - Furnace bottom ash - Pulverised fuel ash, etc.
Monitoring Methodology
Solid waste data are mainly collected from the following sources:
Waste intake records taken at waste management facilities; Results of annual survey on waste composition conducted at landfills and RTSs; Results of waste recovery survey conducted on the local recycling industry; Statistics provided by relevant groups of EPD; and Statistics provided by other departments including FEHD, CEDD and C&SD.
Monitoring of Solid Waste in Hong Kong - Waste Statistics for 2016
30

Appendix 2: Terminology of Waste Management System
Under the statistical framework of solid waste, waste is an unwanted material or product which has been consumed, or is unsuitable for consumption as perceived by the generator. The interpretations of common terminology of Hong Kong’s Waste Management System are detailed below1.
Waste management system (WMS) of Hong Kong comprises the public sector, private recyclers, and green groups in Hong Kong which engage in treatment of wastes or recyclables.
Waste disposal is locally generated waste that are disposed of at strategic landfills managed by EPD.
Resource recovery refers to recycling, reuse, or composting of locally recovered recyclables in Hong Kong or other jurisdictions/countries. Resource recovery activities divert wastes from local landfills for further uses.
Waste generation is waste locally generated in Hong Kong and passes through the WMS. The generation quantity of waste equals the sum of quantities of waste disposal and resource recovery.
Waste avoidance refers to the reduction in the quantity of waste entering the WMS, as a result of preventing the creation of waste at source or treatment of waste outside of the WMS. For example, wastes directly recycled or reused at the place of generation (e.g. on-site composting) or exchange of unprocessed second-hand products are regarded as waste avoidance. Waste avoidance falls outside of the scope of WMS, and is not measured in waste statistics in this report.
Waste recovery rate is calculated as the proportion of resource recovery in waste generation.
Per capita waste disposal rate is the quantity of waste disposed of at landfills on a daily basis by an average person of the Hong Kong population.
1 The terminology applies to municipal solid waste (MSW) and overall construction waste only.
Monitoring of Solid Waste in Hong Kong - Waste Statistics for 2016
31