MONITORING OF RADON AND AIR IONIZATION IN A SEISMIC … · romanian reports in physics 69, 709...
14
Romanian Reports in Physics 69, 709 (2017) MONITORING OF RADON AND AIR IONIZATION IN A SEISMIC AREA VICTORIN-EMILIAN TOADER 1 , IREN-ADELINA MOLDOVAN 1 , ALEXANDRU MARMUREANU 1 , PUSHAN KR DUTTA 2 , RALUCA PARTHENIU 1 , EDUARD NASTASE 1 1 National Institute for Earth Physics, P.O.Box MG-2, RO 077125, Magurele, Romania, E-mails: [email protected]; [email protected]; [email protected] 2 Erasmus Post-Doctoral, Mechatronics University of Oradea, E-mails: [email protected]; [email protected]; [email protected] Received September 10, 2016 Abstract. Our multidisciplinary network (AeroSolSys) located in Vrancea (Curvature Carpathian Mountains) includes radon concentration monitoring in five stations. We focus on lithosphere and near surface low atmosphere phenomena using real-time information about seismicity, + / – ions, clouds, solar radiation, temperature (air, ground), humidity, atmospheric pressure, wind speed and direction, telluric currents, variations of the local magnetic field, infrasound, variations of the atmospheric electrostatic field, variations in the earth crust with inclinometers, electromagnetic activity, CO 2 concentration, ULF radio wave propagation, seismo- acoustic emission, animal behavior. The main purpose is to inform the authorities about risk situation and update hazard scenarios. The radon concentration monitoring is continuously with 1 hour or 3 hours sample rate in locations near to faults in an active seismic zone characterized by intermediate depth earthquakes. Trigger algorithms include standard deviation, mean and derivative methods. We correlate radon concentration measurements with humidity, temperature and atmospheric pressure from the same equipment. In few stations we have meteorological information, too. Sometime the radon concentration has very high variations (maxim 4 535 Bq/m 3 from 106 Bq/m 3 ) in short time (1–2 days) without being accompanied by an important earthquake. Generally the cause is the high humidity that could be generated by tectonic stress. Correlation with seismicity needs information from minimum 6 month in our case. For 10 605 hours, 618 earthquakes with maxim magnitude 4.9 R, we have got radon average 38 Bq/m 3 and exposure 408 111 Bqh/m 3 in one station. In two cases we have correlation between seismicity and radon concentration. In other one we recorded high variation because the location was in an area with multiple faults and a river. Radon can be a seismic precursor but only in a multidisciplinary network. A pair of ions counters (positive and negative) work together in few stations. The anomalies for short or long period of time should be correlated with local environment factors (e.g. humidity). Key words: radon anomalies, multidisciplinary monitoring, precursor phenomena, air ionization monitoring, radon monitoring, earthquake cumulative energy, cross-correlation.
Transcript of MONITORING OF RADON AND AIR IONIZATION IN A SEISMIC … · romanian reports in physics 69, 709...

Romanian Reports in Physics 69, 709 (2017)
MONITORING OF RADON AND AIR IONIZATION
IN A SEISMIC AREA
VICTORIN-EMILIAN TOADER1, IREN-ADELINA MOLDOVAN1, ALEXANDRU
MARMUREANU1, PUSHAN KR DUTTA2, RALUCA PARTHENIU 1, EDUARD NASTASE1
1 National Institute for Earth Physics, P.O.Box MG-2, RO 077125, Magurele, Romania,
E-mails: [email protected]; [email protected]; [email protected] 2 Erasmus Post-Doctoral, Mechatronics University of Oradea,
E-mails: [email protected]; [email protected]; [email protected]
Received September 10, 2016
Abstract. Our multidisciplinary network (AeroSolSys) located in Vrancea
(Curvature Carpathian Mountains) includes radon concentration monitoring in five
stations. We focus on lithosphere and near surface low atmosphere phenomena using
real-time information about seismicity, + / – ions, clouds, solar radiation, temperature
(air, ground), humidity, atmospheric pressure, wind speed and direction, telluric
currents, variations of the local magnetic field, infrasound, variations of the
atmospheric electrostatic field, variations in the earth crust with inclinometers,
electromagnetic activity, CO2 concentration, ULF radio wave propagation, seismo-
acoustic emission, animal behavior. The main purpose is to inform the authorities
about risk situation and update hazard scenarios. The radon concentration monitoring
is continuously with 1 hour or 3 hours sample rate in locations near to faults in an
active seismic zone characterized by intermediate depth earthquakes. Trigger
algorithms include standard deviation, mean and derivative methods. We correlate
radon concentration measurements with humidity, temperature and atmospheric
pressure from the same equipment. In few stations we have meteorological
information, too. Sometime the radon concentration has very high variations (maxim
4 535 Bq/m3 from 106 Bq/m3) in short time (1–2 days) without being accompanied by
an important earthquake. Generally the cause is the high humidity that could be
generated by tectonic stress. Correlation with seismicity needs information from
minimum 6 month in our case. For 10 605 hours, 618 earthquakes with maxim
magnitude 4.9 R, we have got radon average 38 Bq/m3 and exposure 408 111 Bqh/m3
in one station. In two cases we have correlation between seismicity and radon
concentration. In other one we recorded high variation because the location was in an
area with multiple faults and a river. Radon can be a seismic precursor but only in a
multidisciplinary network. A pair of ions counters (positive and negative) work
together in few stations. The anomalies for short or long period of time should be
correlated with local environment factors (e.g. humidity).
Key words: radon anomalies, multidisciplinary monitoring, precursor phenomena,
air ionization monitoring, radon monitoring, earthquake cumulative
energy, cross-correlation.
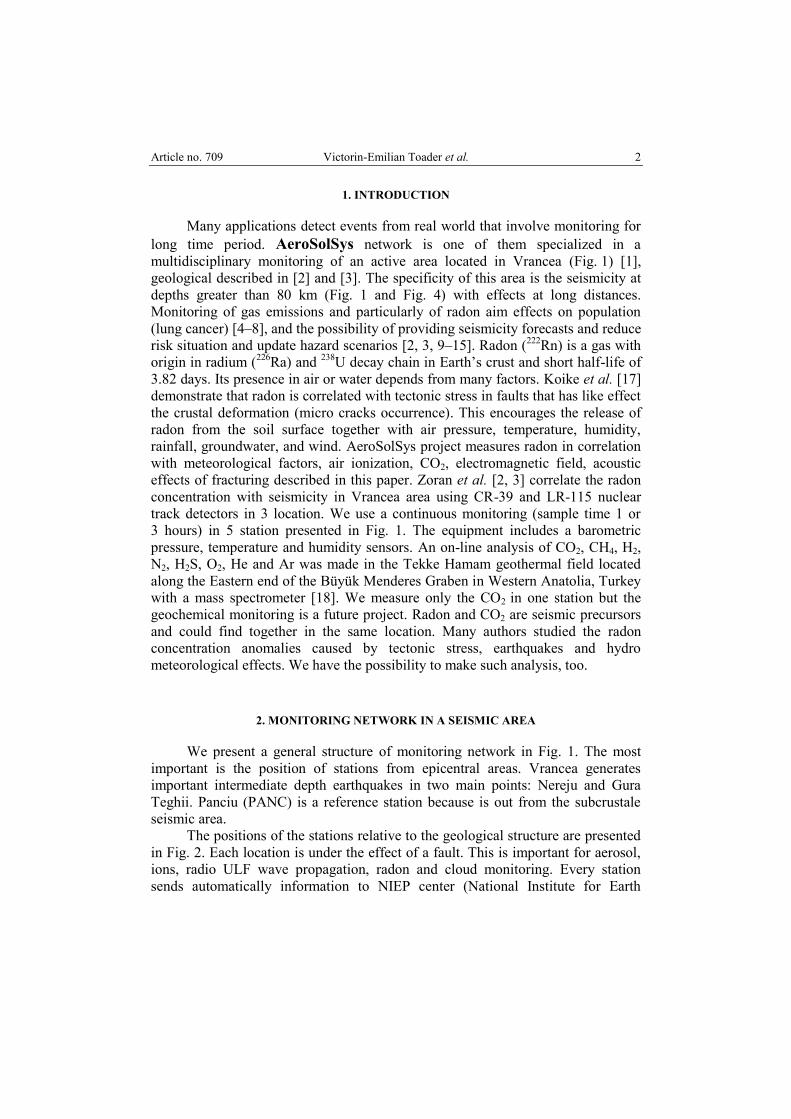
Article no. 709 Victorin-Emilian Toader et al. 2
1. INTRODUCTION
Many applications detect events from real world that involve monitoring for
long time period. AeroSolSys network is one of them specialized in a
multidisciplinary monitoring of an active area located in Vrancea (Fig. 1) [1],
geological described in [2] and [3]. The specificity of this area is the seismicity at
depths greater than 80 km (Fig. 1 and Fig. 4) with effects at long distances.
Monitoring of gas emissions and particularly of radon aim effects on population
(lung cancer) [4–8], and the possibility of providing seismicity forecasts and reduce
risk situation and update hazard scenarios [2, 3, 9–15]. Radon (222
Rn) is a gas with
origin in radium (226
Ra) and 238
U decay chain in Earth’s crust and short half-life of
3.82 days. Its presence in air or water depends from many factors. Koike et al. [17]
demonstrate that radon is correlated with tectonic stress in faults that has like effect
the crustal deformation (micro cracks occurrence). This encourages the release of
radon from the soil surface together with air pressure, temperature, humidity,
rainfall, groundwater, and wind. AeroSolSys project measures radon in correlation
with meteorological factors, air ionization, CO2, electromagnetic field, acoustic
effects of fracturing described in this paper. Zoran et al. [2, 3] correlate the radon
concentration with seismicity in Vrancea area using CR-39 and LR-115 nuclear
track detectors in 3 location. We use a continuous monitoring (sample time 1 or
3 hours) in 5 station presented in Fig. 1. The equipment includes a barometric
pressure, temperature and humidity sensors. An on-line analysis of CO2, CH4, H2,
N2, H2S, O2, He and Ar was made in the Tekke Hamam geothermal field located
along the Eastern end of the Büyük Menderes Graben in Western Anatolia, Turkey
with a mass spectrometer [18]. We measure only the CO2 in one station but the
geochemical monitoring is a future project. Radon and CO2 are seismic precursors
and could find together in the same location. Many authors studied the radon
concentration anomalies caused by tectonic stress, earthquakes and hydro
meteorological effects. We have the possibility to make such analysis, too.
2. MONITORING NETWORK IN A SEISMIC AREA
We present a general structure of monitoring network in Fig. 1. The most
important is the position of stations from epicentral areas. Vrancea generates
important intermediate depth earthquakes in two main points: Nereju and Gura
Teghii. Panciu (PANC) is a reference station because is out from the subcrustale
seismic area.
The positions of the stations relative to the geological structure are presented
in Fig. 2. Each location is under the effect of a fault. This is important for aerosol,
ions, radio ULF wave propagation, radon and cloud monitoring. Every station
sends automatically information to NIEP center (National Institute for Earth

3 Monitoring of radon and air ionization in a seismic area Article no. 709
Physics from Romania) where a server saves, displays and makes a power
spectrum analysis in real time.
Fig. 1 – Multidisciplinary monitoring network in Vrancea area, Romania seismicity.
Fig. 2 – Monitoring network, main faults
(map by C. Dinu, V. Raileanu et al. CEEX 647/2005).

Article no. 709 Victorin-Emilian Toader et al. 4
We made a geological investigation for every station (Fig. 3). The
particularity of Vrancea area is presented in Fig. 4.
Fig. 3 – Electrical tomography, Plostina site.
Fig. 4 – Vrancea hypocenter distribution.
Comparing Figs. 2 and 4 is not obvious a relationship between the
distribution of epicenters and faults at a depth of more than 80 km. Each station
position is on a fault but what we measure is an indirect effect of an activity at high
depth. Radon monitoring is indoor in air near the ground. In this case atmospheric
air currents can introduce errors. We use meteorological station to correct these
effects.

5 Monitoring of radon and air ionization in a seismic area Article no. 709
The equipment in each station is presented in Table 1. Every site has seismic
equipment.
Table 1
Configuration of monitoring stations
Station Location Equipment
BISR Bisoca Seismic speed-acceleration, acoustic, radio ULF, inclinometer, radon,
air temperature, pressure and humidity
LOPR Lopatari Acoustic, inclinometer, radon, air temperature, pressure and humidity
NEHR Nehoiu Seismic speed-acceleration, acoustic, ionization, meteorological station,
inclinometer, radon, air temperature, pressure and humidity
MLR Muntele Rosu Seismic speed-acceleration, acoustic, inclinometer, radon, air
temperature, pressure and humidity, magnetic field, X, Y, Z
COVR Covasna Seismic speed-acceleration, radio ULF
PLOR4 Plostina
Seismic speed-acceleration, acoustic, infrasound, meteorological
station, ionization, telluric field, air electrostatic field, inclinometer, air
-ground – borehole temperature
PLOR7 Plostina
Seismic speed-acceleration, radio ULF, video camera for clouds,
radiometer for solar direct and reflected monitoring (long and short
waves)
VRI Vrancioaia
Seismic speed-acceleration, air-ground acoustic, radio ULF, infrasound,
ionization, telluric field, solar radiation (pyranometer), ground
temperature, meteorological station, air electrostatic field, scalar
magnetic field, video for clouds, radon, air temperature, air pressure and
humidity
ODBI Odobesti
Seismic speed-acceleration, acoustic, radio, telluric field, borehole
temperature, meteorological station, radon, air temperature, pressure
and humidity
PANC Panciu Seismic speed-acceleration, radio ULF
Radon measurements in Odobesti station had variations which are not
correlated with seismic activity. It is hard to determinate the source of anomalies in
this case. For this reason the equipment were moved in MLR location. Fluid
pressure is important in micro fracturing process. Robert A. Meyers in Extreme
Article no. 709 Victorin-Emilian Toader et al. 6
Environmental Events Complexity [19] said that “crustal fluids play an important
passive role in all brittle failure models by counteracting the rock matrix stress
acting on a fracture through pore pressure”. Stuart Crampin [20, 21] consider rock
deformation (micro cracks, fracturing process) a result of pore pressure like a
source of tectonic stress. BISR and LOPR locations are in area where the
groundwater determine landslides and the radon measurements could be affected.
In PLOR we have natural springs, too. COVR and NEHR are next to rivers.
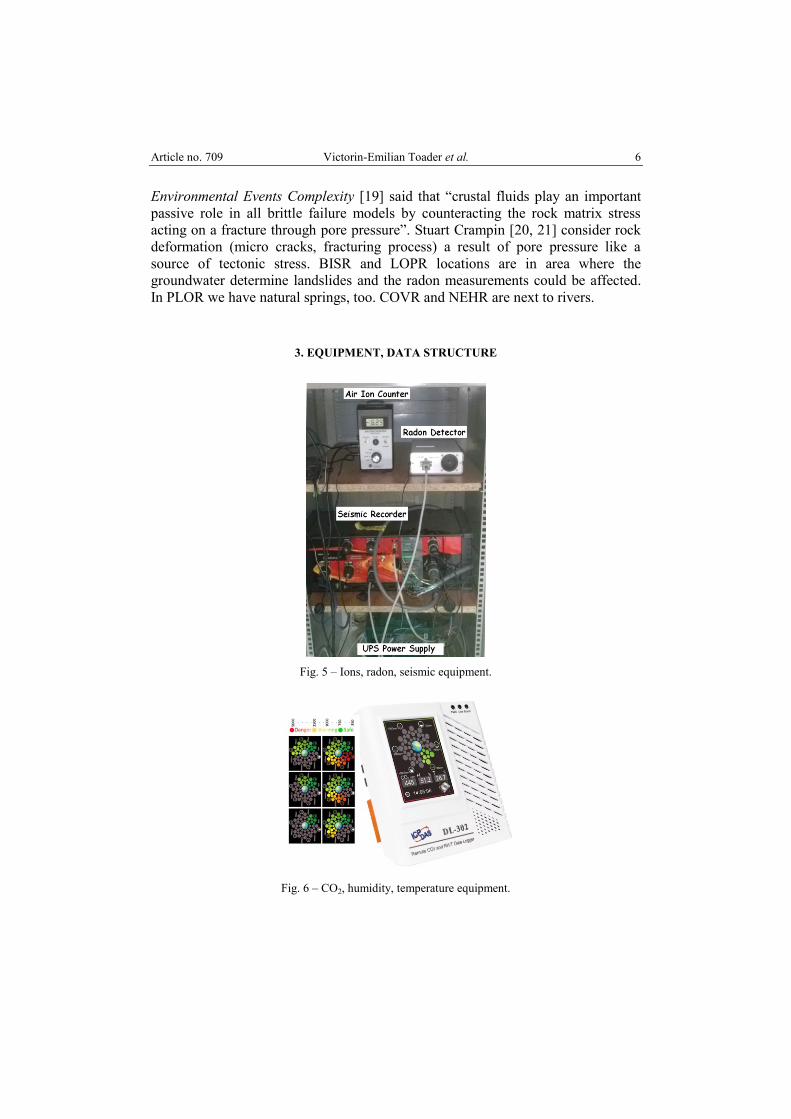
3. EQUIPMENT, DATA STRUCTURE
Fig. 5 – Ions, radon, seismic equipment.
Fig. 6 – CO2, humidity, temperature equipment.

7 Monitoring of radon and air ionization in a seismic area Article no. 709
Fig. 7 – L1, L2 data levels.
Figure 5 is an example of multidisciplinary monitoring station (NEHR). The
tectonic stress produces a degassing process that generates CO2 (Fig. 6) and radon.
There are two levels of data processing: L1 direct information from sites and L2
data corrected and packed in 24 hours files (Fig. 7).
4. METHODS
Figure 8 presents a multidisciplinary analysis (radon, meteorological
information, CO2, humidity, temperature, magnetic field and NOAA satelitare data,
ions positive and negative, atmospheric electric field [9], telluric field, and
seismicity magnitude-depth). Before 3 earthquakes (4.4R, 4.1R, 4.2R) we have
radon variation but this is not enough. The emission of radon is affected by
pressure, temperature, and humidity. A high atmospheric pressure closes the rock's
micro fractures and reduces the exhalation of gases. In Fig. 8 we observe a raining
period. The number of positive ions is higher, there are spikes on electric field, and
CO2 oscillates. In Fig. 9 we have the radon evolution in Vrancea area correlated
with global seismic energy. The method used in this picture for detecting abnormal
variations is standard deviation (+/–2σ green lines, mean red line)
[10, 16]. For MLR, NEHR and LOPR we have recorded spikes. The cause could be
the environment conditions relative to stations position. The radon detector in MLR
is in an open tunnel with a high humidity that could bring the radon. The BISR is
affected by Casin–Bisoca fault (Fig. 2). Radon could be emitted in a near place and
brought by wind. We observe the daily and seasonal variation, too.
An earthquake has an energy E corresponding to its magnitude [22]. The
effect in a location is [18]
TEEi = Ei / di2, (1)
where d is the distance to hypocenter in km2, E – the energy in Erg = 1E18.

Article no. 709 Victorin-Emilian Toader et al. 8
Cumulate the effects of all magnitudes in a period of time to a location gives
the total earthquake energy (TEE). In this case we expect that 4.9R earthquake,
15/03/29, with preparation zone 127.9 km (Dobrovolsky 1979) [10] to have the
maximum effect in LOPR (epicentral distance 18.7 km) but the TEE is higher in
VRI location. We consider the case from Table 2, for a seismic analysis (period
15/01/01–16/04/29, ML > 3.6R) calculating the preparation zone and epicentral
distances from monitoring stations. In Fig. 10 we have the TEE energy for location
where we monitor the radon. Figure 11 presents the analysis of seismicity
(magnitude, depth), global seismic energy, rupture and strain for ML > 3.6R.
Fig. 8 – Multidisciplinary analysis, AeroSolSys network.
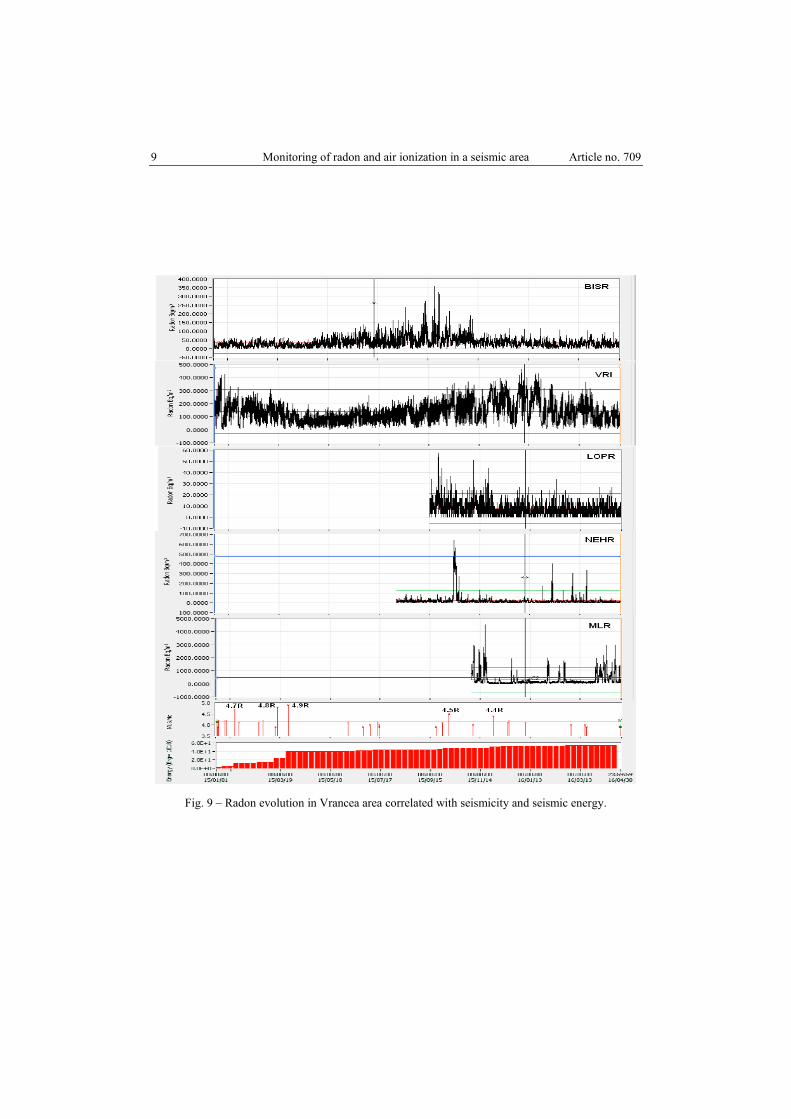
9 Monitoring of radon and air ionization in a seismic area Article no. 709
Fig. 9 – Radon evolution in Vrancea area correlated with seismicity and seismic energy.

Article no. 709 Victorin-Emilian Toader et al. 10
Fig. 10 – Total earthquake energy in radon monitoring locations.
Fig. 11 – Analysis of seismicity, energy, rupture and strain, ML > 3.6R.

11 Monitoring of radon and air ionization in a seismic area Article no. 709
Table 2
Seismic analysis, preparation zone and epicentral distances from monitoring stations, ML > 3.6R
Time M H Lon Lat Prep.
Zone
DE
MLR
DE
NEHR
DE
VRI
DE
LOPR
DE
BISR
Y/M/D R km Grd Grd km km km km km km
15/01/03 4.1 78.7 26.6848 45.7782 57.9 65.8 49.4 10.3 35.0 25.6
15/01/03 3.9 138.4 26.3674 45.4843 47.5 33.0 8.5 50.8 15.6 27.6
15/01/04 4.2 119.3 26.4225 45.5605 63.9 38.1 17.8 41.4 14.9 22.4
15/01/12 4.2 18.8 27.0448 45.542 63.9 85.9 59.8 43.6 37.8 91.4
15/01/14 4.2 145.9 26.3503 45.5501 63.9 32.3 14.3 45.7 19.0 28.0
15/01/24 4.7 88.4 26.5712 45.7123 104.9 54.6 38.3 20.9 26.5 21.2
15/01/28 4.1 128.7 26.4940 45.6405 57.9 45.9 28.3 30.9 19.4 19.7
15/02/21 4.1 141.3 26.5791 45.6883 57.9 54.0 36.5 22.8 23.8 18.6
15/02/27 4.2 129.6 26.6709 45.7250 63.9 62.2 44.1 16.2 29.0 19.9
15/03/13 3.9 118 26.5517 45.5698 47.5 48.1 25.5 35.6 10.7 12.5
15/03/16 4.8 114.1 26.4214 45.5821 115.8 38.5 19.8 39.5 16.6 22.8
15/03/29 4.9 141.6 26.4579 45.6231 127.9 42.6 25.2 34.1 18.7 21.3
15/06/09 4.1 140.3 26.3444 45.5497 57.9 31.9 14.1 46.0 19.4 28.4
15/06/26 3.9 133.5 26.3853 45.5046 47.5 34.4 11.1 48.1 14.7 25.7
15/07/05 4 132.9 26.6526 45.6957 52.4 59.6 40.8 19.8 25.5 17.0
15/07/13 4.1 146.1 26.5119 45.6529 57.9 47.7 30.2 29.0 20.4 19.3
15/07/15 4 141.3 26.6281 45.6949 52.4 57.8 39.4 20.5 25.0 17.5
15/07/15 3.9 133.9 26.6241 45.6126 47.5 54.6 32.9 29.2 16.0 9.8
15/09/21 3.9 125.9 26.3903 45.4951 47.5 34.8 10.6 48.8 14.1 25.6
15/09/29 4.1 121 26.7268 45.7228 57.9 66.0 47.0 15.9 30.2 19.5
15/10/07 4.5 129.7 26.8586 45.6574 86.0 73.5 50.8 25.3 30.4 16.8
15/11/05 4 132.1 26.3553 45.5018 52.4 32.0 9.5 49.7 16.9 28.1
15/11/29 4.4 125.6 26.6777 45.7178 77.9 62.4 43.9 16.9 28.4 19.0
15/12/16 4.1 140.2 26.5507 45.6515 57.9 50.4 31.9 27.5 19.8 16.9
15/12/18 4.2 142.9 26.5487 45.6533 63.9 50.4 32.0 27.4 20.0 17.1
16/01/07 4.1 117.3 26.293 45.5232 57.9 27.4 10.7 50.9 22.2 32.6
16/03/01 4 66.5 26.9874 45.8248 52.4 89.1 69.6 20.6 50.7 37.5
16/03/18 4 117.3 26.719 45.7294 52.4 65.8 47.0 15.2 30.7 20.2
16/03/20 3.9 148.7 26.4017 45.5978 47.5 37.5 20.7 39.1 19.0 24.6
16/04/29 3.9 146.1 26.4738 45.6162 47.5 43.5 25.2 34.0 17.5 19.9
Article no. 709 Victorin-Emilian Toader et al. 12
5. CONCLUSIONS
A monitoring network involves a multidisciplinary activity that highlights
the interdependence of environmental factors (air, earth) and their balance under
normal conditions. Weather or seismic events represent the point of maximum
imbalance. Electromagnetic, radon, CO2, infrasound, seismoacoustic,
air ionization and solar radiation monitoring, in correlation with global and
local environmental factors (including seismic zones), is a new approach for
atmospheric study in our area. Radon is a precursor element but only in a
multidisciplinary network. The spikes are not followed by earthquakes in 3 cases.
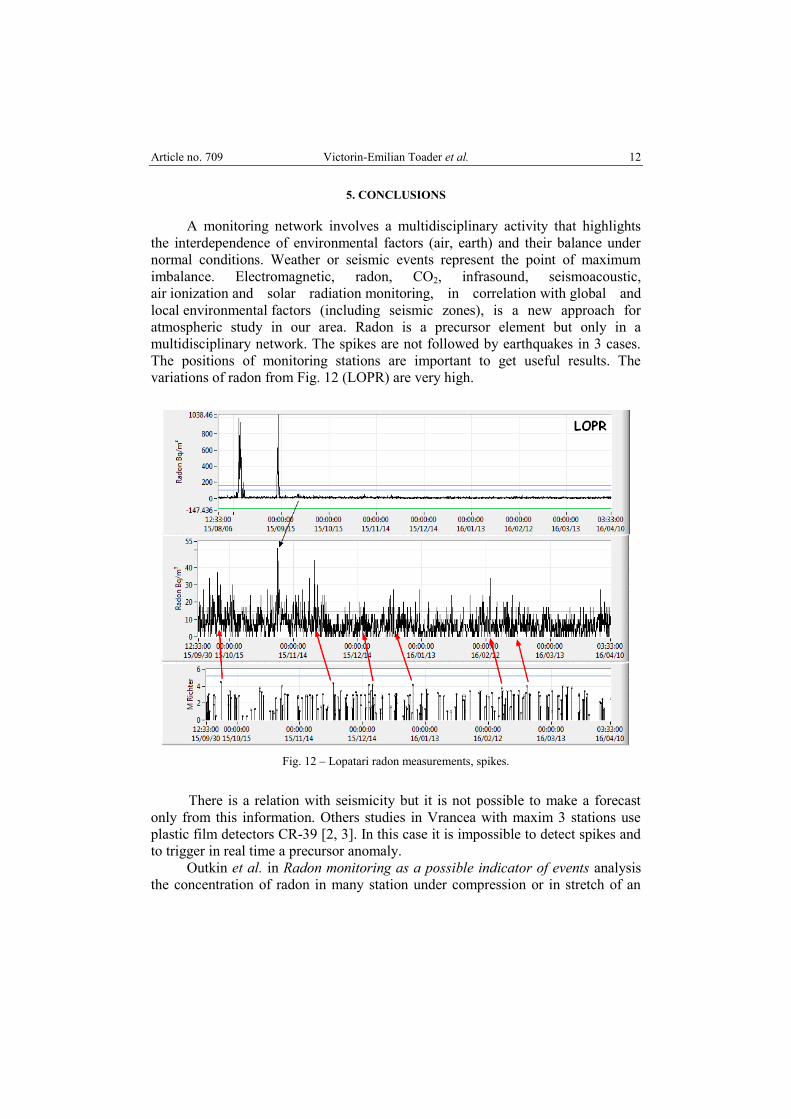
The positions of monitoring stations are important to get useful results. The
variations of radon from Fig. 12 (LOPR) are very high.
Fig. 12 – Lopatari radon measurements, spikes.
There is a relation with seismicity but it is not possible to make a forecast
only from this information. Others studies in Vrancea with maxim 3 stations use
plastic film detectors CR-39 [2, 3]. In this case it is impossible to detect spikes and
to trigger in real time a precursor anomaly.
Outkin et al. in Radon monitoring as a possible indicator of events analysis
the concentration of radon in many station under compression or in stretch of an

13 Monitoring of radon and air ionization in a seismic area Article no. 709
array. The magnitude in our analysis period is low (maxim 4.9R) and we measure
the radon in indoor air.
The result of AeroSolSys project is the growth of the seismic alert service
through: perfecting risk evaluation, seismic forecast, informing the decision factors
regarding the impact minimization of natural disasters and the education of the
population. The main purpose is to detect events before they occur. The papers [23]
and [24] presents complex networks for multidisciplinary observations of pre-
earthquake signals with the same goal.
Acknowledgements. This work was supported by a grant of the Romanian National Authority
for Scientific Research, Programme for research – Space Technology and Advanced Research –
STAR, project number 84/2013, AeroSolSys.
REFERENCES
1. Katsuaki Koike, Tohru Yoshinaga, Takayoshi Ueyama and Hisafumi Asaue, Increased radon-222
in soil gas because of cumulative seismicity at active faults, Earth, Planets and Space 66, 57
(2014).
2. M. Zoran, R. Savastru, D. Savastru, C. Chitaru, L. Baschir, M. Tautan, Radon levels assessment in
relation with seismic events in Vrancea region, Journal of Radioanalytical & Nuclear Chemistry
293(2), 655–663 (2012).
3. M. Zoran, R. Savastru, D. Savastru, Surveillance of Vrancea active seismic region in Romania
through time series satellite data, Cent. Eur. J. Geosci., 6(2), DOI: 10.2478/s13533-012-0158-z,
195–206 (2014).
4. A. Cucoș (Dinu), T. Dicu, C. Cosma, Indoor radon exposure in energy – efficient houses from
Romania, Rom. Journ. Phys. 60, 9–10, 1574–1580 (2015).
5. V. Giagias, D. Burghele, C. Cosma, Seasonal variation of indoor radon in dwellings from Athens,
Greece, Rom. Journ. Phys. 60, 9–10, 1581–1588 (2015).
6. B. T. Obreja, E Neacsu, L. Done, F. Dragolici, L. Tugulan, L. Zicman, D. Scradeanu, Evaluation
of environmental monitoring data at low and intermediate – level radioactive waste repository
Baita (Bihor), Romania, Rom. Journ. Phys. 61, 3–4, 718–727 (2016).
7. L. Tugulan, F.M. Dragolici, G. Chirosca, A. V. Chirosca, O. G. Duliu, Radiation exposure in
underground low activity radioactive waste repository, Rom. Journ. Phys. 60, 9–10, 1598–1605
(2015).
8. L. Sahin, H. Cetinkaya, S. Gelgun, Assessment of annual effective dose due to the indoor radon
exposure in a second degree earthquake zone of Kutahya (Turkey), Rom. Journ. Phys. 61, 3–4,
687–696 (2016).
9. Y. Omori, Y. Yasuoka, H. Nagahama, Y. Kawada, T. Ishikawa, S. Tokonami, and M. Shinogi,
Anomalous radon emanation linked to preseismic electromagnetic phenomena, Nat. Hazards
Earth Syst. Sci. 7 (2007).
10. Asta Gregorič, Boris Zmazek, Sašo Džeroski, Drago Torkar and Janja Vaupotič, Earthquake
Research and Analysis – Statistical Studies, Observations and Planning, Edited by Dr Sebastiano
D'Amico in Radon as an Earthquake Precursor – Methods for Detecting Anomalies, InTech 9,
179–196 (2012).
11. Sedat İnan and Cemil Seyis, Soil Radon Observations as Possible Earthquake Precursors in
Turkey, Acta Geophysica 58, 5, 828–837 (2010).
Article no. 709 Victorin-Emilian Toader et al. 14
12. H. Virk, B. Singh, Radon anomalies in soil gas and groundwater as earthquake precursor
phenomena, Tectonophysics 227, 215–224 (1993).
13. Muslim Murat Sac, Coskun Harmansah, Berkay Camgoz, Hasan Sozbilir, Radon Monitoring as
the Earthquake Precursor in Fault Line in Western Turkey, Ekoloji 20, 79, 93–98 (2011).
14. D. Ghosh, A. Deb, S. R. Sahoo, S. Haldar, R. Sengupta, Radon as Seismic Precursor: New data
with Well Water of Jalpaiguri (India), Nat. Hazard 58, 877–889 (2011).
15. V.I. Outkin, I.A. Kozlova, A.K. Yurkov, P.K. Dutta, O.P. Mishra, M.K. Naskar, Radon
monitoring as a possible indicator of events, Earth Syst. Dynam. Discuss. 34, 93–107 (2013).
16. Giuseppina Immè and Daniela Morelli, Earthquake Research and Analysis – Statistical Studies,
Observations and Planning, Edited by Dr. Sebastiano D'Amico, in Radon as Earthquake
Precursor, InTech 7, 143– 160 (2012).
17. Katsuaki Koike, Tohru Yoshinaga, Takayoshi Ueyama and Hisafumi Asaue, Increased radon-222
in soil gas because of cumulative seismicity at active faults, Earth, Planets and Space 66, 57
(2014).
18. Selin Süer, Thomas Wiersberg, Nilgün Güleç, Jörg Erzinger and Mahmut Parlaktuna,
Geochemical Monitoring of the Seismic Activities and Noble Gas Characterization of the
Geothermal Fields along the Eastern Segment of the Büyük Menderes Graben, Proceedings World
Geothermal Congress Bali, Indonesia, 25–29 April, 2010.
19. Robert A. Meyers, Extreme Environmental Events Complexity in Forecasting and Early warning,
Springer Science+Buisiness Media, LLC (2011).
20. Stuart Crampin, A New Geophysics provides the Opportunity for Stress-Forecasting Earthquakes
and Volcanic Eruptions, Disaster Advances 2, N1 (2009).
21. Stuart Crampin and Yuan Gao, Earthquakes can be stress-forecast, Geophysical Journal
International 180, 1124–1127 (2010).
22. Victorin Toader, Ion M. Popescu, Iren-Adelina Moldovan, Ionescu Constantin, Vrancea
Seismicity Analysis Based on Cumulative Seismic Energy, U.P.B. Sci. Bull. Series A 77, 2 (2015).
23. D. Ouzounov, S. Pulinets, G. Papadopoulos, V. Kunitsyn, I. Nesterov, K. Hattori, M. Kafatos, and
P. Taylor, Multi-sensors observations of pre-earthquake signals. What we learned from the Great
Tohoku earthquake?, Geophysical Research Abstracts, EGU2012-10234-1, 2012 EGU General
Assembly 14 (2012).
24. V.E. Toader, I.A. Moldovan, C. Ionescu, Complex Monitoring and Alert System for
Seismotectonic Phenomena, Rom. Journ. Phys. 60, 7–8, 1225–1233 (2015).